when to take or forego new product exclusivity: balancing...
TRANSCRIPT

When to Take or Forego New Product Exclusivity:
Balancing Protection from Competition against Word-of-Mouth Spillover
Renana Peres
School of Business Administration
Hebrew University of Jerusalem
Jerusalem, Israel 91905
Christophe Van den Bulte
The Wharton School
University of Pennsylvania
Philadelphia, PA 19104
November 2013
Acknowledgment: We benefited from discussions with Oded Koenigsberg and from comments
by Ronald Burt, Jeffrey Cai, Anne Coughlan, Chrysanthos Dellarocas, Jacob Goldenberg,
Michael Haenlein, Yogesh Joshi, Barak Libai, Gary Lilien, Eitan Muller, Raji Srinivasan,
Upender Subramanian, the review team, seminar participants at the University of Pennsylvania
and the University of Texas at Austin, and participants at the 2010 Workshop on Information
Networks (WIN 2010) and the 2011 Marketing Science Conference. We thank Tal Tamir for her
research assistance. This research was supported by the Kmart Fund and by the Israel Internet
Association. Parts of this research were conducted when Peres was Visiting Assistant Professor
at the University of Pennsylvania and when Van den Bulte was Chazen Visiting Scholar at
Columbia University.

1
When to Take or Forego New Product Exclusivity:
Balancing Protection from Competition against Word-of-Mouth Spillover
Abstract
Manufacturers or resellers introducing a new product often face the decision whether and for
how long to be its exclusive seller. Standard models of competition and conventional wisdom
suggest that being exclusive boosts profits. Using both agent-based simulations and game-
theoretic modeling, the authors find that positive word-of-mouth from customers of rival firms
can make exclusivity unprofitable. This reversal of the conventional wisdom occurs because
word-of-mouth creates a positive externality, and a firm holding exclusivity cannot benefit from
the word-of-mouth spillover generated by customers of other firms. The benefits of foregoing
exclusivity are magnified by the presence of locked-in customers who consider buying from only
a single firm, by the extent to which opinion leaders are among one’s own locked-in customers
rather than those of competitors, and by low price sensitivity of customers. Also, firms
sometimes benefit from foregoing exclusivity even without word-of-mouth from rivals’
customers, but this requires the combination of large-scale lock-in, high price sensitivity, and
strong word-of-mouth among one’s own customers.
Keywords: product exclusivity, new products, word-of-mouth, social networks, social contagion.

2
When the marketing executives of Comverse Technology launched their innovative voice-
based verification product in Japan in 1995, they had an intriguing interaction with NTT
DoCoMo (NTT for short), one of their potential distributors. To attract NTT, Comverse offered
it to be the exclusive distributor of the new product in Japan. NTT agreed to represent the
company, but rejected the exclusivity offer. Moreover, it insisted that Comverse would sell the
product through other distributors besides NTT.
NTT’s response was surprising since it goes against the conventional wisdom among both
practitioners and researchers. Manufacturers and resellers typically prefer being exclusive for
three reasons. First, they do not have to compete for customers and so can achieve higher sales.
Second, monopoly allows them to charge higher prices. Finally, being the exclusive seller can
increase a company’s bargaining power with suppliers and generate increased economies of scale
or experience, all of which may lower costs and boost margins. Business stealing, monopoly
pricing power, and cost improvements all typically result in higher profits.
What, then, motivated NTT to insist on non-exclusivity? As their managers told the
Comverse team involved in the negotiations which included the first author, NTT was less
concerned about protecting itself against the negative effects of competition than about
capitalizing on a positive externality of competition. Specifically, NTT considered that even
though accepting exclusivity would protect it against rivals and boost its bargaining power vis-à-
vis Comverse, the product’s great innovativeness made it even more important to establish its
credibility and legitimacy as quickly and as widely as possible. Having NTT—or any other
firm—be the sole seller would have limited the number of reachable customers and hence
curtailed the amount of word-of-mouth (WOM) and peer-based legitimation in the Japanese
market. This, in NTT’s estimation, outweighed the standard benefits of exclusivity.

3
An example of the conventional wisdom is AT&T’s decision to offer very favorable terms to
Apple for being the exclusive U.S. service provider for the early iPhone, including an
unprecedented revenue sharing agreement giving Apple about $10 a month from each iPhone
customer’s bill (Yoffie and Kim 2010). This may have been a sound course of action for AT&T.
Since its number of loyal or locked-in customers had dwindled over time, having a unique and
buzz-worthy product could help restore its ability to compete against other service providers. The
contrast between NTT and AT&T suggests that WOM is not the only consideration affecting the
decision to seek or forego exclusivity. Whether the company is exposed to intense rivalry may
also be a critical driver. Of course, it is difficult to draw strong conclusions from any such
anecdotes, and it is possible that one or both these companies made the wrong decision.
The examples of NTT and AT&T suggest a tension between two considerations. Standard
models of competition and conventional wisdom suggest that exclusivity boosts profits because
it protects against the harmful effects of competition: fewer customers and lower margins.
However, as the NTT managers noted, exclusivity also precludes one from benefiting from the
positive externality of social contagion stemming from competitors’ customers. Protection
against competitors favors exclusivity yet WOM across customer bases favors the opposite. So,
how should firms balance those two considerations? This is what we seek to understand.
Rivals’ customers can boost one’s own sales in various ways. One is word-of-mouth.
Customers who talk or write positively about a new product they bought make others aware of
the category and make it credible in their eyes by vouching for its reliability, ease of use, and so
on. Another is visual influence. Simply using the product in public can boost awareness, increase
social-normative acceptability or legitimacy, and trigger concerns about social status. These are
long recognized to be important elements in fashion apparel but arguably also matter in mobile

4
consumer electronics (e.g., smartphones, ear pods vs. large headphones, etc.). A third way how
rivals’ customers can boost one’s own sales are installed base effects or network externalities.
The utility of communication and IT hardware and software often increases with the size of the
installed base, either directly because of interoperability or indirectly through the increased
supply of complementary products and services.
The various contagion mechanisms (awareness, belief updating, social-normative pressure,
competition for status, and network externalities; see Iyengar, Van den Bulte and Choi 2011) can
operate both within and across brands or vendors (Krishnan et al. 2012; Libai et al. 2009). For
instance, a consumer who bought a Samsung smartphone may influence other consumers to also
buy a smartphone—through word-of-mouth, visual influence, or less directly through the greater
availability of accessories and apps—but not necessarily one made by Samsung. Similarly, a
corporate customer who bought Comverse’s voice recognition software from a systems
integrator different from NTT may facilitate subsequent sales of the same software by NTT.
How word-of-mouth and other contagion dynamics influence the appeal of product
exclusivity is important to at least three kinds of companies. The first are resellers having the
opportunity to be exclusive distributors, like NTT and AT&T. The second are manufacturers
having developed a new technology and having to decide whether to market it themselves as a
monopolist or to make the technology available to competitors also through licensing or by
selling them key components (e.g., Chen and Xie 2007; Conner 1995; John et al. 1999; Xie and
Sirbu 1995).1 The third are companies in fashion industries, where foregoing exclusivity for
one’s designs can boost social contagion increasing overall demand but also greater competition
depressing market share and margins (e.g., Barnett 2005).

5
This study investigates how the decision to take exclusivity is driven by a trade-off between
seeking protection against competition versus leveraging social contagion which we refer to as
word-of-mouth or WOM as that narrower term is more familiar to marketers. The contrast
between the NTT and AT&T examples suggests that customer lock-in may be critical to how
firms should make that trade-off. NTT, like many other systems integrators, has many locked-in
customers who may monitor the offerings of other suppliers but are very unlikely to buy from
them (Heide and Weiss 1995; Wuyts et al. 2004). Hence, NTT could benefit from the WOM
generated by its competitors’ customers without fear of losing much business to these rivals.
AT&T, in contrast, was operating in a cellphone market with limited switching costs and being
mostly unloved by its customers. Without strong customer lock-in or loyalty, it was especially
eager to be the exclusive service provider of the original iPhone.
We answer our research question using both agent based simulation and game-theoretic
modeling. This leverages the strength of each method, shows that our key insights are robust to
whether WOM accelerates sales or expands overall demand, and provides confidence that our
key result is not driven by some technical assumptions specific to either method. Using formal
methods of theorizing provides protection against falling victim to hidden assumptions (Moorthy
1993) and avoids biases from competitive selection in empirical data (Eyuboglu and Buja 2007).
Our work makes three theoretical contributions. First, it shows how word-of-mouth (or
contagion more broadly) and customer lock-in jointly affect the optimal go-to-market strategy.
The decision to take or forego exclusivity in markets with WOM is critically affected by the
level of customer lock-in. In essence, our work shows that cross-brand WOM makes
competitors’ locked-in customers a complementary asset (Teece 1986) and that foregoing
exclusivity may be a price more than worth paying to capitalize on that asset. Second, our work

6
shows that foregoing exclusivity can be profitable even when exclusivity is only temporary,
competitors offer products of equal quality, and WOM is weaker across than within brands.
Third, by documenting the interplay between customer lock-in and WOM, we provide new
insights into the interlock between a “vertical” network of commercial ties and a “horizontal”
network of word-of-mouth ties (Van den Bulte 2010).
We first review the related literature. Next, we discuss market characteristics likely to affect
the balance between seeking protection from competition and leveraging WOM externalities. We
then describe the design of the agent-based simulation study and its results. We complement this
with the game-theoretic analysis. We conclude with a discussion of the results’ implications for
theory, practice, and research.
Related Literature
We briefly review the prior literature on the connections among (i) WOM and other
spillovers among competitors, (ii) customer lock-in, and (iii) new product.exclusivity
WOM and other Positive Spillovers among Competitors
Several studies document the existence of positive WOM spillovers across competing firms
or their brands. Gatignon, Anderson and Lojas (2007) found that sales of a new product in one
channel can accelerate that in another channel. Research on software piracy indicates that
spillovers between the legal and pirate versions can promote the penetration of the new product
(e.g., Givon et al. 1995). Word-of-mouth can also spill over across brands (Krishnan et al. 2012),
allowing later entrants to enjoy a faster takeoff (Libai et al. 2009).
Similar effects may operate through contagion processes other than WOM. Research on early
product life cycle dynamics suggests that competitors benefit from each other through their
investments in distribution infrastructure or through their mere presence legitimating the new

7
category and assuaging customers’ concern about the absence of alternative sources of supply
(e.g., Agarwal and Bayus 2002; Geroski and Vlassopoulos 1991). Also, competitors may benefit
from each other’s experience, either directly or through using common suppliers (Dockner and
Jørgensen 1988).
Customer Lock-in and Positive Spillovers among Competitors
Markets where all firms can sell to all customers are rare. More common are markets with a
mixture of “switchable” or “shared” customers able and willing to purchase from many firms and
“locked-in” customers buying from only a single firm. As a result, firms often have only partially
overlapping customer bases. The pattern can stem from differences in geography, vertical
industry sectors, existing service contracts, or brand loyalty making some customers consider
only a single company (e.g., Fershtman and Muller 1993; Gensch 1984; Heide and Weiss 1995;
Narasimhan 1988). Some business customers, for instance, use new corporate software only if it
is provided and supported by the systems integrator they work with. Some consumers have such
strong affect towards a company or its brand that they will not buy a new product from anyone
else (e.g., Apple aficionados). As a result, firms often have both customers sheltered from
competition and others for which they compete. The more the customer bases of the firms
overlap, i.e., the greater the fraction of shared customers, the more intensely they compete.
The contrast between NTT and AT&T suggests that firms with locked-in customers are more
likely to benefit rather than suffer from the presence of competitors. This is supported by a recent
field experiment with a catalog retailer (Anderson and Simester 2013) in which competitors’
advertising had a positive effect on customers with the highest switching costs and a negative
effect on those with the lowest switching cost. This, the authors noted, suggests that competitors’
advertising primed customers to think about the category and that whether the customer

8
purchased from the competitors or the focal retailer depended on lock-in.
New Product Exclusivity and WOM
Prior research shows that positive spillovers can make it profitable for a company to invite
competitors into their market, but provides no insight into how customer lock-in should affect
that decision. Prior research on exclusivity in markets with WOM (or contagion in general) also
leave other important questions unanswered.
Customer lock-in and opinion leader lock-in. Prior analyses assume that all firms can attract
all customers and that all customers are equally influential (Conner 1995; Sun, Xie and Cao
2004; Xie and Sirbu 1995). Locked-in or loyal customers who consider buying from only a
single company and opinion leaders are ignored, even though such lock-in is quite common and
tempers the need for protection against rivals. Also, one would expect that a firm that has most
opinion leaders locked-in as loyal customers has less to gain from cross-brand WOM and from
foregoing exclusivity than companies who do not enjoy such support. To what extent does
opinion leader lock-in or lock-out affect the profitability of exclusivity?
Product quality. Studies by Conner (1995) and Sun, Xie and Cao (2004) and an essay by
Barnett (2005) conclude that foregoing exclusivity can boost profits, but do so after requiring
that the other entrants provide products of inferior quality, like PC clones or knockoff apparel
items. In such cases, being the higher-quality vendor softens the blow from giving up
exclusivity. Can foregoing exclusivity be optimal even without superior quality?
Exclusivity duration. The studies by Conner (1995) and Sun, Xie and Cao (2004) further
assume that exclusivity never expires. This is not realistic, as patents expire, exclusive
distribution rights in perpertuity are exceedingly rare, and other sources of exclusivity erode over
time as well (e.g., the novelty of product designs). More importantly, assuming perpetuity

9
precludes one from identifying whether the duration of exclusivity should affect the decision to
take or forego it. Firms having a limited window before their patent expires or their designs
becomes commonplace gain only limited guidance from extant research. For instance, are there
market conditions under which long exclusvity is better but short exclusivity is worse than no
exclusivity at all?
Strength of WOM within and across brands. The work by Xie and Sirbu (1995) does not
make restrictive assumptions about quality and perpetuity, and shows that positive demand
externalities can lead a company marketing a new product to prefer competing immediately over
enjoying a temporary monopoly. However, it does so under the assumption that WOM is as
strong across as within brands. For instance, their analysis assumes that the odds of someone
buying a Google Nexus smartphone increases by the same amount when ten of his friends
bought that very same phone as when they bought another Android smartphone like a Samsung
Galaxy or HTC One. This is inconsistent with evidence on the effects of WOM within and across
brands (Krishnan et al. 2012; Libai et al. 2009; Parker and Gatignon 1994). More importantly,
the assumption is bound to drive the results against exclusivity. Can foregoing exclusivity be
optimal even when WOM is weaker across than within brands?
Drivers of the Trade-off between Protection from Competition and WOM
Several market characteristics are likely to affect the balance between seeking protection
from competition and leveraging word-of-mouth spillovers. As our discussion of prior research
implies, three stand out: the strength of cross-brand WOM, the vulnerability to competition, and
the lock-in or lock-out of opinion leaders. Besides these drivers of main substantive interest, we
also investigate three market characteristics that may affect their importance: whether WOM

11
accelerates or expands sales, the speed of diffusion, and the level olf homophily and clustering in
the WOM network. We discuss each in turn.
Strength of Cross-brand WOM
The more customers buy from one firm in response to WOM from customers who have
bought from another firm, the greater the benefit from having competitors in the market. The
stronger the cross-brand WOM, the greater the externality it generates, and hence the greater the
benefits from foregoing exclusivity.
Vulnerability to Competition
Competitors can depress profits both by stealing one’s customers and by forcing one to cut
prices. We investigate both types of vulnerability to competition.
Customer lock-in. The more firms cater to the same pool of shared customers, the greater the
potential for business stealing. Conversely, the greater the fraction of locked-in customers, the
lower the chance of significant business stealing.
Customer cross-price sensitivity. Competing over customers who are able and willing to buy
from more than one firm depresses profits even more when those customers can be swayed by
even small price differences. The more price sensitive customers are, the more exclusivity can
help boost profits. Firms operating in industries where customers see a lot of value added over
the naked product, like systems integration for complex corporate IT solutions, experience less
price pressure and hence benefit less from exclusivity than firms operating in commodity-like
businesses like telephone and Internet access service. This distinction may also have contributed
to the different decisions made by NTT and AT&T.

11
Opinion leader lock-in
Not all customers are equally effective in spreading WOM. Customers who are more central
in the network or who are more persuasive have a disproportional impact on others’ behavior.
Consequently, if these opinion leaders have such a strong preference for one’s brand that they
would never consider buying from another source, then one will benefit more from within-brand
but less from cross-brand WOM. Conversely, a company stands to benefit less from within-
brand but more from cross-brand WOM when the opinion leaders are locked-in with its rivals.
Other market characteristics
Besides the characteristics of main substantive interest discussed above, we also investigate
some additional elements to assess whether the key insights are robust.
WOM effects: Sales acceleration vs. demand expansion. Firms can create value for their
shareholders by accelerating or by enhancing cash flows (e.g., Srivastava et al. 1998) and WOM
can affect both the timing and the volume of sales (e.g., Libai et al. 2013). So, to establish the
generalizability of our key insight, we study the exclusivity decision in markets where WOM
accelerates the sales of a new product in a market of fixed size as well as in markets where
WOM increases the overall level of demand.
Diffusion speed. The value of a temporary exclusivity for a new product is likely to depend
on how quickly customers are likely to adopt. Little can be gained from being the monopolist of
an underdeveloped market. If consumers are likely to adopt only slowly, such that most of the
adoptions take place after the exclusivity expires, then the value of protection against
competition is low. Conversely, if the market is bound to develop quickly, then having a
temporary monopoly during that early period is worth more. So, the value of temporary
exclusivity is likely to increase with the tendency to adopt early regardless of cross-brand WOM.

12
Homophily and clustering. Social networks often exhibit homophily and clustering (e.g.,
Ansari et al. 2011; McPherson et al. 2001; Rivera et al. 2010). Homophily is the “birds of a
feather flock together” phenomenon that nodes in a network are more likely to be connected to
others like them than unlike them. Clustering is the “common friends are friends” tendency for
closed triads to occur: If node a is connected to both nodes b and c, then there is a higher than
average chance that b and c are connected too. Clustering can affect contagion in various ways.
On the one hand, it slows down the transfer of information over long distances in the network, at
least when clustering comes at the detriment of bridges between remote parts of the network. On
the other hand, it boosts contagion when more than a single exposure is necessary to trigger
adoption (Centola 2010; Centola and Macy 2007). We do not expect these bridging and multiple
exposure mechanisms to be important because (i) contagion and information transfer rarely
operate over many “hops” in the network (Dodds et al. 2003; Goel et al. 2012) and (ii) our
models allow for contagion with even a single exposure, consistent with empirical research in
marketing (e.g., Iyengar et al. 2011). Even though we do not expect homophily-induced
clustering to affect the profitability of exclusivity, we manipulate homophily and clustering to
establish rather than assume the generalizability of our key insight.
Methodology
We use both a simulation analysis with an agent based model (ABM) and a mathematical
analysis with a game-theoretic model. Each approach has its advantages and disadvantages.
Agent based modeling is a flexible method to study contagion dynamics in non-regular
networks and has become increasingly common in marketing (e.g., Haenlein and Libai 2013;
Libai et al. 2013). In contrast, incorporating contagion in continuous-time mathematical models
quickly becomes unwieldy even in monopolistic markets with very simple network structures
13
(e.g., Ho et al. 2012; Van den Bulte and Joshi 2007) and identifying optimal strategies requires
remaining at a high level of abstraction (e.g., Fruchter and Van den Bulte 2011; Joshi et al. 2009;
Xie and Sirbu 1995).
Game-theoretic modeling offers two advantages over ABM for our research purposes. First,
it allows one to study the entire range of the theory parameter space rather than only discrete
points. Second, it allows one to study the forward-looking behavior of profit maximizing firms
setting prices or making other marketing decisions.
By using both approaches, we leverage the strengths of each and answer our research
questions more comprehensively and robustly than by using only one or the other (Table 1). We
use the simulation as the main study, presenting its design and results in detail, and complement
this with a shorter report on the game-theoretic analysis.
-------------- Insert Table 1 about here -------------
Using formal methods of theorizing provides protection against hidden assumptions
(Moorthy 1993) and avoids biases from competitive selection in empirical data (Eyuboglu and
Buja 2007). As with any deductive reasoning, the results are already contained in the model set
up because “No process of logical reasoning … can enlarge the information content of the
axioms and premises or observation statements from which it proceeds” (Medawar 1984, p. 79).
For instance, the theorems of Euclid’s geometry “are merely a spelling out, a bringing into the
open, of information already contained in the axioms and postulates. Given the axioms and
postulates, to a perfect mind (as A.J. Ayer remarked), the theorems of Euclid would be instantly
obvious, without the necessity for making the information they contained explicit by a
complicated deductive reasoning” (Medawar 1984, pp. 79-80).
To focus on the issues of central interest, our models assume that the exclusivity holder does

14
not face any active competition, though they incorporate untapped market potential and hence
the presence of a passive alternative available to customers. The absence of active competition is
obviously a simplification. E.g., Sony had exclusivity over the Betamax system but still faced
competition of the VHS and Video 2000 systems, and Apple has exclusivity over its iOS
operating system but still faces competition from Android and Windows devices.
Design of Simulation Study with Agent Based Model
A new product is introduced into a market with 900 customers who can buy only a single
unit but can vary in when they do so. We focus on a market with two firms. The customers are
connected through social ties, and are part of the customer base of one or both firms. Thus, as
illustrated in Figure 1 the market features a horizontal network of WOM ties and a vertical
network of commercial ties.
-------------- Insert Figure 1 about here -------------
Given this new product diffusion setting, we use the present value of the cash flows as
profitability metric. We consider only positive contagion since it is obvious that, setting aside
price competition, negative contagion across brands acts as an incentive to take rather than
forego exclusivity.
We first present the network characteristics manipulated in the simulation study: the overlap
in customer bases, the structure of the WOM network (degree, homophily and clustering), and
the opinion leader lock-in. Next, we discuss how exclusivity is operationalized. We then present
the agent based model of adoption, and conclude with a brief discussion on the choice of
parameter values. All factors are combined in a full-factorial design with 45,000 cells, and 10
simulated markets in each cell of the design.

15
Overlap in Customer Bases
We manipulate the level of competition by varying the fraction of shared customers from 0%
to 100% in steps of 20%. We equally split the remainder as locked-in to either firm, so firms are
always symmetric with respect to the size of their customer base.
Customer WOM Network
Number of ties (Degree). The WOM networks we create have the same degree distribution as
that documented by the Keller Fay Group’s TalkTrack survey (Keller 2007) in which people are
asked about the average number of people with whom they communicate regularly regarding
brands and product. The average degree, i.e., the average number of WOM ties per customer, is
about 6. For simplicity, WOM ties are symmetric: If customer a is connected to b, then b is also
connected to a. Consistent with recent research, we assume that the contagiousness of an adopter
within each of his ties increases with his degree (Iyengar et al. 2011). Hence, even though ties
are symmetric, the strength of influence of a on b need not be the same as that of b on a.
Homophily and clustering. We create WOM networks with different levels of homophily and
clustering by means of random graphs with a planted partition (e.g., Condon and Karp 2001;
Fortunato 2010). The 900 customers are organized into three separate bins of equal size, which
can be based on a customer characteristic related to homophily like gender, race, lifestyle,
location, or industry. The probability that two customers, one from bin i and one from bin j are
connected is pij. For three bins, there are six probabilities: p11, p22, p33, p12, p13, p23. If all these
probabilities are the same, then the network is a standard random or Erdös-Renyi graph without
any homophily. Tuning the probabilities allows one to increase the level of homophily. We
create three different WOM networks (Table 2). The first is a standard random network whereas
the other two exhibit “low” and “moderate” homophily since we take pii > pij (i j).

16
Homophily induces clustering. The global clustering coefficient, i.e., the mean probability
that two nodes are connected given that they are connected to a common node, ranges from 0.7%
to 2%. Because the three networks have the same number of nodes and the same average degree,
networks with higher homophily and clustering also have a higher maximum degree, a greater
fraction of high-degree nodes, and a higher probability that the high-degree nodes are connected
to one another (Serrano and Boguna 2005; Volz 2004).
-------------- Insert Table 2 about here -------------
Opinion Leader (OL) Lock-In and Lock-Out
The extent to which cross-brand WOM generates an externality is likely to depend on
whether opinion leaders are shared, locked-in with the firm who can claim exclusivity, or locked-
in with its rival. We define opinion leaders as the customers with the highest degree (e.g.,
Iyengar et al. 2011). We interlock the horizontal network of WOM ties and the vertical network
of commercial ties in four different ways, varying to what extent the most influential customers
are locked-in with the focal firm or its competitors.
Equal access. Customers are shared or locked-in with either firm independently of their
number of WOM ties (degree). So, opinion leaders are spread proportionally across locked-in
and shared customer bases, and no firm has an advantage.
Strong OL lock-in. Customers with the highest degree are locked-in with the focal firm that
can take or forego exclusivity; customers with lower degree are shared customers; and the
customers with the lowest degree are locked-in with the rival.
Moderate OL lock-in. This is a less extreme variation of the preceding scenario. The
customers with the highest degree are shared customers. Then, by decreasing degree,
customers are locked-in first with the focal firm and then with its rival. So, the focal firm

17
again has customers with a higher average degree than its rival, but by a smaller margin.
Strong OL lock-out. This is the reverse of the second scenario. Customers with the lowest
degree are locked-in with the focal firm, and those with the highest degree are locked-in with
its rival.
Exclusivity
Exclusivity is the availability of the product through only a single firm, and is temporary,
varying from 0 to 8 periods. For example, if a firm has exclusivity for 4 periods, then it is the
only seller for the first 4 periods that the product is in the market and only its locked-in and
shared customers can adopt. As soon as the exclusivity expires, in the fifth period, the product
becomes available from all firms and all customers can adopt.
Adoption Dynamics of Customers
We extend the agent based model used by Libai, Muller and Peres (2013). The market starts
with zero adoptions and runs for 30 consecutive discrete-time periods. For a market with only
two firms, customers are in one of three states: “0” for not having adopted; “1” for having
adopted from firm 1; “2” for having adopted from firm 2. In each period, customers who have
not adopted yet decide whether to buy the product from one of the firms that offer it and to
which they are connected. If, for example, customer i has not adopted yet and is a shared
customer of firms 1 and 2, but 1 is the exclusive seller, then i’s choice set for that time period is
only {0, 1}: He can either remain a non-adopter or buy from 1. If he does not adopt and the
exclusivity terminates in a subsequent period, he will start choosing among states 0, 1, and 2.
As in traditional diffusion modeling, adoption depends on two factors: (1) time-invariant
external influence driven by the product’s appeal and the customers’ innovativeness, and (2)
internal influence by WOM or other forms of contagion from prior adopters. Internal influence

18
can operate within or across brands and can do so simultaneously. For instance, if a potential
adopter connected only to firm 1 has WOM ties with an adopter of firm 1 and with an adopter of
firm 2, then his decision whether to buy from firm 1 will be affected by within-brand WOM from
the first contact as well as cross-brand WOM from the second.
Adoption Probabilities
Agent based models of new product adoption typically use a competing risk approach where
each prior adopter connected to a customer i can independently trigger i to adopt. The discrete-
time hazard of i adopting is one minus the probability that both external influence and internal
influence from prior adopters fail to convert him:( )
( ) 1 (1 )(1 ) iN t
ip t d q , where Ni(t) is the
number of customers connected to i who adopted the product before time t, d is the parameter of
external influence, and q is the parameter of internal influence. This discrete-time competing-risk
formulation converges to the continuous-time Bass model as the time interval shrinks to zero,
provided the network is fully connected (Goldenberg et al. 2009). Libai, Muller and Peres (2013)
extend this framework to a competitive scenario for two firms. Here, to address our substantive
questions, we extend the formulation to allow for cross-brand WOM and more than two firms.
In each period, every potential adopter i considers adopting from any firm that he is
connected to and that sells the product. The choice set can include zero, one, or more firms.
Obviously, if the choice set does not include any firm, the customer cannot adopt. If the choice
set includes only one firm, say firm 1, because of exclusivity or lock-in, then the probability that
the customer is convinced to consider buying from firm 1 at time t, ( ), is also the probability
of adopting from 1 at time t, ( ):
(1a) ( ) ( ), where
(1b) ( ) ( ) ∏ ( )
( ) ∏ ( ) ( )

19
where is the external influence parameter, is the within-brand WOM parameter of a
customer j, is the cross-brand WOM parameter of a customer j, and )(tN k
i is the number of
customers connected to i who have adopted the product from firm k before time t.
If the customer is not locked-in and there is no exclusivity, then he has multiple firms to
choose from. The probability of being convinced to consider adopting from firm 1 remains as
given in Eq. (1b). Similarly, the probability of considering adopting from another firm k is:
(2) ( ) ( ) ∏ ( )
( ) ∏ ( )
( ) .
Market with two firms. There are now several possible paths to adoption, even with only two
firms. The first path is that customer i considers adopting from firm 1 but not 2. The probability
of this is )1( 21
ii pp . The second is that customer i considers adopting from firm 2 only. The
probability of this is )1( 12
ii pp . The third is that the customer is persuaded to adopt by both
firms but buys from only one of the two. The probability of such an adoption is21
ii pp , and the
customer adopts from firm 1 rather than from 2 according to the ratio of the probabilities,
. The probabilities of adoption are (Libai et al. 2013):
( ) (
)
(3) ( ) (
)
( ) ( )(
), where
To create adoption events, we use the same procedure as Libai et al. (2013). For each customer
in each period, we draw a random number from a uniform distribution between 0 and 1. If the
number is smaller than the probability of adopting from 1, then the customer adopts from 1. Else,
if the probability is smaller than the sum of the probabilities of adopting from 1 or 2, then the
21
customer adopts from 2. Otherwise, the customer does not adopt.
Market with more than two firms. One can extend this logic to markets with more than two
firms. In a market with K firms, customers are in one of K+1 states: “0” for not having adopted;
“1” for having adopted from firm 1; “2” for having adopted from firm 2, and so on. A customer
may be persuaded to adopt by any combination firms. For instance, in a market with three firms,
one must consider the possibility that all three firms persuade the customers, that firms 1 and 2
do but firm 3 does not, that firms 1 and 3 do but firm 2 does not, and so on. Eq. (3) can be
generalized to any number of firms, with the probability to adopt from firm 1 being:
(4) ( ) ∑ ∏
∑
∏ ( ) { }
The sum goes over all possible subsets S of the set of competitors (including the empty set), to
cover all possible ways in which a customer can be persuaded to consider buying from firm 1.
For example, for 3 firms, the subsets S of competitors who can affect adoption from firm 1 are
(, {2}, {3}, {2, 3}).
Parametrization
Table 3 provides the values of the parameters we manipulate. The parameter space in a
model or experiment need not be restricted to values reported in prior empirical research
(Hacking 1983), and doing so actually limits one’s ability to generate new insights (Medawar
1979). Yet, some may feel that a model or experiment is more persuasive and valuable when its
parameters or manipulations include levels consistent with quantities reported in empirical work.
-------------- Insert Table 3 about here -------------
Adoption parameters. The values of d, qw and qc are identical across firms for simplicity.
Comparing values of d and of total WOM (qw + qc) to estimates of p and q in the Bass model is
rather moot since the scaling of Bass model parameters is determined solely by the scaling of

21
time (e.g., Van den Bulte 2011). Note, though, that the scaling of our parameters is consistent
with annual p and q values for many consumer durables. Also, values of (qw + qc)/d include
typical values of the q/p shape parameter in the Bass model, especially after considering that the
q/p estimates exhibit an upward bias (Van den Bulte and Lilien 1997). We impose that qc ≤ qw,
consistently with findings by Parker and Gatignon (1994), Libai et al. (2009), and Krishnan et al.
(2012). Following recent evidence that influentials tend to not only have more ties but also be
more contagious within each of those ties (Hu and Van den Bulte 2012; Iyengar et al. 2011), the
value of qwj for each customer increases with his number of ties: qwj = + *log(degreej), with
> 0 (qwj = 0 when degreej = 0). The parameters and are set such that qwj ranges between
50% and 150% of the average. The same procedure is applied to qcj.
Customer network structure. The degree distribution is consistent with research on WOM
(Keller 2007). The global clustering coefficient ranges between 0.7% and 2%, but the amount of
clustering is not uniform throughout the networks. For instance, it is about 7.5% among the
locked-in customers of the focal firm when homophily is high, overlap in customer bases is high
(80%), and all influentials are locked-in with the focal firm. This range is consistent with
clustering of ties in prior diffusion research (e.g., Christakis and Fowler 2007; Moody 2009).
Length of exclusivity. We analyze several durations of exclusivity, ranging up to 8 periods.
Given the scaling of our adoption parameter, these periods can (but need not) be interpreted as
years, so exclusivity durations of 0, 2, 4, 6 and 8 periods cover a realistic range.
Discount rate. We measure a firm’s profitability as the present value of the cash flows from
all its adoptions, each contributing a margin of $1, over all 30 time periods with a discount rate
of 10%. The margin can stem from a one-time purchase of a durable good, or be the lifetime
value at the time of adoption of a cash flow stream including follow-up sales. The discount rate

22
is similar to the annual rate computed by Schmitt et al. (2001). We safely ignore any residual
value in the cash flows. We track the diffusion over 30 periods and the adoption parameters are
high enough to achieve close to complete diffusion in the very great majority of runs. Such near-
complete diffusion and the 10% discount rate preclude truncation artifacts in present value
calculations without residual value (Fruchter and Van den Bulte 2011).
Results of Simulation Study
We first present results for two firms and 10% discounting, and then briefly note to what
extent the results differ in scenarios with five firms or without discounting.
Profit Impact of Exclusivity by Level of Competition
Figure 2 shows how discounted profits vary by the level of competition and the length of
exclusivity, averaged across all other parameters.3 Each line corresponds to a different level of
customer overlap. As expected, the lines fan out. As the duration of exclusivity increases, profits
increase in markets with moderate to high levels of overlap but decrease in markets with low
levels of overlap. So, unless exclusivity provides protection from competition, it harms rather
than boosts profitability.
The order of the lines in Figure 2 shows that at the average level of within- and cross-brand
WOM, greater overlap is associated with greater profits. This happens because overlap boosts
not only competition but also the level of within-brand WOM. Say the market features two
manufacturers selling directly, A and B, a WOM network without homophily (pure random
graph), equal access to opinion leaders, and no cross-brand WOM. With 0% overlap, half the ties
of A’s customers are with people who are locked-in with B and will never buy from A. As a
result, A cannot benefit fully from within-brand WOM. The greater the overlap, the more a firm
has access to customers (locked + shared) who are connected to other customers the firm has
23
access to, and hence the more the firm benefits from within-brand WOM.
Table 4 conveys the same information but in a different format. It shows, for each level of
customer base overlap and each length of exclusivity, by what percentage discounted profits
differ from those of the no-exclusivity strategy. Whereas long exclusivity boosts discounted
profits by 7% to 43% when the amount of customer overlap is 40% or higher, it actually lowers
them by 3% to 13% when customer overlap is 20% or lower.
-------------- Insert Figure 2 and Table 4 about here -------------
The Moderating Effect of Cross-Brand WOM
The results in Figure 2 and Table 4 pertain to the average market setting, which features only
moderate within-brand WOM ( 0.11qw ) and even weaker cross-brand WOM ( 0.05qc ).
Since the value of exclusivity is likely to vary with the strength of cross-brand WOM, the grand
averages reported in Figure 2 and Table 4 provide only a very coarse-grained picture.
Table 5 presents the percentage profit impact of using exclusivity at different levels of
customer base overlap and specific levels of within- and cross-brand WOM. We use a low,
intermediate and high value of each contagion parameter to span the parameter space. Three of
the nine possible combinations violate the condition that WOM cannot be higher across than
within brands, and so are not part of the study.
-------------- Insert Table 5 about here -------------
Careful reading of the results in Table 5 conveys many insights. First, let us focus on
conditions without cross-brand contagion (qc = 0), shown in the left-hand block of columns. As
expected, exclusivity has no impact on profitability in the absence of competition (0% overlap),
but boosts profitability even at very moderate levels of competition. The positive impact
increases as the level customer overlap increases from 0% to 100%.

24
Second, exclusivity can depress profits even at high levels of competition when qc > 0. This
is shown by the presence of several sizable negative values in the middle and right-hand blocs of
columns. For instance, when customer overlap is 60-100% and qw = qc = 0.08, then having an
exclusivity period of length 2 or 4 is less profitable than having no exclusivity at all. Negative
values also occur when WOM is weaker across than within brands.
Third, the extent to which exclusivity hurts profits compared to the no-exclusivity baseline
increases with the strength of cross-brand WOM, holding constant the level of within-brand
WOM, the length of exclusivity, and the intensity of competition. This can be seen by taking any
cell in one of the duration-by-overlap blocks at one level of qc and comparing it to the
corresponding cell in of the duration-by-overlap blocks at a higher level of qc.
Fourth, a longer exclusivity period is not always better or always worse than a shorter
exclusivity period. When there is cross-brand WOM, the effect depends on the intensity of
competition in the market. Take for example the central block of entries where qw = qc = 0.08.
Starting on the top row and going down the column allows one to track what happens when
exclusivity lengthens. Increasing exclusivity results in lower profits at low levels of competition
(0%-20% overlap) but the opposite holds at high levels of competition (80%-100% overlap). The
same pattern is present in the other two blocks with positive cross-brand contagion (qw = 0.16
and qc = 0.08; qw = qc = 0.16).
Fifth, it is possible for a short exclusivity period to be worse than both no exclusivity and
long exclusivity. That is, there are market situations in which companies should either command
a long exclusivity period or forego exclusivity entirely. For instance, when qw = qc = 0.08 and
customer overlap = 80-100%, exclusivity lasting only 2 or 4 periods does worse than no
exclusivity, but exclusivity lasting 8 periods does better.

25
The final insight comes from comparing the top and bottom halves of the middle block of
columns. When cross-brand WOM is moderate (qc = 0.08), then exclusivity is less beneficial and
more harmful when within-brand WOM is moderate (qw = 0.08) than when it is high (qw =
0.16). In other words, foregoing exclusivity in order to capitalize on cross-brand WOM has a
greater impact when within-brand WOM is only moderate. Conversely, when within-brand
WOM is high, there is less to be gained from cross-brand WOM. This is consistent with the
notion that declining exclusivity and free-riding cross-brand WOM affects discounted profits by
accelerating the diffusion process—which is important especially when within-brand WOM
alone cannot generate speedy diffusion.
The same insight is gained from comparing the entries when both within- and cross-brand
WOM are moderate (qw = qc = 0.08) versus when both are high (qw = qc = 0.16). Exclusivity is
less beneficial and more harmful when both forms of WOM are moderate rather than high. This
further supports the notion that the benefits of foregoing exclusivity stem from allowing cross-
brand WOM to accelerate the diffusion process.
The Moderating Effects of Opinion Leader Lock-In and Diffusion Speed
The discussion so far has focused on how advantages and disadvantages of exclusivity vary
by the level of competition and the strength of WOM, especially that operating across brands. In
this section, we use regression analysis to corroborate those insights and to investigate to what
extent the effect of exclusivity on discounted profits is moderated by opinion leaders lock-in,
diffusion speed, and homophily.
We regress the natural logarithm of discounted profits on (i) 0/1 indicator variables for each
duration of exclusivity, (ii) indicator variables for each level of homophily and clustering, (iii)
indicator variables for each type of opinion leader lock-in, (iv) the values of all three adoption

26
parameters (divided by 10 to avoid cluttering the results with very small coefficients) as well as
the interaction between the two WOM parameters, and (v) the interaction of the duration of
exclusivity (DUR) with all regressors (ii)-(iv). So, we allow the “main” effect of duration to be
non-linear through the dummies but we limit the moderator effects to be linear in duration. The
latter restriction gives a better birds’ eye view of moderator effects than reporting a very large
number of coefficients of interaction between each regressor and each duration dummy.
Taking the natural logarithm of profitability as the dependent variable in a linear regression
model generates regression coefficients (b) with a clear managerial meaning. Specifically,
[exp(b) – 1] 100% is the percentage change in profitability to be expected when the regressor
increases by 1 unit. To ensure that the regression coefficients map in this fashion into the results
in Table 4, we mean-center all variables apart from the exclusivity dummies and the DUR
variable used to construct the interaction terms. We estimate the models with OLS and, given the
presence of significant heteroscedasticity (White test p < .001), compute t-statistics using White-
Huber heteroscedasticity-consistent standard errors.
Table 6 shows the results of these regressions for each level of customer overlap separately.
The coefficients of the DUR = x dummies map, after transformation, perfectly into the mean
values reported in Table 4.
-------------- Insert Table 6 about here -------------
Let us next focus on the linear effects of the other variables. Homophily and clustering, as
expected, has only a very small effect. Even when significant it is never larger than 5%. Opinion
leader lock-in has a much larger effect, sometimes reaching between 30% and 40%. Compared to
equal access, having the opinion leaders locked-in is associated with higher profitability, whereas
the reverse holds for having them locked-out. The effects become smaller as the overlap in

27
customer base increases, and they become virtually zero when the overlap reaches 100% and
firms have equal access to all customers, including opinion leaders. Finally, higher values of the
adoption parameters are associated with higher profitability. The faster the diffusion, the greater
the number of sales realized early rather than late, and so the more valuable a temporary
monopoly is. The negative interactions between the parameters of within- and cross-brand WOM
indicate that the latter is especially valuable when the former is low, consistent with our
discussion of Table 5.
All these linear effects are as expected, and provide face validity to our simulation design.
We now turn to the main purpose of the regression analysis: understanding how the market
characteristics affect the profitability of exclusivity.
Homophily. The coefficients of the interactions terms between DUR and homophily are
rarely statistically significant and always small. Homophily and the clustering it induces do not
affect the profitability of exclusivity.
Opinion leader lock-in and lock-out. Opinion leader lock-in has a larger and more intricate
effect. The pattern of interactions indicates that foregoing exclusivity in order to free-ride cross-
brand WOM makes much more sense when competition is weak and the opinion leaders are
locked-in. The effect sizes in Table 6 provide rich insights. Taking into account that the DUR
variable is scaled from 0 to 8 and that the lock-in variables are mean-centered dummies, and
interpreting the periods as years, the results in Table 6 imply that, at average values of the
adoption parameters (d, qw, and qc) and 0% overlap, the average company loses about 13% of
profitability by taking an 8-year exclusivity, a company with strong or moderate lock-in
experiences virtually no loss, and a company facing strong lock-out experiences about twice the
average loss. Also, whereas taking exclusivity in a market with 20% overlap lowers the
28
profitability of the average firm by about 3%, it does not do so at all for a firm with strong or
moderate interlock. Firms facing strong lock-out, in contrast, lose an additional 1-2% per year of
exclusivity. In markets with 40% overlap, exclusivity remains unprofitable for firms facing lock-
out whereas it is profitable for others. Even with 60% overlap, firms facing lock-out gain only
about 2/3 of the benefits the average firm reaps from each year of exclusivity. Clearly, the lock-
in and lock-out of opinion leaders has a major impact on the decision to forego exclusivity.
Diffusion speed. Table 6 also provides insights in how the adoption parameters moderate the
effect of exclusivity on profitability. The positive effect of d DUR implies that foregoing
exclusivity is especially attractive when customers are slow to adopt without WOM. The
interactions of DUR with the WOM parameters corroborate the insights from Table 5. The
negative effect of qc DUR implies that having a short exclusivity period or foregoing
exclusivity altogether is more attractive when cross-brand WOM is strong. The positive effect of
qw qc DUR implies that the attractiveness of doing so is even higher when own-firm WOM
is low. Foregoing exclusivity is especially attractive when within-brand WOM alone cannot
generate sales quickly.
Robustness checks
Zero discount rate. If foregoing exclusivity boosts profits because cross-brand WOM
accelerates sales and cash flows, as we claim, then it should not have a positive financial impact
when the discount rate is zero. This is indeed the case. Ignoring the time value of money, the line
corresponding to zero overlap in Figure 2 becomes flat and all the negative values observed for
non-zero overlap in Tables 4 and 5 become positive. Of course, zero discounting or infinite
patience runs counter to both human nature and sound financial management.

29
More than two firms. One would expect the profit impact of exclusivity to magnify if there
are more firms in the market. Say there are only two firms. With 0% overlap, exclusivity
increases the market access from 50% to 100% but decreases the fraction of the market that can
spread cross-brand WOM from 100% to 50%. If there are five (or more generally N > 2) firms,
then the protection from competition increases from 20% (1/N) to 100%, but the base for cross-
brand WOM decreases from 100% to 20% (1/N). So, a larger number of firms makes protection
from competition and the WOM-externality larger to the same extent, and there is no reason to
expect major changes in when to take or forego exclusivity. Repeating the simulation for N = 5
confirms this: The percentage gains and losses from taking exclusivity are markedly larger (e.g.,
ranging from -24% to +155% in the equivalent of Table 4), but gains versus losses are realized in
very much the same market conditions as in the main analysis with two firms.
Additional Insights from a Game-Theoretic Model
Motivation
The design of the simulation study raises two questions about the generalizability of its
results. First, can foregoing exclusivity be attractive when competition lowers the prices and
profit margins? One of the main reasons for using patent protection or exclusive distribution is
that exclusivity allows sellers to charge higher prices. Our simulation ignores this margin-
boosting impact of exclusivity, and so may overestimate the benefits of foregoing exclusivity in
markets where exclusivity affects not only access to customers but also the prices and profit
margins realized when selling to these customers. The second question pertains to how WOM
affects sales. The market size in the simulation is fixed and cross-brand WOM boosts discounted
profits by accelerating rather than expanding sales. Firms can create value for their shareholders
both by accelerating and enhancing cash flows (Srivastava et al. 1998) and WOM can affect both

31
the timing and the volume of sales (Libai et al. 2013), but the simulation involves only the first
of these two routes. So the second question arises: Can foregoing exclusivity boost profitability
also in markets where cross-brand WOM increases rather than accelerates overall sales?
We investigate these two questions through a game-theoretic model. It features simpler
network structure and contagion dynamics than the simulation study, but has the advantages of
(i) identifying the profit-maximizing behavior of firms competing through prices and of doing so
(ii) mathematically in a continuous parameter space rather than through simulation at discrete
points in the space.
Model assumptions and structure
The market features two firms, A and B, who compete in prices over two periods and are
symmetric in all regards except that A has the option of being a temporary monopolist in period
1 and having to compete against B only in period 2. The firms have a common and constant
marginal cost c.
The market consists of customers who consider buying from either firm, and of customers
who are locked-in to a single firm and consider buying only from that one source (e.g.,
Fershtman and Muller 1993). The fraction of locked-in potential customers is , split equally
between the two firms. The remaining ( ) fraction consists of “shared” customers who
might buy from either firm. We denote Segment 1 as those locked-in to A, Segment 2 as those
shared by A and B, and Segment 3 as those locked-in to B. For simplicity, we assume the
unweighted base level of demand for the product to be common across segments. That base level
can be interpreted as the potential demand within each segment from those who are aware of the
product and consider buying it, and actually would do so if it were available for free.

31
Firms cannot price discriminate between their locked-in and shared segment. Nor can they
credibly commit in period 1 about what prices they will charge in period 2.
Without exclusivity, the demand
of firm i in segment j in period 1 equals:
(
)
(5)
( ) (
(
))
( ) ( ( ))
( ),
where is the price of firm i in period 1 and represents the intensity of price competition
between the two firms in Segment 2. The demand equations in Segments 1 and 3 are standard
linear specifications for monopoly, and those in Segment 2 correspond to A and B being
horizontally differentiated from each other in that segment (e.g., Desai et al. 2010). When
the demand system reduces to two disjoint monopolies. When it reduces to the duopoly
specification used by Desai et al. (2010). The “full” own-price sensitivity of demand equals
( ) in the duopolistically shared segment, where . Hence, we do not
require . The price sensitivity under monopoly is only
If firm A chooses to be exclusive in period 1, then it is the monopolist not only in its locked-
in Segment 1 but also in Segment 2. The demand then equals:
( )
(6) ( ) ( )

32
We do not distinguish between trial and repeat sales in period 2, and assume that all demand
in period 2 is lifted by the sales in period 1. The word-of-mouth (WOM) triggered by prior sales
volume boosts the product’s awareness and legitimacy, and so boosts the base level of demand in
each segment. This contagion process operates both within and across brands. Within-brand
WOM influence, the effect of which is denoted by , occurs when prior sales of a firm increases
that same firm’s base level demand. Cross-brand WOM influence, the effect of which is denoted
by , occurs when prior sales of a firm increases the competing firm’s base level demand. We
analyze the effect of cross-brand WOM as a positive externality and, based on prior empirical
evidence (Libai et al. 2009), we assume that within-brand influence is greater than cross-brand
influence, .
Regardless of whether firm A enjoyed exclusivity in period 1, it faces firm B in period 2.
Hence, taking into account the WOM effects, the demand equations for period 2 are:
(
(
) (
))
(7)
( ) ( ( ) ( ) ( ))
( ) ( ( ) ( ) ( ))
( ( ) ( )).
Note how firm A’s base level demand in period 2 is boosted by prior sales of firm B, and
hence how A may benefit from allowing B to sell in period 1. Even though A receives a bigger
boost from its own prior sales in Segment 2 than from B’s prior sales in that competitive segment
(because ), A also benefits from B’s prior sales in Segment 3 that cannot be serviced by A.
Less obvious is whether that boost in base level demand in period 2 is ever sufficient to give up
monopoly profits in Segment 2 in period 1.

33
Assuming a discount factor to capture both the relative duration of periods 1 and 2 and the
time value of money, the present value of total profits of the firms equals:
( )( ) ( )( )
(A3) ( )( ) ( )( ).
Of course, both the prices and the volumes will be different depending on whether B started
commercializing the product in period 1 or 2.
To identify when firm A should forego temporary exclusivity, we compare the equilibrium
profits with and without exclusivity. Without exclusivity, A and B first set their prices for period
1 and then, once the period is concluded, set their prices for period 2. So, the game is a two-
period simultaneous-move game. With temporary exclusivity, only A set its price for period 1
and then, once the period is concluded, both A and B set their prices for period 2 simultaneously.
We solve the game by identifying the Nash equilibrium pricing strategies through backward
induction. The Web Appendix identifies the equilibrium strategies and resulting profits, and
identifies when it is profitable to forego exclusivity. Here, we present only the main insights.
Insights
The game-theoretic model provides three insights. The first and most important is that firms
may want to forego temporary exclusivity even when there is price competition, WOM affects
sales volume rather than timing, and firms care equally about current and future profits. This is
especially so when cross-brand WOM is strongly positive and there is little overlap in customer
bases. Foregoing exclusivity can be optimal even with complete overlap in customer bases,
provided cross-brand contagion is strong enough. The basis for this first result is that allowing a
competitor to enter early generates a WOM externality that shifts one’s own demand curve
upwards, allowing one to sell more or to charge higher prices. These results are consistent with

34
the key insights from the simulation and show that the latter do not hinge on the mechanism at
work (demand acceleration vs. demand expansion) or the absence of price competition.
The second insight from the game-theoretic model is that intense price sensitivity tends to
favor exclusivity, at least when it goes hand in hand with high overlap in customer bases. This is
unsurprising and simply provides additional face validity to our assumptions and results.
The third insight is that in markets with price sensitive demand, a small fraction of shared
customers, and strong within-brand WOM, firms may want to forego temporary exclusivity even
in the absence of cross-brand WOM. Here is why: Say firm A enjoys a temporary exclusivity in
the early stage of market development. When WOM is strong within brands but very weak or
inexistent across them, then firm B entering later has a major WOM handicap. It is forced to set
very low prices to generate any sales and, when customers are very price sensitive, A has to
follow suit. This depresses A’s profit so much that it prefers foregoing temporary exclusivity and
competing against B immediately rather than keeping B out of the market at first but having to
compete against it aggressively later on. This pattern is consistent with the insight that within-
brand contagion can sometimes intensify competition (e.g., He et al. 2012). The pattern is also
reminiscent of the famous result by Klemperer (1987) that loyalty programs and switching costs
can have a perverse effect: Even though they decrease competition and increase profitability
once customers have been made loyal, this induces firms to compete intensely when acquiring
customers in the early stages of market development. The ferocious competition to attract new
customers can more than dissipate the benefits of reduced competition later on. Our model shows
that something similar can happen with temporary exclusivity as well, though the sequence of
ferocious versus softened competition is reversed and lock-in is exogenous. Because the
simulation did not involve price competition, this result is unique to the game-theoretic analysis.

35
Discussion
Recapitulation of Main Insights
We considered a puzzling business decision by NTT managers and—building from these
practitioners’ theory in use (Zaltman et al. 1982)—investigated whether WOM dynamics and
customer lock-in can impact the profitability of temporary product exclusivity. We develop six
new insights.
First, foregoing temporary exclusivity can be more profitable than taking it, and which
course of action is most profitable depends not simply on the strength of cross-brand WOM but
also on customer lock-in. The right decision cannot be reached by considering one without the
other. This interplay between cross-brand WOM and customer lock-in is our most important and
novel insight.
Second, firms who count the opinion leaders among their locked-in customers or brand
aficionados gain more from exclusivity than firms who do not. Companies and brands that do not
have strong and exclusive bonds with opinion leaders are typically seen as weaker. So, our result
that such companies and brands gain less from exclusivity—often intended as protection against
competition—may seem paradoxical. The paradox is resolved, however, once one realizes that
those weak players stand to gain most from cross-brand WOM.
Third, a short exclusivity period can be worse than both no exclusivity and long exclusivity.
That is, the impact of exclusivity duration on profits can be non-monotonic.
Fourth, firms may want to forego temporary exclusivity even in the absence of cross-brand
WOM, but only in markets with price sensitive demand, a small set of shared customers, and
strong within-brand WOM. Though a special case, this may be our most surprising result. The
next two results are, in our estimation, less important or novel than the preceding four.
36
Fifth, facing a larger number of competitors increases the profit impact of making the wrong
decision but need not affect the decision itself very much. The reason is that in fragmented
markets with more competitors, both the harm from business stealing and the positive externality
of WOM increase. In our simulated markets, both ended up counter-balancing each other.
Sixth, foregoing exclusivity for a new product is especially attractive when customers are
slow to adopt without WOM and when within-brand WOM alone cannot generate sales quickly.
Contributions to Theory
We make three theoretical contributions. First, we show how WOM and market structure
jointly affect whether one should take or forego exclusivity. As we discuss later, cross-brand
WOM turns locked-in customers of one’s competitors into a complementary asset (Teece 1986)
that one does not have access to but is able to capitalize on by foregoing exclusivity.
Second, unlike previous research, we show that foregoing exclusivity can be profitable
even when exclusivity is only temporary, competitors offer products of equal quality, and WOM
is weaker across than within brands.
Third, we show how a sound marketing decision can hinge on the interlock between a
“vertical” and a “horizontal” network (Van den Bulte 2010). Our two focal considerations, lock-
in and WOM, can be integrated into a network view of markets featuring both a "vertical"
network of commercial ties between firms and customers, and a "horizontal" network of WOM
ties among customers (Figure 1). The interlocking of horizontal and vertical networks has
received very little attention so far. Each type of ties has been the focus of separate research
streams, with vertical ties being the focus in the channels and business marketing literatures (e.g.,
Wuyts et al. 2004) and horizontal ties being the focus in the diffusion and social network
literatures (e.g., Iyengar et al. 2011). Our results illuminate some of the complex interactions

37
between the two: Exclusivity protects firms from rivals vying for the same set of customers (i.e.,
in network-theoretic terms, from other structurally equivalent firms), but does so at the detriment
of a positive externality stemming from social contagion in the horizontal network.
Implications for Practice
Though our models are theoretical, our results provide useful qualitative guidance to
managers. For instance, they indicate that NTT’s intuition was sound. WOM dynamics among
customers, and specifically spillover across competitors’ customer bases, can reverse the
common view that exclusivity is valuable. However, our results also show that NTT’s decision is
not always the best. A systems integrator like NTT often has many locked-in customers, and this
favors foregoing exclusivity. A firm that does not enjoy such lock-in may be better off going for
a temporary exclusivity, like phone service provider AT&T did with the early iPhone. Our
findings also have implications beyond those motivating examples.
New product marketing. Firms launching a new product can increase their profitability by
enabling competitors to enter the market as well. When positive cross-brand WOM accelerates or
increases the demand for the product at a given price, this externality can more than compensate
for the loss of market share from foregoing an exclusive first-mover position. Customer lock-in
is critical, though. The greater the fraction of locked-in customers, the less intense the
competition and the greater the boost in cross-brand WOM, and hence the greater the increase in
profits from foregoing temporary exclusivity.
Exclusive distribution. Distributors should not always strive for temporary product
exclusivity. A sound decision takes into account WOM and customer lock-in, our results show.
Distributors should also take into consideration channel-specific motivations for exclusivity,
such as the need to protect transaction-specific investments or the boost in bargaining power

38
driving down the manufacturer’s wholesale price. Another important consideration is that social
contagion often drives growth for risky new products and technologies, but is less important than
advertising, service, and other distributor efforts for low-risk products in mature industries.
Benchmarking. When exclusivity lowered financial performance in our analyses, it did so
because the boost in profit share was not enough to compensate for the decrease in total industry
profits. Hence, companies who judge their financial performance against their competitors (e.g.,
through profit or market share) may mistakenly conclude that exclusivity boosts financial
performance when it actually depresses it. This implies that using competitor-oriented objectives
when making decisions to accept exclusivity can hurt financial performance, consistent with
broader claims by Armstrong and Collopy (1996) and Luo, Rindfleisch and Tse (2007).
Business marketing. The decision to exploit or forego exclusivity is especially consequential
in markets where influential customers consider dealing with only one key supplier. The
interlock between the vertical network of commercial ties (which customers consider buying
from what firm) and the horizontal network of WOM ties (which customers are most influential)
may be especially important in business markets, where customers like Boeing, Goldman Sachs,
BMW or Toyota can have a major impact in legitimizing new technologies and solutions.
Fashion and lifestyle industries. The strategic trade-offs involved in product exclusivity are
especially challenging in fashion industries (Appel et al. 2013; Barnett 2005; Hemphill and Suk
2009; Siggelkow 2001). Our results imply that allowing rivals to enter immediately can be
beneficial even when there is no cross-brand WOM but there are high levels of customer lock-in,
within-brand WOM, and price sensitivity of customers. Markets for fashion apparel and other
products with a strong social or lifestyle identity can exhibit this combination of lock-in (brand
aficionados), high within-brand WOM (strong insider buzz) but low cross-brand WOM
39
(indifference to outsiders). Our result that lack of exclusivity can boost profits is quite relevant to
the debate among legal scholars on the merits of laws such as the proposed Innovative Design
Protection and Piracy Prevention Act (Barnett 2005; Hemphill and Suk 2009).
Implications for Research
Networks in marketing. Our study considered two different mechanisms, competition and
word-of-mouth, each operating over a different set of ties, vertical commercial ties between
firms and customers and horizontal word-of-mouth ties among customers. Focusing on vertical
and horizontal networks jointly may be an effective research strategy to better distinguish
between mechanisms that are often hard to tease apart in a single type of network (e.g., Burt
1987). Future research may benefit from similarly matching different processes to different kinds
of ties to gain deeper understanding of social network processes, not only various contagion
mechanisms in new product diffusion as discussed recently by Iyengar, Van den Bulte and Choi
(2011) but also other processes like competition as illustrated in the present study.
Marketing strategy. Several studies have documented how network externalities and other
contagion dynamics can affect the benefits of early versus late entry (e.g., Joshi et al. 2009;
Srinivasan et al. 2004). Our work suggests that distinguishing between the effects of contagion
within and between brands may provide more refined insights into that important question.
The positive impact of competition on market size is a phenomenon that has received
considerable attention in the areas of technology standards, licensing, category building, and
social legitimation dynamics (e.g., Agarwal and Bayus 2002; Roberts and Samuelson 1988). Our
work suggests that such positive aspects of competition exist at the intersection of channel
strategy and new product diffusion as well. There is a dearth of research at this intersection
(Gatignon et al. 2007), and we hope our work will motivate more investigations in the area.

41
Commercialization of new technologies. Influential contributions by Teece (1986) and Itami
(1987) noted that (i) bringing new technologies to market often requires not just a product and
customers but also complementary assets, and that (ii) customer lock-in boosts the firm’s ability
to appropriate the profits of the innovation. We contend that the presence of cross-brand WOM
adds an important dynamic. The locked-in customers of one’s competitors now become a
complementary asset that one does not have access to but would like to capitalize on. In order to
do that, one must allow the competitor to sell one’s technology. Foregoing exclusivity is then a
form of cooperation with competitors where access to technology or product is exchanged for
WOM. Note, this dynamic can be at work even without any competing standard, and so provides
a new rationale for technology licensing.
Multi-method research. Our work illustrates how agent based modeling and game theory
can be used in complementary fashion. Combining the two can leverage the strength of each and
provide confidence that key insights are not driven by assumptions specific to either method.
Unresolved issues. Like any research effort, our simulation and game-theoretic models
provide a purposively selective representation of the phenomenon of interest. The analyses did
not consider that customers may interpret exclusivity as a quality signal. In such cases,
exclusivity may boost the intrinsic tendency to adopt early or increase the size of the market
regardless of WOM. Also, we focused on sellers and their direct customers, without taking into
account other constituents upstream or downstream in the supply chain. For instance, we did not
consider that a reseller or OEM may accept an exclusivity offer from an upstream supplier
because he knows that if he does not, the offer will go to a competitor, and that if the latter
accepts then the reseller or OEM will be worse off. So, if the upstream supplier makes the
mistake of offering exclusivity, a rational reseller or OEM may be induced to accept it even if he

41
would have preferred that no such offer was going to be extended to anyone. Also, when
downstream resellers or OEMs are vertically differentiated in the quality they provide to
customers, then the upstream supplier should take that into account when deciding which of
these downstream firms to extend the exclusivity offer to (Subramanian et al. 2013). More
generally, allowing for asymmetry between competitors may produce interesting new results. So
may allowing for price discrimination between locked-in and other customers and allowing for
endogenous customer lock-in that springs into existence only after one buys the product
(Klemperer 1987).
The decision to use exclusivity in a vertical supply chain or distribution channel context has
several additional facets. On the one hand, exclusivity provides the upstream company with
better control and coordination (Frazier and Lassar 1996), signals commitment to its downstream
partners (Fein and Anderson 1997), and enables the latter to recoup transaction specific
investments faster (e.g., Dutta et al. 1999). On the other hand, it increases the downstream
partner’s bargaining power and limits the product’s availability (e.g., Subramanian et al. 2013).
Though these considerations affect the governance of supply chains and distribution channels,
we did not incorporate them into our analyses. Conversely, existing channel research provides
little to no insights on how WOM should affect channel design and management. One possibility
is that WOM among customers facilitates market learning by channel or supply chain partners,
which in turn affects the decision how to structure the pattern of ties between upstream and
downstream companies (Wuyts et al. 2004). This would be an example of how marketing
strategy can actively shape the interlock of horizontal and vertical networks.

42
References
Agarwal, Rajshree and Barry L. Bayus (2002), “The Market Evolution and Sales Takeoff of
Product Innovations,” Management Science, 48 (8), 1024-1041.
Anderson, Eric T. and Duncan Simester (2013), “Advertising in a Competitive Market: The Role
of Product Standards, Customer Learning and Switching Costs,” Journal of Marketing
Research, 50 (August), 489-504.
Ansari, Asim, Oded Koenigsberg, and Florian Stahl (2011), “Modeling Multiple Relationships in
Social Networks,” Journal of Marketing Research, 48 (August), 713-728.
Appel, Gil, Barak Libai, and Eitan Muller (2013), “The Short- and Long-term Impacts of
Fashion Knockoffs on Original Items,” MSI Report No. 13-108, Cambridge, MA: Marketing
Science Institute.
Armstrong, J. Scott and Fred Collopy (1996), “Competitor Orientation: Effects of Objectives and
Information on Managerial Decisions and Profitability,” Journal of Marketing Research, 33
(2), 188-199.
Barnett, Jonathan M. (2005), “Shopping for Gucci on Canal Street: Reflections on Status
Consumption, Intellectual Property, and the Incentive Thesis,” Virginia Law Review, 91
(October), 1381-1423.
Burt, Ronald S. (1987), “Social Contagion and Innovation: Cohesion versus Structural
Equivalence,” American Journal of Sociology, 92 (6), 1287-1335.
Centola, Damon (2010), “The Spread of Behavior in an Online Social Network Experiment,”
Science, 329 (5996), 1194-1197.
——— and Michael Macy (2007), “Complex Contagions and the Weakness of Long Ties,”
American Journal of Sociology, 113 (November), 702-734.
Chen, Yuxin and Jinhong Xie (2007), “Cross-Market Network Effect with Asymmetric
Customer Loyalty: Implications on Competitive Advantage,” Marketing Science, 26 (1), 52-66.
Christakis, Nicholas A. and James H. Fowler (2007), “The Spread of Obesity in a Large Social
Network Over 32 Years,” New England Journal of Medicine, 357 (4), 370-379.
Conner, Kathleen R. (1995), “Obtaining Strategic Advantage from Being Imitated: When Can
Encouraging "Clones" Pay?” Management Science, 41 (2), 209-225.
Condon, Anne and Richard M. Karp (2001), “Algorithms for Graph Partitioning on the Planted
Partition Model,” Random Structures and Algorithms, 18 (2), 116-140.
Desai, Preyas S., Oded Koenigsberg, and Devavrat Purohit (2010), “Forward Buying by
Retailers,” Journal of Marketing Research, 47 (February), 90-102.

43
Dockner, Engelbert and Steffen Jørgensen (1988), “Optimal Pricing Strategies for New Products
in Dynamic Oligopolies,” Marketing Science, 7 (4), 315-334.
Dodds, Peter Sheridan, Roby Muhamad, and Duncan J. Watts (2003), “An Experimental Study
of Search in Global Social Networks,” Science, 301 (5634), 827-829.
Dutta, Shantanu, Jan Heide, and Mark Bergen (1999), “Vertical Territorial Restrictions and
Public Policy: Evidence from Industrial Markets,” Journal of Marketing, 63 (4), 121-134.
Eyuboglu, Nermin and Andreas Buja (2007), “Quasi-Darwinian Selection in Marketing
Relationships,” Journal of Marketing, 71 (October), 48–62.
Fein, Adam and Erin Anderson (1997), “Patterns of Credible Commitments: Territory and Brand
Selectivity in Industrial Distribution Channels,” Journal of Marketing, 61 (2), 19-34.
Fershtman, Chaim and Eitan Muller (1993), “The Benefits of Being Small: Duopolistic
Competition with Market Segmentation,” Review of Industrial Organization, 8 (1), 101-111.
Fortunato, Santo (2010), “Community Detection in Graphs,” Physics Reports, 486 (3-5), 75-174.
Frazier, Gary L. and Walfried M. Lassar (1996), “Determinants of Distribution Intensity,”
Journal of Marketing, 60 (4), 39-51.
Fruchter, Gila E. and Christophe Van den Bulte (2011), “Why the Generalized Bass Model
Leads to Odd Optimal Advertising Policies,” International Journal of Research in Marketing,
28 (3), 218-230.
Gatignon, Hubert, Erin Anderson, and Joseph Lajos (2007), “New Product Distribution and
Inter-Channel Competition: Market-Making, Market-Taking, and Competitive Effects in
Several European Countries,” Working paper, Insead, Fontainebleau, France.
Gensch, Dennis H. (1984), “Targeting the Switchable Industrial Customer,” Marketing Science,
3 (Winter), 41-54.
Geroski, Paul, and Tassos Vlassopoulos (1991), “The Rise and Fall of a Market Leader: Frozen
Foods in the U.K.,” Strategic Management Journal, 12 (6), 467-478.
Givon, Moshe, Vijay Mahajan, and Eitan Muller (1995), “Software Piracy: Estimation of Lost
Sales and the Impact on Software Diffusion,” Journal of Marketing, 59 (1), 29-37.
Goel, Sharad, Duncan J. Watts, and Daniel G. Goldstein (2012), ”The Structure of Online
Diffusion Networks,” in EC '12 Proceedings of the 13th ACM Conference on Electronic
Commerce, New York: ACM, 623-638.
Goldenberg, Jacob, Oded Lowengart, and Daniel Shapira (2009), “Zooming in: Self Emergence
Movements in New-Product Growth,” Marketing Science, 28 (2), 274-292.

44
Hacking, Ian (1983), Representing and Intervening: Introductory Topics in the Philosophy of
Natural Science. Cambridge, U.K.: Cambridge University Press.
Haenlein, Michael and Barak Libai (2013), “Targeting Revenue Leaders for a New Product,”
Journal of Marketing, 77 (May), 65-80.
He, Tingting, Dmitri Kuksov, and Chakravarthi Narasimhan (2012), “Intraconnectivity and
Interconnectivity: When Value Creation May Reduce Profits, Marketing Science, 31 (July-
August), 587-602.
Heide, Jan B. and Allen M. Weiss (1995), “Vendor Consideration and Switching Behavior for
Buyers in High Technology Markets,” Journal of Marketing, 59 (3), 30-43.
Hemphill, C. Scott and Jeannie Suk (2009), “The Law, Culture, and Economics of Fashion,”
Stanford Law Review, 61 (March), 1147-1199.
Ho, Teck-Hua, Shan Li, So-Eun Park, and Zuo-Jun Max Shen (2012), “Customer Influence
Value and Purchase Acceleration in New Product Diffusion," Marketing Science, 31 (March-
April), 236-256.
Hu, Yansong and Christophe Van den Bulte (2012), "The Social Status of Innovators, Imitators,
and Influentials in New Product Adoption: It’s Not Just about High versus Low," MSI Report
No. 12-106. Cambridge, MA: Marketing Science Institute.
Itami, Hiroyuki (1987), Mobilizing Invisible Assets. Cambridge, MA: Harvard University Press.
Iyengar, Raghuram, Christophe Van den Bulte, and Jeonghye Choi (2011), “Distinguishing
among Mechanisms of Social Contagion in New Product Adoption: Framework and
Illustration,” MSI Report No. 11-119, Cambridge, MA: Marketing Science Institute.
———, ———, and Thomas W. Valente (2011), “Opinion Leadership and Social Contagion in
New Product Diffusion,” Marketing Science, 30 (March-April), 195-212.
John, George, Allen M. Weiss, and Shantanu Dutta (1999), “Marketing in Technology-Intensive
Markets: Toward a Conceptual Framework,” Journal of Marketing, 63 (October), 78-91.
Joshi, Yogesh. V., David J. Reibstein, and Z. John Zhang (2009), “Optimal Entry Timing in
Markets with Social Influence,” Management Science, 55 (6), 926-939.
Keller, Ed (2007), “Unleashing the Power of Word of Mouth: Creating Brand Advocacy to Drive
Growth,” Journal of Advertising Research, 47 (4), 448-452.
Klemperer, Paul (1987), “Markets with Consumer Switching Costs,” Quarterly Journal of
Economics, 102 (May), 375-394.
Krishnan, Trichy V., P.B. “Seethu” Seetharaman, and Demetrios Vakratsas (2012), “The
Multiple Roles of Interpersonal Communication in New Product Growth,” International
Journal of Research in Marketing, 29 (3), 292-305.

45
Libai, Barak, Eitan Muller, and Renana Peres (2009), “The Role of Within-Brand and Cross-
Brand Communications in Competitive Growth,” Journal of Marketing, 73 (3), 19-34.
———, ——— , and ——— (2013), “Decomposing the Value of Word-of-Mouth Seeding
Programs: Acceleration Versus Expansion,” Journal of Marketing Research, 50 (April), 161-
176.
Luo, Xueming, Aric Rindfleisch, and David K. Tse (2007), “Working with Rivals: The Impact of
Competitor Alliances on Financial Performance,” Journal of Marketing Research, 44 (1), 73-
83.
McPherson, Miller, Lynn Smith-Lovin, and James M. Cook (2001), “Birds of a Feather:
Homophily in Social Networks,” Annual Review of Sociology, 27, 415-444.
Medawar, Peter B. (1979), Advice to a Young Scientist. New York: Harper & Row.
——— (1984), The Limits of Science. New York: Harper & Row.
Moody, James (2009), “Network Structure and Diffusion,” Working Paper, Duke Population
Research Institute, Duke University, Durham, NC.
Moorthy, K. Sridhar (1993), “Theoretical Modeling in Marketing,” Journal of Marketing, 57
(April), 92-106.
Narasimhan, Chakravarthi (1988), “Competitive Promotional Strategies,” Journal of Business,
61 (4), 427-449.
Parker, Philip M. and Hubert Gatignon (1994), “Specifying Competitive Effects in Diffusion
Models: An Empirical Analysis,” International Journal of Research in Marketing, 11 (1), 17-
39.
Rivera, Mark T., Sara B. Soderstrom, and Brian Uzzi (2010), “Dynamics of Dyads in Social
Networks: Assortative, Relational, and Proximity Mechanisms,” Annual Review of
Sociology, 36, 91-115.
Roberts, Mark J. and Larry Samuelson (1988), “An Empirical Analysis of Dynamic, Nonprice
Competition in an Oligopolistic Industry,” Rand Journal of Economics, 19 (2), 200-220.
Schmitt, Philipp, Bernd Skiera, and Christophe Van den Bulte (2011), “Referral Programs and
Customer Value,” Journal of Marketing, 75 (1), 46-59.
Serrano, M. Angeles and Marian Boguna (2005), “Tuning Clustering in Random Networks with
Arbitrary Degree Distributions,” Physical Review E, 72 (3 Pt 2), 036133.
Siggelkow, Nicolaj (2001), “Change in the Presence of Fit: The Rise, the Fall, and the
Renaissance of Liz Claiborne,” Academy of Management Journal, 44 (4), 838-857.

46
Srinivasan, Raji, Gary L. Lilien, and Arvind Rangaswamy (2004), “First In, First Out? The
Effects of Network Externalities on Pioneer Survival,” Journal of Marketing, 68 (1), 41-58.
Srivastava, Rajendra K., Tasadduq A. Shervani, and Liam Fahey (1998), “Market-Based Assets
and Shareholder Value: A Framework for Analysis,” Journal of Marketing, 62 (January), 2-
18.
Subramanian, Upender, Jagmohan S. Raju, and Z. John Zhang (2013), “Exclusive Handset
Arrangements in the Wireless Industry: A Competitive Analysis,” Marketing Science, 32
(March-April), 246-270.
Sun, Baohong, Jinhong Xie, and Henry Cao (2004), “Product Strategy for Innovators in Markets
with Network Effects,” Marketing Science, 23 (2), 243-254.
Teece, David J. (1986), “Profiting from Technological Innovation: Implications for Integration,
Collaboration, Licensing and Public Policy,” Research Policy, 15 (December), 285-305.
Van den Bulte, Christophe (2010), “Opportunities and Challenges in Studying Customer
Networks,” In The Connected Customer: The Changing Nature of Consumer and Business
Markets, Stefan Wuyts, Marnik G. Dekimpe, Els Gijsbrechts, and Rik Pieters, eds., London,
U.K.: Routledge, 7-35.
——— (2011), “Bass Model,” In Wiley International Encyclopedia of Marketing, Vol. 5, Barry
L. Bayus, ed. Chichester, U.K.: John Wiley, 9-15.
——— and Yogesh V. Joshi (2007), “New Product Diffusion with Influentials and Imitators,”
Marketing Science, 26 (3), 400-21.
——— and Gary L. Lilien (1997), “Bias and Systematic Change in the Parameter Estimates of
Macro-Level Diffusion Models,” Marketing Science, 16 (4), 338-53.
Volz, Erik (2004), “Random Networks with Tunable Degree Distribution and Clustering,”
Physical Review E, 70 (5 Pt 2), 056115.
Wuyts, Stefan, Stefan Stremersch, Christophe Van den Bulte, and Philip Hans Franses (2004),
“Vertical Marketing Systems for Complex Products: A Triadic Perspective,” Journal of
Marketing Research, 41 (4), 479-487.
Xie, Jinhong and Marvin Sirbu (1995), “Price Competition and Compatibility in the Presence of
Positive Demand Externalities,” Management Science, 41 (5), 909- 926.
Yoffie, David B. and Renee Kim (2010), “Apple Inc. in 2010,” Case 9-710-467, Boston, MA:
Harvard Business School.
Zaltman, Gerald, Karen LeMasters, and Michael Heffring (1982), Theory Construction in
Marketing: Some Thoughts on Thinking. New York: Wiley.
47
FOOTNOTES
1. Matsushita licensed its VHS video recorder technology whereas Sony kept the exclusivity
over its Betamax technology. Canon commercialized its laser engine printing technology in
the 1980s by selling both ready-to-use desktop laser printers to end users and printer
subsystems to competitors like HP and Apple (John et al. 1999). In today’s tablet computer
market, Apple has kept the exclusivity over its iOS operating system, whereas Google has
commercialized its Android system both directly in Nexus tablets and indirectly through
licenses to Asus, Dell, Lenovo, Samsung, and others. Microsoft similarly has commercialized
its Windows RT operating system by selling its own Surface tablets and by licensing to
competitors.
2. We use the term within-brand (cross-brand) WOM rather than the more cumbersome “WOM
affecting the sales of the product sold by the same firm (different firms).” When the focal
firm making the exclusivity decision is a manufacturer, the brand refers to the manufacturer
rather than the supplier of the technology (e.g., Samsung vs. HTC rather than Android).
Similarly, when the focal firm is a distributor, the brand refers to the distributor rather than
the supplier of the product or technology distributor (e.g., AT&T vs. Sprint rather than Apple
iPhone, NTT vs. Accenture rather than Comverse).
3. Profitability levels and ratios reported in Figure 2, Table 4, and all subsequent exhibits are
based on geometric means, such that the mean of a ratio equals the ratio of the means:
GM(X/Y) = GM(X) / GM(Y). The traditional average or arithmetic mean does not have this
property. Though using the arithmetic or geometric mean does not affect our key insights,
only the latter provides an exact mapping of descriptive percentage gains into regression
results.

48
Figure 1. A Market with Interlocking Horizontal and Vertical Networks

49
Figure 2. How Discounted Profits Vary by Length of Exclusivity and Level of Competition
(0-100% Customer Overlap)
Discounted Profits (10% discounting) are averaged across all values of adoption parameters,
customer homophily structures, and opinion leader lock-in structures.
100
150
200
250
300
350
0 2 4 6 8
Discounted Profits
Length of Exclusivity
100%
80%
60%
40%
20%
0%

51
Table 1. Key Market Characteristics in the Simulation and Game-Theoretic Analyses
Simulation Analysis Game-Theoretic Analysis
______________________________________________________________________________
Of primary interest:
Strength of cross-brand WOM Yes Yes
Customer base overlap Yes Yes
Opinion leader lock-in Yes No
Price competition No Yes
Of secondary interest, showing robustness
Effect of WOM Sales Acceleration Demand Expansion
Repeat purchases No Yes
Number of Periods 30 2
Network Clustering Low to Moderate Maximum
Number of Firms 2 and 5 2
______________________________________________________________________________

51
Table 2. Homophily Parameters, Clustering, and Average Degree
in the Three WOM Networks.
Homophily p11 p22 p33 p12 p13 p23 Clustering
coefficient
Average
degree
Ratio of the
top 33% to
average
degree
None 0.007 0.007 0.007 0.007 0.007 0.007 0.007 6.42 1.45
Low 010.0 01000 01000 01000 0.006 0.001 0.01 6.37 1.59
Moderate 010.0 01000 01000 0100. 0100. 0 0.02 6.43 2.00
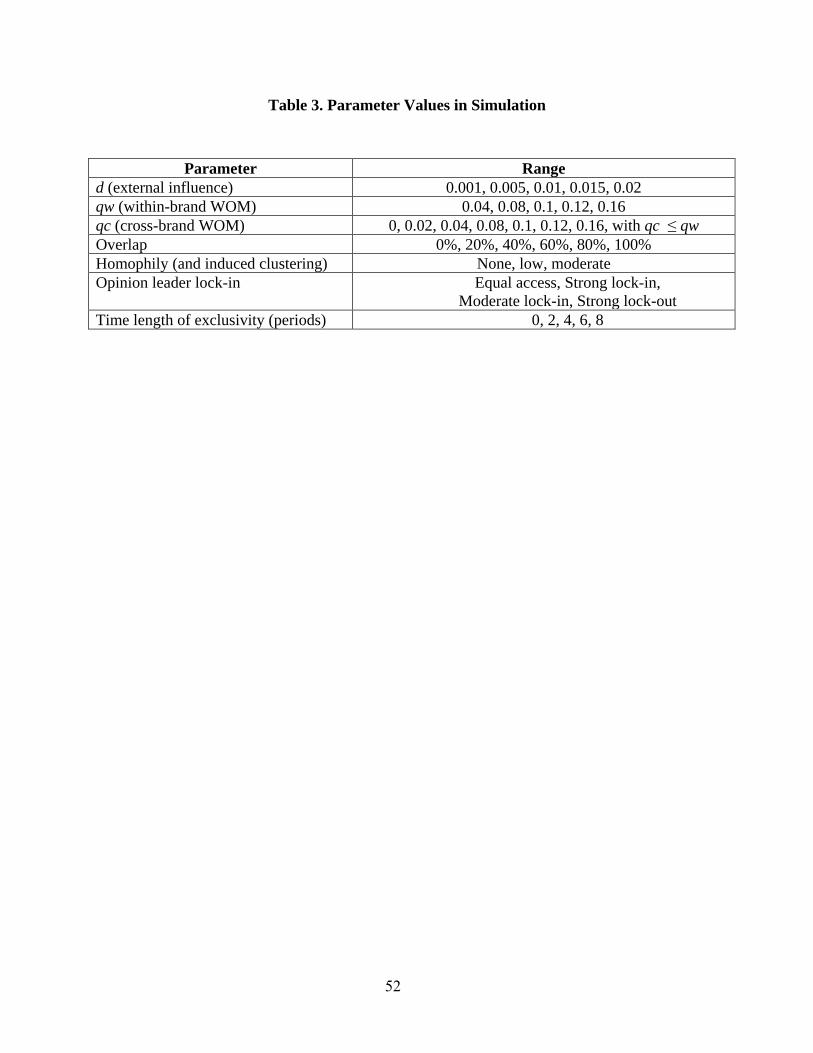
52
Table 3. Parameter Values in Simulation
Parameter Range
d (external influence) 0.001, 0.005, 0.01, 0.015, 0.02
qw (within-brand WOM) 0.04, 0.08, 0.1, 0.12, 0.16
qc (cross-brand WOM) 0, 0.02, 0.04, 0.08, 0.1, 0.12, 0.16, with qc ≤ qw
Overlap 0%, 20%, 40%, 60%, 80%, 100%
Homophily (and induced clustering) None, low, moderate
Opinion leader lock-in Equal access, Strong lock-in,
Moderate lock-in, Strong lock-out
Time length of exclusivity (periods) 0, 2, 4, 6, 8

53
Table 4. Difference in Discounted Profits Compared to No-Exclusivity,
by Length of Exclusivity and Level of Competition
Length of
Exclusivity Level of Competition (Customer Overlap)
__________ ________________________________________________________
T 0% 20% 40% 60% 80% 100%
2 -4.3% -1.8% 0.8% 3.7% 7.1% 10.9%
4 -7.6% -3.0% 2.3% 8.2% 14.9% 21.4%
6 -10.4% -3.3% 4.9% 13.6% 23.6% 33.5%
8 -13.1% -3.4% 7.2% 18.5% 31.1% 43.2%
_______________________________________________________________________
Discounted Profits (10% discounting) are averaged across all values of adoption parameters,
customer homophily structures, and opinion leader lock-in structures.

54
Table 5. Difference in Discounted Profits Compared to No-Exclusivity for Specific Levels of Word-of-Mouth,
by Length of Exclusivity (T) and Level of Competition
qc = 0.00 qc = 0.08 qc = 0.16
_____________________________ _____________________________ _____________________________
qw T Customer Overlap Customer Overlap Customer Overlap
0% 20% 40% 60% 80% 100% 0% 20% 40% 60% 80% 100% 0% 20% 40% 60% 80% 100%
2 -1.2% 5.4% 7.1% 10.8% 16.3% 18.5%
0.04 4 0.0% 7.3% 9.2% 16.6% 27.6% 32.0%
6 2.6% 8.7% 14.9% 21.7% 34.6% 40.6%
8 0.6% 10.4% 18.5% 26.5% 40.7% 46.7%
2 -0.8% 6.4% 10.4% 18.2% 24.0% 33.8% -6.3% -5.4% -5.2% -4.7% -4.5% -3.3%
0.08 4 -0.8% 10.0% 19.4% 30.7% 41.0% 52.8% -11.7% -9.8% -8.5% -7.2% -5.8% -2.1%
6 -2.0% 11.5% 21.8% 38.2% 50.8% 63.2% -15.1% -12.3% -9.0% -5.7% -1.9% 4.4%
8 -0.9% 14.1% 26.2% 43.5% 57.6% 67.8% -18.8% -13.8% -8.4% -3.3% 3.6% 12.7%
2 -0.9% 7.1% 19.1% 31.0% 42.5% 56.0% -4.9% -3.2% -1.9% -0.1% 2.3% 6.1% -5.9% -5.5% -5.3% -4.3% -3.8% -2.7%
0.16 4 0.0% 14.4% 30.2% 49.8% 63.5% 77.9% -9.1% -4.9% 0.3% 5.5% 12.8% 21.3% -11.3% -8.5% -6.3% -3.0% 1.1% 4.8%
6 1.4% 17.0% 36.5% 57.2% 72.7% 83.0% -12.4% -4.9% 4.7% 13.3% 26.1% 40.5% -15.1% -9.0% -2.0% 5.8% 13.6% 24.3%
8 0.0% 18.7% 40.7% 62.5% 74.5% 84.9% -15.4% -4.8% 7.3% 21.5% 37.8% 55.0% -18.5% -9.6% 0.8% 12.4% 25.7% 42.1%
____________________________________________________________________________________________________________
Values are percentage changes in Discounted Profits (10% discounting), averaged across all levels of the external influence adoption
parameter, all customer network structures, and all customer base structures.

55
Table 6. Regression Analysis by Level of Competition
_____________________________________________________________________________________
Customer Overlap
______________ ___________________________________________________________________
0% 20% 40% 60% 80% 100%
Linear effects Intercept 5.077*** 5.169*** 5.245*** 5.311*** 5.380*** 5.451*** DUR = 2 -0.044*** -0.018 0.008 0.036*** 0.069*** 0.104*** DUR = 4 -0.079*** -0.031** 0.023** 0.079*** 0.139*** 0.194*** DUR = 6 -0.110*** -0.034*** 0.048*** 0.128*** 0.212*** 0.289*** DUR = 8 -0.140*** -0.035*** 0.069*** 0.170*** 0.271*** 0.359*** Low homophily 0.032* 0.015 0.006 -0.003 -0.001 0.005 Moderate homophily 0.032* -0.001 -0.021 -0.044*** -0.044*** -0.029*** Strong OL lock-in 0.286*** 0.269*** 0.235*** 0.203*** 0.142*** -0.004 Moderate OL lock-in 0.284*** 0.233*** 0.149*** 0.096*** 0.044*** -0.002 Strong OL lock-out -0.375*** -0.398*** -0.384*** -0.337*** -0.226*** 0.002 d 3.777*** 3.403*** 3.090*** 2.884*** 2.647*** 2.411*** qw 0.293*** 0.264*** 0.251*** 0.241*** 0.259*** 0.284*** qc 0.453*** 0.388*** 0.315*** 0.250*** 0.159*** 0.048***
qw qc -0.534*** -0.489*** -0.442*** -0.407*** -0.380*** -0.311*** Interactions with DUR (0-8)
Low hom. DUR 0.001 0.002 0.001 0.001 0.001 0.001
Mod. hom. DUR 0.003 0.004 0.005* 0.003 0.005** 0.004**
Strong OL lock-in DUR 0.015*** 0.007*** 0.002 -0.005** -0.007*** 0.001
Mod. OL lock-in DUR 0.015*** 0.013*** 0.015*** 0.011*** 0.007*** 0.000
Strong OL lock-out DUR -0.020*** -0.017*** -0.011*** -0.007* 0.001 0.000
d DUR 0.066** 0.107*** 0.147*** 0.168*** 0.177*** 0.181***
qw DUR 0.009** 0.019*** 0.030*** 0.041*** 0.047*** 0.048***
qc DUR -0.022*** -0.029*** -0.034*** -0.039*** -0.041*** -0.034***
qw qc DUR 0.018* 0.023** 0.025*** 0.028*** 0.035*** 0.035*** R2 74.7% 76.3% 77.8% 78.9% 81.2% 83.3%
_____________________________________________________________________________________
* p < .05, ** p < .01, *** p < .001. The dependent variable is the natural logarithm of Discounted Profits. All
regressors interacting with DUR are mean-centered. Each model is estimated on N = 7,500 observations where each
observation is the geometric mean of 10 random replicates in each cell of the simulation design: 5 levels of duration,
3 homophily structures, 4 opinion leader lock-in structures, 5 levels of external influence adoption, and 25
combinations of within- and cross-brand WOM propensities.