where the stem jobs are 10 th annual ma stem summit november 13, 2013 michael j. baines cpim...
TRANSCRIPT

Where The STEM Jobs Are
10th Annual MA STEM SummitNovember 13, 2013
Michael J. Baines CPIMFranklin Hampshire Regional Employment Board

Three Best Sources ofLabor Market Information
Traditional LMI (long term)
Real Time Labor Market Intelligence (short term)
Direct Communication with Employers (validate the above)

Recent research suggests that jobs advertised online now reflect at least 70 percent of all openings.
Online job ads are better for uncovering immediate job openings and emerging skill requirements

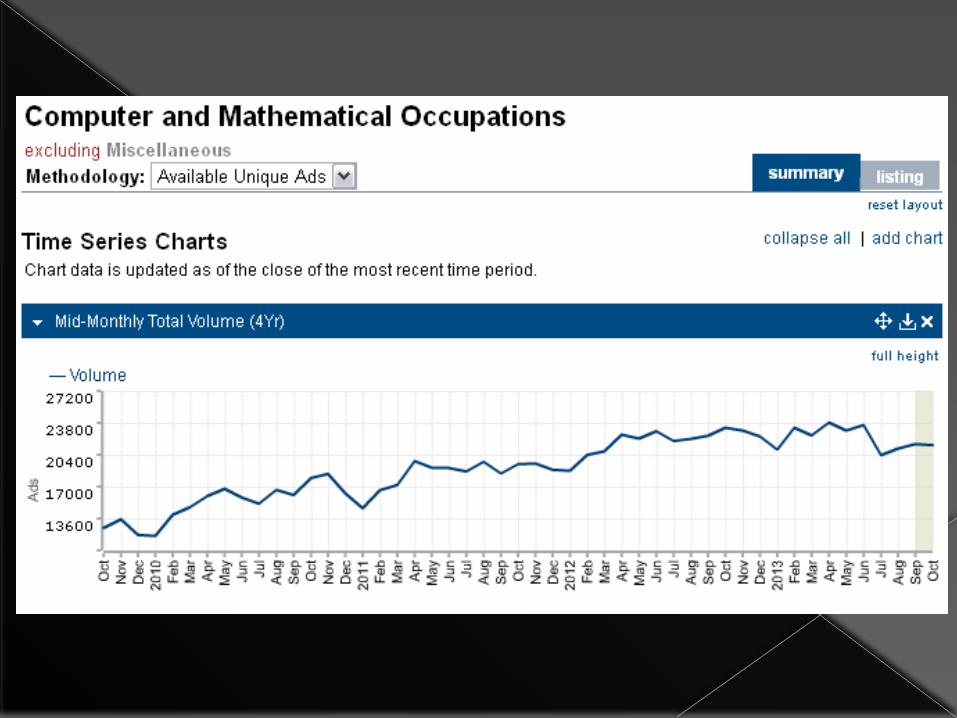
Hiring Demand Dashboard4 year Graph

Major STEM SOC Groups 11-0000 Management 13-0000 Business and Financial
Operations 15-0000 Computer and Mathematical 17-0000 Architecture and Engineering 19-0000 Life, Physical, and Social
Science 29-0000 Healthcare Practitioners and
Technical Occupations


My Analytics (pdf or live?)

Some Minor STEM SOC Groups
25-10XX STEM Teachers Post Secondary 27-1000 Arts and Design 27-4000 Media and Communication
Equipment Workers 49-0000 Installation Maintenance and
Repair Occupations 51-0000 Production Occupations


EMSI STEM Research - MA

Compare to Tom’s Top 20Management Computer and Math

Top 20 STEM Occupations Requiring Advanced EducationRanked by Annual Openings
Occupation (accounts for 62% of STEM Annual Openings)
Annual Openings2010-2020
Long-term 10 YR Growth Rate
Annual Growth by Job
CreationAccountants and Auditors 1462 19% 47%Management Analysts 1294 31% 66%Software Developers, Systems Software 1206 33% 76%
Market Research Analysts and Marketing Specialists
858 46% 63%
Software Developers, Applications 842 26% 71%Financial Analysts 792 36% 63%Computer Systems Analysts 749 29% 60%Financial Managers 685 17% 48%Network and Computer Systems Administrators 511 32% 66%
Computer and Information Systems Managers 504 23% 60%
Medical and Health Services Managers 424 21% 46%Information Security Analysts, Web Developers, and Computer Network Architects
411 30% 67%
Medical Scientists, Except Epidemiologists 390 42% 87%
Graphic Designers 360 16% 34%Mechanical Engineers 350 18% 36%Physicians and Surgeons, All Other 345 14% 42%Computer Programmers 342 13% 37%Clinical, Counseling, and School Psychologists 307 18% 36%
Electrical Engineers 298 14% 36%Biological Technicians 278 21% 38%

Reminder…Pairing online job ads with government-backed statistics and projections and business outreach efforts is the most effective approach and provides the best insight on immediate and ongoing occupational and skill demands.

Find the Power Point here;
> STEMpower.org> STEM LMI sub-group > Share / File Cabinet
Product of the Franklin Hampshire Regional Employment Board

On line References
Standard Occupational Classification
http://www.bls.gov/soc/major_groups.htm
Onet Online – STEM Occupational Cluster
http://www.onetonline.org/find/stem?t=0&g=Go

Contact Information
Michael J. Baines CPIMSpecial Projects Coordinator
STEM Sector [email protected] x 375
www.stempower.org