why is tobacco price manipulation a problem? fjc 052908
TRANSCRIPT
Frank J. ChaloupkaDirector, ImpacTeen Project and
International Tobacco Evidence [email protected]
www.impacteen.orgwww.tobaccoevidence.net
Why is Tobacco Price Manipulation
a Problem? Point-of-Sale Marketing
and Cigarette Smoking
Summit to Identify Policy Strategies to Address Retail Tobacco Price ManipulationSan Francisco, CA May 29, 2008

Overview
• Brief review of recent trends in cigarette company marketing expenditures and impact on price
• Brief review of literature on impact of cigarette marketing on youth and adult cigarette smoking
• Effects of POS cigarette marketing on youth smoking uptake– Focus on recent Archives of Pediatrics & Adolescent
Medicine paper by Slater et al. (2007)

Source: Federal Trade Commission, 2005, and author’s calculations
Cigarette Marketing ExpendituresInflation Adjusted, 1975-2005
$0.00
$2.00
$4.00
$6.00
$8.00
$10.00
$12.00
$14.00
$16.00
$18.00
1975 1978 1981 1984 1987 1990 1993 1996 1999 2002 2005
Year
Bill
ion
Do
llars
(8/
07 $
$s)
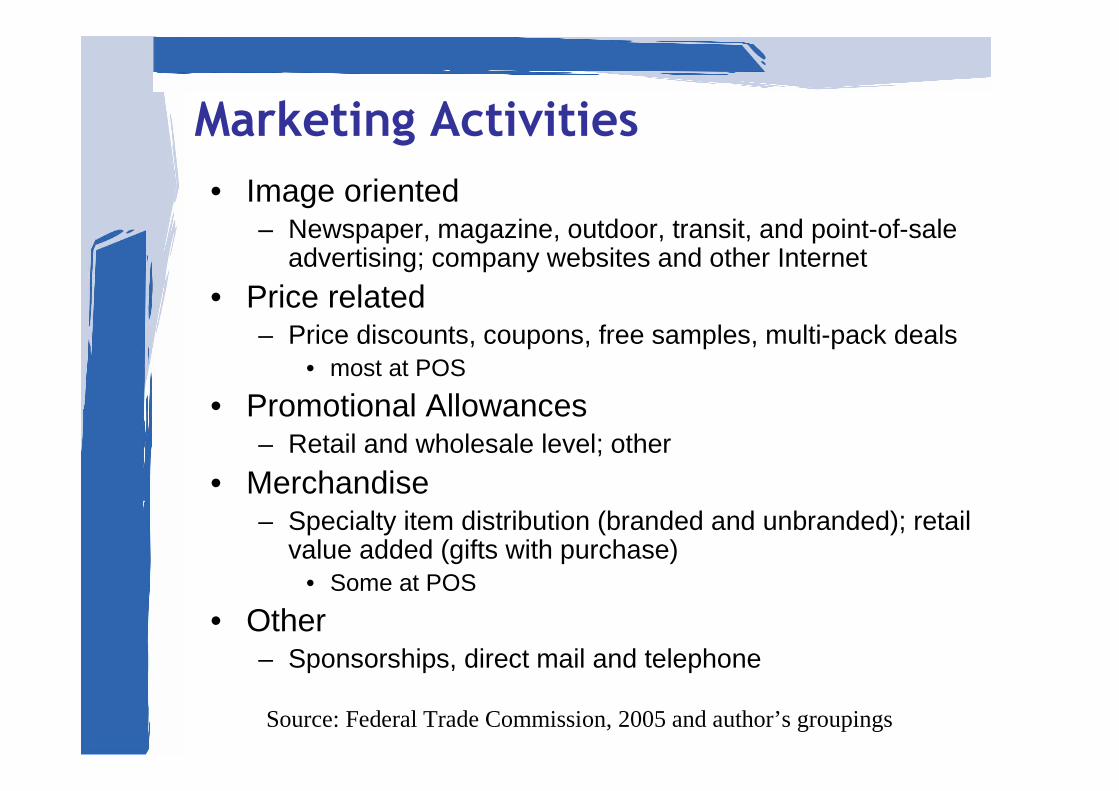
Marketing Activities
• Image oriented– Newspaper, magazine, outdoor, transit, and point-of-sale
advertising; company websites and other Internet
• Price related– Price discounts, coupons, free samples, multi-pack deals
• most at POS
• Promotional Allowances– Retail and wholesale level; other
• Merchandise– Specialty item distribution (branded and unbranded); retail
value added (gifts with purchase)• Some at POS
• Other– Sponsorships, direct mail and telephone
Source: Federal Trade Commission, 2005 and author’s groupings
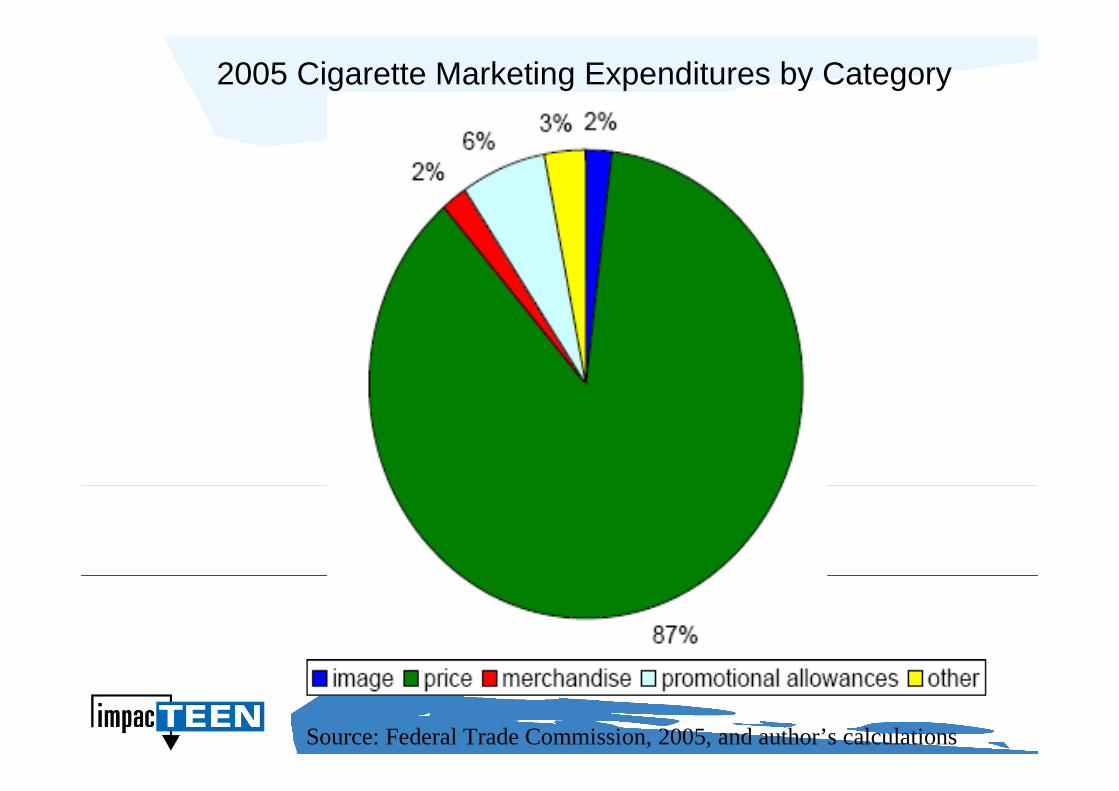
Source: Federal Trade Commission, 2005, and author’s calculations
2005 Cigarette Marketing Expenditures by Category

Shift in Marketing Activities
• Rise in marketing spending in unconstrained venues following the MSA
– Significant increases in point-of-sale marketing following the implementation of the 1999 ban on billboard advertising (Wakefield, et al., 2002)
– Consistent with empirical evidence on impact of marketing restrictions on smoking behavior (Saffer and Chaloupka, 2000)
• Shift over time to price-related marketing activities
– Appears to follow release of the first economic studies on the impact of price on youth and adult smoking behavior in early 1980s (Chaloupka, 2005)
– Accelerates following the MSA
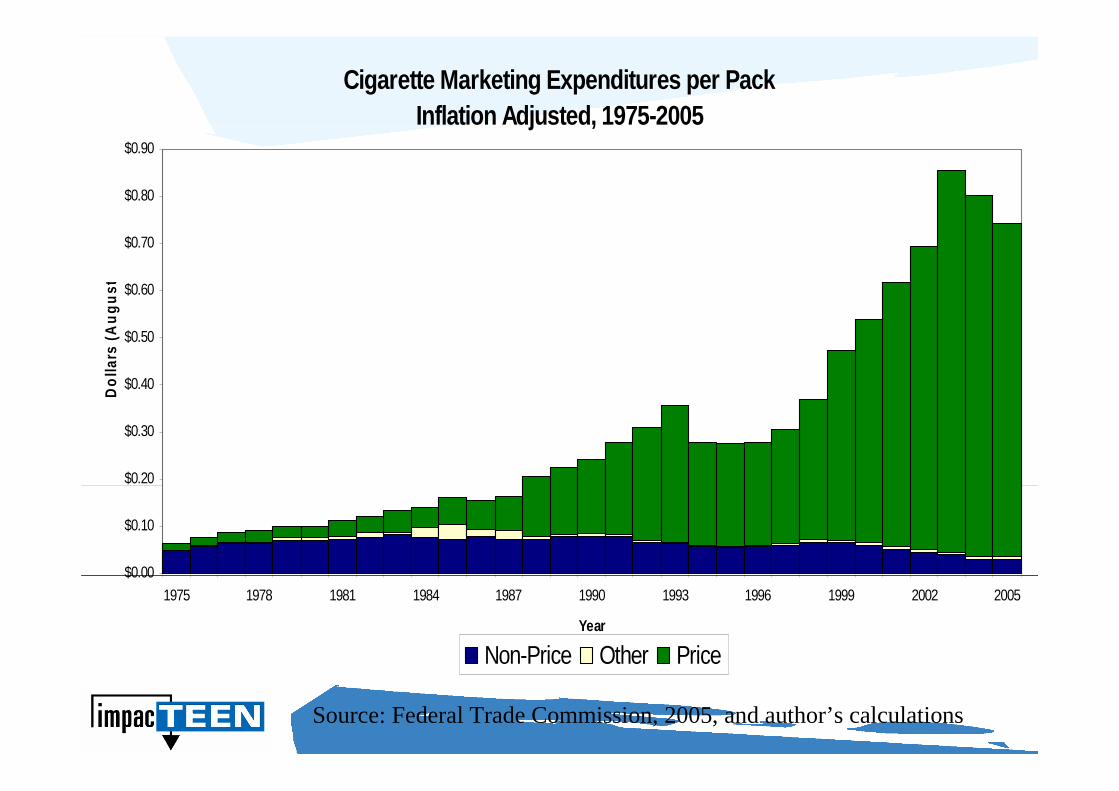
Source: Federal Trade Commission, 2005, and author’s calculations
Cigarette Marketing Expenditures per PackInflation Adjusted, 1975-2005
$0.00
$0.10
$0.20
$0.30
$0.40
$0.50
$0.60
$0.70
$0.80
$0.90
1975 1978 1981 1984 1987 1990 1993 1996 1999 2002 2005
Year
Do
llars
(A
ug
ust
Non-Price Other Price
Price-Related Cigarette Marketing and Tobacco Control
• Evidence from internal documents that price-related marketing used to soften impact of tax increases (Chaloupka et al., 2002; Chaloupka et al., 1998)
•Greater price-related marketing since the MSA (Ruel, et al., 2004; Loomis et al., 2006; FTC, 2007)
•More price-related marketing in states with greater spending on comprehensive tobacco control programs (Loomis, et al., 2006; Slater et al., 2001)
Price-Related Cigarette Marketing and Tobacco Control•More marketing in stores that are more frequented by youth than in other stores (Henriksen, et al., 2004)
•Growing use of point-of-sale ads to highlight sales promotions (e.g. special price, special offer, cents off, reduced price, multi-pack special) (Feighery et al., 2008)
•Percentage of stores in California with at least one ad featuring sales promotion rose from 68% in 2002 to 79% in 2005•More rapid increases in stores located in neighborhoods with higher than average proportion of African-Americans

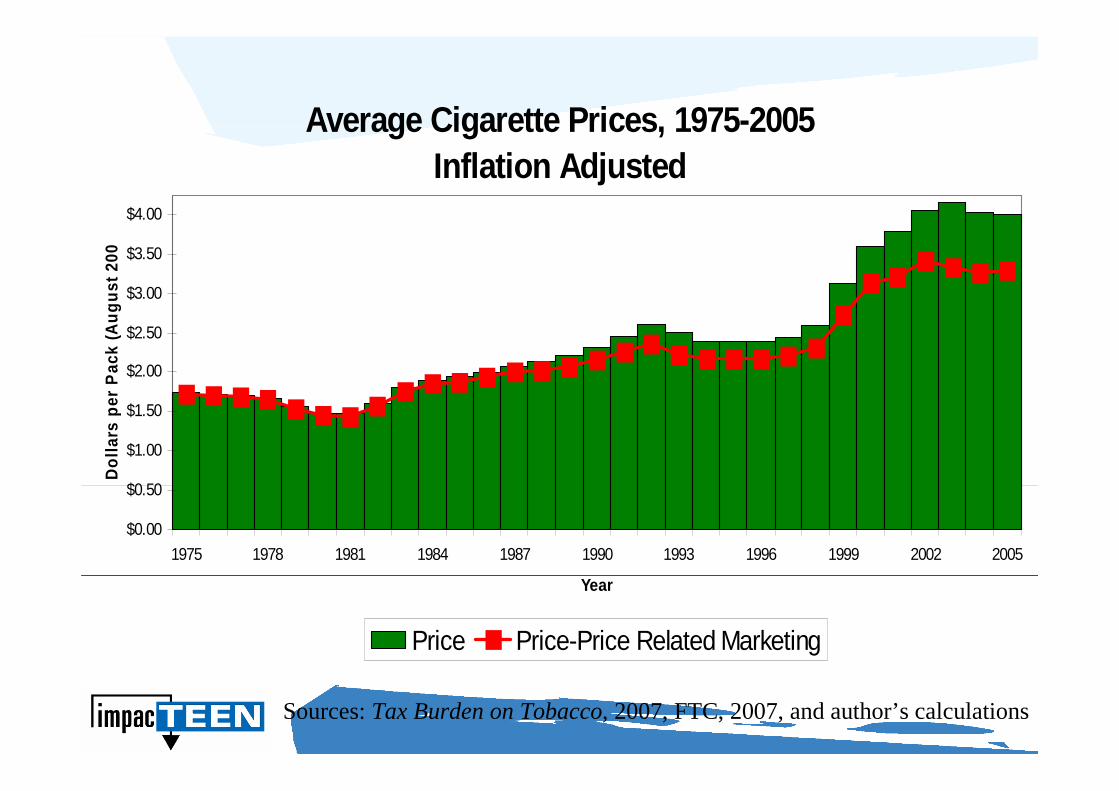
Sources: Tax Burden on Tobacco, 2007, FTC, 2007, and author’s calculations
Cigarette Taxes and Prices, 1976-2005
$0.00
$0.50
$1.00
$1.50
$2.00
$2.50
$3.00
$3.50
$4.00
$4.50
1976 1978 1980 1982 1984 1986 1988 1990 1992 1994 1996 1998 2000 2002 2004
Year
Do
llars
per
Pac
k
State Tax Federal Tax MSA Costs Net Price
Sources: Tax Burden on Tobacco, 2007, FTC, 2007, and author’s calculations
Average Cigarette Prices, 1975-2005Inflation Adjusted
$0.00
$0.50
$1.00
$1.50
$2.00
$2.50
$3.00
$3.50
$4.00
1975 1978 1981 1984 1987 1990 1993 1996 1999 2002 2005
Year
Do
llar
s p
er P
ack
(Au
gu
st 2
007)
Price Price-Price Related Marketing
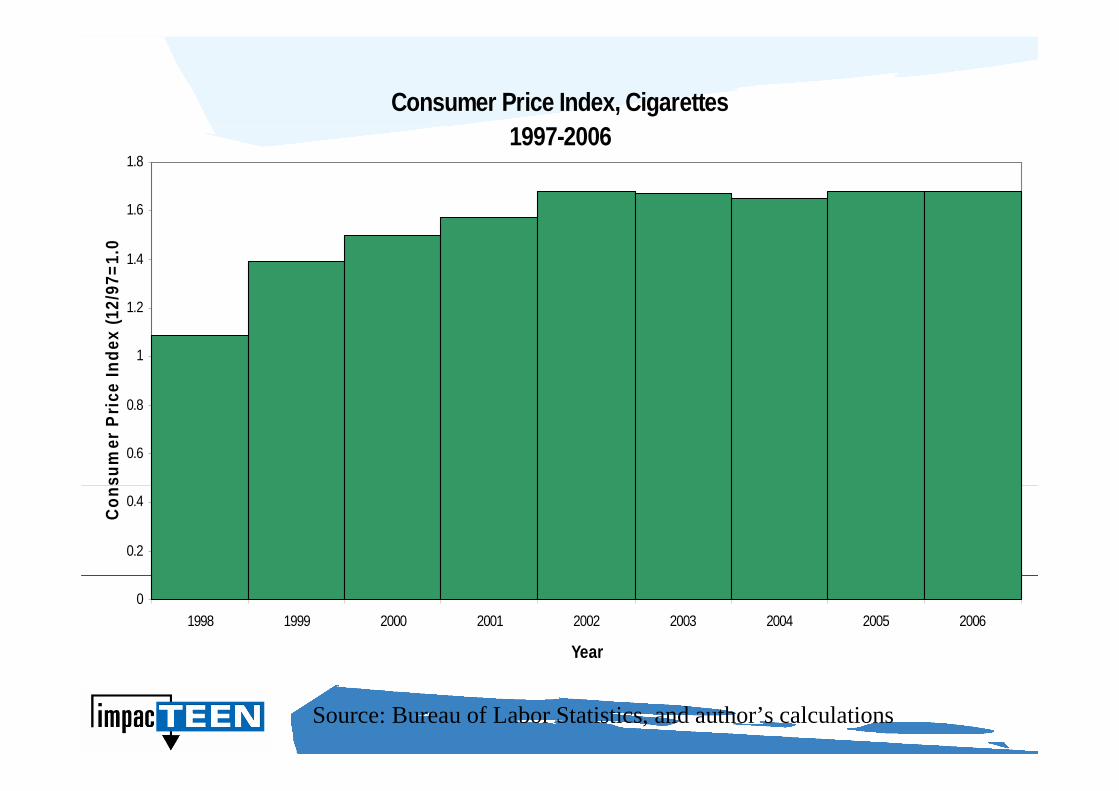
Source: Bureau of Labor Statistics, and author’s calculations
Consumer Price Index, Cigarettes1997-2006
0
0.2
0.4
0.6
0.8
1
1.2
1.4
1.6
1.8
1998 1999 2000 2001 2002 2003 2004 2005 2006
Year
Co
nsu
mer
Pri
ce I
nd
ex (
12/9
7=1.
00)
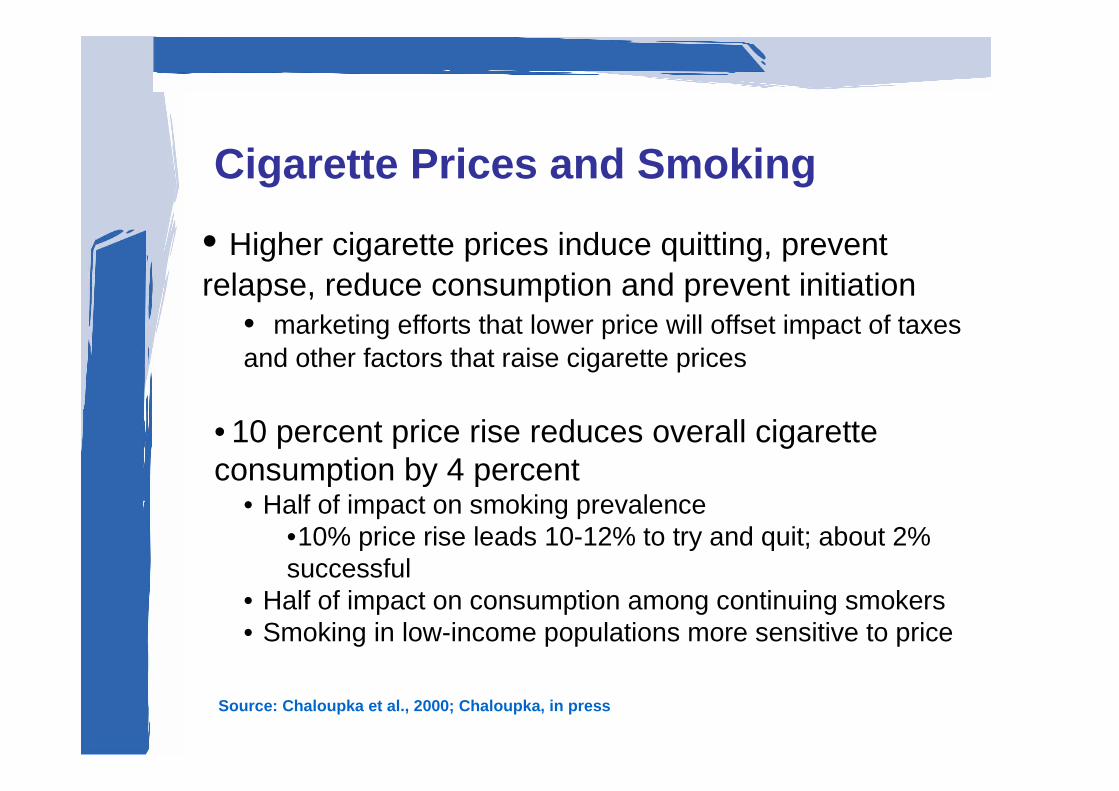
Cigarette Prices and Smoking
• Higher cigarette prices induce quitting, prevent relapse, reduce consumption and prevent initiation
• marketing efforts that lower price will offset impact of taxes and other factors that raise cigarette prices
• 10 percent price rise reduces overall cigarette consumption by 4 percent
• Half of impact on smoking prevalence•10% price rise leads 10-12% to try and quit; about 2% successful
• Half of impact on consumption among continuing smokers• Smoking in low-income populations more sensitive to price
Source: Chaloupka et al., 2000; Chaloupka, in press

Source: Tax Burden on Tobacco, 2007; FTC 2007;and author’s calculations
Cigarette Sales and Cigarette PricesUnited States, 1975-2005
18
20
22
24
26
28
30
32
1975 1978 1981 1984 1987 1990 1993 1996 1999 2002 2005
Year
Sal
es (
bil
lio
n p
acks
)
$1.25
$1.75
$2.25
$2.75
$3.25
$3.75
$4.25
Pri
ce (
Au
gu
st
2007
do
llar
s)
Sales Price Price-Price Marketing

Source: NHIS; TBOT, 2007, FTC 2007; and author’s calculations
Cigarette Prices and Adult Smoking PrevalenceUnited States, 1978-2005
$1.25
$1.75
$2.25
$2.75
$3.25
$3.75
$4.25
1978 1981 1984 1987 1990 1993 1996 1999 2002 2005
Year
Pri
ce p
er P
ack
(8/0
7 d
oll
ars)
20
22
24
26
28
30
32
34
Ad
ult
Pre
vale
nce
Price Price-Price Marketing Adult Prevalence
Source: NSDUH, Tax Burden on Tobacco, 2007, and author’s calculations
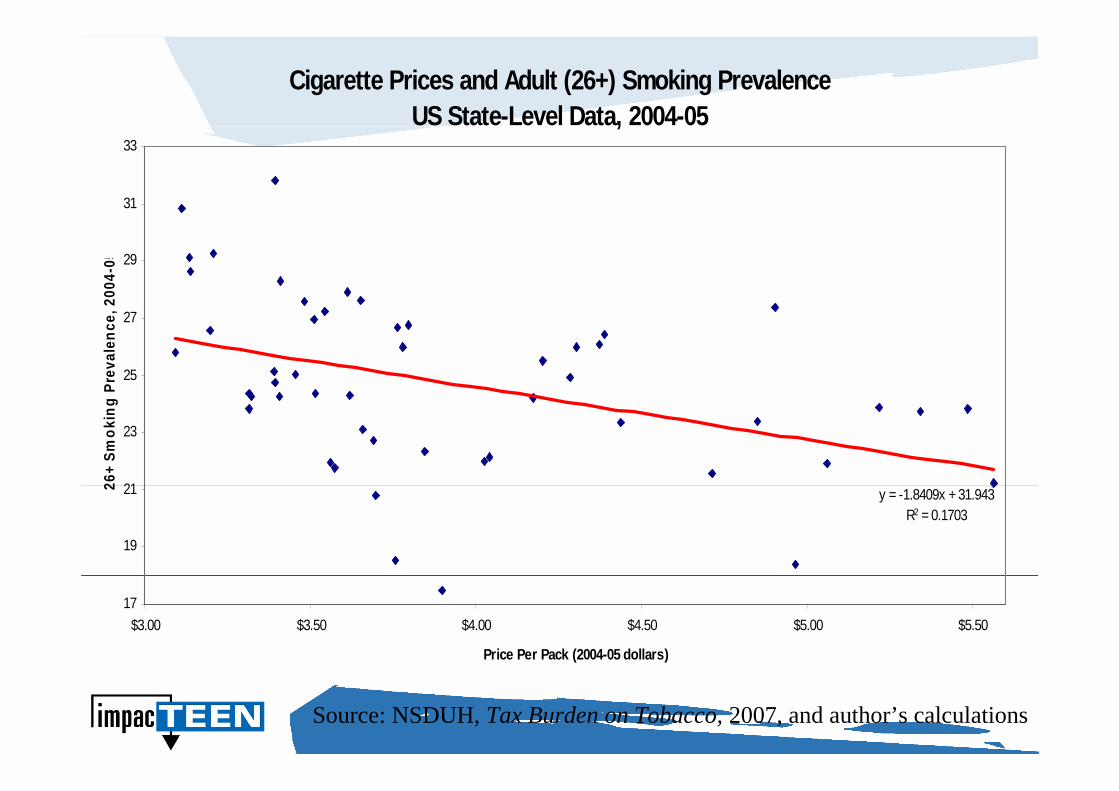
Cigarette Prices and Adult (26+) Smoking PrevalenceUS State-Level Data, 2004-05
y = -1.8409x + 31.943R2 = 0.1703
17
19
21
23
25
27
29
31
33
$3.00 $3.50 $4.00 $4.50 $5.00 $5.50
Price Per Pack (2004-05 dollars)
26+
Sm
oki
ng
Pre
vale
nce
, 200
4-05

Source: BRFSS, Tax Burden on Tobacco, 2006, and author’s calculations
Cigarette Prices and Percentage of Ever Smokers Who Have Quit Smoking
y = 0.0167x + 0.2478
R2 = 0.1276
18.0%
22.0%
26.0%
30.0%
34.0%
38.0%
42.0%
$3.00 $3.50 $4.00 $4.50 $5.00 $5.50
Price (dollars per pack)
Per
cen
t Qu
itter
s
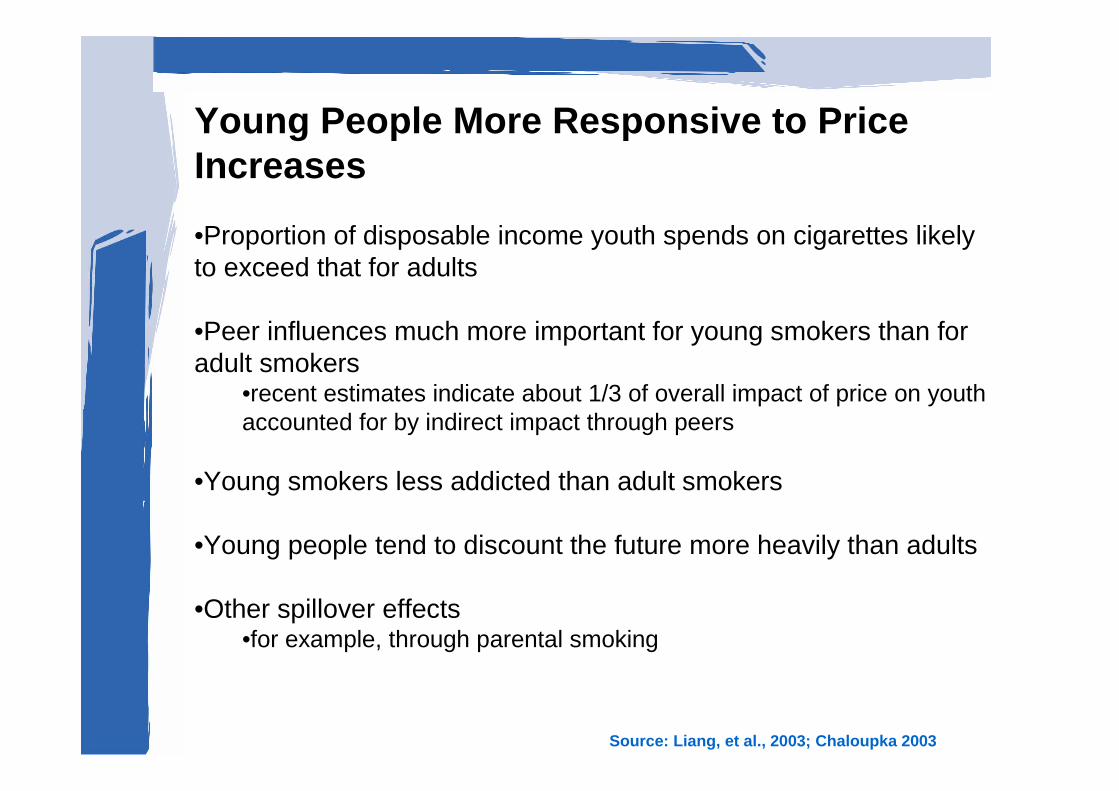
Young People More Responsive to Price Increases
•Proportion of disposable income youth spends on cigarettes likely to exceed that for adults
•Peer influences much more important for young smokers than for adult smokers
•recent estimates indicate about 1/3 of overall impact of price on youth accounted for by indirect impact through peers
•Young smokers less addicted than adult smokers
•Young people tend to discount the future more heavily than adults
•Other spillover effects •for example, through parental smoking
Source: Liang, et al., 2003; Chaloupka 2003
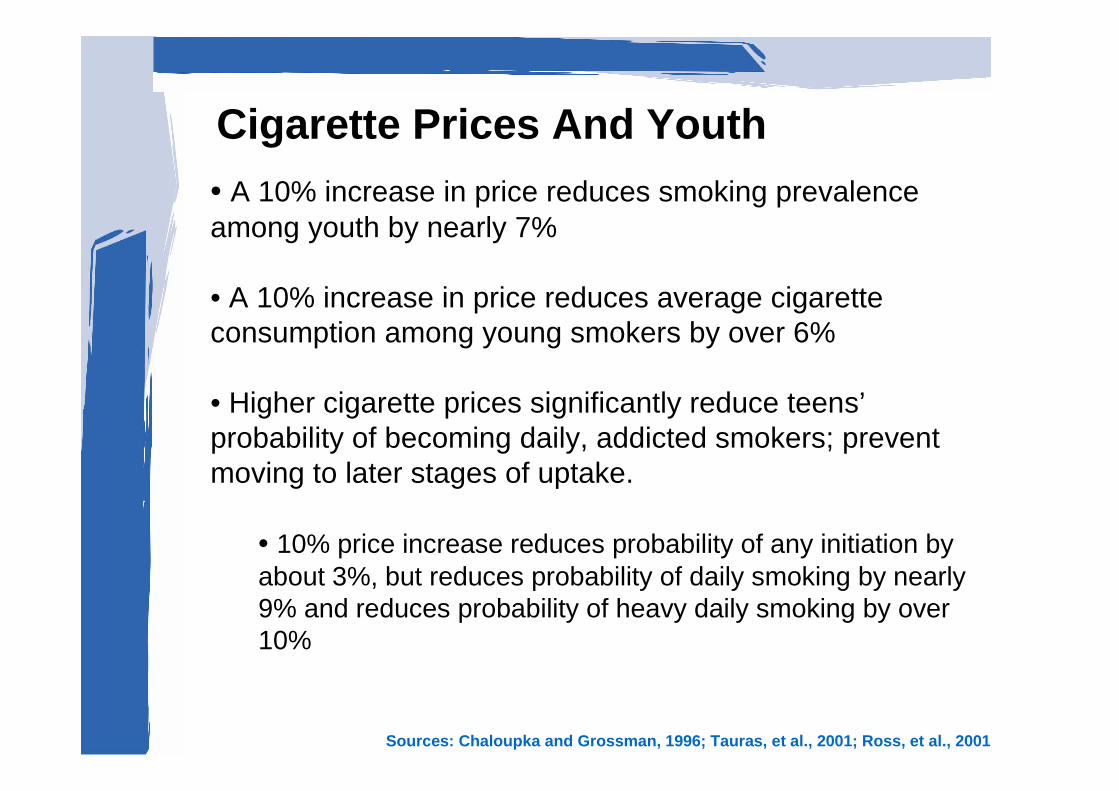
Cigarette Prices And Youth• A 10% increase in price reduces smoking prevalence among youth by nearly 7%
• A 10% increase in price reduces average cigarette consumption among young smokers by over 6%
• Higher cigarette prices significantly reduce teens’probability of becoming daily, addicted smokers; prevent moving to later stages of uptake.
• 10% price increase reduces probability of any initiation by about 3%, but reduces probability of daily smoking by nearly 9% and reduces probability of heavy daily smoking by over 10%
Sources: Chaloupka and Grossman, 1996; Tauras, et al., 2001; Ross, et al., 2001
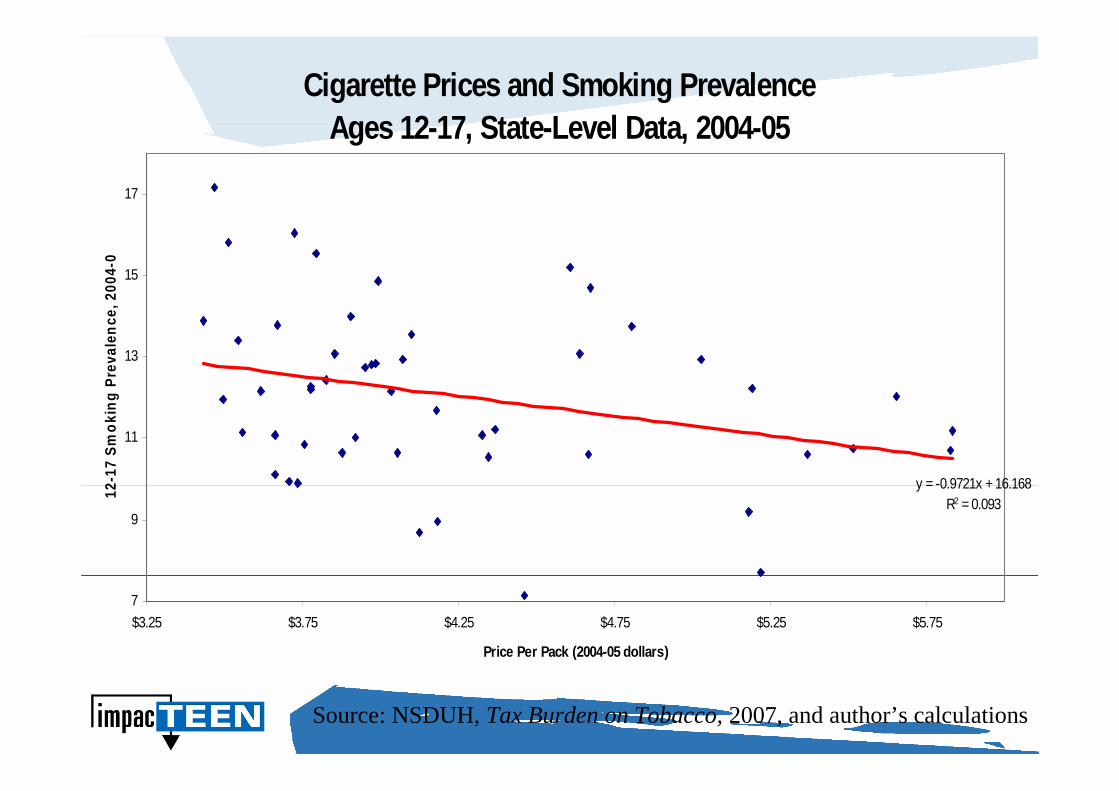
Source: NSDUH, Tax Burden on Tobacco, 2007, and author’s calculations
Cigarette Prices and Smoking PrevalenceAges 12-17, State-Level Data, 2004-05
y = -0.9721x + 16.168R2 = 0.093
7
9
11
13
15
17
$3.25 $3.75 $4.25 $4.75 $5.25 $5.75
Price Per Pack (2004-05 dollars)
12-1
7 S
mo
kin
g P
reva
len
ce, 2
004-
05

Source: MTF; TBOT, 2007; FTC 2007, and author’s calculations
Cigarette Prices and Youth Smoking PrevalenceUnited States, 1975-2005
$1.25
$1.75
$2.25
$2.75
$3.25
$3.75
$4.25
1975 1978 1981 1984 1987 1990 1993 1996 1999 2002 2005
Year
Pri
ce p
er P
ack
(8/0
7 d
oll
ars)
22
24
26
28
30
32
34
36
38
40
12th
Gra
de
Pre
vale
nce
Price Price-Price Marketing 12th Grade Prevalence
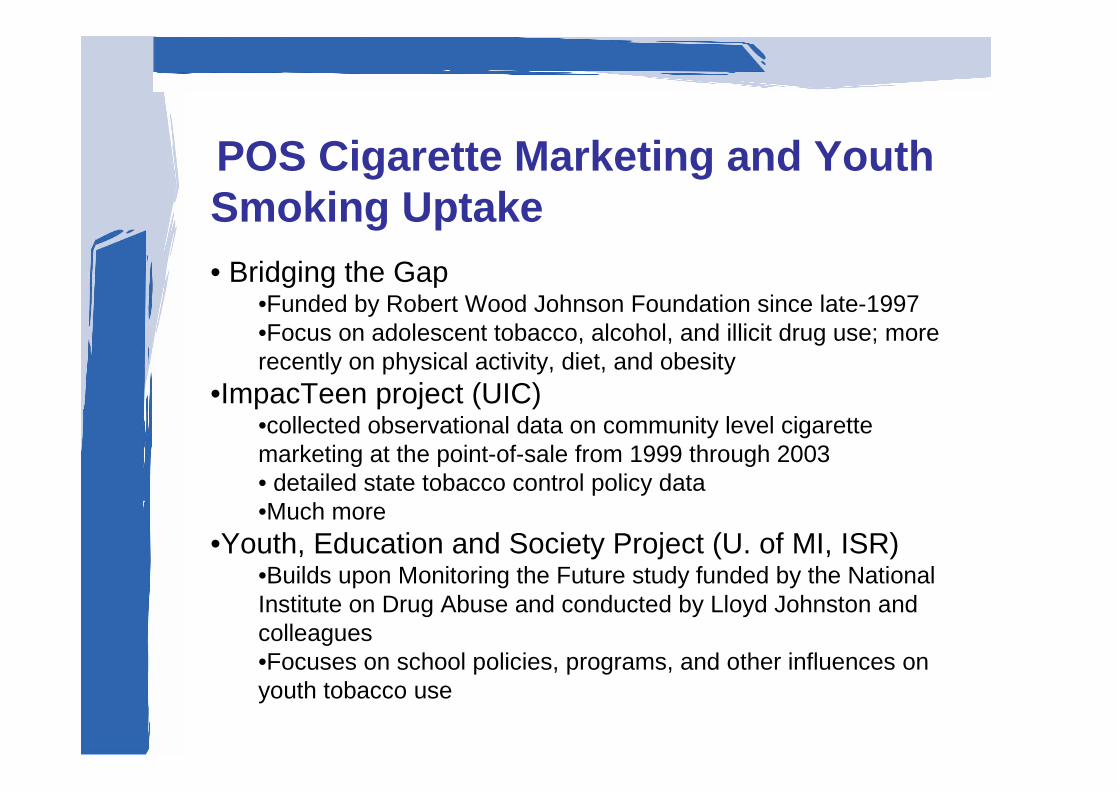
POS Cigarette Marketing and Youth Smoking Uptake• Bridging the Gap
•Funded by Robert Wood Johnson Foundation since late-1997•Focus on adolescent tobacco, alcohol, and illicit drug use; morerecently on physical activity, diet, and obesity
•ImpacTeen project (UIC)•collected observational data on community level cigarette marketing at the point-of-sale from 1999 through 2003• detailed state tobacco control policy data•Much more
•Youth, Education and Society Project (U. of MI, ISR)•Builds upon Monitoring the Future study funded by the National Institute on Drug Abuse and conducted by Lloyd Johnston and colleagues •Focuses on school policies, programs, and other influences on youth tobacco use

POS Cigarette Marketing and Youth Smoking Uptake• Design
• observational data collection at the point-of-sale in communities around schools participating in the Monitoring the Future survey
• approximately 200 schools per year • about equally divided between 8th, 10th, and 12th grade schools
• census of retail outlets selling tobacco in most communities• random sample of 30 in larger communities• identified from business lists, verification calls, and on-site• average of 18.1 stores per community• 17,476 stores observed 1999-2003

POS Cigarette Marketing and Youth Smoking Uptake• Collected data on variety of cigarette marketing at the point-of-sale
• in-store, exterior, and parking lot measures of advertising
• low-height advertising and functional objects
• Promotions: cents-off specials, on-pack coupons, multi-pack discounts, gifts with purchase (Marlboro and Newport)
•Cigarette prices (Marlboro, Newport, and lowest price)
•Placement (self-service vs. clerk assisted only)
•Measures used in analyses reflect the proportion of stores in a given community with different types of marketing
• price is average price of premium brands

POS Marketing and Youth Uptake• Marketing Measures:
$3.62Premium price
48%Any vs. no promotions
83%No self-service placement
2.56Advertising Scale (0-5)

POS Marketing and Youth Uptake• Outcome:
•Youth smoking uptake – 6 levels based on past and current smoking behavior and future intentions to smoke •Validated with longitudinal MTF data
•26,301 students
11.5%Current Established Smoker
6.9%Recent Experimenter
3.1%Former Established Smoker
4.1%Nonrecent Experimenter
20.7%Puffer
53.7%Never smoker
% of youthStage
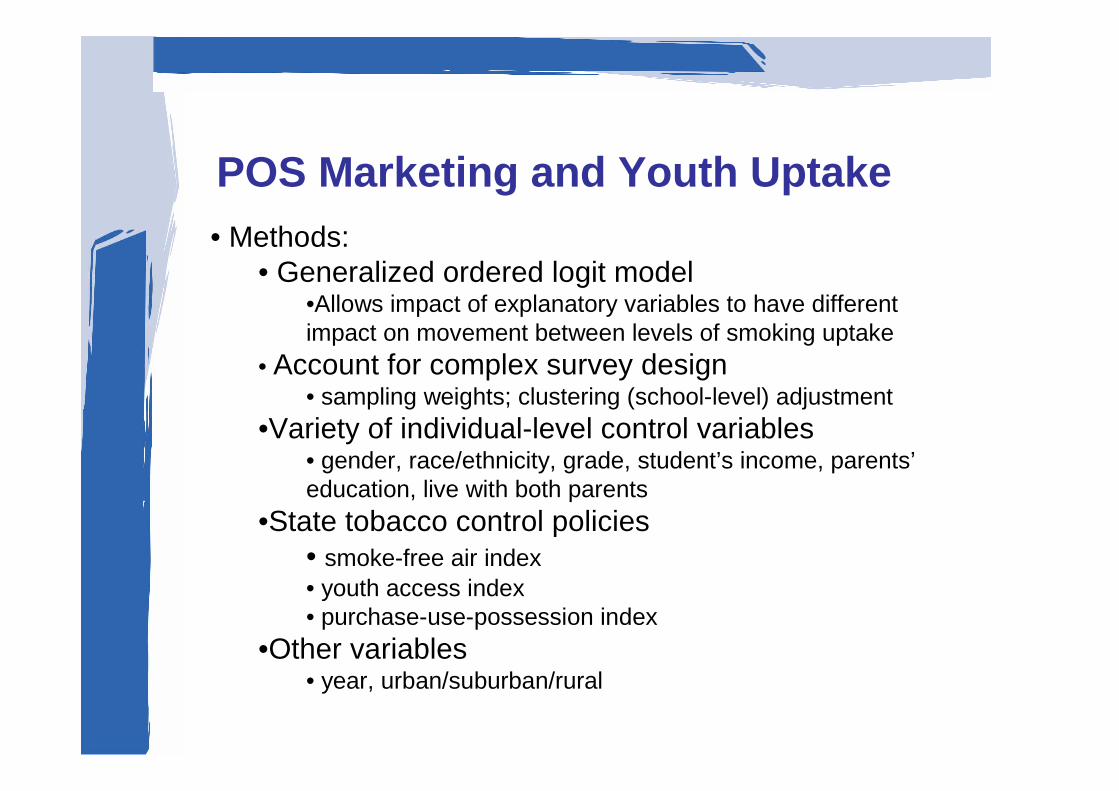
POS Marketing and Youth Uptake• Methods:
• Generalized ordered logit model•Allows impact of explanatory variables to have different impact on movement between levels of smoking uptake
• Account for complex survey design• sampling weights; clustering (school-level) adjustment
•Variety of individual-level control variables• gender, race/ethnicity, grade, student’s income, parents’education, live with both parents
•State tobacco control policies• smoke-free air index• youth access index• purchase-use-possession index
•Other variables• year, urban/suburban/rural
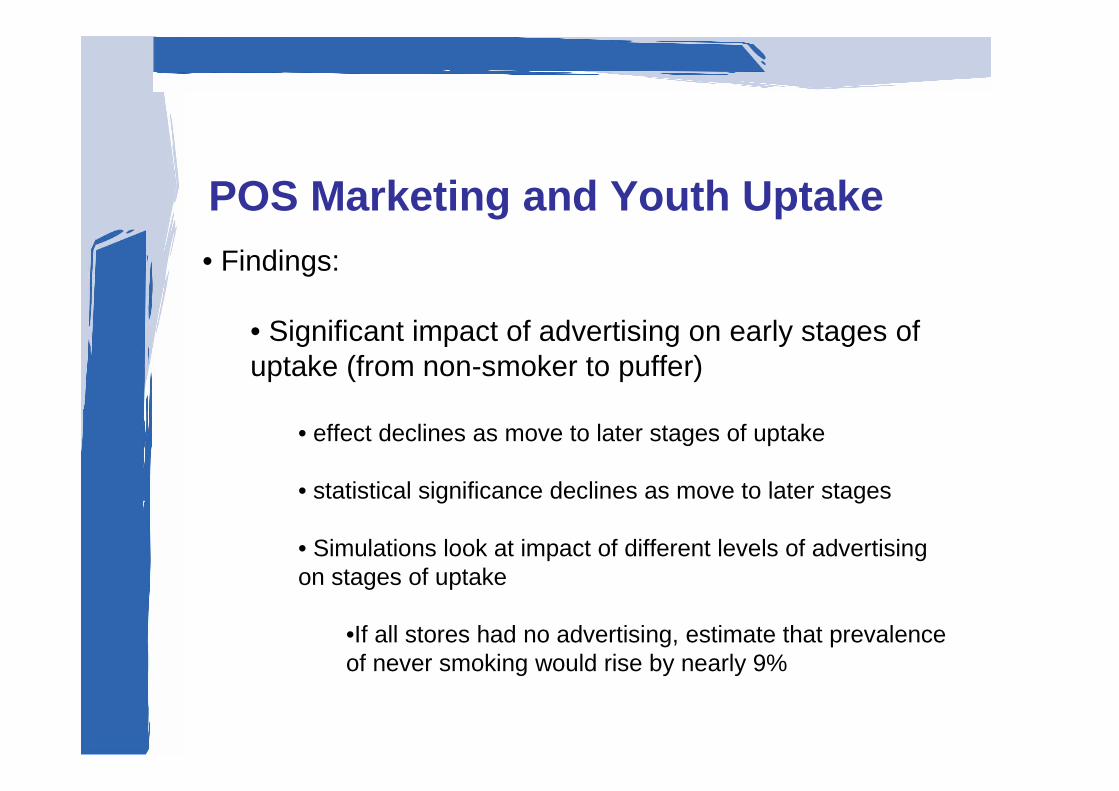
POS Marketing and Youth Uptake• Findings:
• Significant impact of advertising on early stages of uptake (from non-smoker to puffer)
• effect declines as move to later stages of uptake
• statistical significance declines as move to later stages
• Simulations look at impact of different levels of advertising on stages of uptake
•If all stores had no advertising, estimate that prevalence of never smoking would rise by nearly 9%
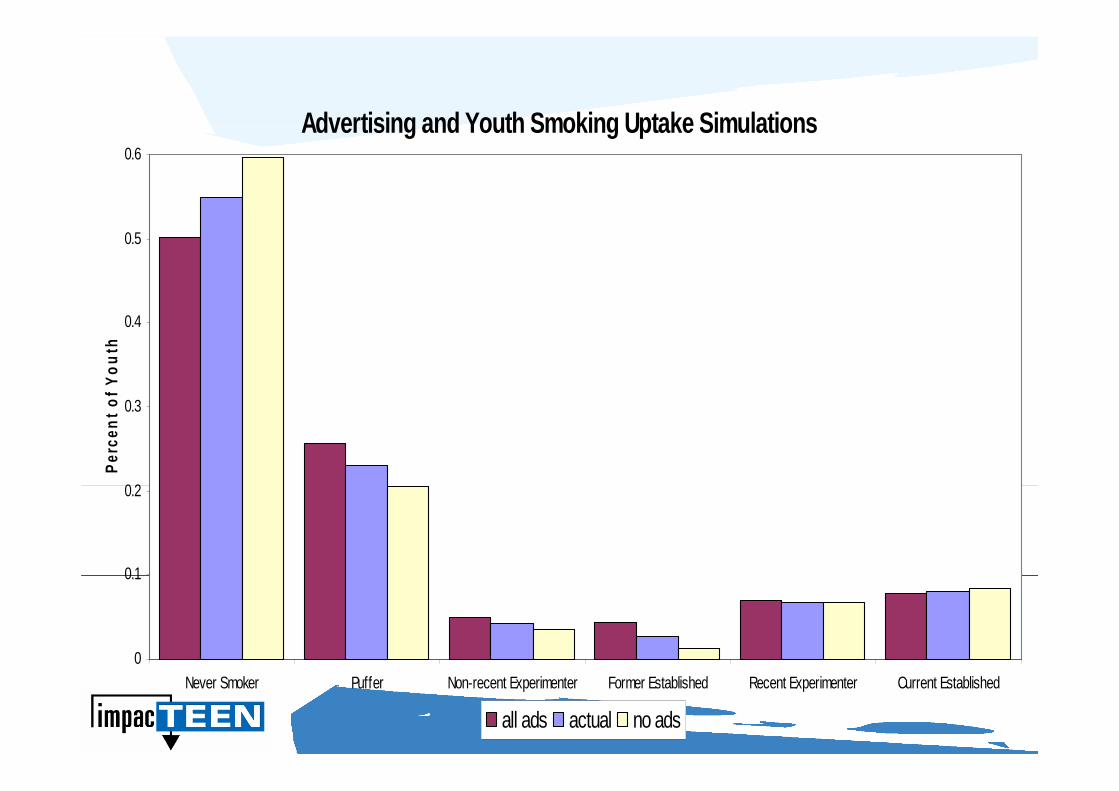
Advertising and Youth Smoking Uptake Simulations
0
0.1
0.2
0.3
0.4
0.5
0.6
Never Smoker Puffer Non-recent Experimenter Former Established Recent Experimenter Current Established
Per
cen
t o
f Y
ou
th
all ads actual no ads

POS Marketing and Youth Uptake• Findings:
• Significant impact of promotions on later stages of uptake
• effect rises as move to later stages of uptake
• statistical significance increases as move to later stages
•Simulations look at impact of different levels of advertising on stages of uptake
•If all stores had no promotions, estimate that prevalence of current established smoking would fall by over 13%

Promotions and Youth Smoking Uptake Simulations
0.00%
1.00%
2.00%
3.00%
4.00%
5.00%
6.00%
7.00%
8.00%
9.00%
10.00%
Current Established
Per
cen
t o
f Y
ou
th
all promos actual no promos
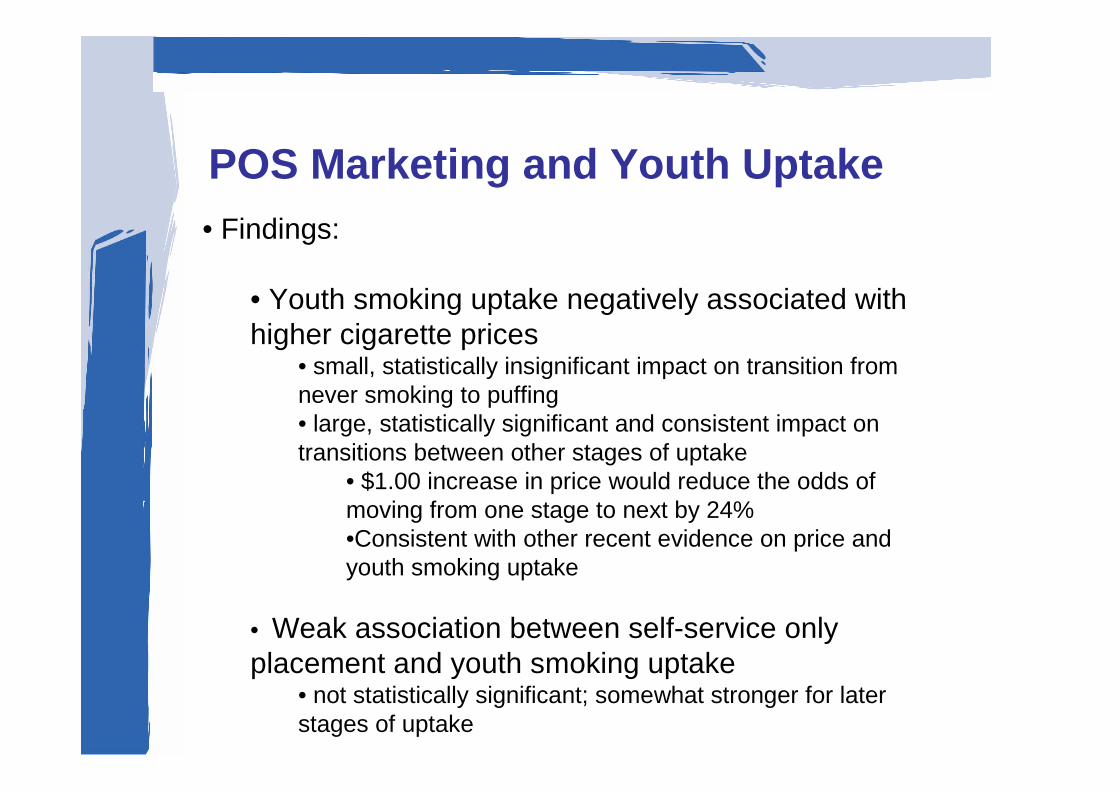
POS Marketing and Youth Uptake• Findings:
• Youth smoking uptake negatively associated with higher cigarette prices
• small, statistically insignificant impact on transition from never smoking to puffing• large, statistically significant and consistent impact on transitions between other stages of uptake
• $1.00 increase in price would reduce the odds of moving from one stage to next by 24%•Consistent with other recent evidence on price and youth smoking uptake
• Weak association between self-service only placement and youth smoking uptake
• not statistically significant; somewhat stronger for later stages of uptake

POS Marketing and Youth Uptake• Limitations:
• Cross-sectional data limits ability to assess causal impact of POS marketing on youth smoking uptake
• Relatively crude measures of cigarette marketing
•Inability to match store-specific data to youth based on stores they frequent most

POS Marketing and Youth Smoking• Recent analysis by Feighery and her colleagues (2006)
• data on POS marketing collected observationally from 53 stores located near 3 California middle schools
• branded signs• functional objects• shelving units & product displays• shelf-space for specific brands
• Based on observation data and youth self-reports of shopping behavior, four measures of advertising exposure constructed:
• shopping frequency in stores with more cigarette advertising• shopping frequency in stores that sell cigarettes• exposure to brand impressions in stores where students shop• self-reported exposure to cigarette advertising

POS Marketing and Youth Smoking• Recent analysis by Feighery and her colleagues (2006)
• youth smoking behavior:• ever smoking• susceptibility to smoking
• Key findings:• ever smoking and susceptibility to smoking positively and significantly associated with alternative measures of advertising exposure in all but one of the models estimated
• estimate that youth who are highly exposed to marketing are 2-3 times more likely to have ever smoked than youth with low exposure to cigarette marketing
• Similar limitations
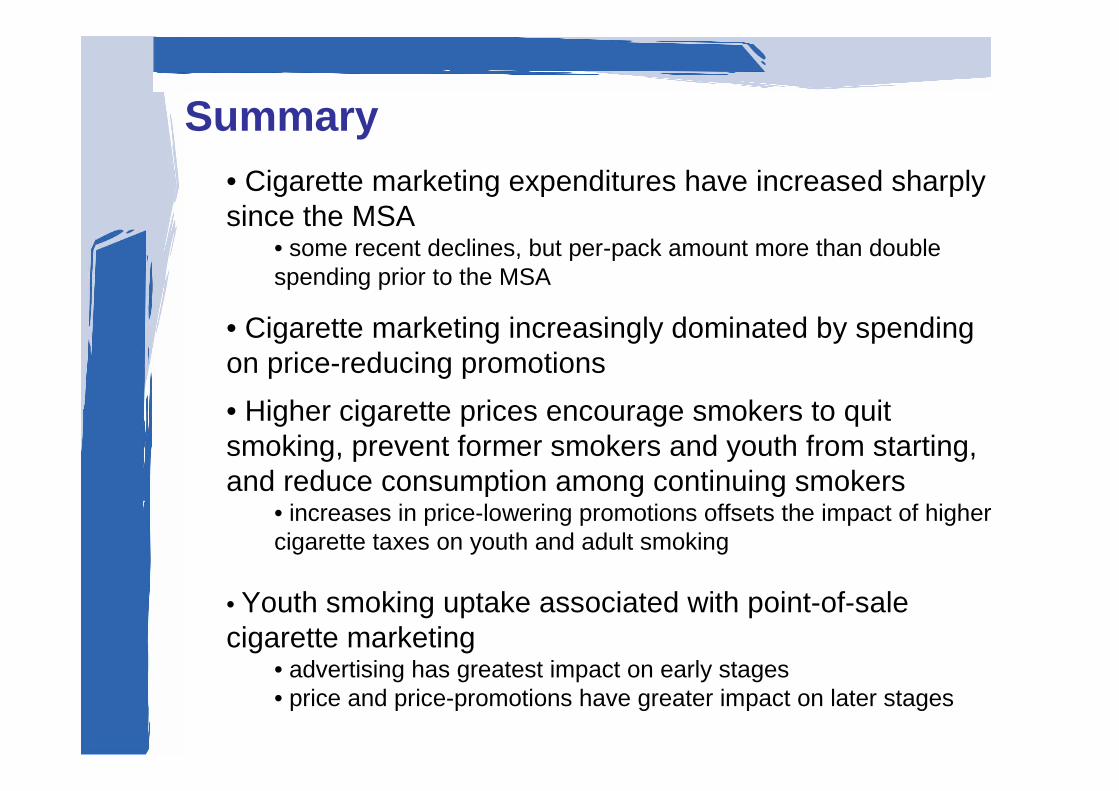
Summary• Cigarette marketing expenditures have increased sharply since the MSA
• some recent declines, but per-pack amount more than double spending prior to the MSA
• Cigarette marketing increasingly dominated by spending on price-reducing promotions
• Higher cigarette prices encourage smokers to quit smoking, prevent former smokers and youth from starting, and reduce consumption among continuing smokers
• increases in price-lowering promotions offsets the impact of higher cigarette taxes on youth and adult smoking
• Youth smoking uptake associated with point-of-sale cigarette marketing
• advertising has greatest impact on early stages• price and price-promotions have greater impact on later stages
