wind river indian reservation and surrounding area … · several records for a top 5 warmest...
TRANSCRIPT
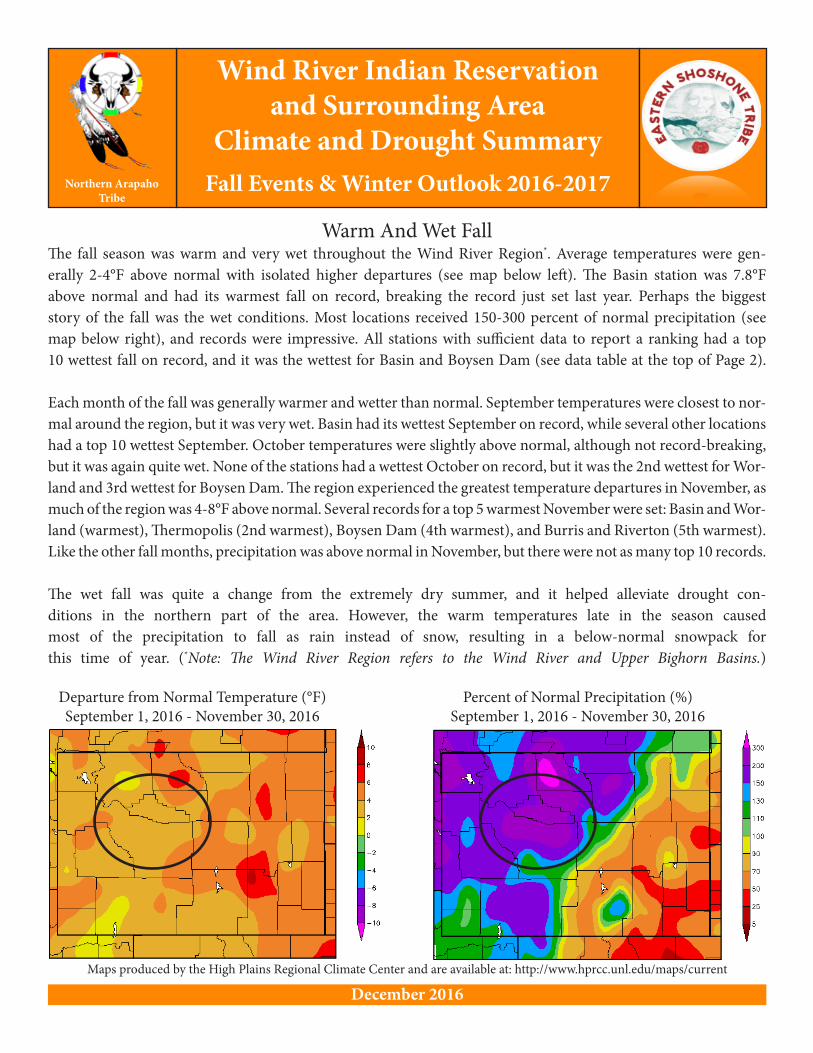
Warm And Wet FallThe fall season was warm and very wet throughout the Wind River Region*. Average temperatures were gen-erally 2-4°F above normal with isolated higher departures (see map below left). The Basin station was 7.8°F above normal and had its warmest fall on record, breaking the record just set last year. Perhaps the biggest story of the fall was the wet conditions. Most locations received 150-300 percent of normal precipitation (see map below right), and records were impressive. All stations with sufficient data to report a ranking had a top 10 wettest fall on record, and it was the wettest for Basin and Boysen Dam (see data table at the top of Page 2).
Each month of the fall was generally warmer and wetter than normal. September temperatures were closest to nor-mal around the region, but it was very wet. Basin had its wettest September on record, while several other locations had a top 10 wettest September. October temperatures were slightly above normal, although not record-breaking, but it was again quite wet. None of the stations had a wettest October on record, but it was the 2nd wettest for Wor-land and 3rd wettest for Boysen Dam. The region experienced the greatest temperature departures in November, as much of the region was 4-8°F above normal. Several records for a top 5 warmest November were set: Basin and Wor-land (warmest), Thermopolis (2nd warmest), Boysen Dam (4th warmest), and Burris and Riverton (5th warmest). Like the other fall months, precipitation was above normal in November, but there were not as many top 10 records.
The wet fall was quite a change from the extremely dry summer, and it helped alleviate drought con-ditions in the northern part of the area. However, the warm temperatures late in the season caused most of the precipitation to fall as rain instead of snow, resulting in a below-normal snowpack for this time of year. (*Note: The Wind River Region refers to the Wind River and Upper Bighorn Basins.)
Wind River Indian Reservation and Surrounding Area
Climate and Drought SummaryFall Events & Winter Outlook 2016-2017Northern Arapaho
Tribe
December 2016Maps produced by the High Plains Regional Climate Center and are available at: http://www.hprcc.unl.edu/maps/current
Departure from Normal Temperature (°F)September 1, 2016 - November 30, 2016
Percent of Normal Precipitation (%)September 1, 2016 - November 30, 2016
Page 2December 2016
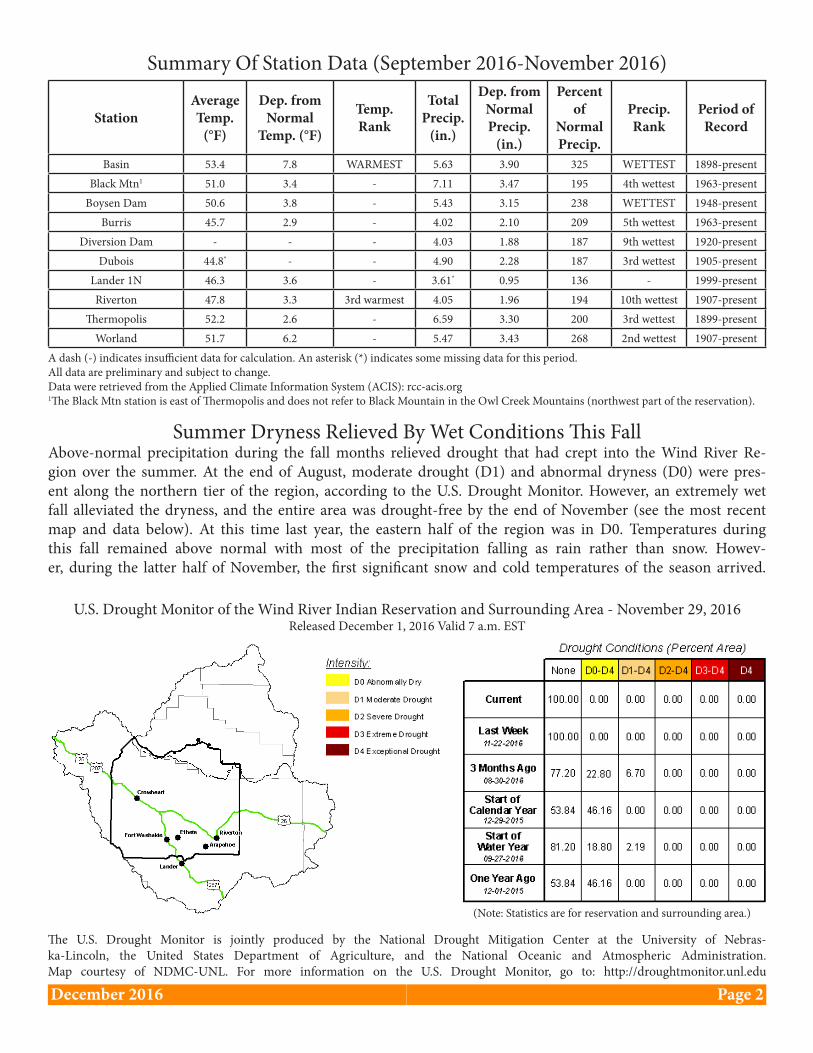
Summer Dryness Relieved By Wet Conditions This FallAbove-normal precipitation during the fall months relieved drought that had crept into the Wind River Re-gion over the summer. At the end of August, moderate drought (D1) and abnormal dryness (D0) were pres-ent along the northern tier of the region, according to the U.S. Drought Monitor. However, an extremely wet fall alleviated the dryness, and the entire area was drought-free by the end of November (see the most recent map and data below). At this time last year, the eastern half of the region was in D0. Temperatures during this fall remained above normal with most of the precipitation falling as rain rather than snow. Howev-er, during the latter half of November, the first significant snow and cold temperatures of the season arrived.
Summary Of Station Data (September 2016-November 2016)
StationAverage Temp.
(°F)
Dep. from Normal
Temp. (°F)
Temp. Rank
Total Precip.
(in.)
Dep. from Normal Precip.
(in.)
Percent of
Normal Precip.
Precip. Rank
Period of Record
Basin 53.4 7.8 WARMEST 5.63 3.90 325 WETTEST 1898-presentBlack Mtn1 51.0 3.4 - 7.11 3.47 195 4th wettest 1963-present
Boysen Dam 50.6 3.8 - 5.43 3.15 238 WETTEST 1948-presentBurris 45.7 2.9 - 4.02 2.10 209 5th wettest 1963-present
Diversion Dam - - - 4.03 1.88 187 9th wettest 1920-presentDubois 44.8* - - 4.90 2.28 187 3rd wettest 1905-present
Lander 1N 46.3 3.6 - 3.61* 0.95 136 - 1999-presentRiverton 47.8 3.3 3rd warmest 4.05 1.96 194 10th wettest 1907-present
Thermopolis 52.2 2.6 - 6.59 3.30 200 3rd wettest 1899-presentWorland 51.7 6.2 - 5.47 3.43 268 2nd wettest 1907-present
A dash (-) indicates insufficient data for calculation. An asterisk (*) indicates some missing data for this period.All data are preliminary and subject to change.Data were retrieved from the Applied Climate Information System (ACIS): rcc-acis.org1The Black Mtn station is east of Thermopolis and does not refer to Black Mountain in the Owl Creek Mountains (northwest part of the reservation).
U.S. Drought Monitor of the Wind River Indian Reservation and Surrounding Area - November 29, 2016Released December 1, 2016 Valid 7 a.m. EST
The U.S. Drought Monitor is jointly produced by the National Drought Mitigation Center at the University of Nebras-ka-Lincoln, the United States Department of Agriculture, and the National Oceanic and Atmospheric Administration. Map courtesy of NDMC-UNL. For more information on the U.S. Drought Monitor, go to: http://droughtmonitor.unl.edu
(Note: Statistics are for reservation and surrounding area.)

Page 3December 2016
Warm Fall Caused Mountain Snowpack To Get Off To A Slow StartThe mountain snowpack season got off to a considerably slow start compared to recent years. At the end of No-vember, the average Snow Water Equivalent (SWE) for the Wind River Basin was a mere 50 percent of median (see SWE map of Wyoming and table of SNOTEL sites in the region below). In comparison to previous years on the same date (November 28th), SWE was 62 percent of median in 2015, 80 percent of median in 2014, and 117 percent of median in 2013. Compared to this time last year, SWE was higher for the Hobbs Park and St. Lawrence ALT SNO-TEL sites but lower for the Cold Springs, Deer Park, and Owl Creek sites. The primary reason for the slow start was above-normal temperatures that caused much of the precipitation to fall as rain instead of snow. However, it is still very early and snowpack is continuing to trend higher as we get further into the season. (*Note: SWE is the amount of water contained within the snowpack. It can be thought of as the depth of water that would theoretically result if you melted the entire snowpack instantaneously. Median is a common descriptor used to express a “middle” value in a set of data. Median better represents SWE than does the “average.” Source: Natural Resources Conservation Service.)
As for surface water around the region, a thin layer of ice had formed on the lakes and reservoirs by the end of the season. Bull Lake was particularly low at 24.5 percent full compared to 46.4 percent full this time last year, but part of the reason is because construction on the dams and headgates of Bull Lake and Dinwoody Lake is about to begin.
Reservoir Data as of November 30, 2016
Reservoir Name
Reservoir Elevation (feet)
Reservoir Storage
(acre-feet)
Reservoir % Full
Reservoir Name
Reservoir Elevation (feet)
Reservoir Storage
(acre-feet)
Reservoir % Full
Anchor 6,369.0 849.2 4.9 Pilot Butte 5,455.2 29,504.0 87.5Boysen 4,720.7 661,014 89.1 Ray Lake 5,522.27 no data no data
Bull Lake 5,760.3 37,368.3 24.5 Washakie 6,348.08 no data no dataDinwoody no data no data no data
Data sources: Bureau of Indian Affairs (not available online), Bureau of Reclamation (http://www.usbr.gov/gp/lakes_reservoirs/wyoming_lakes.htm)
On the map above, the percent of median value for the Wind River Basin is based on all reporting SNOTEL sites in the ba-sin. The table above lists SWE by SNOTEL site in and around the Wind River Reservation. Reference period for average compar-ison is 1981-2010. Map provided by the Wyoming Water Resources Data System: http://www.wrds.uwyo.edu/wrds/nrcs/snowrept/snowrept.html. SNOTEL data provided by the Natural Resources Conservation Service: http://www.wcc.nrcs.usda.gov/snow/.
SNOTEL Site SWE (% of median)
Cold Springs 57
Deer Park 26
Hobbs Park 72
Owl Creek 60
St. Lawrence ALT 40
Snow Water Equivalent (SWE) % of Median by Basin and SNOTEL Site (Wyoming) as of November 28, 2016
Page 4December 2016
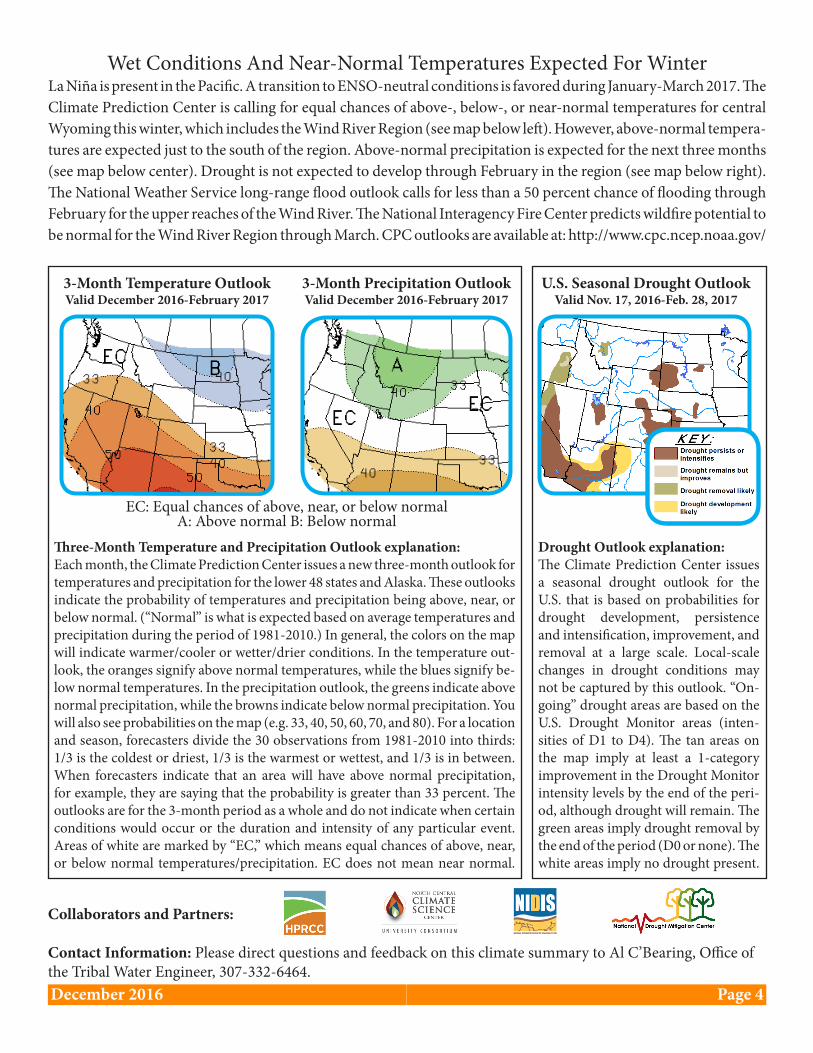
Wet Conditions And Near-Normal Temperatures Expected For WinterLa Niña is present in the Pacific. A transition to ENSO-neutral conditions is favored during January-March 2017. The Climate Prediction Center is calling for equal chances of above-, below-, or near-normal temperatures for central Wyoming this winter, which includes the Wind River Region (see map below left). However, above-normal tempera-tures are expected just to the south of the region. Above-normal precipitation is expected for the next three months (see map below center). Drought is not expected to develop through February in the region (see map below right). The National Weather Service long-range flood outlook calls for less than a 50 percent chance of flooding through February for the upper reaches of the Wind River. The National Interagency Fire Center predicts wildfire potential to be normal for the Wind River Region through March. CPC outlooks are available at: http://www.cpc.ncep.noaa.gov/
Three-Month Temperature and Precipitation Outlook explanation: Each month, the Climate Prediction Center issues a new three-month outlook for temperatures and precipitation for the lower 48 states and Alaska. These outlooks indicate the probability of temperatures and precipitation being above, near, or below normal. (“Normal” is what is expected based on average temperatures and precipitation during the period of 1981-2010.) In general, the colors on the map will indicate warmer/cooler or wetter/drier conditions. In the temperature out-look, the oranges signify above normal temperatures, while the blues signify be-low normal temperatures. In the precipitation outlook, the greens indicate above normal precipitation, while the browns indicate below normal precipitation. You will also see probabilities on the map (e.g. 33, 40, 50, 60, 70, and 80). For a location and season, forecasters divide the 30 observations from 1981-2010 into thirds: 1/3 is the coldest or driest, 1/3 is the warmest or wettest, and 1/3 is in between. When forecasters indicate that an area will have above normal precipitation, for example, they are saying that the probability is greater than 33 percent. The outlooks are for the 3-month period as a whole and do not indicate when certain conditions would occur or the duration and intensity of any particular event. Areas of white are marked by “EC,” which means equal chances of above, near, or below normal temperatures/precipitation. EC does not mean near normal.
Drought Outlook explanation: The Climate Prediction Center issues a seasonal drought outlook for the U.S. that is based on probabilities for drought development, persistence and intensification, improvement, and removal at a large scale. Local-scale changes in drought conditions may not be captured by this outlook. “On-going” drought areas are based on the U.S. Drought Monitor areas (inten-sities of D1 to D4). The tan areas on the map imply at least a 1-category improvement in the Drought Monitor intensity levels by the end of the peri-od, although drought will remain. The green areas imply drought removal by the end of the period (D0 or none). The white areas imply no drought present.
3-Month Precipitation OutlookValid December 2016-February 2017
3-Month Temperature OutlookValid December 2016-February 2017
U.S. Seasonal Drought OutlookValid Nov. 17, 2016-Feb. 28, 2017
EC: Equal chances of above, near, or below normal A: Above normal B: Below normal
Contact Information: Please direct questions and feedback on this climate summary to Al C’Bearing, Office of the Tribal Water Engineer, 307-332-6464.
Collaborators and Partners:
!
!!
!
!
!
!
!
!
!
!
!
!
!
!
!
!
!
!
!
!
!
!
!
!
!
!
!
!
#
#
#
##
#
##
#
#
#
#
#
#
#
#
#
#
!
!
!
!
!
!
Wind River Indian Reservation
Upper Bighorn Basin
Wind River Basin
£¤20
£¤287
£¤26
£¤287
£¤20
£¤16
£¤26
RIVERTONCOOP
PAVILLION COOPDIVERSION DAM COOP
WINDRIVER
BURRISCOOP
HOBBSPARK
COLDSPRINGS
ST.LAWRENCE
ALT
BOYSENDAM COOP
SHOSHONICOOP
THERMOPOLISCOOP
LANDER HUNTFLD AP COOP
RIVERTONRGNL AP
OWLCREEK
DUBOISCOOP
RIVERTON 0.5 NW
DEERPARK
BurroughsCreek
Kirwin
LittleWarm
SouthPass
TimberCreek
TogwoteePass
TownsendCreek
YountsPeak
BASINCOOP
BLACKMTN COOP
WORLANDCOOP
LANDER1N COOP
WIND RIVERABOVE REDCREEK NEARDUBOIS
DINWOODY CREEKABOVE LAKESNEAR BURRIS
BULL LAKECREEK ABOVEBULL LAKE
BULL LAKE CREEKNEAR LENORE
WIND RIVERNEARCROWHEART
WIND RIVERNEARKINNEAR
WIND RIVERAT RIVERTON LITTLE WIND
RIVER NEARRIVERTON
WIND RIVERBELOW BOYSENRESERVOIR
FIVEMILECREEK NEARSHOSHONI
WIND RIVERNEAR DUBOIS
LITTLE POPOAGIE RIVERNEAR LANDER
SOUTH FORK LITTLEWIND RIVER ABOVE
WASHAKIE RESERVOIR
North ForkLittle
Wind River
North ForkPopo AgieRiver
East ForkWind River
BIGHORNRIVER ATWORLAND
BIGHORNRIVER ATBASIN
Crowheart
EtheteFort Washakie
RivertonArapahoe
LanderLegendWR Stream Gauges#
WR Weather Stations! COOP! CoCoRaHS! RAWS! SNOTEL! WBAN
Basin Boundary0 10 20 30 40 50 60 70 80 90 100 1105Miles
Revised 6/18/2015 Wind River Indian Reservation and Surrounding Area
¯Contact Information:Shannon McNeeley, [email protected]