winterwind, international wind energy conference, february 2012, skelleftea, sweden
DESCRIPTION
Evaluation of WRF mesoscale model for icing events characterization: Some insights on model performance Pau Casso (1) Gil Lizcano (1) Pep Moreno (1) Josep Calbó (2) Alain Ochoa de Retana (3) - PowerPoint PPT PresentationTRANSCRIPT

EWEA 2012 Annual Event, April 2012, Bella Center, Copenhaguen, Denmark
Evaluation of WRF mesoscale model for icing events characterization:
Some insights on model performance
Pau Casso (1) Gil Lizcano (1) Pep Moreno (1) Josep Calbó (2) Alain Ochoa de Retana (3)
1) Vortex, Barcelona, Spain(2) University of Girona, Girona, Spain (3) Gamesa Energía, Zamudio, Spain

EWEA 2012 Annual Event, April 2012, Bella Center, Copenhaguen, Denmark
Outline
Icing Occurs
Motivation
Model Setup
Results
Conclusions

EWEA 2012 Annual Event, April 2012, Bella Center, Copenhaguen, Denmark
Icing Occurs
Icing really occurs and implies:
Health and Safety issues
Loss of production
Increased loads & damage
Increased noise
Availability
O&M
Life-timeFigure1: Alpine site Test Gütsch site in Switzerland

EWEA 2012 Annual Event, April 2012, Bella Center, Copenhaguen, Denmark
Icing is a Problem
Not yet well defined how to cope with Icing in the wind industry:
-Manufacturers: Developing heating and de-icing systems. Strong competence.
-Developers: Lots of questions arise regarding guarantees from manufacturers and production losses.
-Consultancies: Not clear how to include Icing uncertainties in projects evaluations.

- Rapid increase of wind energy markets in Cold Climates
- Power production loss estimations due to icing are difficult
- Lack of observed icing conditions are a constant
Motivation
EWEA 2012 Annual Event, April 2012, Bella Center, Copenhaguen, Denmark

•Hindcast modeling solutions have been proved as skillful alternatives to represent wind regime and temperature at near windfarm resolution.
•Anemometry and turbine alarms data from Gamesa was available at 6 wind farms with detected icing events.
Motivation
EWEA 2012 Annual Event, April 2012, Bella Center, Copenhaguen, Denmark

Model Setup and Configuration
EWEA 2012 Annual Event, April 2012, Bella Center, Copenhaguen, Denmark
Purpose: Detect icing events with a modeling chain with NO use of on-site measured data
WRF mesoscale model -> Wind, Temp., cloud and rain water
Algorithm to calculate icing on structures (Makkonen, 2000)
Simulated ice load and ice episodes

Model Setup and Configuration
EWEA 2012 Annual Event, April 2012, Bella Center, Copenhaguen, Denmark
STEP 1 - Cold weather events detection
•1km resolution WRF model hindcasts over 10 years
•Driven by NCEP/CFS reanalysis at 0.5 degrees
•Thompson microphysics scheme
Output used to select potential icing events based on crossed distribution of humidity and temperature.
Figure 1 Nested domains that define downscaling approach at a 1Km WRF temperature and moisture characterization
Model Setup and Configuration
EWEA 2012 Annual Event, April 2012, Bella Center, Copenhaguen, Denmark
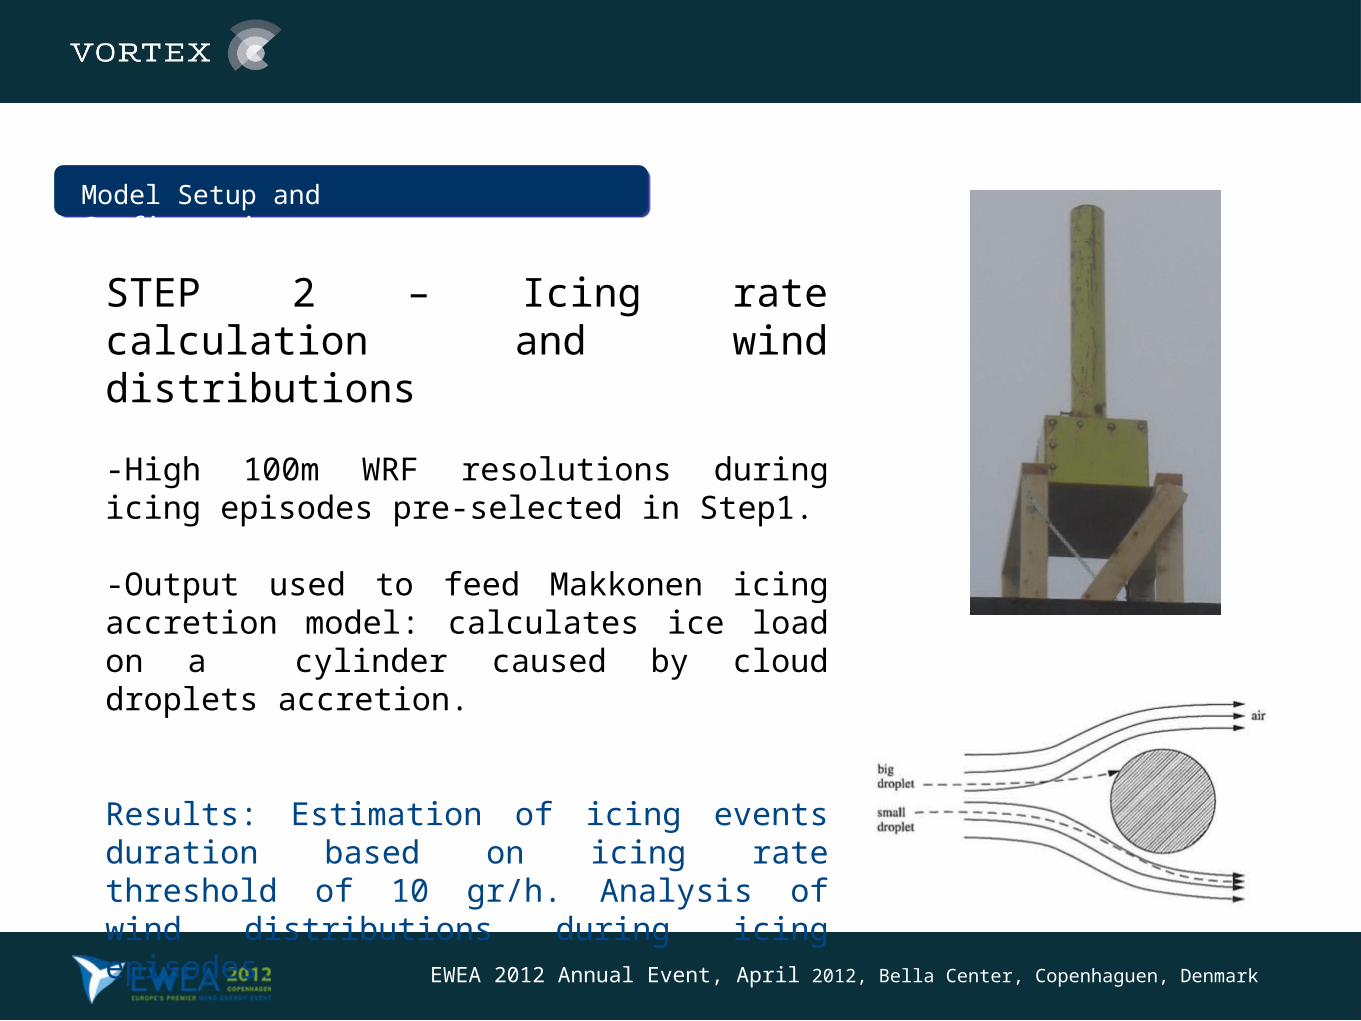
STEP 2 – Icing rate calculation and wind distributions
-High 100m WRF resolutions during icing episodes pre-selected in Step1.
-Output used to feed Makkonen icing accretion model: calculates ice load on a cylinder caused by cloud droplets accretion.
Results: Estimation of icing events duration based on icing rate threshold of 10 gr/h. Analysis of wind distributions during icing episodes.

•The model chain WRF 1km → WRF 100m → Makkonen is applied to 6 sites.
•Available anemometry data from Gamesa at 6/6 wind Farms.
•Available turbine-stop alarms data due to icing at 3/6 wind Farms.
EWEA 2012 Annual Event, April 2012, Bella Center, Copenhaguen, Denmark
Model Setup and Configuration

Results
Icing events occurrences match
EWEA 2012 Annual Event, April 2012, Bella Center, Copenhaguen, Denmark
Site Period #Days Vortex Icing #Days Iced Anem. #Days Turbines Stopped
Germany1 24 months 49 23 9
Portugal 3 months 18 7
Spain 72 months 295 274 0
Germany2 24 months 23 20 0
Poland 72 months 299 178
Sweeden 12 months 63 38

Results
Icing events occurrences match
• Vortex relevantly matches the icing occurrences on a mean value when compared to anemometry data.
• In relation to turbine stops, results are discouraging.
• Lack of knowledge between anemometry and turbines availability in icing conditions.
EWEA 2012 Annual Event, April 2012, Bella Center, Copenhaguen, Denmark

Results
Wind distribution during icing
events
Case 1: High wind speed icing conditions
Strong wind conditions under icing episodes
Indication of significant production loss
EWEA 2012 Annual Event, April 2012, Bella Center, Copenhaguen, Denmark
Mean Wind Speed DistributionWind Speed Distribution during icing conditions

Results
Wind distribution during icing
events
Case 1: High wind speed icing conditions
EWEA 2012 Annual Event, April 2012, Bella Center, Copenhaguen, Denmark
Icing conditions correspond to main direction
Indication of significant production loss
Wind Direction during icing conditionsMean Wind Direction

Results
Wind distribution during icing events
Case 2: Low wind speed icing conditions
EWEA 2012 Annual Event, April 2012, Bella Center, Copenhaguen, Denmark
Low wind speed conditions during icing episodes
Not very relevant production losses
Mean Wind Speed DistributionWind Speed Distribution during icing conditions

Results
Wind distribution during icing events
Case 2: Low wind speed icing conditions
EWEA 2012 Annual Event, April 2012, Bella Center, Copenhaguen, Denmark
Icing conditions do NOT correspond to main direction
Not very relevant production losses but guide for security issues
Mean Wind Direction Wind Direction during icing conditions

Conclusions
The modeling chain shows an interesting ability to track icing episodes specially against anemometry data.
Very poor correlation between modeling and turbine availability.Lot of work to do. Need of specific turbine model.
Very encouraging results regarding the characterization of wind distributions under icing conditions.
Promising results to estimate production losses.
Interesting guide for designing security and accessibility issues.
EWEA 2012 Annual Event, April 2012, Bella Center, Copenhaguen, Denmark

Conclusions
EWEA 2012 Annual Event, April 2012, Bella Center, Copenhaguen, Denmark
Thank you for you attention.