wonderla holidays - initiating...
TRANSCRIPT
Edelweiss Research is also available on www.edelresearch.com, Bloomberg EDEL <GO>, Thomson First Call, Reuters and Factset. Edelweiss Securities Limited
Wonderla Holidays (Wonderla), India’s largest amusement park chain, is set for an adrenaline rush propelled by the likely recovery in discretionary spending. Reasonable prices, credible brand equity, in-house manufacturing, improving resort occupancy and experienced management team give it a distinctive competitive edge. Riding 2 successful operational parks and 1 on the horizon, we expect commendable revenue, EBITDA and PAT CAGR of 31.9%, 28.3% and 18.6%, respectively, over FY15-17. We initiate coverage with ‘BUY’. Attractive pricing spurs footfalls; in-house team a competitive edge Attractive pricing (~1/3rd that of Imagica) and activations (team of 59 sales agents, Privilege Card) spurred footfall CAGR of 7.9% (Asia average 6%) coupled with 9.1% ATP CAGR over FY09-14. As a further booster, the company adds a new ride every year. Also, strong in-house manufacturing team (30% rides manufactured in house) gives competitive edge and cuts downtime. Moreover, occupancy at its 3-star resort has improved (48.9% in 9mFY15 vis-à-vis 26.9% in 9mFY14) and is slated to surge further.
To reap expansion benefits; non-ticket contribution margin kicker Wonderla’s new Hyderabad park is expected to be operational in early FY17. Moreover, lower initial capex compared to other large parks (INR2.5bn for Hyderabad park compared to INR16.5bn for Imagica) reduces the payback period and improves return ratios. Additionally, mix change in favour of non-ticketing park revenue from current ~23% will aid margin as F&B is directly recognised as sales commission and merchandise entails ~50% EBITDA margin.
Outlook and valuations: Positive swing; initiate with ‘BUY’ Wonderla’s management pedigree (~15 years’ industry experience), strong brand franchise, reasonable pricing and attractive rides place it in a sweet spot. We assign EV/EBITDA multiple of 15x (discount to niche retailers but ~35% premium to global peers) FY17E to arrive at a target price of INR363. Hence, we initiate coverage with ‘BUY’ and rate the stock ‘Sector Performer’ on relative return basis. Service tax, accidents, natural disasters or epidemics are key concerns/risks.
INITIATING COVERAGE
WONDERLA HOLIDAYSRide the adrenaline rush
EDELWEISS 4D RATINGS
Absolute Rating BUY
Rating Relative to Sector Performer
Risk Rating Relative to Sector Medium
Sector Relative to Market Overweight
MARKET DATA (R: NA.BO, B: WONH IN)
CMP : INR 277
Target Price : INR 363
52-week range (INR) : 355 / 156
Share in issue (mn) : 56.5
M cap (INR bn/USD mn) : 16 / 250
Avg. Daily Vol.BSE/NSE(‘000) : 544.2
SHARE HOLDING PATTERN (%)
Current Q2FY15 Q1FY15
Promoters * 71.0 71.0 71.0
MF's, FI's & BK’s 2.1 4.1 8.3
FII's 7.9 6.9 2.1
Others 19.0 18.0 18.6 * Promoters pledged shares (% of share in issue)
: NIL
PRICE PERFORMANCE (%)
Sensex Stock
Stock over Sensex
1 month 0.6 (4.1) (4.7)
3 months 4.0 (0.9) (4.9)
12 months 31.5 75.7 44.2
Abneesh Roy +91 22 6620 3141 [email protected] Click on image to view video Tanmay Sharma +91 22 4040 7586 [email protected] Alankar Garude +91 22 6623 3301 [email protected]
India Equity Research| Retail
March 11, 2015
FinancialsYear to March FY14 FY15E FY16E FY17ERevenues (INR mn) 1,536 1,714 2,024 2,984 EBITDA (INR mn) 704 810 970 1,333 Net profit (INR mn) 399 499 589 701 Diluted EPS (INR) 9.5 8.8 10.4 12.4 EPS growth (%) 18.8 (7.0) 18.0 19.1 Diluted P/E (x) 29.2 31.4 26.6 22.3 EV/EBITDA (x) 16.5 16.7 15.0 11.4 ROAE (%) 29.6 19.6 15.4 16.2
Retail
2 Edelweiss Securities Limited
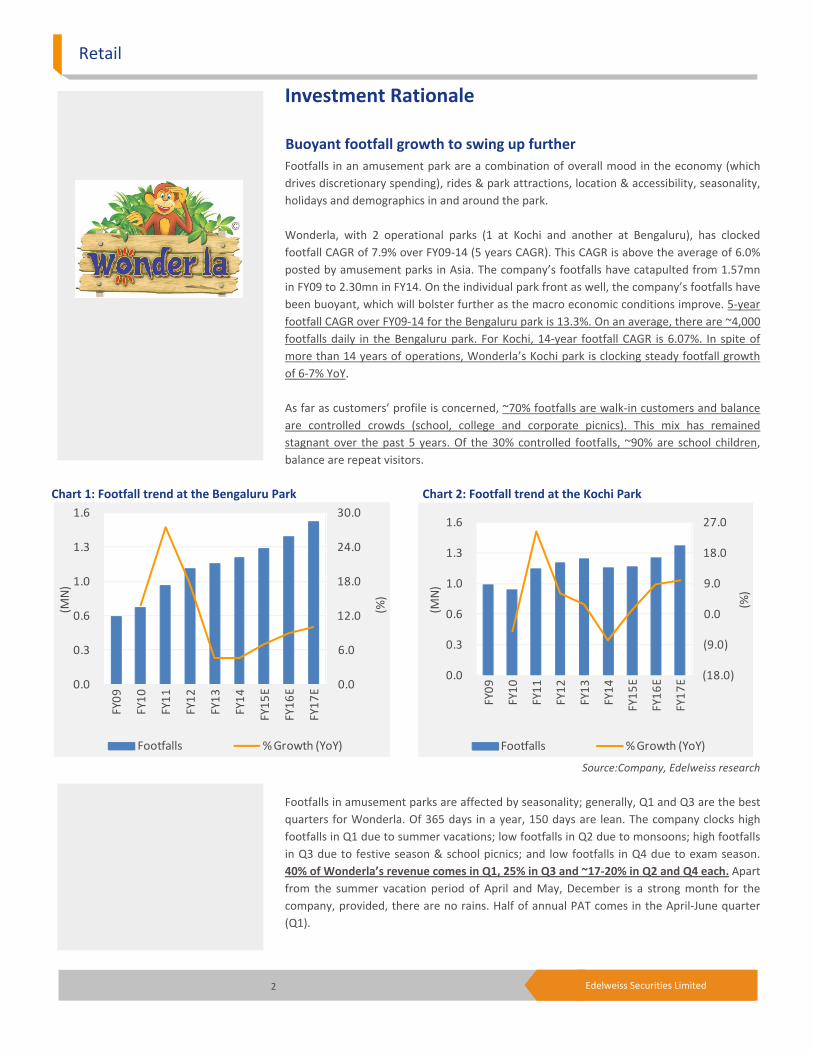
Investment Rationale Buoyant footfall growth to swing up further Footfalls in an amusement park are a combination of overall mood in the economy (which drives discretionary spending), rides & park attractions, location & accessibility, seasonality, holidays and demographics in and around the park. Wonderla, with 2 operational parks (1 at Kochi and another at Bengaluru), has clocked footfall CAGR of 7.9% over FY09-14 (5 years CAGR). This CAGR is above the average of 6.0% posted by amusement parks in Asia. The company’s footfalls have catapulted from 1.57mn in FY09 to 2.30mn in FY14. On the individual park front as well, the company’s footfalls have been buoyant, which will bolster further as the macro economic conditions improve. 5-year footfall CAGR over FY09-14 for the Bengaluru park is 13.3%. On an average, there are ~4,000 footfalls daily in the Bengaluru park. For Kochi, 14-year footfall CAGR is 6.07%. In spite of more than 14 years of operations, Wonderla’s Kochi park is clocking steady footfall growth of 6-7% YoY. As far as customers’ profile is concerned, ~70% footfalls are walk-in customers and balance are controlled crowds (school, college and corporate picnics). This mix has remained stagnant over the past 5 years. Of the 30% controlled footfalls, ~90% are school children, balance are repeat visitors.
Chart 1: Footfall trend at the Bengaluru Park Chart 2: Footfall trend at the Kochi Park
Source:Company, Edelweiss research
Footfalls in amusement parks are affected by seasonality; generally, Q1 and Q3 are the best quarters for Wonderla. Of 365 days in a year, 150 days are lean. The company clocks high footfalls in Q1 due to summer vacations; low footfalls in Q2 due to monsoons; high footfalls in Q3 due to festive season & school picnics; and low footfalls in Q4 due to exam season. 40% of Wonderla’s revenue comes in Q1, 25% in Q3 and ~17-20% in Q2 and Q4 each. Apart from the summer vacation period of April and May, December is a strong month for the company, provided, there are no rains. Half of annual PAT comes in the April-June quarter (Q1).
0.0
6.0
12.0
18.0
24.0
30.0
0.0
0.3
0.6
1.0
1.3
1.6
FY09
FY10
FY11
FY12
FY13
FY14
FY15
E
FY16
E
FY17
E
(%)
(MN
)
Footfalls % Growth (YoY)
(18.0)
(9.0)
0.0
9.0
18.0
27.0
0.0
0.3
0.6
1.0
1.3
1.6
FY09
FY10
FY11
FY12
FY13
FY14
FY15
E
FY16
E
FY17
E
(%)
(MN
)
Footfalls % Growth (YoY)
Wonderla Holidays
3 Edelweiss Securities Limited
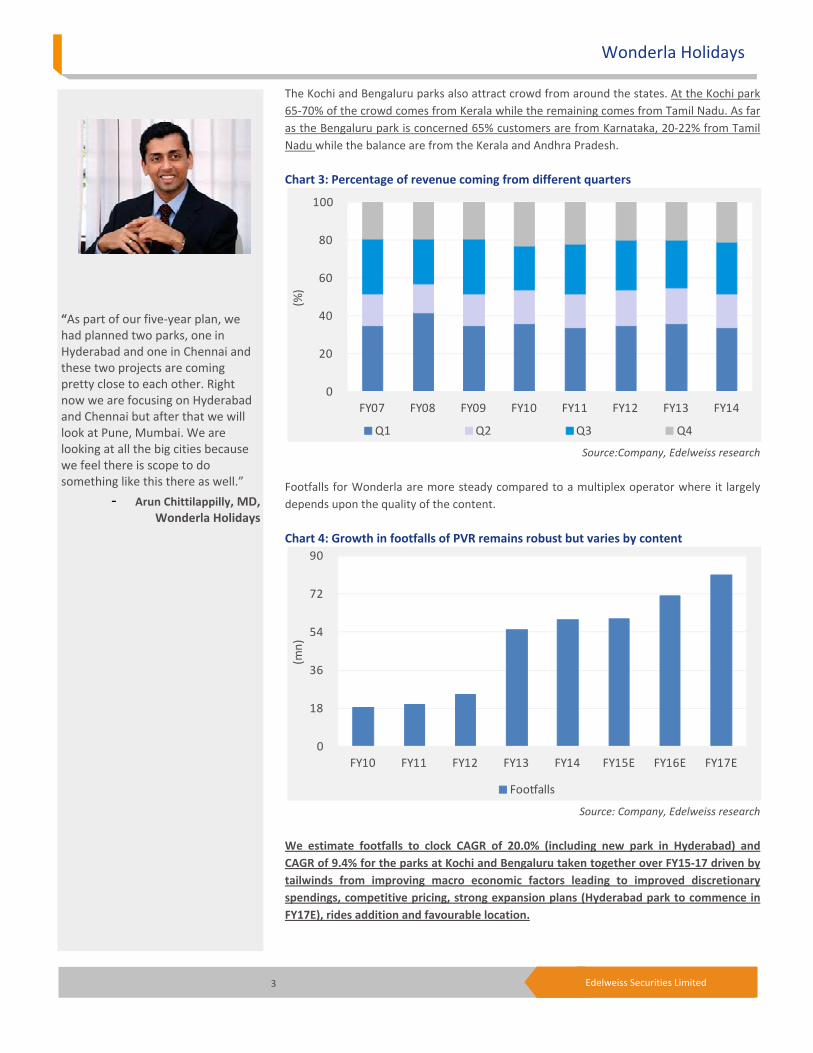
The Kochi and Bengaluru parks also attract crowd from around the states. At the Kochi park 65-70% of the crowd comes from Kerala while the remaining comes from Tamil Nadu. As far as the Bengaluru park is concerned 65% customers are from Karnataka, 20-22% from Tamil Nadu while the balance are from the Kerala and Andhra Pradesh. Chart 3: Percentage of revenue coming from different quarters
Source:Company, Edelweiss research
Footfalls for Wonderla are more steady compared to a multiplex operator where it largely depends upon the quality of the content. Chart 4: Growth in footfalls of PVR remains robust but varies by content
Source: Company, Edelweiss research
We estimate footfalls to clock CAGR of 20.0% (including new park in Hyderabad) and CAGR of 9.4% for the parks at Kochi and Bengaluru taken together over FY15-17 driven by tailwinds from improving macro economic factors leading to improved discretionary spendings, competitive pricing, strong expansion plans (Hyderabad park to commence in FY17E), rides addition and favourable location.
0
20
40
60
80
100
FY07 FY08 FY09 FY10 FY11 FY12 FY13 FY14
(%)
Q1 Q2 Q3 Q4
0
18
36
54
72
90
FY10 FY11 FY12 FY13 FY14 FY15E FY16E FY17E
(mn)
Footfalls
“As part of our five-year plan, we had planned two parks, one in Hyderabad and one in Chennai and these two projects are coming pretty close to each other. Right now we are focusing on Hyderabad and Chennai but after that we will look at Pune, Mumbai. We are looking at all the big cities because we feel there is scope to do something like this there as well.”
- Arun Chittilappilly, MD,Wonderla Holidays

Retail
4 Edelweiss Securities Limited
Chart 5: Bengaluru park customer type over the years Chart 6: Kochi park customer type over the years
Source:Company, Edelweiss research
Macro economic tailwinds to pace up the ride Discretionary spending on the rise: Discretionary spending in a country is a vital determinant of amusement parks’ profitability. Discretionary spending in India has plummeted significantly over the past 2 years, validated by the significant slowdown in Jubilant FoodWorks’ and Yum Brands’ same store sales growth (SSG). However, the spending is anticipated to gallop riding optimism instilled by the new government at the Centre. India’s job market is also reviving post credible policy actions initiated by the new government. Job market revival will boost actual spending significantly, which in turn will spur discretionary spending. As per India Skills Report 2015, hiring is slated to jump 23% in CY15. Interest rate cut by RBI will also be a key driver of discretionary spending going foward.
Chart 7: Per capita income in India continues to improve Chart 8: Discretionary spendings as a % of total spendings
Source: CSO, Crisil, Edelweiss research
0.0
20.0
40.0
60.0
80.0
100.0
FY09 FY10 FY11 FY12 FY13 FY14
(%)
Walk-ins Bookings
0
16,000
32,000
48,000
64,000
80,000
FY08 FY09 FY10 FY11 FY12 FY13
(INR)
Per capita income
0.0
20.0
40.0
60.0
80.0
100.0
FY81 FY86 FY91 FY96 FY01 FY06 FY10 FY12
(%)
Necessities Discretionary
0.0
20.0
40.0
60.0
80.0
100.0
FY09 FY10 FY11 FY12 FY13 FY14
(%)
Walk-ins Bookings

Wonderla Holidays
5 Edelweiss Securities Limited
Chart 9: Interest rate cuts to help revive the economy
Source: Bloomberg, Edelweiss research
Chart 10: Slowdown in SSG over the past few quarter
Source: Company, Edelweiss research
Favourable demographics: India is slated to become the youngest country in the world by 2020 with the median age declining to 29 years with about 64% of population in the working age group. Also, as per a recent UN report, India has the world's largest youth population, despite having a smaller population than China, with 356mn in the 10-24 year age bracket. This presents a favourable demographic for the amusement industry in India as majority of its customers fall under this age bracket. Tourism industry boom: Promoting tourism is Modi government’s key priority. Domestic spending on tourism, one of the biggest driver of the amusement park industry, is expected to jump significantly. Domestic tourism posted CAGR of 13.7% for ~7 years till CY11 and the number of domestic tourists jumped 14.0% CAGR between 1991 and 2012. Also, as GDP imrovement spurs income levels, domestic tourism will surge at a much faster clip. This bodes well for the amusement park industry as local residents form major chunk of the footfall (84%), followed by domestic tourists (15%). Larger inflow of tourists in parks leads to
3.0
4.6
6.2
7.8
9.4
11.0
Mar
-01
Mar
-02
Mar
-03
Mar
-04
Mar
-05
Mar
-06
Mar
-07
Mar
-08
Mar
-09
Mar
-10
Mar
-11
Mar
-12
Mar
-13
Mar
-14
Mar
-15
(%)
(12.0)
(3.2)
5.6
14.4
23.2
32.0
Q1C
Y12
Q2C
Y12
Q3C
Y12
Q4C
Y12
Q1C
Y13
Q2C
Y13
Q3C
Y13
Q4C
Y13
Q1C
Y14
Q2C
Y14
Q3C
Y14
Q4C
Y14
(%)
Yum! Brands JFL

Retail
6 Edelweiss Securities Limited
better utilisation of allied services like hotels/ resorts as well. In India, only 3% tourists visit amusement parks compared to 59% in US, Singapore and Australia. This provides significant potential for further increase in the inflow of tourists in amusement parks in India.
Chart 11: Statewise domestic tourist visitor proportion Chart 12 : Domestic visitors on an upswing
Source: Indian Tourism Statistics 2012, Edelweiss research
Urbanisation: More and more people in India are moving to urban cities which is rapidly increasing the pace of urbanisation. As a result of rapid urbanisation, more people in India are looking for entertainment and leisure ones. Currently, many Indian cities have limited entertainment options, especially outdoor options, to offer to consumers. Amusement parks are expected to cater to this growing consumer segment. The count of the population as a proportion of overall population residing in urban areas has increased from 11.4% in 1901 to 28.53% in 2001. According to a survey by UN State of the World Population report in 2007, by 2030, 40.76% of country's population is expected to reside in urban areas. The focus of the new government towards revival of growth in urban cities further provides a philip to the urbanisation rate in India. Chart 13: Rate of urbanisation continues to improve in India
Source: Census, Edelweiss research
Andhra Pradesh
20%
Tamil Nadu18%
Uttar Pradesh
16%Karnataka
9%
Maharashtra7%
Madhya Pradesh
5%
Rajasthan3%
Uttarakhand3%
Gujarat2%
West Bengal2%
Others15%
20.0
25.6
31.2
36.8
42.4
48.0
1990 1991 2001 2005 2008 2011 2025E 2030E
(%)
Urbanisation Rate
0.0
5.0
10.0
15.0
20.0
25.0
0
240
480
720
960
1,200
2010 2011 2012
(%)
(mn)
Domestic visitors (in mn) Growth rate (YoY)

Wonderla Holidays
7 Edelweiss Securities Limited
Chart 14: Urban population increasing as a % of total population
Source: Industry, Edelweiss research
Increase in ticket prices to boost average realisation per consumer Realisation per consumer in a park is a function of the ticket price and revenue from non-ticketing items like food, merchandising etc. According to our estimate, Wonderla’s blended gross realisation per customer will jump from INR700 in FY14 to INR932 in FY17, riding improvement in proportion of non-ticketing revenue, improvement in average ticket price (ATP) and also introduction of differentiated and premium offerings. Chart 15: Blended realisation per customer for Wonderla
Source: Company, Edelweiss research
Despite ATP CAGR of 9.1% over FY09-14, the company has been able to sustain healthy footfall growth. We expect Wonderla to register ATP CAGR of ~10.0% over FY15-17 driven by improvement in discretionary spendings.
0
320
640
960
1,280
1,600
1990 1991 2001 2005 2008 2011 2025E 2030E
(mn)
Total Population(MN) Urban Population
0.0
3.2
6.4
9.6
12.8
16.0
0
200
400
600
800
1,000
FY09 FY10 FY11 FY12 FY13 FY14 FY15E FY16E FY17E(%
)
(INR)

Retail
8 Edelweiss Securities Limited
Chart 16: Overall ATP for Wonderla to jump
Source: Company, Edelweiss research
PVR has also been able to increase ATP price over the years. Chart 17: PVR’s ATP continues to rise
Source: Company, Edelweiss research
Kochi, Bengaluru park’s ATP growth robust Kochi Park’s (first park in Wonderla’s franchise started in 2000) ATP has surged from INR278 in FY09 to INR469 in FY14, implying 5-year CAGR of ~11%. Bengaluru Park, which commenced operations in 2005, has clocked ATP CAGR of 6% over FY09-14. Its ATP stood at INR586 in FY14, up from INR437 in FY09. Thus, both the parks have atleast grown in line with inflation. The reason behind Kochi park’s higher CAGR is that it started at a lower base and management slowly upgraded its customers, leading to a bigger delta compared to the Bengaluru park, which started at a premium to Kochi. Ergo, Wonderla’s blended ATP has surged from INR342 in FY09 to INR530 in FY14, 9.1% CAGR over FY09-14. We estimate Kochi and Bengaluru parks’ ATP to post CAGR of 9.5% each over FY15-17 driven by better pricing power via extensions, new ride launches and improvement in the discretionary spending.
0.0
3.2
6.4
9.6
12.8
16.0
0
160
320
480
640
800
FY09 FY10 FY11 FY12 FY13 FY14 FY15E FY16E FY17E
(%)
(INR)
Total entry charge per customer (INR) % growth (YoY)
0
50
100
150
200
250
FY10 FY11 FY12 FY13 FY14 FY15E FY16E FY17E
(INR)
ATP

Wonderla Holidays
9 Edelweiss Securities Limited
Chart18: Average ticket price per customer for Bengaluru park Chart 19: Average ticket price per customer for Kochi park
Source: Company, Edelweiss research
Hyderabad Park: New growth trigger Wonderla took the IPO route (~INR1.8bn proceeds) to set up a new amusement park in Hyderabad. For the park, the company has acquired ~50 acres of land; all the necessary approvals have been obtained from Telangana government and construction is underway. The park is expected to commence operations from April 2016 (we have assumed that the park will be operational for 10 months in FY17). Thus, from FY17, the park will start to reflect in the company’s numbers. This park is similar to the Bengaluru park as far as rides and other facilities are concerned. However, the Hyderabad park has much better connectivity compared to other existing parks in Hyderabad—superior infrastructure, is close to the airport and is located outside the ring road which connects to Hyderabad city. Though initially pricing in Hyderabad will be slightly lower than the Bengaluru park, eventually it will be at par with the latter. We have built in ATP of INR721 (~5% discount to the Bengaluru park) for FY17 for the Hyderabad park and as the park matures its realisation will improve further, boosting the company’s overall realisation. Though Hyderabad has Ramoji Film City, which does raise competition concerns, we believe both Wonderla and Ramoji are operating in different genres—while Wonderla is an amusement park with dry and wet rides, Ramoji is a film city. Apart from this, the company is also planning to open a new park in Chennai, which is expected to start in the latter part of FY19.
Competitive and flexible pricing cushion against slowdown An attractive price point providing cutomers a value for money proposition is one of Wonderla’s key strengths. Despite good quality rides, it charges competitive prices compared to other players. This is because the company’s upfront capex is much lower compared to other large parks, e.g., Imagica, which charges INR1,500/ ticket on a weekday, incurred upfront capex of INR16.5bn compared to only INR2,500mn incurred by Wonderla at its Hyderabad park. This cushions the company from a sharp dip in footfalls driving weak consumer sentiments.
(4.0)
0.0
4.0
8.0
12.0
16.0
0
160
320
480
640
800
FY09
FY10
FY11
FY12
FY13
FY14
FY15
E
FY16
E
FY17
E
(%)
(INR)
Entry charge per customer Bengaluru % growth (YoY)
0.0
3.2
6.4
9.6
12.8
16.0
0
140
280
420
560
700
FY09
FY10
FY11
FY12
FY13
FY14
FY15
E
FY16
E
FY17
E
(%)
(INR)
Entry charge per customer Kochi % growth (YoY)
Retail
10 Edelweiss Securities Limited
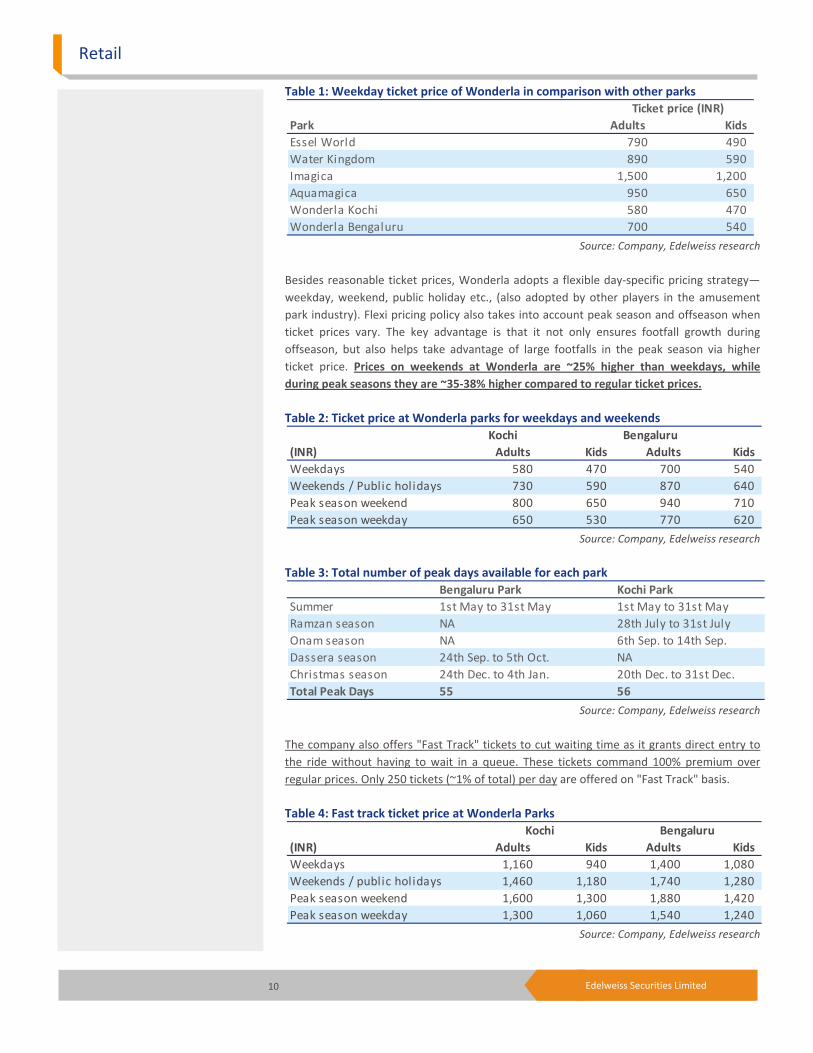
Table 1: Weekday ticket price of Wonderla in comparison with other parks
Source: Company, Edelweiss research
Besides reasonable ticket prices, Wonderla adopts a flexible day-specific pricing strategy—weekday, weekend, public holiday etc., (also adopted by other players in the amusement park industry). Flexi pricing policy also takes into account peak season and offseason when ticket prices vary. The key advantage is that it not only ensures footfall growth during offseason, but also helps take advantage of large footfalls in the peak season via higher ticket price. Prices on weekends at Wonderla are ~25% higher than weekdays, while during peak seasons they are ~35-38% higher compared to regular ticket prices. Table 2: Ticket price at Wonderla parks for weekdays and weekends
Source: Company, Edelweiss research
Table 3: Total number of peak days available for each park
Source: Company, Edelweiss research
The company also offers "Fast Track" tickets to cut waiting time as it grants direct entry to the ride without having to wait in a queue. These tickets command 100% premium over regular prices. Only 250 tickets (~1% of total) per day are offered on "Fast Track" basis. Table 4: Fast track ticket price at Wonderla Parks
Source: Company, Edelweiss research
Park Adults KidsEssel World 790 490 Water Kingdom 890 590 Imagica 1,500 1,200 Aquamagica 950 650 Wonderla Kochi 580 470 Wonderla Bengaluru 700 540
Ticket price (INR)
Kochi Bengaluru(INR) Adults Kids Adults KidsWeekdays 580 470 700 540 Weekends / Public holidays 730 590 870 640 Peak season weekend 800 650 940 710 Peak season weekday 650 530 770 620
Bengaluru Park Kochi ParkSummer 1st May to 31st May 1st May to 31st MayRamzan season NA 28th July to 31st July Onam season NA 6th Sep. to 14th Sep.Dassera season 24th Sep. to 5th Oct. NAChristmas season 24th Dec. to 4th Jan. 20th Dec. to 31st Dec.Total Peak Days 55 56
(INR) Adults Kids Adults KidsWeekdays 1,160 940 1,400 1,080 Weekends / public holidays 1,460 1,180 1,740 1,280 Peak season weekend 1,600 1,300 1,880 1,420 Peak season weekday 1,300 1,060 1,540 1,240
Kochi Bengaluru

Wonderla Holidays
11 Edelweiss Securities Limited
Proportion of non-ticketing revenue rising gradually Apart from the entry charge, non-ticketing is another important revenue stream. These revenues primarily constitute revenue from sale of food & beverages (F&B) and merchandise. While globally amusement parks generate ~50% revenue from non-ticket streams, in India this share is 20-25%. Wonderla’s non-ticketing revenue stream after grossing up has gradually increased—from 19.4% in FY09 to 23.2% in FY14 (excluding income from resort). If we do not gross up the proportion of non ticketing revenue has increased to 17% in FY14 from ~14% in FY09. We expect this share in overall revenue to jump to ~26% in FY17E. This will also bolster the company’s overall margin as F&B and merchandise margins are higher— F&B business is directly recognised as commission, merchandise margin 50%. Management believes the proportion of non-ticket revenue can eventually rise to 30%. Chart 20: Gross non ticketing revenue over the years
Source: Company, Edelweiss research
Chart 21: Movement in the proportion of non ticketing revenues
Source: Company, Edelweiss research
0.0
12.0
24.0
36.0
48.0
60.0
0
180
360
540
720
900 FY
09
FY10
FY11
FY12
FY13
FY14
FY15
E
FY16
E
FY17
E
(YoY
%)
(INR
mn)
Gross Non Ticketing revenue (INR mn) Growth (% YoY)
0.0
20.0
40.0
60.0
80.0
100.0
FY09 FY10 FY11 FY12 FY13 FY14 FY15E FY16E FY17E
(%)
Ticketing revenue Gross non ticketing revenue
Retail
12 Edelweiss Securities Limited
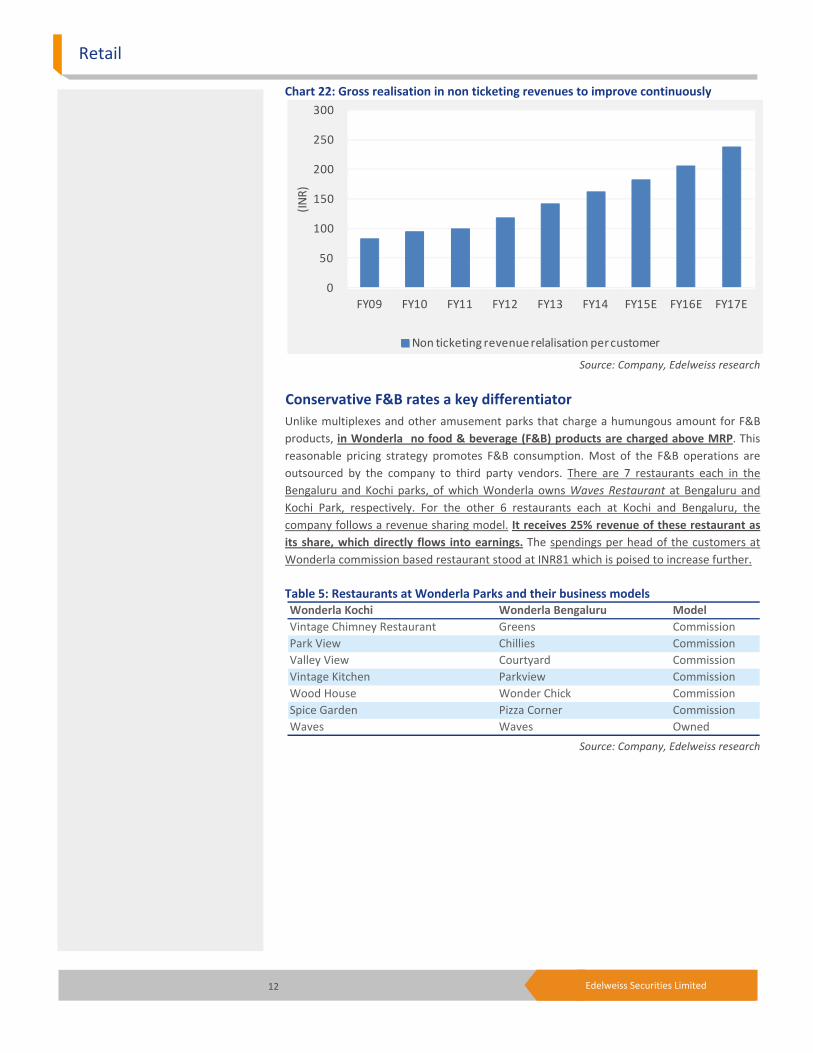
Chart 22: Gross realisation in non ticketing revenues to improve continuously
Source: Company, Edelweiss research
Conservative F&B rates a key differentiator Unlike multiplexes and other amusement parks that charge a humungous amount for F&B products, in Wonderla no food & beverage (F&B) products are charged above MRP. This reasonable pricing strategy promotes F&B consumption. Most of the F&B operations are outsourced by the company to third party vendors. There are 7 restaurants each in the Bengaluru and Kochi parks, of which Wonderla owns Waves Restaurant at Bengaluru and Kochi Park, respectively. For the other 6 restaurants each at Kochi and Bengaluru, the company follows a revenue sharing model. It receives 25% revenue of these restaurant as its share, which directly flows into earnings. The spendings per head of the customers at Wonderla commission based restaurant stood at INR81 which is poised to increase further. Table 5: Restaurants at Wonderla Parks and their business models
Source: Company, Edelweiss research
0
50
100
150
200
250
300
FY09 FY10 FY11 FY12 FY13 FY14 FY15E FY16E FY17E(IN
R)
Non ticketing revenue relalisation per customer
Wonderla Kochi Wonderla Bengaluru ModelVintage Chimney Restaurant Greens CommissionPark View Chillies CommissionValley View Courtyard CommissionVintage Kitchen Parkview CommissionWood House Wonder Chick CommissionSpice Garden Pizza Corner CommissionWaves Waves Owned

Wonderla Holidays
13 Edelweiss Securities Limited
Chart 23: Spendings per head of customers at Wonderla’s commission restaurants
Source: Company, Edelweiss research
Chart 24: PVR’s F&B spends per head have increased over the years
Source: Company, Edelweiss research
The share of F&B in Wonderla’s total revenue after grossing up (considering 100% F&B revenue) was ~16% in FY14, which we believe will increase. The affordable pricing is one of the key reasons for this increase in the overall proportion.
In-house technical team cuts external dependence, downtime Compared to other parks, Wonderla’s key advantage is that it has an in-house manufacturing and technical team which helps limit downtime and also reduces the cost of procuring and importing a new ride. This is also a prime reason why till now the company has faced no major mechanical failure at its parks. Wonderla saves cost on 3 fronts:
1. In-house designing: Wonderla designs the rides and parks in house. Typically, an external agency charges ~INR100-200mn for designing a park and its rides. Due to in-house expertise, the company saves on this cost.
0
28
56
84
112
140
FY09 FY10 FY11 FY12 FY13 FY14 FY15E FY16E FY17E(I
NR)
Spendings per customer
0
16
32
48
64
80
FY10 FY11 FY12 FY13 FY14 FY15E FY16E FY17E
(INR)
F&B spends per head
Retail
14 Edelweiss Securities Limited
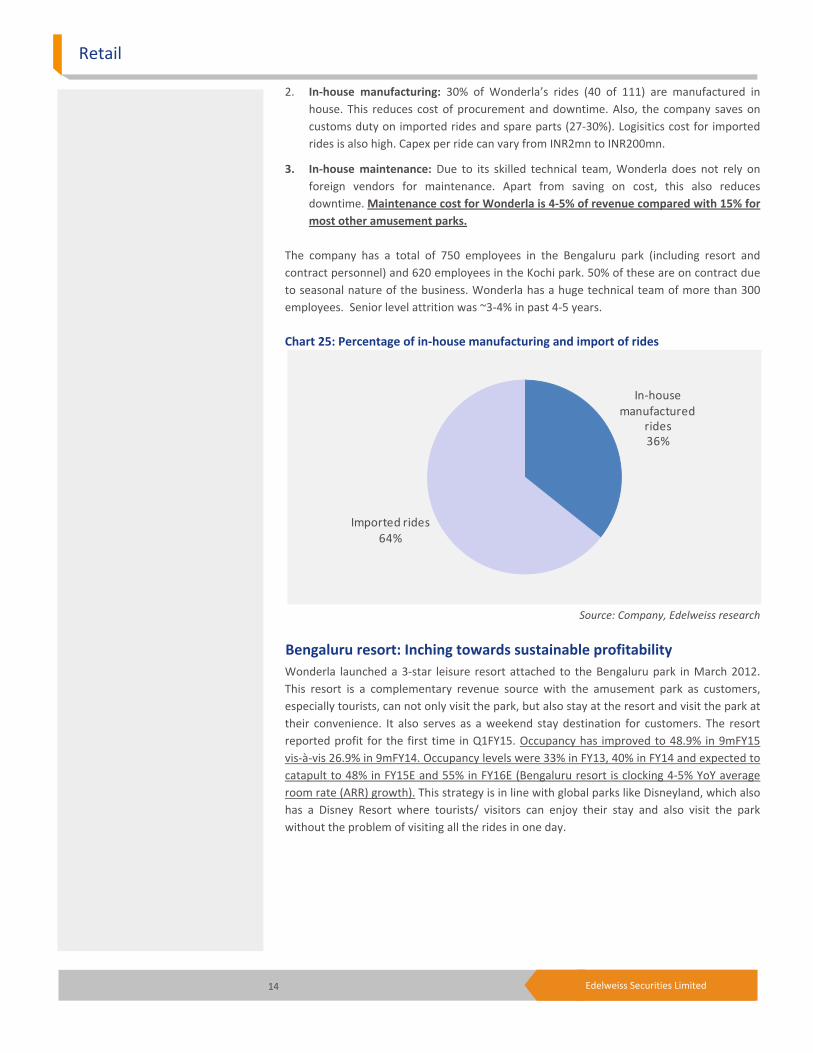
2. In-house manufacturing: 30% of Wonderla’s rides (40 of 111) are manufactured in house. This reduces cost of procurement and downtime. Also, the company saves on customs duty on imported rides and spare parts (27-30%). Logisitics cost for imported rides is also high. Capex per ride can vary from INR2mn to INR200mn.
3. In-house maintenance: Due to its skilled technical team, Wonderla does not rely on foreign vendors for maintenance. Apart from saving on cost, this also reduces downtime. Maintenance cost for Wonderla is 4-5% of revenue compared with 15% for most other amusement parks.
The company has a total of 750 employees in the Bengaluru park (including resort and contract personnel) and 620 employees in the Kochi park. 50% of these are on contract due to seasonal nature of the business. Wonderla has a huge technical team of more than 300 employees. Senior level attrition was ~3-4% in past 4-5 years. Chart 25: Percentage of in-house manufacturing and import of rides
Source: Company, Edelweiss research
Bengaluru resort: Inching towards sustainable profitability Wonderla launched a 3-star leisure resort attached to the Bengaluru park in March 2012. This resort is a complementary revenue source with the amusement park as customers, especially tourists, can not only visit the park, but also stay at the resort and visit the park at their convenience. It also serves as a weekend stay destination for customers. The resort reported profit for the first time in Q1FY15. Occupancy has improved to 48.9% in 9mFY15 vis-à-vis 26.9% in 9mFY14. Occupancy levels were 33% in FY13, 40% in FY14 and expected to catapult to 48% in FY15E and 55% in FY16E (Bengaluru resort is clocking 4-5% YoY average room rate (ARR) growth). This strategy is in line with global parks like Disneyland, which also has a Disney Resort where tourists/ visitors can enjoy their stay and also visit the park without the problem of visiting all the rides in one day.
In-house manufactured
rides36%
Imported rides64%

Wonderla Holidays
15 Edelweiss Securities Limited
Table 6: Financial metrics of Bengaluru resort for 9mFY15
Source: Company, Edelweiss research
Globally, most big amusement park chains have a resort adjoining the park. The occupancy in these resorts can be as high as 90%, lending a bigger delta in terms of operating leverage. Thus, the resort presents Wonderla a significant opportunity to enhance this revenue stream. Table 7: Occupancy levels of hotels at global amusement parks
Source: IMaCS report, Edelweiss research
New additions, dry & wet rides key pull factor Apart from the expansion strategy which garners growth at the overall park level, key to drive footfalls and growth is rides. Wonderla has been at the forefront as far as rides addition are concerned. On an average, the company adds 1 new ride per year thereby adding capacity. In FY14, it added 4 new rides at its parks. As on FY14 end, Wonderla had a total of 111 rides (dry and wet), of which 40 were manufactured in house. Having in-house capability also helps the company in rides addition at a much faster clip and at a reasonable cost. Another key advantage is that it has both dry and wet rides in the same park for which it does not charge separately. A single ticket at the time of entrance gives access to all the rides. Unlike this, other parks like Essel World and Adlabs Imagica, have separate water parks and entry tickets. Table 8: Total land and water rides added each year at Wonderla Parks
Source: Company, Edelweiss research
9mFY15 9mFY14 YoY %Total revenue (INR mn) 80.2 48 67.1 Total no of room nights available (No.) to guests 21623 22746Occupancy % 48.9 26.9Avg. room rental for the period (INR) 4324 4342 (0.4)
Theme park Hotels owned Rooms Occupancy (%)Disneyland, Tokyo 3 705+ 90.0 Disneyland, Paris 5 5,800 87.0 Universal Studios, Orlando 3 2,150 NAUniversal Studios, Japan 6 2,500 85.0 Everland, Korea 2 NA NAEuropa Park, Germany 4 724 NA
Total rides FY11 FY12 FY13 FY14 9mFY15Land based ridesKochi 29 31 31 34 39 Bengaluru 32 33 33 35 39 Water based ridesKochi 22 22 22 22 23 Bengaluru 20 20 20 20 20

Retail
16 Edelweiss Securities Limited
Fig. 1: Rides at Wonderla
Source: Company

Wonderla Holidays
17 Edelweiss Securities Limited
Capital intensive nature keeps competition at bay Amusement parks is a capital intensive industry as it requires upfront investments for land purchase, rides, construction etc. This is the key reason behind absence of many large amusement parks in India. Also, even post the upfront expenditure, it entails huge maintainance capex besides capex for new rides. This, coupled with humungous increase in land cost especially in the past 6-7 years, has increased entry barriers for this industry. A large park in India typically requires an initial capex of more than INR700mn and area of atleast 40 acres. This is the primary reason why there are only 16-18 large parks in India. A few large parks in India, apart from Wonderla, are Essel World and Adlabs Imagica in Mumbai, Nicco Park in Kolkata, Ramoji Film City etc. Going forward, a total of INR175bn investment is planned in 12 major projects lined up over the next 3-4 years. Biggest of them will be the park at Surat, which alone will contribute INR95-100bn of the overall amount. We believe Wonderla is in a sweet spot because it already has 2 parks under operation both of which are high RoCE, high margin and profitable mature entities. It has also started construction of Hyderabad park and is in the process of acquiring land in Chennai. Another benefit for Wonderla is that though going forward there are many amusement parks on the anvil, most will be in different states or if in the same state, in different cities. Table 9: Capex per park
Source: Company, Edelweiss research
Brand building and marketing to attract customers Brand is also key to attract customers. Wonderla’s total ad & marketing spending is ~11% of revenue. Of this, while ~7% are above-the-line ad spends, balance are below-the-line promotional activities. Promotions include commission paid to 59 sales agents who handle the sales and marketing functions like marketing at various schools & colleges, arranging for their tickets, transportation etc (Hyderabad park will have another 10-20 sales agents). The company already has 2 parks in operation and by FY19 it is expected to have 4 parks. Investment behind brands and expansion will help bulid the Wonderla franchise. This will help the company in further expansion into the country as it will create more buzz around its parks, encouraging more people to visit them. To further promote footfalls, Wonderla also launched Wonderla Privilage Card to enhance frequency of repeat customers. This card gives additional 10-20% discount to visitors if they visit the park subsequently. The card is given if a customer buys 4 tickets at a full rate with no discounts. Apart from this, there are separate discounts for school and college students, which vary from 20-35%. Wonderla also felicitates various schools for their efforts on making the state greener and safer. These initiatives helps the company to keep the brandname of Wonderla buzzing.
Capex incurred (INR mn)Wonderla Kochi 200Wonderla Bengaluru 950Wonderla Hyderabad 2,500
“Wonderla believes that when a school takes green steps, its students will grow up to be sensitive and caring towards the environment.”

Retail
18 Edelweiss Securities Limited
Chart 26: Advertising and marketing expenses as a % of sales
Source: Company, Edelweiss research
Table 10: Various offers and discounts offered by Wonderla
Source: Company, Edelweiss research
Mature parks bring operating leverage, new parks aid growth Wonderla’s mature properties clock RoCE of 32-35%. 70% of operating cost is fixed. Thus, it gets a magnifying effect of operating leverage as the property matures because of the higher fixed costs. However, initially margins do come under pressure when a new property is launched. A new park starts with a lower EBITDA margins though profitable at EBITDA level but witness margin improvement as it matures (margins can gradually improve to 45-50% in a stable phase). Wonderla’s parks at Kochi and Bengaluru are mature and clocked footfalls of close to 1.12mn and 1.18mn, respectively, in FY14. ~0.80-0.85mn footfalls lead to 48-49% EBITDA margin for a particular park. The company clocked EBITDA margin of 45.8% in FY14 with 2 parks under operation. With the new Hyderabad park coming into operation from FY17, we anticipate margins to fall from 45.8% in FY14 to 44.7% in FY17E.
6.0
8.0
10.0
12.0
14.0
16.0
FY09 FY10 FY11 FY12 FY13 FY14 FY15E FY16E FY17E(%
)
Advertisement & marketing expenses as a % of revenue
Offer
Privilege Member Card Offer
Customer gets 10-20% off on subsequent visit to Wonderla for a period of 5 years. A card can be obtained if the customer buys atleast 4 tickets without any discount during his first visit.
Discount to school students
Offers discount upto 35% on tickets provided a minimum of 20 students come from a single institution.
Discount for college students
Wonderla Parks in Bengaluru and Kochi offer a 20% discount on park admission to college students. Students below the age of 22 may avail this offer by showing their original college ID card with photo.

Wonderla Holidays
19 Edelweiss Securities Limited
Chart 27: Margin profile over the years
Source: Company, Edelweiss research
Margin improvement is also a function of capacity utilisation per park. Currently, this number for Wonderla ranges from 26-27%. As and when the economy revives, we expect the capacity utilsation to improve. At current figure, the company has enough capacity to handle much more customers. In case the current capacity falls short, the company has enough spare land in each of its parks to expand further. Table 11: Total capacity utilisation per park for Wonderla
Source: Company, Edelweiss research
Table 12: Unutilised land available at Wonderla parks
Source: Company, Edelweiss research
For mature parks, footfall growth settles at 6-7% YoY. A park becomes free cash positive in the second year. While Kochi became free cash positive in the first year itself, Bengaluru became so in the second year. It takes 9-10 years for a park to achieve cash breakeven. Such long payback period also poses barriers to entry into the industry. However, there will always be a trade off between margins and revenue growth, which will come from new parks. The company plans to open a new park every 4 years. After Hyderabad, Wonderla is planning to expand to Chennai. The company plans to start building the park after 2 years and expects to complete it in FY19. After Chennai park, it is eyeing other cities as well.
40.8
43.2
45.6
48.0
50.4
52.8
FY09 FY10 FY11 FY12 FY13 FY14 FY15E FY16E FY17E(%
)
EBITDA margins
Kochi Bengaluru TotalTotal capacity per day (nos.) 12,000 12,000 24,000 Total footfalls in FY14 (mn) 1.1 1.2 2.3 Total footfalls per day (nos.) 3,066 3,233 6,299 Capacity util isation (%) 25.5 26.9 26.2 Balance capacity (%) 74.5 73.1 73.8
Kochi BengaluruTotal available area (in acres) 93.2 81.8 Total area utilised (in acres) 28.8 39.2 Total area unutilised (in acres) 64.4 42.6 % of unutilised land 69.1 52.0

Retail
20 Edelweiss Securities Limited
Valuation Wonderla, India’s largest amusement park chain, is in a sweet spot with the amusement park industry set to swing upwards spurred by the favourable macro economic tail winds and increased penetration. The company, armed with an experienced management (~15 years’ experience in amusement parks industry), in-house manufacturing capability, strong & clean balance sheet and robust expansion plan, is well poised to soar. It has clocked revenue, EBITDA and EPS CAGR of 20.1%, 20.7% and 24.4%, respectively, over FY09-14. The company’s EBITDA margin is one of the highest in the industry—45.8% in FY14. We expect Wonderla to clock revenue, EBITDA and EPS CAGR of 31.9%, 28.3% and 18.6%, respectively, over FY15-17E led by better macro economic tailwinds, addition of new parks and improvement in non ticketing revenues. We believe that being a capex heavy industry it will be more relevant to value the stock on EV/EBITDA basis than P/E. Also, EV/EBITDA makes sense for better capturing the cash generating capability of a firm especially when the company is going in an investment phase. Wonderla will be opening a new park at Hyderabad in FY17E and expected to open another park in Chennai by FY19E. Globally, mature amusement parks trade at an average EV/EBITDA multiple of ~12.5x and 11.0x FY16E and FY17E respectively. Also, companies in India trade at a significant premium to their global peers because of the higher growth potential (consumer companies in India trade at double the multiple of their global peers). PVR, which operates in emerging market of India, trades at a 50-60% premium to international multiplex peers. Merlin Entertainments (largest European entertainment company operating in Europe and runs 100 attractions in 22 countries across 4 continents), the second most visited theme park operator came out with an IPO in October 2013. The company trades at a EV/EBITDA of 11.0 x and 10.0x FY16E and FY17E. Merlin has a margin profile of close to 32% in FY14 and RoCE of ~16% respectively. Ergo, we assign a target of EV/EBITDA multiple of 15.0x (~35% premium to the global average) to Wonderla on account of its strong margin, free cash flow generation, healthy leverage and return ratios compared to the industry to arrive at a target price of INR363. We initiate coverage with ‘BUY’ given the strong industry dynamics, macro economic triggers, experienced management, profitability, healthy return ratios and high entry barriers.
Table 13: Valuation metrics of key global players in the amusement park industry
Source: Bloomberg, Edelweiss research
M Cap EVCompany Name (USD Mn) (USD Mn) FY15E FY16E FY17E FY15E FY16E FY17E FY15E FY16E FY17EWonderla Holidays 249 221 7.9 7.2 5.1 16.7 15.0 11.4 31.4 26.6 22.3 Merlin Entertainments 6,632 8,092 3.9 3.6 3.3 11.9 11.0 10.0 22.1 19.8 17.5 Oriental Land Co/Japan 25,450 24,514 6.4 6.1 5.8 20.5 18.7 16.6 40.4 36.6 32.3 Six Flags Entertainment Corp 4,215 5,974 4.8 4.6 4.4 12.6 11.8 10.9 32.5 28.3 23.1 Cedar Fair LP 3,123 4,502 3.8 3.6 3.5 10.1 9.7 9.2 18.3 16.5 16.1 Ardent Leisure Group 843 1,072 2.3 2.1 1.8 11.2 10.1 8.6 18.4 15.9 13.8 Peer mean 8,052 8,831 4.2 4.0 3.8 13.2 12.3 11.1 26.3 23.4 20.5
EV/ Sales (x) EV/ EBITDA (x) P/E (x)

Wonderla Holidays
21 Edelweiss Securities Limited
Table 14: Financial metrics of global players present in the amusement park industry
Source: Bloomberg, Edelweiss research
There are no major like-to-like comparisons for the amusement park industry in India; however, Wonderla is a play on discretionary consumption in India. Major players in the discretionary space in India especially those that are driven by footfalls are trading at an EV/EBITDA multiple of ~14x FY17E which further justifies our multiple. Table 15: Companies in discretionary consumption space
Source: Bloomberg, Edelweiss research
PVR, India’s largest multiplex opearator, is currently trading at an EV/EBITDA multiple of 8.0x . The multiplex model can, to an extent, be compared to the theme park model as it is also driven by footfalls. The revenue mix is also similar with revenue streams from ticket prices, food & beverages and also rentals. If we compare Wonderla with PVR, the former’s EBITDA margin is much better than the latter (PVR clocked EBITDA margin of 15.7% versus Wonderla’s 45.8% in FY14). Wonderla’s RoCE is higher at 35.8% in FY14 compared to PVR’s 9.7%. As far as footfalls are concerned, theme parks generally have better stability compared to multiplexes, where footfalls are driven by the movie, which can vary significantly every Friday. Consequently, Wonderla should trade at a premium to the multiplex space in India. Adlabs Imagica which is in the process of being listed is raising close to INR4.7bn via IPO at higher price band. The company is loss making and saw net loss of INR524.8mn in FY14 hence we cannot compare it on P/E basis. However on most other metrices also Imagica seems to be at a higher premium to Wonderla. Table 16: Wonderla and Imagica valuation metrics (based on FY14 numbers)
Source: Company, Edelweiss research
M Cap EVCompany Name (USD Mn) (USD Mn) FY15E FY16E FY15E FY16E FY15E FY16E FY15E FY16EWonderla Holidays 249 221 29 34 13 16 47.2 47.9 8 10 Merlin Entertainments 6,632 8,092 2,065 2,226 678 736 32.8 33.0 298 330 Oriental Land Co Ltd/Japan 25,450 24,514 3,847 4,015 1,309 1,480 34.0 36.9 585 647 Six Flags Entertainment Corp 4,215 5,974 1,239 1,294 475 507 38.3 39.2 136 152 Cedar Fair LP 3,123 4,502 1,197 1,237 447 466 37.3 37.7 171 183 Ardent Leisure Group 843 1,072 458 520 91 106 19.8 20.3 48 57
Revenue (USD mn) EBITDA (USD mn) EBITDA Margin (%) PAT (USD mn)
Company FY16E FY17E FY16E FY17EWonderla 26.6 22.3 15.0 11.4 PVR 23.3 20.2 10.0 8.2 Inox Leisure 26.9 13.6 10.2 7.5 Titan Company 34.7 28.5 23.7 19.7 Jubilant Foodworks 56.1 38.4 26.3 18.5 Shoppers Stop NM NM 18.2 13.7 Peer Mean 35.3 25.2 17.7 13.5
P/E EV/ EBITDA
Wonderla Adlabs ImagicaMarket cap to sales 10.2 17.2 EV to sales 7.6 27.5 EV / EBITDA 16.5 422.4 P/E 29.2 NA

Retail
22 Edelweiss Securities Limited
Table 17: Key financial metrics of Imagica and Wonderla
Source: Company, Edelweiss research
*Footfalls in CY14
**Total debt for Wonderla
Adlabs Imagica (including Aquamagica) Wonderla Bengaluru Wonderla Kochi
Total Area (in acres) 300 81.75 93.17
Total Area uti l ised(in acres) 132 39.2 28.75
Rides (Land + Water) 40 59 62
Ticket price in INR (weekdays) 1500 700 580
Ticket price in INR (weekends) 1900 870 730
Waterpark ticket price in INR (weekdays) 950 No separate charges No separate charges
Waterpark ticket price in INR (weekends) 1150 No separate charges No separate charges
Hotel rooms 287 84 NA
Footfalls (in mn) in FY14 0.91* 1.18 1.12
Cost of project (INR mn) 16504 950 200
Revenues (INR mn) for FY14 1,069 838 628
EBITDA (INR mn) for FY14 69.7 457 294
EBITDA margins (%) 6.5 54.6 46.8
Proportion of Non ticketing revenues (%) ~25.0 16.0 15.0
Total debt as on 30th September 2014 (INR mn) 12,772 123.0**

Wonderla Holidays
23 Edelweiss Securities Limited
Key Risks Service tax levy may affect footfalls The central government in the Union Budget has taken amusement parks out of the serive tax negative list, which has resulted in the levy of service tax. This will result in increase in overall ATP price due to additional charge of 14% service tax which may affect the footfalls. However, we believe this will not have a significnat impact on footfalls.
Accidents/natural calamities can impact footfalls Accidents or natural calamities will affect footfalls, resulting in lower revenue. Not only will accidents lead to negative publicity, affecting footfalls, but it will also expose the company to possible financial liability and legal proceedings. Till now, there have been 9 accidents at Wonderla’s parks, of which 2 cases are outstanding. Going forward, the company cannot guarantee non occurrence of accidents; however, it will take all precautions. Any epidemic like swine flu, terrorist attacks etc., can also impact footfalls.
Slowdown in consumer discretionary spending With anticipated recovery in the economy due to policy changes, consumer spending is expected to recover. However, if the economy does not recover, it may adversely affect consumer spending. Wonderla is affected by consumer discretionary spending and any adverse event in the economy will result in lower footfalls, affecting revenue.
Seasonal nature of business increases dependency on Q1 and Q3
Q1 and Q3 are the best quarters for the amusement parks business. In other quarters, schools have exams affecting footfalls. Q1 and Q3 contribute ~65% to the company’s revenue. However, due to adverse reasons, if the park remains closed during peak quarters, Wonderla’s overall performance will be affected.
Difficulties in land acquisition Wonderla is planning amusement parks in Hyderabad and Chennai. Going forward, it has plans in other cities as well. However, inability to find land in those states can affect the company’s growth strategy, which will again result in lower revenue.

Retail
24 Edelweiss Securities Limited
Company Description Wonderla is a leading operator of amusement parks in India. It operates and maintains 2 large amusement parks located in Bengaluru and Kochi. The company is also setting up a new amusement park at Ranga Reddy district of Telegana, which will start functioning by FY17. To set up the third park, it raised INR1.8bn via IPO. The parks are certified by Bureau Veritas Certification for meeting BS OHSAS 18001:2007 safety standards and ISO 14001:2004 environment protection standards. Apart from the amusement parks, Wonderla also owns a resort in Bengaluru, Wonderla Resort.
Fig. 2: Wonderla’s timeline
Source: Edelweiss research
Table 18: Awards won by Wonderla
Source: Company, Edelweiss research
Wonderla Kochi The first amusement park was started in 2000 in Kochi by the name ‘Veegaland’ which was later merged with the company with effect from April 1, 2008. It is situated on 93.17 acres (currently 28.75 acres occupied for 55 land and water based attractions) and has 22 water based and 33 land based attractions. Of the total 55 attractions, 10 are inhouse attractions.
2000
Wonderla Kochi
2005
Wonderla Bengaluru
2012
Wonderla Resort
(Bengaluru)
2014
Wonderla Holidays IPO
2016E
Wonderla Hyderabad
2019E
Wonderla Chennai
List of awards ParkRanked No.1 in India according to Trip Advisor's travellers choice awards 2014
Bengaluru
Ranked No.3 in India according to Trip Advisor's travellers choice awards 2014
Kochi
Ranked No.7 in Top 25 amusement parks l ist in Asia Bengaluru
Ranked No.13 in Top 25 amusement parks l ist in Asia Kochi
Winner of the National Award for Excellence by the Indian Association of Amusement Parks & Industries in the category of total number and variety of rides.
Kochi
Runner up in the National Award for Excellence by the Indian Association of Amusement Parks & Industries in the category of print media.
Kochi
Winner of the National Award for Excellence by the Indian Association of Amusement Parks & Industries in the category of Most Innovative Ride & attractions, Dry Rides and Electronic Media TV Channel
Bengaluru

Wonderla Holidays
25 Edelweiss Securities Limited
As on 9mFY15, Kochi had 39 land rides and 23 water rides. It won the ’Best Tourism Destination’ award for FY13. It is ranked as the thirteenth best amusement park in Asia by Trip Advisor. Total footfalls were 1.10mn in FY14 against 1.21mn in FY13. In FY14, the company added 3 more attractions—Rokin Tug, Fire Brigade and Magic Plane. The company has in-house facility in Kochi to manufacture amusement rides and attractions. It even procures rides from manufacturers within and outside India. Fig. 3: Wonderla Kochi park
Source: Company
Wonderla Begaluru Wonderla opened another amusement park in 2005 in Bengaluru under the brand name ‘Wonderla’. It is situated on 81.75 acres (currently 39.20 acres occupied for land and water based attractions) and has 20 water based and 35 land based attractions. At the end of 9mFY15, this park had 39 land rides and 20 water rides. Therefore, the total rides are 55, of which 18 are manufactured inhouse. It is located off the Bengaluru-Mysore highway, 28km from central Bengaluru. Total footfalls catapulted 58,000 (up 5% YoY) from 1.129mn in FY13 to 1.187mn in FY14. In FY14, the company added 2 more attractions—XDMAX and Mini Coco Cups. Fig. 4: Wonderla Bengaluru park
Source: Company

Retail
26 Edelweiss Securities Limited
Wonderla Hyderabad The company is also in the process of setting up its third amusement park in Hyderabad. To this end, it has acquired 49.57 acres of land in Telangana. Wonderla went for an IPO so that it can utilise the proceeds to set up the new amusement park. The company expects operation to commence by FY17. Telangana government has given all necessary approvals for setting up the amusement park. The company intends to use only 27 acres to set up the proposed amusement park comprising 27 land based and 18 water based attractions. The park is similar to the Bengaluru park as far as rides and other facilities are concerned. However, connectivity will be better compared to the Bengaluru park.
Wonderla Resort, Bengaluru The company also owns a resort in Bengaluru Wonderla which was inaugurated in March 2012. It is situated beside the amusement park. Rated as a Three Star Hotel, it has 84 luxury rooms including banquet halls, conference rooms, a multi-cuisine restaurant, solar heated swimming room, board room and a well equipped gym (totalling 8,900 sq ft with capacity to hold 800 guests). The resort division reported top line of INR65.63mn in FY14 compared with INR59.45mn in FY13. The average occupancy rate was 30% in FY14, which has improved to 48.9% in 9mFY15. This also serves as a weekend stay destination for customers in and around the park. Fig. 5: Wonderla Bengaluru resort
Source: Company

Wonderla Holidays
27 Edelweiss Securities Limited
Fig. 6: Wonderla’s SWOT analysis
Source: Edelweiss research
One of the largest theme parks in India with a strong brand
name
Experienced management team with 14 years of industry
experience
No big bang ride (like those found at Disney/ Imagica), F&B and merchandise share lower
than global peers
Improvement in the macro economic environment, increase
in tourism, improvement in discretionary spendings and
GDP
Entry of new parks in the same area, excessive rainfall,
accident at the park, any disease or terrosrist threat
Strengths Weaknesses
Opportunities Threats
Retail
28 Edelweiss Securities Limited
Management overview Mr. George Joseph, Chairman and Non Executive Director: Mr. George Joseph is the Chairman and Non Executive independent Director of Wonderla. He was selected as an Additional Director on June 27, 2011, and later he was appointed as Director and Chairman on September 12, 2011. Before joining Wonderla as a board member, Mr. Joseph was the Chairman & MD of Syndicate Bank. He has also worked in Canara Bank for over 37 years in different roles. He is a member of Certified Associate of the Indian Institute of Bankers and Associate of the Institute of Bankers, London. He has done his bachelor’s degree in commerce from Kerala University. Mr. Kochouseph Chittilappilly, Non Executive Director: He is one of the promoters of the company. He has 15 years’ experience in the amusement park industry. Mr. Chittilappilly has won several awards like Young Businessman of the Year 1995 by Business Deepika, Businessman of the Year 2007 by the business magazine ‘Dhanam’, Tourism Man of the Year Award 2011 by the Association of Tourism Trade Organisations and India and Businessman of the Year 2011 by the Travancore Management Association, Kottayam. Mr. Arun Kochouseph Chittilappilly, Managing Director: He was appointed as Additional Director of the company on January 27, 2003, and later became the Director on December 22, 2003. Mr. Arun Kochouseph Chittilappilly was promoted to Managing Director on April 1, 2012. He has more than 11 years’ experience in the amusement park industry. He has a master’s degree in industrial engineering from Swinburne University of Technology, Victoria, Australia. Mr. Ramachandran Panjan Moothedath, Non-Executive Director (Independent): On November 24, 2011, Mr. Ramachandran Panjan Moothedath was appointed as the Additional Director of the company. He was promoted as Director on August 9, 2012. He is also the Chairman & MD of Jyothy Laboratories. Mr. Moothedath has more than 31 years of experience. He has graduated from University of Mumbai and holds a diploma in financial management. Ms. Priya Sarah Cheeran Joseph, Executive Director: Ms. Priya Sarah Cheeran Joseph was appointed as Non Executive Director of the company from March 01, 2013. She manages the food & beverages and human resource departments of the company since 2005. Ms. Priya has more than 11 years’ experience in the amusement park industry. She also looks after the corporate social responsibility of the company. Mr. Nandkumar T, VP, Finance: Mr. Nandkumar T has been with the company since December 26, 2011. He is a qualified chartered accountant. He is currently responsible for overseeing the corporate finance activities of the company, including developing financial operating reports, preparing financial materials, building relationships with investors & analysts, monitoring & analysing monthly operating results against the budget. He has 17 years of experience in accounts and finance, including 4 years with Group company, V-Guard Industries as the CFO. Prior to joining Wonderla, Mr. Nandkumar worked in various capacities with Dhanalakshmi Bank from April 1997 to April 2006.

Wonderla Holidays
29 Edelweiss Securities Limited
Table 19: Professional team
Source: Company, Edelweiss research
Name DesignationJoined company on Experience Job description
Mr. Sivadas M. Senior General Manager - Operations
1-Aug-03 26 Years Preparation of overall budget, developing strategies to control cost, standardising of procedures etc
Mr. Ajikrishnan A.G., Deputy General Manager (Technical)
1-Apr-06 17 Years Managing the technical aspects
Mr. Santosh Kumar Barik Company Secretary 1-Jan-11 NA Financial and legal compliances
Mr. Ramanakumar V.B. Chief Manager (Marketing) 1-Jan-06 20 years Managing marketing activities including planning incentive schemes, customer retention strategies
Mr. Mahesh M.B. Assistant General Manager (Commercial)
1-May-00 20 years Planning, coordination and implemention of all food and beverage activities
Mr. Jayaprakash Deputy Manager (Human Resources)
1-Sep-05 9 Years Responsible for coordinating the recruitment and selection process
Mr. Unni P.R. Chief Manager (Finance and Accounts)
2-Jun-04 14 years Responsible for finance management, maintenance of accounts and records
Mr. Ravikumar M.A. General Manager – Administration
1-Mar-00 27 years Responsible for coordination across departments, periodic review of performance
Mr. Sudhir M.V. Senior Manager (Operations) 16-Jul-07 22 years Responsible for guest relations, food and beverages, event management housekeeping, maintenance, security etc

Retail
30 Edelweiss Securities Limited
Industry Overview
Theme park industry Though the Indian theme park industry is at a nascent stage, it is clocking good growth. Currently, around 150 parks are operational in India including small, medium and large parks. However, the country’s attractive demographics (population of close to 1.21bn) present an enormous growth opportunity. As per industry estimates, the size of the Indian amusement industry is INR25-30bn garnering footfalls of close to 50mn. This industry has been posting 20-25% CAGR over the past 5 years and is expected to become a INR50-60bn industry over the next 5 years.
Fig. 7: Amusement Park industry in India
Source: Industry, Edelweiss research
Globally,the amusement park industry was estimated at USD28bn in 2012, which is expected to increase to USD29.5bn in 2015 and USD32bn in 2017. US and Europe are considered mature markets in the amusement industry and Asia too is growing at a fast pace. Chart 28: Amusement park industry global revenue share
Source: IAAPA
Amusement parks begin in India in 1980s with Appu Ghar being set up in the year 1984 in Delhi
1990s saw expansion of amusement parks in other
cities. Parks like Nicco Park , Essel World came into
operation.
2000s saw increase in the integrated offerings in the park like resorts, shopping malls etc.
Tie ups was also done with foreign amusement parks.
US50%
Asia Pacific27%
EMEA20%
Canada2%
Latin America1%

Wonderla Holidays
31 Edelweiss Securities Limited
Footfalls growth in India outpace global average The Indian amusement park industry is well poised to grow at a faster clip compared to global peers not only because of the low penetration, but also because of favourable demographics. Footfalls also depend upon the climate; as India is a tropical country, it enjoys summer season for around 7-8 months, making water parks popular. Indian parks have clocked footfalls of close to 60mn annually and the industry is well poised to grow with more parks coming in and GDP reviving in the country. Globally, footfalls in top 10 parks jumped 6.7% in 2012, while in Asia and North America they rose 6.0% and 3.0%, respectively. If we take into account only the top 25 parks in the world, overall footfalls catapulted to 205.9mn in 2012 from 187.6mn in 2007. The growth was 1.9%, 3.8% and 5.2% in 2010, 2011 and 2012, respectively.
Table 20: Footfalls trend globally in amusement parks (MN)
Source: IMaCs Report, * Taken from Top 10 parks in Asia
Chart 29: Footfalls in amusement parks in CY12 ( in mn)
Source: Industry, Edelweiss research
Theme Parks Number of Parks 2007 2012CAGR 2007-
12 (%) Growth rate in
CY12 (%) Attendance per park
(CY12) Worldwide Top 25 187.6 205.9 1.9 5.2 8.2 North America Top 20 122.8 131.6 1.4 3.6 6.6 Europe Top 20 60.9 58.0 (1.0) (0.3) 2.9 Asia Top 20 NA 108.7 3.6* 5.8 5.4 Latin America Top 20 11.3 13.2 3.2 2.6 1.3 Water ParksWorldwide Top 20 19.4 23.6 4.0 5.4 1.2 North America Top 20 12.2 15.1 4.4 2.2 0.8 Asia Top 15 NA 14.4 NA 7.4 0.7
0.0
4.0
8.0
12.0
16.0
20.0
Mag
ic K
ingd
om, U
SD
isne
ylan
d, U
SD
isne
ylan
d, T
okyo
Dis
ney
Sea,
Tok
yaD
isne
ylan
d, P
aris
Epco
t, U
SD
isne
y's A
nim
al K
ingd
om, U
SD
isne
y's H
olly
woo
d St
udio
s, U
SU
nive
rsal
Stu
dios
, Jap
anIs
land
s of A
dven
ture
, US
Dis
ney'
s, C
alifo
rnia
Oce
an P
ark,
HK
Ever
land
, SK
Dis
neyl
and,
HK
Lott
e W
orld
, SK
Uni
vers
al S
tudi
os, U
SN
agas
him
a Sp
alan
dSe
awor
ld F
lori
da, U
SW
alt D
isne
y St
udio
s, P
aris
Euro
pa P
ark,
Ger
man
ySe
awor
ld C
alifo
rnia
, US
Busc
h G
arde
ns T
ampa
Bay
, US
De
Efte
ling,
Net
herl
ands
Oct
east
, Chi
naW
onde
rla,
Indi
a
(mn)
Retail
32 Edelweiss Securities Limited
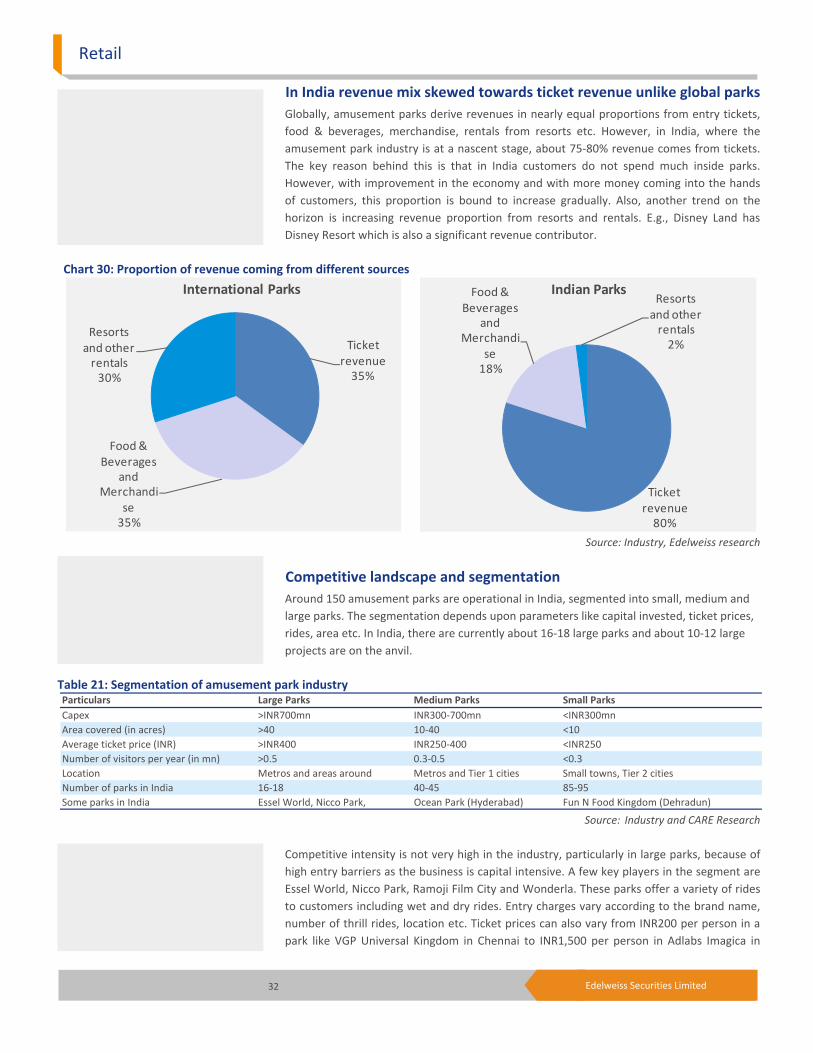
In India revenue mix skewed towards ticket revenue unlike global parks Globally, amusement parks derive revenues in nearly equal proportions from entry tickets, food & beverages, merchandise, rentals from resorts etc. However, in India, where the amusement park industry is at a nascent stage, about 75-80% revenue comes from tickets. The key reason behind this is that in India customers do not spend much inside parks. However, with improvement in the economy and with more money coming into the hands of customers, this proportion is bound to increase gradually. Also, another trend on the horizon is increasing revenue proportion from resorts and rentals. E.g., Disney Land has Disney Resort which is also a significant revenue contributor.
Chart 30: Proportion of revenue coming from different sources
Source: Industry, Edelweiss research
Competitive landscape and segmentation Around 150 amusement parks are operational in India, segmented into small, medium and large parks. The segmentation depends upon parameters like capital invested, ticket prices, rides, area etc. In India, there are currently about 16-18 large parks and about 10-12 large projects are on the anvil.
Table 21: Segmentation of amusement park industry
Source: Industry and CARE Research
Competitive intensity is not very high in the industry, particularly in large parks, because of high entry barriers as the business is capital intensive. A few key players in the segment are Essel World, Nicco Park, Ramoji Film City and Wonderla. These parks offer a variety of rides to customers including wet and dry rides. Entry charges vary according to the brand name, number of thrill rides, location etc. Ticket prices can also vary from INR200 per person in a park like VGP Universal Kingdom in Chennai to INR1,500 per person in Adlabs Imagica in
Ticket revenue
35%
Food & Beverages
and Merchandi
se35%
Resorts and other
rentals30%
International Parks
Particulars Large Parks Medium Parks Small ParksCapex >INR700mn INR300-700mn <INR300mnArea covered (in acres) >40 10-40 <10Average ticket price (INR) >INR400 INR250-400 <INR250Number of visitors per year (in mn) >0.5 0.3-0.5 <0.3Location Metros and areas around Metros and Tier 1 cities Small towns, Tier 2 citiesNumber of parks in India 16-18 40-45 85-95Some parks in India Essel World, Nicco Park, Ocean Park (Hyderabad) Fun N Food Kingdom (Dehradun)
Ticket revenue
80%
Food & Beverages
and Merchandi
se18%
Resorts and other
rentals2%
Indian Parks

Wonderla Holidays
33 Edelweiss Securities Limited
Mumbai. Majority of the parks operate on the single entry fee model, in which a customer does not have to pay for the rides in the park; he pays only for F&B and merchandise.
Table 22: Overview of some major amusement parks in India
Source: Industry, CARE Research, Edelweiss research
Note: *FY11 revenues **Area will be increased in phased manner to 147 acres
Solid investments lined up Around INR175bn investments are on the anvil in the amusement park industry with close to 10-11 projects lined up for launch. 4 of these parks will be launched in Maharashtra. The biggest amusement park is slated to come up in Surat (Gujarat) at an investment of close to INR95-100bn.
Amusement Park CityArea (in
acres) Dry Wet Structure Entry charges (INR)
Annual footfalls (in mn)
Revenue (FY12 in mn)
Essel World and Water Kingdom
Mumbai 64 Yes Yes Separate fees for land and water park
INR790-890 1.8570*
Nicco Park Kolkata 40 Yes Yes Separate fees for land and water park
Main park package - INR430Water park package - INR380
1.7
311.1
Ocean Park Hyderabad 20 Yes Yes Separate fees for land and water park
INR300 NANA
Ramoji Film City Hyderabad 1666 NA NA Single entry fees General package at INR800 1.5 NA
Kishkinta Chennai 120 Yes Yes Single entry fees INR540 NA NA
Queensland Chennai 70 Yes Yes Single entry fees INR350 NA NA
VGP Universal Chennai NA Yes Yes Single entry fees INR200 NA NA
MGM Dizzee World Chennai 27 Yes Yes Single entry fees INR500 NA NA
GRS Fantasy Park Mysore 30 Yes Yes Single entry fees INR395 NA NA
Mount Opera Hyderabad 55 Yes Yes Single entry as well as pay as you go option
INR360 NA
NA
Entertainment City Noida 44** Yes Yes Single entry as wellas pay as you go option
INR450 NA
NA
Black Thunder (Majorly water rides)
Coimbatore 65 Yes Yes Single entry fees INR450 0.5NA
Fun n Food Village Delhi 10 Yes Yes Single entry fees INR300 NA NA
Rides Pricing

Retail
34 Edelweiss Securities Limited
Table 23: Major investments upcoming in the amusement park industry in India
Source: Industry, CARE, Edelweiss research
Upcoming project Location Promoter
Estimated Inv. (INR
bn)Expected
completion yearSize
(acres) Description
Sea World Singhudurg, Konkan, Maharashtra
Proposed by GoM, wil l be done on PPP basis
5-5.1 2015 150 Is a water based animal kingdom with 3000 kind of marine animals
Theme Park Nagpur, Maharashtra Landmark Entertainment 15 Planning stage 300 Theme park based on concept l ike Jurassic park, Terminator and Spiderman
MGM Lavasa Hollywood Theme Park
Lavasa, Maharashtra MGM - Lavasa 4.5 NA 75 India's first hollywood theme park
Spaceworld Theme Park Lavasa, Maharashtra Space Investment Company, Lavasa
4 NA 65 India's first edutainment theme park
Appu Ghar Gurgaon, Haryana International Amusement 4 NA 58 Will include amusement park, water park, retail complex
Surat Theme Park Surat, Gujarat Atlanta 95-100 2016 3200 One of Asia's largest theme park
Krishna Lila Theme Park Bengaluru, Karnataka ISKCON 3.5 2016-17 28 Spritual theme park to spread awareness of vedic heroes
Jaipur Mega Tourism City Jaipur, Rajasthan International Amusement 25 Planning stage 300 Mega Tourism City
Naya Raipur Amusement Park
Naya Raipur, Chhattisgarh
Proposed by NRDA, wil l be done on PPP basis
0.23 Planning stage 40 Recreational cum amusement park
Adventure Island and Metro Walk
Rohini, Delhi 50:50 JV of International Amusement and Unitech
2-3 Completed 62 Amusement park
Entertainment City Phase 1
Noida, Delhi 50:50 JV of International Amusement and Unitech
10-11 Phase 1 completed,
Phase 2 is on
147 Mega complex having amusement park, retail space, health club, small water park, shoping mall with a 5 star hotel

Wonderla Holidays
35 Edelweiss Securities Limited
Financial Outlook Footfall surge, ATP jump, new park to spur revenue CAGR of 24.8% Wonderla is estimated to clock revnue CAGR of 24.8% over FY14-17 primarily driven by the new park at Hyderabad and increase in footfalls and ATP. Footfalls at Wonderla are expected to post 14.4% CAGR over FY14-17E (we expect Hyderabad park to register footfalls of 0.58mn in FY17E). Excluding the Hyderabad park, footfall CAGR over FY14-17E is expected to be 7.61% with Bengaluru and Kochi parks clocking footfall CAGR of 8.7% and 6.5%, respectively. We have bulit in a total ATP increase of 9.4% CAGR over FY14-17E for Bengaluru and Kochi parks. Chart 31: Revenue expected to surge going ahead
Source: Edelweiss research
New park to depress FY17 EBITDA margin Wonderla registered 45.8% EBITDA margin in FY14, up 91bps YoY. Going forward, we expect it to expand 210bps YoY till FY16E driven by better mix and increased occupancy driven by footfall growth, leading to better oprating leverage. However, since the Hyderabad park will commence operations from FY17, we expect EBITDA margin to dip 322bps YoY in FY17E. We expect EBITDA CAGR of 23.7% over FY14-17.
0
600
1,200
1,800
2,400
3,000
3,600
FY13 FY14 FY15E FY16E FY17E
(INR
mn)
Net revenues
We expect EBITDA to post a CAGR of 28% (FY15-FY17E).

Retail
36 Edelweiss Securities Limited
Chart 32: EBITDA margin will dip after new park comes into operation
Source: Edelweiss research
PAT to post CAGR of 20.7% over FY14-17E Wonderla is expected to post 20.7% PAT CAGR over FY14-17E. The FY14-16E number stands at 21.5% which will be only because of the the existing park under operation i.e., Kochi and Bengaluru parks. Chart 33: PAT will continue to swing upwards
Source: Edelweiss research
41.6
43.2
44.8
46.4
48.0
49.6
0
280
560
840
1,120
1,400
FY13 FY14 FY15E FY16E FY17E
(%)
(INR
mn)
EBITDA EBITDA margins
0
140
280
420
560
700
840
FY13 FY14 FY15E FY16E FY17E
(INR)
PAT

Wonderla Holidays
37 Edelweiss Securities Limited
Appendix Adlabs Imagica
IPO on cards
Another amusement park which has recently filed for an IPO after Wonderla is Adlabs Imagica. The company intends to raise money for partial repayment of its consortium loan and for general corporate purposes. Total amount of debt standing as due in the book of the company stood at INR9,441mn as on March 31, 2014. Imagica commenced full operations from November 1, 2013; prior to which though it was operational, not all the rides were open to the pubilc. Overview
Imagica is a recent addition to the large theme parks in India. This park, to certain extent, can be compared to Disneyland in Hongkong as it is a mix of high thrill rides like roller coaster, small rides and indoor thematic rides. Also, like Disney, Imagica also has its signature parade at the end of the day which showcases its characters. The park is spread over 132 acres and is strategically located on the Mumbai Pune Expressway. This helps garner footfalls not only from Mumbai, but from Pune and cities around as well. Imagica has 26 rides which includes bigger and thrilling rides like roller coasters which are among the biggest rides in India. All the rides are divided into various themes (6 themes) like thrilling rides, indoor rides etc. Some of the famous rides in the park are Rajasaurus River Adventure, Wrath of Gods (VFX show) and Nitro (large roller coaster). Apart from these, it also has live performances by dancers, musicians, magicians etc. Imagica has diversified into water parks as well under the name Aquamagica. This water park is adjoining the Imagica Theme Park (land rides), but charges a separate entry fee. Thus, the park gives wholesome entertainment to customers with both land and water rides. The park owns and operates various multi cuisine F&B outlets. Unlike Wonderla, where F&B prices are at MRP, at Imagica they are at a premium. The latter also has many merchandise counters. Imagica is also constructing a 287 room hotel in the park which will include facilities such as banquet halls, conference rooms, specialty restaurants, recreation areas, a swimming pool, a spa, a kids’ activity centre and a gym. The first phase of this hotel is expected to get over by April 2015 (116 rooms). This hotel will be operated by Novotel. This will provide customers with an option to stay and explore the park including the water park, which otherwise would not have been possible in a day’s time. Other key highlights of Adlabs Imagica
Imagica project cost and land: The company has total 300 acres, of which area under construction is close to 132 acres. Balance 170 acres is free for further constructions, if any. The cost of this land was INR2,500mn. The total project cost was INR16.50bn with INR11bn debt and INR5.5bn equity. A consortium of 13 banks funded the project spearheaded by Union Bank of India. Though the company has no plans, as of now, on use of the spare land,

Retail
38 Edelweiss Securities Limited
it is planning to develop the area into a destination land. As per the company, it has constructed an international standard park at one third the price. Imagica Hotel: Phase 1 (116 rooms) of the 287 room hotel which will be operated by Novotel is expected to commence operations from April 2015. The hotel will convert the company from a day to a multi-day destination. The hotel will be mid priced—starting from close to INR4,500. Pricing: The company will focus on increasing non-ticketing revenues whose ARPU will grow faster than ticket price. The increase in ticket price in FY16 is expected to be only to the tune of increase in the service tax liability. Tie ups: The company has also entered into a tie up to operate a snow park at Imagica. The park will be manufactured by some other vendor and Adlabs will earn commission (% of sales) for it. The company is also looking to set up an adventure park at the venue. Revenue proportion: 35-40% in H1 and 60-65% in H2. However, with the addition of water park the dynamics will alter as water parks operate better during the summer season. Blended realisation: INR1,450 for the theme park and INR1,000 for the water park. Capacity: While Imagica Theme Park’s total capacity is 15,000 customers, Aquamagica’s is 5,000. Service tax liability: Adlabs will use input tax credit to the extent of 33% while it will pass the balance to customers. Break even: The company requires 0.85mn-0.9mn footfalls for breakeven while footfall of 1.4mn is required to breakeven on cash basis. Competition: Though Disneyland and Universal Studios have India plans, their entry is atleast 3-4 years away. It requires 55 licenses to set up a theme park in India. Rides import: Adlabs imports its equipment and rides from foreign players (vendors like BNP of Switzerland, White Water of Canada, vendors from US, Italy, E2M etc). The company has customised them to appeal to the Indian audience. Imagica Theme Park has 25 rides and 14 water slides in Aquamagica. Revenue mix: 75% from ticket sales, 17-18% for F&B and 7-8% from retail & merchandise. All the restaurants are owned by the company—6 restaurants at the theme park and 3 at the water park. The company has 4 banquet halls with a capacity of close to 2,000 each. Intellectual property rights: The company has ownership of all the IPRs of characters and other IPRs. This has a huge monetisation potential by way of sale of merchandise etc. Imagica’s products are available on all online stores. Footfalls: 1.7mn in 18 months of operation. The company clocked 912061 customers in CY14 in the Imagica Theme Park.

Wonderla Holidays
39 Edelweiss Securities Limited
Entertainment tax: The company has 15% exemption from entertainment tax from the state government for 10 years. Expansion: Adlabs intends to expand to North (Delhi) and South India (Hyderabad) in 3-4 years’ time. The company will not resort to debt to expand, but will scout for strategic partners. The company has finalised land in Hyderabad. It will not duplicate the park in Mumbai in other places. Push strategy: The company is targeting to increase volumes on weekdays and bring in different offers. There are offers targeting schools, groups and corporate. School picnics form 20-22% of the overall footfall. In the past 18 months, a total of 800 schools visited the park, while 500 corporate paid a visit to the park. Travel agent tie up: Imagica has tied up with all large travel agents in Mumbai. In-bound tourists from Maharashtra in Mumbai is 35mn. The company has also tied up with bus operators and offers home to home pick up packages as well. Online sales: The company is also focusing on increasing its online presence. 18-20% of overall ticket sales are through the online channel. The company has also started cash on delivery for buying tickets. Proximity: Imagica is 1.2 hours drive away from Mumbai and Pune. It is 6km away from Khopoli station. The company also provides free shuttle service to and from Khopoli station at designated intervals. PE players: The 2 PE players—ICICI Ventures and Jacob Balls—will continue to remain invested even after the IPO. Power: The company has invested heavily in a power station and is connected to the national power grid. Chart 1: Quarterly footfall trend of Adlabs Imagica
Source: Company, Edelweiss research
0
80,000
160,000
240,000
320,000
400,000
Q1FY14 Q2FY14 Q3FY14 Q4FY14 Q1FY15 Q2FY15 Q3FY15
(Nos
.)
Footfalls

Retail
40 Edelweiss Securities Limited
Table 1: Adlabs Imagica ticket pricing
Source: Company, Edelweiss research
Table 2: Key financial metrics of Imagica and Wonderla
Source: Company, Edelweiss research
*Footfalls in CY14
**Total debt for Wonderla
Essel World
Essel World is one of the oldest large theme parks in India. Like Imagica, Essel World has 2 amusement parks—Essel World (for land rides) and Water Kingdom (water park). The park is spread over a combined area of 64 acres. Essel World has a total of about 31 rides (13 family rides, 9 adrenaline-pumping thrill rides and 9 children’s rides). Apart from the water slides, it also has an ice skating rink, a dance floor and bowling alley. In terms of footfalls, it garners around 1.8mn visitors annually, of which 17% are students. Recently, Essel World launched a new ride at its park Shot N Drop—India’s tallest tower ride. The company is also considering opening a resort.
IMAGICA Adult Child Senior Citizen Adult Child Senior CitizenRegular 1,500 1,200 1,200 1,900 1,600 1,600 Imagica Express 2,200 2,000 2,000 3,000 2,600 2,600 College Pack 1,300 NA NA 1,500 NA NASchool Pack NA 800-1000 NA NA 1200-1300 NAAQUAMAGICARegular 950 650 650 1,150 800 800 College Pack 800 NA NA 950 NA NA
Weekdays Weekends and holidays
Adlabs Imagica (including Aquamagica) Wonderla Bengaluru Wonderla Kochi
Total Area (in acres) 300 81.75 93.17
Total Area uti l ised(in acres) 132 39.2 28.75
Rides (Land + Water) 40 59 62
Ticket price in INR (weekdays) 1500 700 580
Ticket price in INR (weekends) 1900 870 730
Waterpark ticket price in INR (weekdays) 950 No separate charges No separate charges
Waterpark ticket price in INR (weekends) 1150 No separate charges No separate charges
Hotel rooms 287 84 NA
Footfalls (in mn) in FY14 0.91* 1.18 1.12
Cost of project (INR mn) 16504 950 200
Revenues (INR mn) for FY14 1,069 838 628
EBITDA (INR mn) for FY14 69.7 457 294
EBITDA margins (%) 6.5 54.6 46.8
Proportion of Non ticketing revenues (%) ~25.0 16.0 15.0
Total debt as on 30th September 2014 (INR mn) 12,772 123.0**

Wonderla Holidays
41 Edelweiss Securities Limited
Table 3: Key financial metrics of Essel World
Source: Company, Edelweiss research
Walt Disney
The Walt Disney Company is a diversified worldwide entertainment company with operations in 5 business categories—Media Network, Parks & Resorts, Studio Entertainment, Consumer Products and Interactive. Walt Disney Parks & Resorts is one of the famous amusement parks in the US. The theme park is one of the company’s core businesses. It operates 11 parks which attracted 132.5mn guests according to the 2013 Global Attractions Attendance Report by industry monitors AECOM Economics and the Themed Entertainment Association (TEA). The theme park concept was an instant hit and led to the opening of 1971 Disney World—a resort comprising 4 theme parks in Florida. It was followed by theme parks in Tokyo, Paris and Hong Kong. Walt Disney Parks & Resorts earns majority revenue via sale of tickets, which is used to cover the cost and very little flows to the bottom line. The huge profit reported by the parks and resorts is not only due to tickets sales, but also due to money made on sale of merchandise and food & beverages. The huge profits are invested back in to theme parks to include new rides, to attract new customers. The reason behind the success of theme park is that all Disneyland park rides are based on themes which catch the attention of customers.
INR mn FY14 FY13Total revenues 1,049 977 Total operating expenses 713 654 EBITDA 336 323 EBITDA margins (%) 32 33 PAT 156 162 Proportion of revenue from non ticketing items (%) 10 9 Total debt 779 546 Cash and bank balances 70 218 Net debt 710 328

Retail
42 Edelweiss Securities Limited
Chart 2: Walt Disney’s revenues from park and resorts
Source:Company, Edelweiss research
Chart 3: Parks and resorts – Operating profit
Source: Company, Edelweiss research
Cedar Fair About Cedar Fair
Cedar Fair owns and operates one of the leading amusement and water parks in US and Canada. The parks are open daily from 9:00 am to 10:00 pm and are operational for 130 days. The park charges an admission fee which gives the customer unlimited access to use all the rides (except Challenge Park at Cedar Point, Valleyfair, and Thrills Unlimited). As of March 3, 2014, the company owned 11 best-in-class amusement parks, 1 amusement park under contract, 3 outdoor water parks and 5 hotels with ~1,700 rooms.
(16.0)
(8.0)
0.0
8.0
16.0
24.0
0
3,200
6,400
9,600
12,800
16,000
FY01
FY02
FY03
FY04
FY05
FY06
FY07
FY08
FY09
FY10
FY11
FY12
FY13
FY14
(%)
(USD
mn)
Revenues Revenue Growth
(43.0)
(28.8)
(14.6)
(0.4)
13.8
28.0
0
600
1,200
1,800
2,400
3,000
FY01
FY02
FY03
FY04
FY05
FY06
FY07
FY08
FY09
FY10
FY11
FY12
FY13
FY14
(%)
(USD
mn)
Operating Income Operating Income growth

Wonderla Holidays
43 Edelweiss Securities Limited
Table 4: Location of Cedar Fair parks
Source: Company, Edelweiss research
Cedar Point
Cedar Fair’s flagship park, Cedar Point, approximately 60 miles West of Cleveland, is the largest seasonal amusement park in the US. It was first developed as a recreational area in 1870. It serves ~26mn people from 6 states—Ohio & Michigan, Western Pennsylvania & New York, northern West Virginia and Indiana and southwestern Ontario, Canada. The park has 56 rides including 15 world class roller coasters. It is situated on ~365 acres excluding the 60 acres property adjoining the approach to the Cedar Point Causeway. It has been voted the ‘Best Amusement Park in the World’ in Amusement Today’s international survey for 16 consecutive years. Cedar Point also operates 4 hotels. The park’s largest hotel Hotel Breakers has ~600 rooms. The other hotel, Castaway Bay, has 237 rooms centered around a 38,000 square foot indoor water park. Fig. 1: Roller Coaster at Cedar Fair
Source: Company
Parks LocationCedar Point OhioKings Island OhioCanada's Wonderland CanadaDorney Park & Wildwater Kingdom PennsylvaniaValleyfair MinnesotaMichigan's Adventure MichiganKings Dominion VirginiaCarowinds North CarolinaWorlds of Fun MissouriKnott's Berry Farm CaliforniaCalifornia's Great America California

Retail
44 Edelweiss Securities Limited
Financials
The company generates revenue from sale of tickets, food, merchandise and games inside the park and hotel rooms outside the park. The main expense includes salaries & wages, advertising, maintenance and operating supplies. Expenses are more or less fixed and do not vary with attendance. Total revenue increased by 8.6% CAGR from FY04 till FY13 supported by admission revenue, which clocked 9.9% CAGR and accommodation revenue posted 10.4% CAGR over FY04-13. Admission revenue as a percentage of total revenue has remained in the 50-60% range over FY04-13.
Table 5: Key metrics of Cedar Fair
Source: Company, Edelweiss research
To attract audience during the operating season, the park conducts internet campaigns apart from radio and television campaigns. These campaigns help the company market itself to 2 important demographic groups—students from 12- 24 years and families. Chart 4: Revenue and revenue growth at Cedar Fair
Source: Company, Edelweiss research
% of Revenue FY04 FY05 FY06 FY07 FY08 FY09 FY10 FY11 FY12 FY13 Admissions 51.1 51.4 55.3 55.9 56.8 58.2 58.2 57.9 57.3 57.0 Food, Merchandise & Games 39.0 38.5 36.9 36.5 35.7 34.5 34.5 34.0 32.0 31.4 Accommodations & Other 10.0 10.1 7.8 7.6 7.4 7.3 7.3 8.1 10.7 11.6
(10.0)
3.2
16.4
29.6
42.8
56.0
381.0
577.2
773.4
969.6
1,165.8
1,362.0
FY09 FY10 FY11 FY12 FY13
(%)
(USD
mn)
Revenue Revenue growth

Wonderla Holidays
45 Edelweiss Securities Limited
Chart 5: EBITDA and EBITDA margins at Cedar Fair
Source: Company, Edelweiss research
Growth strategy
Cedar Fair has outlined its long-term growth strategy—FUNforward—in FY11, via which the company will provide exciting, quality experiences with the greatest thrill rides and family attractions to consumers. Some of the components of FUNforward are:
• Enhanced guest experience: The company will continue to add new rides and attractions which will give consumers the experience and value which is far more than the admission ticket price.
• Premium product offering: The company will provide premium offerings for benefits oriented guests. For instance, it will provide exclusive parking and elite dinner experience to premium customers.
These offerings have helped Cedar Fair garner higher revenue . Cedar Fair has also introduced a system wherein it charges more to cut wait times for its popular rides. It was first tested on Kings Island, Cedar Point’s sister property near Cincinnati. The strategy worked well as per the company and was later introduced at all the other Cedar Fair parks in 2012. Attendance in the park jumped significantly in CY06 compared to CY05 due to acquisition of Paramount Parks business which resulted in addition of 5 parks to Cedar Fair’s portfolio.
25.0
29.0
33.0
37.0
41.0
45.0
122
198
274
350
426
502
FY09 FY10 FY11 FY12 FY13
(%)
(USD
mn)
EBITDA EBITDA margin

Retail
46 Edelweiss Securities Limited
Chart 6: Cedar Fair attendance per park
Source: Company, Edelweiss research
Chart 7: Average amount spend by a guest in the park at Cedar Fair
Source: Company, Edelweiss research
0.00
0.50
1.00
1.50
2.00
2.50
10
14
18
21
25
29
CY04 CY05 CY06 CY07 CY08 CY09 CY10 CY11 CY12 CY13
(mn)
(mn)
Theme park attendance Attendance per park
31
35
40
44
49
53
CY09 CY10 CY11 CY12 CY13
(USD
mn)
Average in park guest spending (USD)
Average in park guest spending (USD)

Wonderla Holidays
47 Edelweiss Securities Limited
Snapshots of the Hyderabad park under construction Fig. 2: Construction of approach road Fig. 3: Construction of entrance building
Fig. 4: Construction of Tower Building Fig. 5: Construction of Wonder Splash
Source: Company
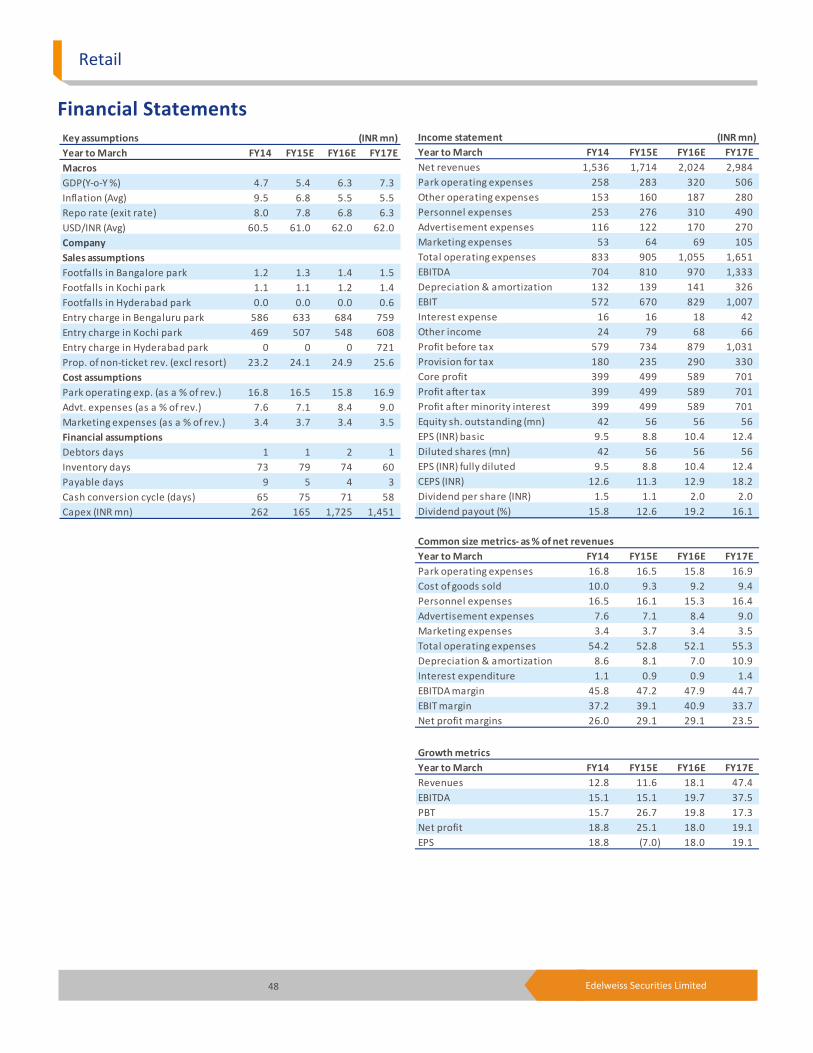
48 Edelweiss Securities Limited
Retail
Financial Statements
Key assumptions (INR mn)Year to March FY14 FY15E FY16E FY17EMacrosGDP(Y-o-Y %) 4.7 5.4 6.3 7.3Inflation (Avg) 9.5 6.8 5.5 5.5Repo rate (exit rate) 8.0 7.8 6.8 6.3USD/INR (Avg) 60.5 61.0 62.0 62.0Company Sales assumptionsFootfalls in Bangalore park 1.2 1.3 1.4 1.5Footfalls in Kochi park 1.1 1.1 1.2 1.4Footfalls in Hyderabad park 0.0 0.0 0.0 0.6Entry charge in Bengaluru park 586 633 684 759Entry charge in Kochi park 469 507 548 608Entry charge in Hyderabad park 0 0 0 721Prop. of non-ticket rev. (excl resort) 23.2 24.1 24.9 25.6Cost assumptionsPark operating exp. (as a % of rev.) 16.8 16.5 15.8 16.9Advt. expenses (as a % of rev.) 7.6 7.1 8.4 9.0Marketing expenses (as a % of rev.) 3.4 3.7 3.4 3.5Financial assumptionsDebtors days 1 1 2 1Inventory days 73 79 74 60Payable days 9 5 4 3Cash conversion cycle (days) 65 75 71 58Capex (INR mn) 262 165 1,725 1,451
Income statement (INR mn)Year to March FY14 FY15E FY16E FY17ENet revenues 1,536 1,714 2,024 2,984 Park operating expenses 258 283 320 506 Other operating expenses 153 160 187 280 Personnel expenses 253 276 310 490 Advertisement expenses 116 122 170 270 Marketing expenses 53 64 69 105 Total operating expenses 833 905 1,055 1,651 EBITDA 704 810 970 1,333 Depreciation & amortization 132 139 141 326 EBIT 572 670 829 1,007 Interest expense 16 16 18 42 Other income 24 79 68 66 Profit before tax 579 734 879 1,031 Provision for tax 180 235 290 330 Core profit 399 499 589 701 Profit after tax 399 499 589 701 Profit after minority interest 399 499 589 701 Equity sh. outstanding (mn) 42 56 56 56 EPS (INR) basic 9.5 8.8 10.4 12.4 Diluted shares (mn) 42 56 56 56 EPS (INR) fully diluted 9.5 8.8 10.4 12.4 CEPS (INR) 12.6 11.3 12.9 18.2 Dividend per share (INR) 1.5 1.1 2.0 2.0 Dividend payout (%) 15.8 12.6 19.2 16.1
Common size metrics- as % of net revenuesYear to March FY14 FY15E FY16E FY17EPark operating expenses 16.8 16.5 15.8 16.9 Cost of goods sold 10.0 9.3 9.2 9.4 Personnel expenses 16.5 16.1 15.3 16.4 Advertisement expenses 7.6 7.1 8.4 9.0 Marketing expenses 3.4 3.7 3.4 3.5 Total operating expenses 54.2 52.8 52.1 55.3 Depreciation & amortization 8.6 8.1 7.0 10.9 Interest expenditure 1.1 0.9 0.9 1.4 EBITDA margin 45.8 47.2 47.9 44.7 EBIT margin 37.2 39.1 40.9 33.7 Net profit margins 26.0 29.1 29.1 23.5
Growth metricsYear to March FY14 FY15E FY16E FY17ERevenues 12.8 11.6 18.1 47.4EBITDA 15.1 15.1 19.7 37.5PBT 15.7 26.7 19.8 17.3Net profit 18.8 25.1 18.0 19.1EPS 18.8 (7.0) 18.0 19.1

49 Edelweiss Securities Limited
Wonderla Holidays
Balance sheet (INR mn)As on 31st March FY14 FY15E FY16E FY17EShare capital 420 565 565 565 Reserves & surplus 1,079 3,027 3,483 4,019 Shareholders funds 1,499 3,591 4,048 4,584 Long term borrowings 203 200 250 800 Loan funds 203 200 250 800 Deferred tax liability/asset 33 33 33 33 Sources of funds 1,736 3,825 4,332 5,418 Tangible assets 1,450 1,345 1,524 4,149 Total CWIP 205 315 1,720 220 Total net fixed assets 1,655 1,660 3,244 4,369 Current investments - 2,000 1,000 500 Cash and cash equivalents 200 333 335 819 Inventories 33 35 40 52 Sundry debtors 3 8 10 11 Loans & advances 72 51 65 69 Other assets 38 0 2 2 Total current assets (ex cash) 147 2,094 1,117 634 Current Liabilities 126 105 205 208 Provisions 141 156 159 196 Total CL & provisions 267 261 364 404 Net current assets (ex cash) (120) 1,833 753 230 Application of funds 1,736 3,825 4,332 5,418 Book value per share 36 64 72 81
Free cash flow (INR mn)Year to March FY14 FY15E FY16E FY17ENet profit 399 499 589 701 Depreciation 132 139 141 326 Deferred tax (3) - - - Others 191 251 308 372 Gross cash flow 719 889 1,038 1,399 Less: Changes in WC 19 (48) (80) (23) Operating cash flow 700 937 1,118 1,422 Less: Capex 262 165 1,725 1,451 Free cash flow 438 771 (607) (30)
Peer comparison valuation
Market cap Diluted PE (X) EV/EBITDA (X) ROAE (%)
Name (USD mn) FY15E FY16E FY15E FY16E FY15E FY16E
Wonderla Holidays 249 31.4 26.6 16.7 15.0 15.4 16.2
Titan Company 6,019 45.8 36.7 30.6 25.1 29.4 30.2
Future Retail 719 (57.7) 60.9 5.7 5.0 (1.3) 1.2
Jubilant Foodworks 1,677 84.4 55.8 39.7 26.2 20.4 24.5
Shoppers Stop 641 227.4 116.9 24.3 19.7 3.5 6.6
Median - 64.9 58.4 27.3 22.3 11.9 15.6
AVERAGE - 74.9 67.5 25.0 18.9 13.0 15.6
Source: Edelweiss research
Cash flow metrices (INR mn)Year to March FY14 FY15E FY16E FY17EOperating cash flow 700 937 1,118 1,422 Financing cash flow (71) 1,549 (100) 343 Investing cash flow (259) (2,165) (725) (951) Net cash flow 370 320 293 813 Capex 262 165 1,725 1,451
Profitability & liquidity ratiosYear to March FY14 FY15E FY16E FY17EROAE (%) 29.6 19.6 15.4 16.2 ROACE (%) 35.8 37.7 32.1 24.4 Debtors days 1.0 1.2 1.6 1.2 Inventory days 73 79 74 60 Fixed assets t/o 1.0 1.0 0.8 0.8 Debt/Equity 0.1 0.1 0.1 0.2 Interest coverage 35 42 46 24 Payable days 9 5 4 3 Current ratio 1.3 9.3 4.0 3.6 Debt/EBITDA 0.3 0.2 0.3 0.6
Operating ratiosYear to March FY14 FY15E FY16E FY17ETotal asset turnover 1.0 0.6 0.5 0.6 Fixed asset turnover 1.0 1.0 0.8 0.8 Equity turnover 1.1 0.7 0.5 0.7
Valuation parametersYear to March FY14 FY15E FY16E FY17EEPS (INR) fully diluted 9.5 8.8 10.4 12.4 Y-o-Y growth (%) 18.8 (7.0) 18.0 19.1 CEPS 12.6 11.3 12.9 18.2 Diluted P/E (x) 29.2 31.4 26.6 22.3 Price/BV (x) 7.8 4.4 3.9 3.4 EV/Sales (x) 7.6 7.9 7.2 5.1 EV/EBITDA (X) 16.5 16.7 15.0 11.4 Dividend yield (%) 0.5 0.4 0.7 0.7
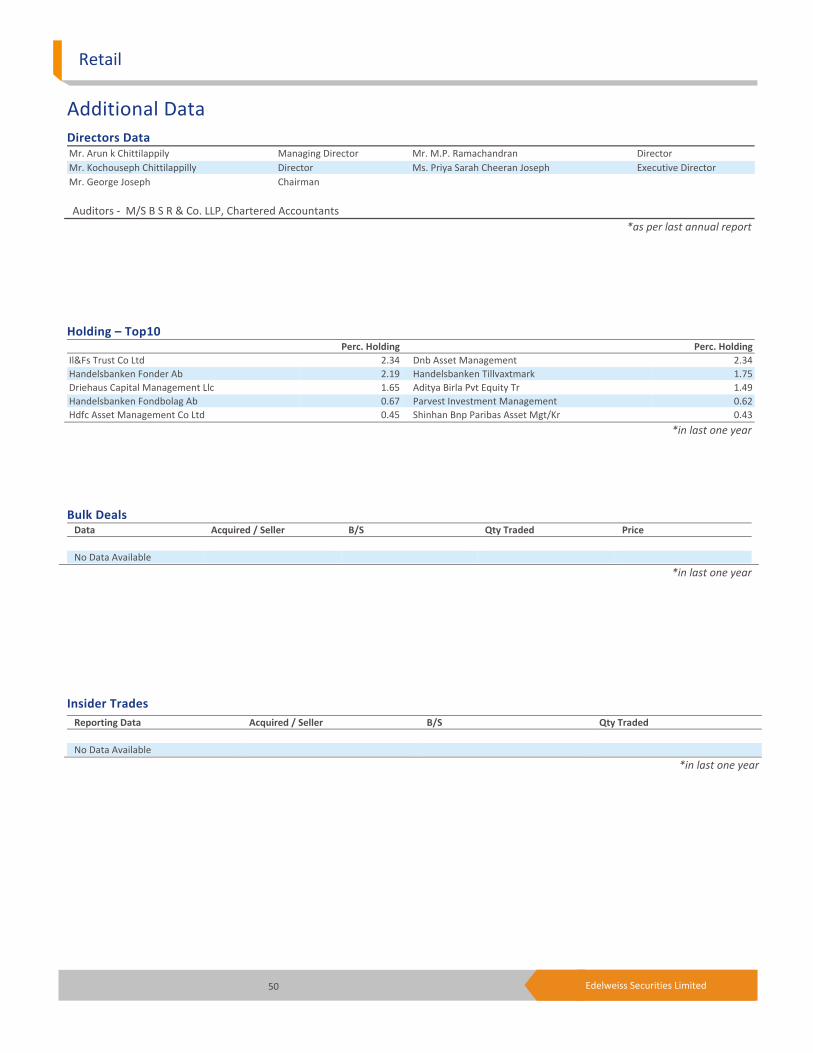
50 Edelweiss Securities Limited
Retail
Insider Trades Reporting Data Acquired / Seller B/S Qty Traded No Data Available
*in last one year
Bulk Deals Data Acquired / Seller B/S Qty Traded Price No Data Available
*in last one year
Holding – Top10 Perc. Holding Perc. Holding
Il&Fs Trust Co Ltd 2.34 Dnb Asset Management 2.34Handelsbanken Fonder Ab 2.19 Handelsbanken Tillvaxtmark 1.75Driehaus Capital Management Llc 1.65 Aditya Birla Pvt Equity Tr 1.49Handelsbanken Fondbolag Ab 0.67 Parvest Investment Management 0.62Hdfc Asset Management Co Ltd 0.45 Shinhan Bnp Paribas Asset Mgt/Kr 0.43
*in last one year
Additional Data
Directors Data Mr. Arun k Chittilappily Managing Director Mr. M.P. Ramachandran DirectorMr. Kochouseph Chittilappilly Director Ms. Priya Sarah Cheeran Joseph Executive DirectorMr. George Joseph Chairman
Auditors - M/S B S R & Co. LLP, Chartered Accountants *as per last annual report

51 Edelweiss Securities Limited
Company Absolute
reco
Relative
reco
Relative
risk
Company Absolute
reco
Relative
reco
Relative
Risk
Future Retail HOLD SU H Jubilant Foodworks BUY SP M
Shoppers Stop BUY SP L Titan Company BUY SO L
Wonderla BUY SP M
RATING & INTERPRETATION
ABSOLUTE RATING
Ratings Expected absolute returns over 12 months
Buy More than 15%
Hold Between 15% and - 5%
Reduce Less than -5%
RELATIVE RETURNS RATING
Ratings Criteria
Sector Outperformer (SO) Stock return > 1.25 x Sector return
Sector Performer (SP) Stock return > 0.75 x Sector return
Stock return < 1.25 x Sector return
Sector Underperformer (SU) Stock return < 0.75 x Sector return
Sector return is market cap weighted average return for the coverage universe within the sector
RELATIVE RISK RATING
Ratings Criteria
Low (L) Bottom 1/3rd percentile in the sector
Medium (M) Middle 1/3rd percentile in the sector
High (H) Top 1/3rd percentile in the sector
Risk ratings are based on Edelweiss risk model
SECTOR RATING
Ratings Criteria
Overweight (OW) Sector return > 1.25 x Nifty return
Equalweight (EW) Sector return > 0.75 x Nifty return
Sector return < 1.25 x Nifty return
Underweight (UW) Sector return < 0.75 x Nifty return

52 Edelweiss Securities Limited
Retail
Edelweiss Securities Limited, Edelweiss House, off C.S.T. Road, Kalina, Mumbai – 400 098. Board: (91-22) 4009 4400, Email: [email protected]
Nischal Maheshwari
Head Research
Coverage group(s) of stocks by primary analyst(s): Retail Future Retail, Jubilant Foodworks, Shoppers Stop, Titan Company
Distribution of Ratings / Market Cap
Edelweiss Research Coverage Universe
Rating Distribution* 150 46 10 207* 1 stocks under review
Market Cap (INR) 143 58 6
Date Company Title Price (INR) Recos
Recent Research
25-Feb-15 Titan Company
Evolving with times; Visit Note
422 Buy
05-Feb-15 Jubilant Foodworks
Tasty bite; Result Update
1,432 Buy
05-Feb-15 Retail Yum! Brands: Performance continues to be soft; EdelFlash
> 50bn Between 10bn and 50 bn < 10bn
Buy Hold Reduce Total
Rating Interpretation
Buy appreciate more than 15% over a 12-month period
Hold appreciate up to 15% over a 12-month period
Reduce depreciate more than 5% over a 12-month period
Rating Expected to
One year price chart
100
160
220
280
340
400
May
14
Jun
14
Jul 1
4
Aug
14
Sep
14
Oct
14
Nov
14
Dec
14
Jan
15
Feb
15
Mar
15
(INR)
Wonderla Holidays

53 Edelweiss Securities Limited
Wonderla Holidays
DISCLAIMER This report has been prepared by Edelweiss Securities Limited (Edelweiss). This report does not constitute an offer or solicitation for the purchase or sale of any financial instrument or as an official confirmation of any transaction. The information contained herein is from publicly available data or other sources believed to be reliable. This report is provided for assistance only and is not intended to be and must not alone be taken as the basis for an investment decision. The user assumes the entire risk of any use made of this information. Each recipient of this report should make such investigation as it deems necessary to arrive at an independent evaluation of an investment in the securities of companies referred to in this document (including the merits and risks involved), and should consult his own advisors to determine the merits and risks of such investment. The investment discussed or views expressed may not be suitable for all investors. This information is strictly confidential and is being furnished to you solely for your information. This information should not be reproduced or redistributed or passed on directly or indirectly in any form to any other person or published, copied, in whole or in part, for any purpose. This report is not directed or intended for distribution to, or use by, any person or entity who is a citizen or resident of or located in any locality, state, country or other jurisdiction, where such distribution, publication, availability or use would be contrary to law, regulation or which would subject Edelweiss and affiliates/ group companies to any registration or licensing requirements within such jurisdiction. The distribution of this report in certain jurisdictions may be restricted by law, and persons in whose possession this report comes, should observe, any such restrictions. The information given in this report is as of the date of this report and there can be no assurance that future results or events will be consistent with this information. This information is subject to change without any prior notice. Edelweiss reserves the right to make modifications and alterations to this statement as may be required from time to time. Edelweiss or any of its affiliates/ group companies shall not be in any way responsible for any loss or damage that may arise to any person from any inadvertent error in the information contained in this report. Edelweiss is committed to providing independent and transparent recommendation to its clients. Neither Edelweiss nor any of its affiliates, group companies, directors, employees, agents or representatives shall be liable for any damages whether direct, indirect, special or consequential including loss of revenue or lost profits that may arise from or in connection with the use of the information. Past performance is not necessarily a guide to future performance. The disclosures of interest statements incorporated in this report are provided solely to enhance the transparency and should not be treated as endorsement of the views expressed in the report. The information provided in these reports remains, unless otherwise stated, the copyright of Edelweiss. All layout, design, original artwork, concepts and other Intellectual Properties, remains the property and copyright of Edelweiss and may not be used in any form or for any purpose whatsoever by any party without the express written permission of the copyright holders. Edelweiss shall not be liable for any delay or any other interruption which may occur in presenting the data due to any reason including network (Internet) reasons or snags in the system, break down of the system or any other equipment, server breakdown, maintenance shutdown, breakdown of communication services or inability of the Edelweiss to present the data. In no event shall the Edelweiss be liable for any damages, including without limitation direct or indirect, special, incidental, or consequential damages, losses or expenses arising in connection with the data presented by the Edelweiss through this report. Analyst Certification:
The analyst for this report certifies that all of the views expressed in this report accurately reflect his or her personal views about the subject company or companies and its or their securities, and no part of his or her compensation was, is or will be, directly or indirectly related to specific recommendations or views expressed in this report.
Additional Disclaimers
Disclaimer for U.S. Persons
This research report is a product of Edelweiss Securities Limited, which is the employer of the research analyst(s) who has prepared the research report. The research analyst(s) preparing the research report is/are resident outside the United States (U.S.) and are not associated persons of any U.S. regulated broker-dealer and therefore the analyst(s) is/are not subject to supervision by a U.S. broker-dealer, and is/are not required to satisfy the regulatory licensing requirements of FINRA or required to otherwise comply with U.S. rules or regulations regarding, among other things, communications with a subject company, public appearances and trading securities held by a research analyst account. This report is intended for distribution by Edelweiss Securities Limited only to "Major Institutional Investors" as defined by Rule 15a-6(b)(4) of the U.S. Securities and Exchange Act, 1934 (the Exchange Act) and interpretations thereof by U.S. Securities and Exchange Commission (SEC) in reliance on Rule 15a 6(a)(2). If the recipient of this report is not a Major Institutional Investor as specified above, then it should not act upon this report and return the same to the sender. Further, this report may not be copied, duplicated and/or transmitted onward to any U.S. person, which is not the Major Institutional Investor.

54 Edelweiss Securities Limited
Retail
Access the entire repository of Edelweiss Research on www.edelresearch.com
In reliance on the exemption from registration provided by Rule 15a-6 of the Exchange Act and interpretations thereof by the SEC in order to conduct certain business with Major Institutional Investors, Edelweiss Securities Limited has entered into an agreement with a U.S. registered broker-dealer, Enclave Capital, LLC ("Enclave"). Transactions in securities discussed in this research report should be effected through Enclave Capital, LLC. Disclaimer for U.K. Persons
The contents of this research report have not been approved by an authorised person within the meaning of the Financial Services and Markets Act 2000 ("FSMA"). In the United Kingdom, this research report is being distributed only to and is directed only at (a) persons who have professional experience in matters relating to investments falling within Article 19(5) of the FSMA (Financial Promotion) Order 2005 (the “Order”); (b) persons falling within Article 49(2)(a) to (d) of the Order (including high net worth companies and unincorporated associations); and (c) any other persons to whom it may otherwise lawfully be communicated (all such persons together being referred to as “relevant persons”). This research report must not be acted on or relied on by persons who are not relevant persons. Any investment or investment activity to which this research report relates is available only to relevant persons and will be engaged in only with relevant persons. Any person who is not a relevant person should not act or rely on this research report or any of its contents. This research report must not be distributed, published, reproduced or disclosed (in whole or in part) by recipients to any other person. Disclaimer for Canadian Persons
This research report is a product of Edelweiss Securities Limited ("ESL"), which is the employer of the research analysts who have prepared the research report. The research analysts preparing the research report are resident outside the Canada and are not associated persons of any Canadian registered adviser and/or dealer and, therefore, the analysts are not subject to supervision by a Canadian registered adviser and/or dealer, and are not required to satisfy the regulatory licensing requirements of the Ontario Securities Commission, other Canadian provincial securities regulators, the Investment Industry Regulatory Organization of Canada and are not required to otherwise comply with Canadian rules or regulations regarding, among other things, the research analysts' business or relationship with a subject company or trading of securities by a research analyst. This report is intended for distribution by ESL only to "Permitted Clients" (as defined in National Instrument 31-103 ("NI 31-103")) who are resident in the Province of Ontario, Canada (an "Ontario Permitted Client"). If the recipient of this report is not an Ontario Permitted Client, as specified above, then the recipient should not act upon this report and should return the report to the sender. Further, this report may not be copied, duplicated and/or transmitted onward to any Canadian person. ESL is relying on an exemption from the adviser and/or dealer registration requirements under NI 31-103 available to certain international advisers and/or dealers. Please be advised that (i) ESL is not registered in the Province of Ontario to trade in securities nor is it registered in the Province of Ontario to provide advice with respect to securities; (ii) ESL's head office or principal place of business is located in India; (iii) all or substantially all of ESL's assets may be situated outside of Canada; (iv) there may be difficulty enforcing legal rights against ESL because of the above; and (v) the name and address of the ESL's agent for service of process in the Province of Ontario is: Bamac Services Inc., 181 Bay Street, Suite 2100, Toronto, Ontario M5J 2T3 Canada. Disclosures under the provisions of SEBI (Research Analysts) Regulations 2014 (Regulations)
Edelweiss Securities Limited (“ESL” or “Research Entity”) is regulated by the Securities and Exchange Board of India (“SEBI”) and is licensed to carry on the business of broking, depository services and related activities. The business of ESL and its associates are organized around five broad business groups – Credit including Housing and SME Finance, Commodities, Financial Markets, Asset Management and Life Insurance. There were no instances of non-compliance by ESL on any matter related to the capital markets, resulting in significant and material disciplinary action during the last three years except that ESL had submitted an offer of settlement with Securities and Exchange commission, USA (SEC) and the same has been accepted by SEC without admitting or denying the findings in relation to their charges of non registration as a broker dealer. Research reports are distributed as per Regulation 22(1) of the Regulations. An application is filed for obtaining registration under Regulation 3 of the Regulations.
Copyright 2009 Edelweiss Research (Edelweiss Securities Ltd). All rights reserved