worcestershire minerals local plan background … minerals local plan background document: analysis...
TRANSCRIPT

Worcestershire Minerals Local Plan Background Document: Analysis of Mineral Resources in Worcestershire, August 2016
Page | 1
www.worcestershire.gov.uk
Worcestershire Minerals Local Plan Background Document
Analysis of Mineral Resources in Worcestershire
Consultation Document
August 2016
Document Details:
Date: August 2016
Document Location: www.worcestershire.gov.uk/minerals
Contact: Marianne Joynes
Worcestershire County Council, Directorate of Economy and Infrastructure, Minerals Planning, County Hall, Worcester, WR5 2NP
Email: [email protected]
Tel: 01905 766374
Worcestershire Minerals Local Plan Background Document: Analysis of Mineral Resources in Worcestershire, August 2016
Page | 2
www.worcestershire.gov.uk
Contents 1. Background ....................................................................................................... 3
Purpose of the document ....................................................................................... 3
Overview of the minerals found in Worcestershire ................................................. 3
Sand and Gravel ................................................................................................ 3
Crushed Rock .................................................................................................... 4
Clay ................................................................................................................... 4
Building Stone .................................................................................................... 4
Salt .................................................................................................................... 5
Coal ................................................................................................................... 5
Hydrocarbons .................................................................................................... 5
2. Analysis of non-aggregate minerals ................................................................... 6
Building stone ........................................................................................................ 6
Brick clay ............................................................................................................... 7
Coal ....................................................................................................................... 9
Hydrocarbons: conventional (oil and gas) and unconventional (shale gas) hydrocarbons ....................................................................................................... 10
Salt and brine ...................................................................................................... 10
Silica sand ........................................................................................................... 12
Secondary and recycled aggregates.................................................................... 13
3. Analysis of Aggregate Minerals ........................................................................ 14
Baseline data ....................................................................................................... 14
Minimum size threshold ....................................................................................... 16
Analysing individual deposits ............................................................................... 17
Resource areas where some depth information is available ............................. 19
Resource areas where no depth information is available ................................. 22
Compromised resources .................................................................................. 23
Results of the analysis ......................................................................................... 24
4. Next steps ........................................................................................................ 27
5. Appendices ...................................................................................................... 28

Worcestershire Minerals Local Plan Background Document: Analysis of Mineral Resources in Worcestershire, August 2016
Page | 3
www.worcestershire.gov.uk
1. Background
Purpose of the document
1.1. In order to support the preparation of the Minerals Local Plan, Worcestershire County Council has analysed the available information about the mineral resources which are present in the county in order to evaluate the likelihood of them being suitable and commercially attractive for exploitation during the lifetime of the plan.
1.2. The level of information available for non-aggregate minerals is much less than for aggregate minerals. Section 2 sets out the known information for the non-aggregate minerals in the county but further analysis is not possible at this stage. Section 3 sets out the approach taken to analysing the aggregate minerals in the county and the overall results of the analysis.
Overview of the minerals found in Worcestershire
1.3. Worcestershire has a diverse geology covering 600 million years of earth history.
1.4. In the west, the Malvern Hills run north-south along the county boundary and are largely formed from ancient Precambrian rocks. These are some of the oldest rocks in England and one of the most important basement structures of southern Britain. In the north the county is bounded by the Clent Hills and Lickey Hills, which are formed from Carboniferous and Cambrian rock from the more recent Paleozoic era. Carboniferous formations are also found in the Wyre Forest Area in the form of red mudstone and coal.
1.5. Elsewhere in the county the broad floodplains of the Severn, the Teme Valley and Vale of Evesham are floored by easily eroded mudstones and sandstone of Devonian, Triassic and Jurassic age. In the east of the county, Jurassic mudstone is overlaid by Jurassic sandstones and limestones, which form the limestone escarpment of the Cotswolds.
1.6. Over the past 500,000 years ice sheets and melt water have covered the land surface, and the resulting sediments and alluvium deposited has formed terraces along the major river systems.
Sand and Gravel
Glacial and terrace deposits
1.7. Worcestershire has a history of sand and gravel working along the Severn and Carrant Brook valleys. There have been no recent workings along the Carrant Brook, however working along the Severn Valley is currently on-going at several sites.

Worcestershire Minerals Local Plan Background Document: Analysis of Mineral Resources in Worcestershire, August 2016
Page | 4
www.worcestershire.gov.uk
Solid deposits
1.8. Away from the river valleys, sand and gravel has also been worked north of Bromsgrove in the Wildmoor and Blackwell areas, where moulding and silica sands were once nationally important for the iron founding industry. There are active workings in the Wildmoor area at present.
Summary
1.9. Between 2002 and 2011, an average of 736,000 tonnes of sand and gravel were produced each year in Worcestershire1. There are currently 7 active sand and gravel workings in the county2.
Crushed Rock
1.10. In the past, crushed rock has been worked in the Abberley Hills, Malvern Hills and Fish Hill, an outlier of the Cotswold Hills. Several private Acts of Parliament between 1884 and 1924 established the Malvern Hills Conservators and gave the body the responsibility to protect the beauty of the Malvern Hills from the 'threat' of quarrying. It is therefore unlikely that large scale mineral working will take place in the Malvern Hills in the future, although this is not specifically prevented by the Acts3.
1.11. Between 2002 and 2011 it is estimated that an average of 93,000 tonnes of crushed rock were produced each year in Worcestershire4. However, there are currently no workings or planning permissions for crushed rock in the county as the last site ceased working in 2010 and is currently undergoing restoration5.
Clay
1.12. Clay is widely found across the central area of the county and historically there have been many small-scale local sites. The only place that clay is currently worked in Worcestershire is at Hartlebury, near Kidderminster. There are two operational sites and two associated brick works which together are capable of producing over 2 million bricks per week.
Building Stone
1.13. There are examples of buildings across the county which have been constructed from local stone. This tends to be of poor quality, with the exception of granite found in the Malvern area, particular sandstones found in the north
1 Worcestershire County Council (2014) Annual Monitoring Report: Worcestershire Local
Aggregates Assessment
2 Worcestershire County Council (2014) Annual Monitoring Report
3 See Background Document: The Malvern Hills Acts, available on
www.worcestershire.gov.uk/mineralsbackground
4 Worcestershire County Council (2014) Annual Monitoring Report: Worcestershire Local
Aggregates Assessment
5 As at May 2015.

Worcestershire Minerals Local Plan Background Document: Analysis of Mineral Resources in Worcestershire, August 2016
Page | 5
www.worcestershire.gov.uk
west of the county and Cotswold limestone around Bredon Hill and Broadway. Building stone is not currently worked in Worcestershire6.
Salt
1.14. Salt deposits occur around Droitwich and Stoke Prior in Worcestershire, and brine was extracted from these by pumping until the 1920s and 1970's respectively. The salt and brine resources in Worcestershire are not considered likely to be workable or commercially attractive in the future due to issues relating to ground stability and subsidence7.
Coal
1.15. Coalfields in Worcestershire are restricted to the north of the county, to the west of Kidderminster and just south of Stourbridge. These are part of larger coalfields that extend north of the county. The last coalpit in Worcestershire closed in 1972. No applications for coal working have been received in Worcestershire in the last 25 years and all applications in the 10 years prior to this were refused.
1.16. CoalPro and the Coal Authority have confirmed that there is no surface coal resource in any meaningful sense in Worcestershire8 and that although deep coal reserves do exist at present the cost of establishing new, modern, deep mines would be prohibitive even if suitable resources existed. Both organisations have confirmed that they have no interest in developing new coal mines in the county. They have also confirmed that they are not aware that there are any other minerals that might be viable to extract in association with the coal strata.
Hydrocarbons
1.17. There is no history of "conventional" oil and gas, coalbed methane or unconventional hydrocarbons such as shale gas being working the County. In fact there is currently no evidence that they can be found in Worcestershire.
1.18. Based on current evidence9 the county is not considered prospective for coalbed methane. One exploration well for oil and gas has been drilled in the county and another on the border with Herefordshire, with neither of these discovering oil or gas. Although coal bearing and shale strata exist in the county, there is no evidence to suggest that these contain unconventional hydrocarbons such as shale gas.
6 See Background Document: Building Stone in Worcestershire, available on
www.worcestershire.gov.uk/mineralsbackground
7 See Background Document: Salt and Brine in Worcestershire, available on
www.worcestershire.gov.uk/mineralsbackground
8 At a meeting with WCC Planning Officers at County Hall, Worcester on 13
th August 2013.the
Coal Authority and CoalPro stated that although the BGS geological maps do show coal to be present, in the precise sense that identifiable strata exist within current operational horizons they consider the deposits in Worcestershire to be thin to the point of fragmentary and of no commercial value.
9 "Mineral resource Information for Development Plans: Herefordshire and Worcestershire:
Resources and Constraints." British Geological Survey 1999

Worcestershire Minerals Local Plan Background Document: Analysis of Mineral Resources in Worcestershire, August 2016
Page | 6
www.worcestershire.gov.uk
2. Analysis of non-aggregate minerals
Building stone10
2.1. We know that some sources of building stone in Worcestershire are of local importance. Some building stone quarries that were formerly worked in the county provided building stones for local towns and villages, and in some cases important buildings further afield. These quarries provided a supply of stones that contributed to the local character of Worcestershire by giving its unique and varied geology physical expression in the walls, paving stones, homes, bridges, churches and monuments of the county. These quarries have now all ceased operation – in some cases they have not been worked for decades. There have been no new applications for building stone workings in the county since at least 1990.
2.2. English Heritage has completed a strategic stone survey for the UK. This survey identified 60 building stone quarries within Worcestershire, only one of which is classed as 'active' – this is the quarry near Broadway known as Fish Hill which has in fact recently ceased operation. The owners' website states that "Broadway quarry is now exhausted of its Cotswold Stone reserves and [is] undergoing final restoration"11.
10
For further information on building stone, see the background document Building Stone in Worcestershire, available on www.worcestershire.gov.uk/mineralsbackground
11 Smiths & Sons (2013) Broadway Quarry [online] Available from:
http://www.smithsbletchington.co.uk/broadway Accessed on 12.08.2013

Worcestershire Minerals Local Plan Background Document: Analysis of Mineral Resources in Worcestershire, August 2016
Page | 7
www.worcestershire.gov.uk
Figure 1. Former Building Stone Quarries in Worcestershire
2.3. Any future proposals to work building stone in the county are likely to result from a specific conservation need and would therefore relate to a particular location and specification of material. Given the specific characteristics of building stone and the significant variation between localities, a feasibility assessment of the quality and quantity of stone is likely to be required to ensure compatibility with existing material, and to ensure that enough new stone can be provided within the timescale of the project12. It is not considered practical or appropriate for the council to undertake this assessment for the whole county.
2.4. As building stone workings are likely to be relatively small-scale and limited in number, we will put in place policies to assess proposals if they come forward.
Brick clay
2.5. Clay is used mainly in the manufacture of structural clay products, such as facing and engineering bricks, pavers, clay tiles and vitrified clay pipes, with brick manufacture being the largest use across the UK.13 Clays may also be
12
Jefferson, D., Hanna, S. and Martin, B. (2006) Identifying and Sourcing Stone for Historic Building Repair: An approach to determining and obtaining compatible replacement stone English Heritage.
13 British Geological Survey and Department of the Environment, Transport and the Regions,
1999, Mineral Resource Information for Development Plans. Herefordshire and Worcestershire: Resources and Constraints

Worcestershire Minerals Local Plan Background Document: Analysis of Mineral Resources in Worcestershire, August 2016
Page | 8
www.worcestershire.gov.uk
used for construction fill and for lining and sealing landfill sites.14 The types of clays found in Worcestershire are predominantly used in the manufacture of bricks and related products.
2.6. There are 9 different geological groups in Worcestershire that possess some clay properties. However, modern planning applications for clay extraction in Worcestershire have all been limited to a localised area near to Kidderminster, working the formations of Mercia Mudstone Group. Clay from the Mercia Mudstone Group in this area has consistent forming and firing properties and a relatively low firing temperature.15 Whilst the Mercia Mudstone Group is found extensively across the south west, central and north eastern parts of the county, the suitability of the these formations for brickmaking across the rest of the county is largely unknown.16
Figure 2. Mercia Mudstone Group, Sherwood Sandstone Group and Lias Group in Worcestershire, with historic clay sites shown
2.7. There is a large landbank17 for clay in Worcestershire. Worcestershire contributes approximately 4% to national supply levels and accounts for the 5th
14
British Geological Survey and Department of the Environment, Transport and the Regions, 1999, Mineral Resource Information for Development Plans. Herefordshire and Worcestershire: Resources and Constraints
15 British Geological Survey and Department of the Environment, Transport and the Regions,
1999, Mineral Resource Information for Development Plans. Herefordshire and Worcestershire: Resources and Constraints
16 British Geological Survey and Department of the Environment, Transport and the Regions,
1999, Mineral Resource Information for Development Plans. Herefordshire and Worcestershire: Resources and Constraints
17 In mineral planning, the term “landbank” is used to refer to the stock of reserves of minerals
with planning permission for extraction within a particular area; it can be used as a tool to
Worcestershire Minerals Local Plan Background Document: Analysis of Mineral Resources in Worcestershire, August 2016
Page | 9
www.worcestershire.gov.uk
largest supply level of clay for brick, pipes and tiles from a single mineral planning authority area.
Coal
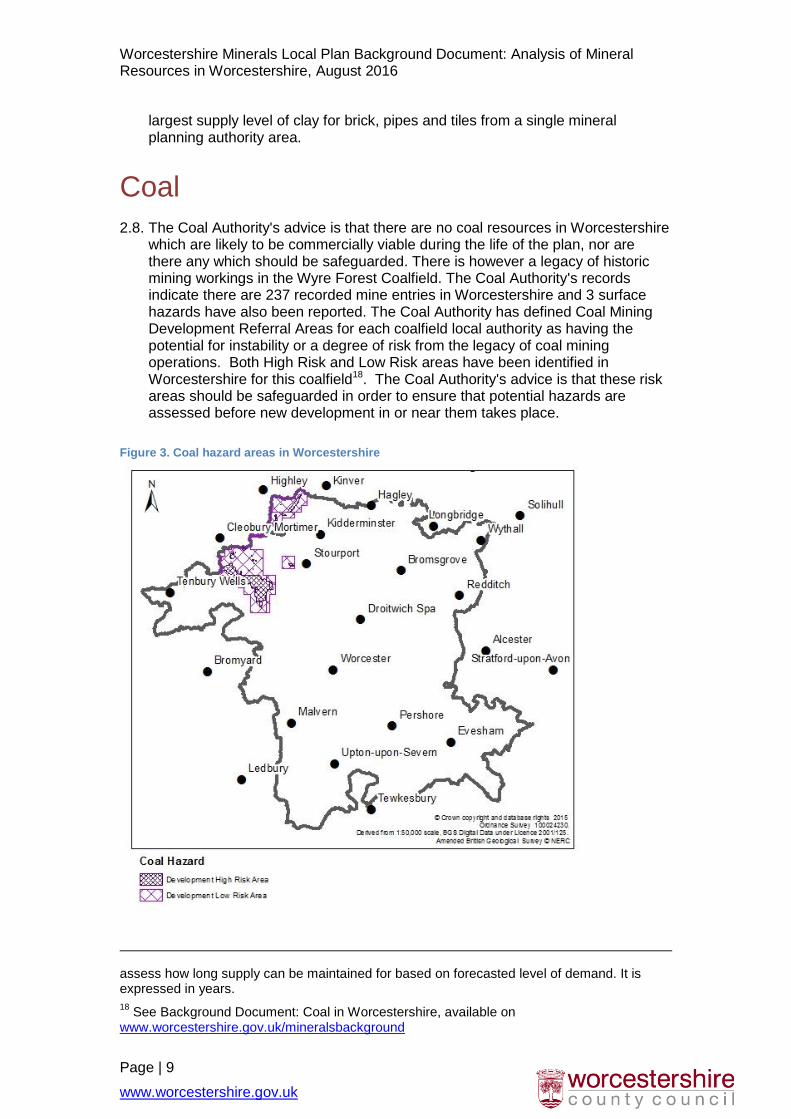
2.8. The Coal Authority's advice is that there are no coal resources in Worcestershire which are likely to be commercially viable during the life of the plan, nor are there any which should be safeguarded. There is however a legacy of historic mining workings in the Wyre Forest Coalfield. The Coal Authority's records indicate there are 237 recorded mine entries in Worcestershire and 3 surface hazards have also been reported. The Coal Authority has defined Coal Mining Development Referral Areas for each coalfield local authority as having the potential for instability or a degree of risk from the legacy of coal mining operations. Both High Risk and Low Risk areas have been identified in Worcestershire for this coalfield18. The Coal Authority's advice is that these risk areas should be safeguarded in order to ensure that potential hazards are assessed before new development in or near them takes place.
Figure 3. Coal hazard areas in Worcestershire
assess how long supply can be maintained for based on forecasted level of demand. It is expressed in years.
18 See Background Document: Coal in Worcestershire, available on
www.worcestershire.gov.uk/mineralsbackground

Worcestershire Minerals Local Plan Background Document: Analysis of Mineral Resources in Worcestershire, August 2016
Page | 10
www.worcestershire.gov.uk
2.9. Evidence suggests that it is extremely unlikely that there will be any interest in working coal in Worcestershire during the lifetime of the Minerals Local Plan19. We will put in place policies to assess proposals if they come forward.
Hydrocarbons: conventional (oil and gas) and unconventional (shale gas) hydrocarbons
2.10. There are no Petroleum Licence Areas in Worcestershire and there is no history of "conventional" oil and gas, coalbed methane or unconventional hydrocarbons such as shale gas being worked in Worcestershire. Coal bearing and shale strata exist in the county, however we are not aware of any evidence to suggest that these contain unconventional hydrocarbons such as shale gas.
2.11. Based on current evidence20 the county is not considered prospective for coalbed methane. One exploration well for oil and gas has been drilled in the county and another on the border with Herefordshire. Neither of these led to the discovery of oil or gas. We will put in place policies to assess proposals if they come forward.
Salt and brine
2.12. Salt (halite) deposits can be found in Worcestershire and brine is created where ground water percolates through and dissolves the rock salt. Brine was extracted by pumping until the 1920s and 1970's in Droitwich and Stoke Prior respectively. The extent of the brine is not mapped but the halite deposit is broadly in the area shown in Figure 4.
19
Background document: “Coal mining in Worcestershire”
(2012) (pg 2) www.worcestershire.gov.uk/mineralsbackground
20 "Mineral Resource Information for Development Plans: Herefordshire and Worcestershire:
Resources and Constraints." British Geological Survey 1999

Worcestershire Minerals Local Plan Background Document: Analysis of Mineral Resources in Worcestershire, August 2016
Page | 11
www.worcestershire.gov.uk
Figure 4. Salt deposits in Worcestershire
2.13. The salt and brine resources in Worcestershire are not considered likely to be workable or commercially attractive in the future due to issues relating to ground stability and subsidence21. However, we will put in place policies to assess proposals if they come forward.
21
Background document: "Salt and brine in Worcestershire" (2012) available on www.worcestershire.gov.uk/mineralsbackground

Worcestershire Minerals Local Plan Background Document: Analysis of Mineral Resources in Worcestershire, August 2016
Page | 12
www.worcestershire.gov.uk
Silica sand
2.14. Silica sand deposits form part of the solid sand deposits in the Wildmoor area near Bromsgrove. Silica sand in the Wildmoor formation is a source of naturally-bonded moulding sand, which was important in the early development of the foundry castings industry but is now much less used22. However it is not easy to identify the sections of the Wildmoor formation where silica sand is found.
Figure 5. Wildmoor sandstone formation
2.15. The properties of naturally-bonded sand cannot be controlled as easily as synthetic foundry sand and this, together with the wider use of chemical binders, has contributed to the decline in their use23. In Worcestershire silica sand is
22
BGS, DETR (1999) Mineral Resource Information for Development Plans, Herefordshire and Worcestershire: Resource Constraints (pg 16).
http://www.bgs.ac.uk/mineralsuk/planning/resource.html
23 BGS, DETR (1999) Mineral Resource Information for Development Plans, Herefordshire
and Worcestershire: Resource Constraints (pg 16).
http://www.bgs.ac.uk/mineralsuk/planning/resource.html
© Crown copyright and database rights 2013 Ordnance Survey 100024230.
Derived from 1:50,000 scale, BGS Digital Data under Licence 2001/125. Amended British Geological Survey © NERC
Worcestershire Minerals Local Plan Background Document: Analysis of Mineral Resources in Worcestershire, August 2016
Page | 13
www.worcestershire.gov.uk
now principally worked as a source of building sand24, the county has sufficient permitted reserves to comply with national planning policy and we have therefore assessed the Wildmoor Formation as an aggregate mineral in Section 3.
Secondary and recycled aggregates
2.16. Secondary aggregates are produced as by-products from other industrial processes. There are currently no industrial processes in Worcestershire which are known to produce secondary aggregates or any waste management facilities that are known to process them.
2.17. A significant amount of recycled aggregates are produced in the county from the management of construction and demolition waste (C&D waste). This could provide up to 420,000 tonnes of recycled aggregates per year25. Provision for recycled aggregates is addressed through the Waste Core Strategy and is monitored through the Annual Monitoring Report under the Waste Core Strategy monitoring indicators. This strategy seeks to achieve enough capacity to recycle 75% of construction and demolition waste.
24
BGS, DETR (1999) Mineral Resource Information for Development Plans, Herefordshire and Worcestershire: Resource Constraints Mineral Resources Map, inset box.
25 See "Waste Core Strategy for Worcestershire" for further details.

Worcestershire Minerals Local Plan Background Document: Analysis of Mineral Resources in Worcestershire, August 2016
Page | 14
www.worcestershire.gov.uk
3. Analysis of Aggregate Minerals
Baseline data
3.1. To analyse the aggregate minerals in the county, we have used digital data provided by the British Geological Survey (1:50,000 scale). We have filtered this data to show (Figure 6):
the terrace and glacial sand and gravel deposits by filtering the superficial deposits data using the BGS Rock Classification Scheme categories of "sand", "sand and gravel" and "gravel";
the solid sand deposits by filtering the bedrock deposit data to show of the "Wildmoor Sandstone Formation" and "Kidderminster Formation";
the crushed rock resources by filtering the bedrock deposit data to show the "Malverns Complex", "Warren House Formation", "Aymestry Limestone Formation", "Woolhope Limestone Formation", "Inferior Oolite Group" and "Lickey Quartzite Formation".
We believe that these are the only strata in the county that have been worked to produce aggregates since 1947.

Worcestershire Minerals Local Plan Background Document: Analysis of Mineral Resources in Worcestershire, August 2016
Page | 15
www.worcestershire.gov.uk
Figure 6. Aggregate mineral deposits in Worcestershire
3.2. To inform the development of the Minerals Local Plan, we have undertaken further analysis of this data to establish which of these deposits is likely to contain a significant amount of mineral resource and may be viable to be worked in the county over the life of the Minerals Local Plan.
© Crown copyright and database rights 2013 Ordnance Survey 100024230.
Derived from 1:50,000 scale, BGS Digital Data under Licence 2001/125. Amended British Geological Survey © NERC
Worcestershire Minerals Local Plan Background Document: Analysis of Mineral Resources in Worcestershire, August 2016
Page | 16
www.worcestershire.gov.uk
Minimum size threshold
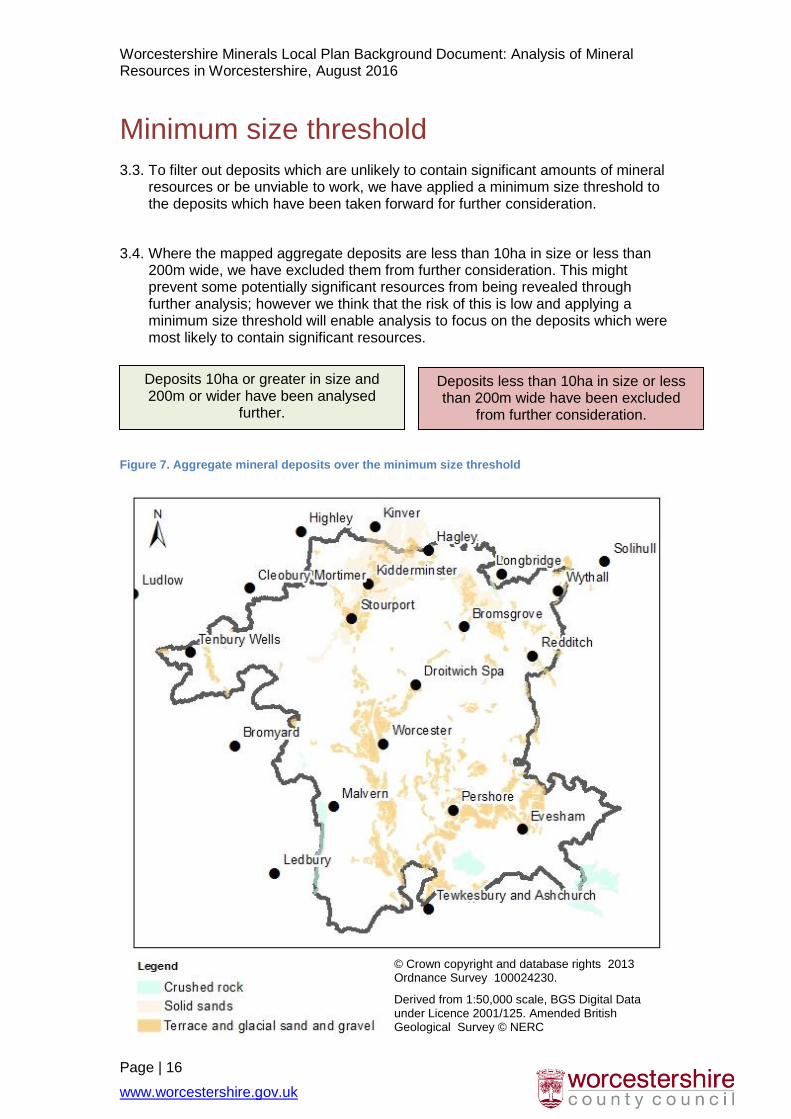
3.3. To filter out deposits which are unlikely to contain significant amounts of mineral resources or be unviable to work, we have applied a minimum size threshold to the deposits which have been taken forward for further consideration.
3.4. Where the mapped aggregate deposits are less than 10ha in size or less than 200m wide, we have excluded them from further consideration. This might prevent some potentially significant resources from being revealed through further analysis; however we think that the risk of this is low and applying a minimum size threshold will enable analysis to focus on the deposits which were most likely to contain significant resources.
Figure 7. Aggregate mineral deposits over the minimum size threshold
Deposits less than 10ha in size or less than 200m wide have been excluded
from further consideration.
Deposits 10ha or greater in size and 200m or wider have been analysed
further.
© Crown copyright and database rights 2013 Ordnance Survey 100024230.
Derived from 1:50,000 scale, BGS Digital Data under Licence 2001/125. Amended British Geological Survey © NERC

Worcestershire Minerals Local Plan Background Document: Analysis of Mineral Resources in Worcestershire, August 2016
Page | 17
www.worcestershire.gov.uk
Analysing individual deposits
3.5. Each mapped deposit has been assessed to identify the significance of the mineral resource using information from the British Geological Survey (BGS) (presented in documents called 'memoirs') and data provided in support of previous planning applications. The amount and quality of information varies significantly for different deposits and different parts of the county.
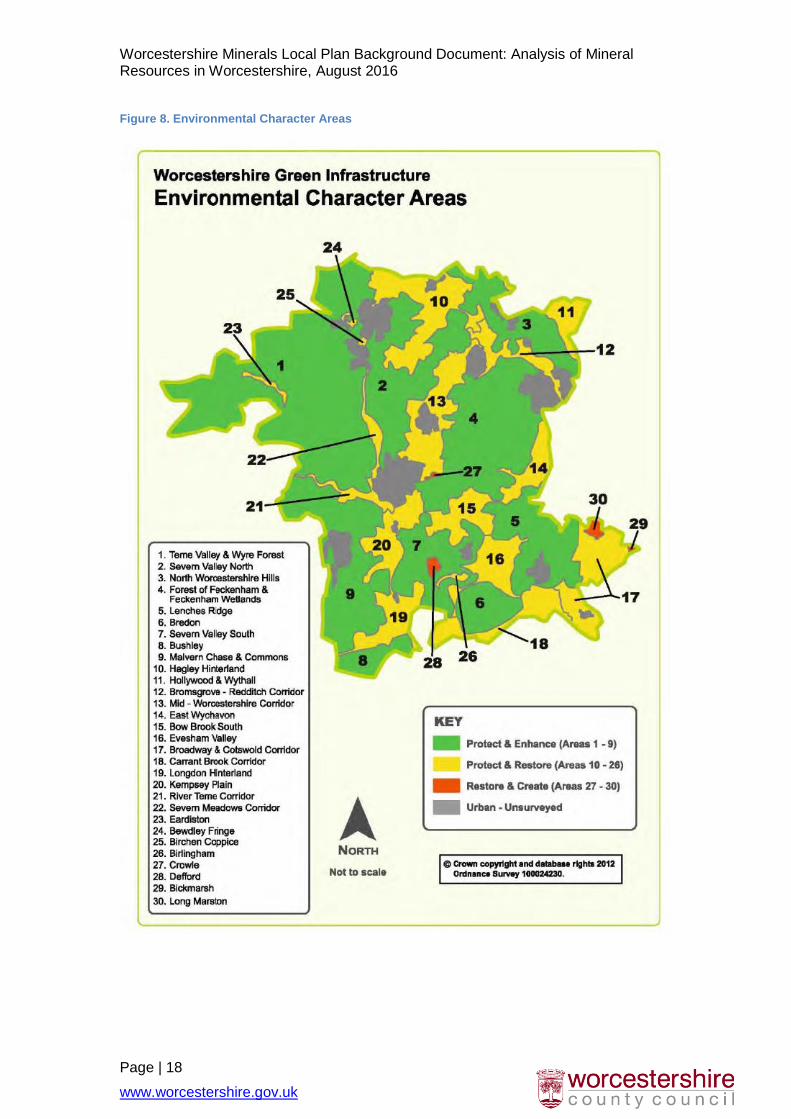
3.6. As there are a significant number of deposits, the analysis has been grouped into different areas of the county. We have used the Environmental Character Areas established as part of the Worcestershire Green Infrastructure Framework as the basis for this grouping26, as well as any relevant urban areas.
2.18. The Environmental Character Areas are:
1. Teme Valley & Wyre Forest
2. Severn Valley North
3. North Worcestershire Hills
4. Forest of Feckenham & Feckenham Wetlands
5. Lenches Ridge
6. Bredon
7. Severn Valley South
8. Bushley
9. Malvern Chase and Commons
10. Hagley Hinterland
11. Hollywood & Wythall
12. Bromsgrove – Redditch Corridor
13. Mid-Worcestershire Corridor
14. East Wychavon
15. Bow Brook South
16. Evesham Valley
17. Broadway & Cotswold Corridor
18. Carrant Brook Corridor
19. Longdon Hinterland
20. Kempsey Plain
21. River Teme Corridor
22. Severn Meadows Corridor
23. Eardiston
24. Bewdley Fringe
25. Birchen Coppice
26. Birlingham
27. Crowle
28. Defford
29. Bickmarsh
30. Long Marston
These are illustrated on Figure 8. Environmental Character Areas.
26
The Worcestershire Green Infrastructure Partnership has undertaken an analysis of the landscape character, biodiversity and the historic environment of Worcestershire to identify 30 distinct GI Environmental Character Areas (ECAs). Details about how these were developed is set out in Planning for a Multifunctional Green Infrastructure Framework in Worcestershire: Green Infrastructure Framework 2 (2012) available at www.worcestershire.gov.uk/GI
Worcestershire Minerals Local Plan Background Document: Analysis of Mineral Resources in Worcestershire, August 2016
Page | 18
www.worcestershire.gov.uk
Figure 8. Environmental Character Areas

Worcestershire Minerals Local Plan Background Document: Analysis of Mineral Resources in Worcestershire, August 2016
Page | 19
www.worcestershire.gov.uk
2.20. The urban areas are numbered as follows:
31. Alvechurch
32. Bewdley and Wribbenhall
33. Broadway
34. Bromsgrove
35. Droitwich
36. Evesham
37. Kempsey
38. Kidderminster
39. Malvern
40. Pershore
41. Redditch
42. Rubery and Cofton Hackett
43. Stourport
44. Upton upon Severn
45. West Hagley
46. Worcester
3.7. Appendices 1-46 set out the analysis of the aggregate deposits in each of these areas. In some cases the deposits have been split and considered as more than one resource area. Each resource area has been given a unique reference number (for example, resource area 1/12 can be found in Appendix 1 "ECA 1: Teme Valley and Wyre Forest" and is the 12th resource area listed in that ECA).
Resource areas where some depth information is available
Calculating the volume of the mineral resource
3.8. Where some information on the depth of resources is available (either from BGS memoirs or planning histories), we have estimated the potential resource volume using the following approach:
Resource area x estimated depth = estimated resource volume in m3.
2
3.9. To avoid spurious accuracy, minimise the risk of overestimating the resources
and to allow for the following factors, as part of the calculation above we decided to halve the resource potential when estimating the resource volume because:
Many resource areas are overlain by dispersed development and it is therefore unlikely that the whole resource area would be worked.
Information about depth is limited in detail and the quality and depth can vary across the resource area.
Constraints that will be set out in criteria-based policies have not been applied to the assessment of resource areas; it is possible therefore that some parts of the resource areas would be constrained from being fully worked.
3.10. Not all resource areas will be affected equally by all of these factors. At this stage we think that this will lead to an overestimate of the resource in some areas and an underestimate in others, averaging out across the county.

Worcestershire Minerals Local Plan Background Document: Analysis of Mineral Resources in Worcestershire, August 2016
Page | 20
www.worcestershire.gov.uk
Converting the volume into a tonnage
3.11. We have converted the estimated resource volumes into tonnages. However, during the Second Stage Consultation for the Minerals Local Plan it was brought to our attention that the conversion factors used to convert approximate volumes of mineral into tonnages were inappropriate.
3.12. For the Second Stage consultation the estimated volume of aggregate resources was converted into a tonnage based on assumptions about the weight and density of materials as published on www.simetric.co.uk, an online metric conversion tool (see table below).
Material Density
Gravel with sand natural 1922 kg/m3
sand with gravel wet 2020 kg/m3
Sand and gravel average 1971kg/m3
Material Density
Limestone (solid) 2611 kg/m3
Granite (solid) 2691 kg/m3
Crushed rock average 2651 kg/m3
3.13. To avoid spurious accuracy this was rounded to 2 tonnes/m3 for sand and gravel and 2.7 tonnes/m3 for crushed rock.
3.14. Comments received from the Mineral Products Association (MPA) and Cemex in response to the Second Stage Consultation indicated that the 2 tonnes/m³ (for sand and gravel) and 2.7 tonnes/m³ (for crushed rock) figures did not match industry standards for estimating mineral resources.
3.15. The Mineral Products Association (MPA)27 stated that we had used "…inaccurate estimations of resource quantities in the AoS [Area of Search] assessments. The industry uses a density figure of 1.64 t/m³ for sand and gravel, which takes account of processing losses. The equivalent figures for crushed rock vary depending on the geology but range from 2.2 t/m³ - 2.5 t/m³. Again, these figures are net of processing losses."
3.16. The response we received from Cemex28 was similar and provides the same figure for sand and gravel.
27
Response B020-1899, Mineral Products Association. See the response document to the Second Stage Consultation, available on http://www.worcestershire.gov.uk/minerals and follow the links to "Previous Consultation Stages" and "Second Stage Consultation".
28 Response B057-1793, Cemex. See the response document to the Second Stage
Consultation, available on http://www.worcestershire.gov.uk/minerals and follow the links to "Previous Consultation Stages" and "Second Stage Consultation".

Worcestershire Minerals Local Plan Background Document: Analysis of Mineral Resources in Worcestershire, August 2016
Page | 21
www.worcestershire.gov.uk
3.17. The MPA is an industry body representing the companies responsible for about 90% of UK aggregate production and is a reputable source of information. However, we decided to seek confirmation of these figures from the British Aggregates Association (BAA) who represent the remaining 10% of production (and many of the smaller independent producers) before revisiting our original assessments. A telephone conversation with Mr. Peter Huxtable (Secretary of the BAA) revealed that the BAA did not have a standard conversion figure, but that the MPA's numbers "sounded reasonable". Mr. Huxtable recommended that we contact the British Geological Survey (BGS) for an independent assessment.
3.18. Email correspondence from Dr Joseph Mankelow, Team Leader for Mineral Resources and Policy at the BGS, revealed that they "…have used a conversion factor of 1.65 t/m3 which is comparable to that provided to you by the MPA.
The figures of 2.2 - 2.5 t/m3 provided by the MPA for crushed rock are okay. Actual figures will vary depending on the type of rock and certain types will be higher than 2.5t/m3 (e.g Granite at around 2.7t/m3). A specific rock type will have a range of densities when crushed."
Dr Mankelow referred us to the Sand and Gravel assessment for Dorset County Council produced by BGS which uses these figures, and is available online at http://www.dorsetforyou.com/media.jsp?mediaid=180565&filetype=pdf.
3.19. Based on this feedback, we have decided to use the BGS figure of 1.65t/m³ for sand and gravel to re-assess the resource areas. Taking into account that the crushed rock resources of the Malverns are granitic and therefore at the heavier end of this spectrum but other types of rock in the county may well be at lighter end, we have used 2.45t/m3 for crushed rock (the mid-point of the range 2.2-2.7t/m³) to re-assess the resource areas.
3.20. The implications resulting from this change of conversion factor are discussed below.
Determining significance
3.21. Where we have some information on the depth of resources and can therefore estimate a tonnage, the resource areas have been classified as follows:
Table 1. Significance of deposits based on estimated resource
Estimated resource: <600,000 tonnes
Estimated resource: 600,000-2,000,000 tonnes
Estimated resource: >2,000,000 tonnes
Classified as: Not significant
Classified as: Significant Classified as: Key resource
3.22. These thresholds have been selected based on responses received to the first consultation on the Minerals Local Plan and local examples. Responses suggested that "a stand-alone sand and gravel site requiring a new plant site and appropriate infra-structure needs a resource of 1.5 to 2 million tonnes to be viable [and] an extension to an existing site of 0.5M tonnes or greater would be viable"29, and that "discussions with industry indicate [that] any extraction less
29
Response A32-2295, Tony Rowley Associates on behalf of Lechmere Estate. See the Response Document to the First Stage Consultation, available on

Worcestershire Minerals Local Plan Background Document: Analysis of Mineral Resources in Worcestershire, August 2016
Page | 22
www.worcestershire.gov.uk
than 1 million tonnes is not economically viable"30. Another response reminded us that "The viability of any mineral deposit depends upon its market price… Hence, resources not viable at one point in time may become viable…"31. Although this response specifically referred to the variations in the price of coal, and the price of lower value minerals such as aggregates can remain comparatively stable for many years, it is possible that the viability of aggregate deposits could change over the life of the Minerals Local Plan, and therefore some flexibility needs to be built in to the assessment.
3.23. As these responses indicated that sites with over 2 million tonnes of mineral resources would be viable, we have used this as the threshold for "key resources". We do not however, wish to frustrate the possibility of smaller sites being developed; it may be that market conditions might allow a smaller site to be viable. There is no guidance on what size any such site might be. The smallest free standing gravel pit the council is aware of in Worcestershire in recent times was at Lower Moor, where a two man company, operating one site, produced about 20,000 tonnes per annum of sand and gravel for about 30 years.
3.24. The site is unique locally but is evidence that small scale operations are possible and that small reserves can be significant. For the purposes of this consultation therefore we have adopted a minimum size of 600,000 tonnes of resources as being the smallest that we consider useful for strategic planning purposes and we have categorised these as "significant".
3.25. No comments were received in response to the Second Stage Consultation on the Minerals Local Plan which disagreed with these thresholds. One was received supporting the lower "not significant" threshold of 600,000 tonnes32.
Resource areas where no depth information is available
3.26. Where no information on the depth of resource is available, the following assumptions have been made:
http://www.worcestershire.gov.uk/minerals and follow the links to "Previous Consultation Stages" and "First Stage Consultation"
30 Response A30-2286, Mrs N Inchbald. See the Response Document to the First Stage
Consultation, available on http://www.worcestershire.gov.uk/minerals and follow the links to "Previous Consultation Stages" and "First Stage Consultation"
31 Response A29-1314, Confederation of UK Coal Producers (CoalPro). See the Response
Document to the First Stage Consultation, available on http://www.worcestershire.gov.uk/minerals and follow the links to "Previous Consultation Stages" and "First Stage Consultation"
32 Response B060-2399, Mrs Pat Harries. See the response document to the Second Stage
Consultation, available on http://www.worcestershire.gov.uk/minerals and follow the links to "Previous Consultation Stages" and "Second Stage Consultation".

Worcestershire Minerals Local Plan Background Document: Analysis of Mineral Resources in Worcestershire, August 2016
Page | 23
www.worcestershire.gov.uk
Table 2. Significance of deposits based on size
Size of deposit Classification where no information available on depth to calculate resource
Small deposits: <50 ha Classified as: Not significant
Medium deposits: 51-200 ha Classified as: Significant
Large deposits: 201 ha + Classified as: Significant
3.27. Where there is no information on the depth of resources, it is difficult to estimate whether any particular deposit might be important. One option might be to exclude all resources with unknown depth from further consideration. However, as the amount and quality of information on the depth of resources varies significantly across the county, this approach would risk discounting a large number of potentially important resources.
3.28. Instead, we have made the assumption that larger deposits (more than 50ha) are more likely to contain "significant" amounts of resources and smaller deposits (less than 50ha) are less likely to contain significant resources and should therefore be classed as "not significant". No comments were received in response to the Second Stage Consultation on the Minerals Local Plan which disagreed with these thresholds.
Compromised resources
3.29. Most resource areas include some built development, whether this is roads, railways or buildings. In some cases this may limit the area that is available for mineral working; however in most cases this is only likely to affect small parts of the resource area.
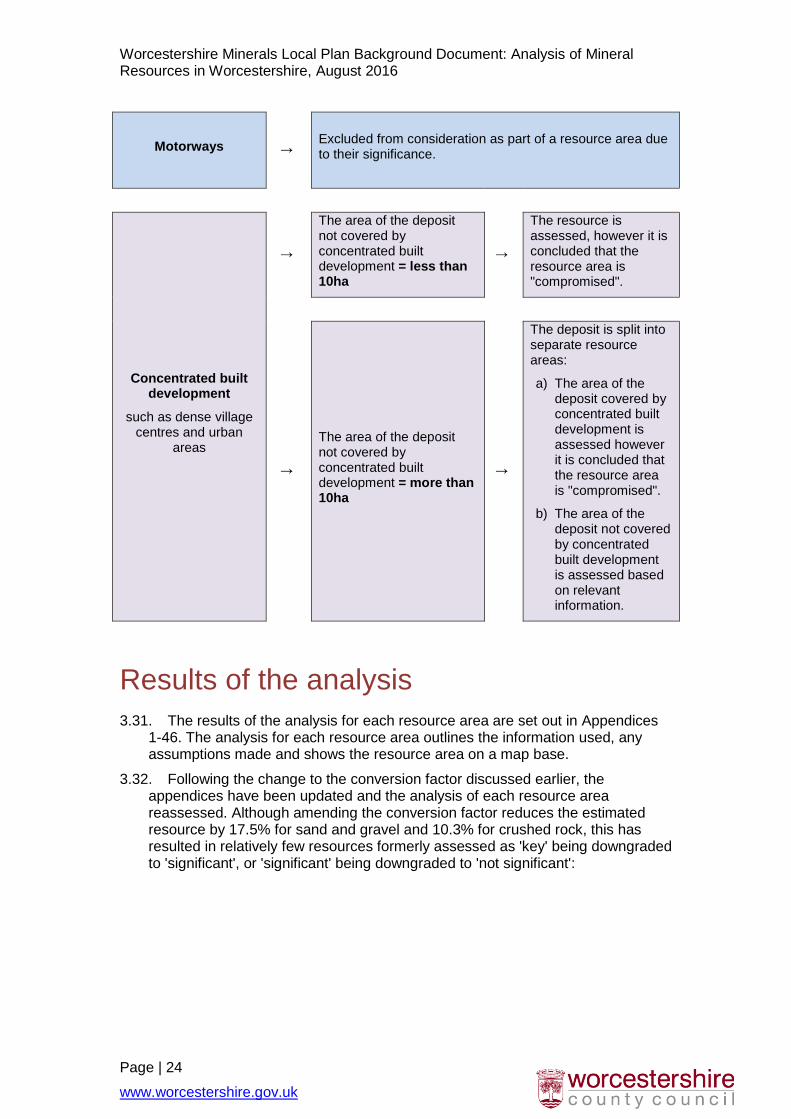
3.30. We have made provision for this by halving all estimated resources as outlined above and we think in most cases this will be adequate. However there are two circumstances in which we have considered this differently:
Worcestershire Minerals Local Plan Background Document: Analysis of Mineral Resources in Worcestershire, August 2016
Page | 24
www.worcestershire.gov.uk
Motorways ↓ Excluded from consideration as part of a resource area due
to their significance.
Concentrated built development
such as dense village centres and urban
areas
↓
The area of the deposit not covered by concentrated built development = less than 10ha
↓
The resource is assessed, however it is concluded that the resource area is "compromised".
↓
The area of the deposit not covered by concentrated built development = more than 10ha
↓
The deposit is split into separate resource areas:
a) The area of the deposit covered by concentrated built development is assessed however it is concluded that the resource area is "compromised".
b) The area of the deposit not covered by concentrated built development is assessed based on relevant information.
Results of the analysis
3.31. The results of the analysis for each resource area are set out in Appendices 1-46. The analysis for each resource area outlines the information used, any assumptions made and shows the resource area on a map base.
3.32. Following the change to the conversion factor discussed earlier, the appendices have been updated and the analysis of each resource area reassessed. Although amending the conversion factor reduces the estimated resource by 17.5% for sand and gravel and 10.3% for crushed rock, this has resulted in relatively few resources formerly assessed as 'key' being downgraded to 'significant', or 'significant' being downgraded to 'not significant':

Worcestershire Minerals Local Plan Background Document: Analysis of Mineral Resources in Worcestershire, August 2016
Page | 25
www.worcestershire.gov.uk
Table 3. Resource areas with changed significance levels due to altered conversion factor
Resource number*
Second Stage Consultation Third Stage Consultation
Original estimated resource tonnage
Significance Revised estimate of resource
tonnage
Significance
1/12 625,000 Significant 515,625 Not significant
1/29 630,000 Significant 519,750 Not significant
2/4 400,000 Significant 330,000 Not significant
4/6 700,000 Significant 577,500 Not significant
4/17 640,000 Significant 528,000 Not significant
7/8 710,000 Significant 585,750 Not significant
8/2 640,000 Significant 528,000 Not significant
13/3 2,040,000 Key 1,683,000 Significant
16/5 697,000 Significant 575,025 Not significant
16/9 2,392,000 Key 1,973,400 Significant
19/6 676,000 Significant 557,700 Not significant
19/8 2,214,000 Key 1,826,550 Significant
22/5 672,000 Significant 554,400 Not significant
25/2 2,028,000 Key 1,673,100 Significant
46/5a 2,006,000 Key 1,654,950 Significant
3.33. In addition, 21 sites were proposed by landowners and mineral operators in response to the Second Stage Consultation on the Minerals Local Plan and a subsequent "Call for Sites" in summer 2014. 2 new resource areas (7/19 and 13/11) have been included and the assessment of relevant resource areas has been updated where additional geological data was provided.
3.34. A further "Call for Sites" in summer 2015 resulted in a further 9 sites being proposed by landowners and mineral operators, although these did not include geological information to warrant amending the assessment of any resource areas.
3.35. However, a further amendment has been made to remove areas of mineral workings which had been included in error in previous iterations of this document. The affected resource area 22/4 (a key resource) has been amended resulting in resource area 22/4 being split into 22/4 and 22/4a:
Resource area 22/4 has been altered in shape and the calculation of estimated resource tonnage amended. It remains a key resource.
Resource area 22/4a is the western edge of the deposit, with less than 10 ha remaining to the west of the former mineral workings. The estimated resource tonnage for this resource area has been calculated, categorising it as a not significant resource.
3.36. The pattern of key, significant and not significant resources resulting from this revised analysis is shown in Figure 9.

Worcestershire Minerals Local Plan Background Document: Analysis of Mineral Resources in Worcestershire, August 2016
Page | 26
www.worcestershire.gov.uk
Figure 9. Significance of aggregate mineral resources
3.37. This analysis estimates that the key and significant deposits contain:
1,280,622,350 tonnes of crushed rock resources
3,397,996,800 tonnes of solid sand resources
248,659,125 tonnes of terrace and glacial sand and gravel resources.

Worcestershire Minerals Local Plan Background Document: Analysis of Mineral Resources in Worcestershire, August 2016
Page | 27
www.worcestershire.gov.uk
4. Next steps 4.1. The analysis set out in this document has been updated following the responses
received to the Second Consultation on the Minerals Local Plan and the subsequent "Call for Sites". The amended assessments undertaken are set out in the attached Appendices. Only appendix 22 has been updated from the version published in summer 2015.
4.2. These will form the basis for establishing the spatial strategy in the Third Consultation on the Minerals Local Plan.

Worcestershire Minerals Local Plan Background Document: Analysis of Mineral Resources in Worcestershire, August 2016
Page | 28
www.worcestershire.gov.uk
5. Appendices
The following appendices are available to download as separate files:
Appendix 1: Analysis of aggregate resources in ECA 1: Teme Valley and Wyre Forest
Appendix 2: Analysis of aggregate resources in ECA 2: Severn Valley North
Appendix 3: Analysis of aggregate resources in ECA 3: North Worcestershire Hills
Appendix 4: Analysis of aggregate resources in ECA 4: Forest of Feckenham & Feckenham Wetlands
Appendix 5: Analysis of aggregate resources in ECA 5: Lenches Ridge
Appendix 6: Analysis of aggregate resources in ECA 6: Bredon
Appendix 7: Analysis of aggregate resources in ECA 7: Severn Valley South
Appendix 8: Analysis of aggregate resources in ECA 8: Bushley
Appendix 9: Analysis of aggregate resources in ECA 9: Malvern Chase and Commons
Appendix 10: Analysis of aggregate resources in ECA 10: Hagley Hinterland
Appendix 11: Analysis of aggregate resources in ECA 11: Hollywood and Wythall
Appendix 12: Analysis of aggregate resources in ECA 12: Bromsgrove – Redditch Corridor
Appendix 13: Analysis of aggregate resources in ECA 13: Mid Worcestershire Corridor
Appendix 14: Analysis of aggregate resources in ECA 14: East Wychavon
Appendix 15: Analysis of aggregate resources in ECA 15: Bow Brook South
Appendix 16: Analysis of aggregate resources in ECA 16: Evesham Valley
Appendix 17: Analysis of aggregate resources in ECA 17: Broadway and Cotswold Corridor
Appendix 18: Analysis of aggregate resources in ECA 18: Carrant Brook Corridor
Appendix 19: Analysis of aggregate resources in ECA 19: Longdon Hinterland
Appendix 20: Analysis of aggregate resources in ECA 20: Kempsey Plain
Appendix 21: Analysis of aggregate resources in ECA 21: River Teme Corridor
Appendix 22: Analysis of aggregate resources in ECA 22: Severn Meadows Corridor
Appendix 23: Analysis of aggregate resources in ECA 23: Eardiston
Appendix 24: Analysis of aggregate resources in ECA 24: Bewdley Fringe
Appendix 25: Analysis of aggregate resources in ECA 25: Birchen Coppice
Appendix 26: Analysis of aggregate resources in ECA 26: Birlingham
Appendix 27: Analysis of aggregate resources in ECA 27: Crowle
Appendix 28: Analysis of aggregate resources in ECA 28: Defford
Appendix 29: Analysis of aggregate resources in ECA 29: Bickmarsh

Worcestershire Minerals Local Plan Background Document: Analysis of Mineral Resources in Worcestershire, August 2016
Page | 29
www.worcestershire.gov.uk
Appendix 30: Analysis of aggregate resources in ECA 30: Long Marston
Appendix 31: Analysis of aggregate resources in Area 31: Alvechurch
Appendix 32: Analysis of aggregate resources in Area 32: Bewdley and Wribbenhall
Appendix 33: Analysis of aggregate resources in Area 33: Broadway
Appendix 34: Analysis of aggregate resources in Area 34: Bromsgrove
Appendix 35: Analysis of aggregate resources in Area 35: Droitwich
Appendix 36: Analysis of aggregate resources in Area 36: Evesham
Appendix 37: Analysis of aggregate resources in Area 37: Kempsey
Appendix 38: Analysis of aggregate resources in Area 38: Kidderminster
Appendix 39: Analysis of aggregate resources in Area 39: Malvern
Appendix 40: Analysis of aggregate resources in Area 40: Pershore
Appendix 41: Analysis of aggregate resources in Area 41: Redditch
Appendix 42: Analysis of aggregate resources in Area 42: Rubery & Cofton Hackett
Appendix 43: Analysis of aggregate resources in Area 43: Stourport
Appendix 44: Analysis of aggregate resources in Area 44: Upton upon Severn
Appendix 45: Analysis of aggregate resources in Area 45: West Hagley
Appendix 46: Analysis of aggregate resources in Area 46: Worcester