youth insights report...youtube, facebook and instagram. when comparing social media usage by...
TRANSCRIPT
STUDENTHUT.COM
The TripAdvisor for universities”“ Most useful website
for students”“
YOUTH INSIGHTS REPORT
Brand, Platform Trends and the Student AudienceJUNE 2018
CONTENTS
ABOUT THE REPORT
03
METHODOLOGY
04
KEY FINDINGS
05BRANDS ON
SOCIAL MEDIA
16
BRAND ETHICS
19
PLATFORM PREFERENCES
12
PLATFORM TRENDS
09
PURCHASING HABITS AND INFLUENCES
20
BRAND COMMUNICATION
23
DEMOGRAPHICS
06
02
BRAND TRENDS
15
ABOUT THE REPORT
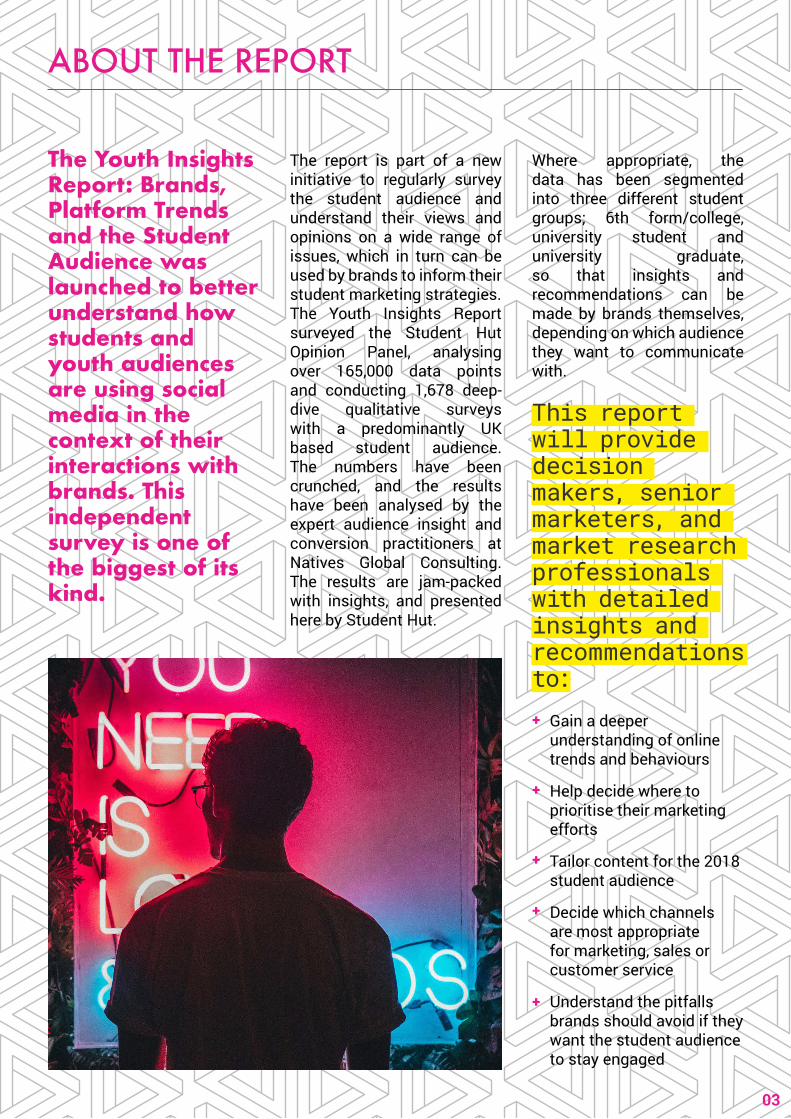
The Youth Insights Report: Brands, Platform Trends and the Student Audience was launched to better understand how students and youth audiences are using social media in the context of their interactions with brands. This independent survey is one of the biggest of its kind.
03
The report is part of a new initiative to regularly survey the student audience and understand their views and opinions on a wide range of issues, which in turn can be used by brands to inform their student marketing strategies.The Youth Insights Report surveyed the Student Hut Opinion Panel, analysing over 165,000 data points and conducting 1,678 deep-dive qualitative surveys with a predominantly UK based student audience. The numbers have been crunched, and the results have been analysed by the expert audience insight and conversion practitioners at Natives Global Consulting. The results are jam-packed with insights, and presented here by Student Hut.
Where appropriate, the data has been segmented into three different student groups; 6th form/college, university student and university graduate, so that insights and recommendations can be made by brands themselves, depending on which audience they want to communicate with.
This report will provide decision makers, senior marketers, and market research professionals with detailed insights and recommendations to:+
+
+
+
+
Gain a deeper understanding of online trends and behaviours
Help decide where to prioritise their marketing efforts
Tailor content for the 2018 student audience
Decide which channels are most appropriate for marketing, sales or customer service
Understand the pitfalls brands should avoid if they want the student audience to stay engaged
THE METHODOLOGY
The Youth Insights Report was distributed to all opted-in, registered students on the Student Hut Panel.
The survey was open for two days between 22/2/18 and 24/2/18. Deep-dive, qualitative interviews were conducted with 1,678 respondents. Equal weighting was given to each participant’s response.
The survey was built and analysed by the Insights and Research Division at Natives Global Consulting; the team behind the National Clearing Survey, Edurank and the European MBA Survey.
04
KEY FINDINGS
05
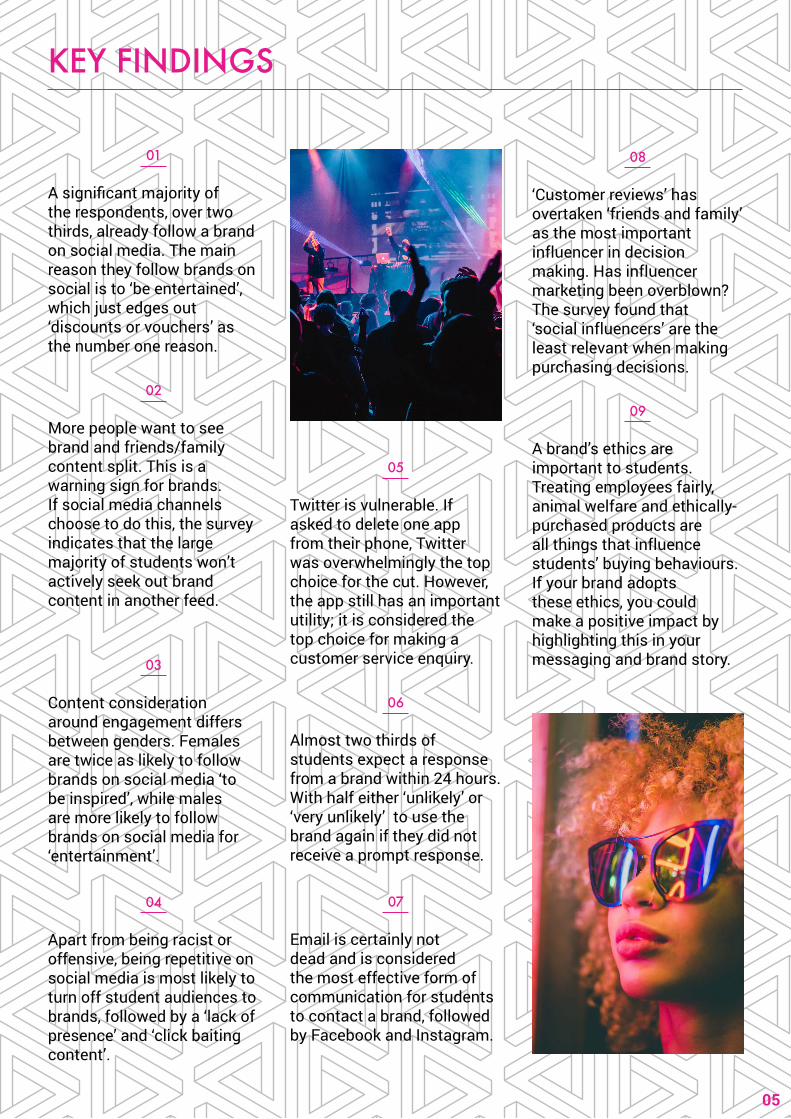
A significant majority of the respondents, over two thirds, already follow a brand on social media. The main reason they follow brands on social is to ‘be entertained’, which just edges out ‘discounts or vouchers’ as the number one reason.
01
More people want to see brand and friends/family content split. This is a warning sign for brands. If social media channels choose to do this, the survey indicates that the large majority of students won’t actively seek out brand content in another feed.
02
Content consideration around engagement differs between genders. Females are twice as likely to follow brands on social media ‘to be inspired’, while males are more likely to follow brands on social media for ‘entertainment’.
03
Apart from being racist or offensive, being repetitive on social media is most likely to turn off student audiences to brands, followed by a ‘lack of presence’ and ‘click baiting content’.
04
Twitter is vulnerable. If asked to delete one app from their phone, Twitter was overwhelmingly the top choice for the cut. However, the app still has an important utility; it is considered the top choice for making a customer service enquiry.
05
Almost two thirds of students expect a response from a brand within 24 hours. With half either ‘unlikely’ or ‘very unlikely’ to use the brand again if they did not receive a prompt response.
06
Email is certainly not dead and is considered the most effective form of communication for students to contact a brand, followed by Facebook and Instagram.
07
‘Customer reviews’ has overtaken ‘friends and family’ as the most important influencer in decision making. Has influencer marketing been overblown? The survey found that ‘social influencers’ are the least relevant when making purchasing decisions.
08
A brand’s ethics are important to students. Treating employees fairly, animal welfare and ethically-purchased products are all things that influence students’ buying behaviours. If your brand adopts these ethics, you could make a positive impact by highlighting this in your messaging and brand story.
09
DEMOGRAPHICS

Scotland2%
North East England5%
Yorkshire and the Humber
10%
WestMidlands
8%Wales4%
South West8%
Greater London
13%
East Midlands
6% East of England
11%
Northern Ireland2%
South East19%
NorthWest11%
07
LOCATION OF OUR PANEL (UK ONLY)
08
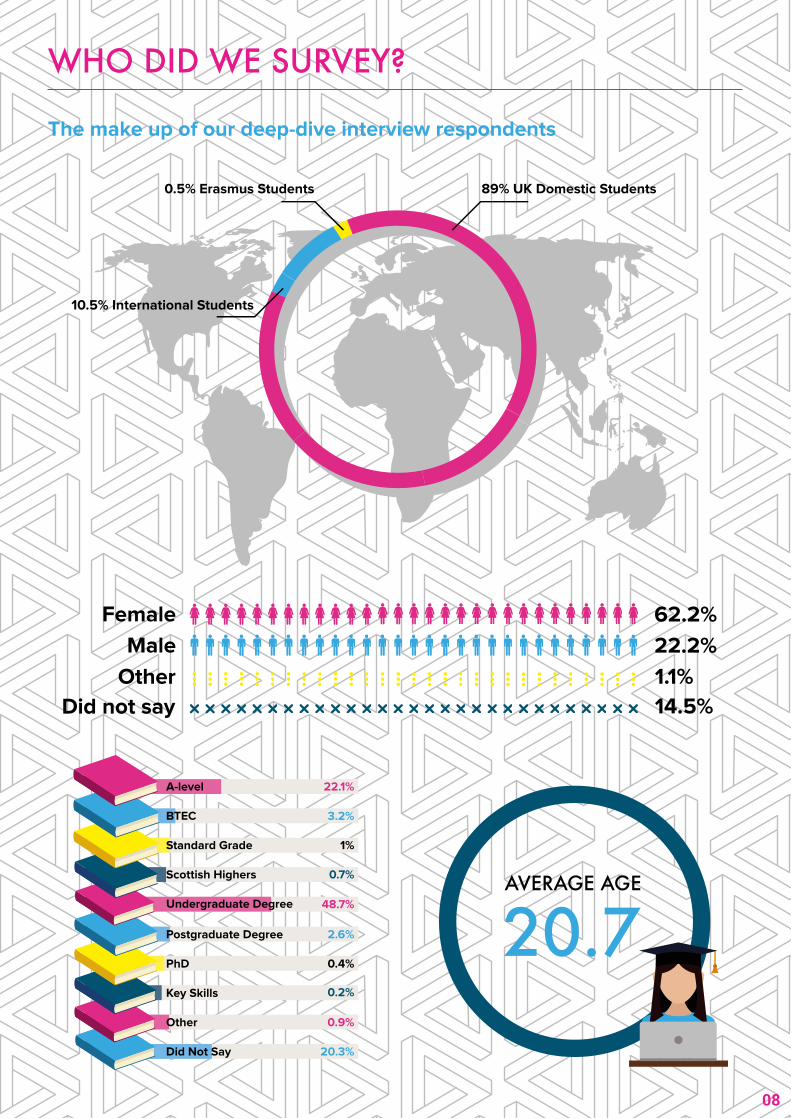
89% UK Domestic Students0.5% Erasmus Students
10.5% International Students
A-level
BTEC
Standard Grade
Scottish Highers
Undergraduate Degree
Postgraduate Degree
PhD
Key Skills
Other
Did Not Say
48.7%
22.1%
0.9%
3.2%
2.6%
20.3%
1%
0.4%
0.7%
0.2%
WHO DID WE SURVEY?
The make up of our deep-dive interview respondents

PLATFORM TRENDS
PLATFORM TRENDS ANDTHE STUDENT AUDIENCE
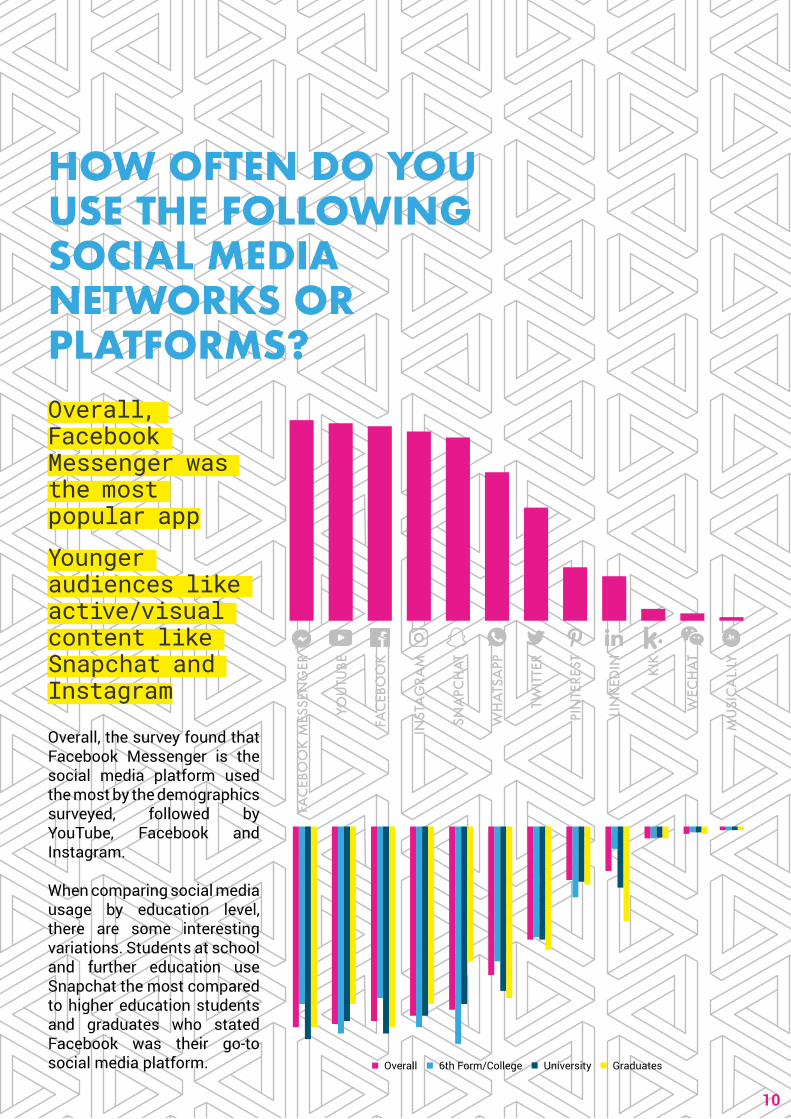
HOW OFTEN DO YOU USE THE FOLLOWING SOCIAL MEDIA NETWORKS OR PLATFORMS?
Overall, the survey found that Facebook Messenger is the social media platform used the most by the demographics surveyed, followed by YouTube, Facebook and Instagram.
When comparing social media usage by education level, there are some interesting variations. Students at school and further education use Snapchat the most compared to higher education students and graduates who stated Facebook was their go-to social media platform.
10
Overall, Facebook Messenger was the most popular app
Younger audiences like active/visual content like Snapchat and Instagram
Overall 6th Form/College University Graduates
FAC
EBO
OK
MES
SEN
GER
YOU
TUBE
FAC
EBO
OK
INST
AG
RAM
SNA
PCH
AT
WH
ATS
APP
TWIT
TER
PIN
TERE
ST
LIN
KED
IN KIK
WEC
HA
T
MU
SIC
AL.
LY
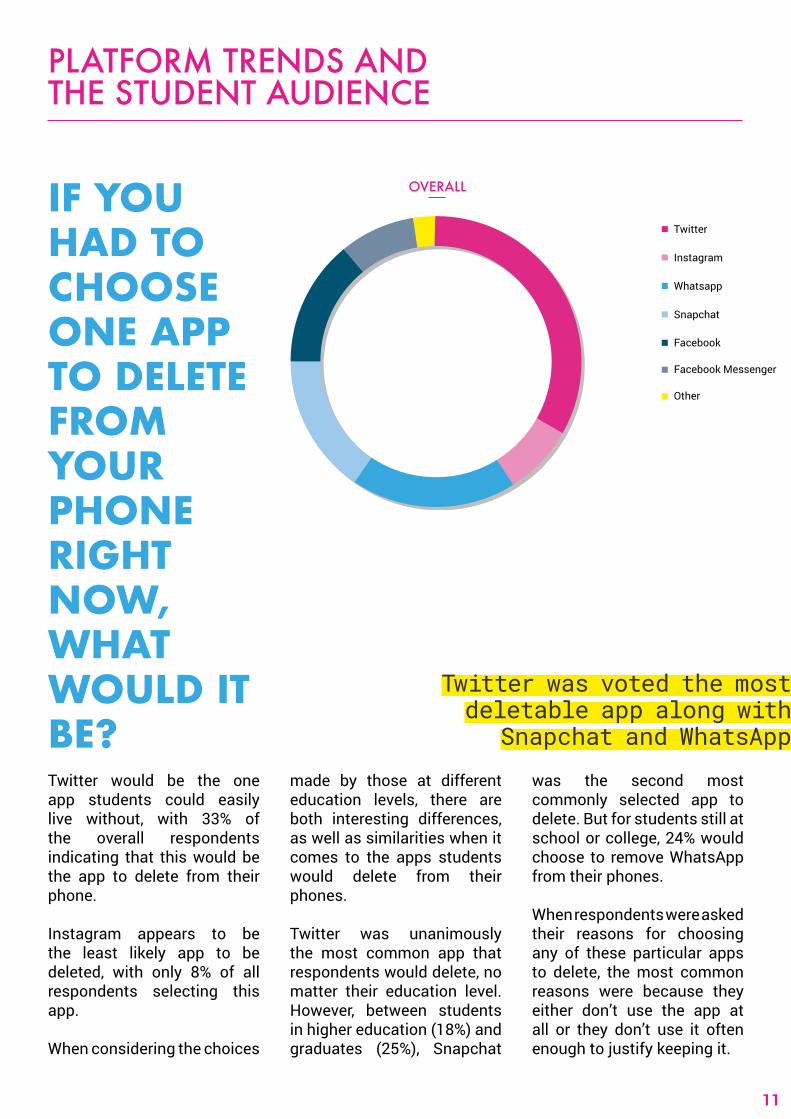
Twitter was voted the most deletable app along with
Snapchat and WhatsApp
PLATFORM TRENDS ANDTHE STUDENT AUDIENCE
IF YOU HAD TO CHOOSE ONE APP TO DELETE FROM YOUR PHONE RIGHT NOW, WHAT WOULD IT BE?Twitter would be the one app students could easily live without, with 33% of the overall respondents indicating that this would be the app to delete from their phone.
Instagram appears to be the least likely app to be deleted, with only 8% of all respondents selecting this app.
When considering the choices
made by those at different education levels, there are both interesting differences, as well as similarities when it comes to the apps students would delete from their phones.
Twitter was unanimously the most common app that respondents would delete, no matter their education level. However, between students in higher education (18%) and graduates (25%), Snapchat
11
OVERALL
Snapchat
Facebook Messenger
Other
was the second most commonly selected app to delete. But for students still at school or college, 24% would choose to remove WhatsApp from their phones.
When respondents were asked their reasons for choosing any of these particular apps to delete, the most common reasons were because they either don’t use the app at all or they don’t use it often enough to justify keeping it.
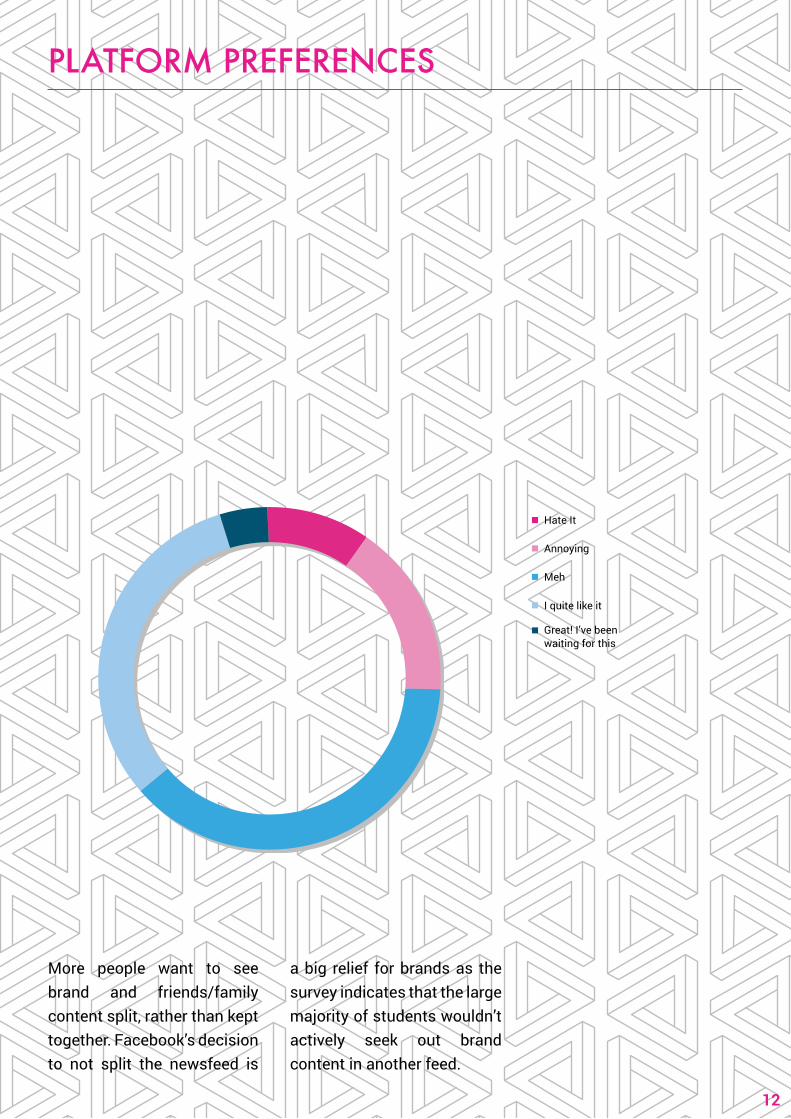
HOW WOULD YOU FEEL IF NEWS FEEDS WERE SPLIT BETWEEN FRIENDS/FAMILY AND BRANDS ON FACEBOOK?
PLATFORM PREFERENCES
More people want to see brand and friends/family content split, rather than kept together. Facebook’s decision to not split the newsfeed is
12
Hate It
Annoying
Meh
I quite like it
Great! I’ve been waiting for this
a big relief for brands as the survey indicates that the large majority of students wouldn’t actively seek out brand content in another feed.
13
PLATFORM PREFERENCES
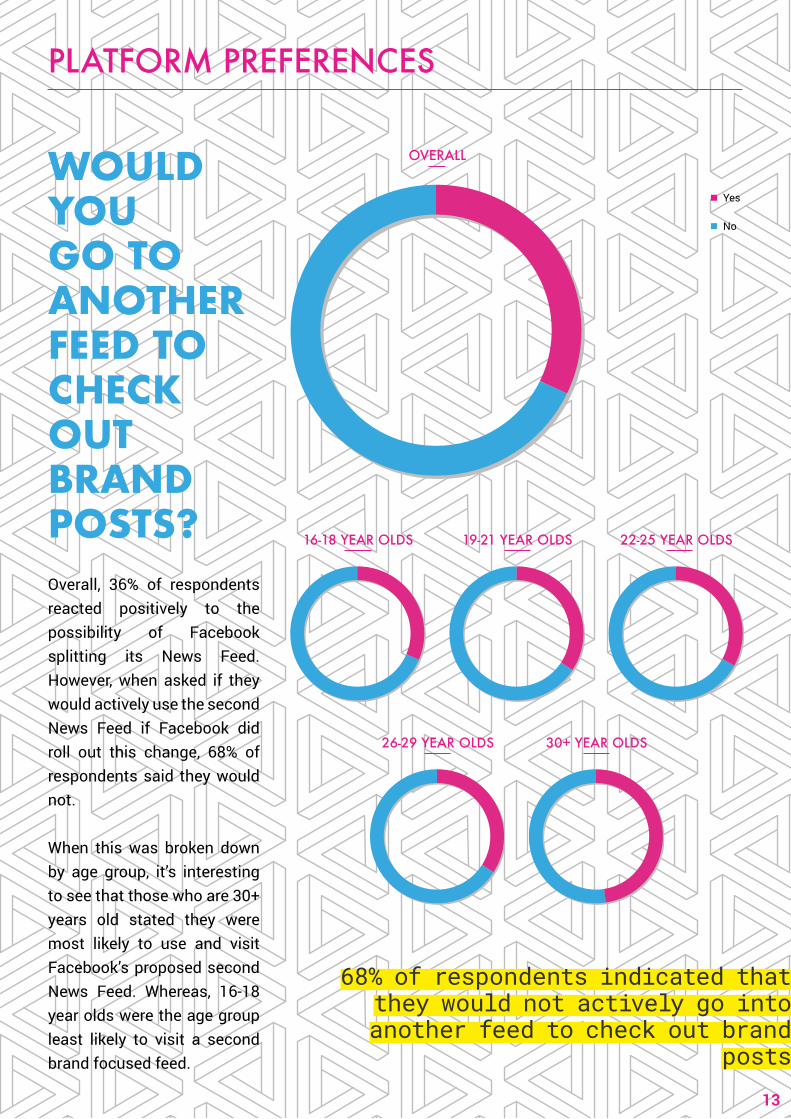
WOULD YOU GO TO ANOTHER FEED TO CHECK OUT BRAND POSTS? 16-18 YEAR OLDS 19-21 YEAR OLDS 22-25 YEAR OLDS
OVERALL
Yes
No
26-29 YEAR OLDS 30+ YEAR OLDS
68% of respondents indicated that they would not actively go into another feed to check out brand
posts
Overall, 36% of respondents reacted positively to the possibility of Facebook splitting its News Feed. However, when asked if they would actively use the second News Feed if Facebook did roll out this change, 68% of respondents said they would not.
When this was broken down by age group, it’s interesting to see that those who are 30+ years old stated they were most likely to use and visit Facebook’s proposed second News Feed. Whereas, 16-18 year olds were the age group least likely to visit a second brand focused feed.
FINAL FINDINGS PLATFORM TRENDS
Overall, Facebook, Facebook Messenger and YouTube were the most used social media platforms.
01
Snapchat and Instagram were more popular with those still at 6th form/college compared to university students and graduates.
02
A third of respondents would delete Twitter if asked to delete one app from their phone right now.
03
If respondents could only use one app for the rest of their lives, Instagram, Snapchat and Facebook were their preferred choices.
04
71% of respondents indicated that they do follow brands on social media.
05
Females are twice as likely to follow brands on social media to be inspired, with males more likely to follow brands on social media for entertainment.
06
Just over a third responded positively to the possibility of Facebook splitting the news feed into one for businesses/brands and one for friends/family.
07
68%, of respondents would not actively go into another feed to check out brand posts if Facebook did implement this change.
08
For those who indicated that they would go into another feed to look out brand posts, the most common reason was because they felt it was a good way to keep up with discounts/promotions and special deals on products
09
For those who indicated that they would not go into another Facebook feed to check out brand posts the most common reason was because they were not interested at looking at brands on Facebook and didn’t use Facebook to actually follow brands.
10
14
BRANDTRENDS
BRANDS ON SOCIAL MEDIA
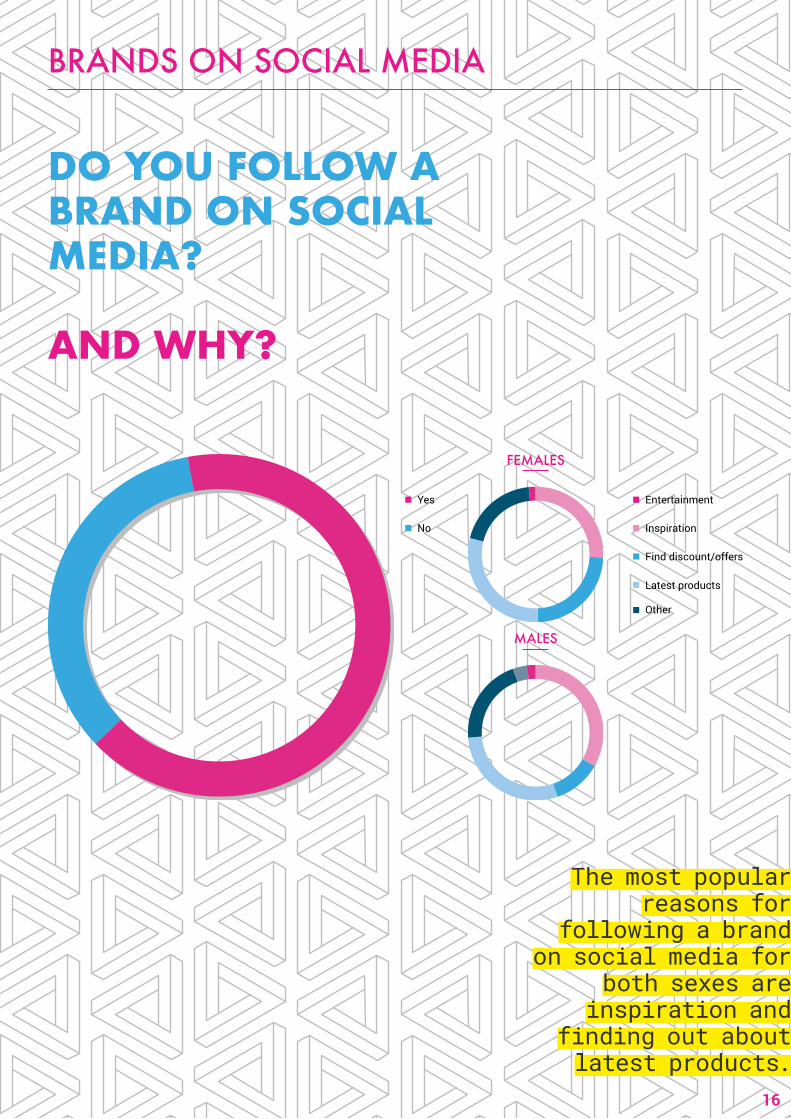
DO YOU FOLLOW A BRAND ON SOCIAL MEDIA?
AND WHY?
16
Yes
No
FEMALES
MALES
Entertainment
Inspiration
Find discount/offers
Latest products
Other
The most popular reasons for
following a brand on social media for
both sexes are inspiration and
finding out about latest products.
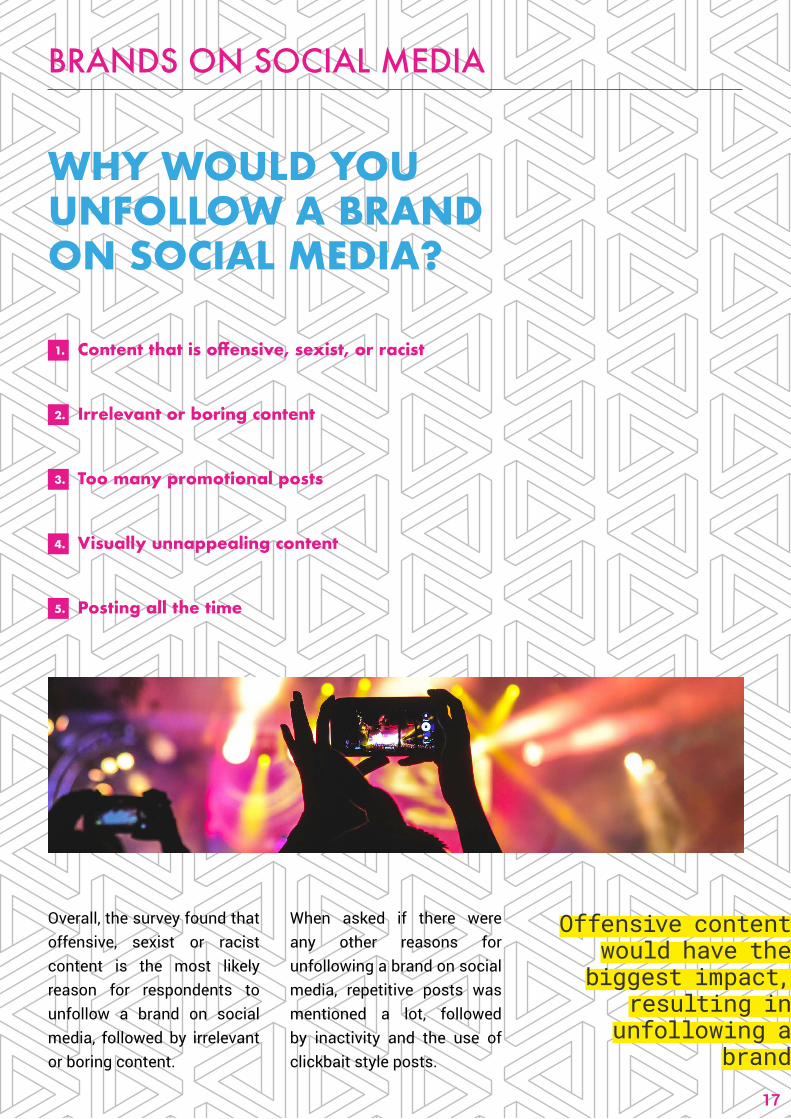
Offensive content would have the
biggest impact, resulting in
unfollowing a brand
BRANDS ON SOCIAL MEDIA
17
WHY WOULD YOU UNFOLLOW A BRAND ON SOCIAL MEDIA?
Overall, the survey found that offensive, sexist or racist content is the most likely reason for respondents to unfollow a brand on social media, followed by irrelevant or boring content.
When asked if there were any other reasons for unfollowing a brand on social media, repetitive posts was mentioned a lot, followed by inactivity and the use of clickbait style posts.
Content that is offensive, sexist, or racist1.
Irrelevant or boring content2.
Too many promotional posts3.
Visually unnappealing content4.
Posting all the time5.
BRANDS ON SOCIAL MEDIA
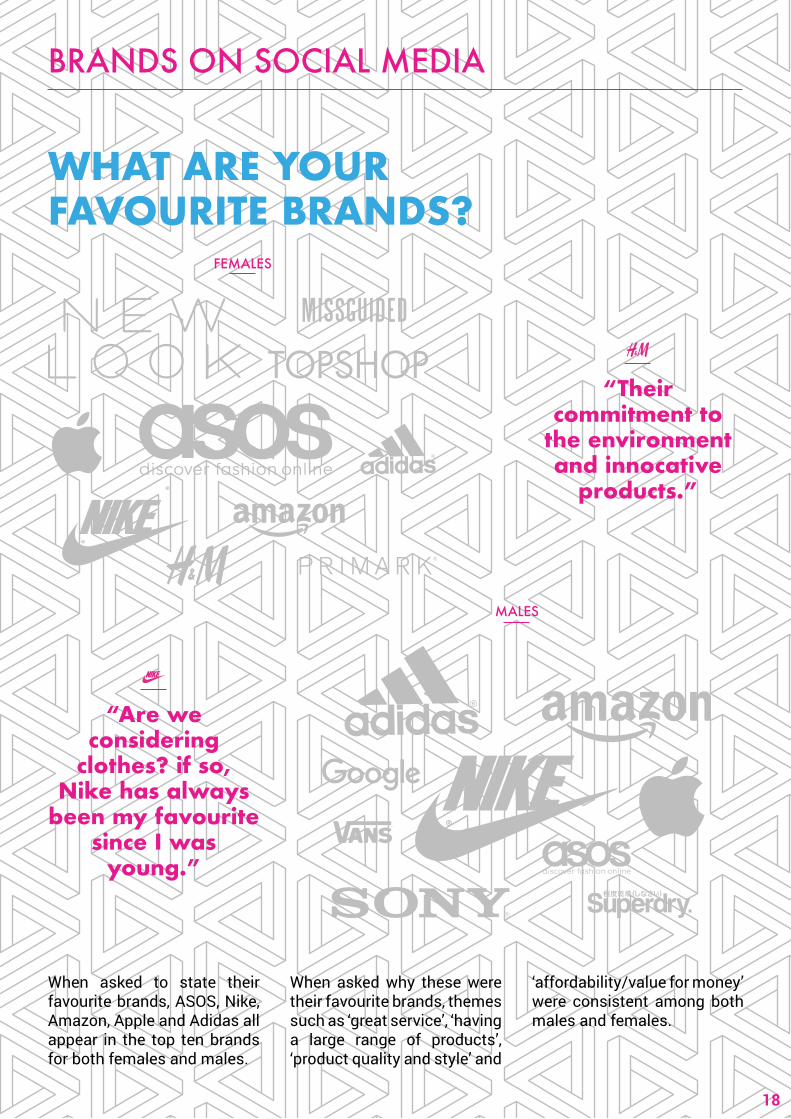
“Their commitment to
the environment and innocative
products.”
“Are we considering
clothes? if so, Nike has always
been my favourite since I was
young.”
WHAT ARE YOUR FAVOURITE BRANDS?
When asked to state their favourite brands, ASOS, Nike, Amazon, Apple and Adidas all appear in the top ten brands for both females and males.
MALES
FEMALES
18
When asked why these were their favourite brands, themes such as ‘great service’, ‘having a large range of products’, ‘product quality and style’ and
‘affordability/value for money’ were consistent among both males and females.
BRANDS ETHICS
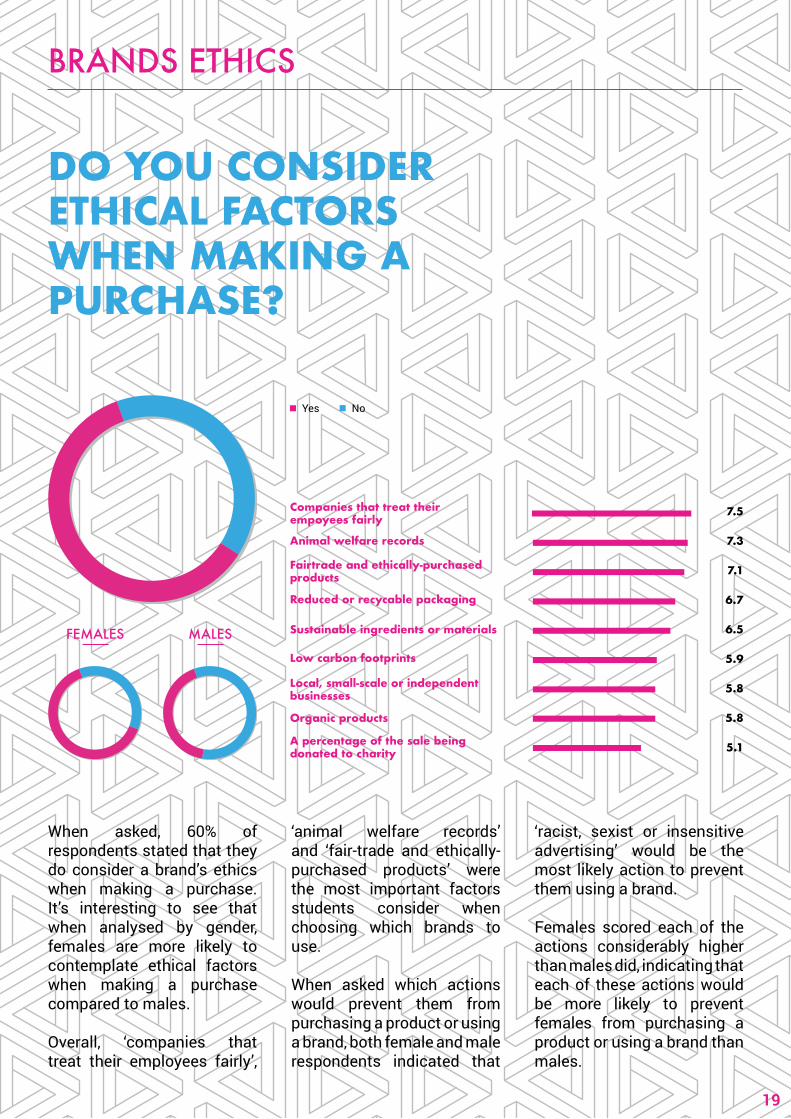
DO YOU CONSIDER ETHICAL FACTORS WHEN MAKING A PURCHASE?
When asked, 60% of respondents stated that they do consider a brand’s ethics when making a purchase. It’s interesting to see that when analysed by gender, females are more likely to contemplate ethical factors when making a purchase compared to males.
Overall, ‘companies that treat their employees fairly’,
FEMALES MALES
19
Yes No
Companies that treat their empoyees fairly
Animal welfare records
Fairtrade and ethically-purchased products
Reduced or recycable packaging
Sustainable ingredients or materials
Low carbon footprints
Organic products
Local, small-scale or independent businesses
A percentage of the sale being donated to charity
7.5
7.3
7.1
6.7
6.5
5.9
5.8
5.8
5.1
‘animal welfare records’ and ‘fair-trade and ethically-purchased products’ were the most important factors students consider when choosing which brands to use.
When asked which actions would prevent them from purchasing a product or using a brand, both female and male respondents indicated that
‘racist, sexist or insensitive advertising’ would be the most likely action to prevent them using a brand.
Females scored each of the actions considerably higher than males did, indicating that each of these actions would be more likely to prevent females from purchasing a product or using a brand than males.

PURCHASING HABITS AND INFLUENCERS
‘Customer reviews’ has overtaken ‘friends and family’ as the most important influencer in decision making. Has influencer marketing been overblown? The survey found that ‘social influencers’ are the least relevant when making purchasing decisions.
When asked about other factors that influence their purchasing, respondents stated price and affordability as the most influential factors.
Celebrity endorsements, news and sponsored content on websites followed by
WHAT ARE THE BIGGEST INFLUENCING FACTORS PRIOR TO PURCHASE?
20
bloggers/vloggers were the least influential factors when students are considering a purchase.
Using the data available, this was then broken down by age group and indicated that, aside from product reviews and recommendations, 16 to 18-year-olds are influenced by digital and social media adverts more so than traditional advertising.On the other hand, 26-year-olds through to 30+-year-olds are influenced by more traditional means of advertising compared to younger age groups.
Online reviews, along with
recommendations from family and friends have the
biggest influence, whilst bloggers/
vloggers have little to no influence
Reviews 1.
Recommendations by friends2.
Recommendation by family3.
Digital advertising4.
Social media adverts5.
Traditional advertising6.
Bloggers/vloggers7.
News and sponsored content on websites
8.
Celebrity endorsements9.
IF A BRAND THATYOU USECREATES ACRINGEWORTHY ADVERT,HOW MUCH WOULD THIS AFFECT YOURDECISION TOPURCHASE?
PURCHASING HABITS AND INFLUENCERS
42% indicated that their purchase decisions would be negatively affected if a brand they used created cringeworthy adverts.
21
Not at all. It doesn’t really bother me
Hardly at all. I don’t think it’s a big deal not to consult young people
Not much, I’m not that fussed
A little. I wouldn’t want to use a brand that seemed out of touch
A lot. I’d never use that brand again
PURCHASING HABITS AND INFLUENCERS
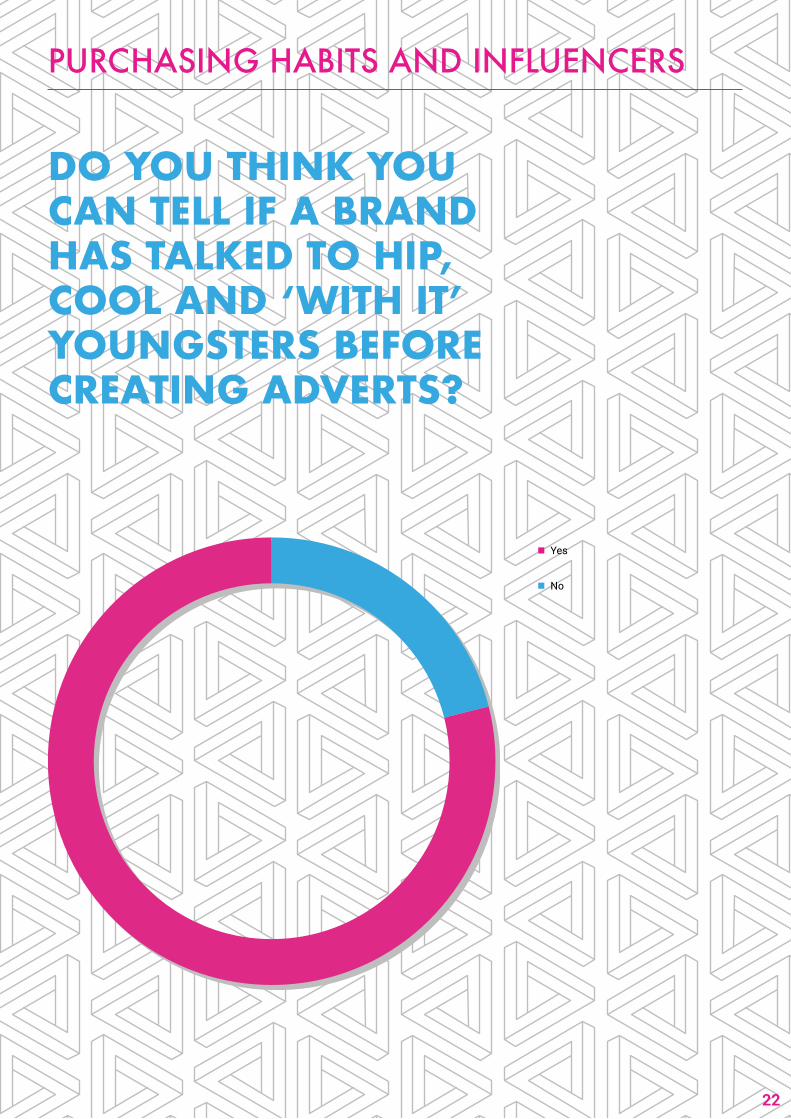
DO YOU THINK YOU CAN TELL IF A BRAND HAS TALKED TO HIP, COOL AND ‘WITH IT’ YOUNGSTERS BEFORE CREATING ADVERTS?
Yes
No
22
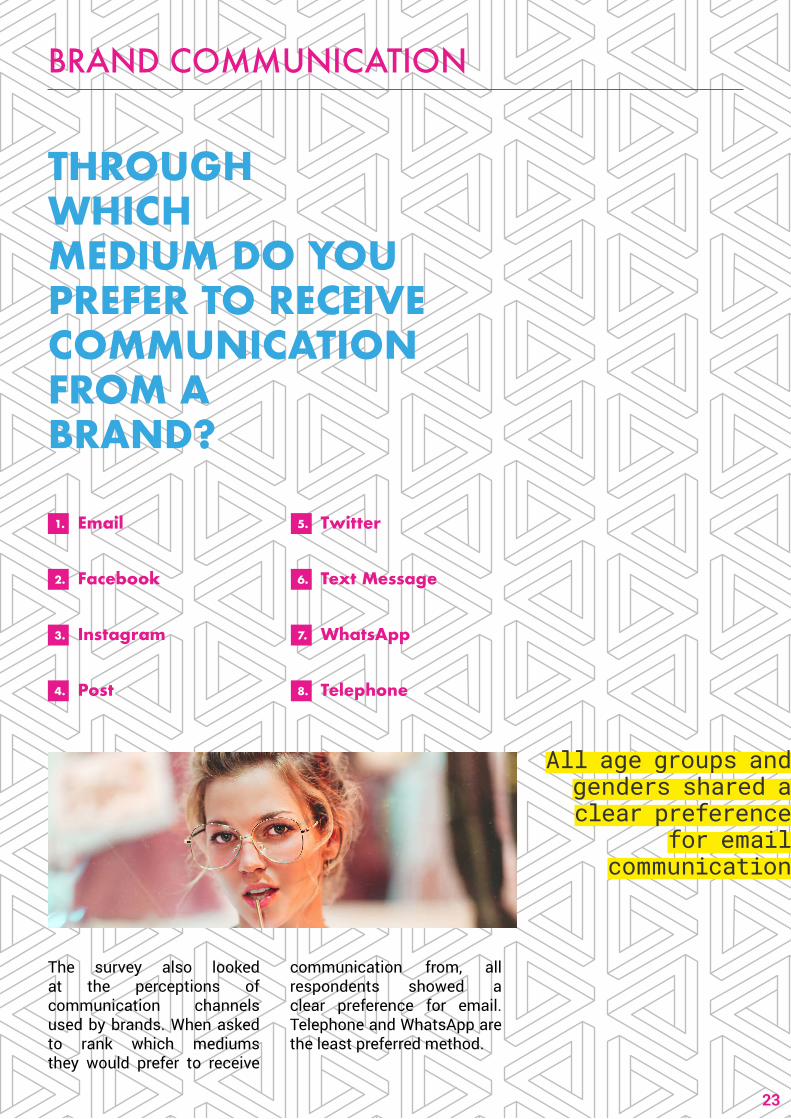
The survey also looked at the perceptions of communication channels used by brands. When asked to rank which mediums they would prefer to receive
BRAND COMMUNICATION
THROUGHWHICHMEDIUM DO YOU PREFER TO RECEIVE COMMUNICATION FROM ABRAND?
23
Email1.
Facebook2.
Instagram3.
Post4.
Twitter5.
Text Message6.
WhatsApp7.
Telephone8.
communication from, all respondents showed a clear preference for email. Telephone and WhatsApp are the least preferred method.
All age groups and genders shared a clear preference
for email communication
BRAND COMMUNICATION
24
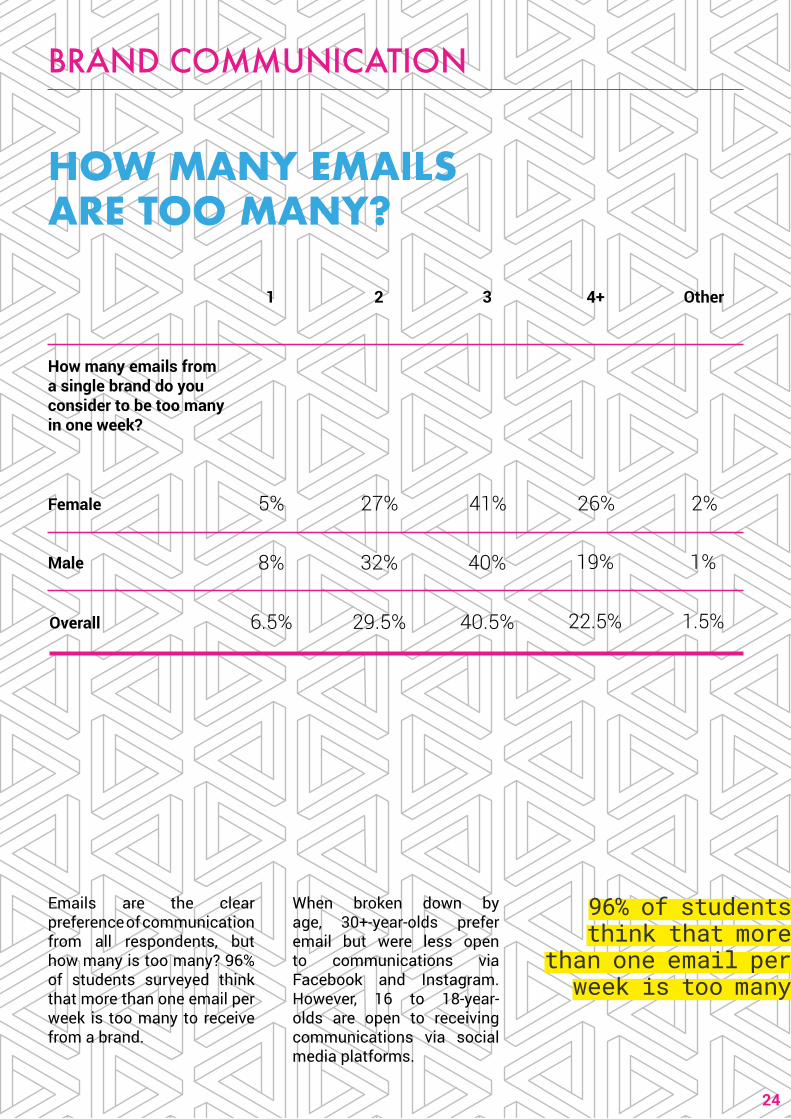
HOW MANY EMAILS ARE TOO MANY?
1 2 3 4+ Other
Female
Male
5% 27% 41% 26% 2%
8% 32% 40% 19% 1%
Overall 6.5% 29.5% 40.5% 22.5% 1.5%
How many emails from a single brand do you consider to be too many in one week?
96% of students think that more
than one email per week is too many
Emails are the clear preference of communication from all respondents, but how many is too many? 96% of students surveyed think that more than one email per week is too many to receive from a brand.
When broken down by age, 30+-year-olds prefer email but were less open to communications via Facebook and Instagram. However, 16 to 18-year-olds are open to receiving communications via social media platforms.
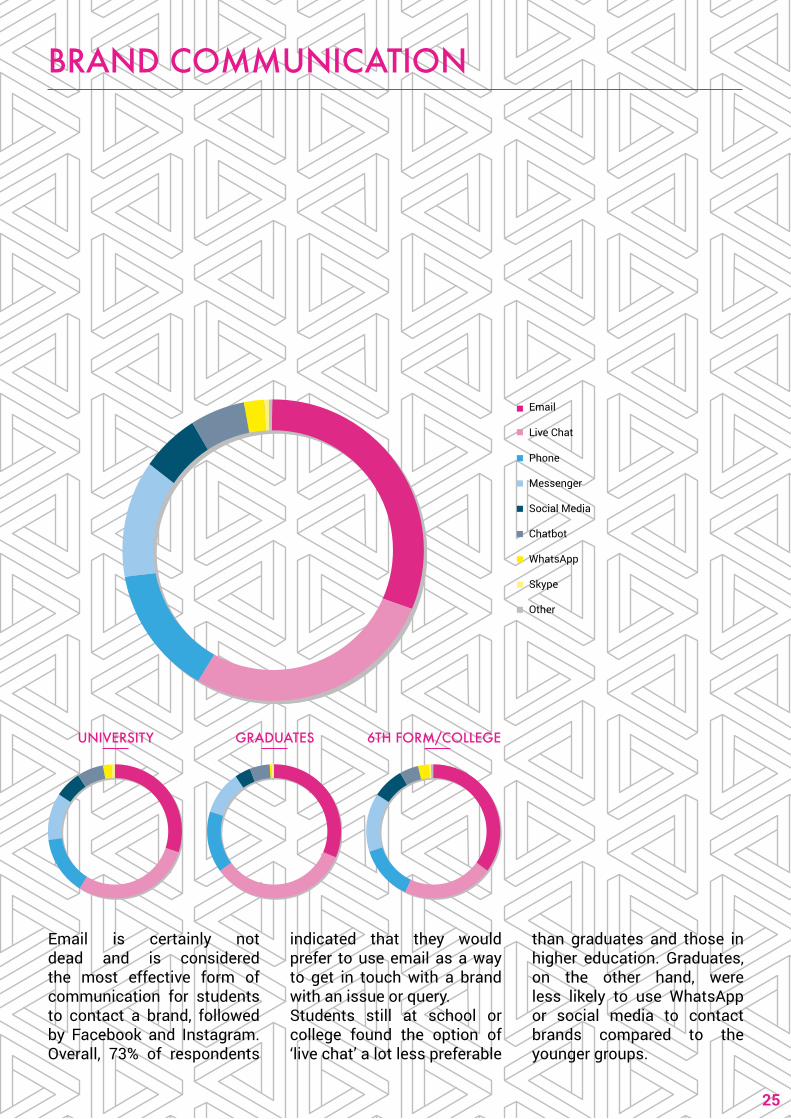
HOW WOULD YOU PREFER TO GET IN TOUCH WITH BRANDS WHEN YOU HAVE AN ISSUE OR A QUERY?
BRAND COMMUNICATION
Email is certainly not dead and is considered the most effective form of communication for students to contact a brand, followed by Facebook and Instagram. Overall, 73% of respondents
UNIVERSITY GRADUATES 6TH FORM/COLLEGE
25
Live Chat
Phone
Messenger
Social Media
Chatbot
Skype
Other
indicated that they would prefer to use email as a way to get in touch with a brand with an issue or query. Students still at school or college found the option of ‘live chat’ a lot less preferable
than graduates and those in higher education. Graduates, on the other hand, were less likely to use WhatsApp or social media to contact brands compared to the younger groups.
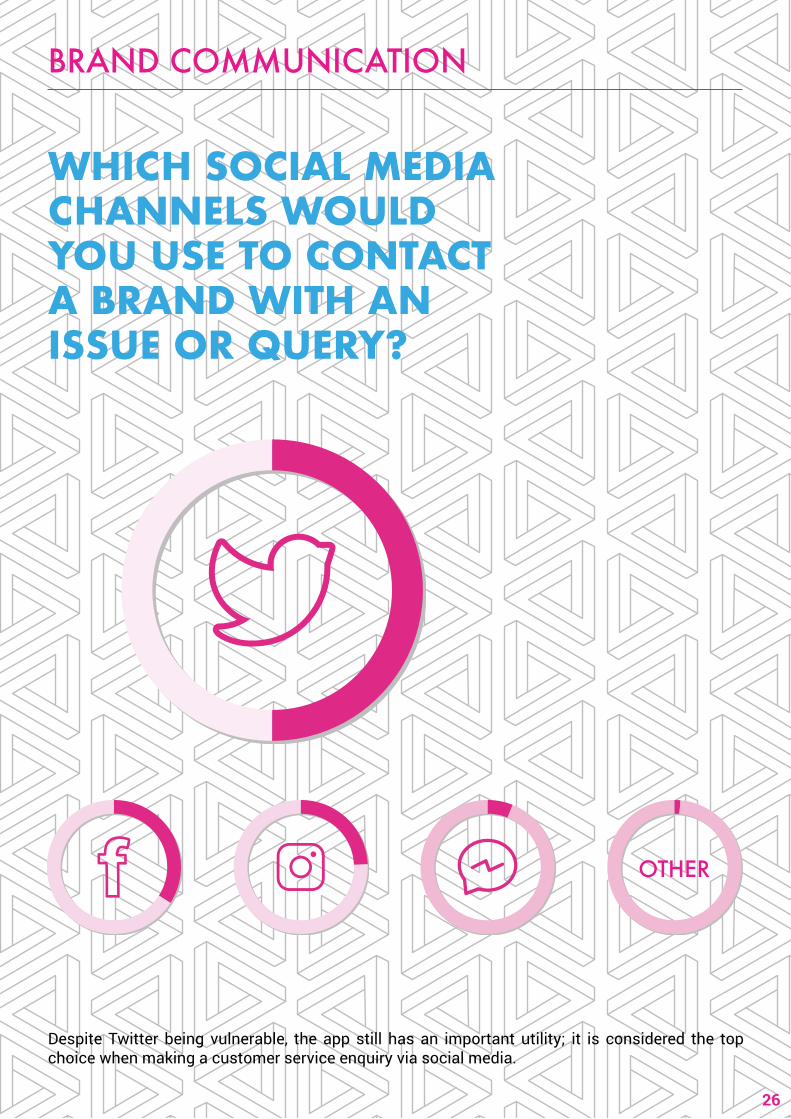
Despite Twitter being vulnerable, the app still has an important utility; it is considered the top choice when making a customer service enquiry via social media.
BRAND COMMUNICATION
26
WHICH SOCIAL MEDIA CHANNELS WOULD YOU USE TO CONTACT A BRAND WITH AN ISSUE OR QUERY?
OTHER
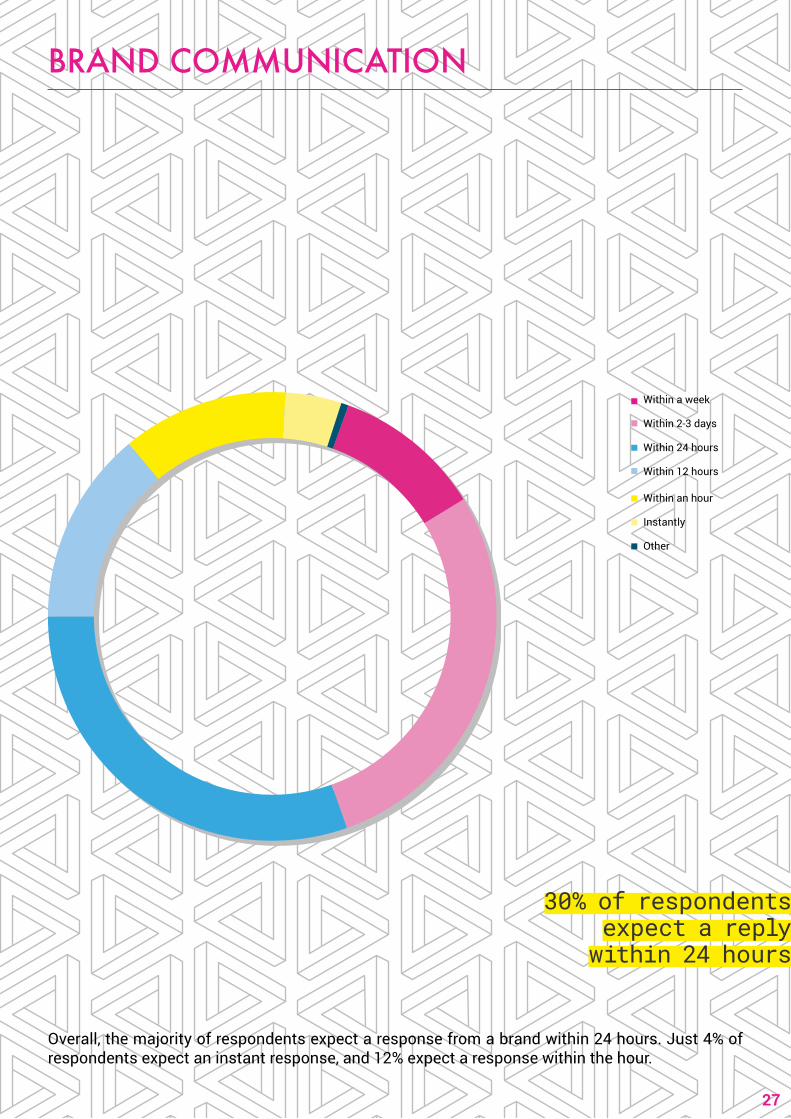
HOW QUICKLY DO YOU EXPECT A RESPONSE FROM A BRAND?
BRAND COMMUNICATION
Overall, the majority of respondents expect a response from a brand within 24 hours. Just 4% of respondents expect an instant response, and 12% expect a response within the hour.
27
30% of respondents expect a reply within 24 hours
Within a week
Within 2-3 days
Within 24 hours
Within 12 hours
Within an hour
Instantly
Other
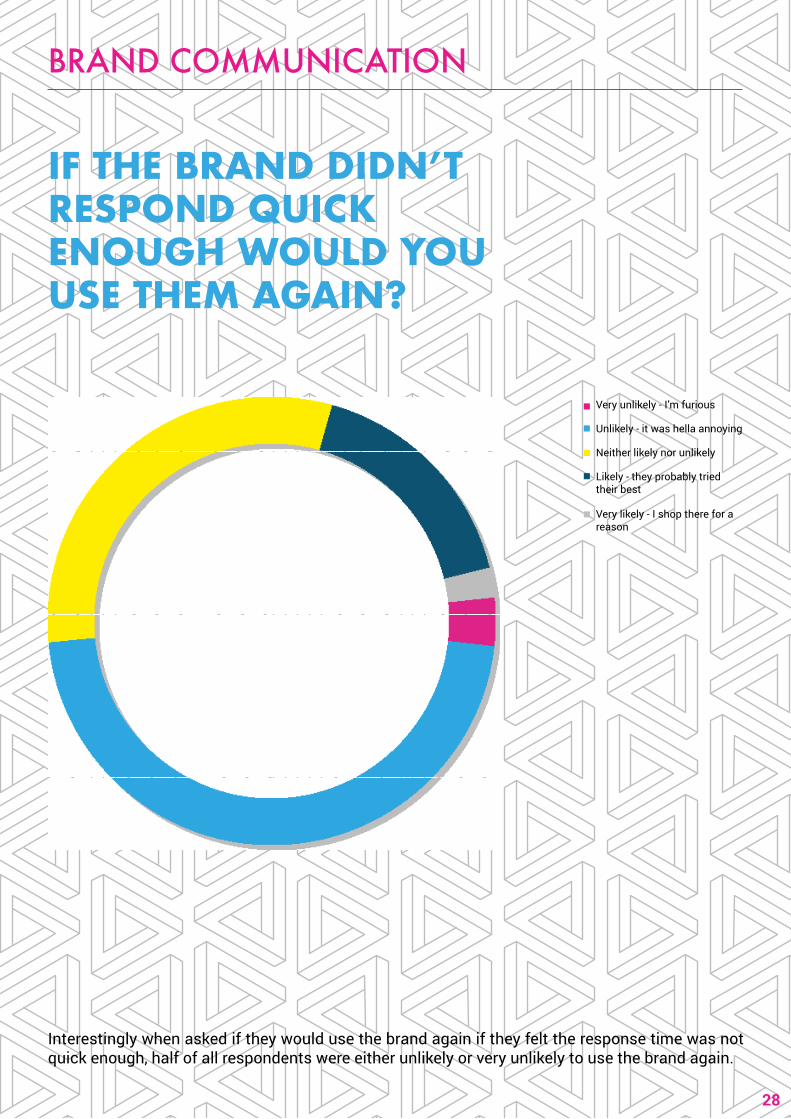
IF THE BRAND DIDN’T RESPOND QUICK ENOUGH WOULD YOU USE THEM AGAIN?
BRAND COMMUNICATION
Interestingly when asked if they would use the brand again if they felt the response time was not quick enough, half of all respondents were either unlikely or very unlikely to use the brand again.
Very unlikely - I’m furious
Unlikely - it was hella annoying
Neither likely nor unlikely
Likely - they probably tried their best
Very likely - I shop there for a reason
28
FINAL FINDINGS BRAND TRENDS
‘Companies that treat their employees fairly’, ‘animal welfare records’ and ‘fair-trade & ethically-purchased products’ were the most persuasive ethical factors for respondents when choosing which brands to use.
03
Both females and males indicated that racist, sexist or insensitive advertising would be the most likely action to prevent them from using a brand from the available options.
04
Customer reviews were the biggest influence on what products they buy, followed by recommendations by both friends and family.
05
16-18 year olds told us that they are more influenced by social media adverts and digital adverts compared to their older counterparts.
06
Email was the preferred medium to receive communications from brands, followed by Facebook and Instagram.
07
Females were open to receiving more emails per week than males.
08
Respondents would prefer to use email, over other communication methods, to get in touch with a brand about an issue or query.
09
Offensive, sexist or racist content would be the most likely reason for respondents to unfollow a brand on social media.
01
Females are more likely to consider ethical factors when making a purchase compared to males.
02
29
61% of respondent’s expected a response from a brand within 24 hours.
11
FINAL FINDINGS BRAND TRENDS
Half of the respondents were either unlikely or very unlikely to use a brand again if they felt the the response time was not quick enough.
13
ASOS, Nike, Amazon, Apple and Adidas were the respondents favourite brands.
12
Females preferred clothing brands, for example New Look, Topshop and H&M, whereas males saw technology brands such as Samsung, Sony and Google appear in their top 10 favourite brands list.
14
58% of respondents indicated their purchase decisions would not be affected that much if a brand created cringeworthy adverts.
16
Respondents would rather spend their money on experiences, such as travel and holidays, than alcohol or health and fitness.
17
Twitter was the preferred social media channel to raise an issue/query with a brand.
10
79% of respondents indicated that they can tell if a brand has talked to hip, cool and “with it” youngsters before creating adverts.
15
30
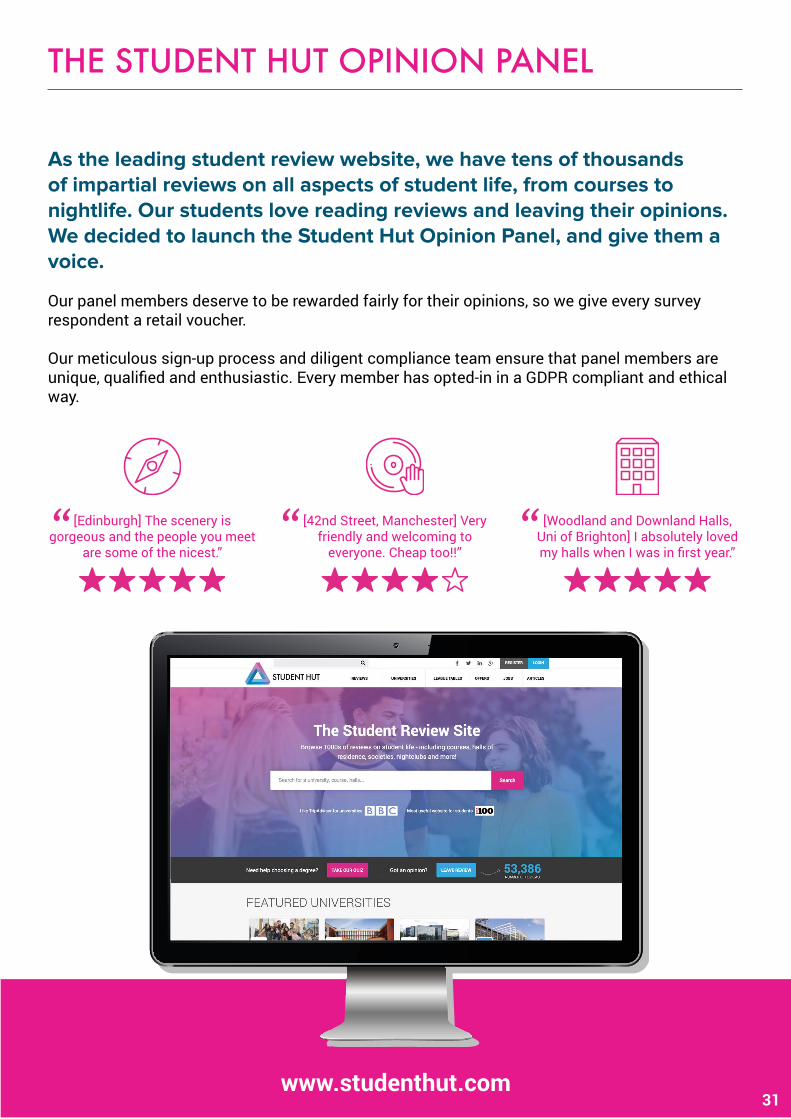
As the leading student review website, we have tens of thousands of impartial reviews on all aspects of student life, from courses to nightlife. Our students love reading reviews and leaving their opinions. We decided to launch the Student Hut Opinion Panel, and give them a voice.
Our panel members deserve to be rewarded fairly for their opinions, so we give every survey respondent a retail voucher.
Our meticulous sign-up process and diligent compliance team ensure that panel members are unique, qualified and enthusiastic. Every member has opted-in in a GDPR compliant and ethical way.
THE STUDENT HUT OPINION PANEL
www.studenthut.com31
[Edinburgh] The scenery is gorgeous and the people you meet
are some of the nicest.”
[42nd Street, Manchester] Very friendly and welcoming to
everyone. Cheap too!!”
[Woodland and Downland Halls, Uni of Brighton] I absolutely loved my halls when I was in first year.”
Contact our experts at [email protected] or call us on +44 0207 183 2681to discuss putting together a bespoke market research project.
/StudentHut @StudentHutUK @StudentHut