1 office for state, tribal, local and territorial support presents... cdc vital signs progress on...
TRANSCRIPT

1
Office for State, Tribal, Local and Territorial Supportpresents . . .
CDC Vital SignsProgress on Childhood Obesity:
Many States Show Declines
August 13, 2013
2:00–3:00 pm (EDT)
Welcome
Centers for Disease Control and PreventionOffice for State, Tribal, Local and Territorial Support

2
Agenda2:00 pm Welcome & Introductions Richard Schieber, MD
Coordinator, CDC Vital Signs Program, CDC
2:04 pm Presentations Lieutenant Commander Ashleigh L. May, PhDEpidemiologist, Obesity Prevention and Control Branch, National Center for Chronic Disease Prevention and Health Promotion, CDC
Lonias Gilmore, MPHPublic Health Consultant, Nutrition, Physical Activity and Obesity Training Coordinator, Michigan Department of Community Health
Loretta A. Santilli, MPHDirector, Division of Nutrition, New York State Department of Health
2:30 pm Q&A and Discussion Richard Schieber, MD
2:55 pm Wrap-up
3:00 pm End of Call
3
Vital Signs Teleconference
to support STLT efforts and build momentum around the monthly
release of CDC Vital Signs

4
CDC Vital Signs Town Hall Teleconference
Progress on Childhood ObesityMany States Show Declines
Lieutenant Commander Ashleigh L. May, PhD
Epidemiologist Division of Nutrition, Physical Activity, and Obesity
National Center for Chronic Disease Prevention and Health PromotionCenters for Disease Control and Prevention
August 13, 2013
National Center for Chronic Disease Prevention and Health Promotion Division of Nutrition, Physical Activity, and Obesity

5
Key Findings
After decades of rising, obesity rates among low-income preschoolers are now showing small, but significant declines in many states: Small declines in 19 of 43 states and territories
Small increases in 3 of 43 states and territories
No change in 21 of 43 states and territories

6
Figure 1. Decreases and increases*† in obesity§ prevalence from 2008 to 2011 among low-income preschool-aged children—Pediatric Nutrition Surveillance System (PedNSS), United States
* Trends assessed by logistic regression models adjusted for age, sex, and race/ethnicity† Annual decreases and increases in obesity are statistically significant at p<0.05§ Obesity defined as having an age- and sex-specific body mass index ≥95th percentile, according to the 2000 CDC growth charts

7
Figure 2. Prevalence of obesity* among low-income, preschool-aged children—PedNSS, United States, 2011
* Obesity defined as having an age- and sex-specific body mass index ≥95th percentile, according to the 2000 CDC growth charts
8
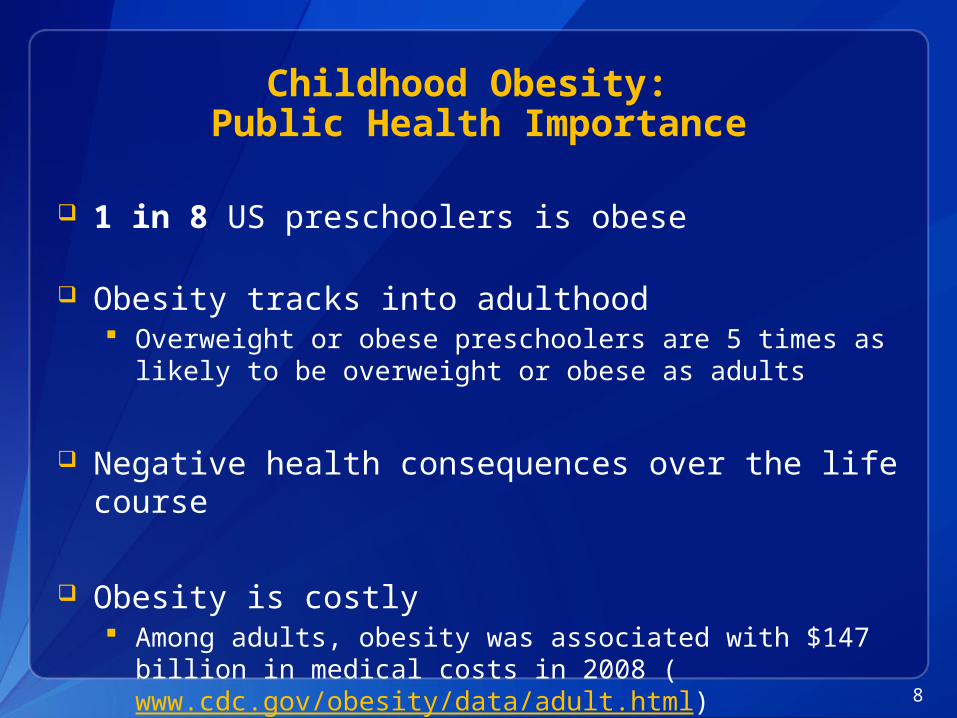
Childhood Obesity: Public Health Importance
1 in 8 US preschoolers is obese
Obesity tracks into adulthood Overweight or obese preschoolers are 5 times as likely to be
overweight or obese as adults
Negative health consequences over the life course
Obesity is costly Among adults, obesity was associated with $147 billion in medical
costs in 2008 (www.cdc.gov/obesity/data/adult.html)

9
State and Local Officials Can Help Reduce Obesity
Role of State and Local Officials Creating partnerships with diverse stakeholders
Increasing access to healthy, affordable food and beverages
Providing access to safe, free drinking water
Helping local schools open gyms, playgrounds, and sports fields during non-school hours
Encouraging the use of best practices for nutrition, physical activity, and screen time in child care
10
Resources
Vital Signs Town Hall Teleconference www.cdc.gov/stltpublichealth/townhall
Vital Signs www.cdc.gov/vitalsigns
Overweight and Obesity www.cdc.gov/obesity Childhood Overweight and Obesity www.cdc.gov/obesity/childhood
CDC’s State Indicator Reports www.cdc.gov/obesity/resources/reports.html

11
Questions?
For more information, please contact Centers for Disease Control and Prevention
1600 Clifton Road NE, Atlanta, GA 30333Telephone: 1-800-CDC-INFO (232-4636)/TTY: 1-888-232-6348E-mail: [email protected] Web: http://www.cdc.gov
The findings and conclusions in this report are those of the authors and do not necessarily represent the official position of the Centers for Disease Control and Prevention.
National Center for Chronic Disease Prevention and Health PromotionDivision of Nutrition, Physical Activity, and Obesity
12
Reducing Barriers to Eating Smart and Moving More for Michigan’s Low-Income Families
Lonias Gilmore, MPHPublic Health Consultant and
Nutrition, Physical Activity, and Obesity Training CoordinatorMichigan Department of Community Health
12

13
Environmental support increases opportunities for low-income families with children to eat healthier and move more.
13
14
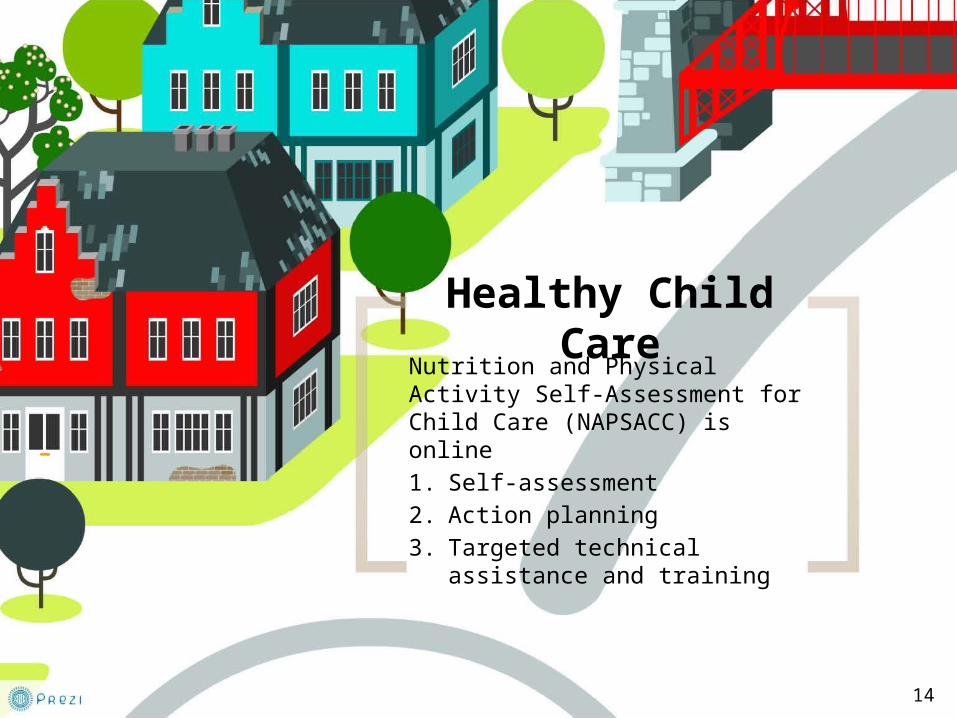
Healthy Child CareNutrition and Physical Activity Self-Assessment for Child Care (NAPSACC) is online1. Self-assessment 2. Action planning 3. Targeted technical assistance
and training
14

15
Healthy Child CareNAPSACC has reached more
than 7,000 low-income children aged 5 years and
under in nearly 100 licensed childcare centers.
15

1616

17
Healthy Communities: Adequate and Safe Parks and Trails
Park improvements have the potential to increase access to physical activity for about 4,800 children from low-income families.
17

1818
19
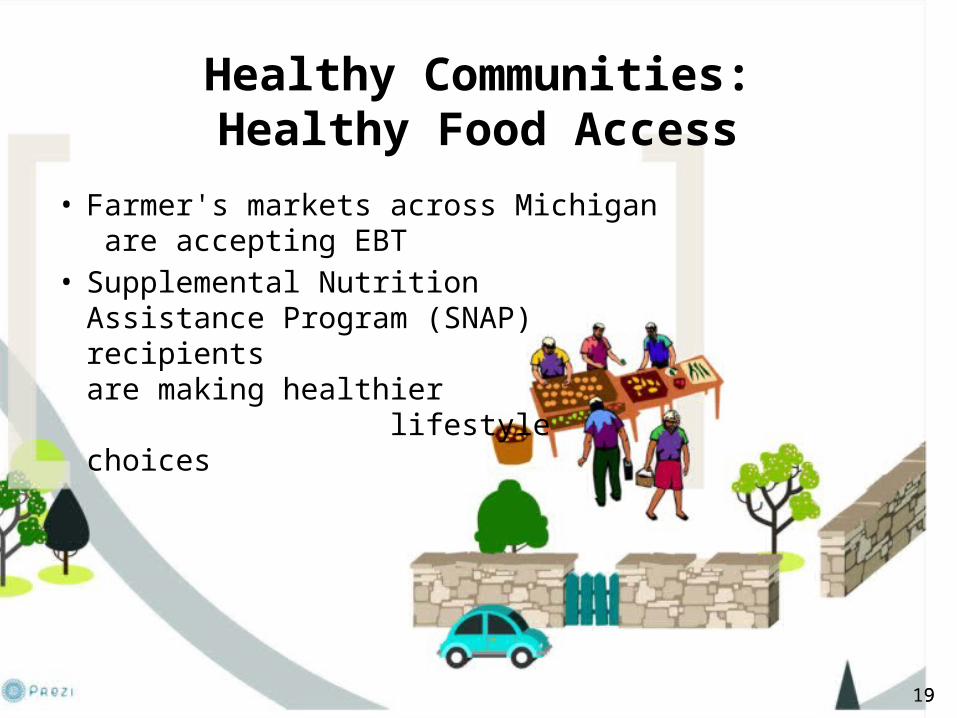
Healthy Communities:Healthy Food Access
• Farmer's markets across Michigan are accepting EBT
• Supplemental Nutrition Assistance Program (SNAP) recipients are making healthier lifestyle choices
19

2020

21
Lessons Learned
• Partnerships are key• Building capacity in local jurisdictions works• Policies make it stick
21
2222

23
Making the “healthy choice” the
“easy choice” for low-income families
with young children
23

24
Lonias Gilmore, MPHEmail: [email protected] Michigan Healthy Childcare: http://mihealthtools.org/childcare
MDCH Department of Community Health: http://www.michigan.gov/preventobesity
24

25
Coordinated Efforts Reversing the Trend of Childhood Obesity
in New York State
Vital Signs Town Hall Teleconference August 13, 2013
Loretta A. Santilli, MPHDirector, Division of Nutrition
New York State Department of [email protected]

26
Why Do We Care?
• Obesity in children and adolescents has tripled over the past three decades and has reached epidemic proportions
• Approximately one-third of children in New York State (NYS) are overweight or obese
• Total obesity-related healthcare costs in NYS are estimated at $11.8 billion every year
Unless we reverse this trend, children may face a shorter lifespan than their parents
27
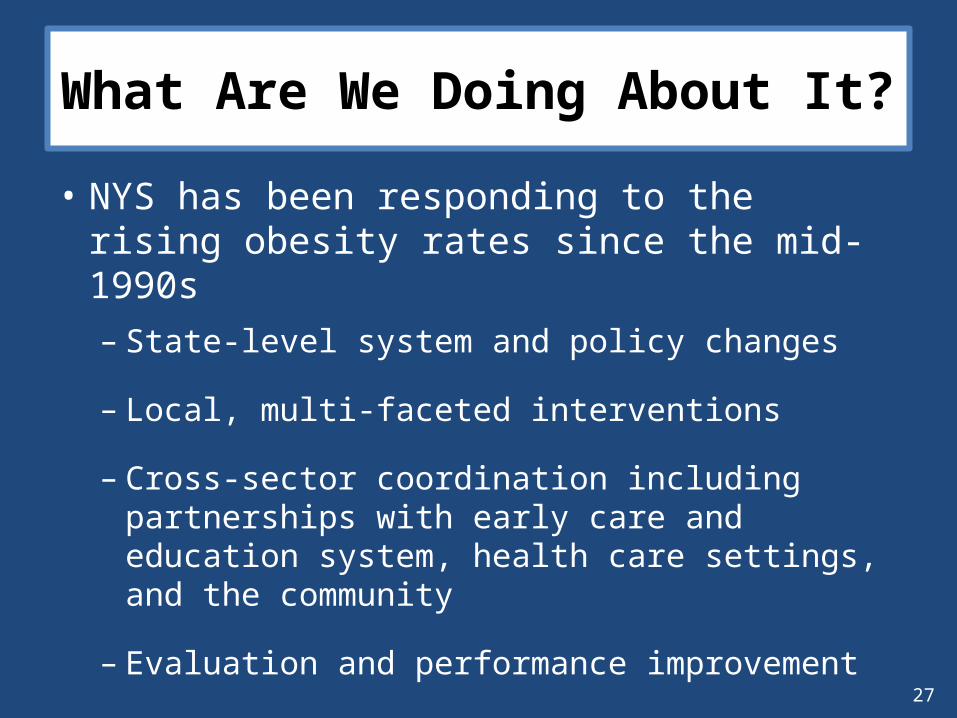
What Are We Doing About It?
• NYS has been responding to the rising obesity rates since the mid-1990s– State-level system and policy changes
– Local, multi-faceted interventions
– Cross-sector coordination including partnerships with early care and education system, health care settings, and the community
– Evaluation and performance improvement

28
Prevention Is the Best Cure!
• Comprehensive Obesity Prevention Strategies– Support healthy food and beverage choices • Increase access to and consumption of non-fat/low-fat
milk, fruits & vegetables, and whole grains
– Promote and support breastfeeding
– Encourage physical activity and limit sedentary activity (like screen viewing) among children and youth
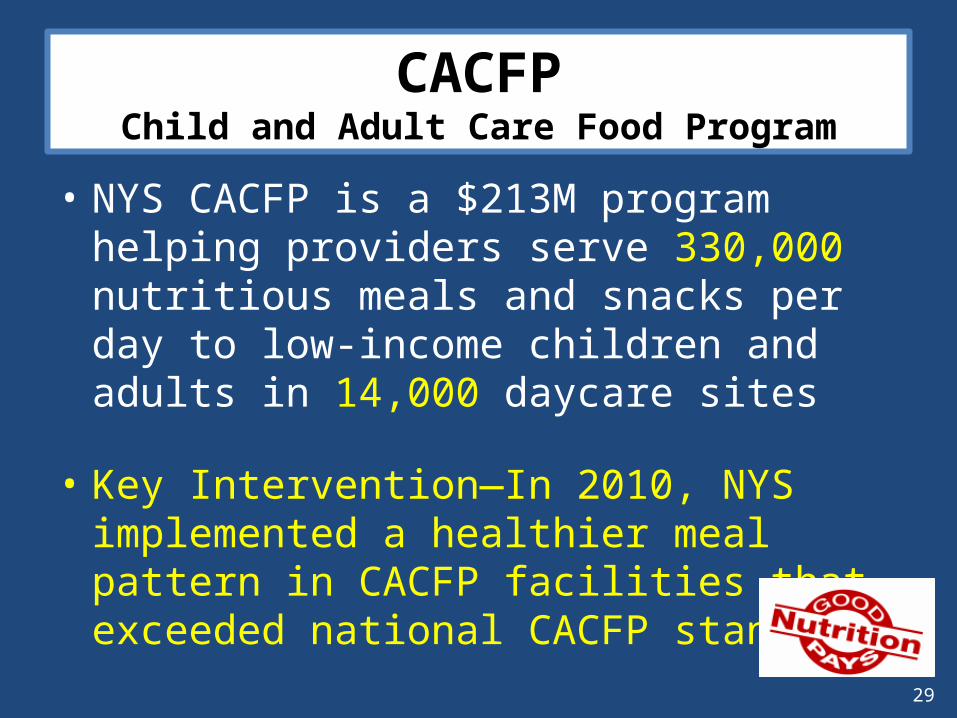
29
• NYS CACFP is a $213M program helping providers serve 330,000 nutritious meals and snacks per day to low-income children and adults in 14,000 daycare sites
• Key Intervention—In 2010, NYS implemented a healthier meal pattern in CACFP facilities that exceeded national CACFP standards
CACFPChild and Adult Care Food Program
30
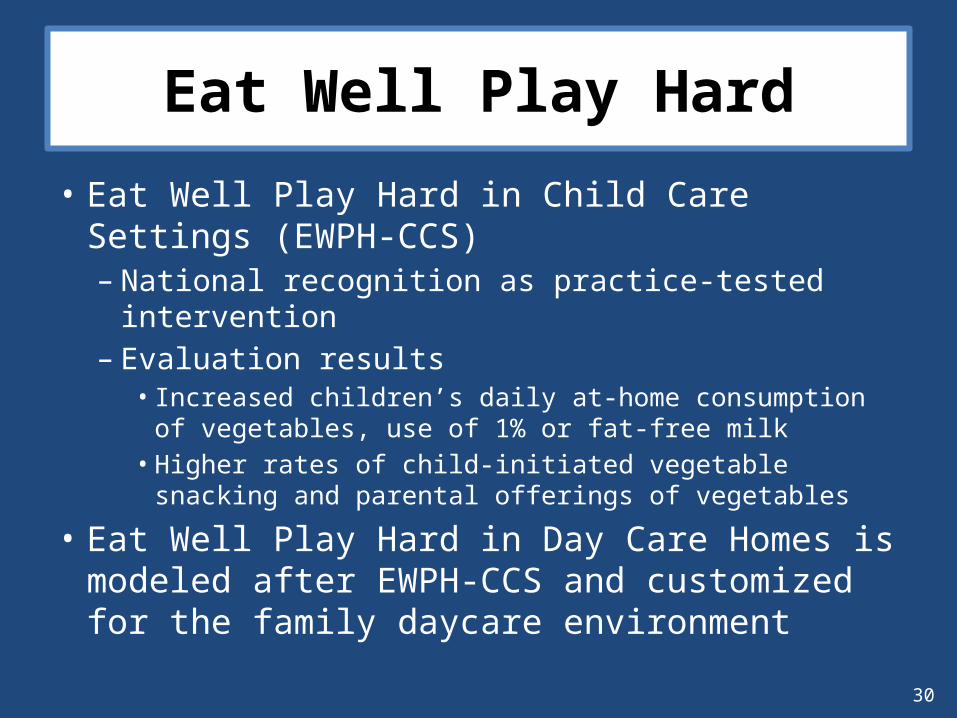
Eat Well Play Hard
• Eat Well Play Hard in Child Care Settings (EWPH-CCS)– National recognition as practice-tested intervention– Evaluation results
• Increased children’s daily at-home consumption of vegetables, use of 1% or fat-free milk
• Higher rates of child-initiated vegetable snacking and parental offerings of vegetables
• Eat Well Play Hard in Day Care Homes is modeled after EWPH-CCS and customized for the family daycare environment

31
NAPSACC
• Statewide implementation of the Nutrition and Physical Activity Self-Assessment for Child Care (NAPSACC)– NAPSACC reached 254 child care facilities, 2,250
staff, and 11,430 children – Providers completing the intervention improved
nutrition and physical activity practices – Sustained improvements at 2 to 3 years were
associated with written policies

32
• $550M federal grant program in NYS providing supplemental nutritious foods, information on healthy eating, and referrals to health care– Average monthly caseload is approximately
512,000 low-income women, infants, and children – WIC serves about 50% of all infants born in NYS
• Key Interventions—Changes to WIC food packages and WIC Healthy Lifestyles Initiative
WICSupplemental Nutrition Program for Women, Infants, and Children

33
WIC Interventions
• In 2009, New York became the first state in the nation to revamp its WIC food packages to reflect the latest science on healthy diets and address obesity
• WIC Healthy Lifestyles Initiative encourages participants and their families to adopt a healthier lifestyle through physical activity and improved nutrition– Implementation of FitWIC, a fun, low-cost, and
innovative education approach to promote physical activity at all 100 WIC agencies

34
Breastfeeding Support Activities
• Designed to increase the initiation, duration, and exclusivity of breastfeeding in NYS
• WIC activities– Breastfeeding mother food package designed to support exclusive
breastfeeding consistent with AAP policy statement– Loving Support Peer Counseling Program– Breastfeeding coordinators in local agencies– Breast pumps as needed– Making It Work Toolkit for working moms
• CACFP Breastfeeding Friendly Child Care Initiative– 549 breastfeeding-friendly designated CACFP participants
• Breastfeeding Quality Improvement in Hospitals– 16 breastfeeding-friendly hospitals in NYS

35
State-Level Partnerships
• Obesity Prevention in Child Care Partnership– Affiliated with the NYS Early Childhood Advisory
Council– Advanced statewide adoption of obesity
prevention best practices in child care settings – Resulted in the incorporation of nutrition, physical
activity, screen time, and breastfeeding standards in NYS’s child care quality-rating improvement system and in revised child care regulations
36
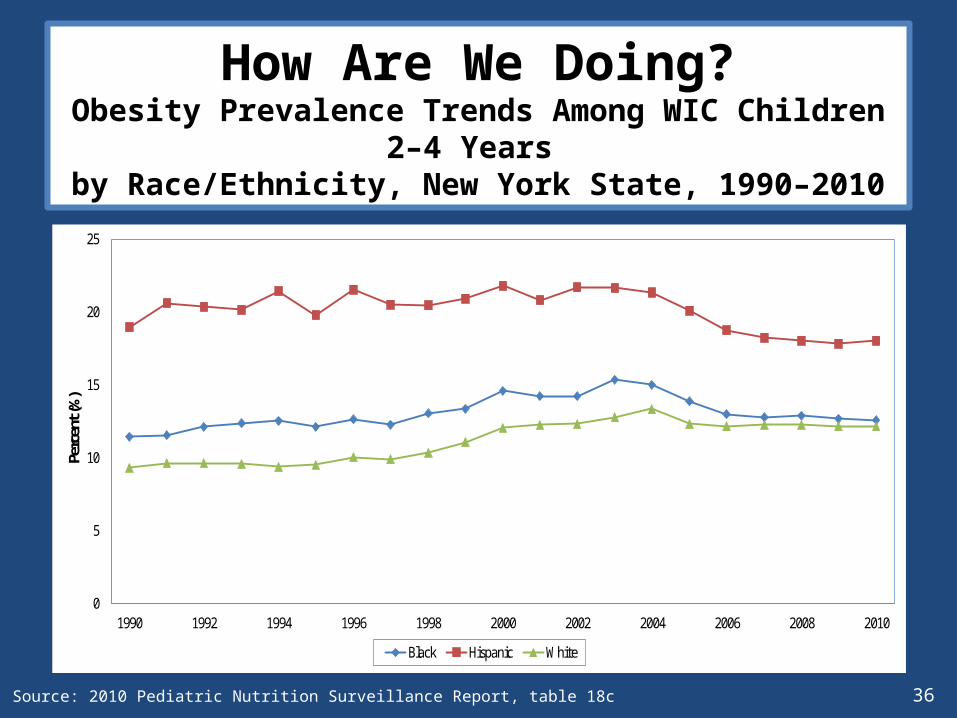
How Are We Doing?Obesity Prevalence Trends Among WIC Children 2–4 Years
by Race/Ethnicity, New York State, 1990–2010
0
5
10
15
20
25
1990 1992 1994 1996 1998 2000 2002 2004 2006 2008 2010
Perc
ent (
%)
Black Hispanic White
1990-2003 (↑2.7 )
1989-2003 (↑3.9)
1989-2003 (↑3.4)
2003-2010 (↓3.6)
2003-2010 (↓2.8)
2003-2010 (↓0.6)
Source: 2010 Pediatric Nutrition Surveillance Report, table 18c

37
We ARE Reversing the Trend!
• Obesity among children 2–5 years of age participating in WIC decreased from 16.7% in 2003 to 14.3% in 2011.
• By 2011, approximately 6,800 more children 2–5 years in WIC were drinking low-fat or fat-free milk compared to whole milk (66.4% in 2009 to 69.4% in 2011).
• Breastfeeding initiation rates among WIC participants increased from 72% in 2008 to 79% in 2012.

38
Lessons Learned
• Isolated initiatives are not sufficient to improve and sustain obesity prevention practice
• State agencies can establish obesity prevention practices and standards and monitor performance
• Nutrition, physical activity, screen time, and breastfeeding interventions can help promote and support practice improvements in multiple settings, including early child care and education centers
• Partnerships are essential to engage key stakeholders in individually and collectively addressing early childhood obesity and sustaining obesity prevention best practices over time
39
CDC Vital Signs Electronic Media Resources
Become a fan on Facebookwww.facebook.com/cdc
Follow us on Twittertwitter.com/CDCgov/
Syndicate Vital Signs on your websitehttp://tools.cdc.gov/syndication/search.aspx?searchURL=www.cdc.gov%2fvitalsigns
Vital Signs interactive buttons and bannerswww.cdc.gov/vitalsigns/SocialMedia.html
40
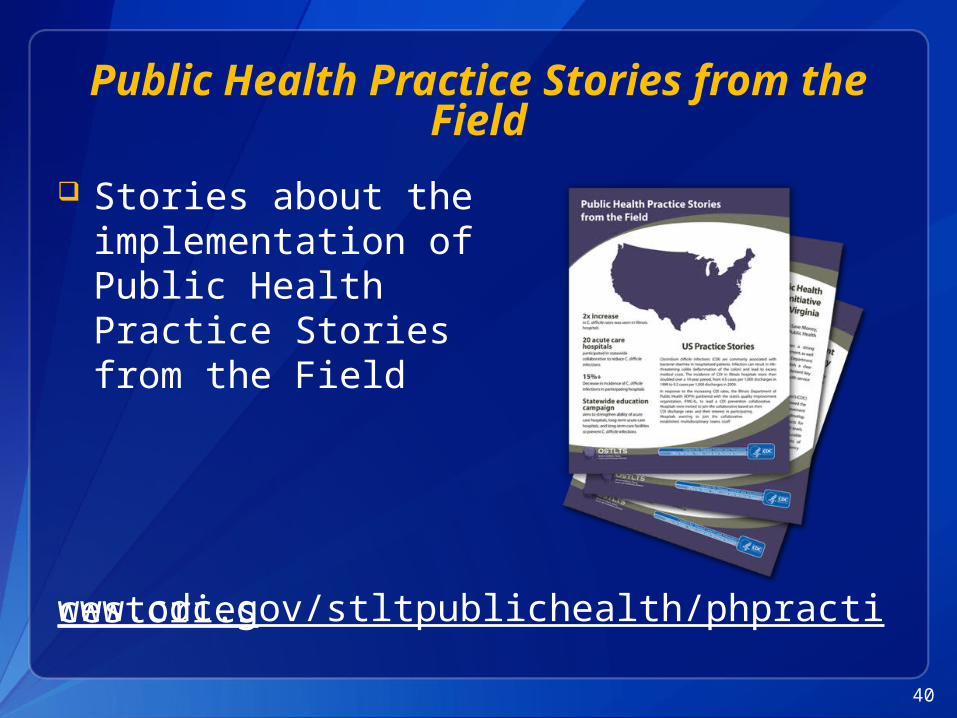
Public Health Practice Stories from the Field
Stories about the implementation of Public Health Practice Stories from the Field
www.cdc.gov/stltpublichealth/phpracticestories
41
For more information, please contact Centers for Disease Control and Prevention.
1600 Clifton Road NE, Atlanta, GA 30333Telephone, 1-800-CDC-INFO (232-4636)/TTY: 1-888-232-6348Email: [email protected] Web: www.cdc.gov
The findings and conclusions in this presentation are those of the authors and do not necessarily represent the official position of the Centers for Disease Control and Prevention.
Please mark your calendars for the next Vital Signs Town Hall Teleconference
September 10, 20132:00–3:00 pm (EDT)
Centers for Disease Control and PreventionOffice for State, Tribal, Local and Territorial Support
Provide feedback on this teleconference: [email protected]