11 4040 22 2014 83693 - online exam...
TRANSCRIPT
This document consists of 19 printed pages and 1 blank page.
DC (NF/SLM) 83693/3© UCLES 2014 [Turn over
Cambridge International ExaminationsCambridge Ordinary Level
*9950000248*
STATISTICS 4040/22
Paper 2 October/November 2014
2 hours 15 minutes
Candidates answer on the question paper.
Additional Materials: Pair of compasses Protractor
READ THESE INSTRUCTIONS FIRST
Write your Centre number, candidate number and name on all the work you hand in.Write in dark blue or black pen.You may use an HB pencil for any diagrams or graphs.Do not use staples, paper clips, glue or correction fluid.DO NOT WRITE IN ANY BARCODES.
Answer all questions in Section A and not more than four questions from Section B.If working is needed for any question it must be shown below that question.The use of an electronic calculator is expected in this paper.
At the end of the examination, fasten all your work securely together.The number of marks is given in brackets [ ] at the end of each question or part question.
www.onlineexamhelp.com
ww
w.o
nlin
eexa
mhe
lp.c
om

2
4040/22/O/N/14© UCLES 2014
Section A [36 marks]
Answer all of the questions 1 to 6.
1 (i) Explain the meaning of the term ‘discrete variable’.
...................................................................................................................................................
.............................................................................................................................................. [1]
(ii) Give an example of a continuous variable.
.............................................................................................................................................. [1]
(iii) Explain the meaning of the term ‘qualitative variable’.
...................................................................................................................................................
.............................................................................................................................................. [1]
(iv) Give an example of a discrete quantitative variable.
.............................................................................................................................................. [1]
3
4040/22/O/N/14© UCLES 2014 [Turn over
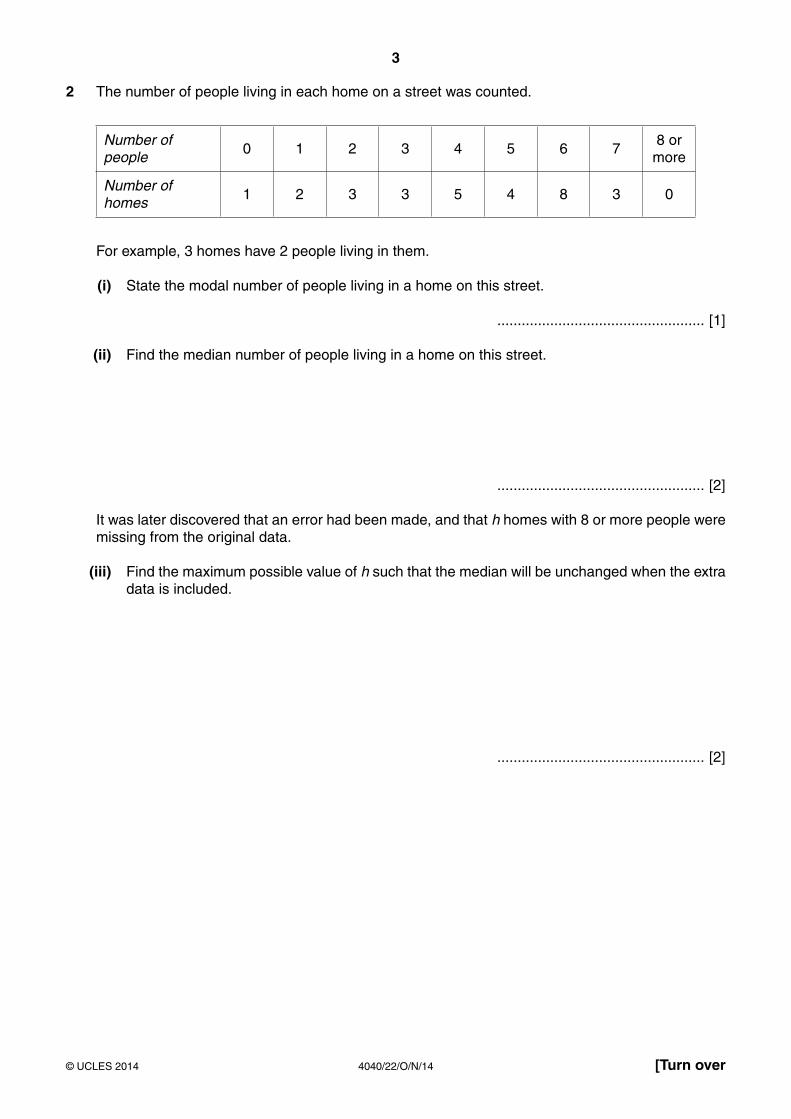
2 The number of people living in each home on a street was counted.
Number of people
0 1 2 3 4 5 6 78 or more
Number of homes
1 2 3 3 5 4 8 3 0
For example, 3 homes have 2 people living in them.
(i) State the modal number of people living in a home on this street.
................................................... [1]
(ii) Find the median number of people living in a home on this street.
................................................... [2]
It was later discovered that an error had been made, and that h homes with 8 or more people were missing from the original data.
(iii) Find the maximum possible value of h such that the median will be unchanged when the extra data is included.
................................................... [2]
4
4040/22/O/N/14© UCLES 2014
3 Maria and Nico each have a tin containing 5 white, 8 milk and 7 dark chocolates.
(i) Maria selects two chocolates at random from her tin and eats them.
Find the probability that
(a) both are white chocolates,
................................................... [2]
(b) exactly one is a white chocolate.
................................................... [2]
(ii) Nico selects chocolates at random from his tin until he finds a milk chocolate. He returns unwanted chocolates to the tin after each selection.
Find the probability that it will take him fewer than 3 attempts to find a milk chocolate.
................................................... [2]
www.onlineexamhelp.com
ww
w.o
nlin
eexa
mhe
lp.c
om
5
4040/22/O/N/14© UCLES 2014 [Turn over
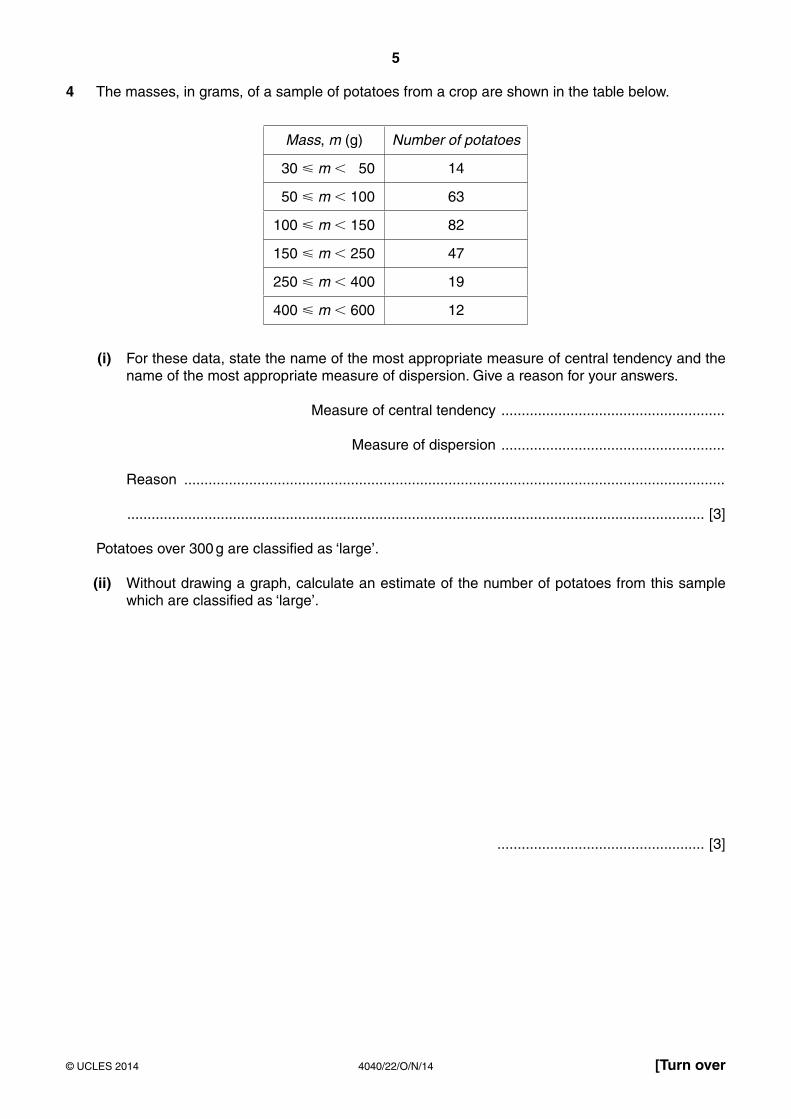
4 The masses, in grams, of a sample of potatoes from a crop are shown in the table below.
Mass, m (g) Number of potatoes
30 � m � 50 14
50 � m � 100 63
100 � m � 150 82
150 � m � 250 47
250 � m � 400 19
400 � m � 600 12
(i) For these data, state the name of the most appropriate measure of central tendency and the name of the most appropriate measure of dispersion. Give a reason for your answers.
Measure of central tendency .......................................................
Measure of dispersion .......................................................
Reason .....................................................................................................................................
.............................................................................................................................................. [3]
Potatoes over 300 g are classified as ‘large’.
(ii) Without drawing a graph, calculate an estimate of the number of potatoes from this sample which are classified as ‘large’.
................................................... [3]

6
4040/22/O/N/14© UCLES 2014
5 At a school the 100 male and 120 female students choose to study one of the three options Music, Drama or Art.
Their choices are illustrated in the chart below.
0
10
20
30
40
50
60
70
80
90
100
Percentageof students
Male
Art
Drama
Music
Female
(i) State the full name for this type of chart.
...............................................................................................................................................[1]
(ii) Calculate the numbers of males and females taking each option and insert them into the table below.
Music Drama Art
Male
Female
[2]
7
4040/22/O/N/14© UCLES 2014 [Turn over
(iii) Display your data from part (ii) in a fully-labelled dual bar chart using the key provided.
Male
Female
[3]
(iv) Give one advantage that the dual bar chart you have drawn has over the chart given at the start of the question.
...................................................................................................................................................
.............................................................................................................................................. [1]
8
4040/22/O/N/14© UCLES 2014
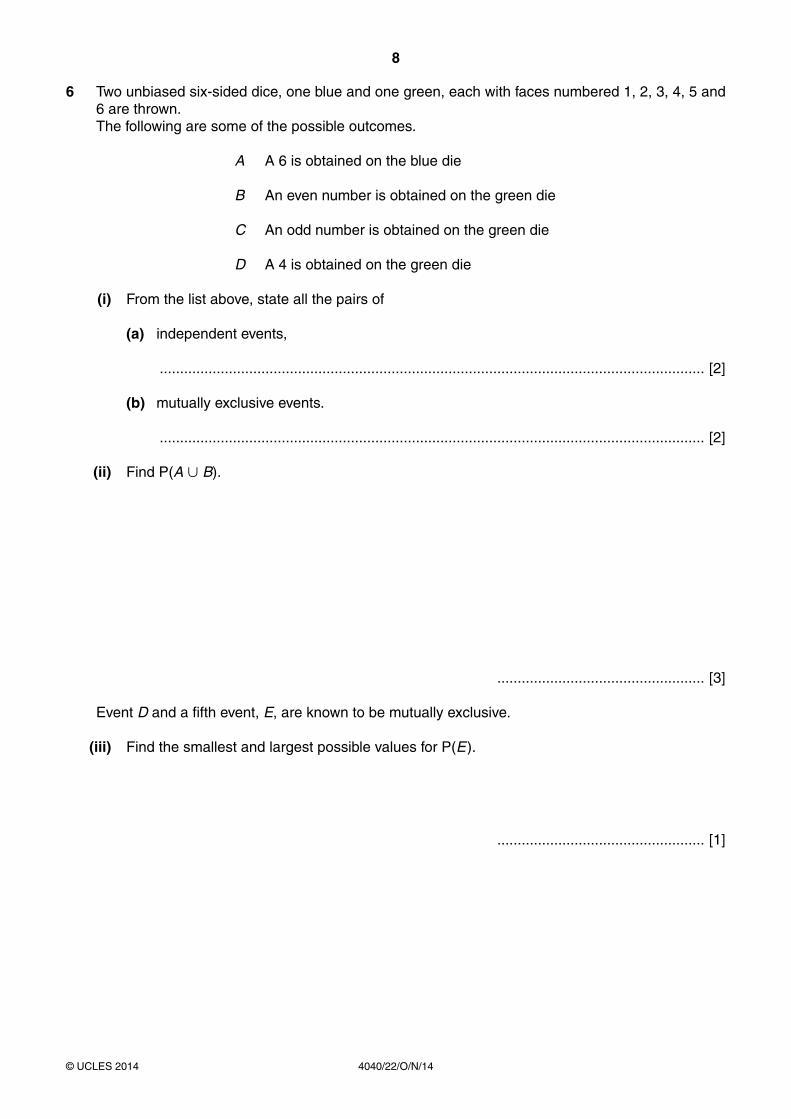
6 Two unbiased six-sided dice, one blue and one green, each with faces numbered 1, 2, 3, 4, 5 and 6 are thrown.
The following are some of the possible outcomes.
A A 6 is obtained on the blue die
B An even number is obtained on the green die
C An odd number is obtained on the green die
D A 4 is obtained on the green die
(i) From the list above, state all the pairs of
(a) independent events,
...................................................................................................................................... [2]
(b) mutually exclusive events.
...................................................................................................................................... [2]
(ii) Find P(A ∪ B).
................................................... [3]
Event D and a fifth event, E, are known to be mutually exclusive.
(iii) Find the smallest and largest possible values for P(E).
................................................... [1]
9
4040/22/O/N/14© UCLES 2014 [Turn over
Section B [64 marks]
Answer not more than four of the questions 7 to 11.
Each question in this section carries 16 marks.
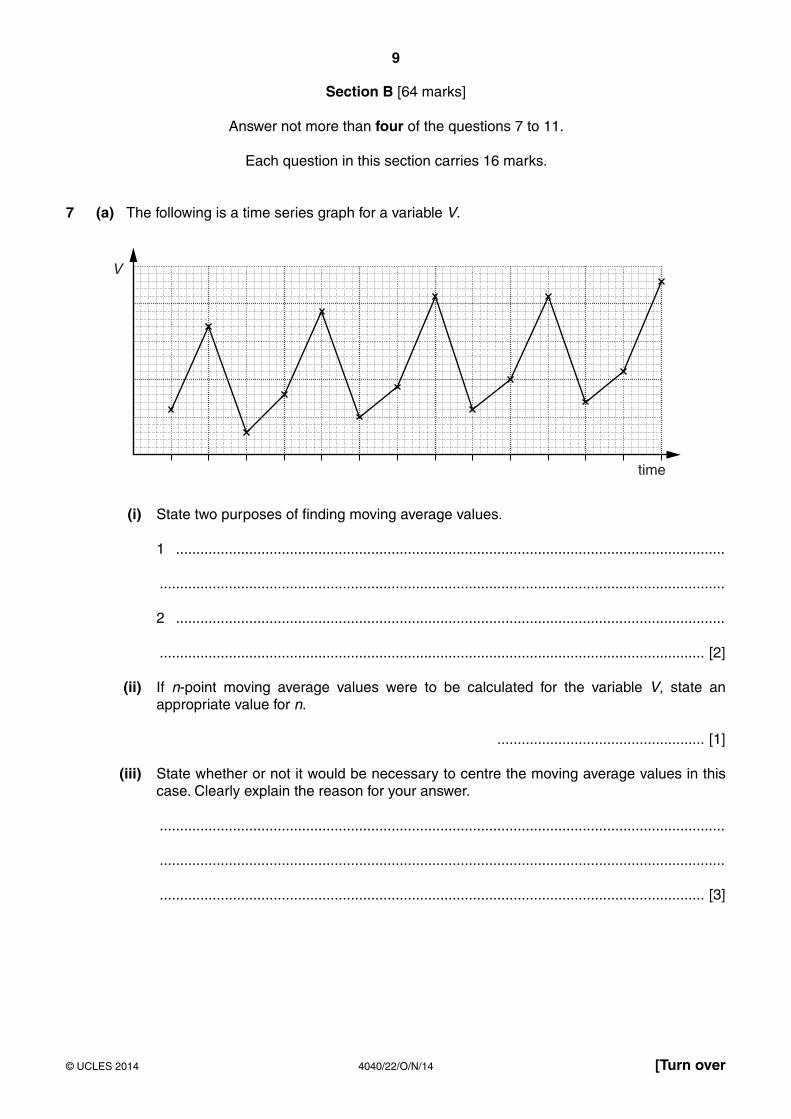
7 (a) The following is a time series graph for a variable V.
V
time
(i) State two purposes of finding moving average values.
1 .......................................................................................................................................
...........................................................................................................................................
2 .......................................................................................................................................
...................................................................................................................................... [2]
(ii) If n-point moving average values were to be calculated for the variable V, state an appropriate value for n.
................................................... [1]
(iii) State whether or not it would be necessary to centre the moving average values in this case. Clearly explain the reason for your answer.
...........................................................................................................................................
...........................................................................................................................................
...................................................................................................................................... [3]
10
4040/22/O/N/14© UCLES 2014
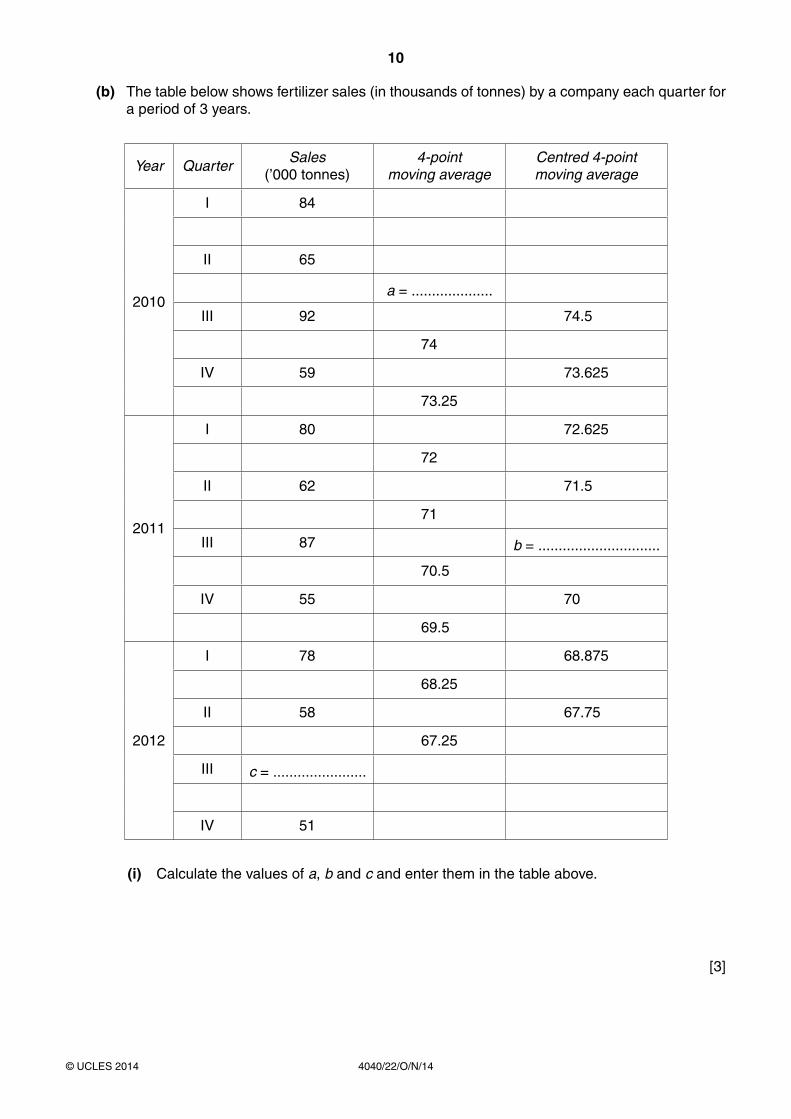
(b) The table below shows fertilizer sales (in thousands of tonnes) by a company each quarter for a period of 3 years.
Year QuarterSales
(’000 tonnes)4-point
moving averageCentred 4-pointmoving average
2010
I 84
II 65
a = ....................
III 92 74.5
74
IV 59 73.625
73.25
2011
I 80 72.625
72
II 62 71.5
71
III 87 b = ..............................
70.5
IV 55 70
69.5
2012
I 78 68.875
68.25
II 58 67.75
67.25
III c = .......................
IV 51
(i) Calculate the values of a, b and c and enter them in the table above.
[3]
11
4040/22/O/N/14© UCLES 2014 [Turn over
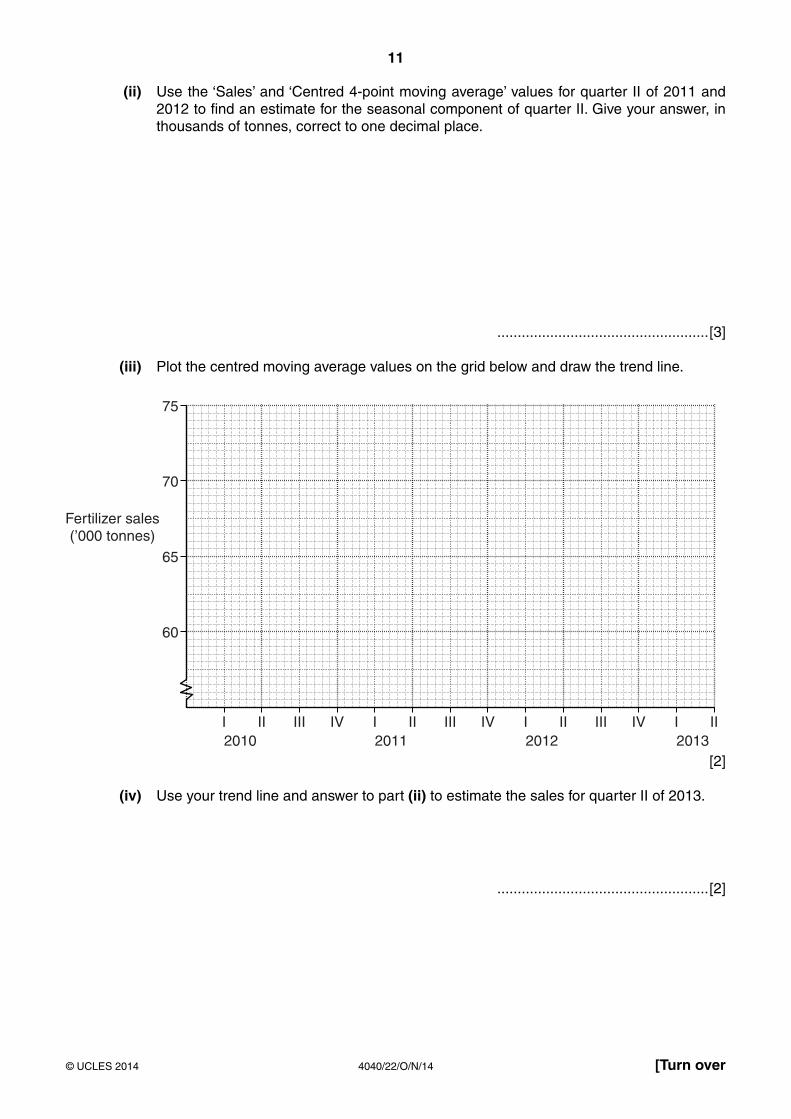
(ii) Use the ‘Sales’ and ‘Centred 4-point moving average’ values for quarter II of 2011 and 2012 to find an estimate for the seasonal component of quarter II. Give your answer, in thousands of tonnes, correct to one decimal place.
....................................................[3]
(iii) Plot the centred moving average values on the grid below and draw the trend line.
I II III IV I II III IV I II III IV I II2010 2011 2012 2013
Fertilizer sales(’000 tonnes)
60
65
70
75
[2]
(iv) Use your trend line and answer to part (ii) to estimate the sales for quarter II of 2013.
....................................................[2]
12
4040/22/O/N/14© UCLES 2014
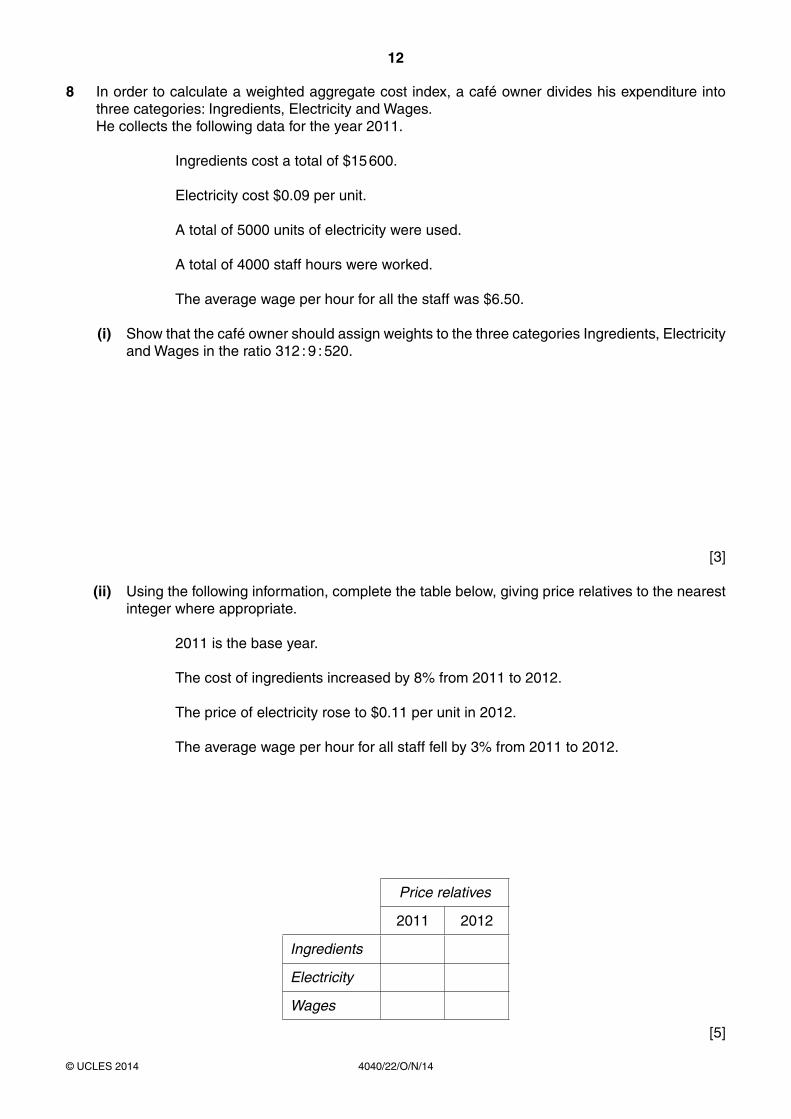
8 In order to calculate a weighted aggregate cost index, a café owner divides his expenditure into three categories: Ingredients, Electricity and Wages.
He collects the following data for the year 2011.
Ingredients cost a total of $15 600.
Electricity cost $0.09 per unit.
A total of 5000 units of electricity were used.
A total of 4000 staff hours were worked.
The average wage per hour for all the staff was $6.50.
(i) Show that the café owner should assign weights to the three categories Ingredients, Electricity and Wages in the ratio 312 : 9 : 520.
[3]
(ii) Using the following information, complete the table below, giving price relatives to the nearest integer where appropriate.
2011 is the base year.
The cost of ingredients increased by 8% from 2011 to 2012.
The price of electricity rose to $0.11 per unit in 2012.
The average wage per hour for all staff fell by 3% from 2011 to 2012.
Price relatives
2011 2012
Ingredients
Electricity
Wages
[5]
13
4040/22/O/N/14© UCLES 2014 [Turn over
(iii) Calculate a weighted aggregate cost index for the year 2012, taking 2011 as base year, giving your answer correct to one decimal place.
................................................... [3]
(iv) Use the index calculated in part (iii) and the costs for 2011 to estimate, to 3 significant figures, the total cost of running the café in 2012.
................................................... [3]
(v) Give two possible reasons why your estimate for 2012 may be very inaccurate.
Reason 1 ...................................................................................................................................
...................................................................................................................................................
Reason 2 ...................................................................................................................................
.............................................................................................................................................. [2]
14
4040/22/O/N/14© UCLES 2014
9 In this question give all probabilities as exact fractions.
A turn at a game consists of throwing a pair of unbiased coins, each with a head on one side and a tail on the other. A point is scored every time a turn produces a pair of heads. A game consists of three turns.
(i) If one game is played,
(a) show that the probability of scoring three points is 164 ,
[2]
(b) find the probability of scoring exactly two points.
................................................... [3]
(ii) If X is the number of points scored in one game, find the probability of each of the remaining possible values of X. Hence produce a table showing all the possible values of X together with their probabilities.
[4]
15
4040/22/O/N/14© UCLES 2014 [Turn over
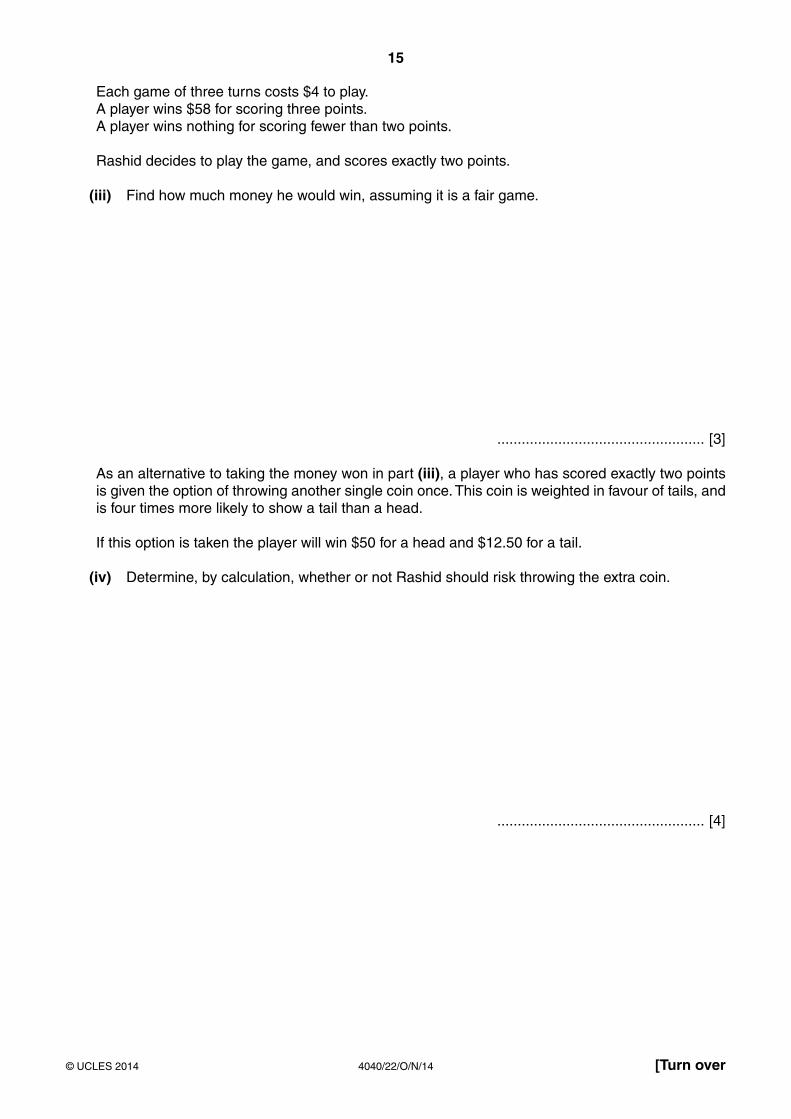
Each game of three turns costs $4 to play. A player wins $58 for scoring three points. A player wins nothing for scoring fewer than two points.
Rashid decides to play the game, and scores exactly two points.
(iii) Find how much money he would win, assuming it is a fair game.
................................................... [3]
As an alternative to taking the money won in part (iii), a player who has scored exactly two points is given the option of throwing another single coin once. This coin is weighted in favour of tails, and is four times more likely to show a tail than a head.
If this option is taken the player will win $50 for a head and $12.50 for a tail.
(iv) Determine, by calculation, whether or not Rashid should risk throwing the extra coin.
................................................... [4]
16
4040/22/O/N/14© UCLES 2014
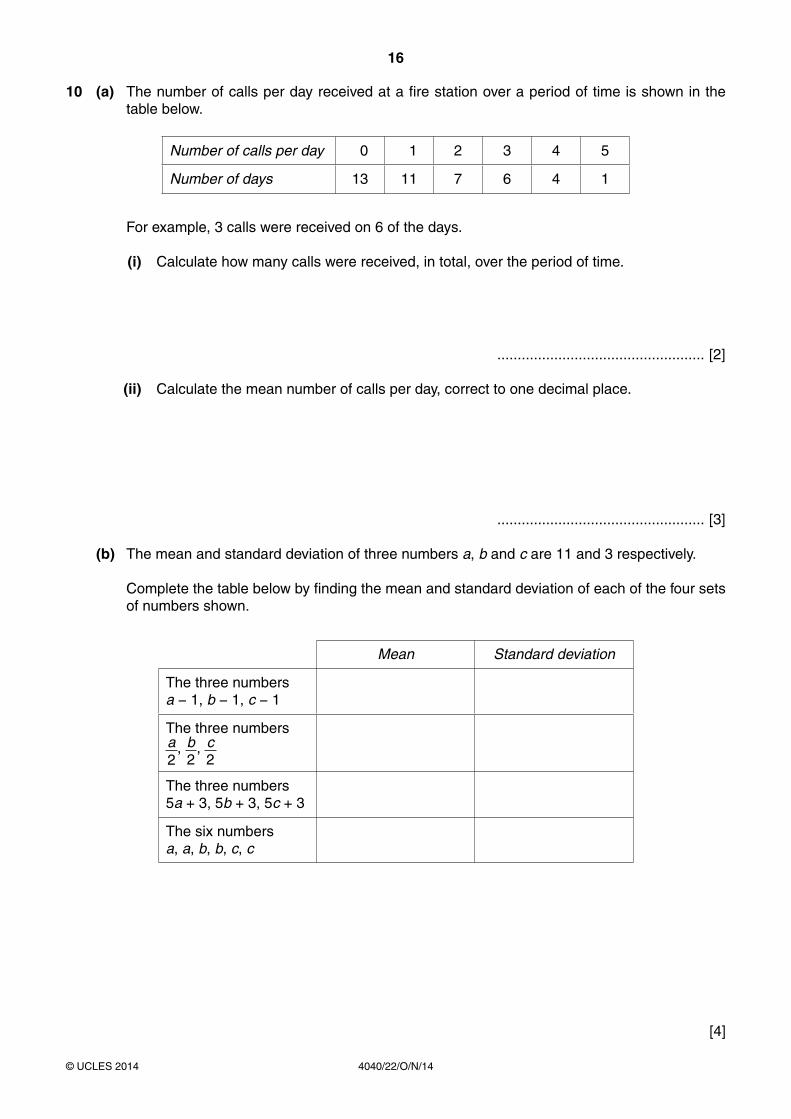
10 (a) The number of calls per day received at a fire station over a period of time is shown in the table below.
Number of calls per day 0 1 2 3 4 5
Number of days 13 11 7 6 4 1
For example, 3 calls were received on 6 of the days.
(i) Calculate how many calls were received, in total, over the period of time.
................................................... [2]
(ii) Calculate the mean number of calls per day, correct to one decimal place.
................................................... [3]
(b) The mean and standard deviation of three numbers a, b and c are 11 and 3 respectively.
Complete the table below by finding the mean and standard deviation of each of the four sets of numbers shown.
Mean Standard deviation
The three numbersa − 1, b − 1, c − 1
The three numbersa2
, b2
, c2
The three numbers5a + 3, 5b + 3, 5c + 3
The six numbersa, a, b, b, c, c
[4]
17
4040/22/O/N/14© UCLES 2014 [Turn over
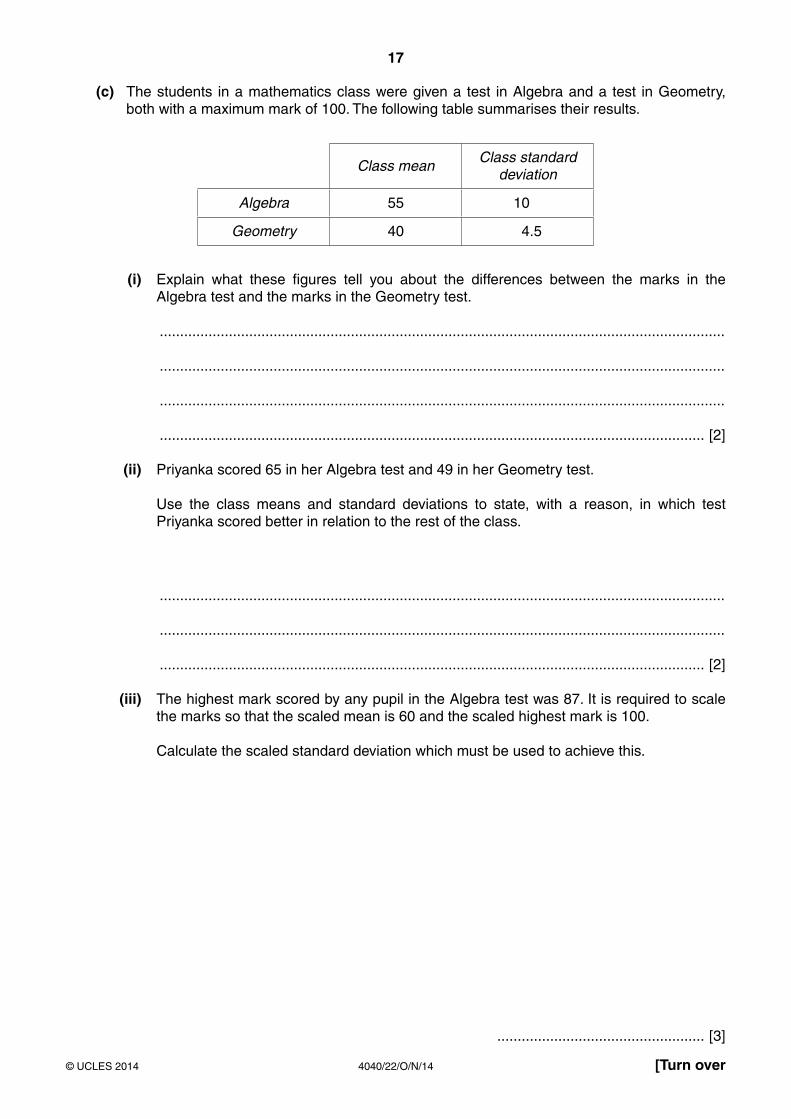
(c) The students in a mathematics class were given a test in Algebra and a test in Geometry, both with a maximum mark of 100. The following table summarises their results.
Class meanClass standard
deviation
Algebra 55 10
Geometry 40 4.5
(i) Explain what these figures tell you about the differences between the marks in the Algebra test and the marks in the Geometry test.
...........................................................................................................................................
...........................................................................................................................................
...........................................................................................................................................
...................................................................................................................................... [2]
(ii) Priyanka scored 65 in her Algebra test and 49 in her Geometry test.
Use the class means and standard deviations to state, with a reason, in which test Priyanka scored better in relation to the rest of the class.
...........................................................................................................................................
...........................................................................................................................................
...................................................................................................................................... [2]
(iii) The highest mark scored by any pupil in the Algebra test was 87. It is required to scale the marks so that the scaled mean is 60 and the scaled highest mark is 100.
Calculate the scaled standard deviation which must be used to achieve this.
................................................... [3]
18
4040/22/O/N/14© UCLES 2014
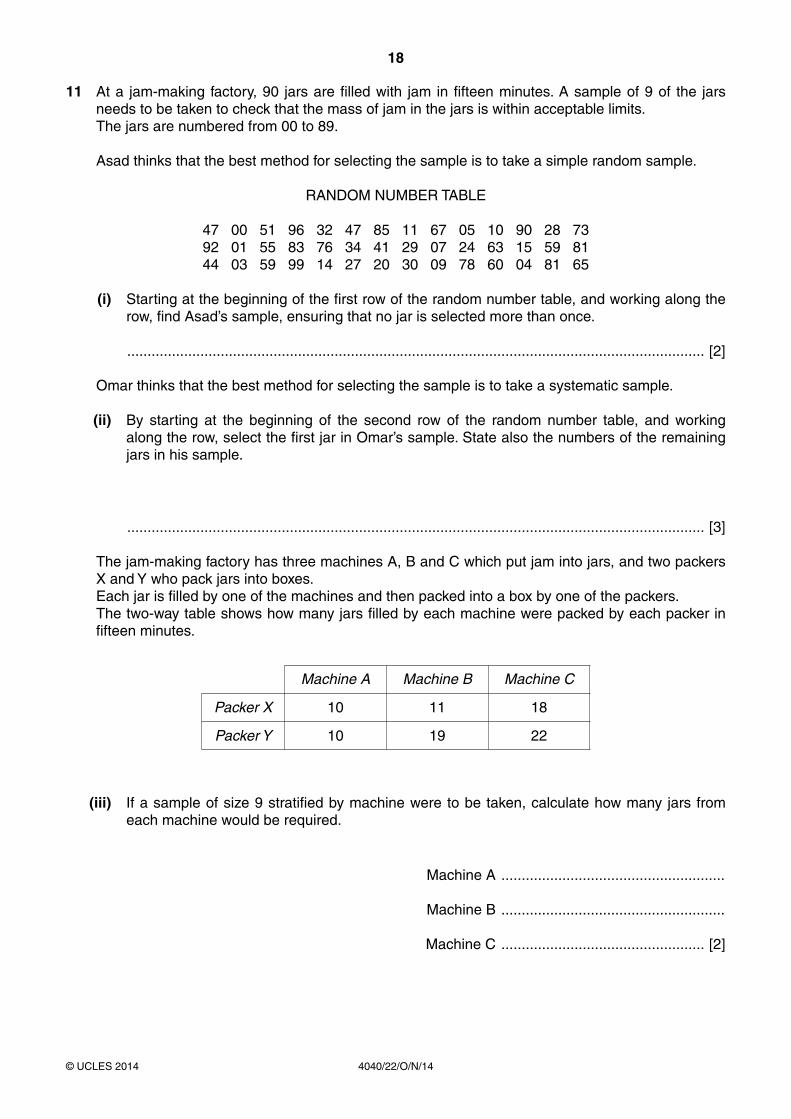
11 At a jam-making factory, 90 jars are filled with jam in fifteen minutes. A sample of 9 of the jars needs to be taken to check that the mass of jam in the jars is within acceptable limits.
The jars are numbered from 00 to 89.
Asad thinks that the best method for selecting the sample is to take a simple random sample.
RANDOM NUMBER TABLE
47 00 51 96 32 47 85 11 67 05 10 90 28 7392 01 55 83 76 34 41 29 07 24 63 15 59 8144 03 59 99 14 27 20 30 09 78 60 04 81 65
(i) Starting at the beginning of the first row of the random number table, and working along the row, find Asad’s sample, ensuring that no jar is selected more than once.
.............................................................................................................................................. [2]
Omar thinks that the best method for selecting the sample is to take a systematic sample.
(ii) By starting at the beginning of the second row of the random number table, and working along the row, select the first jar in Omar’s sample. State also the numbers of the remaining jars in his sample.
.............................................................................................................................................. [3]
The jam-making factory has three machines A, B and C which put jam into jars, and two packers X and Y who pack jars into boxes.
Each jar is filled by one of the machines and then packed into a box by one of the packers. The two-way table shows how many jars filled by each machine were packed by each packer in
fifteen minutes.
Machine A Machine B Machine C
Packer X 10 11 18
Packer Y 10 19 22
(iii) If a sample of size 9 stratified by machine were to be taken, calculate how many jars from each machine would be required.
Machine A .......................................................
Machine B .......................................................
Machine C .................................................. [2]
19
4040/22/O/N/14© UCLES 2014
The jars from machines A, B and C are those numbered 00 – 19, 20 – 49 and 50 – 89 respectively.
(iv) Comment on how accurately the samples taken by Asad and Omar represent the jars filled by each machine.
...................................................................................................................................................
...................................................................................................................................................
...................................................................................................................................................
.............................................................................................................................................. [2]
(v) Starting at the beginning of the third row of the table, and moving along the row, select a sample of size 9 stratified by machine. Use every number if the machine to which it relates has not yet been fully sampled.
...................................................................................................................................................
.............................................................................................................................................. [3]
(vi) If a sample of size 9 stratified by packer were to be taken, calculate how many jars from each packer would be required.
Packer X ..................................................
Packer Y .................................................. [2]
(vii) If a stratified sample were to be taken, state whether it would be more appropriate, in this case, to stratify by machine or by packer. Explain your answer.
...................................................................................................................................................
...................................................................................................................................................
.............................................................................................................................................. [2]
20
4040/22/O/N/14© UCLES 2014
Permission to reproduce items where third-party owned material protected by copyright is included has been sought and cleared where possible. Every reasonable effort has been made by the publisher (UCLES) to trace copyright holders, but if any items requiring clearance have unwittingly been included, the publisher will be pleased to make amends at the earliest possible opportunity.
Cambridge International Examinations is part of the Cambridge Assessment Group. Cambridge Assessment is the brand name of University of Cambridge Local Examinations Syndicate (UCLES), which is itself a department of the University of Cambridge.
BLANK PAGE