17 february 2017 fy2017 interim results presentation · v pacific smiles group –interim results...
TRANSCRIPT
Pacific Smiles Group – Interim Results Presentation 1
Presented by:
John Gibbs, Managing Director & Chief Executive Officer
Jane Coleman, Chief Financial Officer
17 FEBRUARY 2017
FY2017INTERIM RESULTS PRESENTATION
For
per
sona
l use
onl
y
v
Pacific Smiles Group – Interim Results Presentation 2
INTERIM RESULTS PRESENTATION
IMPORTANT NOTICEAND DISCLAIMER
This document is a presentation prepared by
Pacific Smiles Group Limited (ACN 103 087
449) (Pacific Smiles).
Material in this presentation provides general
background information about the activities of
Pacific Smiles current at the date of this
presentation, unless otherwise noted.
Information in this presentation remains
subject to change without notice.
Circumstances may change and the contents
of this presentation may become outdated as
a result.
The information contained in this presentation
is a summary only and does not purport to be
complete. It should be read in conjunction with
Pacific Smiles’ other periodic and continuous
disclosure announcements lodged with the
Australian Securities Exchange, which are
available at www.asx.com.au.
This presentation is for information purposes
only and is not a prospectus, product
disclosure statement or other offer document
under Australian law or the law of any other
jurisdiction. It is not intended to be relied upon
as advice to investors or potential investors
and does not take into account the investment
objectives, financial or tax situation or needs of
any particular investor. Readers should
consider the appropriateness of the
information having regard to their own
objectives, financial and tax situation and
needs and seek independent legal, taxation
and other professional advice appropriate for
their jurisdiction and individual circumstances.
This presentation is not and should not be
considered as an offer or recommendation
with respect to the subscription for, purchase
or sale of any security and neither this
document, nor anything in it shall form the
basis of any contract or commitment.
Accordingly, no action should be taken on the
basis of, or in reliance on, this presentation. In
particular, this presentation does not constitute
an offer to sell, or a solicitation of an offer to
buy, any securities in the United States. No
securities of Pacific Smiles have been, and nor
will they be, registered under the Securities
Act of 1933 as amended (US Securities Act).
Securities in Pacific Smiles may not be offered
or sold in the United States except pursuant to
an exemption from, or in a transaction not
subject to, registration under the US Securities
Act and applicable US state securities laws.
Pacific Smiles, its related bodies corporate and
any of their respective officers, directors,
employees, agents or advisers (Pacific
Smiles Parties), do not make any
representation or warranty, express or implied,
in relation to the accuracy, reliability or
completeness of the information contained
herein, and to the maximum extent permitted
by law disclaim any responsibility and liability
flowing from the use of this information by any
party. To the maximum extent permitted by
law, the Pacific Smiles Parties do not accept
any liability to any person, organisation or
entity for any loss or damage arising from the
use of this presentation or its contents or
otherwise arising in connection with it.
Forward looking statements
This document contains certain forward
looking statements and comments about
expectations about the performance of its
businesses. Forward looking statements can
generally be identified by the use of forward
looking words such as, without limitation,
‘expect’, ‘outlook’, ‘anticipate’, ‘likely’, ‘intend’,
‘should’, ‘could’, ‘may’, ‘predict’, ‘plan’,
‘propose’, ‘will’, ‘would’, ‘believe’, ‘forecast’,
‘estimate’, ‘target’ and other similar
expressions within the meaning of securities
laws of applicable jurisdictions. Indications of,
and guidance on, future earnings or financial
position or performance are also forward
looking statements.
Forward looking statements involve inherent
risks and uncertainties, both general and
specific, and there is a risk that such
predictions, forecasts, projections and other
forward looking statements will not be
achieved. Forward looking statements
are provided as a general guide only, and
should not be relied on as an indication or
guarantee of future performance. Forward
looking statements involve known and
unknown risks, uncertainty and other factors,
and may involve significant elements of
subjective judgment and assumptions as to
future events which may or may not prove to
be correct, which can cause Pacific Smiles’
actual results to differ materially from the
plans, objectives, expectations, estimates and
intentions expressed in such forward looking
statements and many of these factors are
outside the control of Pacific Smiles. As such,
undue reliance should not be placed on any
forward looking statement. Past performance
is not a guide to future performance and no
representation or warranty is made by any
person as to the likelihood of achievement or
reasonableness of any forward looking
statements, forecast financial information or
other forecast. Nothing contained in this
presentation nor any information made
available to you is, or shall be relied upon as, a
promise, representation, warranty or
guarantee as to the past, present or the future
performance of Pacific Smiles. Pacific Smiles
does not undertake any obligation to update or
review any forward-looking statements (other
than to the extent required by applicable law).
Pro forma financial information
Pacific Smiles uses certain measures to
manage and report on its business that are not
recognised under Australian Accounting
Standards. These measures are referred to as
non-IFRS financial information.
Pacific Smiles considers that this non-IFRS
financial information is important to assist in
evaluating Pacific Smiles’ performance. The
information is presented to assist in making
appropriate comparisons with prior periods
and to assess the operating performance of
the business. For a reconciliation of the non-
IFRS financial information contained in this
presentation to IFRS-compliant comparative
information, refer to the Appendices of this
presentation.
All dollar values are in Australian dollars (A$)
unless otherwise stated.
A number of figures, amounts, percentages,
estimates, calculations of value and fractions
in this presentation are subject to the effect of
rounding. Accordingly, the actual calculation of
these figures may differ from the figures set
out in this presentation.
For
per
sona
l use
onl
y
v
Pacific Smiles Group – Interim Results Presentation 3
INTERIM RESULTS PRESENTATION
1. PERFORMANCE HIGHLIGHTS
2. BUSINESS OVERVIEW AND UPDATE
3. RESULTS DETAIL
4. GROWTH AND OUTLOOK
AGENDA
For
per
sona
l use
onl
y
Pacific Smiles Group – Interim Results Presentation 4
PERFORMANCEHIGHLIGHTS
SECTION 1
For
per
sona
l use
onl
y

v
Pacific Smiles Group – Interim Results Presentation 5
1H17 PERFORMANCEHIGHLIGHTS
• Patient fees $73.6 million, up 9.9% (1H16: $67.0 million)
• Revenue $45.6 million, up 9.4% (1H16: $41.6 million)
• Same centre patient fees growth +4.4% (1H16: +4.9%)
• EBITDA $10.7 million, up 13.8% (1H16: $9.4 million)
• EBITDA to patient fees margin of 14.6% (1H16: 14.1%)
• NPAT $5.4 million, up 10.0% (1H16: $4.9 million)
• Interim dividend of 2.2 cps (fully franked) declared
• Net cash of $5.3 million
• Network expansion with 4 new Pacific Smiles Dental centres
opened
For
per
sona
l use
onl
y
v
Pacific Smiles Group – Interim Results Presentation 6
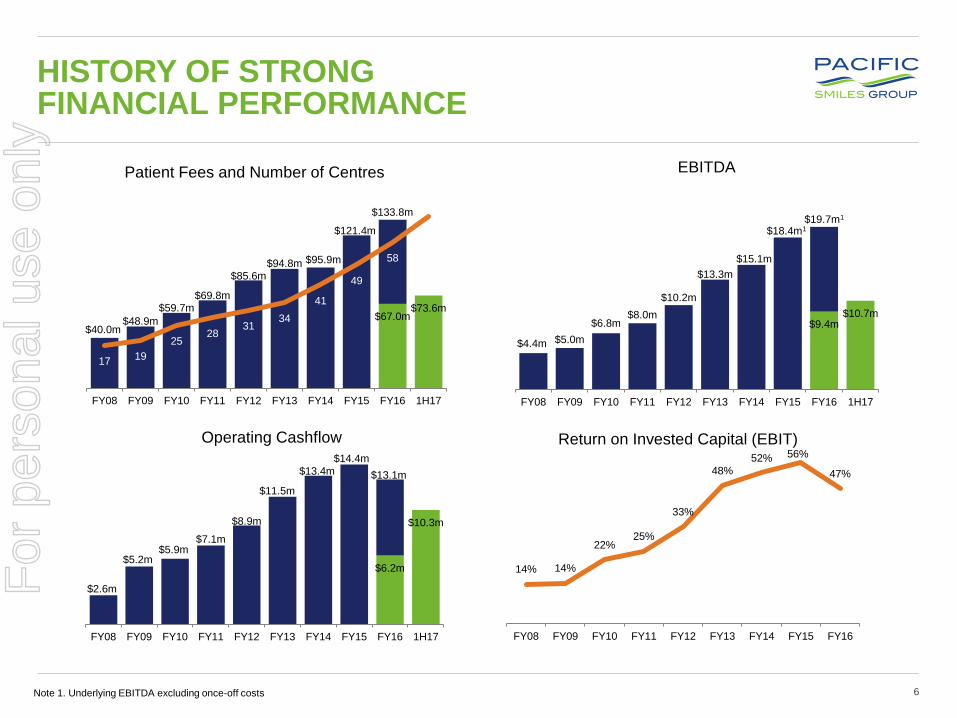
HISTORY OF STRONG FINANCIAL PERFORMANCE
Note 1. Underlying EBITDA excluding once-off costs
14% 14%
22%25%
33%
48%
52% 56%
47%
0
0.2
0.4
0.6
0.8
1
1.2
FY08 FY09 FY10 FY11 FY12 FY13 FY14 FY15 FY16
$0m
$0m
$0m
$0m
$0m
$1m
$1mReturn on Invested Capital (EBIT)
$0m $0m $0m $0m $0m $0m
$67.0m$73.6m
$40.0m$48.9m
$59.7m$69.8m
$85.6m
$94.8m $95.9m
$121.4m
$133.8m
1719
2528
3134
41
49
58
68
$-
$20.0
$40.0
$60.0
$80.0
$100.0
$120.0
$140.0
$160.0
FY08 FY09 FY10 FY11 FY12 FY13 FY14 FY15 FY16 1H17
$0m
$10m
$20m
$30m
$40m
$50m
$60m
$70m
$80m
Patient Fees and Number of Centres
$0m $0m $0m $0m $0m $0m
$6.2m
$10.3m
$2.6m
$5.2m$5.9m
$7.1m
$8.9m
$11.5m
$13.4m
$14.4m
$13.1m
0
2
4
6
8
10
12
14
16
FY08 FY09 FY10 FY11 FY12 FY13 FY14 FY15 FY16 1H17
$0m
$0m
$0m
$1m
$1m
$1m
$1mOperating Cashflow
$0m $0m $0m $0m $0m $0m
$9.4m$10.7m
$4.4m $5.0m
$6.8m$8.0m
$10.2m
$13.3m
$15.1m
$18.4m1
$19.7m1
0
5
10
15
20
25
FY08 FY09 FY10 FY11 FY12 FY13 FY14 FY15 FY16 1H17
$0m
$0m
$0m
$1m
$1m
$1m
$1m
EBITDA
For
per
sona
l use
onl
y
Pacific Smiles Group – Interim Results Presentation 7
BUSINESS OVERVIEWAND UPDATE
SECTION 2
For
per
sona
l use
onl
y

v
Pacific Smiles Group – Interim Results Presentation 8
BUSINESS OVERVIEW
• Founded in 2003, Pacific Smiles is a leading Australian branded dental
group, operating 62 dental centres containing more than 250 active
dental chairs at 31 December 2016
• Achieves industry leading consistency across operations, facility design
and dental centre positioning
• Pacific Smiles provides dentists with fully serviced and equipped
facilities, including support staff, materials, marketing and administrative
services – enabling dentists to maximise time treating patients
• Dentists offer a range of general, family and cosmetic dental treatments
including dental implants and a range of specialist services such as
orthodontics
• Over 350 dentists and approximately 800 staff servicing nearly 600,000
patient appointments each year
For
per
sona
l use
onl
y
v
Pacific Smiles Group – Interim Results Presentation 9
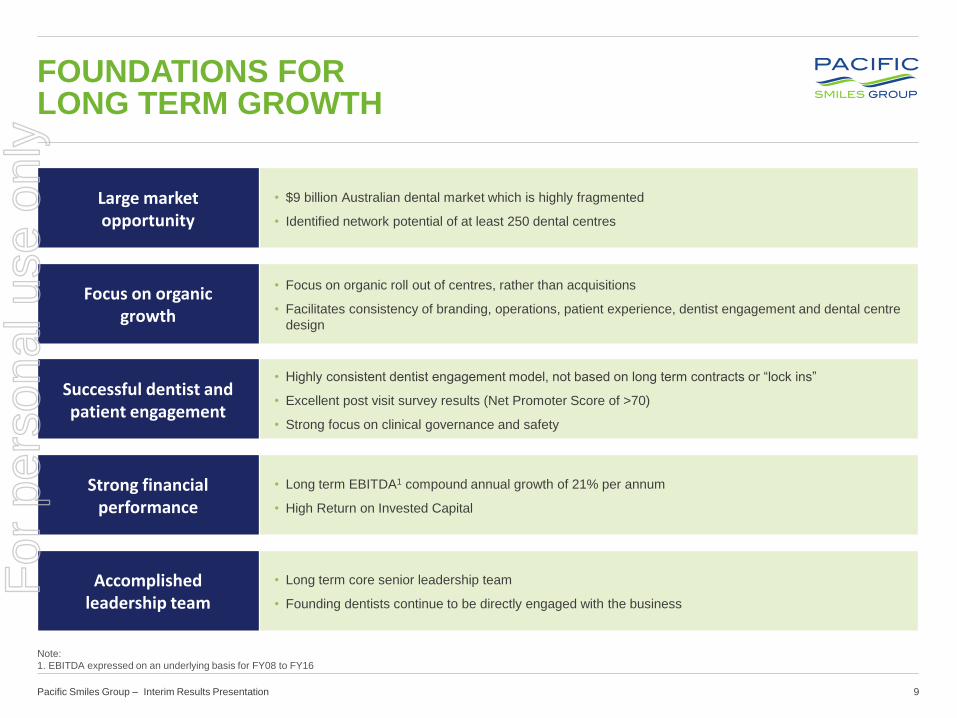
Large market opportunity
• $9 billion Australian dental market which is highly fragmented
• Identified network potential of at least 250 dental centres
Focus on organic growth
• Focus on organic roll out of centres, rather than acquisitions
• Facilitates consistency of branding, operations, patient experience, dentist engagement and dental centre
design
Successful dentist and patient engagement
• Highly consistent dentist engagement model, not based on long term contracts or “lock ins”
• Excellent post visit survey results (Net Promoter Score of >70)
• Strong focus on clinical governance and safety
Strong financial performance
• Long term EBITDA1 compound annual growth of 21% per annum
• High Return on Invested Capital
Accomplishedleadership team
• Long term core senior leadership team
• Founding dentists continue to be directly engaged with the business
FOUNDATIONS FOR LONG TERM GROWTH
Note:
1. EBITDA expressed on an underlying basis for FY08 to FY16
For
per
sona
l use
onl
y
v
Pacific Smiles Group – Interim Results Presentation 10
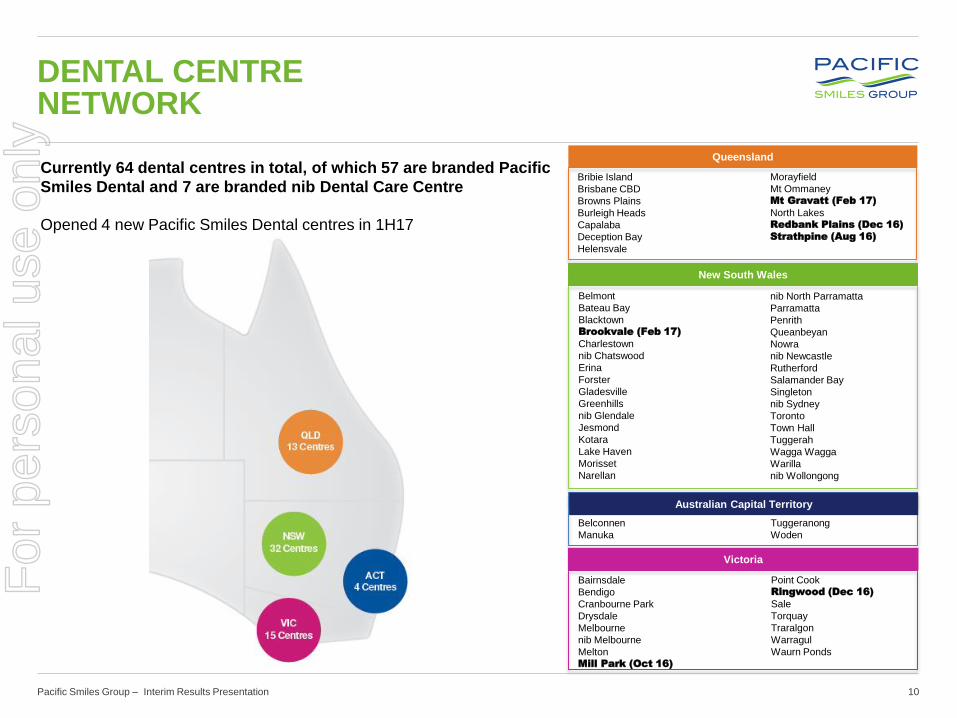
DENTAL CENTRE NETWORK
Currently 64 dental centres in total, of which 57 are branded Pacific
Smiles Dental and 7 are branded nib Dental Care Centre
Opened 4 new Pacific Smiles Dental centres in 1H17
Queensland
New South Wales
Bribie Island
Brisbane CBD
Browns Plains
Burleigh Heads
Capalaba
Deception Bay
Helensvale
Australian Capital Territory
Victoria
Morayfield
Mt OmmaneyMt Gravatt (Feb 17)
North LakesRedbank Plains (Dec 16)
Strathpine (Aug 16)
Belmont
Bateau Bay
BlacktownBrookvale (Feb 17)
Charlestown
nib Chatswood
Erina
Forster
Gladesville
Greenhills
nib Glendale
Jesmond
Kotara
Lake Haven
Morisset
Narellan
nib North Parramatta
Parramatta
Penrith
Queanbeyan
Nowra
nib Newcastle
Rutherford
Salamander Bay
Singleton
nib Sydney
Toronto
Town Hall
Tuggerah
Wagga Wagga
Warilla
nib Wollongong
Belconnen
Manuka
Tuggeranong
Woden
Bairnsdale
Bendigo
Cranbourne Park
Drysdale
Melbourne
nib Melbourne
MeltonMill Park (Oct 16)
Point CookRingwood (Dec 16)
Sale
Torquay
Traralgon
Warragul
Waurn Ponds
Victoria
For
per
sona
l use
onl
y
v
Pacific Smiles Group – Interim Results Presentation 11
OPERATIONALUPDATE
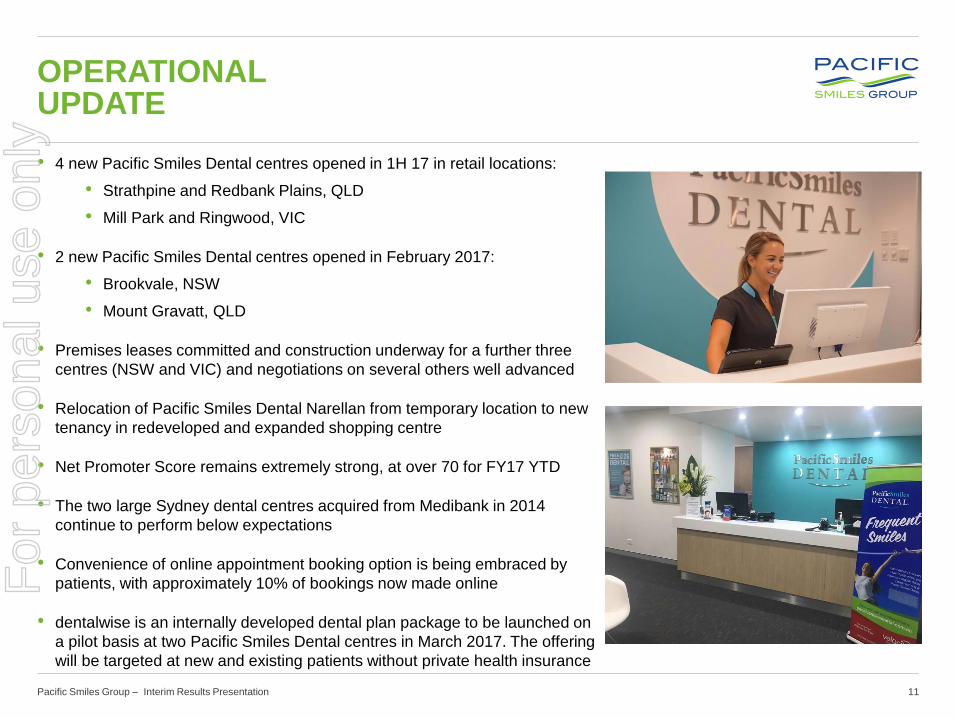
• 4 new Pacific Smiles Dental centres opened in 1H 17 in retail locations:
• Strathpine and Redbank Plains, QLD
• Mill Park and Ringwood, VIC
• 2 new Pacific Smiles Dental centres opened in February 2017:
• Brookvale, NSW
• Mount Gravatt, QLD
• Premises leases committed and construction underway for a further three
centres (NSW and VIC) and negotiations on several others well advanced
• Relocation of Pacific Smiles Dental Narellan from temporary location to new
tenancy in redeveloped and expanded shopping centre
• Net Promoter Score remains extremely strong, at over 70 for FY17 YTD
• The two large Sydney dental centres acquired from Medibank in 2014
continue to perform below expectations
• Convenience of online appointment booking option is being embraced by
patients, with approximately 10% of bookings now made online
• dentalwise is an internally developed dental plan package to be launched on
a pilot basis at two Pacific Smiles Dental centres in March 2017. The offering
will be targeted at new and existing patients without private health insurance
For
per
sona
l use
onl
y
v
Pacific Smiles Group – Interim Results Presentation 12
UPDATE ON STRATEGIC PHI RELATIONSHIPS
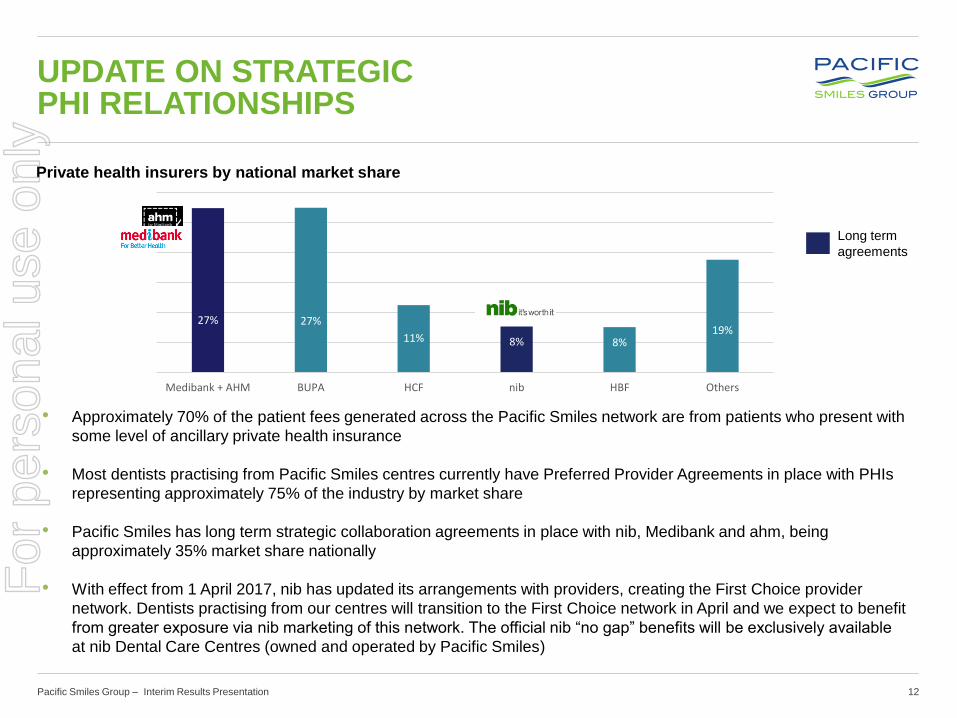
• Approximately 70% of the patient fees generated across the Pacific Smiles network are from patients who present with
some level of ancillary private health insurance
• Most dentists practising from Pacific Smiles centres currently have Preferred Provider Agreements in place with PHIs
representing approximately 75% of the industry by market share
• Pacific Smiles has long term strategic collaboration agreements in place with nib, Medibank and ahm, being
approximately 35% market share nationally
• With effect from 1 April 2017, nib has updated its arrangements with providers, creating the First Choice provider
network. Dentists practising from our centres will transition to the First Choice network in April and we expect to benefit
from greater exposure via nib marketing of this network. The official nib “no gap” benefits will be exclusively available
at nib Dental Care Centres (owned and operated by Pacific Smiles)
Private health insurers by national market share
27% 27%
11% 8% 8%19%
Medibank + AHM BUPA HCF nib HBF Others
Long term
agreements
For
per
sona
l use
onl
y
Pacific Smiles Group – Interim Results Presentation 13
RESULTSDETAIL
SECTION 3
For
per
sona
l use
onl
y
v
Pacific Smiles Group – Interim Results Presentation 14
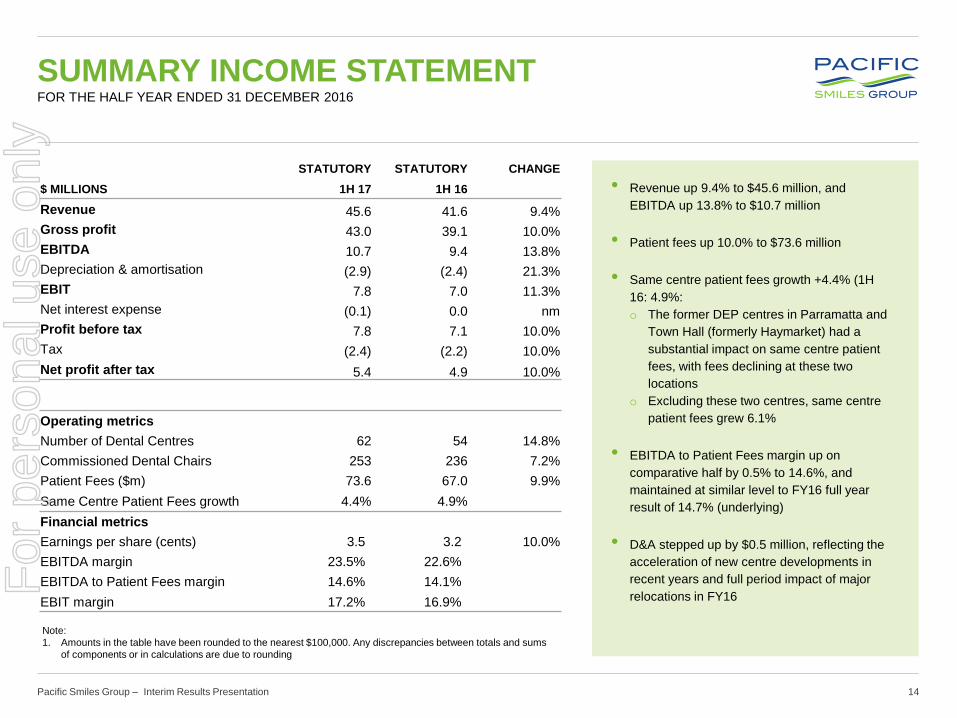
• Revenue up 9.4% to $45.6 million, and
EBITDA up 13.8% to $10.7 million
• Patient fees up 10.0% to $73.6 million
• Same centre patient fees growth +4.4% (1H
16: 4.9%:
o The former DEP centres in Parramatta and
Town Hall (formerly Haymarket) had a
substantial impact on same centre patient
fees, with fees declining at these two
locations
o Excluding these two centres, same centre
patient fees grew 6.1%
• EBITDA to Patient Fees margin up on
comparative half by 0.5% to 14.6%, and
maintained at similar level to FY16 full year
result of 14.7% (underlying)
• D&A stepped up by $0.5 million, reflecting the
acceleration of new centre developments in
recent years and full period impact of major
relocations in FY16
STATUTORY STATUTORY CHANGE
$ MILLIONS 1H 17 1H 16
Revenue 45.6 41.6 9.4%
Gross profit 43.0 39.1 10.0%
EBITDA 10.7 9.4 13.8%
Depreciation & amortisation (2.9) (2.4) 21.3%
EBIT 7.8 7.0 11.3%
Net interest expense (0.1) 0.0 nm
Profit before tax 7.8 7.1 10.0%
Tax (2.4) (2.2) 10.0%
Net profit after tax 5.4 4.9 10.0%
Operating metrics
Number of Dental Centres 62 54 14.8%
Commissioned Dental Chairs 253 236 7.2%
Patient Fees ($m) 73.6 67.0 9.9%
Same Centre Patient Fees growth 4.4% 4.9%
Financial metrics
Earnings per share (cents) 3.5 3.2 10.0%
EBITDA margin 23.5% 22.6%
EBITDA to Patient Fees margin 14.6% 14.1%
EBIT margin 17.2% 16.9%
SUMMARY INCOME STATEMENTFOR THE HALF YEAR ENDED 31 DECEMBER 2016
Note:
1. Amounts in the table have been rounded to the nearest $100,000. Any discrepancies between totals and sums
of components or in calculations are due to rounding
For
per
sona
l use
onl
y
v
Pacific Smiles Group – Interim Results Presentation 15
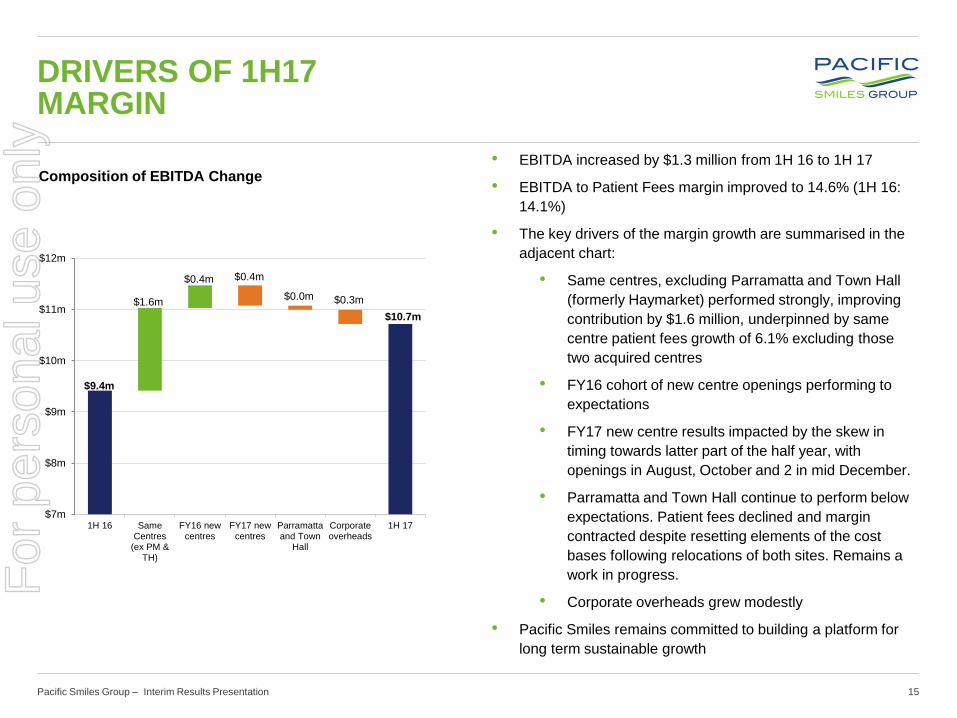
• EBITDA increased by $1.3 million from 1H 16 to 1H 17
• EBITDA to Patient Fees margin improved to 14.6% (1H 16:
14.1%)
• The key drivers of the margin growth are summarised in the
adjacent chart:
• Same centres, excluding Parramatta and Town Hall
(formerly Haymarket) performed strongly, improving
contribution by $1.6 million, underpinned by same
centre patient fees growth of 6.1% excluding those
two acquired centres
• FY16 cohort of new centre openings performing to
expectations
• FY17 new centre results impacted by the skew in
timing towards latter part of the half year, with
openings in August, October and 2 in mid December.
• Parramatta and Town Hall continue to perform below
expectations. Patient fees declined and margin
contracted despite resetting elements of the cost
bases following relocations of both sites. Remains a
work in progress.
• Corporate overheads grew modestly
• Pacific Smiles remains committed to building a platform for
long term sustainable growth
DRIVERS OF 1H17 MARGIN
Composition of EBITDA Change
$9.4m
$10.7m
$1.6m
$0.4m
$0.0m
$0.4m
$0.3m
$7m
$8m
$9m
$10m
$11m
$12m
1H 16 SameCentres
(ex PM &TH)
FY16 newcentres
FY17 newcentres
Parramattaand Town
Hall
Corporateoverheads
1H 17
For
per
sona
l use
onl
y

v
Pacific Smiles Group – Interim Results Presentation 16
BALANCE SHEETAS AT 31 DECEMBER 2016
• Net cash of $5.3 million at 31 December 2016
• Increases in property, plant and equipment reflect the
investment in 4 new centre openings and 3 more new
centres under construction
• Payables increased $1.2 million broadly in line with
business growth
• Provisions have increased $0.8 million, primarily due to the
required straight line accounting for premises leases, under
which the accounting expenses currently exceed cash
rental payments under Group’s portfolio of leases
• ROIC (EBIT) has increased steadily over a number of
years, reaching over 50% in FY15. The decreases in FY16
(actual) and FY17 (estimated) largely reflect the
acceleration in the rate of new centre openings over the
past three years (which typically incur start-up losses)
STATUTORY STATUTORY
$ MILLIONS 31 DEC 2016 31 DEC 2015
Current assets
Cash and cash equivalents 5.3 9.4
Receivables 1.1 1.6
Inventories 2.6 2.4
Other 0.3 0.3
Total current assets 9.3 13.7
Non-current assets
Property, plant and equipment 37.1 29.7
Intangible assets 11.4 11.5
Deferred tax assets 4.5 4.1
Total non-current assets 53.0 45.3
Total assets 62.3 59.0
Current liabilities
Payables 10.2 9.0
Borrowings 0.0 0.3
Current tax liabilities 0.4 1.0
Provisions 3.1 3.1
Total current liabilities 13.7 13.4
Non-current liabilities
Deferred tax liabilities 0.2 0.3
Provisions 5.3 4.5
Total non-current liabilities 5.5 4.7
Total liabilities 19.2 18.1
Net assets 43.1 40.9
Equity
Contributed equity 35.1 35.1
Reserves 0.3 0.1
Retained profits 7.8 5.7
Total equity 43.1 40.9Note:
1. Amounts in the table have been rounded to the nearest $100,000. Any discrepancies
between totals and sums of components are due to rounding
For
per
sona
l use
onl
y
v
Pacific Smiles Group – Interim Results Presentation 17
SUMMARY CASH FLOWFOR THE HALF YEAR ENDED 31 DECEMBER 2016
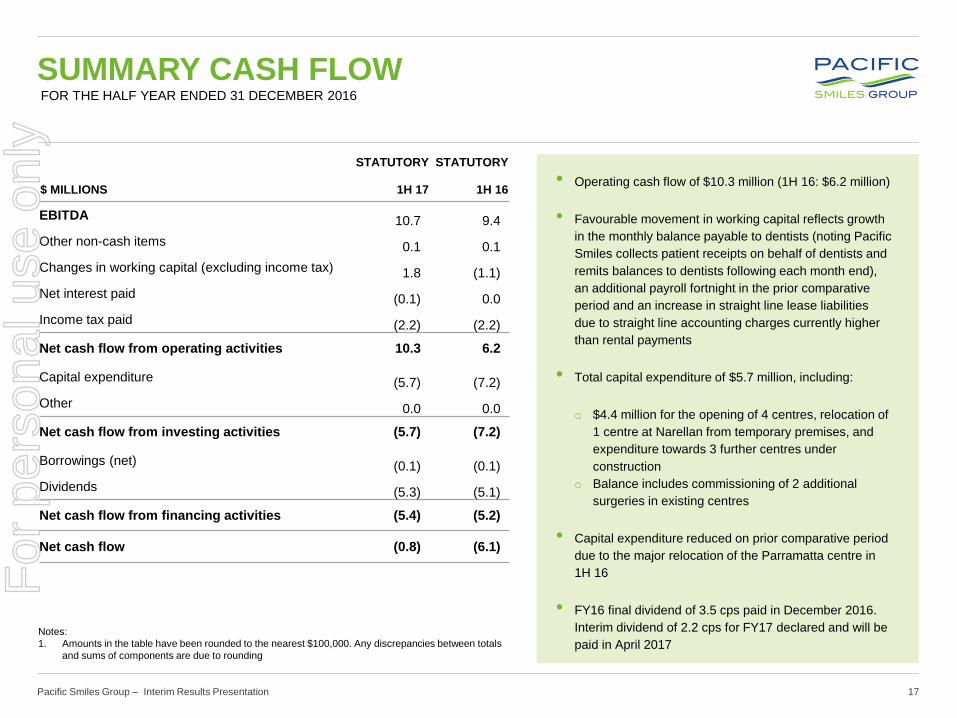
• Operating cash flow of $10.3 million (1H 16: $6.2 million)
• Favourable movement in working capital reflects growth
in the monthly balance payable to dentists (noting Pacific
Smiles collects patient receipts on behalf of dentists and
remits balances to dentists following each month end),
an additional payroll fortnight in the prior comparative
period and an increase in straight line lease liabilities
due to straight line accounting charges currently higher
than rental payments
• Total capital expenditure of $5.7 million, including:
o $4.4 million for the opening of 4 centres, relocation of
1 centre at Narellan from temporary premises, and
expenditure towards 3 further centres under
construction
o Balance includes commissioning of 2 additional
surgeries in existing centres
• Capital expenditure reduced on prior comparative period
due to the major relocation of the Parramatta centre in
1H 16
• FY16 final dividend of 3.5 cps paid in December 2016.
Interim dividend of 2.2 cps for FY17 declared and will be
paid in April 2017
STATUTORY STATUTORY
$ MILLIONS 1H 17 1H 16
EBITDA 10.7 9.4
Other non-cash items 0.1 0.1
Changes in working capital (excluding income tax) 1.8 (1.1)
Net interest paid (0.1) 0.0
Income tax paid (2.2) (2.2)
Net cash flow from operating activities 10.3 6.2
Capital expenditure (5.7) (7.2)
Other 0.0 0.0
Net cash flow from investing activities (5.7) (7.2)
Borrowings (net) (0.1) (0.1)
Dividends (5.3) (5.1)
Net cash flow from financing activities (5.4) (5.2)
Net cash flow (0.8) (6.1)
Notes:
1. Amounts in the table have been rounded to the nearest $100,000. Any discrepancies between totals
and sums of components are due to rounding
For
per
sona
l use
onl
y
Pacific Smiles Group – Interim Results Presentation 18
GROWTH AND OUTLOOK
SECTION 4
For
per
sona
l use
onl
y
v
Pacific Smiles Group – Interim Results Presentation 19
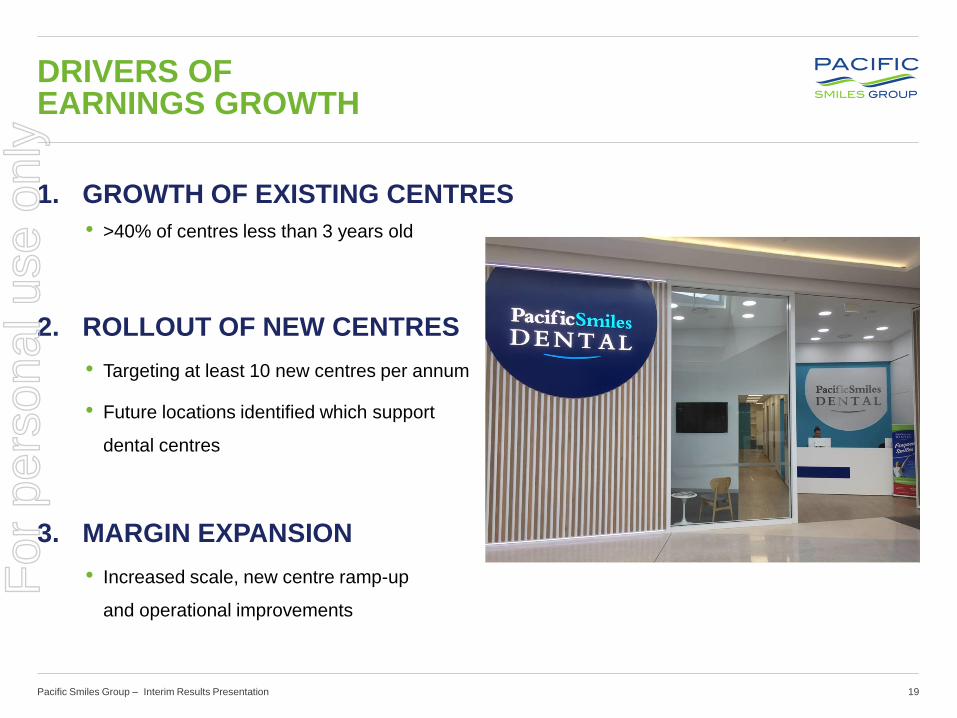
DRIVERS OFEARNINGS GROWTH
1. GROWTH OF EXISTING CENTRES
• >40% of centres less than 3 years old
2. ROLLOUT OF NEW CENTRES
• Targeting at least 10 new centres per annum
• Future locations identified which support network potential of at least 250
dental centres
3. MARGIN EXPANSION
• Increased scale, new centre ramp-up
and operational improvements
For
per
sona
l use
onl
y
v
Pacific Smiles Group – Interim Results Presentation 20
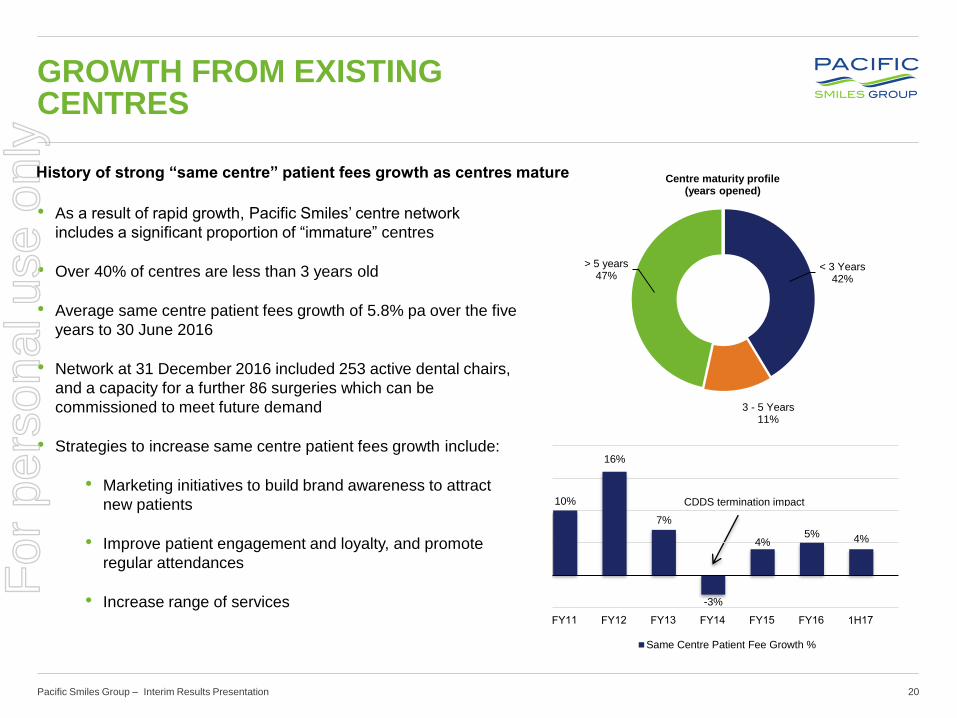
GROWTH FROM EXISTING CENTRES
< 3 Years42%
3 - 5 Years11%
> 5 years47%
Centre maturity profile (years opened)
History of strong “same centre” patient fees growth as centres mature
• As a result of rapid growth, Pacific Smiles’ centre network
includes a significant proportion of “immature” centres
• Over 40% of centres are less than 3 years old
• Average same centre patient fees growth of 5.8% pa over the five
years to 30 June 2016
• Network at 31 December 2016 included 253 active dental chairs,
and a capacity for a further 86 surgeries which can be
commissioned to meet future demand
• Strategies to increase same centre patient fees growth include:
• Marketing initiatives to build brand awareness to attract
new patients
• Improve patient engagement and loyalty, and promote
regular attendances
• Increase range of services
10%
16%
7%
-3%
4%5% 4%
Same Centre Patient Fee Growth %
CDDS termination impact
For
per
sona
l use
onl
y
v
Pacific Smiles Group – Interim Results Presentation 21
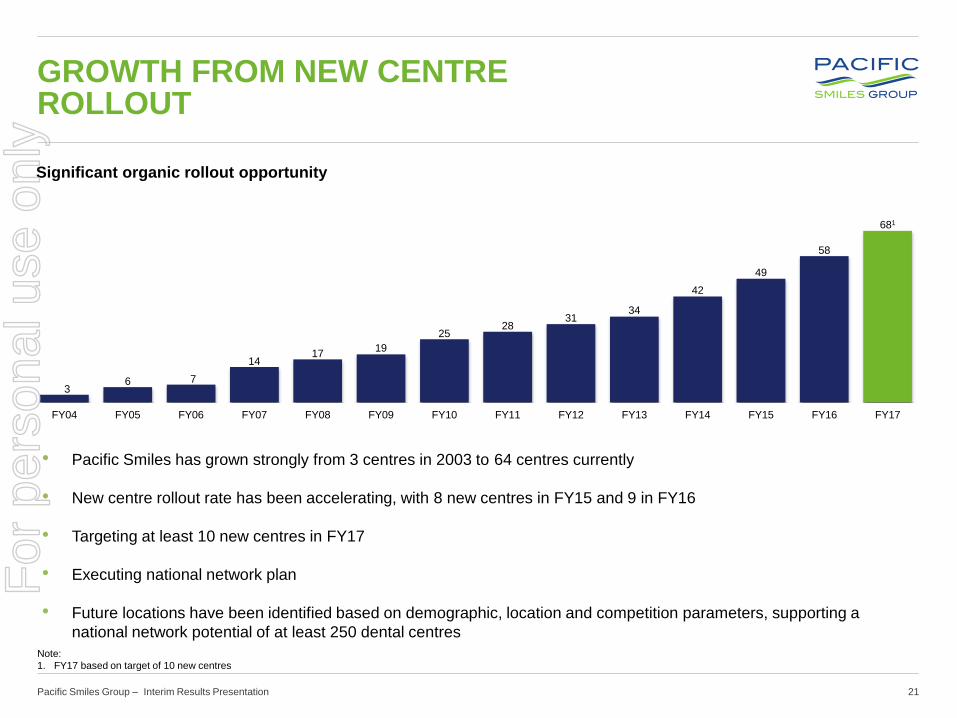
GROWTH FROM NEW CENTRE ROLLOUT
• Pacific Smiles has grown strongly from 3 centres in 2003 to 64 centres currently
• New centre rollout rate has been accelerating, with 8 new centres in FY15 and 9 in FY16
• Targeting at least 10 new centres in FY17
• Executing national network plan
• Future locations have been identified based on demographic, location and competition parameters, supporting a
national network potential of at least 250 dental centres
36 7
1417
19
2528
3134
42
49
58
681
FY04 FY05 FY06 FY07 FY08 FY09 FY10 FY11 FY12 FY13 FY14 FY15 FY16 FY17
Significant organic rollout opportunity
Note:
1. FY17 based on target of 10 new centres
For
per
sona
l use
onl
y

v
Pacific Smiles Group – Interim Results Presentation 22
MARGIN EXPANSION
• Group EBITDA to patient fees margin has expanded from
10% in FY09 to approximately 15% in FY16
• The Pacific Smiles model supports long-term margin
expansion from three key sources:
• Same centre patient fees growth
• New centre ramp-up
• Patient fees growth leveraging fixed overhead costs
• Established centres take many years to achieve maturity
and continue to show margin expansion over this time
• The past five cohorts have followed a consistent path of
EBITDA ramp-up over the first 36 months of operation
• The FY15 and FY16 cohorts achieved profitability after 12
and 8 months respectively.
• The improved performance of the FY16 cohort is
attributed to being more selective on location and
enhanced marketing
Margin expansion from same centre patient fees growth, new centre ramp and leveraging fixed overheads
-10%
11%
17%
23%26%
-20%
-10%
0%
10%
20%
30%
FY12 FY13 FY14 FY15 FY16
EBITDA to Patient Fees Margin (FY12 Cohort)2
Note: 2. Represents the total EBITDA margin for the 4 centres opened in FY12
Note: 1. Represents the average EBITDA for the centres opened during the relevant financial year from
month zero (pre-opening) to month 36 (where applicable). Centre EBITDA has been scaled to align
opening months by cohort. For example month 1 for the FY12 cohort reflects the average EBITDA for
the first month for all centres opened in FY12.
0 2 4 6 8 10 12 14 16 18 20 22 24 26 28 30 32 34 36
Average Monthly Centre EBITDA by Cohort1
FY12 FY13 FY14 FY15 FY16
For
per
sona
l use
onl
y
v
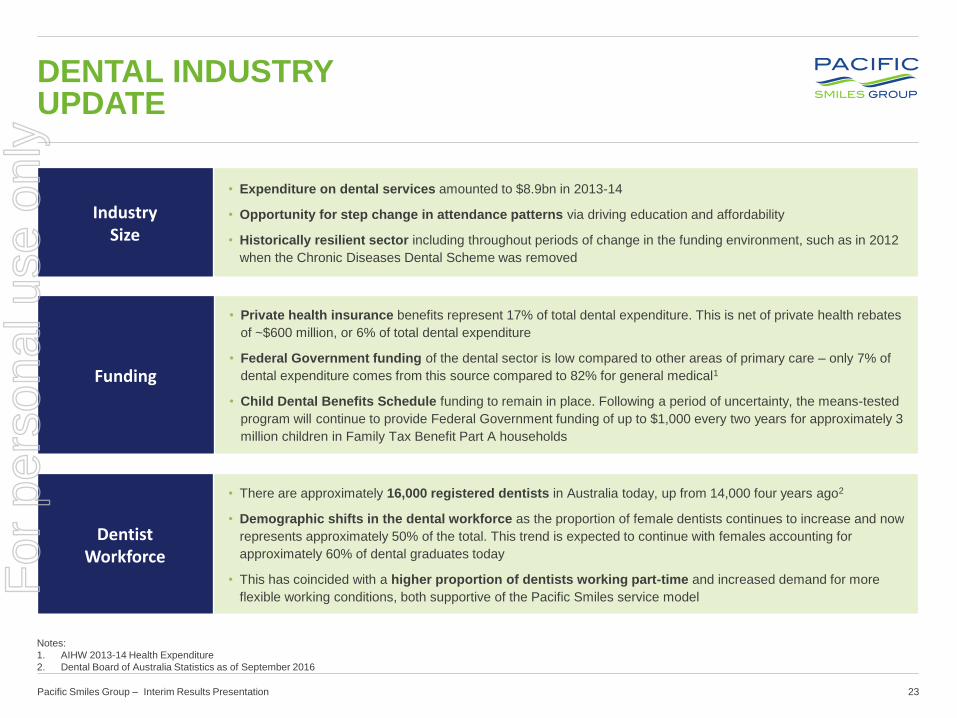
Pacific Smiles Group – Interim Results Presentation 23
Industry Size
• Expenditure on dental services amounted to $8.9bn in 2013-14
• Opportunity for step change in attendance patterns via driving education and affordability
• Historically resilient sector including throughout periods of change in the funding environment, such as in 2012
when the Chronic Diseases Dental Scheme was removed
Funding
• Private health insurance benefits represent 17% of total dental expenditure. This is net of private health rebates
of ~$600 million, or 6% of total dental expenditure
• Federal Government funding of the dental sector is low compared to other areas of primary care – only 7% of
dental expenditure comes from this source compared to 82% for general medical1
• Child Dental Benefits Schedule funding to remain in place. Following a period of uncertainty, the means-tested
program will continue to provide Federal Government funding of up to $1,000 every two years for approximately 3
million children in Family Tax Benefit Part A households
Dentist Workforce
• There are approximately 16,000 registered dentists in Australia today, up from 14,000 four years ago2
• Demographic shifts in the dental workforce as the proportion of female dentists continues to increase and now
represents approximately 50% of the total. This trend is expected to continue with females accounting for
approximately 60% of dental graduates today
• This has coincided with a higher proportion of dentists working part-time and increased demand for more
flexible working conditions, both supportive of the Pacific Smiles service model
Notes:
1. AIHW 2013-14 Health Expenditure
2. Dental Board of Australia Statistics as of September 2016
DENTAL INDUSTRY UPDATE
For
per
sona
l use
onl
y
v
Pacific Smiles Group – Interim Results Presentation 24
• No change to EBITDA guidance. EBITDA for FY17 expected to be in the range of $21.7 million to $23.2
million, representing growth of between 10% to 18% compared with FY16 EBITDA (underlying)
• Same centre patient fees growth at least 5% for FY17 (year to date1 actual 4.6%)
• Opening at least 10 new dental centres in FY17
• Strong pipeline of new centre opportunities, with 6 new sites opened during the year to date and three
currently under construction
• Management continues to execute on the roll-out strategy and estimates the long term network potential
is at least 250 dental centres
• Dividend policy unchanged, with a pay-out ratio in the range of 80-90% of NPAT expected for FY17
OUTLOOK
Notes:
1. Year to date refers to management information on trading to 14 February 2017
For
per
sona
l use
onl
y

THANK YOU
For
per
sona
l use
onl
y