2 2012 lenovo confidential. all rights …static.lenovo.com/ww/lenovo/pdf/lenovo_q4_fy12_ppt_eng...5...
TRANSCRIPT


2012 LENOVO CONFIDENTIAL. ALL RIGHTS RESERVED. 2
2012 LENOVO CONFIDENTIAL. ALL RIGHTS RESERVED. 3
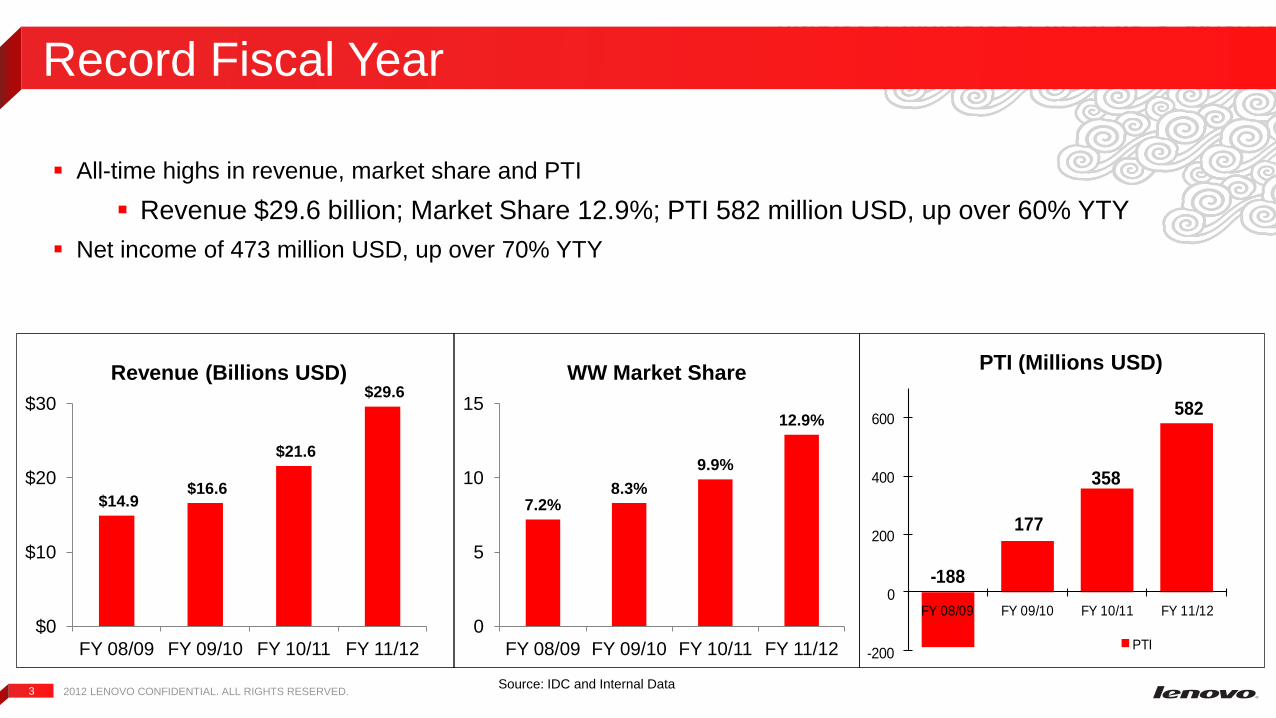
Record Fiscal Year
$14.9 $16.6
$21.6
$29.6
$0
$10
$20
$30
FY 08/09 FY 09/10 FY 10/11 FY 11/12
Revenue (Billions USD)
7.2% 8.3%
9.9%
12.9%
0
5
10
15
FY 08/09 FY 09/10 FY 10/11 FY 11/12
WW Market Share
All-time highs in revenue, market share and PTI
Revenue $29.6 billion; Market Share 12.9%; PTI 582 million USD, up over 60% YTY
Net income of 473 million USD, up over 70% YTY
-188
177
358
582
-200
0
200
400
600
FY 08/09 FY 09/10 FY 10/11 FY 11/12
PTI
PTI (Millions USD)
Source: IDC and Internal Data
2012 LENOVO CONFIDENTIAL. ALL RIGHTS RESERVED. 4
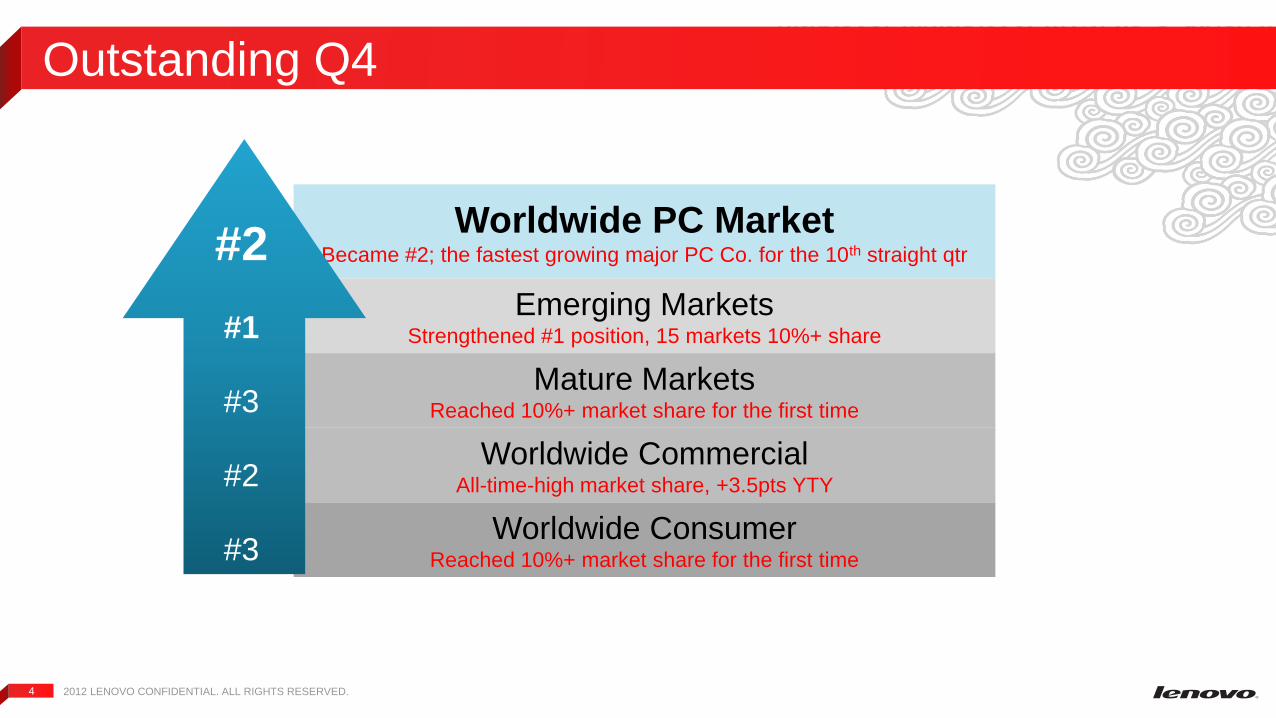
Worldwide PC Market Became #2; the fastest growing major PC Co. for the 10th straight qtr
Emerging Markets Strengthened #1 position, 15 markets 10%+ share
Mature Markets Reached 10%+ market share for the first time
Worldwide Commercial All-time-high market share, +3.5pts YTY
Worldwide Consumer Reached 10%+ market share for the first time
#2
#1
#3
#2
#3
Outstanding Q4

2012 LENOVO CONFIDENTIAL. ALL RIGHTS RESERVED. 5
Protect China Leadership
Record high market share
Profitability up 27% YTY
Strong presence in emerging cities will continue to drive growth
Lenovo China Market Share (%)
0
10
20
30
40
50
Q1 10/11
Q2 10/11
Q3 10/11
Q4 10/11
Q1 11/12
Q2 11/12
Q3 11/12
Q4 11/12
Lenovo China Shipment YTY Growth (%)
22.7%
9.7% Market
6.4%
6.9%
9.3%
9.6%
32%
0 10 20 30 40
Asus
HP
Acer
Dell
Lenovo
$112
$122
$112 $103
$166
$164 $176
$115
$-
$50
$100
$150
$200
Q1 10/11
Q2 10/11
Q3 10/11
Q4 10/11
Q1 11/12
Q2 11/12
Q3 11/12
Q4 11/12
China PC Segment Operating Profit
(US$M)
Source: IDC and Internal Data
2012 LENOVO CONFIDENTIAL. ALL RIGHTS RESERVED. 6
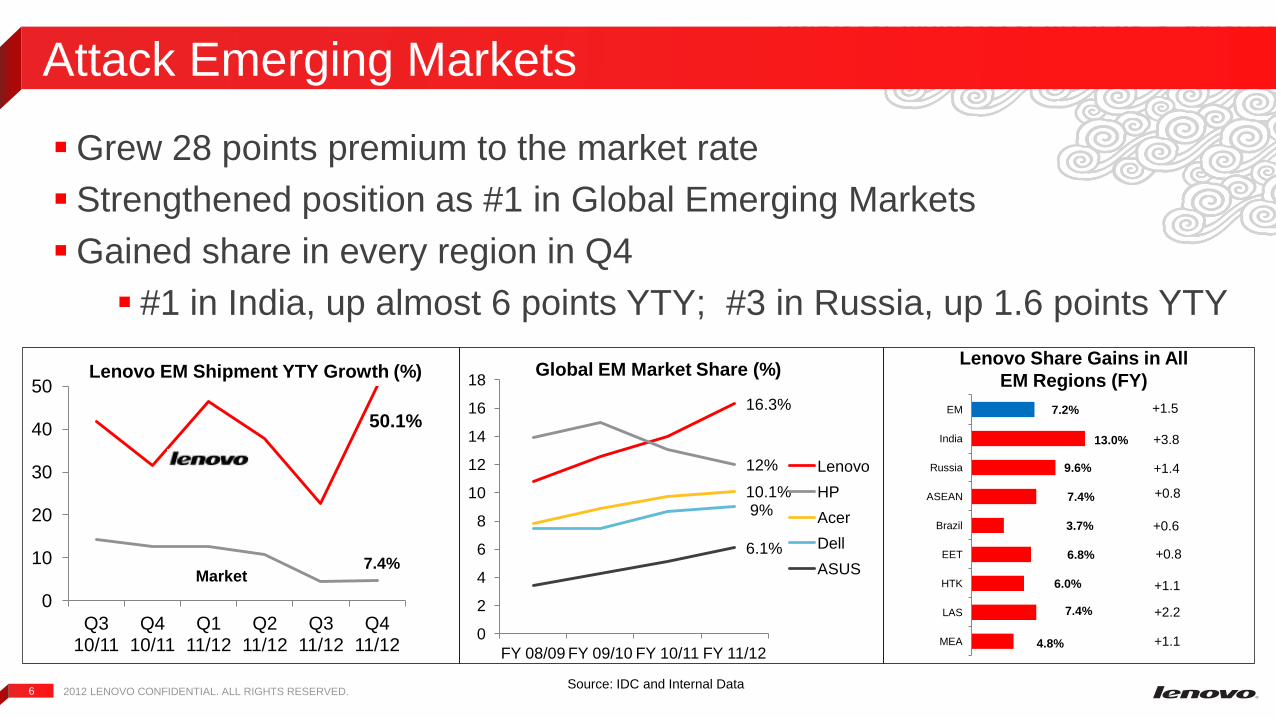
Attack Emerging Markets
Grew 28 points premium to the market rate
Strengthened position as #1 in Global Emerging Markets
Gained share in every region in Q4
#1 in India, up almost 6 points YTY; #3 in Russia, up 1.6 points YTY
0
10
20
30
40
50
Q3 10/11
Q4 10/11
Q1 11/12
Q2 11/12
Q3 11/12
Q4 11/12
Lenovo EM Shipment YTY Growth (%)
50.1%
7.4% Market
16.3%
12%
10.1% 9%
6.1%
0
2
4
6
8
10
12
14
16
18
FY 08/09 FY 09/10 FY 10/11 FY 11/12
Lenovo
HP
Acer
Dell
ASUS
Global EM Market Share (%)
4.8%
7.4%
6.0%
6.8%
3.7%
7.4%
9.6%
13.0%
7.2%
MEA
LAS
HTK
EET
Brazil
ASEAN
Russia
India
EM
+1.4
+1.5
+3.8
Lenovo Share Gains in All
EM Regions (FY)
+1.1
+2.2
+1.1
+0.8
+0.8
+0.6
Source: IDC and Internal Data
2012 LENOVO CONFIDENTIAL. ALL RIGHTS RESERVED. 7
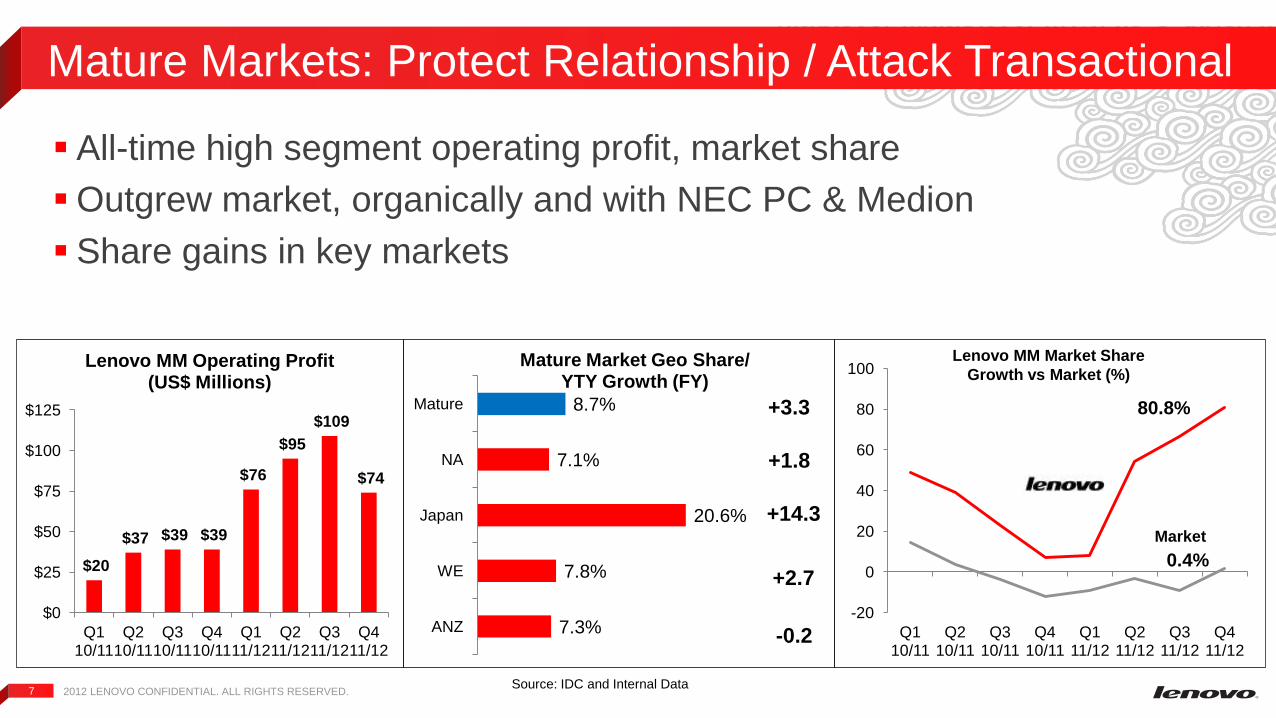
$20
$37 $39 $39
$76
$95
$109
$74
$0
$25
$50
$75
$100
$125
Q1 10/11
Q2 10/11
Q3 10/11
Q4 10/11
Q1 11/12
Q2 11/12
Q3 11/12
Q4 11/12
Lenovo MM Operating Profit (US$ Millions)
All-time high segment operating profit, market share
Outgrew market, organically and with NEC PC & Medion
Share gains in key markets
7.3%
7.8%
20.6%
7.1%
8.7%
ANZ
WE
Japan
NA
Mature
Mature Market Geo Share/ YTY Growth (FY)
+3.3
+1.8
+14.3
+2.7
-0.2
80.8%
0.4%
-20
0
20
40
60
80
100
Q1 10/11
Q2 10/11
Q3 10/11
Q4 10/11
Q1 11/12
Q2 11/12
Q3 11/12
Q4 11/12
Lenovo MM Market Share
Growth vs Market (%)
Mature Markets: Protect Relationship / Attack Transactional
Market
Source: IDC and Internal Data

2012 LENOVO CONFIDENTIAL. ALL RIGHTS RESERVED. 8
Attack Mobile Internet
Smartphone grew 11 times YTY, 6x the China market rate, market share 9.5%
Strong growth in tablets, solid #2 in China, up to #4 in WW
0.9% 1.2% 1%
1.3% 0.9%
1.7%
7.5%
9.5%
0
1
2
3
4
5
6
7
8
9
10
Q1 10/11
Q2 10/11
Q3 10/11
Q4 10/11
Q1 11/12
Q2 11/12
Q3 11/12
Q4 11/12
Lenovo China Smartphone Market Share (%) Lenovo China Tablet Market Share (%)
16.4%
22.9%
45.3% 48.7%
6.6% 6.3%
15.2% 17.2%
0%
10%
20%
30%
40%
50%
60%
Q1 11/12 Q2 11/12 Q3 11/12 Q4 11/12
Android
Tablet
Source: IDC Source: Sino
2012 LENOVO CONFIDENTIAL. ALL RIGHTS RESERVED. 9
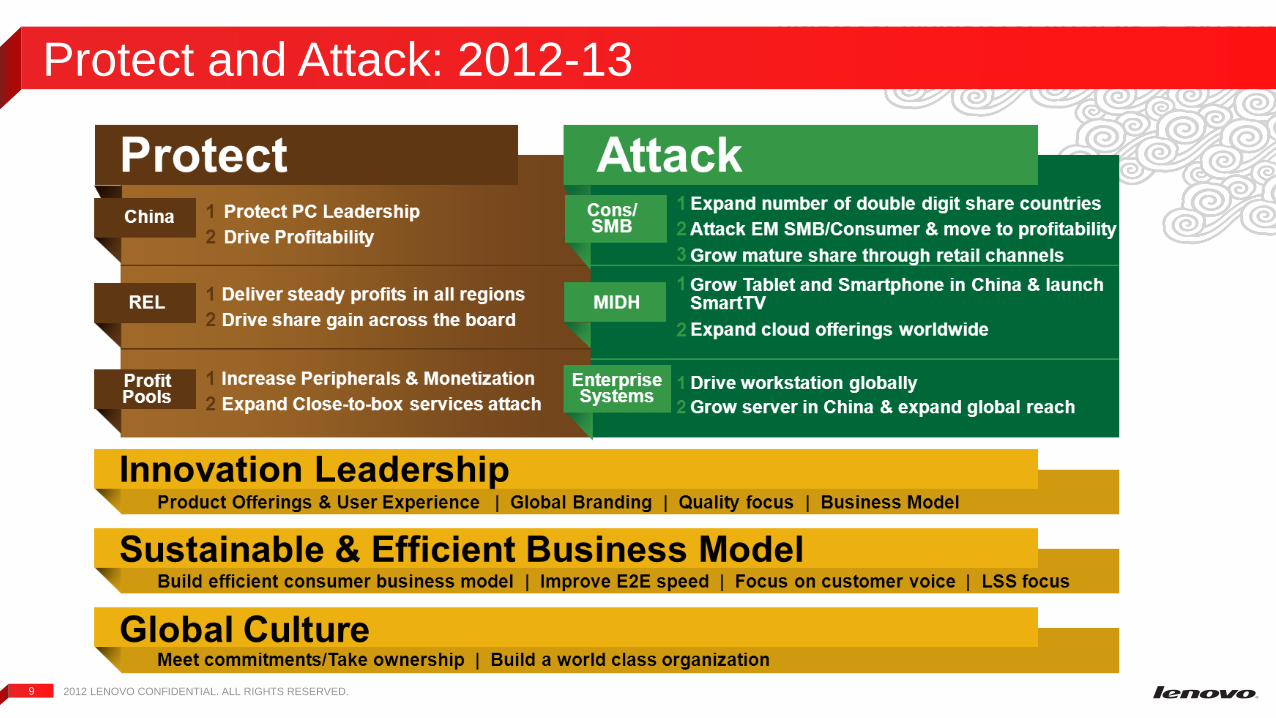
Protect and Attack: 2012-13
2012 LENOVO CONFIDENTIAL. ALL RIGHTS RESERVED. 10
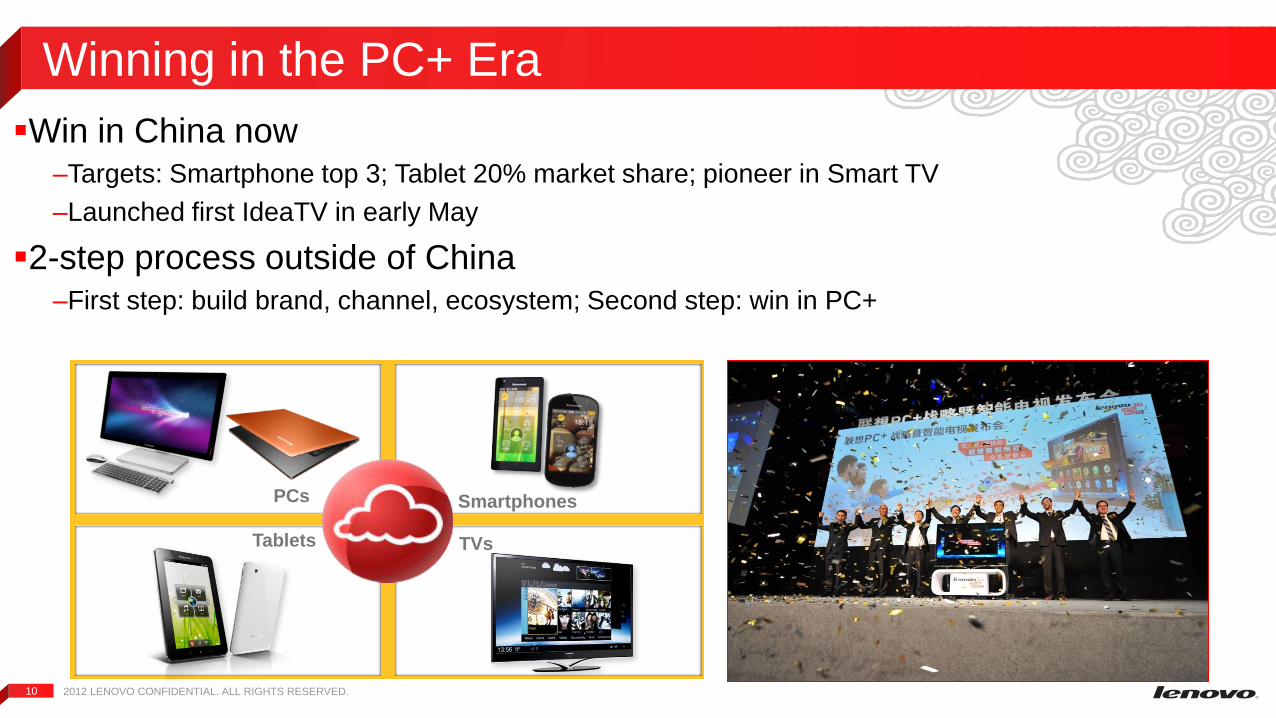
Win in China now –Targets: Smartphone top 3; Tablet 20% market share; pioneer in Smart TV
–Launched first IdeaTV in early May
2-step process outside of China –First step: build brand, channel, ecosystem; Second step: win in PC+
Winning in the PC+ Era
PCs
Tablets
Smartphones
TVs
2012 LENOVO CONFIDENTIAL. ALL RIGHTS RESERVED. 11
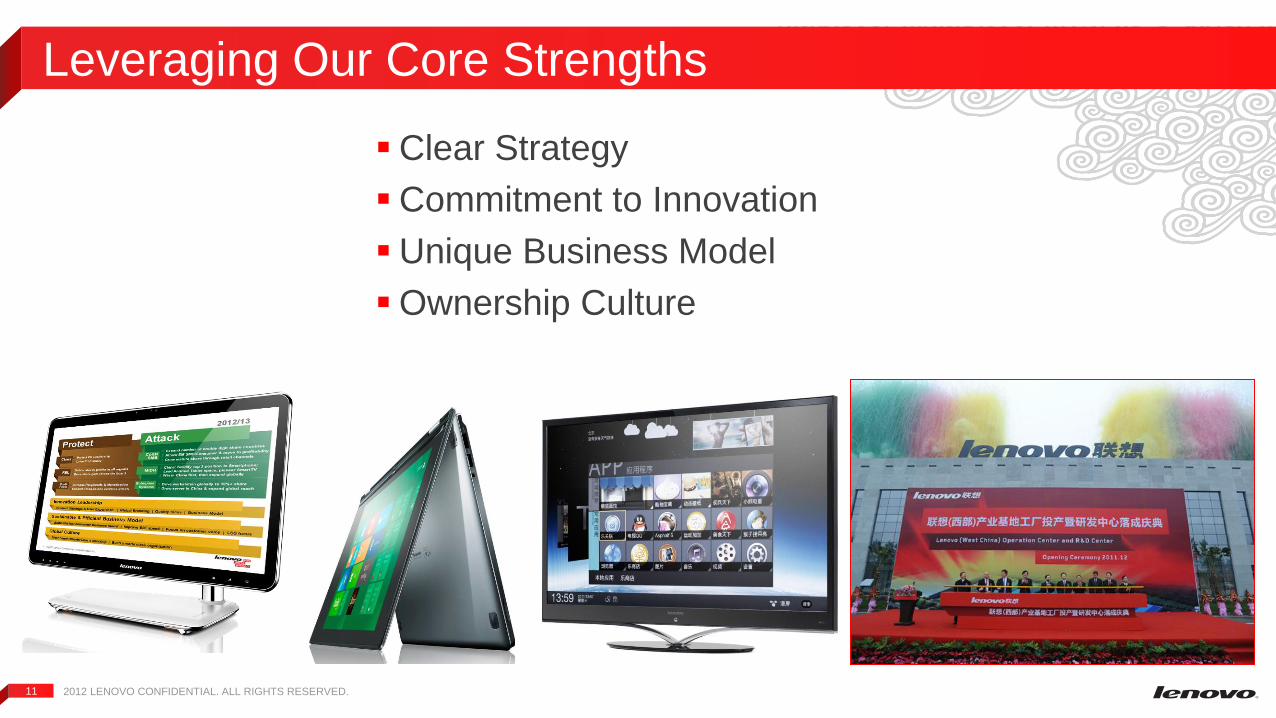
Leveraging Our Core Strengths
Clear Strategy
Commitment to Innovation
Unique Business Model
Ownership Culture

2012 LENOVO CONFIDENTIAL. ALL RIGHTS RESERVED. 12
Outlook for the Year
2012 LENOVO CONFIDENTIAL. ALL RIGHTS RESERVED. 13
2012 LENOVO CONFIDENTIAL. ALL RIGHTS RESERVED. 14
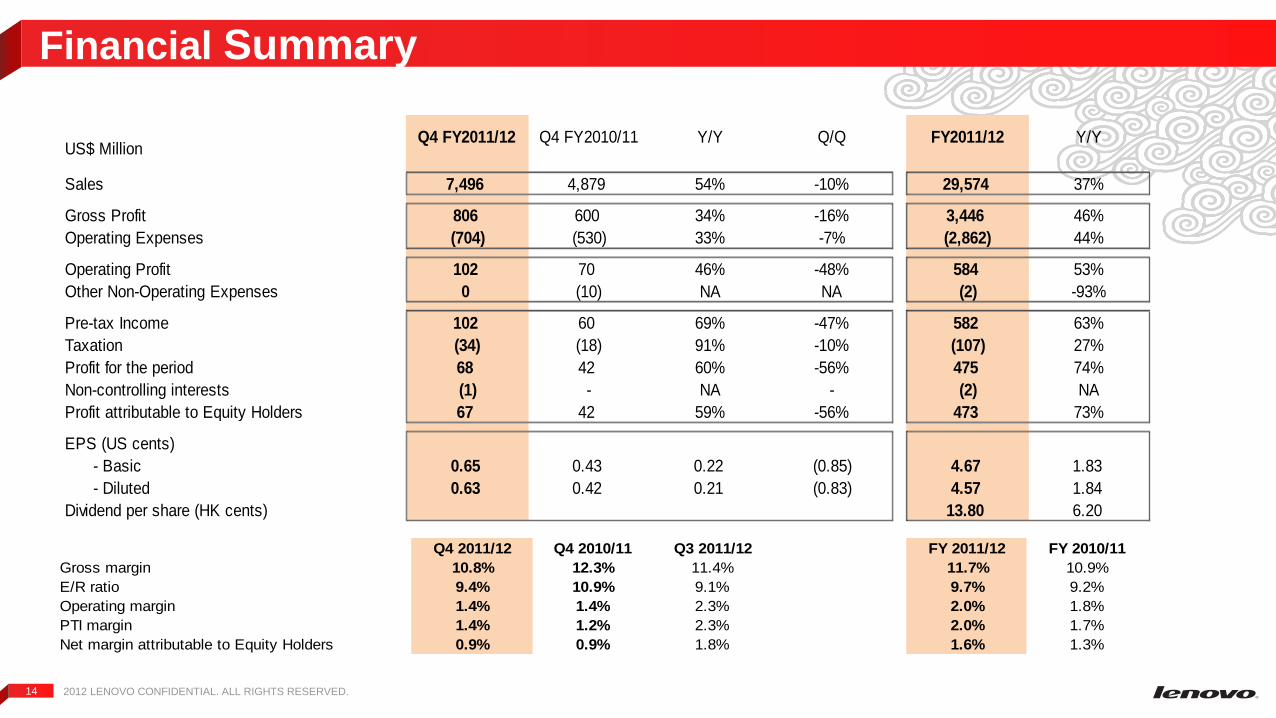
Financial Summary
Q4 2011/12 Q4 2010/11 Q3 2011/12 FY 2011/12 FY 2010/11
Gross margin 10.8% 12.3% 11.4% 11.7% 10.9%
E/R ratio 9.4% 10.9% 9.1% 9.7% 9.2%
Operating margin 1.4% 1.4% 2.3% 2.0% 1.8%
PTI margin 1.4% 1.2% 2.3% 2.0% 1.7%
Net margin attributable to Equity Holders 0.9% 0.9% 1.8% 1.6% 1.3%
US$ MillionQ4 FY2011/12 Q4 FY2010/11 Y/Y Q/Q FY2011/12 Y/Y
Sales 7,496 4,879 54% -10% 29,574 37%
Gross Profit 806 600 34% -16% 3,446 46%
Operating Expenses (704) (530) 33% -7% (2,862) 44%
Operating Profit 102 70 46% -48% 584 53%
Other Non-Operating Expenses 0 (10) NA NA (2) -93%
Pre-tax Income 102 60 69% -47% 582 63%
Taxation (34) (18) 91% -10% (107) 27%
Profit for the period 68 42 60% -56% 475 74%
Non-controlling interests (1) - NA - (2) NA
Profit attributable to Equity Holders 67 42 59% -56% 473 73%
EPS (US cents)
- Basic 0.65 0.43 0.22 (0.85) 4.67 1.83
- Diluted 0.63 0.42 0.21 (0.83) 4.57 1.84
Dividend per share (HK cents) 13.80 6.20
2012 LENOVO CONFIDENTIAL. ALL RIGHTS RESERVED. 15
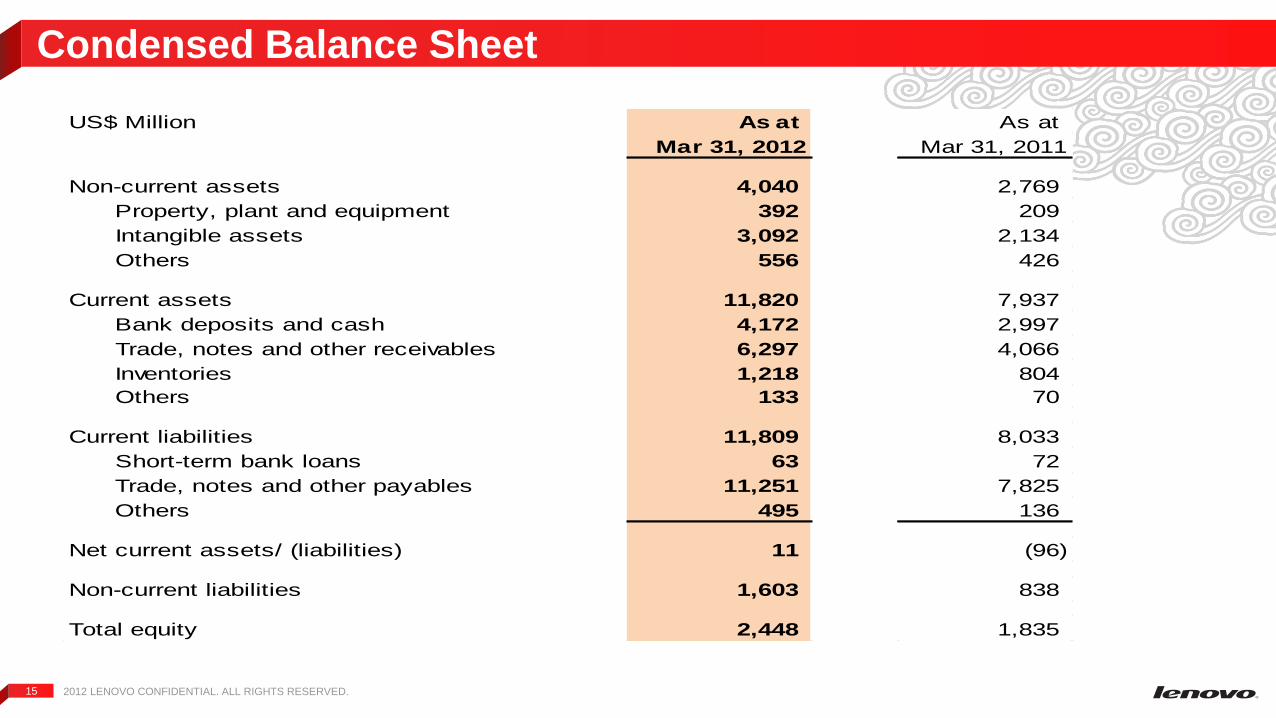
Condensed Balance Sheet
US$ Million As at As at
Mar 31, 2012 Mar 31, 2011
Non-current assets 4,040 2,769
Property, plant and equipment 392 209
Intangible assets 3,092 2,134
Others 556 426
Current assets 11,820 7,937
Bank deposits and cash 4,172 2,997
Trade, notes and other receivables 6,297 4,066
Inventories 1,218 804
Others 133 70
Current liabilities 11,809 8,033
Short-term bank loans 63 72
Trade, notes and other payables 11,251 7,825
Others 495 136
Net current assets/ (liabilities) 11 (96)
Non-current liabilities 1,603 838
Total equity 2,448 1,835
2012 LENOVO CONFIDENTIAL. ALL RIGHTS RESERVED. 16
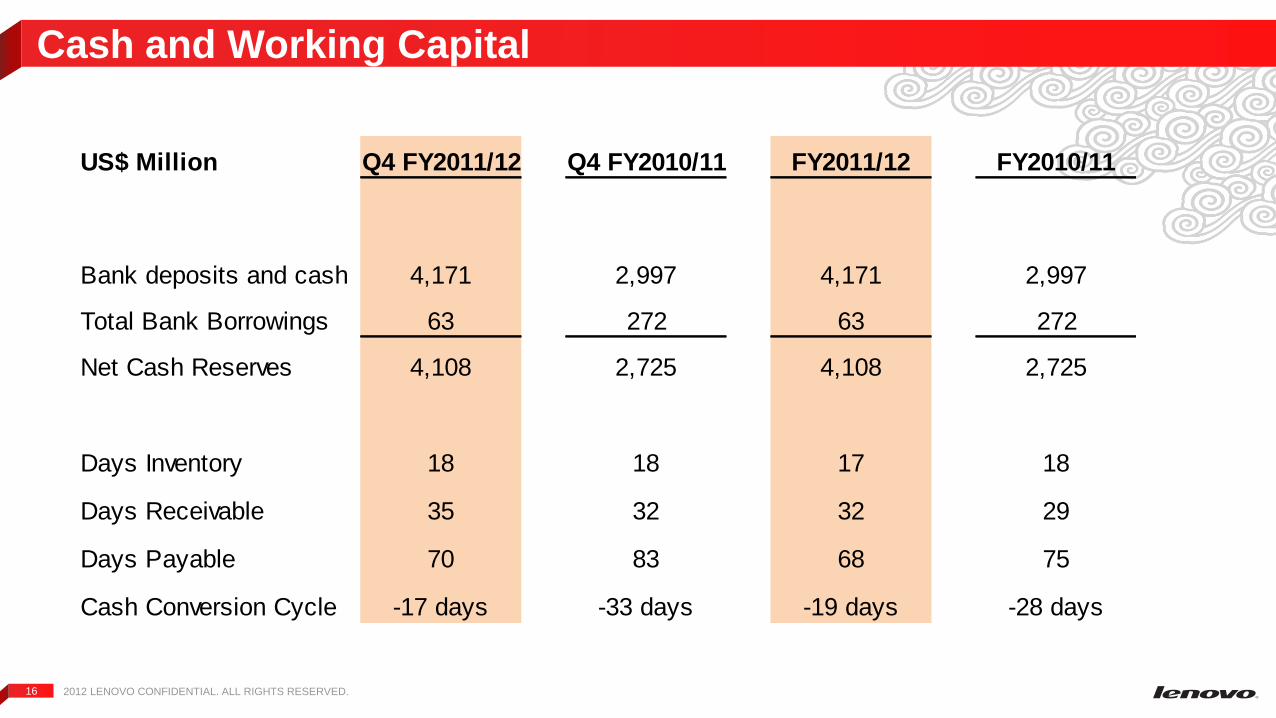
Cash and Working Capital
US$ Million Q4 FY2011/12 Q4 FY2010/11 FY2011/12 FY2010/11
Bank deposits and cash 4,171 2,997 4,171 2,997
Total Bank Borrowings 63 272 63 272
Net Cash Reserves 4,108 2,725 4,108 2,725
Days Inventory 18 18 17 18
Days Receivable 35 32 32 29
Days Payable 70 83 68 75
Cash Conversion Cycle -17 days -33 days -19 days -28 days
2012 LENOVO CONFIDENTIAL. ALL RIGHTS RESERVED. 17
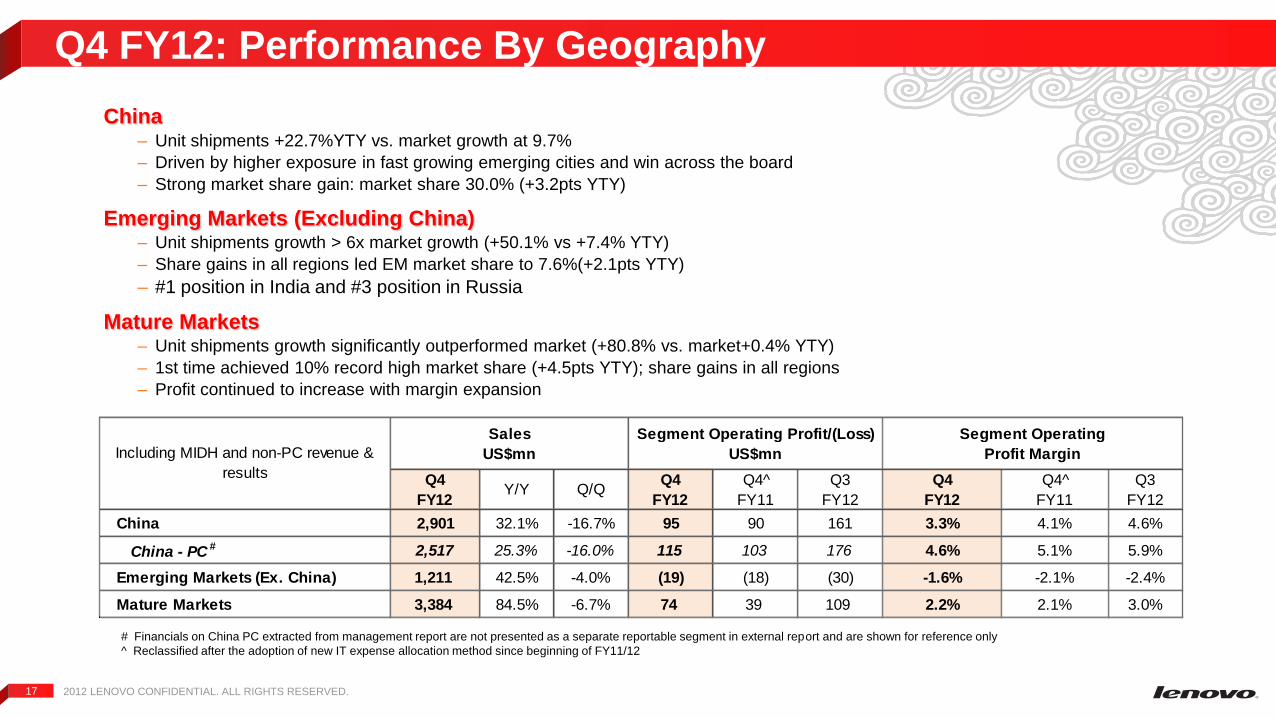
Q4 FY12: Performance By Geography
China – Unit shipments +22.7%YTY vs. market growth at 9.7%
– Driven by higher exposure in fast growing emerging cities and win across the board
– Strong market share gain: market share 30.0% (+3.2pts YTY)
Emerging Markets (Excluding China) – Unit shipments growth > 6x market growth (+50.1% vs +7.4% YTY)
– Share gains in all regions led EM market share to 7.6%(+2.1pts YTY)
– #1 position in India and #3 position in Russia
Mature Markets – Unit shipments growth significantly outperformed market (+80.8% vs. market+0.4% YTY)
– 1st time achieved 10% record high market share (+4.5pts YTY); share gains in all regions
– Profit continued to increase with margin expansion
# Financials on China PC extracted from management report are not presented as a separate reportable segment in external report and are shown for reference only
^ Reclassified after the adoption of new IT expense allocation method since beginning of FY11/12
Q4
FY12Y/Y Q/Q
Q4
FY12
Q4^
FY11
Q3
FY12
Q4
FY12
Q4^
FY11
Q3
FY12
China 2,901 32.1% -16.7% 95 90 161 3.3% 4.1% 4.6%
China - PC # 2,517 25.3% -16.0% 115 103 176 4.6% 5.1% 5.9%
Emerging Markets (Ex. China) 1,211 42.5% -4.0% (19) (18) (30) -1.6% -2.1% -2.4%
Mature Markets 3,384 84.5% -6.7% 74 39 109 2.2% 2.1% 3.0%
US$mn
Segment Operating Profit/(Loss)
Profit Margin
Segment Operating
US$mnIncluding MIDH and non-PC revenue &
results
Sales
2012 LENOVO CONFIDENTIAL. ALL RIGHTS RESERVED. 18
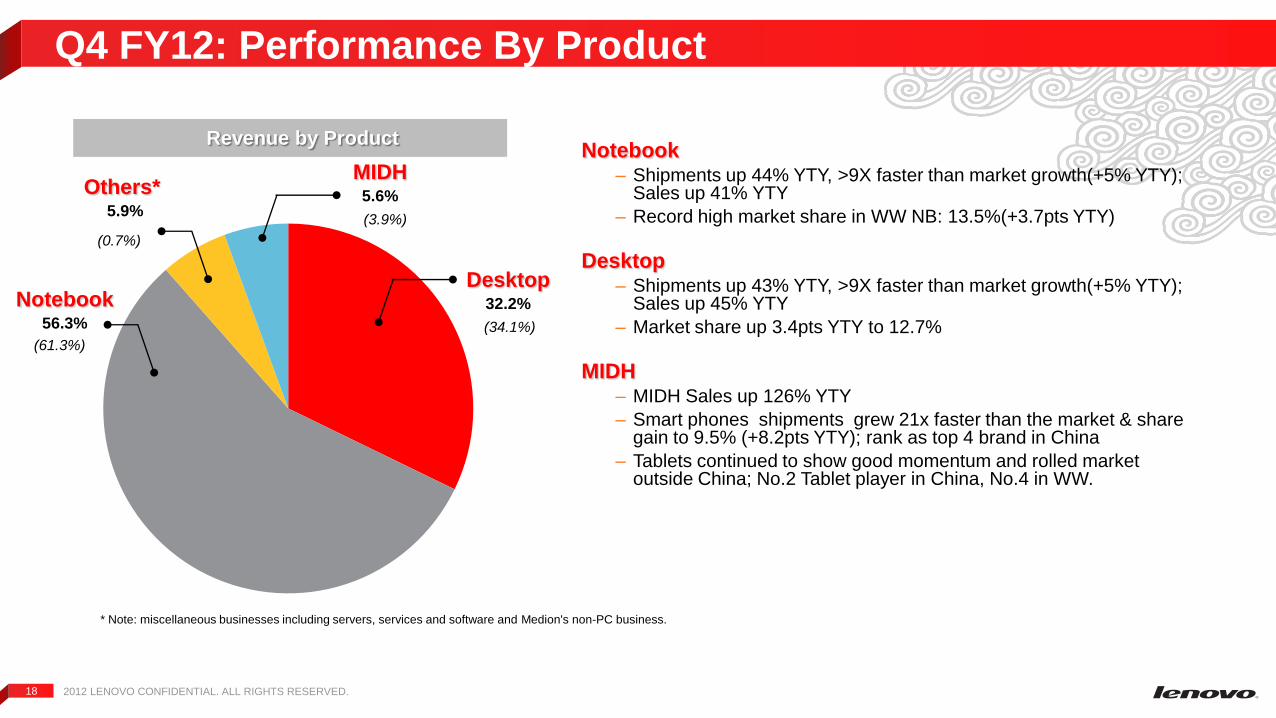
Q4 FY12: Performance By Product
Notebook – Shipments up 44% YTY, >9X faster than market growth(+5% YTY);
Sales up 41% YTY
– Record high market share in WW NB: 13.5%(+3.7pts YTY)
Desktop
– Shipments up 43% YTY, >9X faster than market growth(+5% YTY); Sales up 45% YTY
– Market share up 3.4pts YTY to 12.7%
MIDH – MIDH Sales up 126% YTY
– Smart phones shipments grew 21x faster than the market & share gain to 9.5% (+8.2pts YTY); rank as top 4 brand in China
– Tablets continued to show good momentum and rolled market outside China; No.2 Tablet player in China, No.4 in WW.
(3.9%)
MIDH 5.6%
Revenue by Product
Desktop 32.2%
(34.1%)
Notebook 56.3%
(61.3%)
(0.7%)
Others* 5.9%
* Note: miscellaneous businesses including servers, services and software and Medion's non-PC business.
Appendix
• Performance by Geography – FY12
• Performance by Product – FY12
• Consolidated Income Statement
• Condensed Consolidated Cash Flow Statement

2012 LENOVO CONFIDENTIAL. ALL RIGHTS RESERVED. 20
Performance By Geography - FY12
China – Unit shipments growth at +25.2% vs. market growth at +12.7% YTY
– Continue to be #1 position with record high 32.0% market share, with significant market share gain (+3.2pts YTY)
– OP Margin at 4.5%(+0.1pts YTY) even with investment in MIDH to drive LT growth, PC Margin at 5.6% (+0.7pts YTY) due to scaling benefits from the substantial market share expansion
Emerging Markets (Excluding China) – Unit shipments grow 4.0x of the market(+37.9% vs. market +9.6% YTY)
– Share gains in all regions led EM market share to 7.2%(+1.5pts YTY)
Mature Markets – Strong unit shipments growth YTY (FY12: +52.8% vs. market -5.0%; Organic Growth: +21%) despite market decline
– Record high MM market share (8.7%; +3.3pts YTY)
– >2x increase in operating profit YTY to $354M due to strong CA growth; Overall OP margin improved to 2.9% (+1.2pts YTY)
FY12 YTY FY12 FY11^ FY12 FY11^
China 12,395 24% 552 436 4.5% 4.4%
China - PC # 11,055 20% 622 449 5.6% 4.9%
Emerging Markets (Ex. China) 4,803 24% (94) (62) -2.0% -1.6%
Mature Markets 12,376 60% 354 134 2.9% 1.7%
Including MIDH and non-PC revenue &
results
Segment Operating Profit
Margin
Segment Operating Profit/(Loss)
US$ Million
Sales
US$ Million
# Financials on China PC extracted from management report are not presented as a separate reportable segment in external report and are shown for reference only
^ Reclassified after the adoption of new IT expense allocation method since beginning of FY11/12
2012 LENOVO CONFIDENTIAL. ALL RIGHTS RESERVED. 21
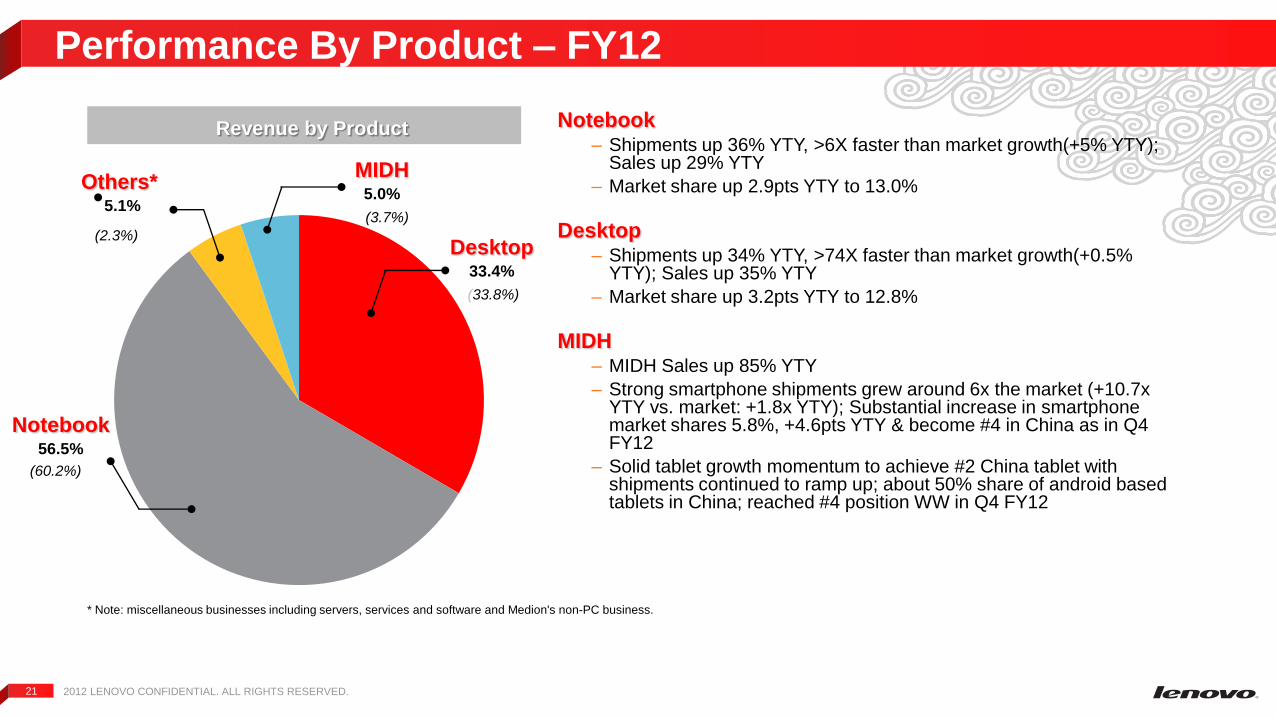
Performance By Product – FY12
Notebook – Shipments up 36% YTY, >6X faster than market growth(+5% YTY);
Sales up 29% YTY
– Market share up 2.9pts YTY to 13.0%
Desktop
– Shipments up 34% YTY, >74X faster than market growth(+0.5% YTY); Sales up 35% YTY
– Market share up 3.2pts YTY to 12.8%
MIDH – MIDH Sales up 85% YTY
– Strong smartphone shipments grew around 6x the market (+10.7x YTY vs. market: +1.8x YTY); Substantial increase in smartphone market shares 5.8%, +4.6pts YTY & become #4 in China as in Q4 FY12
– Solid tablet growth momentum to achieve #2 China tablet with shipments continued to ramp up; about 50% share of android based tablets in China; reached #4 position WW in Q4 FY12
(3.7%)
MIDH 5.0%
Revenue by Product
Desktop 33.4%
(33.8%)
Notebook 56.5%
(60.2%)
(2.3%)
Others* 5.1%
* Note: miscellaneous businesses including servers, services and software and Medion's non-PC business.
2012 LENOVO CONFIDENTIAL. ALL RIGHTS RESERVED. 22
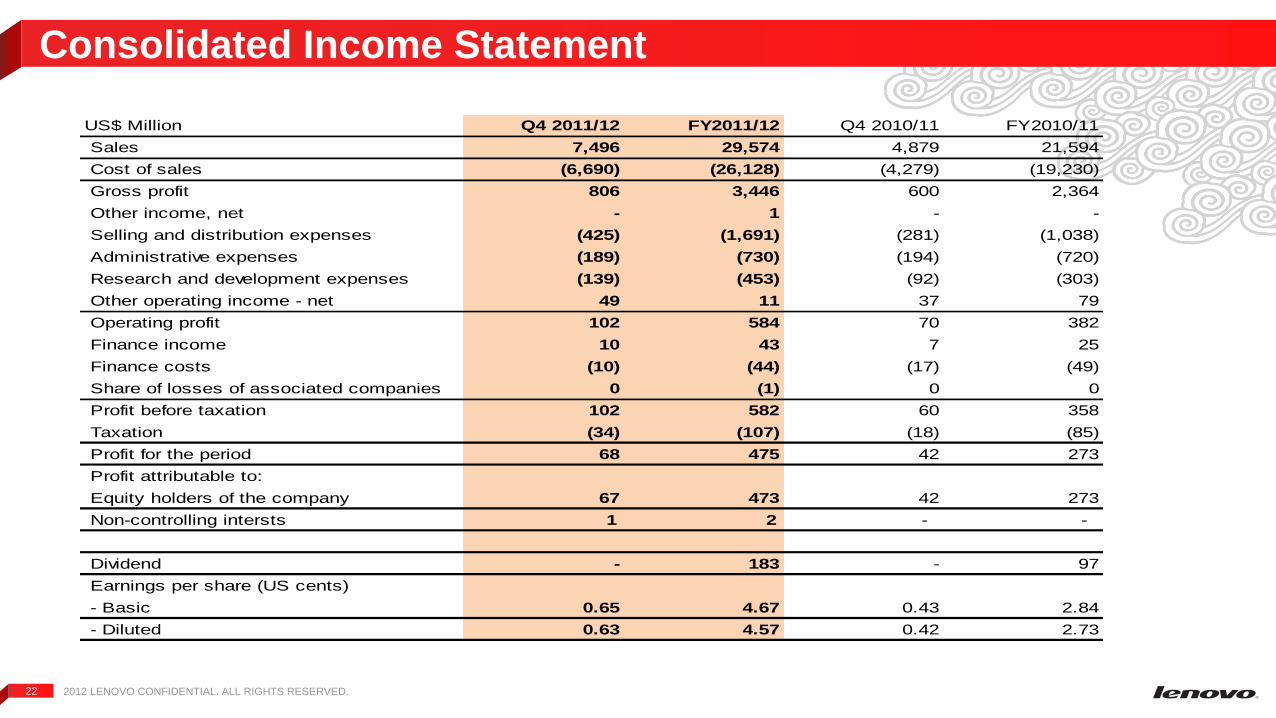
Consolidated Income Statement
US$ Million Q4 2011/12 FY2011/12 Q4 2010/11 FY2010/11
Sales 7,496 29,574 4,879 21,594
Cost of sales (6,690) (26,128) (4,279) (19,230)
Gross profit 806 3,446 600 2,364
Other income, net - 1 - -
Selling and distribution expenses (425) (1,691) (281) (1,038)
Administrative expenses (189) (730) (194) (720)
Research and development expenses (139) (453) (92) (303)
Other operating income - net 49 11 37 79
Operating profit 102 584 70 382
Finance income 10 43 7 25
Finance costs (10) (44) (17) (49)
Share of losses of associated companies 0 (1) 0 0
Profit before taxation 102 582 60 358
Taxation (34) (107) (18) (85)
Profit for the period 68 475 42 273
Profit attributable to:
Equity holders of the company 67 473 42 273
Non-controlling intersts 1 2 - -
Dividend - 183 - 97
Earnings per share (US cents)
- Basic 0.65 4.67 0.43 2.84
- Diluted 0.63 4.57 0.42 2.73
2012 LENOVO CONFIDENTIAL. ALL RIGHTS RESERVED. 23
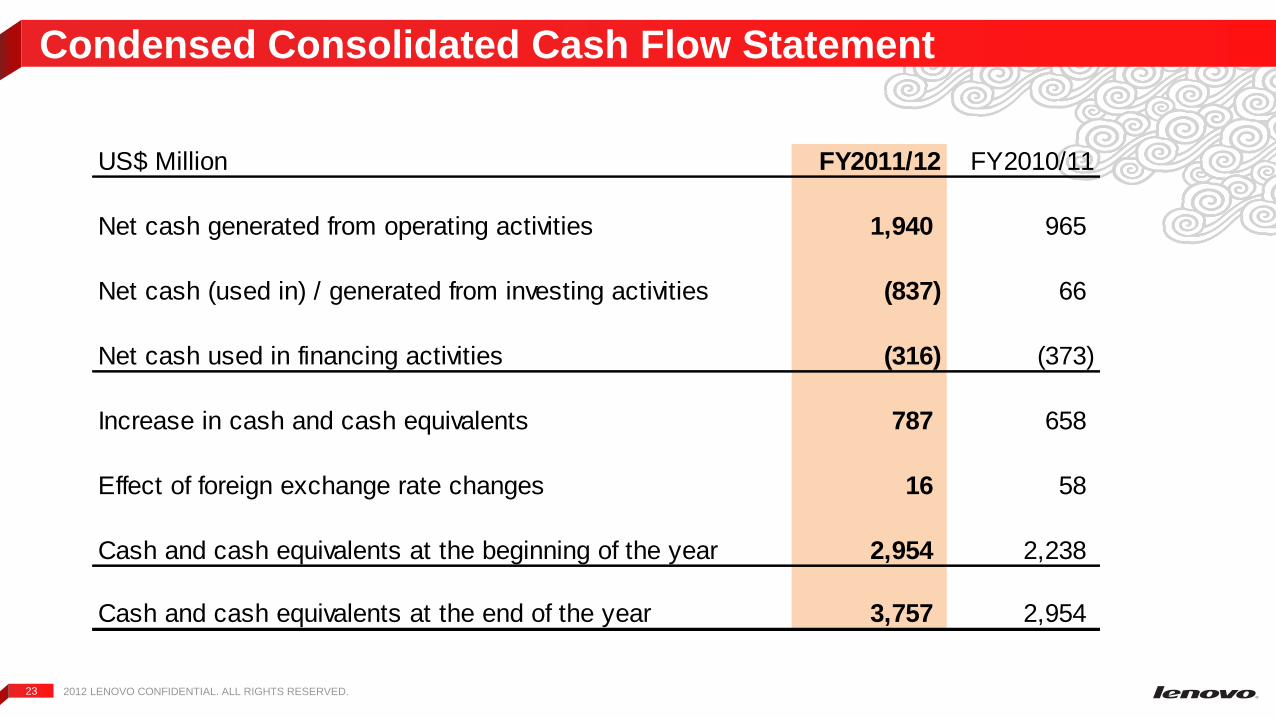
Condensed Consolidated Cash Flow Statement
US$ Million FY2011/12 FY2010/11
Net cash generated from operating activities 1,940 965
Net cash (used in) / generated from investing activities (837) 66
Net cash used in financing activities (316) (373)
Increase in cash and cash equivalents 787 658
Effect of foreign exchange rate changes 16 58
Cash and cash equivalents at the beginning of the year 2,954 2,238
Cash and cash equivalents at the end of the year 3,757 2,954