20 february 2020 full year 2019 operating result at 1,141 ...€¦ · the 2020 fuel bill is...
TRANSCRIPT

1
20 February 2020
FULL YEAR 2019 Operating result at 1,141 million euros, unit cost at -0.9%,
pressure on Cargo unit revenue and a higher fuel bill
FULL YEAR 2019 Revenue growth for all businesses, with strong performance from Transavia and Maintenance
Unit cost at constant currency and fuel reduced by -0.9%, at the better end of guidance range
Operating result at 1,141 million euros, down 264 million euros compared to last year1
Net income at 290 million euros
Net debt/EBITDA ratio at 1.5x, in line with guidance
Record levels of customer satisfaction for Air France and steady-state high level for KLM
Leading airline group on sustainability in the Dow Jones Sustainability Index
OUTLOOK
Business trends After a good performance for the Passenger Network activity with positive unit revenue in January 2020, recent developments with regards to the Covid-19 have impacted the demand outlook, especially in the Asian network. This translates in long-haul forward booking load factors down from February to May 2020. As a consequence the Group anticipates unit revenues at constant currency to be down for the first quarter of 2020.
The Cargo activity is also impacted by Covid-19, foreseen to maintain pressure on the load factor and yield in the first part of 2020.
Based on the Group announcement regarding Covid-19 (suspension of China operations in February-March and possible resumption of operations starting from April 2020), the high-level estimated impact on operating result is of between -150 and -200 million euros for February to April 2020.
Full year 2020 guidance
Unit cost reduction of between -1% and 0% at constant currency and fuel price
The Group plans capital expenditures of 3.6 billion euros for 2020
Net debt/ EBITDA ratio of circa 1.5x The 2020 fuel bill is expected to decrease by 300 million euros compared to 2019 to 5.2 billion euros, based on the forward curve of 14 February 2020
The Board of Directors of Air France-KLM, chaired by Anne-Marie Couderc, met on 19 February 2020 to approve the financial statements for the Full year 2019.
“In 2019, the Air France-KLM Group posted an operating result at 1,141 million euros with a fuel bill hit and pressure on Cargo unit revenues” said Benjamin Smith, CEO of the Air France-KLM Group. Over the year we reinforced our foundations to build a European champion, notably through fleet optimization and restored trust that led to social stability and positive labour agreements at Air France and new CLA agreements at KLM. I am also proud that our Group was again at the top of the DJSI ranking and is recognized as an experienced and knowledgeable environmental leader in the industry. In November, we outlined our strategic plan with a substantial further step-up in financial performance foreseen, and we begin on this 5-year trajectory with a robust financial structure and strong unique assets.”
Air France-KLM Group Fourth quarter Full year
2019 Change 2019 Change
Passengers (thousands) 24,612 +0.6% 104,205 +2.7%
Passenger Unit revenue per ASK2 (€ cts) 6.58 +0.6% 6.67 -0.2%
Operating result (€m) 96 +43 1,141 -264
Net income – Group part (€m) 156 +373 290 -130
Adj. operating free cash flow (€m) -501 -489 -385 -500
Net debt at end of period (€m) 6,147 -17
2018 and 2019 results restated (with a similar impact in both years) for limited life parts componentization accounting change. See notes in the consolidated financial statements paragraph 2, page 12-15 and page 9-10 of this press release.
1 The Air France strike had a -335 million euros impact on the Full year 2018 operating result 2 Passenger unit revenue is the aggregate of Passenger network and Transavia unit revenues, change at constant currency
1

2
Business review
Network: Resilient performance from Passenger and ongoing pressure on Cargo in the 2019 fourth quarter
Network
Fourth quarter Full year
2019 Change Change constant currency
2019 Change Change constant currency
Total revenues (€m) 5,756 +1.2% +0.0% 23,272 +2.6% +1.5%
Scheduled revenues (€m) 5,499 +1.8% +0.4% 22,251 +2.4% +1.1%
Operating result (€m) 38 -8 -22 749 -293 -256
Full year 2019 revenues increased by +1.5% at constant currency to 23.3 billion euros, thanks to the growth of the network activity. The operating result amounted to 749 million euros, a 256 million euro decrease at constant currency compared to last year, mainly explained by an increased fuel bill and with a good unit cost performance offsetting the drop in Cargo unit revenue. Passenger network: Unit revenue in the fourth quarter 2019 -0.2% as expected, with a strong performance from French domestic and Medium-haul.
Fourth quarter Full year
Passenger network 2019 Change Change
constant currency
2019 Change Change constant currency
Passengers (thousands) 21,346 +1.1% 87,624 +2.3%
Capacity (ASK m) 74,723 +2.4% 299,606 +2.5%
Traffic (RPK m) 64,941 +3.4% 263,499 +3.2%
Load factor 86.9% +0.8 pt 87.9% +0.5 pt
Total passenger revenues (€m) 5,197 +2.8% +1.8% 21,119 +3.6% +2.5%
Scheduled passenger revenues (€m) 5,020 +3.5% +2.3% 20,408 +3.4% +2.1%
Unit revenue per ASK (€ cts) 6.72 +1.1% -0.2% 6.81 +0.8% -0.4%
The fourth quarter 2019 posted a mixed performance from the Long-haul network and an improving trend in Short & Medium-haul:
The North Atlantic network’s unit revenue was down -2.8% in the fourth quarter 2019 compared to last year, explained by a 5% ramp-up in Air France-KLM capacity and measures undertaken to defend market-share on specific local traffic flows.
The Asian network’s unit revenue was slightly down (-0.7%) in the fourth quarter 2019, with a continuing strong performance in the networks to Japan, Korea and India. The performance of the routes to Greater China continued to be subdued by the ongoing geo-political situation in Hong Kong.
The Caribbean & Indian Ocean network continued to post solid results with a fourth quarter unit revenue at +2.8%, supported by strong leisure demand.
The Africa & Middle East network saw a unit revenue improvement of 1.8%, underpinned by network rationalizations in the Middle East.
The Latin American network showed an improving trend but continued to post negative unit revenues (-4.2%) as the geo-political and economic context remained challenging in Argentina, Brazil and Chile.
The performance from the Medium-haul hubs was strong with fourth quarter unit revenues up 3.9%, underpinned by a marked moderation in industry capacity growth.

3
The positive effects from the rationalization measures in the Domestic France network were clearly visible, resulting in an improved performance in the fourth quarter with unit revenues up 7.8%.
Cargo: Performance impacted by continuing supply-demand imbalance in the fourth quarter 2019
Fourth quarter Full year
Cargo business 2019 Change Change
constant currency
2019 Change Change constant currency
Tons (thousands) 288 -5.0% 1,110 -2.3%
Capacity (ATK m) 3,714 +2.3% 14,609 +1.7%
Traffic (RTK m) 2,208 -4.9% 8,467 -2.2%
Load factor 59.5% -4.5 pt 58.0% -2.3 pt
Total Cargo revenues (€m) 559 -12.0% -13.7% 2,153 -5.9% -7.8%
Scheduled cargo revenues (€m) 479 -13.5% -15.3% 1,843 -7.3% -9.1%
Unit revenue per ATK (€ cts ) 12.91 -15.4% -17.1% 12.62 -8.9% -10.7%
Fourth quarter 2019 unit revenue remained under strong pressure and was down 17.1% compared to last year at constant currency. Effective cost control measures partly mitigated the negative impact of the Cargo contribution on the Network results. Substantial Cargo industry capacity additions in 2019 led to the worst traffic versus capacity trend for the last 10 years, driven by opportunistic growth strategies after the strong Cargo market in the second half of 2017 and Full year 2018.This caused substantial (belly) overcapacity, particularly on the North Atlantic routes. On the demand side, at the year end world-wide air freight volumes had fallen for 14 consecutive months, caused by geo-political uncertainties resulting in weak global air freight demand, trade tensions impacting especially ex-Asia volumes and a strong decline in demand from the auto-motive industry. In this context, the market share of Air France-KLM Cargo proved resilient, with the growth realized in alternative flows partly mitigating the ex-Asia losses. The Group’s Cargo strategy is focused on maintaining and increasing load factors where possible and taking a pro-active approach to new revenue opportunities. A new Revenue Action plan for 2020 has been established to deliver incremental revenues.

4
Transavia: Strong performance in the 2019 fourth quarter and strong demand in both home markets
Fourth quarter Full year
Transavia 2019 Change 2019 Change
Passengers (thousands) 3,266 -2.6% 16,581 +4.8%
Capacity (ASK m) 6,640 -2.6% 32,867 +6.5%
Traffic (RPK m) 6,064 -2.2% 30,303 +6.7%
Load factor 91.3% +0.4 pt 92.2% +0.2 pt
Total passenger revenues (€m) 338 +10.8% 1,744 +9.3%
Unit revenue per ASK (€ cts) 4.97 +10.2% 5.34 +3.0%
Unit cost per ASK (€ cts) 5.38 +4.8% 4.94 +4.8%
Operating result (€m) -27 +15 131 -14
As anticipated, capacity growth was slightly negative in the fourth quarter 2019 at -2.6% due to the increase in cockpit training needed to prepare for future growth in Transavia France. Transavia delivered a good unit revenue performance in the fourth quarter 2019 with an increase of 10.2% compared to last year, in the context of capacity moderation combined with strong demand in both home markets. The unit revenue for the Full year 2019 increased by 3.0% compared to last year, due to strong demand in both France and the Netherlands. For the Full year 2019, the revenue grew by 9.3% compared to last year for capacity growth of 6.5%. The Transavia unit cost for the Full year increased by 2.7% at constant fuel and currency, explained by increased fleet related- and non-performance costs. The Full year operating margin stood at 7.5%, with an absolute operating result of 131 million euros, 14 million euros down compared to last year.
Solid trend in Maintenance business margins in 2019
Fourth quarter Full year
Maintenance 2019 Change Change
constant currency
2019 Change Change constant currency
Total revenues (€m) 1,163 -3.6% 4,617 +6.2%
Third-party revenues (€m) 515 +5.1% +1.0% 2,138 +11.3% +5.8%
Operating result (€m) 90 43 39 260 46 27
Operating margin (%) 7.7% +3.8 pt +3.6 pt 5.6% +0.7 pt +0.4 pt
The fourth quarter operating result stood at 90 million euros, an increase of 43 million euros, underpinned mainly by increased Engine activity for Third-parties. Full year 2019 revenues increased compared to last year with third-party revenues up 11.3% and 5.8% at constant currency, a continuation of the growth trend underpinned by the inflow of new contracts. The Full year 2019 operating result stood at 260 million euros, an increase of 46 million euros, supported by positive contributions from all business segments: Airframe, Engines and Components. The relentless focus from the teams on turn-around times and cost efficiencies drove these margin improvements. The Maintenance order book stood at 11.5 billion dollars at 31 December 2019, stable on last year.

5
Air France-KLM Group: Full year 2019 operating result at 1,141 million euros with cost efficiency measures offset by pressure on Cargo unit revenue and a fuel bill increase
Fourth quarter Full year
2019 Change Change
constant currency
2019 Change Change constant currency
Capacity (ASK m) 81,363 +2.0% 332,473 +2.9%
Traffic (RPK m) 71,005 +2.9% 293,802 +3.5%
Passenger unit revenue per ASK (€ cts) 6.58 +1.7% +0.6% 6.67 +0.9% -0.2%
Group unit revenue per ASK (€ cts) 7.16 -0.1% -1.1% 7.22 -0.0% -1.2%
Group unit cost per ASK (€ cts) at constant fuel
7.05 -0.5% -1.5% 6.88 +0.5% -0.9%
Revenues (€m) 6,618 +1.9% +0.5% 27,189 +3.7% +2.2%
EBITDA (€m) 867 +8.2% +6.1% 4,128 -3.8% -3.3%
Operating result (€m) 96 +81.1% +35.9% 1,141 -18.8% -17.7%
Operating margin (%) 1.5% +0.6 pt +0.4 pt 4.2% -1.2 pt -1.0 pt
Net income - Group part (€m) 156 +373 290 -130
2018 and 2019 results restated (with a similar impact in both years) for LLP componentization accounting change. For details see statements paragraph 2, page 12-15
In the Full year 2019, the Air France-KLM Group posted an operating result of 1,141 million euros, down by 18.8% compared to last year, impacted by a challenging trading environment and a higher fuel bill. Net income amounted to 290 million euros in 2019, a decrease of 130 million euros compared to last year. The fuel bill including hedging stood at 5,511 million euros in 2019, up 550 million euros. This increase is mainly explained by a hedging gain of 50 million euros this year compared to a hedging gain of 650 million euros last year. Currencies had a positive 367 million euro impact on revenues and a negative 122 million euro effect on costs (ex-fuel) including currency hedging in 2019.
The 2019 fourth quarter unit cost declined by -1.5%, delivering a -0.9% improvement for Full Year 2019, consistent with guidance On a constant currency and fuel price basis, unit costs were down -1.5% in the fourth quarter 2019, with the first realizations of cost efficiency measures at Air France. Group net employee costs were up 4.9% in 2019 compared to last year, explained by additional hires in response to the capacity growth and the impact of wage agreement implementation for Air France and KLM staff. The average number of FTEs (Full Time Equivalent) in 2019 increased by 1,400 compared to last year, including an additional 550 Pilots and 500 Cabin Crew. Productivity measured in ASK per FTE increased by 1.2% in 2019.

6
Net debt stable and Leverage ratio at Full year guidance of 1.5x
Fourth quarter Full year
In € million 2019 Change 2019 Change
Cash flow before change in WCR and Voluntary Departure Plans, continuing operations (€m)
814 +167 3,795 +253
Cash out related to Voluntary Departure Plans (€m) 0 +0 -35 -35
Change in Working Capital Requirement (WCR) (€m) 63 -183 135 -121
Net cash flow from operating activities (€m) 877 -16 3,895 97
Net investments* (€m) -1,118 -449 -3,272 -561
Operating free cash flow (€m) -241 -465 623 -464
Repayment of lease debt -260 -24 -1,008 -36
Adjusted operating free cash flow** -501 -489 -385 -500
* Sum of ‘Purchase of property, plant and equipment and intangible assets’ and ‘Proceeds on disposal of property, plant and equipment and intangible assets’ as presented in the consolidated cash flow statement. ** The “Adjusted operating free cash flow” is operating free cash flow after deducting the repayment of lease debt.
Adjusted operating free cash flow at -385 million euros The Group generated adjusted operating free cash flow of -385 million euros, a decrease of 500 million euros compared to last year, mainly explained by higher net investments in 2019. The lease debt amounted to 4,120 million euros, a reduction of 415 million euros compared to the end of 2018.
Net debt stable
In € million 31 Dec 2019 31 Dec 2018
Net debt 6,147 6,164
EBITDA trailing 12 months 4,128 4,293
Net debt/EBITDA trailing 12 months 1.5 x 1.4 x
The Group net debt stood at 6,147 million euros at 31 December 2019, which is comparable to last year. The net debt/EBITDA ratio stood at 1.5x at 31 December 2019, a slight increase explained by the reduction in EBITDA.
Both airlines improved their results in the fourth quarter 2019, with cost efficiency measures paying off for Air France, resulting in a +0.8pt margin increase
Fourth quarter Full year
2019 Change 2019 Change
Air France Group Operating result (€m) -19 +30 280 -41
Operating margin (%) -0.5% +0.8 pt 1.7% -0.3 pt
KLM Group Operating result (€m) 119 +7 853 -238
Operating margin (%) 4.4% +0.2 pt 7.7% -2.3 pt

7
Outlook Business trends
After a good performance for the Passenger Network activity with positive unit revenue in January 2020, recent developments with regards to the Covid-19 have impacted the demand outlook, especially in the Asian network. This translates in long-haul forward booking load factors down from February to May 2020. As a consequence the Group anticipates unit revenues at constant currency to be down for the first quarter of 2020. The Cargo activity is also impacted by Covid-19, foreseen to maintain pressure on the load factor and yield in the first part of 2020. Based on the Group announcement regarding Covid-19 (suspension of China operations in February-March and possible resumption of operations starting from April 20201), the high-level estimated impact on operating result is of between -150 and -200 million euros for February to April 2020.
This impact on operating result is estimated as the sum of associated loss of revenue due to suspension of China operations for Passenger and Cargo, negative impact for connecting traffic and weakness in rest of Asia and variable cost savings as no redeployment so far is taken into account. Full year 2020 guidance
Capacity: Passenger network activity: In 2020, the Air France-KLM Group plans to selectively grow capacity by 2% to 3% compared to 2019. Capacity implications due to the Covid-19-related flight suspensions are expected to reduce capacity growth to or below the lower-end of this guided range. Transavia: Continue to grow at a sustained pace of 4% to 6% in 2020, with around 10% growth foreseen in France and limited growth for Transavia Netherlands in light of the capacity constraints at Dutch airports. Fuel: The 2020 fuel bill is expected to decrease by 300 million euros compared to 2019 to 5.2 billion euros, based on the forward curve of 14 February 2020.2
Unit cost: The Group will pursue initiatives to reduce unit costs, with a targeted 2020 reduction of between -1% to 0% at constant currency and fuel price. Negative cost implications related to the Covid-19 foreseen due to lower-than-planned capacity growth and disruption cost. Capex: The Group plans capital expenditures of 3.6 billion euros for 2020. Leverage: Air France-KLM is targeting a Net debt/EBITDA ratio of circa 1.5x.
*****
The audit procedures for the consolidated accounts have taken place. The certification report will be published following the completion of the procedures necessary for the filing of the Universal Registration Document. The results presentation is available at www.airfranceklm.com on 20 February 2020 from 7:15 am CET. Press Office +33 1 41 56 56 00
1 All flights to China were suspended as of 30 January 2020. Air France-KLM Group Mainland China network ASKs at 16.5
billion in 2019, representing 5.5% of the total Network Passenger activity 2 Based on the forward curves of 14 February 2020, average Brent price of USD 57, average jet fuel price of USD 605 per ton
including into plane costs. Assuming exchange rate of EUR/USD of 1.11 in 2020

8
Income Statement– restatement by quarter of 2019 Since January 1, 2019, the Air France-KLM Group has made changes in accounting treatment for
Customer compensation and the Component approach for Life Limited Parts. A full explanation of the
changes is given in the Consolidated Financial Statements January 1, 2019 – December 31, 2019, note
2, page 15.
In accordance with IAS 8 “Accounting Policies, Changes in Accounting Estimates and Errors”, these changes in accounting policies have been applied retrospectively to each previous period for which financial information is presented.
€m
Q1 2019 restated
Q2 2019 restated
Q3 2019 restated
Q4 2019
Full year
2019
Revenues 5,942 7,021 7,609 6,617 27,188
Other Revenue From Operating Activity 0 0 0 1 1
External expenses -3,707 -4,028 -4,166 -3,992 -15,893
Salaries & related costs (including external staff)
-1,972 -2,048 -2,011 -2,108 -8,139
Other taxes -52 -41 -27 -34 -154
Other income and expenses 232 263 247 383 1,125
EBITDA 443 1,167 1,652 867 4,128
Amortization, Depreciation and provision -729 -744 -743 -771 -2,987
Income from current operations -286 423 909 96 1,141
Non current result 18 -25 -102 -22 -131
Income from operating activities -268 398 807 74 1,010
Gross cost of financial debt -106 -115 -111 -110 -442
Income from cash & cash equivalent 12 15 13 9 49
Net cost of financial debt -94 -100 -98 -101 -393
Other financial income and expenses -92 -41 -258 120 -271
Income before taxes -454 258 451 93 346
Income tax 128 -165 -94 55 -76
Net income of consolidated companies -326 93 357 148 270
Share in net income of equity affiliates 2 6 6 9 23
Net income for the period -324 99 363 157 293
Net income - minority interest 0 1 1 1 3
Net income - group part -324 98 362 156 290

9
€m Q1 2018 restated
Q2 2018 restated
Q3 2018 restated
Q4 2018 restated
Full year
2018 restated
Revenues 5,730 6,523 7,478 6,493 26,224
Other Revenue From Operating Activity 0 0 1 2 3
External expenses -3,427 -3,704 -3,941 -3,873 -14,946
Salaries & related costs (including external staff) -1,853 -1,959 -1,916 -2,031 -7,759 Other taxes
-49 -38 -40 -39 -166 Other income and expenses
235 237 214 249 937
EBITDA 637 1,059 1,796 801 4,293
Amortization, Depreciation and provision -742 -690 -708 -748 -2,888
Income from current operations -105 369 1,088 53 1,405
Non current result -47 20 21 -6 -12
Income from operating activities -152 389 1,109 47 1,393
Gross cost of financial debt -114 -122 -119 -110 -465
Income from cash & cash equivalent 10 10 10 10 39
Net cost of financial debt -104 -112 -109 -100 -426
Other financial income and expenses
25 -134 -73 -153 -336 Income before taxes
-231 142 927 -206 631
Income tax
-9 -58 -137 -21 -224 Net income of consolidated companies
-240 84 791 -227 407
Share in net income of equity affiliates
-6 6 7 9 15 Net income for the period
-246 90 797 -218 422
Net income - minority interest
0 1 1 1 2
Net income - group part -246 89 796 -217 420

10
Income Statement
Fourth quarter Full year
€m 2019 2018 Change 2019 2018 Change
Sales 6,617 6,493 +1.9% 27,188 26,224 +3.7%
Other revenues 1 2 -50.0% 1 3 -66.7%
Revenues 6,618 6,495 +1.9% 27,189 26,227 +3.7%
Aircraft fuel -1,393 -1,336 +4.3% -5,511 -4,958 +11.2%
Chartering costs -118 -143 -17.5% -525 -577 -9.0%
Landing fees and en route charges -462 -474 -2.5% -1,933 -1,893 +2.1%
Catering -205 -194 +5.7% -822 -783 +4.4%
Handling charges and other operating costs -422 -425 -0.7% -1,715 -1,673 +2.5%
Aircraft maintenance costs -708 -645 +9.8% -2,628 -2,410 +9.0%
Commercial and distribution costs -246 -258 -4.7% -1,029 -1,034 -0.5%
Other external expenses -438 -398 +10.1% -1,730 -1,618 +7.2%
Salaries and related costs -2,108 -2,031 +3.8% -8,139 -7,759 +4.9%
Taxes other than income taxes -34 -39 -12.8% -154 -166 -7.2%
Other income and expenses 383 249 +53.8% 1,125 937 +20.1%
EBITDA 867 801 +8.2% 4,128 4,293 -3.8%
Amortization, depreciation and provisions -771 -748 +3.1% -2,987 -2,888 +3.4%
Income from current operations 96 53 +81.1% 1,141 1,405 -18.8%
Sales of aircraft equipment -2 5 nm 22 4 +450.0%
Other non-current income and expenses -20 -11 +81.8% -153 -16 +856%
Income from operating activities 74 47 +57.4% 1,010 1,393 -27.5%
Cost of financial debt -110 -110 +0.0% -442 -465 -4.9%
Income from cash and cash equivalent 9 10 -10.0% 49 39 +25.6%
Net cost of financial debt -101 -100 +1.0% -393 -426 -7.7%
Other financial income and expenses 120 -153 nm -271 -336 -19.3%
Income before tax 93 -206 nm 346 631 -45.2%
Income taxes 55 -21 nm -76 -224 -66.1%
Net income of consolidated companies 148 -227 nm 270 407 -33.7%
Share of profits (losses) of associates 9 9 +0.0% 23 15 +53.3%
Net income for the period 157 -218 nm 293 422 -30.6%
Minority interest 0 0 nm 3 2 nm
Net income for the period – Group part 157 -218 nm 293 422 -30.6%
2018 and 2019 results restated (with a similar impact in both years) for limited life parts componentization accounting change. See notes in the consolidated financial statements paragraph 2, page 12-15.

11
Consolidated Balance Sheet Assets
31 Dec 2019 31 Dec 2018 €m
Goodwill 217 217
Intangible assets 1,305 1,194
Flight equipment 11,334 10,308
Other property, plant and equipment 1,580 1,503
Right-of-use assets 5,173 5,664
Investments in equity associates 307 311
Pension assets 420 331
Other financial assets 1,096 1,487
Deferred tax assets 523 559
Other non-current assets 241 264
Total non-current assets 22,196 21,838
Other short-term financial assets 800 325
Inventories 737 633
Trade receivables 2,164 2,191
Other current assets 1,123 1,065
Cash and cash equivalents 3,715 3,585
Total current assets 8,539 7,799
Total assets 30,735 29,637
Liabilities and equity 31 Dec 2019 31 Dec 2018
In million euros
Issued capital 429 429
Additional paid-in capital 4,139 4,139
Treasury shares -67 -67
Perpetual 403 403
Reserves and retained earnings -2,620 -3,118
Equity attributable to equity holders of Air France-KLM 2,284 1,786
Non-controlling interests 15 12
Total Equity 2,299 1,798
Pension provisions 2,253 2,098
Return obligation liability and other provisions 3,750 3,657
Financial debt 6,271 5,733
Lease debt 3,149 3,546
Deferred tax liabilities 142 4
Other non-current liabilities 222 459
Total non-current liabilities 15,787 15,497
Return obligation liability and other provisions 714 505
Current portion of financial debt 842 826
Current portion of lease debt 971 989
Trade payables 2,379 2,454
Deferred revenue on ticket sales 3,289 3,153
Frequent flyer program 848 844
Other current liabilities 3,602 3,566
Bank overdrafts 4 5
Total current liabilities 12,649 12,342
Total equity and liabilities 30,735 29,637

12
Statement of Consolidated Cash Flows from 1st January until 31th December 2019
€m 31 Dec 2019 31 Dec 2018
Net income from continuing operations 293 422
Amortization, depreciation and operating provisions 2,987 2,888
Financial provisions 217 159
Loss (gain) on disposals of tangible and intangible assets -43 -33
Loss (gain)on disposals of subsidiaries and associates 0 0
Derivatives – non monetary result 30 -49
Unrealized foreign exchange gains and losses, net 82 223
Other non-monetary items 238 -254
Share of (profits) losses of associates -23 -15
Deferred taxes -21 201
Financial Capacity 3,760 3,542
(Increase) / decrease in inventories -93 -31
(Increase) / decrease in trade receivables 61 -39
Increase / (decrease) in trade payables -133 57
Change in other receivables and payables 300 269
Change in working capital requirements 135 256
Net cash flow from operating activities 3,895 3,798
Purchase of property, plant and equipment and intangible assets -3,372 -2,844
Proceeds on disposal of property, plant and equipment and intangible assets
100 133
Proceeds on disposal of subsidiaries, of shares in non-controlled entities 13 6
Acquisition of subsidiaries, of shares in non-controlled entities -1 -9
Dividends received 14 6
Decrease (increase) in net investments, more than 3 months -72 4
Net cash flow used in investing activities -3,318 -2,704
Increase of equity due to new convertible bond 54 0
Perpetual (including premium) 0 -211
Issuance of debt 1,617 539
Repayment on financial debt -1,156 -1,400
Payments on lease debt -1,008 -972
Decrease (increase ) in loans, net 72 -106
Dividends and coupons on perpetual paid -26 -38
Net cash flow from financing activities -447 -2,188
Effect of exchange rate on cash and cash equivalents and bank overdrafts 1 7
Change in cash and cash equivalents and bank overdrafts 131 -1,087
Cash and cash equivalents and bank overdrafts at beginning of period 3,580 4,667
Cash and cash equivalents and bank overdrafts at end of period 3,711 3,580
Change in treasury of discontinued operations 0 0

13
Key Performance Indicators EBITDA Fourth quarter Full year
€m 2019 2018 2019 2018
Income/(loss) from current operations 96 53 1,141 1,405
Amortization, depreciation and provisions 771 748 2,987 2,888
EBITDA 867 801 4,128 4,293
Restated net result, group share
Fourth quarter Full year
In million euros 2019 2018 2019 2018
Net income/(loss), Group share 156 -217 290 420
Unrealized foreign exchange gains and losses, net -135 79 82 56
Change in fair value of financial assets and liabilities (derivatives) -20 21 -29 -53
Non-current income and expenses 22 6 131 12
Tax impact on gross adjustments net result 39 -39 -52 -4
Restated net income/(loss), group part 62 -150 422 431
Coupons on perpetual -4 -6 -17 -25
Restated net income/(loss), group share including coupons on perpetual (used to calculate earnings per share)
58 -156 405 406
Restated net income/(loss) per share (in €) 0.14 -0.36 0.95 0.95
Return on capital employed (ROCE)1
In million euros 31 Dec
2019 31 Dec
2018 31 Dec
2018 30 Dec
2017
Goodwill and intangible assets 1,522 1,411 1,411 1,338
Flight equipment 11,334 10,308 10,308 9,728
Other property, plant and equipment 1,580 1,503 1,503 1,418
Right of use assets 5,173 5,664 5,664 6,216
Investments in equity associates 307 311 311 301
Financial assets, marketable securities and financial deposits 146 133 133 113
Provisions, excluding pension, cargo litigation and restructuring -4,058 -3,776 -3,776 -3,456
WCR, excluding market value of derivatives -6,309 -6,133 -6,133 -5,896
Capital employed 9,695 9,421 9,421 9,762
Average capital employed (A) 9,558 9,592
Income from current operations 1,141 1,405
- Dividends received -2 -2
- Share of profits (losses) of associates 23 15
- Normative income tax -345 -421
Income from current operations after tax, trailing 12 months (B) 817 997
ROCE, trailing 12 months (B/A) 8.5% 10.4%
1 The ROCE definition has been updated within the framework of IFRS 16 implementation. The asset value linked to the aircraft
lease contracts now corresponds to the net book value of the right-of-use asset of all the lease contracts. Moreover, the “operating result, adjusted for operating leases” no longer exists, having been replaced by “income from current operations” which, thanks to IFRS 16 implementation, no longer includes the financial cost of lease contracts. Finally, the Group now uses a normative income tax rate, calculated according to the tax rates applied in France and in the Netherlands.

14
Net debt
Balance sheet at
€m 31 Dec 2019 31 Dec 2018
Financial debt 6,886 6,216
Lease debt 4,029 4,450
Currency hedge on financial debt 4 7
Accrued interest -62 -67
Gross financial debt (A) 10,857 10,606
Cash and cash equivalents 3,715 3,585
Marketable securities 111 74
Cash securities 300 265
Deposits (bonds) 585 522
Bank overdrafts -4 -5
Others 3 1
Net cash (B) 4,710 4,442
Net debt (A) – (B) 6,147 6,164
Adjusted operating free cash flow
Fourth quarter Full year
€m 2019 2018 2019 2018
Net cash flow from operating activities, continued operations 877 893 3,895 3,798
Investment in property, plant, equipment and intangible assets -1,134 -706 -3,372 -2,844
Proceeds on disposal of property, plant, equipment and intangible assets
16 37 100 133
Operating free cash flow -241 224 623 1,087
Payments on lease debt -260 -236 -1,008 -972
Adjusted operating free cash flow -501 -12 -385 115
15
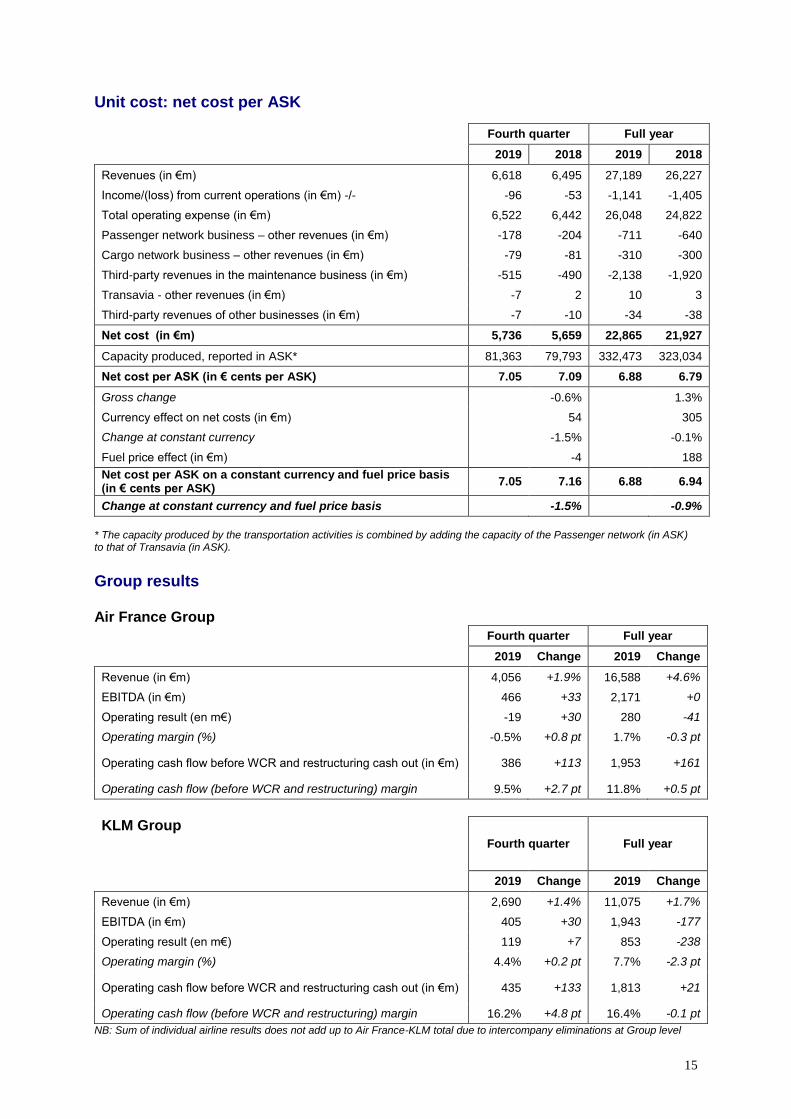
Unit cost: net cost per ASK
Fourth quarter Full year
2019 2018 2019 2018
Revenues (in €m) 6,618 6,495 27,189 26,227
Income/(loss) from current operations (in €m) -/- -96 -53 -1,141 -1,405
Total operating expense (in €m) 6,522 6,442 26,048 24,822
Passenger network business – other revenues (in €m) -178 -204 -711 -640
Cargo network business – other revenues (in €m) -79 -81 -310 -300
Third-party revenues in the maintenance business (in €m) -515 -490 -2,138 -1,920
Transavia - other revenues (in €m) -7 2 10 3
Third-party revenues of other businesses (in €m) -7 -10 -34 -38
Net cost (in €m) 5,736 5,659 22,865 21,927
Capacity produced, reported in ASK* 81,363 79,793 332,473 323,034
Net cost per ASK (in € cents per ASK) 7.05 7.09 6.88 6.79
Gross change -0.6% 1.3%
Currency effect on net costs (in €m) 54 305
Change at constant currency -1.5% -0.1%
Fuel price effect (in €m) -4 188
Net cost per ASK on a constant currency and fuel price basis (in € cents per ASK)
7.05 7.16 6.88 6.94
Change at constant currency and fuel price basis -1.5% -0.9%
* The capacity produced by the transportation activities is combined by adding the capacity of the Passenger network (in ASK) to that of Transavia (in ASK).
Group results Air France Group
Fourth quarter Full year
2019 Change 2019 Change
Revenue (in €m) 4,056 +1.9% 16,588 +4.6%
EBITDA (in €m) 466 +33 2,171 +0
Operating result (en m€) -19 +30 280 -41
Operating margin (%) -0.5% +0.8 pt 1.7% -0.3 pt
Operating cash flow before WCR and restructuring cash out (in €m) 386 +113 1,953 +161
Operating cash flow (before WCR and restructuring) margin 9.5% +2.7 pt 11.8% +0.5 pt
KLM Group
Fourth quarter Full year
2019 Change 2019 Change
Revenue (in €m) 2,690 +1.4% 11,075 +1.7%
EBITDA (in €m) 405 +30 1,943 -177
Operating result (en m€) 119 +7 853 -238
Operating margin (%) 4.4% +0.2 pt 7.7% -2.3 pt
Operating cash flow before WCR and restructuring cash out (in €m) 435 +133 1,813 +21
Operating cash flow (before WCR and restructuring) margin 16.2% +4.8 pt 16.4% -0.1 pt
NB: Sum of individual airline results does not add up to Air France-KLM total due to intercompany eliminations at Group level

16
Group fleet at 31 December 2019
Aircraft type AF
(incl. HOP)
KL (incl.
KLC & MP)
Transavia Owned Finance
lease Operating
lease Total
In operation
Change / 31/12/18
B747-400 8 8 8 8 -3
B777-300 43 14 14 21 22 57 57
B777-200 25 15 25 1 14 40 40
B787-9 9 13 7 3 12 22 22 2
B787-10 4 3 1 4 4 4
A380-800 10 1 4 5 10 10
A350-900 3 1 2 3 3 3
A340-300 4 4 4 4 -2
A330-300 5 5 5 5
A330-200 15 8 11 12 23 23
Total Long-Haul 109 67 0 74 32 70 176 176 4
B737-900 5 2 3 5 5
B737-800 31 73 29 10 65 104 104 10
B737-700 16 7 3 5 15 23 23 -2
A321 20 11 9 20 20
A320 44 3 5 36 44 43
A319 33 20 13 33 33 -1
A318 18 17 1 18 18
Total Medium-Haul
115 52 80 85 21 141 247 246 7
ATR72-600 3 3 3 2 -4
ATR72-500 -1
ATR42-500 1 1 1 -6
Canadair Jet 1000 14 14 14 14
Canadair Jet 700 11 11 11 10 -1
Embraer 190 15 32 8 13 26 47 47 4
Embraer 175 17 3 14 17 17
Embraer 170 15 9 1 5 15 15
Embraer 145 17 14 3 17 13 -5
Total Regional 76 49 0 59 31 35 125 118 -13
B747-400ERF 3 3 3 3
B747-400BCF 1 1 1 1
B777-F 2 2 2 2
Total Cargo 2 4 0 6 0 0 6 6 0
Total 302 172 80 224 84 246 554 546 -2