2004 annual financial report - oregon state...
TRANSCRIPT
2004Annual Financial Report
Eastern Oregon University | Oregon Institute of Technology Oregon State University | Portland State University | Southern Oregon University
University of Oregon | Western Oregon University
OregonUniversitySystem

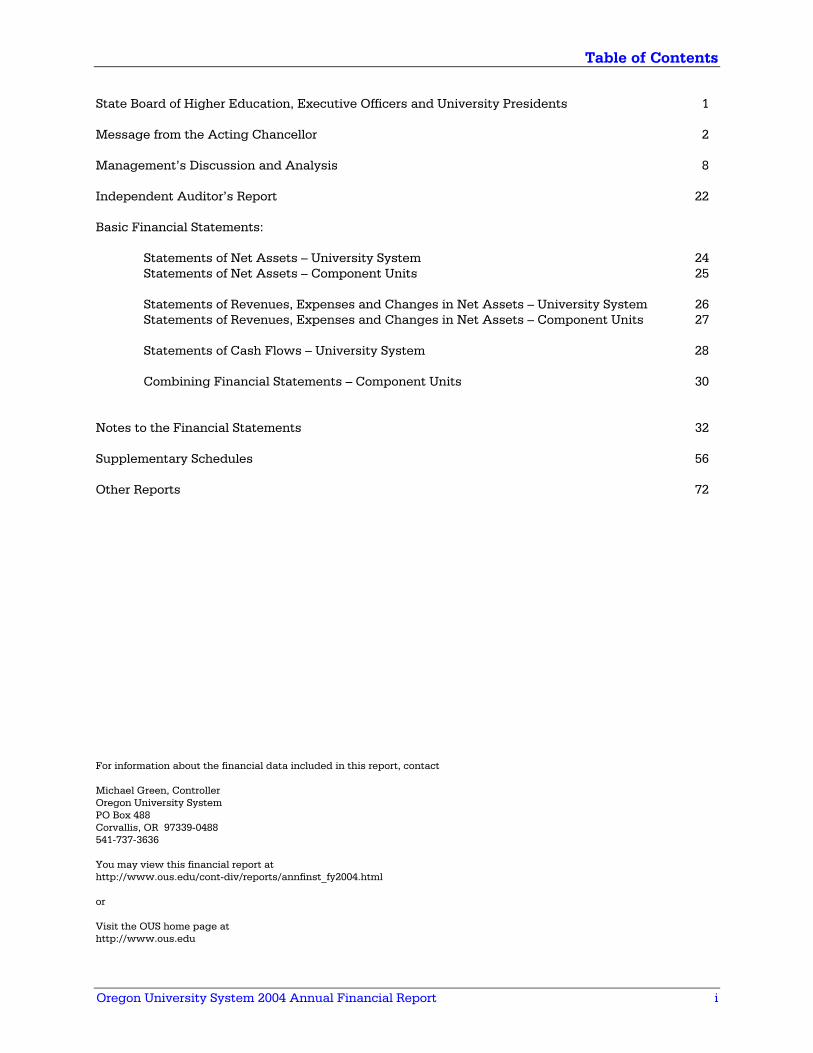
Table of Contents
Oregon University System 2004 Annual Financial Report i
State Board of Higher Education, Executive Officers and University Presidents 1 Message from the Acting Chancellor 2 Management’s Discussion and Analysis 8 Independent Auditor’s Report 22 Basic Financial Statements:
Statements of Net Assets – University System 24 Statements of Net Assets – Component Units 25
Statements of Revenues, Expenses and Changes in Net Assets – University System 26 Statements of Revenues, Expenses and Changes in Net Assets – Component Units 27
Statements of Cash Flows – University System 28
Combining Financial Statements – Component Units 30
Notes to the Financial Statements 32 Supplementary Schedules 56 Other Reports 72 For information about the financial data included in this report, contact Michael Green, Controller Oregon University System PO Box 488 Corvallis, OR 97339-0488 541-737-3636 You may view this financial report at http://www.ous.edu/cont-div/reports/annfinst_fy2004.html or Visit the OUS home page at http://www.ous.edu

Oregon University System 2004 Annual Financial Report 1
Oregon State Board of Higher Education Henry C. Lorenzen Adriana S. Mendoza Howard F. Sohn President, Pendleton, OR La Grande, OR Roseburg, OR Kirby A. Dyess Timothy J. Nesbitt John E. von Schlegell Vice President, Beaverton, OR Salem, OR Portland, OR Donald W. Blair Geraldine L. Richmond Antone C. Van Vliet Beaverton, OR Eugene, OR Corvallis, OR Bridget F. Burns Gretchen S. Schuette Corvallis, OR Salem, OR
Oregon University System Executive Officers George P. Pernsteiner Nancy C. Heiligman Acting Chancellor Assistant Vice Chancellor for Budget Operations Michael J. Green Ben Rawlins Controller General Counsel and Deputy to the Chancellor Ryan J. Hagemann Susan F. Weeks Board Secretary Deputy for Planning
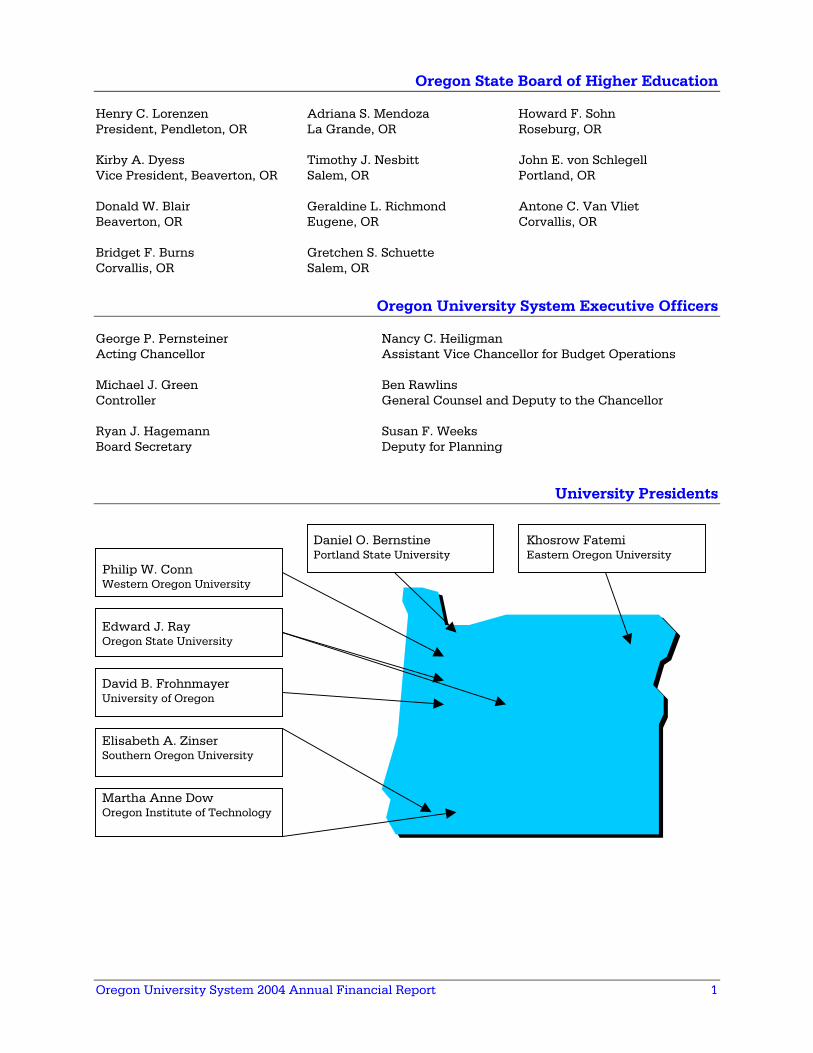
University Presidents Daniel O. Bernstine Khosrow Fatemi Portland State University Eastern Oregon University Philip W. Conn Western Oregon University Edward J. Ray Oregon State University David B. Frohnmayer University of Oregon Elisabeth A. Zinser Southern Oregon University Martha Anne Dow Oregon Institute of Technology
2 Oregon University System 2004 Annual Financial Report
Oregon University System 2004 Annual Financial Report
Message from the Chancellor
Throughout 2004, significant leadership and structural changes took place within the Oregon University System (OUS) that positioned the organization to help more Oregonians access a postsecondary education in the next and future biennia. OUS continued to meet the enrollment demands of the state, while focusing more intently on the barriers that hinder access to college for economically and historically disadvantaged
populations in Oregon. With tuitions increasing as state appropriations fell – victim along with all agencies to lower state revenues in a downturn economy – students and families made difficult decisions and sacrifices in rural and urban areas. This sometimes meant having to leave the promise of postsecondary education behind. Excellence is exemplified in the accomplishments of our students and faculty, in the quality of our academic instruction, through innovations in research and the scope of public service at our seven diverse, high quality institutions: Eastern Oregon University, Oregon Institute of Technology, Oregon State University, Portland State University, Southern Oregon University, University of Oregon, and Western Oregon University. Dedicated top faculty, students and staff joined to effect excellence in numerous programs and in diverse disciplines, becoming more widely recognized nationally and internationally as leaders in specialized fields in the arts, sciences, and professions. Uniting a Vision of Access for Today’s Oregon Oregon is fortunate to have a Governor who has made higher education one of his top priorities. Governor Kulongoski envisions an Oregon with access for all its citizens to a postsecondary education if they so choose. This means a commitment by the state to ensure that low- and moderate-income Oregonians will not be shut out of college because of their family’s financial status. Oregon has changed over time. Yet the gradual, incremental nature of the change has made it difficult for everyone to believe that the “old days,” when natural resources like timber and fisheries ruled, will never return as they had been. Today our natural resources are human ones, intellectual capital that fuels Oregon’s largest industry – high technology – and brings new companies and jobs to the state. Even our traditional agriculture and forestry industries run on technology and systems that demand greater educational attainment of their workers and business partners.
Message from the Chancellor - Continued
Oregon University System 2004 Annual Financial Report 3
Right now just over one-quarter of adult Oregonians, 26%, have a bachelor’s degree; the same percentage have some college, and 7% have an associate’s degree1. Yet, startlingly, by 2010 – 6 years from now – almost 9 out of 10 newly created jobs will require an associate’s or bachelor’s degree2. Four-year degrees will be required for about 6 out of 10 of these new jobs. In other words, Oregon has to do a better job of getting students in, through, around and out of our dual public postsecondary systems that encompass 17 community colleges, 7 universities, and the affiliated Oregon Health and Science University. New jobs in any part of the state require that Oregon achieve higher levels of educational attainment than currently exist. If students have access to educational opportunities in their local area, whether through direct classroom or distance learning, they tend to stay there, contributing to the skills, economy, and life in that community. Getting to Work: Changing the Landscape for Oregon’s Students and Families With a vision for change and reinvestment in the postsecondary education system, the Governor appointed seven new State Board of Higher Education members in December 2003, who were confirmed by the State Senate the next month. Harnessing the momentum of a re-energized mission and the Governor’s goals for expanding access and affordability, the Board created four new Working Groups as their first action: Access and Affordability; Excellence in Delivery and Productivity; Academic Excellence and Economic Development; and the Chancellor’s Office Review. Together these Groups have worked hard, and already accomplished much, to establish and implement objectives related to:
1. Making college more affordable in Oregon through a redesigned and expanded state grant program, and a proposal for a long-term need-based endowment;
2. Enrolling more students in the public two- and four-year colleges and universities by eliminating barriers that inhibit access, transfer of credits, student retention, and completion of a degree within a reasonable period of time;
3. Better alignment of the economic needs of Oregon with top academic research and ventures that exemplify excellence and hold potential for economic development; and
4. Realigning the focus of the Chancellor’s Office with the mission and work objectives of the Board.
Making College More Affordable in Oregon
Starting with the structure of the current Oregon Opportunity Grant, the Access and Affordability Working Group convened a diverse group of campus and community leaders to examine how the grant program could better serve our students. Top on the agenda was finding a way to expand grant outlays to cover all currently eligible students. Only one-third of income-eligible students are awarded grants because funds fall short each year. Average grants are also not large enough to cover more than about 10% of students’ cost of attendance. That means high levels of borrowing for the students most in need of financial assistance. Thus far the group has proposed new eligibility guidelines and grant amounts,
1 Source: 2002 US Census 2 Source: Oregon Employment Department
Message from the Chancellor - Continued
4 Oregon University System 2004 Annual Financial Report
and is working with many partners to gather support for expanded funding of the Oregon Opportunity Grant. Experts tell us that affordability may be more related to the availability and type of financial aid than to tuition costs. The state’s continuing grade of “F” in affordability3 points to the need for a rebalancing of costs and aid by the state. The Access and Affordability Working Group is examining models for a more permanent grant endowment for Oregon students. Thus, in good times and in bad, fluctuations in state revenues will not determine whether a parent can send a child to college or a working adult can enroll in school. There would be equal opportunity for all Oregonians to aspire to and enroll in postsecondary education. Without a permanent solution to helping low- and moderate-income residents attend college, Oregon is at high risk of losing even more ground in increasing our educational levels to the point that can sustain current and new jobs in the state. Compelled by double-digit tuition increases, the State Board of Higher Education took decisive action to reduce college costs for the 2004-05 academic year. Approving a tuition mitigation plan in June, the Board set a ceiling on tuition charges, lowering average increases from the original 14% to 10% for resident undergraduates (at 15 credit hours). Using $2.4 million of savings from the Chancellor’s Office reorganization, the Board funded the mitigation without putting further strains on the campuses. Eliminating Barriers to College Access
Oregon’s pipeline to postsecondary education loses thousands of students along the pathways that lead to college degrees. Specifically wanting to determine how to increase the flow of students through the pipeline and reduce the numbers who drop out along the way, the Excellence in Delivery and Productivity Working Group developed a broad reaching plan in their first few months. Also known as the More Better Faster initiative, the plan’s core revolves around seamless transfer from one educational sector to the next – such as from high school to college, and from community college to a 4-year university. Already, a cross-sector group of university and college faculty and administrators is developing a lower division general education module that is fully transferable between Oregon’s public postsecondary sectors. This is the initial step in the development of policies and practices that enable students to maximize the educational experience they receive from Oregon’s public colleges and universities. They are also sharing tested strategies in student retention that have proven to increase graduation rates and lessen the need for students to delay or
3 “Measuring Up” report, The National Center for Public Policy and Higher Education
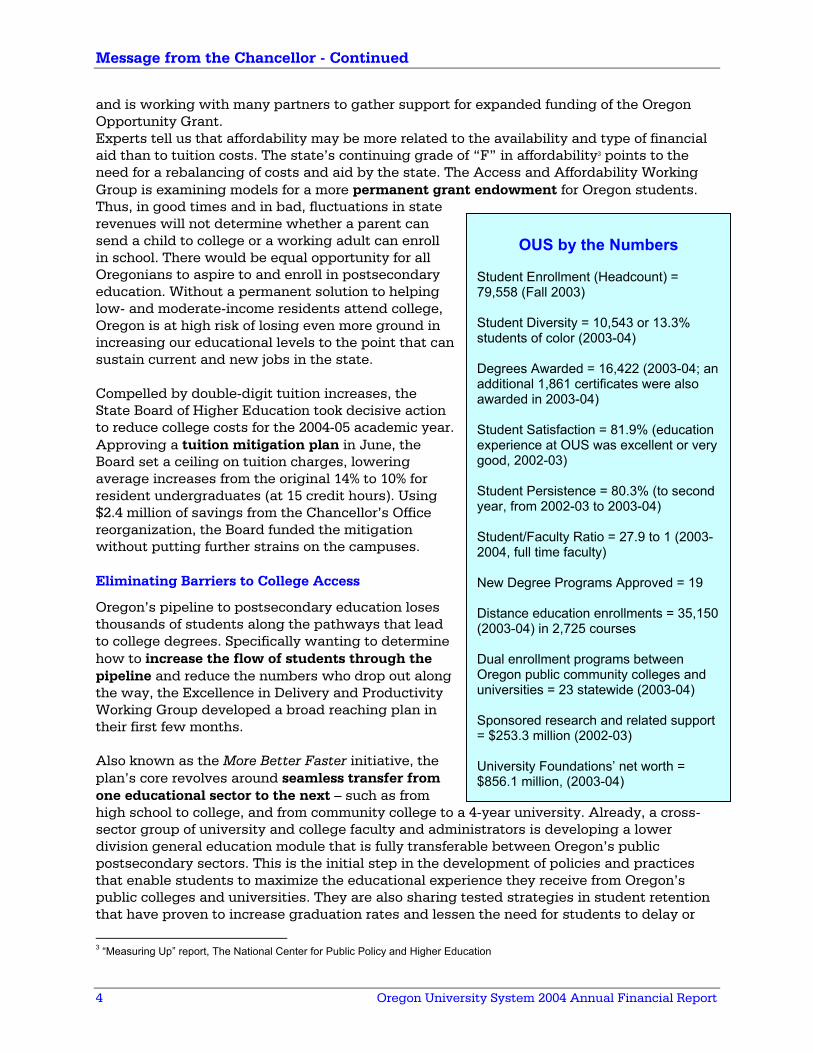
OUS by the Numbers
Student Enrollment (Headcount) = 79,558 (Fall 2003) Student Diversity = 10,543 or 13.3% students of color (2003-04) Degrees Awarded = 16,422 (2003-04; an additional 1,861 certificates were also awarded in 2003-04) Student Satisfaction = 81.9% (education experience at OUS was excellent or very good, 2002-03) Student Persistence = 80.3% (to second year, from 2002-03 to 2003-04) Student/Faculty Ratio = 27.9 to 1 (2003-2004, full time faculty) New Degree Programs Approved = 19 Distance education enrollments = 35,150 (2003-04) in 2,725 courses Dual enrollment programs between Oregon public community colleges and universities = 23 statewide (2003-04) Sponsored research and related support = $253.3 million (2002-03) University Foundations’ net worth = $856.1 million, (2003-04)
Message from the Chancellor - Continued
Oregon University System 2004 Annual Financial Report 5
“stop-out” of their postsecondary education for extended or frequent time periods. A project to identify hard-to-access courses that force students to extend their time in college is in the early stages. When students have to lengthen their stay in college, they pay more in tuition, take on more student loan debt, and have lost opportunity costs from delaying their full entry into the workforce. Helping high school students better prepare for the academic rigor of college is another component of the More Better Faster strategy. The goal is to have a statewide approach that results in all Oregon high school students having the opportunity to take rigorous courses that prepare them for college entry, largely by increasing the number of high quality courses readily available to students, such as Advanced Placement (AP). Planning is also underway to complete a multi-sector student information system, combining and expanding resources and data from K-12, community colleges, and universities, that will support more efficient and effective student transfer among educational sectors, and maintain full credit for their earned coursework credits. Aligning Economic Needs and Areas of Academic Excellence
Existing and emerging throughout Oregon’s postsecondary institutions are areas of academic excellence that can support the state’s need for new businesses and jobs. The Academic Excellence and Economic Development Working Group is completing a review of the state to identify those critical areas of research that have the potential to support and transfer their discoveries and technologies to aid industry, and contribute to the economic vitality of Oregon’s communities. Ultimately looking for 2-5 areas on which to focus its energies, the Group is examining fields such as nanotechnology, natural resources and sustainability, healthcare workforce, K-12 education, leisure, arts and creative services, and brain research at the 7 OUS campuses, 17 community colleges, and the Oregon Health and Science University. This Working Group has longer term goals than the other Groups – goals that may not be fully realized for a decade or more. Realigning the Chancellor’s Office Focus
One of the Governor’s and the Board’s objectives is to ensure that the Office of the Chancellor (the System office) is fully aligned with the goals and focus of the Board and the state. After outlining its new focus, a working group of the Board, the Chancellor’s Office Review, divested the Office of the responsibilities for providing certain service functions and technical support to the campuses. Moving forward, the Office will focus on the development and implementation of policy and advocacy for postsecondary education in Oregon, management reporting and control systems, planning and analysis, communications and government relations, and fulfillment of statutory functions. Campuses have been provided with greater autonomy and flexibility, along with the requisite control measures that ensure accountability. Some former Chancellor’s Office functions have been transferred to particular campuses to manage for the System, such as Information Technology Services now managed by OSU; the operation of the Southwestern Oregon University Center, now managed by EOU; and the Oregon Center for Advanced Technical Education (OCATE), now managed by PSU. The new Provosts’ Council, made up of academic vice presidents of the OUS campuses, completes due diligence and formal review of new academic degree and certificate program requests, and makes recommendations to the Board. The Council replaces a function formerly carried out
Message from the Chancellor - Continued
6 Oregon University System 2004 Annual Financial Report
by the Academic Affairs division of the Chancellor’s Office, which was eliminated during the restructuring. More than $3 million in savings from the reorganization has been used to increase affordability for students, lessen the impact of Measure 30 budget reductions on the campuses, and fund the Board’s Working Group initiatives. Mission to be Accomplished: Access, Affordability, Excellence and Economic Development As the Oregon University System prepares for the 2005-07 biennium, it will approach the budget process through four mission-critical areas: Access, Affordability, Excellence, and Economic Development. Through several budget policy packages and the core essential budget level, the OUS will endeavor to seek a reinvestment strategy for Oregon. It is not expected that the reinvestment will occur in one biennium or even two, but over several biennia to steadily build a postsecondary education system that equitably supports all Oregonians. Moving the ability to go to college from a remote possibility to a birthright for all Oregonians is critical to sustaining a stronger state economy. Without more of our citizens gaining a postsecondary education, we lose businesses, jobs, and stable families. By maintaining the status quo we will continue to import employees for the jobs that Oregonians do not have the qualifications to get, relegating our citizens to second-class status in our own state. That is not what we want for ourselves, our children, or for future generations. It is time for Oregon to spread the transformative power of higher education to every citizen who has the will and the dedication to go to college. By working in partnership with all of our stakeholders across the state, we can improve the opportunities for all Oregonians to go to college, and for our economy to support the needs and aspirations of this state. George Pernsteiner Acting Chancellor October 2004
Message from the Chancellor - Continued
Oregon University System 2004 Annual Financial Report 7
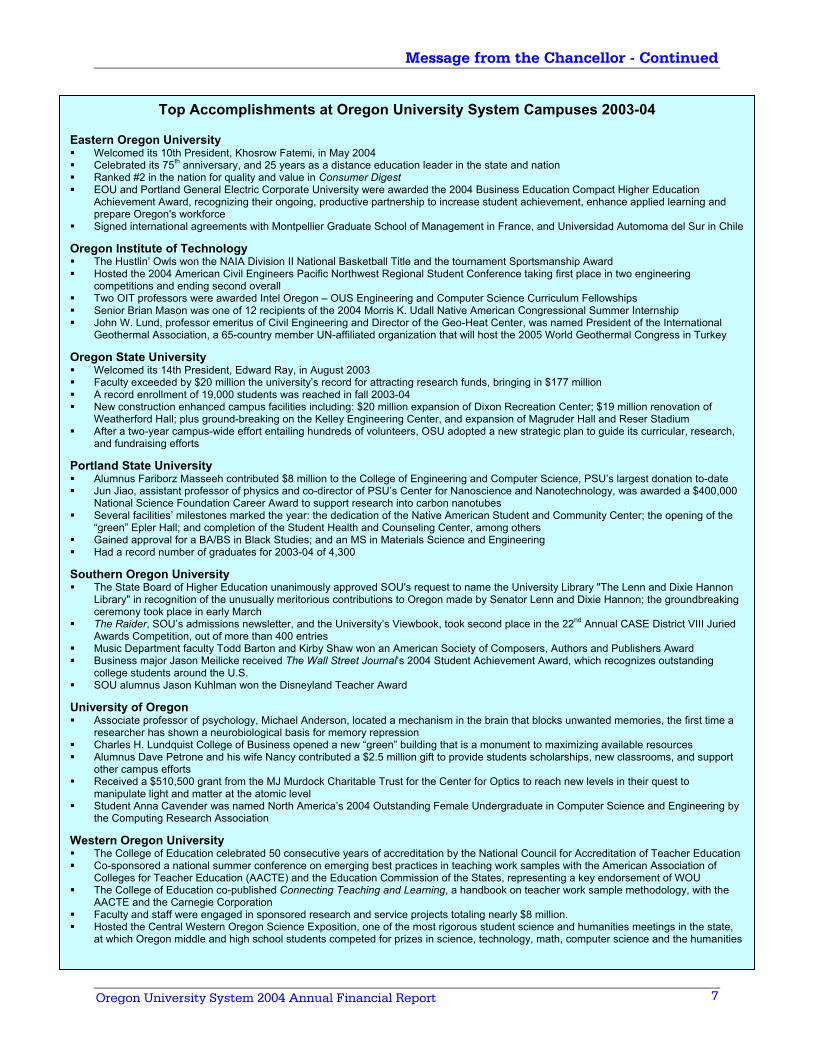
Top Accomplishments at Oregon University System Campuses 2003-04 Eastern Oregon University Welcomed its 10th President, Khosrow Fatemi, in May 2004 Celebrated its 75th anniversary, and 25 years as a distance education leader in the state and nation Ranked #2 in the nation for quality and value in Consumer Digest EOU and Portland General Electric Corporate University were awarded the 2004 Business Education Compact Higher Education
Achievement Award, recognizing their ongoing, productive partnership to increase student achievement, enhance applied learning and prepare Oregon's workforce
Signed international agreements with Montpellier Graduate School of Management in France, and Universidad Automoma del Sur in Chile Oregon Institute of Technology The Hustlin’ Owls won the NAIA Division II National Basketball Title and the tournament Sportsmanship Award Hosted the 2004 American Civil Engineers Pacific Northwest Regional Student Conference taking first place in two engineering
competitions and ending second overall Two OIT professors were awarded Intel Oregon – OUS Engineering and Computer Science Curriculum Fellowships Senior Brian Mason was one of 12 recipients of the 2004 Morris K. Udall Native American Congressional Summer Internship John W. Lund, professor emeritus of Civil Engineering and Director of the Geo-Heat Center, was named President of the International
Geothermal Association, a 65-country member UN-affiliated organization that will host the 2005 World Geothermal Congress in Turkey Oregon State University Welcomed its 14th President, Edward Ray, in August 2003 Faculty exceeded by $20 million the university’s record for attracting research funds, bringing in $177 million A record enrollment of 19,000 students was reached in fall 2003-04 New construction enhanced campus facilities including: $20 million expansion of Dixon Recreation Center; $19 million renovation of
Weatherford Hall; plus ground-breaking on the Kelley Engineering Center, and expansion of Magruder Hall and Reser Stadium After a two-year campus-wide effort entailing hundreds of volunteers, OSU adopted a new strategic plan to guide its curricular, research,
and fundraising efforts Portland State University Alumnus Fariborz Masseeh contributed $8 million to the College of Engineering and Computer Science, PSU’s largest donation to-date Jun Jiao, assistant professor of physics and co-director of PSU’s Center for Nanoscience and Nanotechnology, was awarded a $400,000
National Science Foundation Career Award to support research into carbon nanotubes Several facilities’ milestones marked the year: the dedication of the Native American Student and Community Center; the opening of the
“green” Epler Hall; and completion of the Student Health and Counseling Center, among others Gained approval for a BA/BS in Black Studies; and an MS in Materials Science and Engineering Had a record number of graduates for 2003-04 of 4,300
Southern Oregon University The State Board of Higher Education unanimously approved SOU's request to name the University Library "The Lenn and Dixie Hannon
Library" in recognition of the unusually meritorious contributions to Oregon made by Senator Lenn and Dixie Hannon; the groundbreaking ceremony took place in early March
The Raider, SOU’s admissions newsletter, and the University’s Viewbook, took second place in the 22nd Annual CASE District VIII Juried Awards Competition, out of more than 400 entries
Music Department faculty Todd Barton and Kirby Shaw won an American Society of Composers, Authors and Publishers Award Business major Jason Meilicke received The Wall Street Journal’s 2004 Student Achievement Award, which recognizes outstanding
college students around the U.S. SOU alumnus Jason Kuhlman won the Disneyland Teacher Award
University of Oregon Associate professor of psychology, Michael Anderson, located a mechanism in the brain that blocks unwanted memories, the first time a
researcher has shown a neurobiological basis for memory repression Charles H. Lundquist College of Business opened a new “green” building that is a monument to maximizing available resources Alumnus Dave Petrone and his wife Nancy contributed a $2.5 million gift to provide students scholarships, new classrooms, and support
other campus efforts Received a $510,500 grant from the MJ Murdock Charitable Trust for the Center for Optics to reach new levels in their quest to
manipulate light and matter at the atomic level Student Anna Cavender was named North America’s 2004 Outstanding Female Undergraduate in Computer Science and Engineering by
the Computing Research Association Western Oregon University The College of Education celebrated 50 consecutive years of accreditation by the National Council for Accreditation of Teacher Education Co-sponsored a national summer conference on emerging best practices in teaching work samples with the American Association of
Colleges for Teacher Education (AACTE) and the Education Commission of the States, representing a key endorsement of WOU The College of Education co-published Connecting Teaching and Learning, a handbook on teacher work sample methodology, with the
AACTE and the Carnegie Corporation Faculty and staff were engaged in sponsored research and service projects totaling nearly $8 million. Hosted the Central Western Oregon Science Exposition, one of the most rigorous student science and humanities meetings in the state,
at which Oregon middle and high school students competed for prizes in science, technology, math, computer science and the humanities
Management’s Discussion and Analysis For the Years Ended June 30, 2004 and 2003
8 Oregon University System 2004 Annual Financial Report
INTRODUCTION The following Management’s Discussion and Analysis (MD&A) provides an overview of the financial position and activities of the Oregon University System (OUS) for the years ended June 30, 2004 and 2003. OUS comprises the following four-year public universities: Eastern Oregon University (EOU), Oregon Institute of Technology (OIT), Oregon State University (OSU), Portland State University (PSU), Southern Oregon University (SOU), University of Oregon (UO), and Western Oregon University (WOU). OUS institutions perform instruction, conduct research and provide public services. This analysis has been prepared by management and should be read in conjunction with the accompanying financial statements and footnote disclosures.
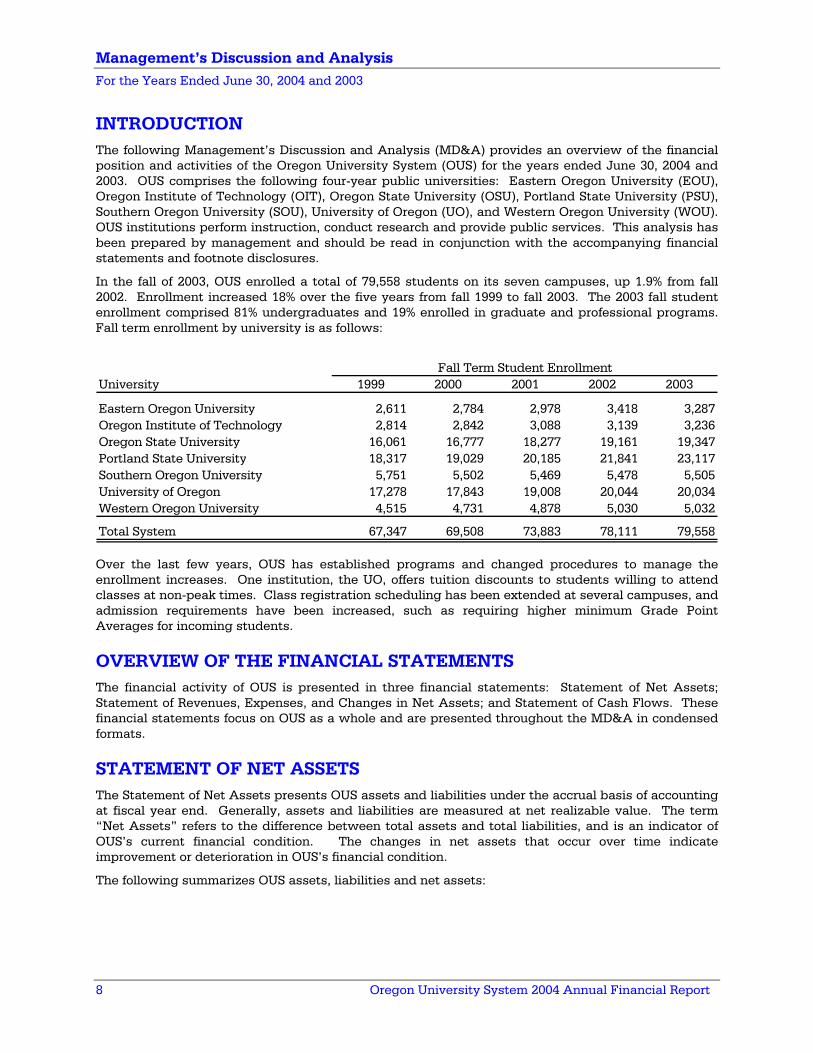
In the fall of 2003, OUS enrolled a total of 79,558 students on its seven campuses, up 1.9% from fall 2002. Enrollment increased 18% over the five years from fall 1999 to fall 2003. The 2003 fall student enrollment comprised 81% undergraduates and 19% enrolled in graduate and professional programs. Fall term enrollment by university is as follows:
University 1999 2000 2001 2002 2003
Eastern Oregon University 2,611 2,784 2,978 3,418 3,287Oregon Institute of Technology 2,814 2,842 3,088 3,139 3,236Oregon State University 16,061 16,777 18,277 19,161 19,347Portland State University 18,317 19,029 20,185 21,841 23,117Southern Oregon University 5,751 5,502 5,469 5,478 5,505University of Oregon 17,278 17,843 19,008 20,044 20,034Western Oregon University 4,515 4,731 4,878 5,030 5,032
Total System 67,347 69,508 73,883 78,111 79,558
Fall Term Student Enrollment
Over the last few years, OUS has established programs and changed procedures to manage the enrollment increases. One institution, the UO, offers tuition discounts to students willing to attend classes at non-peak times. Class registration scheduling has been extended at several campuses, and admission requirements have been increased, such as requiring higher minimum Grade Point Averages for incoming students.
OVERVIEW OF THE FINANCIAL STATEMENTS The financial activity of OUS is presented in three financial statements: Statement of Net Assets; Statement of Revenues, Expenses, and Changes in Net Assets; and Statement of Cash Flows. These financial statements focus on OUS as a whole and are presented throughout the MD&A in condensed formats.
STATEMENT OF NET ASSETS The Statement of Net Assets presents OUS assets and liabilities under the accrual basis of accounting at fiscal year end. Generally, assets and liabilities are measured at net realizable value. The term “Net Assets” refers to the difference between total assets and total liabilities, and is an indicator of OUS’s current financial condition. The changes in net assets that occur over time indicate improvement or deterioration in OUS’s financial condition.
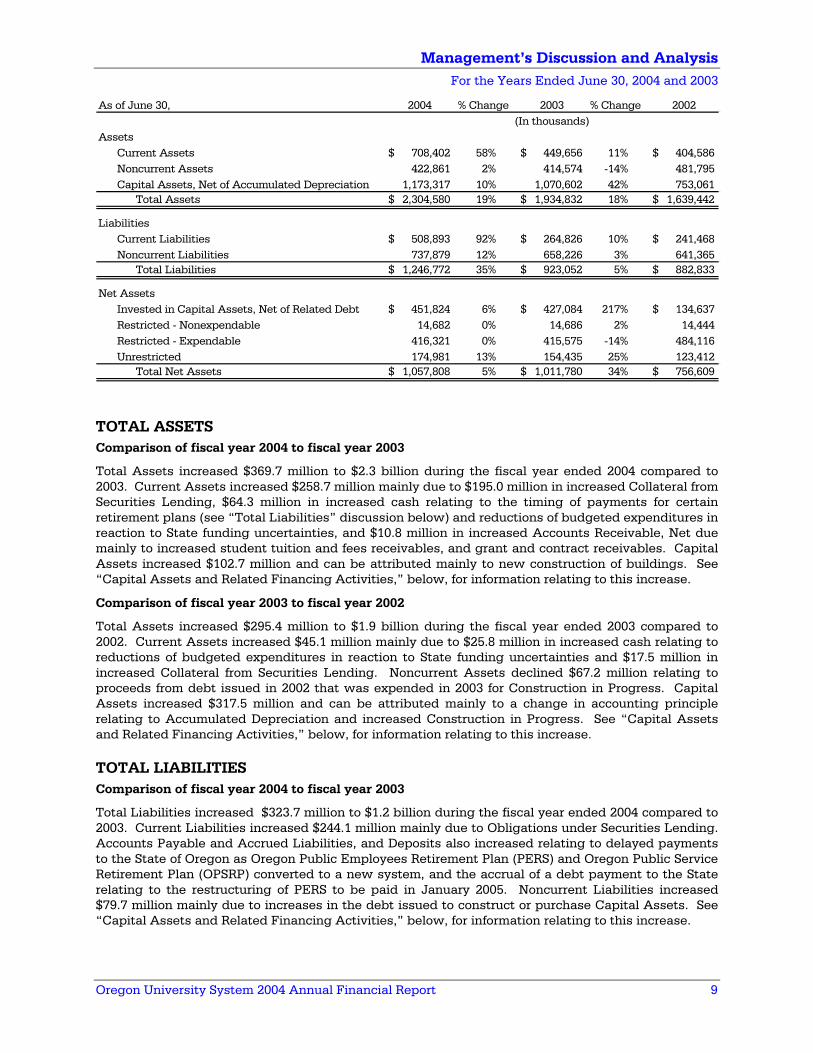
The following summarizes OUS assets, liabilities and net assets:
Management’s Discussion and Analysis For the Years Ended June 30, 2004 and 2003
Oregon University System 2004 Annual Financial Report 9
As of June 30, 2004 % Change 2003 % Change 2002
AssetsCurrent Assets 708,402$ 58% 449,656$ 11% 404,586$ Noncurrent Assets 422,861 2% 414,574 -14% 481,795 Capital Assets, Net of Accumulated Depreciation 1,173,317 10% 1,070,602 42% 753,061
Total Assets 2,304,580$ 19% 1,934,832$ 18% 1,639,442$
LiabilitiesCurrent Liabilities 508,893$ 92% 264,826$ 10% 241,468$ Noncurrent Liabilities 737,879 12% 658,226 3% 641,365
Total Liabilities 1,246,772$ 35% 923,052$ 5% 882,833$
Net AssetsInvested in Capital Assets, Net of Related Debt 451,824$ 6% 427,084$ 217% 134,637$ Restricted - Nonexpendable 14,682 0% 14,686 2% 14,444 Restricted - Expendable 416,321 0% 415,575 -14% 484,116 Unrestricted 174,981 13% 154,435 25% 123,412
Total Net Assets 1,057,808$ 5% 1,011,780$ 34% 756,609$
(In thousands)
TOTAL ASSETS Comparison of fiscal year 2004 to fiscal year 2003
Total Assets increased $369.7 million to $2.3 billion during the fiscal year ended 2004 compared to 2003. Current Assets increased $258.7 million mainly due to $195.0 million in increased Collateral from Securities Lending, $64.3 million in increased cash relating to the timing of payments for certain retirement plans (see “Total Liabilities” discussion below) and reductions of budgeted expenditures in reaction to State funding uncertainties, and $10.8 million in increased Accounts Receivable, Net due mainly to increased student tuition and fees receivables, and grant and contract receivables. Capital Assets increased $102.7 million and can be attributed mainly to new construction of buildings. See “Capital Assets and Related Financing Activities,” below, for information relating to this increase.
Comparison of fiscal year 2003 to fiscal year 2002
Total Assets increased $295.4 million to $1.9 billion during the fiscal year ended 2003 compared to 2002. Current Assets increased $45.1 million mainly due to $25.8 million in increased cash relating to reductions of budgeted expenditures in reaction to State funding uncertainties and $17.5 million in increased Collateral from Securities Lending. Noncurrent Assets declined $67.2 million relating to proceeds from debt issued in 2002 that was expended in 2003 for Construction in Progress. Capital Assets increased $317.5 million and can be attributed mainly to a change in accounting principle relating to Accumulated Depreciation and increased Construction in Progress. See “Capital Assets and Related Financing Activities,” below, for information relating to this increase.
TOTAL LIABILITIES Comparison of fiscal year 2004 to fiscal year 2003
Total Liabilities increased $323.7 million to $1.2 billion during the fiscal year ended 2004 compared to 2003. Current Liabilities increased $244.1 million mainly due to Obligations under Securities Lending. Accounts Payable and Accrued Liabilities, and Deposits also increased relating to delayed payments to the State of Oregon as Oregon Public Employees Retirement Plan (PERS) and Oregon Public Service Retirement Plan (OPSRP) converted to a new system, and the accrual of a debt payment to the State relating to the restructuring of PERS to be paid in January 2005. Noncurrent Liabilities increased $79.7 million mainly due to increases in the debt issued to construct or purchase Capital Assets. See “Capital Assets and Related Financing Activities,” below, for information relating to this increase.
Management’s Discussion and Analysis For the Years Ended June 30, 2004 and 2003
10 Oregon University System 2004 Annual Financial Report
Comparison of fiscal year 2003 to fiscal year 2002
Total Liabilities increased $40.2 million to $923.1 million during the fiscal year ended 2003 compared to 2002. Current Liabilities increased $23.4 million mainly due to Obligations under Securities Lending. Noncurrent Liabilities increased $16.9 million mainly due to increases in the debt issued to construct or purchase Capital Assets. See “Capital Assets and Related Financing Activities,” below, for information relating to this increase.
TOTAL NET ASSETS Comparison of fiscal year 2004 to fiscal year 2003
Overall, OUS’s financial position improved in fiscal year 2004. As a result of changes to Total Assets and Total Liabilities, Total Net Assets increased $46.0 million to $1.1 billion during the fiscal year ended 2004 compared to 2003. In addition, for both fiscal years, current assets are sufficient to meet current obligations.
Comparison of fiscal year 2003 to fiscal year 2002
Overall, OUS’s financial position improved in fiscal year 2003. As a result of changes to Total Assets and Total Liabilities, Total Net Assets increased $255.2 million to $1.0 billion during the fiscal year ended 2003 compared to 2002. In addition, for both fiscal years, current assets are sufficient to meet current obligations.
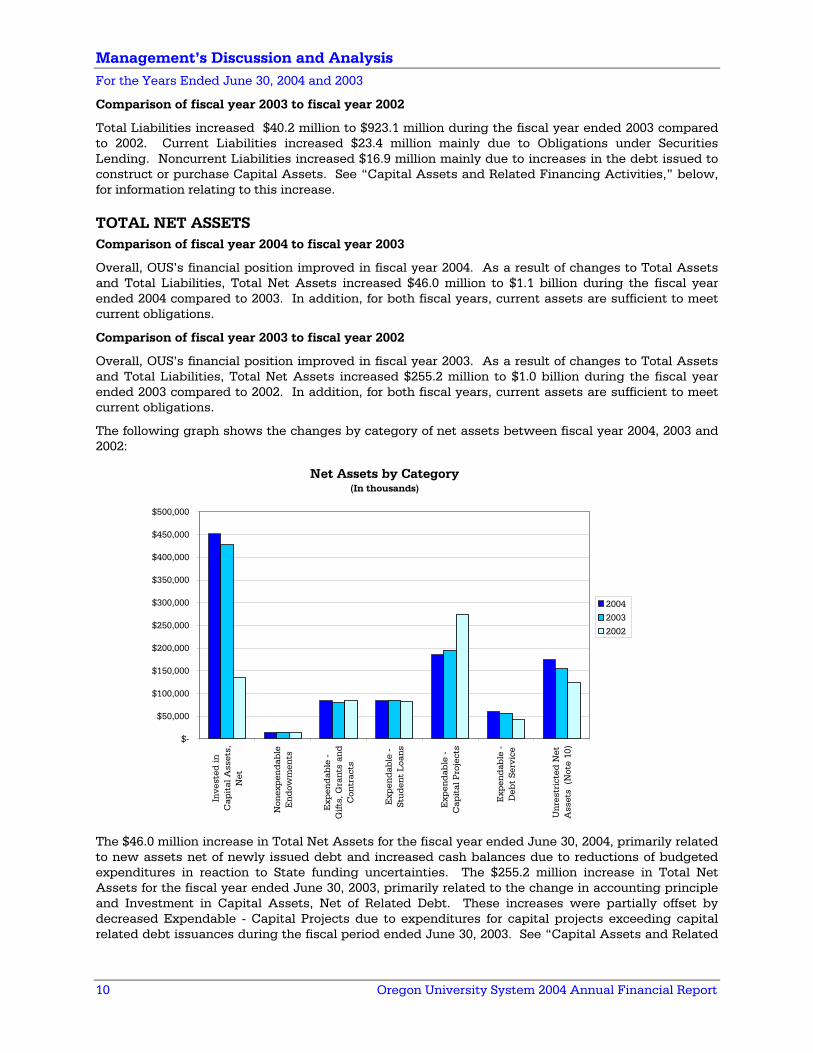
The following graph shows the changes by category of net assets between fiscal year 2004, 2003 and 2002:
Net Assets by Category(In thousands)
$-
$50,000
$100,000
$150,000
$200,000
$250,000
$300,000
$350,000
$400,000
$450,000
$500,000
Inve
sted
inC
apit
al A
sset
s,N
et
Non
exp
end
able
En
dow
men
ts
Exp
end
able
-G
ifts,
Gra
nts
an
dC
ontr
acts
Exp
end
able
-St
uden
t L
oan
s
Exp
end
able
-C
apit
al P
roje
cts
Exp
end
able
-D
ebt
Serv
ice
Un
rest
rict
ed N
etA
sset
s (
Not
e 10
)
2004
2003
2002
The $46.0 million increase in Total Net Assets for the fiscal year ended June 30, 2004, primarily related to new assets net of newly issued debt and increased cash balances due to reductions of budgeted expenditures in reaction to State funding uncertainties. The $255.2 million increase in Total Net Assets for the fiscal year ended June 30, 2003, primarily related to the change in accounting principle and Investment in Capital Assets, Net of Related Debt. These increases were partially offset by decreased Expendable - Capital Projects due to expenditures for capital projects exceeding capital related debt issuances during the fiscal period ended June 30, 2003. See “Capital Assets and Related
Management’s Discussion and Analysis For the Years Ended June 30, 2004 and 2003
Oregon University System 2004 Annual Financial Report 11
Financing Activities,” below, for information relating to the net increase in Invested in Capital Assets, Net of Related Debt.
STATEMENT OF REVENUES, EXPENSES AND CHANGES IN NET ASSETS The Statement of Revenues, Expenses, and Changes in Net Assets presents the results of OUS revenue and expense activity categorized as operating or nonoperating. Due to the classification of Government Appropriations as nonoperating revenue, OUS shows a loss from operations. State appropriations, although considered nonoperating revenue under GASB 35 standards and reflected in the nonoperating section of the Statement of Revenues, Expenses, and Changes in Net Assets and the noncapital financing section of the Statement of Cash Flows, are used solely for operating purposes. The following summarizes the revenue and expense activity of OUS:
For the Year Ended June 30, 2004 % Change 2003 % Change 2002
Operating Revenues 1,199,443$ 2% 1,177,993$ 11% 1,060,762$ Operating Expenses 1,587,347 1% 1,579,234 6% 1,485,657
Operating Loss (387,904) 3% (401,241) 6% (424,895)Nonoperating Revenues (Expenses) 433,932 -4% 451,855 -16% 539,210
Increase In Net Assets Before Change in AccountingPrinciple 46,028 -9% 50,614 -56% 114,315
Cumulative Effect of Change in Accounting Principle - * 204,557 * -
Increase In Net Assets After Change in AccountingPrinciple 46,028 * 255,171 * 114,315
Net Assets at Beginning of Year (2002 as Restated) 1,011,780 * 756,609 * 642,294Net Assets at End of Year 1,057,808$ 5% 1,011,780$ 34% 756,609$
* Not meaningful
(In thousands)
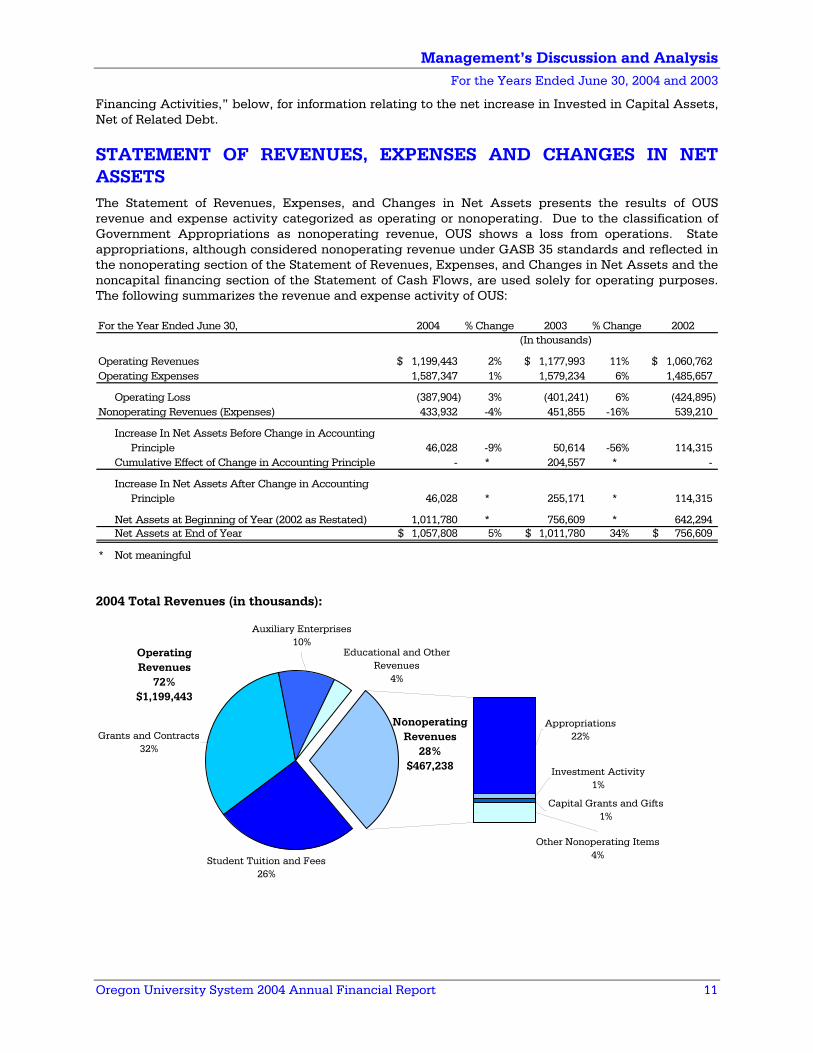
2004 Total Revenues (in thousands):
OperatingRevenues
72%$1,199,443
Appropriations22%
Student Tuition and Fees26%
Other Nonoperating Items4%
Capital Grants and Gifts1%
Investment Activity1%
Grants and Contracts32%
Nonoperating Revenues
28%$467,238
Educational and Other Revenues
4%
Auxiliary Enterprises10%
Management’s Discussion and Analysis For the Years Ended June 30, 2004 and 2003
12 Oregon University System 2004 Annual Financial Report
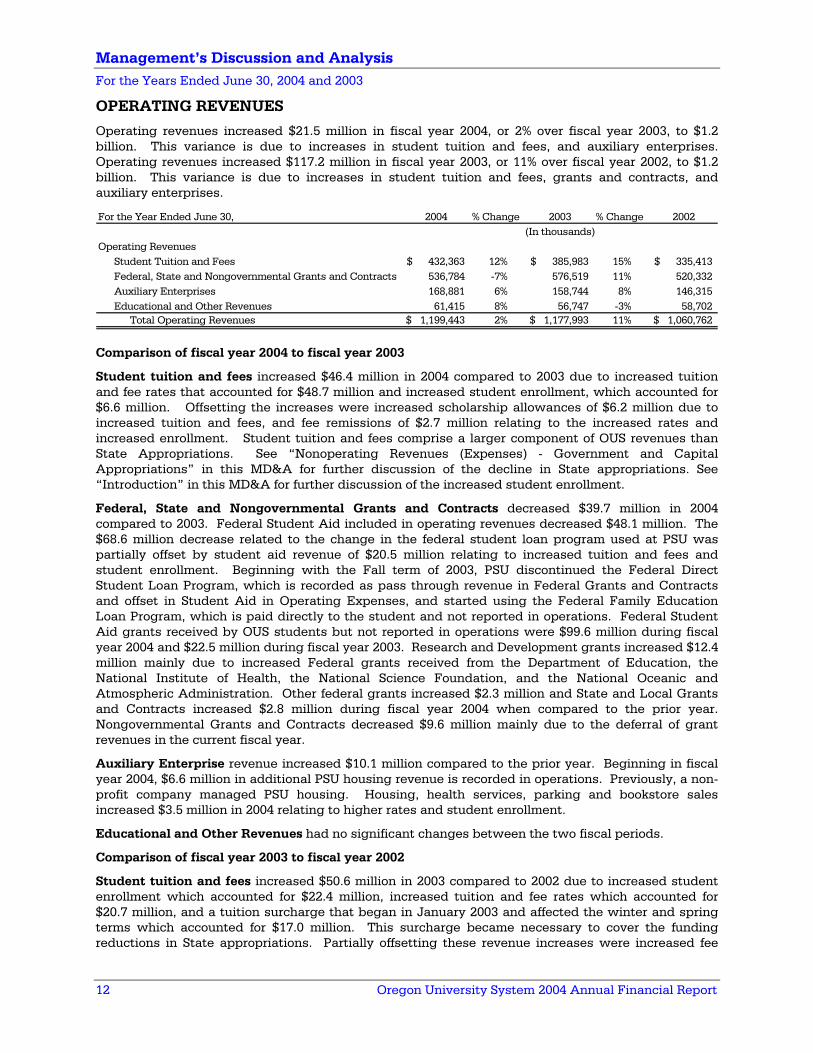
OPERATING REVENUES
Operating revenues increased $21.5 million in fiscal year 2004, or 2% over fiscal year 2003, to $1.2 billion. This variance is due to increases in student tuition and fees, and auxiliary enterprises. Operating revenues increased $117.2 million in fiscal year 2003, or 11% over fiscal year 2002, to $1.2 billion. This variance is due to increases in student tuition and fees, grants and contracts, and auxiliary enterprises.
For the Year Ended June 30, 2004 % Change 2003 % Change 2002
Operating RevenuesStudent Tuition and Fees 432,363$ 12% 385,983$ 15% 335,413$ Federal, State and Nongovernmental Grants and Contracts 536,784 -7% 576,519 11% 520,332 Auxiliary Enterprises 168,881 6% 158,744 8% 146,315 Educational and Other Revenues 61,415 8% 56,747 -3% 58,702
Total Operating Revenues 1,199,443$ 2% 1,177,993$ 11% 1,060,762$
(In thousands)
Comparison of fiscal year 2004 to fiscal year 2003
Student tuition and fees increased $46.4 million in 2004 compared to 2003 due to increased tuition and fee rates that accounted for $48.7 million and increased student enrollment, which accounted for $6.6 million. Offsetting the increases were increased scholarship allowances of $6.2 million due to increased tuition and fees, and fee remissions of $2.7 million relating to the increased rates and increased enrollment. Student tuition and fees comprise a larger component of OUS revenues than State Appropriations. See “Nonoperating Revenues (Expenses) - Government and Capital Appropriations” in this MD&A for further discussion of the decline in State appropriations. See “Introduction” in this MD&A for further discussion of the increased student enrollment.
Federal, State and Nongovernmental Grants and Contracts decreased $39.7 million in 2004 compared to 2003. Federal Student Aid included in operating revenues decreased $48.1 million. The $68.6 million decrease related to the change in the federal student loan program used at PSU was partially offset by student aid revenue of $20.5 million relating to increased tuition and fees and student enrollment. Beginning with the Fall term of 2003, PSU discontinued the Federal Direct Student Loan Program, which is recorded as pass through revenue in Federal Grants and Contracts and offset in Student Aid in Operating Expenses, and started using the Federal Family Education Loan Program, which is paid directly to the student and not reported in operations. Federal Student Aid grants received by OUS students but not reported in operations were $99.6 million during fiscal year 2004 and $22.5 million during fiscal year 2003. Research and Development grants increased $12.4 million mainly due to increased Federal grants received from the Department of Education, the National Institute of Health, the National Science Foundation, and the National Oceanic and Atmospheric Administration. Other federal grants increased $2.3 million and State and Local Grants and Contracts increased $2.8 million during fiscal year 2004 when compared to the prior year. Nongovernmental Grants and Contracts decreased $9.6 million mainly due to the deferral of grant revenues in the current fiscal year.
Auxiliary Enterprise revenue increased $10.1 million compared to the prior year. Beginning in fiscal year 2004, $6.6 million in additional PSU housing revenue is recorded in operations. Previously, a non-profit company managed PSU housing. Housing, health services, parking and bookstore sales increased $3.5 million in 2004 relating to higher rates and student enrollment.
Educational and Other Revenues had no significant changes between the two fiscal periods.
Comparison of fiscal year 2003 to fiscal year 2002
Student tuition and fees increased $50.6 million in 2003 compared to 2002 due to increased student enrollment which accounted for $22.4 million, increased tuition and fee rates which accounted for $20.7 million, and a tuition surcharge that began in January 2003 and affected the winter and spring terms which accounted for $17.0 million. This surcharge became necessary to cover the funding reductions in State appropriations. Partially offsetting these revenue increases were increased fee
Management’s Discussion and Analysis For the Years Ended June 30, 2004 and 2003
Oregon University System 2004 Annual Financial Report 13
remissions of $7.5 million relating to the increased rates, increased enrollment and the surcharge. In 2003, student tuition and fees comprised a larger component of OUS revenues than State Appropriations. See “Nonoperating Revenues (Expenses) - Government and Capital Appropriations” in this MD&A for further discussion of the decline in State appropriations. See “Introduction” in this MD&A for further discussion of the increased student enrollment.
Federal, State and Nongovernmental Grants and Contracts increased $56.2 million in 2003 compared to 2002. Federal Student Aid grants increased $35.7 million due to higher student enrollment and tuition and fees. Research and Development grants increased $17.1 million mainly due to increased Federal grants received from the Department of Agriculture, the Department of Health and Human Services, the National Science Foundation, the Department of Energy, and the Department of the Interior. Other federal grants remained the same in fiscal year 2003 when compared to prior year.
Auxiliary Enterprise revenue increased $12.4 million compared to the prior year. Intercollegiate Athletics revenues grew $7.2 million mainly due to the increased seating capacity at the UO’s football stadium and more home football games at OSU. Housing, health services, parking, and bookstore sales increased $6.8 million in 2003 relating to higher student enrollment and rate increases.
Educational and Other Revenues had no significant changes between the two fiscal periods.
OPERATING EXPENSES
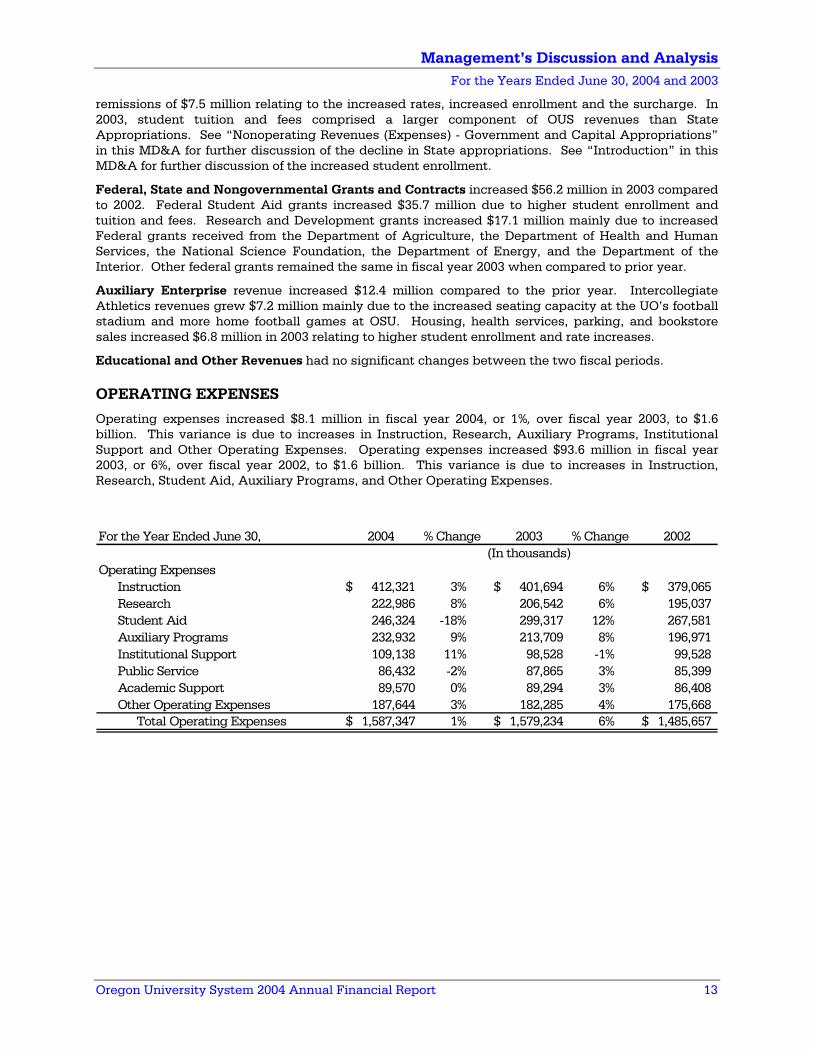
Operating expenses increased $8.1 million in fiscal year 2004, or 1%, over fiscal year 2003, to $1.6 billion. This variance is due to increases in Instruction, Research, Auxiliary Programs, Institutional Support and Other Operating Expenses. Operating expenses increased $93.6 million in fiscal year 2003, or 6%, over fiscal year 2002, to $1.6 billion. This variance is due to increases in Instruction, Research, Student Aid, Auxiliary Programs, and Other Operating Expenses.
For the Year Ended June 30, 2004 % Change 2003 % Change 2002
Operating ExpensesInstruction 412,321$ 3% 401,694$ 6% 379,065$ Research 222,986 8% 206,542 6% 195,037 Student Aid 246,324 -18% 299,317 12% 267,581 Auxiliary Programs 232,932 9% 213,709 8% 196,971 Institutional Support 109,138 11% 98,528 -1% 99,528 Public Service 86,432 -2% 87,865 3% 85,399 Academic Support 89,570 0% 89,294 3% 86,408 Other Operating Expenses 187,644 3% 182,285 4% 175,668
Total Operating Expenses 1,587,347$ 1% 1,579,234$ 6% 1,485,657$
(In thousands)
Management’s Discussion and Analysis For the Years Ended June 30, 2004 and 2003
14 Oregon University System 2004 Annual Financial Report
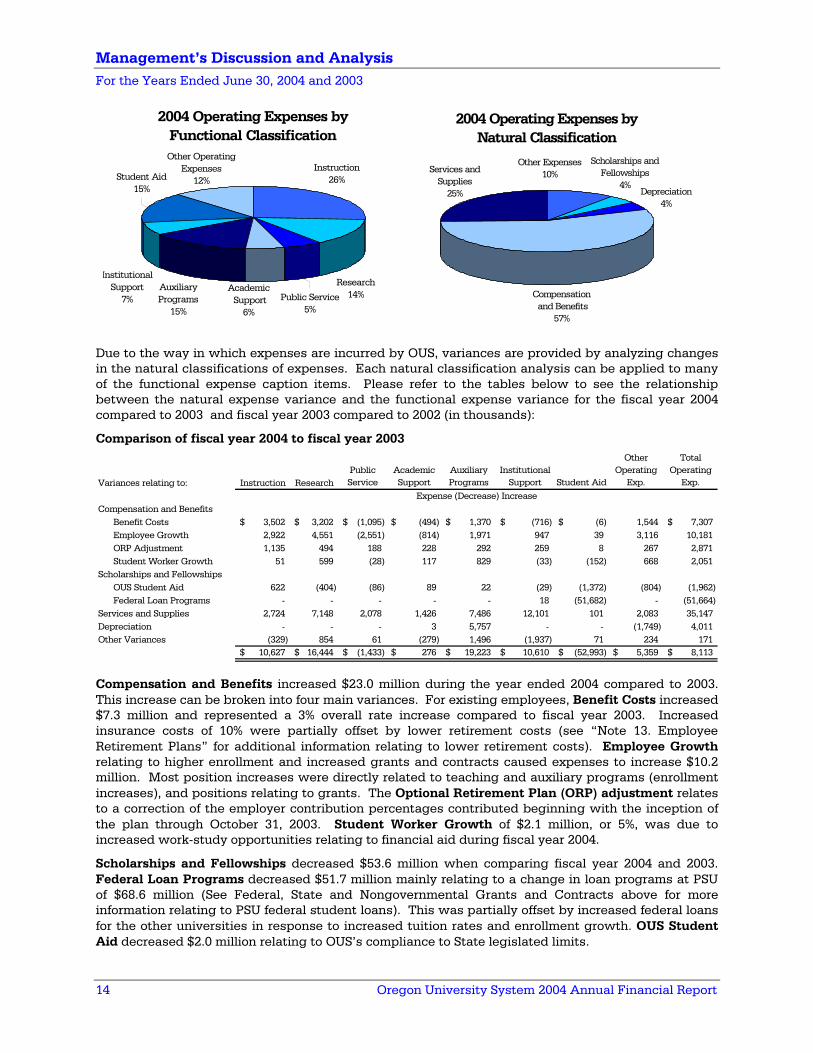
2004 Operating Expenses byFunctional Classification
Research14%
Other Operating Expenses
12%Student Aid15%
Instruction26%
Academic Support
6%
Public Service5%
Institutional Support
7%Auxiliary Programs
15%
2004 Operating Expenses byNatural Classification
Scholarships andFellowships
4%
Other Expenses10%
Compensation and Benefits
57%
Depreciation4%
Services andSupplies
25%
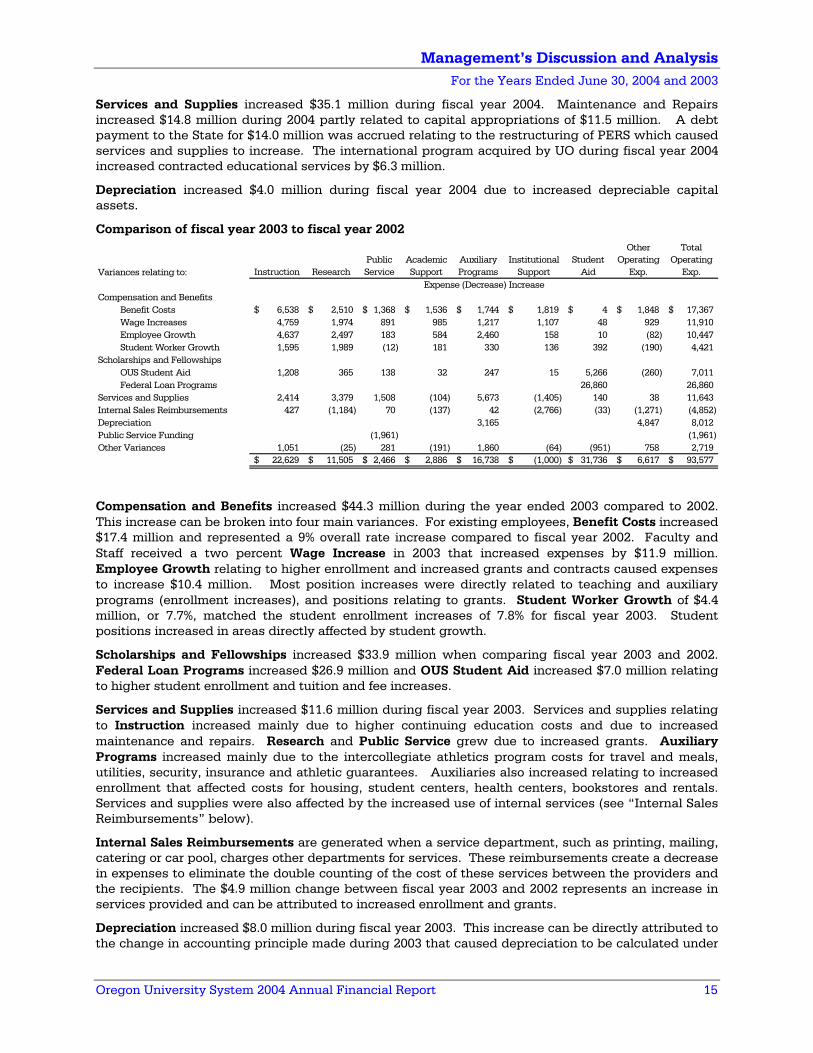
Due to the way in which expenses are incurred by OUS, variances are provided by analyzing changes in the natural classifications of expenses. Each natural classification analysis can be applied to many of the functional expense caption items. Please refer to the tables below to see the relationship between the natural expense variance and the functional expense variance for the fiscal year 2004 compared to 2003 and fiscal year 2003 compared to 2002 (in thousands):
Comparison of fiscal year 2004 to fiscal year 2003
Variances relating to: Instruction ResearchPublic Service
Academic Support
Auxiliary Programs
Institutional Support Student Aid
Other Operating
Exp.
Total Operating
Exp.
Compensation and BenefitsBenefit Costs 3,502$ 3,202$ (1,095)$ (494)$ 1,370$ (716)$ (6)$ 1,544 7,307$ Employee Growth 2,922 4,551 (2,551) (814) 1,971 947 39 3,116 10,181 ORP Adjustment 1,135 494 188 228 292 259 8 267 2,871 Student Worker Growth 51 599 (28) 117 829 (33) (152) 668 2,051
Scholarships and FellowshipsOUS Student Aid 622 (404) (86) 89 22 (29) (1,372) (804) (1,962) Federal Loan Programs - - - - - 18 (51,682) - (51,664)
Services and Supplies 2,724 7,148 2,078 1,426 7,486 12,101 101 2,083 35,147 Depreciation - - - 3 5,757 - - (1,749) 4,011 Other Variances (329) 854 61 (279) 1,496 (1,937) 71 234 171
10,627$ 16,444$ (1,433)$ 276$ 19,223$ 10,610$ (52,993)$ 5,359$ 8,113$
Expense (Decrease) Increase
Compensation and Benefits increased $23.0 million during the year ended 2004 compared to 2003. This increase can be broken into four main variances. For existing employees, Benefit Costs increased $7.3 million and represented a 3% overall rate increase compared to fiscal year 2003. Increased insurance costs of 10% were partially offset by lower retirement costs (see “Note 13. Employee Retirement Plans” for additional information relating to lower retirement costs). Employee Growth relating to higher enrollment and increased grants and contracts caused expenses to increase $10.2 million. Most position increases were directly related to teaching and auxiliary programs (enrollment increases), and positions relating to grants. The Optional Retirement Plan (ORP) adjustment relates to a correction of the employer contribution percentages contributed beginning with the inception of the plan through October 31, 2003. Student Worker Growth of $2.1 million, or 5%, was due to increased work-study opportunities relating to financial aid during fiscal year 2004.
Scholarships and Fellowships decreased $53.6 million when comparing fiscal year 2004 and 2003. Federal Loan Programs decreased $51.7 million mainly relating to a change in loan programs at PSU of $68.6 million (See Federal, State and Nongovernmental Grants and Contracts above for more information relating to PSU federal student loans). This was partially offset by increased federal loans for the other universities in response to increased tuition rates and enrollment growth. OUS Student Aid decreased $2.0 million relating to OUS’s compliance to State legislated limits.
Management’s Discussion and Analysis For the Years Ended June 30, 2004 and 2003
Oregon University System 2004 Annual Financial Report 15
Services and Supplies increased $35.1 million during fiscal year 2004. Maintenance and Repairs increased $14.8 million during 2004 partly related to capital appropriations of $11.5 million. A debt payment to the State for $14.0 million was accrued relating to the restructuring of PERS which caused services and supplies to increase. The international program acquired by UO during fiscal year 2004 increased contracted educational services by $6.3 million.
Depreciation increased $4.0 million during fiscal year 2004 due to increased depreciable capital assets.
Comparison of fiscal year 2003 to fiscal year 2002
Variances relating to: Instruction ResearchPublic Service
Academic Support
Auxiliary Programs
Institutional Support
Student Aid
Other Operating
Exp.
Total Operating
Exp.
Compensation and BenefitsBenefit Costs 6,538$ 2,510$ 1,368$ 1,536$ 1,744$ 1,819$ 4$ 1,848$ 17,367$ Wage Increases 4,759 1,974 891 985 1,217 1,107 48 929 11,910Employee Growth 4,637 2,497 183 584 2,460 158 10 (82) 10,447 Student Worker Growth 1,595 1,989 (12) 181 330 136 392 (190) 4,421
Scholarships and FellowshipsOUS Student Aid 1,208 365 138 32 247 15 5,266 (260) 7,011Federal Loan Programs 26,860 26,860
Services and Supplies 2,414 3,379 1,508 (104) 5,673 (1,405) 140 38 11,643Internal Sales Reimbursements 427 (1,184) 70 (137) 42 (2,766) (33) (1,271) (4,852)Depreciation 3,165 4,847 8,012Public Service Funding (1,961) (1,961)Other Variances 1,051 (25) 281 (191) 1,860 (64) (951) 758 2,719
22,629$ 11,505$ 2,466$ 2,886$ 16,738$ (1,000)$ 31,736$ 6,617$ 93,577$
Expense (Decrease) Increase
Compensation and Benefits increased $44.3 million during the year ended 2003 compared to 2002. This increase can be broken into four main variances. For existing employees, Benefit Costs increased $17.4 million and represented a 9% overall rate increase compared to fiscal year 2002. Faculty and Staff received a two percent Wage Increase in 2003 that increased expenses by $11.9 million. Employee Growth relating to higher enrollment and increased grants and contracts caused expenses to increase $10.4 million. Most position increases were directly related to teaching and auxiliary programs (enrollment increases), and positions relating to grants. Student Worker Growth of $4.4 million, or 7.7%, matched the student enrollment increases of 7.8% for fiscal year 2003. Student positions increased in areas directly affected by student growth.
Scholarships and Fellowships increased $33.9 million when comparing fiscal year 2003 and 2002. Federal Loan Programs increased $26.9 million and OUS Student Aid increased $7.0 million relating to higher student enrollment and tuition and fee increases.
Services and Supplies increased $11.6 million during fiscal year 2003. Services and supplies relating to Instruction increased mainly due to higher continuing education costs and due to increased maintenance and repairs. Research and Public Service grew due to increased grants. Auxiliary Programs increased mainly due to the intercollegiate athletics program costs for travel and meals, utilities, security, insurance and athletic guarantees. Auxiliaries also increased relating to increased enrollment that affected costs for housing, student centers, health centers, bookstores and rentals. Services and supplies were also affected by the increased use of internal services (see “Internal Sales Reimbursements” below).
Internal Sales Reimbursements are generated when a service department, such as printing, mailing, catering or car pool, charges other departments for services. These reimbursements create a decrease in expenses to eliminate the double counting of the cost of these services between the providers and the recipients. The $4.9 million change between fiscal year 2003 and 2002 represents an increase in services provided and can be attributed to increased enrollment and grants.
Depreciation increased $8.0 million during fiscal year 2003. This increase can be directly attributed to the change in accounting principle made during 2003 that caused depreciation to be calculated under
Management’s Discussion and Analysis For the Years Ended June 30, 2004 and 2003
16 Oregon University System 2004 Annual Financial Report
a new method. See “Note 1.C. Change in Accounting Principle” in the Notes to the Financial Statements for more information relating to the recalculation of accumulated depreciation and depreciation expense.
Public Service Funding declined $2.0 million directly relating to the decline in State appropriations for the statewide public services. See “Government and Capital Appropriations” in this MD&A for further discussion of the decline in State appropriations.
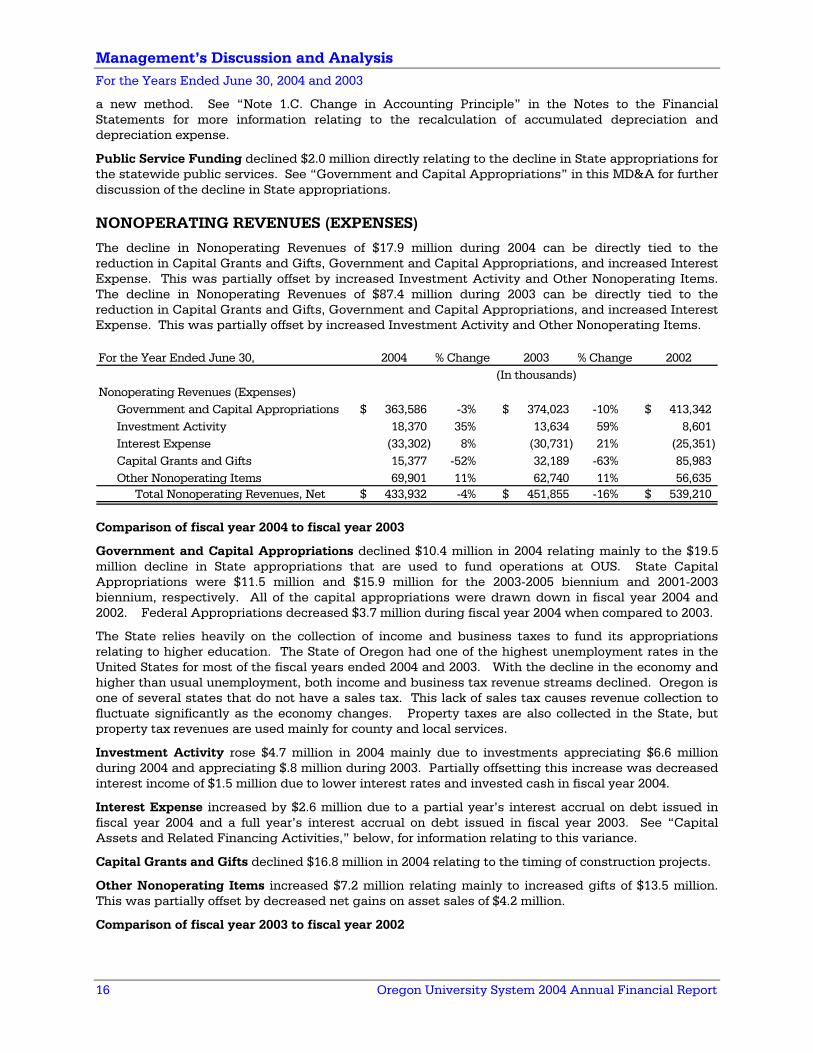
NONOPERATING REVENUES (EXPENSES)
The decline in Nonoperating Revenues of $17.9 million during 2004 can be directly tied to the reduction in Capital Grants and Gifts, Government and Capital Appropriations, and increased Interest Expense. This was partially offset by increased Investment Activity and Other Nonoperating Items. The decline in Nonoperating Revenues of $87.4 million during 2003 can be directly tied to the reduction in Capital Grants and Gifts, Government and Capital Appropriations, and increased Interest Expense. This was partially offset by increased Investment Activity and Other Nonoperating Items.
For the Year Ended June 30, 2004 % Change 2003 % Change 2002
Nonoperating Revenues (Expenses)Government and Capital Appropriations 363,586$ -3% 374,023$ -10% 413,342$ Investment Activity 18,370 35% 13,634 59% 8,601 Interest Expense (33,302) 8% (30,731) 21% (25,351) Capital Grants and Gifts 15,377 -52% 32,189 -63% 85,983 Other Nonoperating Items 69,901 11% 62,740 11% 56,635
Total Nonoperating Revenues, Net 433,932$ -4% 451,855$ -16% 539,210$
(In thousands)
Comparison of fiscal year 2004 to fiscal year 2003
Government and Capital Appropriations declined $10.4 million in 2004 relating mainly to the $19.5 million decline in State appropriations that are used to fund operations at OUS. State Capital Appropriations were $11.5 million and $15.9 million for the 2003-2005 biennium and 2001-2003 biennium, respectively. All of the capital appropriations were drawn down in fiscal year 2004 and 2002. Federal Appropriations decreased $3.7 million during fiscal year 2004 when compared to 2003.
The State relies heavily on the collection of income and business taxes to fund its appropriations relating to higher education. The State of Oregon had one of the highest unemployment rates in the United States for most of the fiscal years ended 2004 and 2003. With the decline in the economy and higher than usual unemployment, both income and business tax revenue streams declined. Oregon is one of several states that do not have a sales tax. This lack of sales tax causes revenue collection to fluctuate significantly as the economy changes. Property taxes are also collected in the State, but property tax revenues are used mainly for county and local services.
Investment Activity rose $4.7 million in 2004 mainly due to investments appreciating $6.6 million during 2004 and appreciating $.8 million during 2003. Partially offsetting this increase was decreased interest income of $1.5 million due to lower interest rates and invested cash in fiscal year 2004.
Interest Expense increased by $2.6 million due to a partial year’s interest accrual on debt issued in fiscal year 2004 and a full year’s interest accrual on debt issued in fiscal year 2003. See “Capital Assets and Related Financing Activities,” below, for information relating to this variance.
Capital Grants and Gifts declined $16.8 million in 2004 relating to the timing of construction projects.
Other Nonoperating Items increased $7.2 million relating mainly to increased gifts of $13.5 million. This was partially offset by decreased net gains on asset sales of $4.2 million.
Comparison of fiscal year 2003 to fiscal year 2002
Management’s Discussion and Analysis For the Years Ended June 30, 2004 and 2003
Oregon University System 2004 Annual Financial Report 17
Government and Capital Appropriations declined $39.3 million in 2003. Government appropriations declined $25.2 million relating to the reduction in State appropriations that are used to fund operations at OUS. To counter these losses in appropriations, temporary tuition surcharges were levied during winter and spring terms of fiscal year 2003 generating $17.0 million. State Capital Appropriations were $15.9 million for the 2001-2003 biennium. All of the capital appropriations were drawn down in fiscal year 2002.
Investment Activity rose $5.0 million in 2003 mainly due to investments depreciating $6.1 million during 2002 and appreciating $.8 million during 2003. Partially offsetting this increase was decreased interest income of $1.3 million due to lower interest rates in fiscal year 2003.
Interest Expense increased by $5.4 million due to a partial year’s interest accrual on debt issued in fiscal year 2003 and a full year’s interest accrual on debt issued in fiscal year 2002. See “Capital Assets and Related Financing Activities,” below, for information relating to this variance.
Capital Grants and Gifts declined $53.8 million in 2003. This was mainly due to contributions received during 2002 of $50.2 million for the expansion of the UO football stadium and $2.4 million for construction of an indoor football practice facility at OSU. No similar contributions were received in 2003.
Other Nonoperating Items increased $6.1 million relating to increased net gains on asset sales of $5.6 million.
CHANGE IN NET ASSETS
The Increase in Net Assets declined $4.6 million in 2004 compared to 2003 relating to declines in Capital Grants and Gifts of $16.8 million, Governmental and Capital Appropriations of $10.4 million, and net gains on asset sales of $4.2 million. This was partially offset by decreased Operating Losses of $13.3 million and increased Gifts of $13.5 million. The Increase in Net Assets declined $63.7 million in 2003 compared to 2002 relating to declines in Capital Grants and Gifts of $53.8 million and Governmental and Capital Appropriations of $39.3 million. This was partially offset by a decreased Operating Loss of $23.7 million.
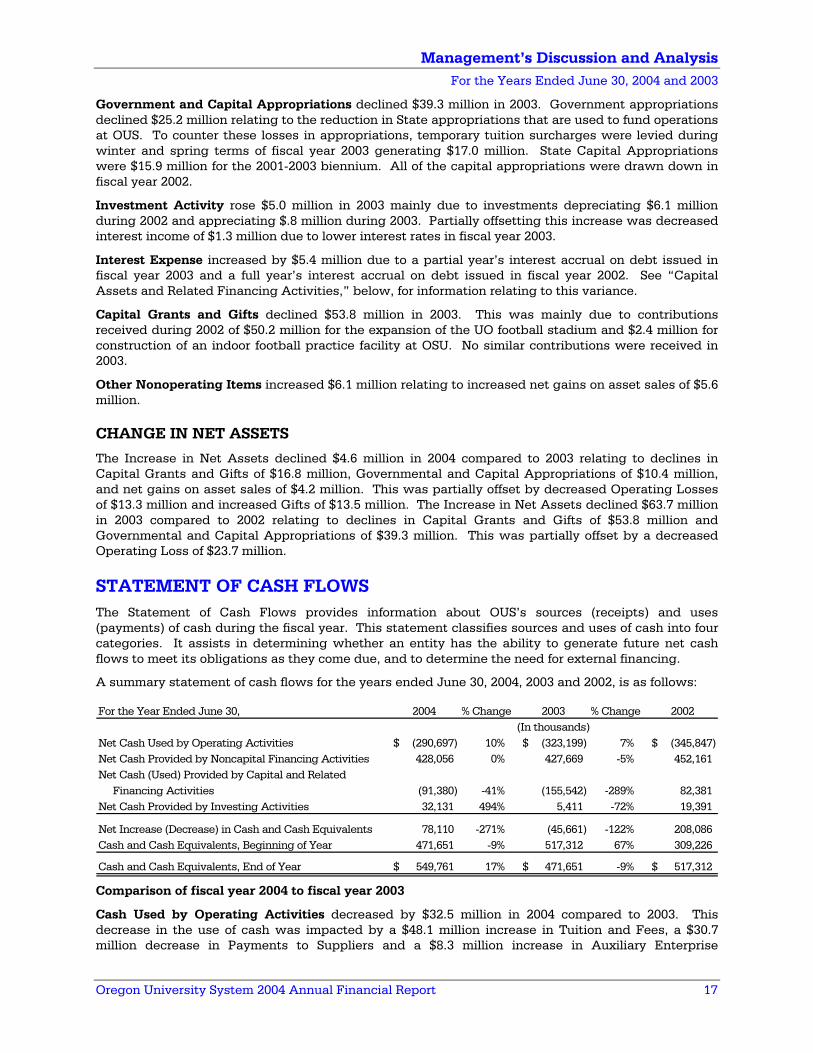
STATEMENT OF CASH FLOWS The Statement of Cash Flows provides information about OUS’s sources (receipts) and uses (payments) of cash during the fiscal year. This statement classifies sources and uses of cash into four categories. It assists in determining whether an entity has the ability to generate future net cash flows to meet its obligations as they come due, and to determine the need for external financing.
A summary statement of cash flows for the years ended June 30, 2004, 2003 and 2002, is as follows:
For the Year Ended June 30, 2004 % Change 2003 % Change 2002
Net Cash Used by Operating Activities (290,697)$ 10% (323,199)$ 7% (345,847)$ Net Cash Provided by Noncapital Financing Activities 428,056 0% 427,669 -5% 452,161 Net Cash (Used) Provided by Capital and Related Financing Activities (91,380) -41% (155,542) -289% 82,381 Net Cash Provided by Investing Activities 32,131 494% 5,411 -72% 19,391
Net Increase (Decrease) in Cash and Cash Equivalents 78,110 -271% (45,661) -122% 208,086 Cash and Cash Equivalents, Beginning of Year 471,651 -9% 517,312 67% 309,226
Cash and Cash Equivalents, End of Year 549,761$ 17% 471,651$ -9% 517,312$
(In thousands)
Comparison of fiscal year 2004 to fiscal year 2003
Cash Used by Operating Activities decreased by $32.5 million in 2004 compared to 2003. This decrease in the use of cash was impacted by a $48.1 million increase in Tuition and Fees, a $30.7 million decrease in Payments to Suppliers and a $8.3 million increase in Auxiliary Enterprise
Management’s Discussion and Analysis For the Years Ended June 30, 2004 and 2003
18 Oregon University System 2004 Annual Financial Report
Operations. Partially offsetting these favorable changes were decreased Grants and Contracts of $39.1 million relating mainly to the change in student loan programs at PSU and increased expenses relating to Payments to Employees for Salaries and Benefits of $17.4 million. See “Statement of Revenues, Expenses and Changes in Net Assets – Operating Revenues,” and “Statement of Revenues, Expenses and Changes in Net Assets – Operating Expenses” above, for further information relating to these revenue and expense increases and decreases.
Cash Provided by Noncapital Financing Activities increased by $.4 million in 2004. Increased Other Gifts and Private Contracts mostly offset the decrease in Governmental Appropriations. See “Statement of Revenues, Expenses and Changes in Net Assets – Nonoperating Revenues (Expenses),” above, for further information relating to the revenue increase and decrease.
Cash Used by Capital and Related Financing Activities declined by $64.2 million in 2004. This can primarily be attributed to debt issuances increasing $59.9 million during fiscal year 2004 when compared to 2003. Decreased construction and purchase of capital assets caused the OUS cash position to increase by $19.0 million. Capital Appropriations of $11.5 million also increased cash during fiscal year 2004. Partially offsetting these cash increases was a net decrease in Capital Grants and Gifts of $17.0 million. See “Statement of Revenues, Expenses and Changes in Net Assets – Nonoperating Revenues (Expenses),” and above for further information relating to these revenue decreases.
Cash Provided by Investing Activities increased by $26.7 million in 2004 when compared to 2003. This was mainly due to the change in Net (Purchases) Sales of Assets of $27.6 million. Fiscal year 2004 reflects investment maturities of $20.4 million. Fiscal year 2003 reflects investment purchases of $18.3 million offset by investment maturities of $6.0 million and sales of $5.0 million.
Comparison of fiscal year 2003 to fiscal year 2002
Cash Used by Operating Activities decreased by $22.6 million in 2003 compared to 2002. This decrease in the use of cash was impacted by a $45.8 million increase in Tuition and Fees and a $65.4 million increase in Grants and Contracts. See “Statement of Revenues, Expenses and Changes in Net Assets – Operating Revenues,” above, for further information relating to these revenue increases. Partially offsetting these increased revenues were increased expenses relating to Payments to Employees for Salaries and Benefits of $44.0 million and Payments to Suppliers of $34.8 million. See “Statement of Revenues, Expenses and Changes in Net Assets – Operating Expenses,” above, for further information relating to these expense increases.
Cash Provided by Noncapital Financing Activities declined by $24.5 million in 2003, due mainly to the $24.6 million decrease in Governmental Appropriations. See “Statement of Revenues, Expenses and Changes in Net Assets – Nonoperating Revenues (Expenses),” above, for further information relating to this revenue decrease.
Cash (Used) Provided by Capital and Related Financing Activities declined by $237.9 million in 2003. This can primarily be attributed to debt issuances declining $166.9 million during fiscal year 2003 when compared to 2002. Increased construction and purchase of capital assets caused the OUS cash position to decline by $28.1 million. Partially offsetting these cash declines was decreased debt principal payments relating to current bond refundings of $24.5 million made during fiscal year 2002. See “Capital Assets and Related Financing Activities,” below for information relating to these variances. This decline can also be attributed to decreases in Capital Grants and Gifts of $51.7 million and Capital Appropriations of $15.9 million. See “Statement of Revenues, Expenses and Changes in Net Assets – Nonoperating Revenues (Expenses),” and above for further information relating to these revenue decreases.
Cash Provided by Investing Activities declined by $14.0 million in 2003 when compared to 2002. This was mainly due to the change in Net (Purchases) Sales of Assets of $11.9 million. Fiscal year 2003 reflects investment purchases of $18.3 million offset by investment maturities of $6.0 million and sales of $5.0 million. Fiscal year 2002 reflects investment maturities of $4.0 million.
Management’s Discussion and Analysis For the Years Ended June 30, 2004 and 2003
Oregon University System 2004 Annual Financial Report 19
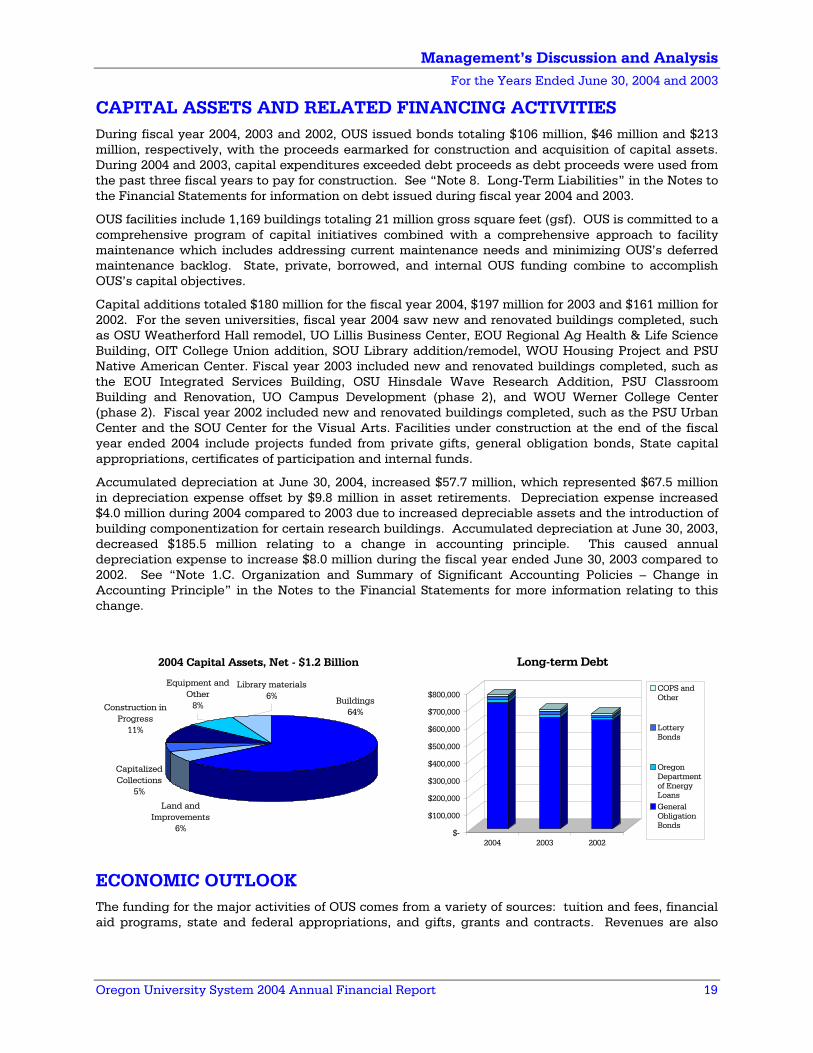
CAPITAL ASSETS AND RELATED FINANCING ACTIVITIES During fiscal year 2004, 2003 and 2002, OUS issued bonds totaling $106 million, $46 million and $213 million, respectively, with the proceeds earmarked for construction and acquisition of capital assets. During 2004 and 2003, capital expenditures exceeded debt proceeds as debt proceeds were used from the past three fiscal years to pay for construction. See “Note 8. Long-Term Liabilities” in the Notes to the Financial Statements for information on debt issued during fiscal year 2004 and 2003.
OUS facilities include 1,169 buildings totaling 21 million gross square feet (gsf). OUS is committed to a comprehensive program of capital initiatives combined with a comprehensive approach to facility maintenance which includes addressing current maintenance needs and minimizing OUS’s deferred maintenance backlog. State, private, borrowed, and internal OUS funding combine to accomplish OUS’s capital objectives.
Capital additions totaled $180 million for the fiscal year 2004, $197 million for 2003 and $161 million for 2002. For the seven universities, fiscal year 2004 saw new and renovated buildings completed, such as OSU Weatherford Hall remodel, UO Lillis Business Center, EOU Regional Ag Health & Life Science Building, OIT College Union addition, SOU Library addition/remodel, WOU Housing Project and PSU Native American Center. Fiscal year 2003 included new and renovated buildings completed, such as the EOU Integrated Services Building, OSU Hinsdale Wave Research Addition, PSU Classroom Building and Renovation, UO Campus Development (phase 2), and WOU Werner College Center (phase 2). Fiscal year 2002 included new and renovated buildings completed, such as the PSU Urban Center and the SOU Center for the Visual Arts. Facilities under construction at the end of the fiscal year ended 2004 include projects funded from private gifts, general obligation bonds, State capital appropriations, certificates of participation and internal funds.
Accumulated depreciation at June 30, 2004, increased $57.7 million, which represented $67.5 million in depreciation expense offset by $9.8 million in asset retirements. Depreciation expense increased $4.0 million during 2004 compared to 2003 due to increased depreciable assets and the introduction of building componentization for certain research buildings. Accumulated depreciation at June 30, 2003, decreased $185.5 million relating to a change in accounting principle. This caused annual depreciation expense to increase $8.0 million during the fiscal year ended June 30, 2003 compared to 2002. See “Note 1.C. Organization and Summary of Significant Accounting Policies – Change in Accounting Principle” in the Notes to the Financial Statements for more information relating to this change.
2004 Capital Assets, Net - $1.2 Billion
Capitalized Collections
5%
Equipment and Other
8%
Library materials6%
Construction in Progress
11%
Land and Improvements
6%
Buildings64%
$-
$100,000
$200,000
$300,000
$400,000
$500,000
$600,000
$700,000
$800,000
2004 2003 2002
Long-term Debt
COPS andOther
LotteryBonds
OregonDepartmentof EnergyLoansGeneralObligationBonds
ECONOMIC OUTLOOK The funding for the major activities of OUS comes from a variety of sources: tuition and fees, financial aid programs, state and federal appropriations, and gifts, grants and contracts. Revenues are also
Management’s Discussion and Analysis For the Years Ended June 30, 2004 and 2003
20 Oregon University System 2004 Annual Financial Report
generated through recovery of costs associated with federal grant and contract activities, which serve to offset related administrative and capital costs.
A primary objective of the universities that comprise OUS is to maintain higher education programs that provide for access, affordability, excellence and economic development. The downturn in the economy and structural issues affecting the State’s revenues have and will continue to have a negative impact on the funding of OUS. Due to the decline in State apportionments, OUS has taken several actions to keep these priorities in the forefront of the State Legislature. See the “Message from the Chancellor” for information relating to this mission and the related actions being undertaken to accomplish it. The quality of education at OUS is tracked and evaluated based on a performance measurement system mandated by the State Legislature in 1997.
There is the potential for a negative impact on OUS if State apportionments continue to decline for a significant period of time. Enrollment increases will likely slow due to higher than average increases in tuition and fees to offset declines in State appropriations. Class size may have to increase as personnel and class and course reductions take affect.
Fall 2004 enrollment increased 0.6% to a total of 80,066, up from 79,558 in the same period in 2003. Though this generates a marginal increase in revenues it increases the difficulty of achieving the primary objective of OUS if the State appropriations do not cover all of the students in the system.
The budgetary outlook for fiscal year 2005 continues to have uncertainties. The State General Fund portion of the OUS budget is $543.2 million for 2003-05, down from $617.4 million in General Fund appropriations for the 2001-03 biennium, a reduction of 12%. For the first time, the Legislature set upper limits on undergraduate fee remissions, which required campuses to adjust their fee remission awards in the this biennium to conform to the limit.
Research volume on OUS campuses remains strong, which, coupled with efforts at increasing technology transfer activities, will help ensure stability and achieve growth in grant and contract revenues, along with increased cost recoveries. The level of cost recovery from the federal government hinges on obtaining/maintaining stability in the negotiated cost recovery rate. Recent trends indicate downward pressure in recovery rates that may serve to offset any volume-related increases.
OUS campuses have increasingly looked to outside donors for funding significant portions of capital projects, as well as supporting operations. Improvements in the levels of gift revenues have been made over the past several years. Given Oregon’s current economic condition, it is uncertain whether we can anticipate continued growth and stability from this revenue source.
Enrollment is increasing at a slower rate due to the continuation of tuition increases, and higher admission requirements. Should state funding levels, coupled with tuition and fees, become more stable in relation to enrollment, we can expect to see increases in operating expenses. However, in the event of declines in state revenues without offsetting tuition and fee increases, the projected increases in enrollment may be further reduced, which may limit operating cost increases.
Compensation continues to be an issue relating to the ability of OUS to attract and retain a quality workforce. With the current wage freeze, there are concerns relating to the ability to offer competitive salaries and benefits in order to help ensure retention of top talent and, as a result, help ensure the continued quality of OUS educational programs. The experience of the last several years, as well as industry projections, points to continued increases in the costs necessary to maintain the current level of employee benefits.
The structure of OUS required contributions to the Oregon Public Employees Retirement System (PERS) has changed by legislative action. PERS is currently under funded and these revisions to the PERS plan have been legislated to help mitigate the funding shortfalls but do not cover the entire deficit. Some of the legislated changes are facing legal challenges in the court system and, depending on the outcome, may increase the contribution percentage.
Management’s Discussion and Analysis For the Years Ended June 30, 2004 and 2003
Oregon University System 2004 Annual Financial Report 21
[This page intentionally left blank.]
Oregon University System 2004 Annual Financial Report 24
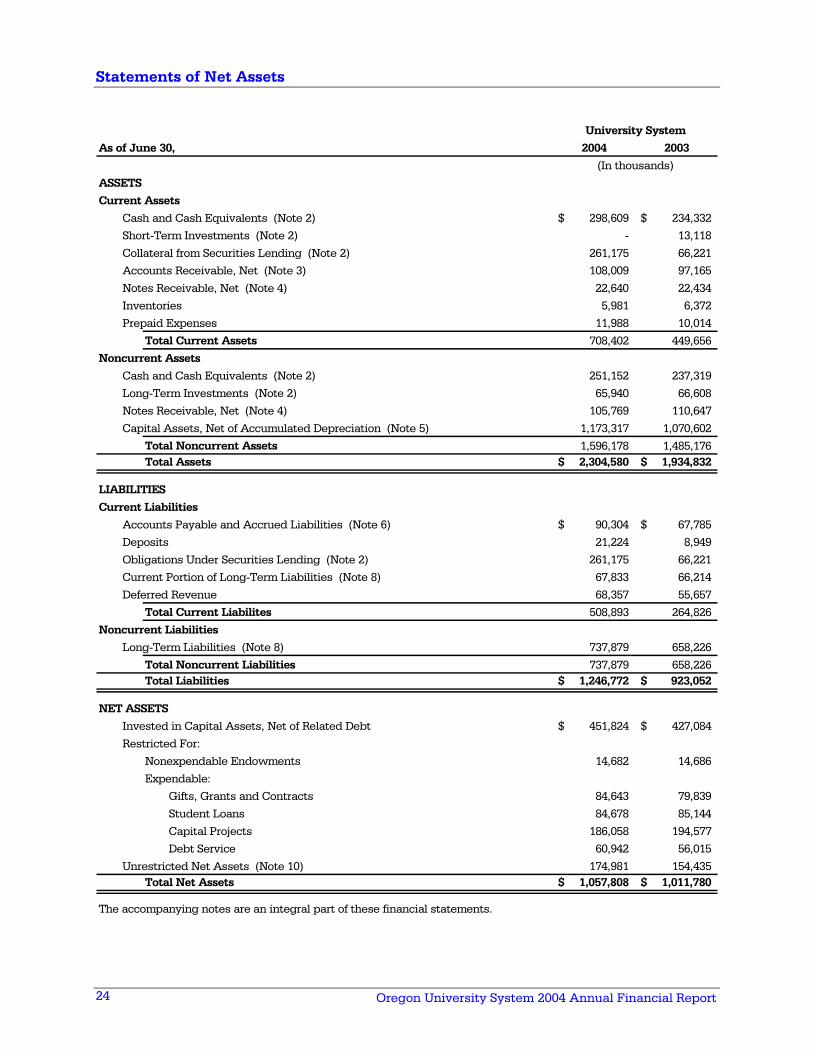
Statements of Net Assets
As of June 30, 2004 2003
ASSETSCurrent Assets
Cash and Cash Equivalents (Note 2) 298,609$ 234,332$ Short-Term Investments (Note 2) - 13,118 Collateral from Securities Lending (Note 2) 261,175 66,221 Accounts Receivable, Net (Note 3) 108,009 97,165 Notes Receivable, Net (Note 4) 22,640 22,434 Inventories 5,981 6,372 Prepaid Expenses 11,988 10,014
Total Current Assets 708,402 449,656 Noncurrent Assets
Cash and Cash Equivalents (Note 2) 251,152 237,319 Long-Term Investments (Note 2) 65,940 66,608 Notes Receivable, Net (Note 4) 105,769 110,647 Capital Assets, Net of Accumulated Depreciation (Note 5) 1,173,317 1,070,602
Total Noncurrent Assets 1,596,178 1,485,176 Total Assets 2,304,580$ 1,934,832$
LIABILITIESCurrent Liabilities
Accounts Payable and Accrued Liabilities (Note 6) 90,304$ 67,785$ Deposits 21,224 8,949 Obligations Under Securities Lending (Note 2) 261,175 66,221 Current Portion of Long-Term Liabilities (Note 8) 67,833 66,214 Deferred Revenue 68,357 55,657
Total Current Liabilites 508,893 264,826 Noncurrent Liabilities
Long-Term Liabilities (Note 8) 737,879 658,226 Total Noncurrent Liabilities 737,879 658,226 Total Liabilities 1,246,772$ 923,052$
NET ASSETSInvested in Capital Assets, Net of Related Debt 451,824$ 427,084$ Restricted For:
Nonexpendable Endowments 14,682 14,686 Expendable:
Gifts, Grants and Contracts 84,643 79,839 Student Loans 84,678 85,144 Capital Projects 186,058 194,577 Debt Service 60,942 56,015
Unrestricted Net Assets (Note 10) 174,981 154,435 Total Net Assets 1,057,808$ 1,011,780$
The accompanying notes are an integral part of these financial statements.
(In thousands)
University System
Oregon University System 2004 Annual Financial Report
25
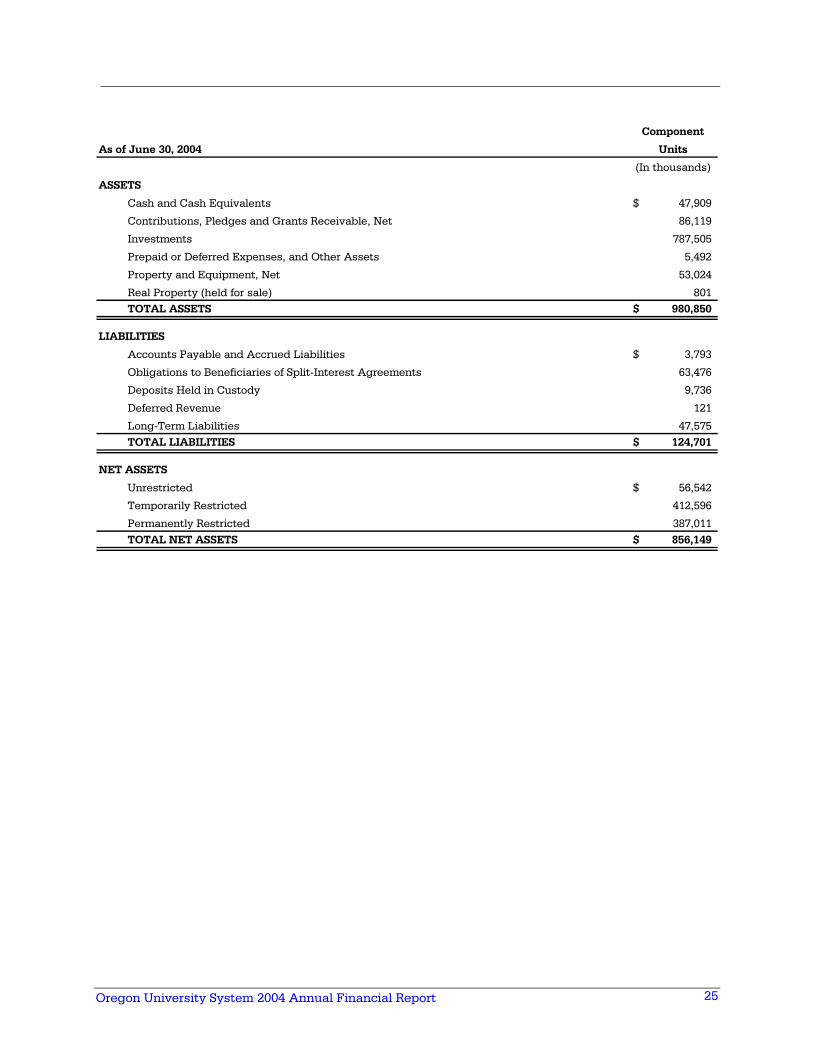
Component
As of June 30, 2004 Units
(In thousands)
ASSETS
Cash and Cash Equivalents 47,909$
Contributions, Pledges and Grants Receivable, Net 86,119
Investments 787,505
Prepaid or Deferred Expenses, and Other Assets 5,492
Property and Equipment, Net 53,024
Real Property (held for sale) 801 TOTAL ASSETS 980,850$
LIABILITIES
Accounts Payable and Accrued Liabilities 3,793$
Obligations to Beneficiaries of Split-Interest Agreements 63,476
Deposits Held in Custody 9,736
Deferred Revenue 121
Long-Term Liabilities 47,575TOTAL LIABILITIES 124,701$
NET ASSETS
Unrestricted 56,542$
Temporarily Restricted 412,596
Permanently Restricted 387,011 TOTAL NET ASSETS 856,149$
Oregon University System 2004 Annual Financial Report 26
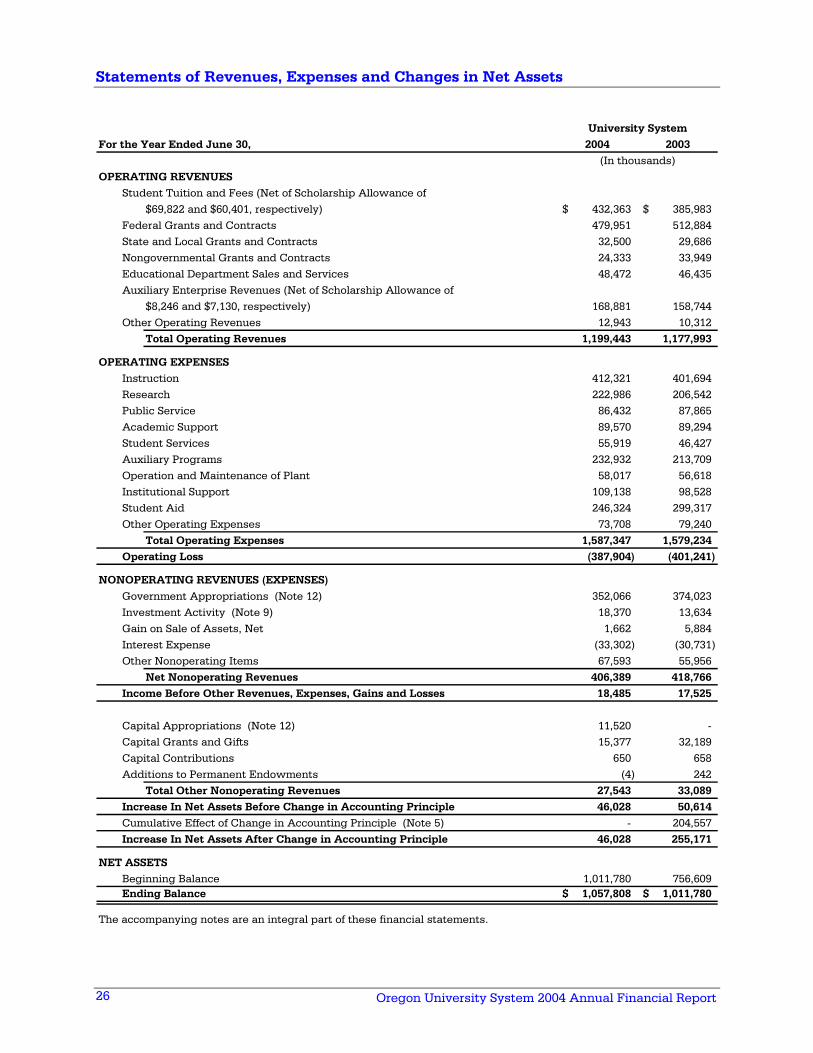
Statements of Revenues, Expenses and Changes in Net Assets
For the Year Ended June 30, 2004 2003
OPERATING REVENUESStudent Tuition and Fees (Net of Scholarship Allowance of
$69,822 and $60,401, respectively) 432,363$ 385,983$ Federal Grants and Contracts 479,951 512,884 State and Local Grants and Contracts 32,500 29,686 Nongovernmental Grants and Contracts 24,333 33,949 Educational Department Sales and Services 48,472 46,435 Auxiliary Enterprise Revenues (Net of Scholarship Allowance of
$8,246 and $7,130, respectively) 168,881 158,744 Other Operating Revenues 12,943 10,312
Total Operating Revenues 1,199,443 1,177,993
OPERATING EXPENSESInstruction 412,321 401,694 Research 222,986 206,542 Public Service 86,432 87,865 Academic Support 89,570 89,294 Student Services 55,919 46,427 Auxiliary Programs 232,932 213,709 Operation and Maintenance of Plant 58,017 56,618 Institutional Support 109,138 98,528 Student Aid 246,324 299,317 Other Operating Expenses 73,708 79,240
Total Operating Expenses 1,587,347 1,579,234Operating Loss (387,904) (401,241)
NONOPERATING REVENUES (EXPENSES)Government Appropriations (Note 12) 352,066 374,023 Investment Activity (Note 9) 18,370 13,634 Gain on Sale of Assets, Net 1,662 5,884 Interest Expense (33,302) (30,731) Other Nonoperating Items 67,593 55,956
Net Nonoperating Revenues 406,389 418,766Income Before Other Revenues, Expenses, Gains and Losses 18,485 17,525
Capital Appropriations (Note 12) 11,520 - Capital Grants and Gifts 15,377 32,189 Capital Contributions 650 658 Additions to Permanent Endowments (4) 242
Total Other Nonoperating Revenues 27,543 33,089Increase In Net Assets Before Change in Accounting Principle 46,028 50,614Cumulative Effect of Change in Accounting Principle (Note 5) - 204,557 Increase In Net Assets After Change in Accounting Principle 46,028 255,171
NET ASSETSBeginning Balance 1,011,780 756,609Ending Balance 1,057,808$ 1,011,780$
The accompanying notes are an integral part of these financial statements.
University System
(In thousands)
Oregon University System 2004 Annual Financial Report
27
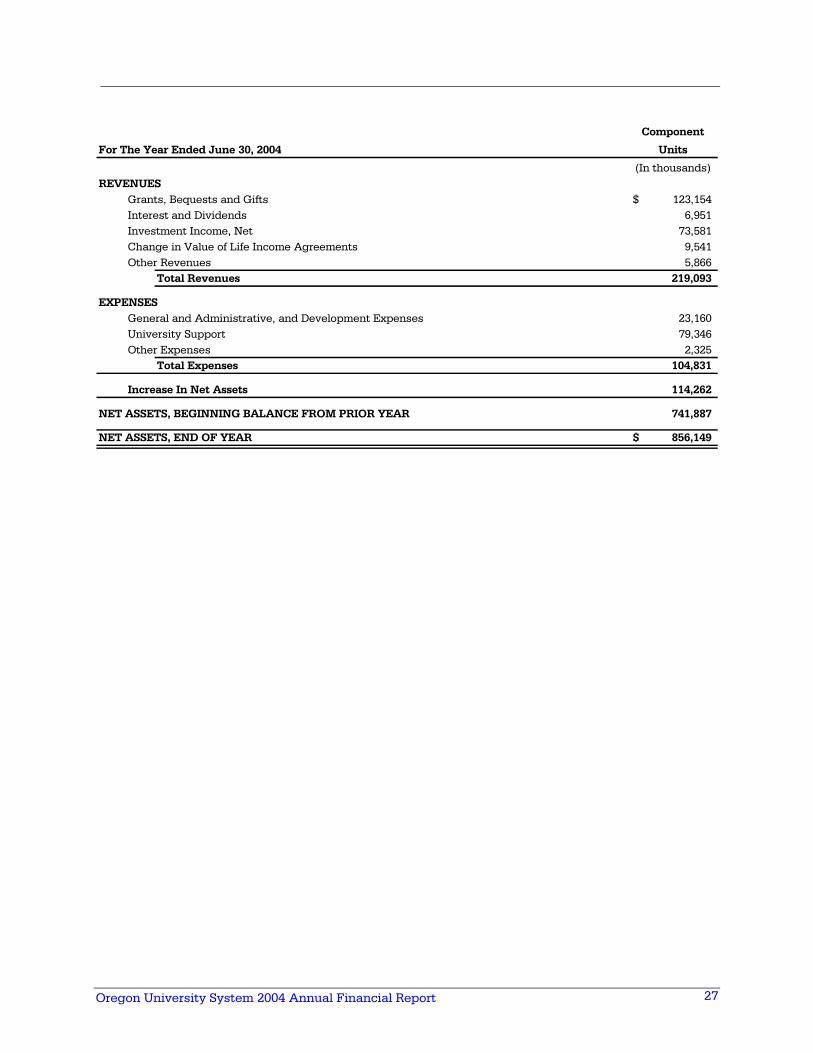
Component
For The Year Ended June 30, 2004 Units
(In thousands)REVENUES
Grants, Bequests and Gifts 123,154$ Interest and Dividends 6,951 Investment Income, Net 73,581 Change in Value of Life Income Agreements 9,541 Other Revenues 5,866
Total Revenues 219,093
EXPENSESGeneral and Administrative, and Development Expenses 23,160 University Support 79,346 Other Expenses 2,325
Total Expenses 104,831
Increase In Net Assets 114,262
NET ASSETS, BEGINNING BALANCE FROM PRIOR YEAR 741,887
NET ASSETS, END OF YEAR 856,149$
Oregon University System 2004 Annual Financial Report 28
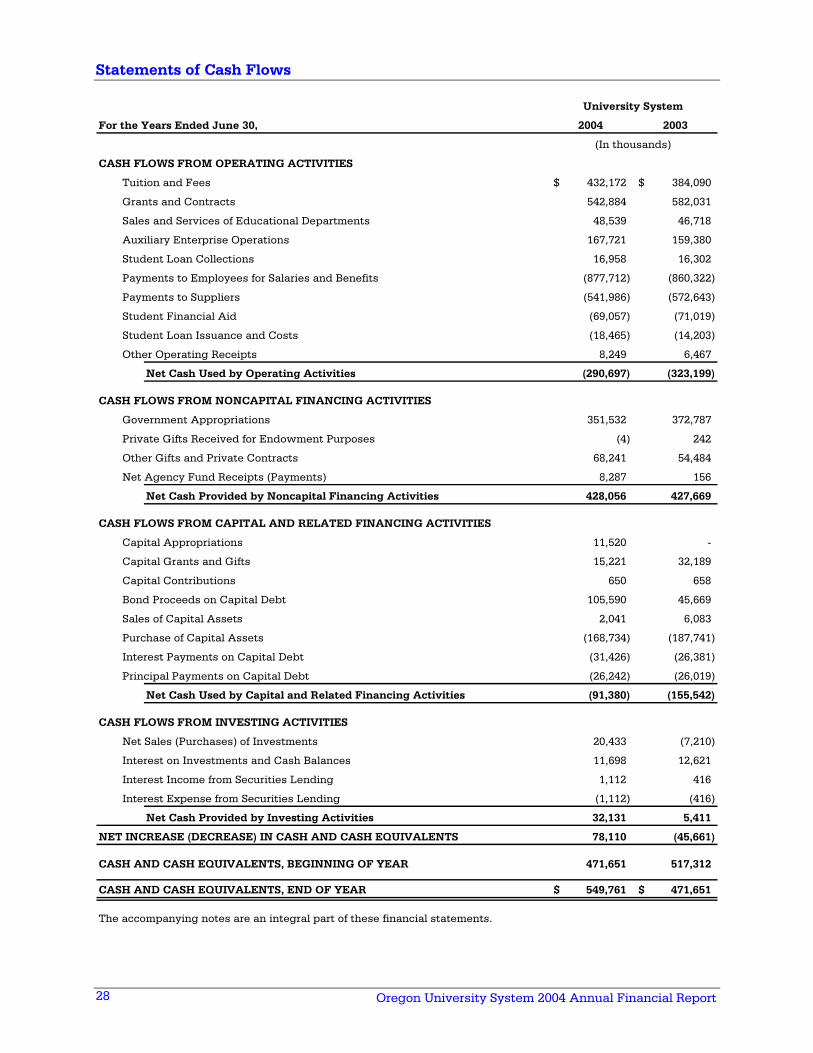
Statements of Cash Flows
For the Years Ended June 30, 2004 2003
CASH FLOWS FROM OPERATING ACTIVITIES
Tuition and Fees 432,172$ 384,090$
Grants and Contracts 542,884 582,031
Sales and Services of Educational Departments 48,539 46,718
Auxiliary Enterprise Operations 167,721 159,380
Student Loan Collections 16,958 16,302
Payments to Employees for Salaries and Benefits (877,712) (860,322)
Payments to Suppliers (541,986) (572,643)
Student Financial Aid (69,057) (71,019)
Student Loan Issuance and Costs (18,465) (14,203)
Other Operating Receipts 8,249 6,467
Net Cash Used by Operating Activities (290,697) (323,199)
CASH FLOWS FROM NONCAPITAL FINANCING ACTIVITIES
Government Appropriations 351,532 372,787
Private Gifts Received for Endowment Purposes (4) 242
Other Gifts and Private Contracts 68,241 54,484
Net Agency Fund Receipts (Payments) 8,287 156
Net Cash Provided by Noncapital Financing Activities 428,056 427,669
CASH FLOWS FROM CAPITAL AND RELATED FINANCING ACTIVITIES
Capital Appropriations 11,520 -
Capital Grants and Gifts 15,221 32,189
Capital Contributions 650 658
Bond Proceeds on Capital Debt 105,590 45,669
Sales of Capital Assets 2,041 6,083
Purchase of Capital Assets (168,734) (187,741)
Interest Payments on Capital Debt (31,426) (26,381)
Principal Payments on Capital Debt (26,242) (26,019)
Net Cash Used by Capital and Related Financing Activities (91,380) (155,542)
CASH FLOWS FROM INVESTING ACTIVITIES
Net Sales (Purchases) of Investments 20,433 (7,210)
Interest on Investments and Cash Balances 11,698 12,621
Interest Income from Securities Lending 1,112 416
Interest Expense from Securities Lending (1,112) (416)
Net Cash Provided by Investing Activities 32,131 5,411
NET INCREASE (DECREASE) IN CASH AND CASH EQUIVALENTS 78,110 (45,661)
CASH AND CASH EQUIVALENTS, BEGINNING OF YEAR 471,651 517,312
CASH AND CASH EQUIVALENTS, END OF YEAR 549,761$ 471,651$
The accompanying notes are an integral part of these financial statements.
(In thousands)
University System
Oregon University System 2004 Annual Financial Report
29
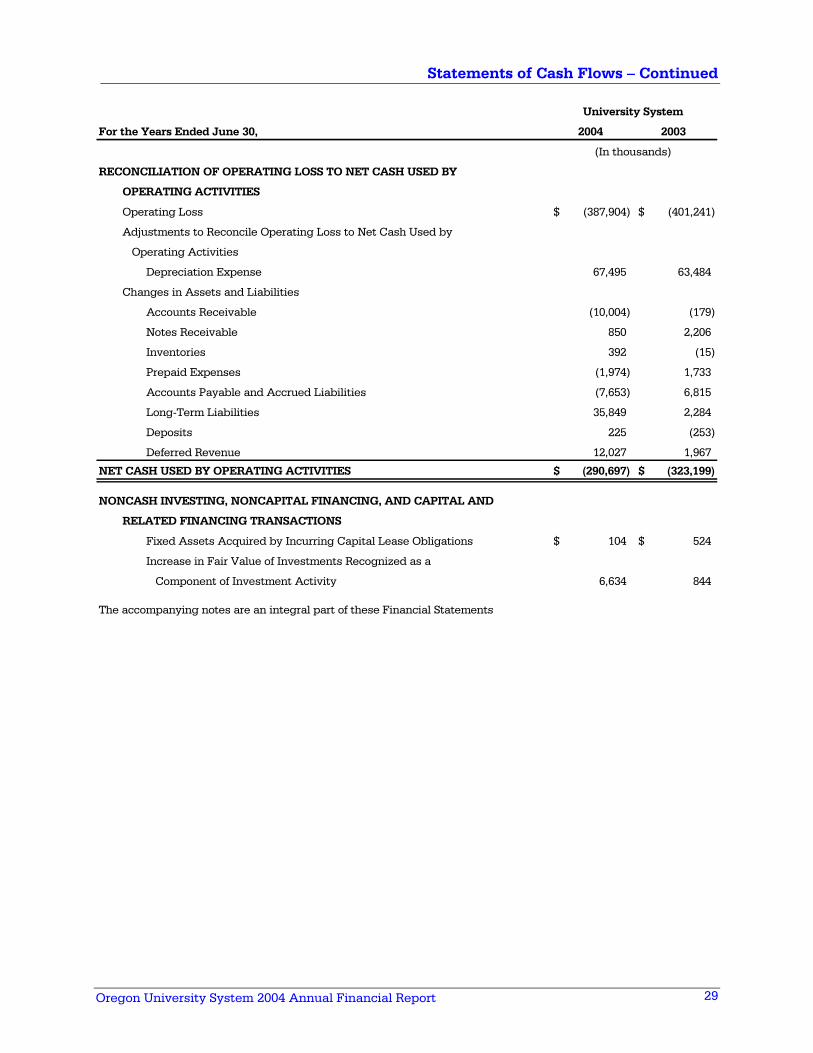
Statements of Cash Flows – Continued
For the Years Ended June 30, 2004 2003
RECONCILIATION OF OPERATING LOSS TO NET CASH USED BY
OPERATING ACTIVITIES
Operating Loss (387,904)$ (401,241)$
Adjustments to Reconcile Operating Loss to Net Cash Used by
Operating Activities
Depreciation Expense 67,495 63,484
Changes in Assets and Liabilities
Accounts Receivable (10,004) (179)
Notes Receivable 850 2,206
Inventories 392 (15)
Prepaid Expenses (1,974) 1,733
Accounts Payable and Accrued Liabilities (7,653) 6,815
Long-Term Liabilities 35,849 2,284
Deposits 225 (253)
Deferred Revenue 12,027 1,967
NET CASH USED BY OPERATING ACTIVITIES (290,697)$ (323,199)$
NONCASH INVESTING, NONCAPITAL FINANCING, AND CAPITAL AND
RELATED FINANCING TRANSACTIONS
Fixed Assets Acquired by Incurring Capital Lease Obligations 104$ 524$
Increase in Fair Value of Investments Recognized as a
Component of Investment Activity 6,634 844
The accompanying notes are an integral part of these Financial Statements
(In thousands)
University System
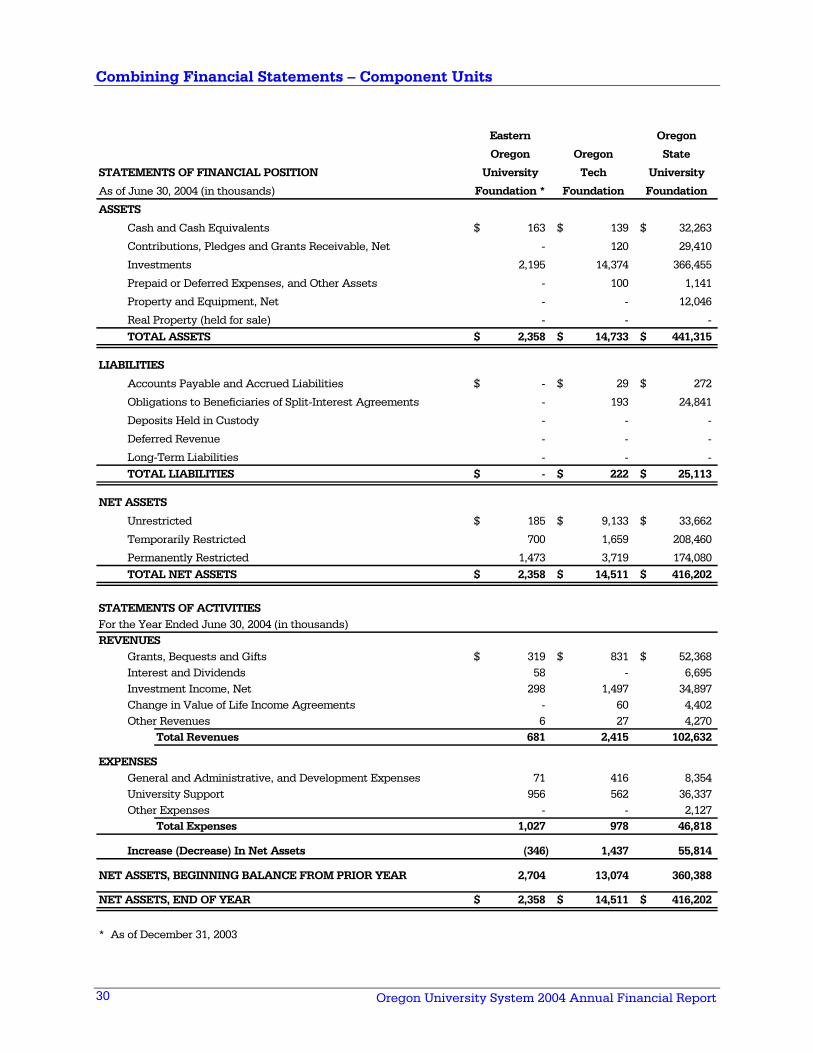
Oregon University System 2004 Annual Financial Report 30
Combining Financial Statements – Component Units
Eastern Oregon
Oregon Oregon State
STATEMENTS OF FINANCIAL POSITION University Tech University
As of June 30, 2004 (in thousands) Foundation * Foundation Foundation
ASSETS
Cash and Cash Equivalents 163$ 139$ 32,263$
Contributions, Pledges and Grants Receivable, Net - 120 29,410
Investments 2,195 14,374 366,455
Prepaid or Deferred Expenses, and Other Assets - 100 1,141
Property and Equipment, Net - - 12,046
Real Property (held for sale) - - - TOTAL ASSETS 2,358$ 14,733$ 441,315$
LIABILITIES
Accounts Payable and Accrued Liabilities -$ 29$ 272$
Obligations to Beneficiaries of Split-Interest Agreements - 193 24,841
Deposits Held in Custody - - -
Deferred Revenue - - -
Long-Term Liabilities - - - TOTAL LIABILITIES -$ 222$ 25,113$
NET ASSETS
Unrestricted 185$ 9,133$ 33,662$
Temporarily Restricted 700 1,659 208,460
Permanently Restricted 1,473 3,719 174,080TOTAL NET ASSETS 2,358$ 14,511$ 416,202$
STATEMENTS OF ACTIVITIESFor the Year Ended June 30, 2004 (in thousands)REVENUES
Grants, Bequests and Gifts 319$ 831$ 52,368$ Interest and Dividends 58 - 6,695 Investment Income, Net 298 1,497 34,897 Change in Value of Life Income Agreements - 60 4,402 Other Revenues 6 27 4,270
Total Revenues 681 2,415 102,632
EXPENSESGeneral and Administrative, and Development Expenses 71 416 8,354 University Support 956 562 36,337 Other Expenses - - 2,127
Total Expenses 1,027 978 46,818
Increase (Decrease) In Net Assets (346) 1,437 55,814
NET ASSETS, BEGINNING BALANCE FROM PRIOR YEAR 2,704 13,074 360,388
NET ASSETS, END OF YEAR 2,358$ 14,511$ 416,202$
* As of December 31, 2003
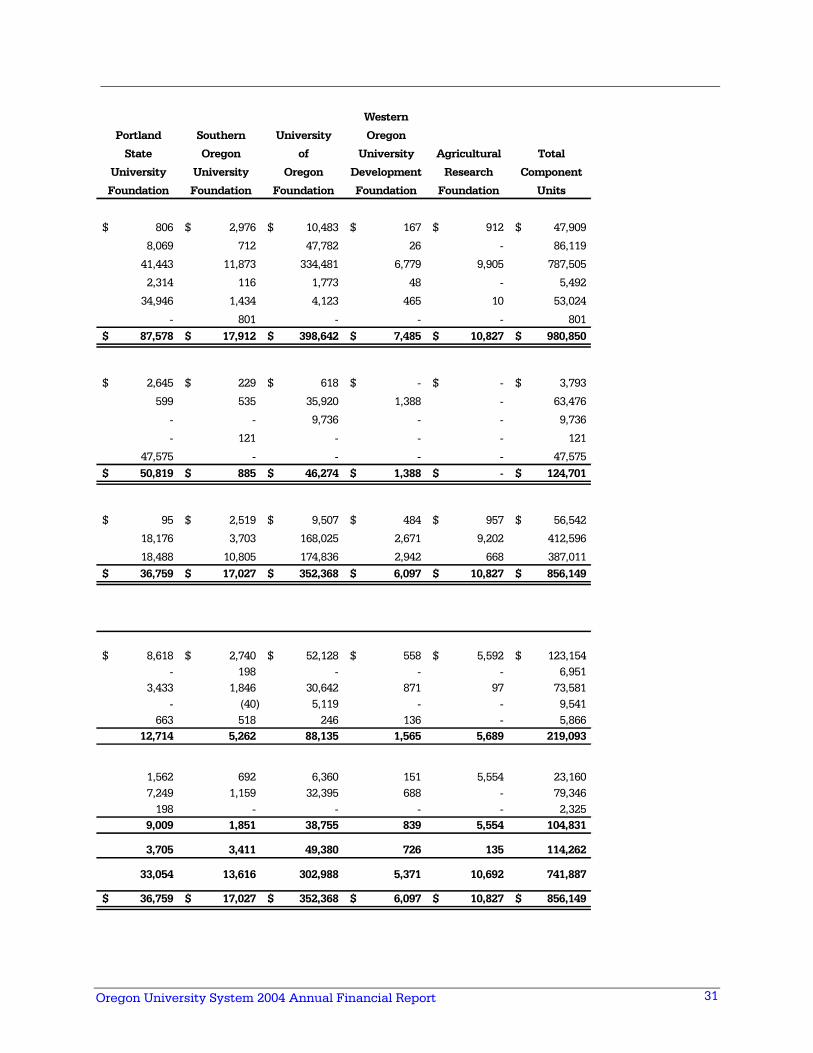
Oregon University System 2004 Annual Financial Report
31
Western
Portland Southern University Oregon
State Oregon of University Agricultural Total
University University Oregon Development Research Component
Foundation Foundation Foundation Foundation Foundation Units
806$ 2,976$ 10,483$ 167$ 912$ 47,909$
8,069 712 47,782 26 - 86,119
41,443 11,873 334,481 6,779 9,905 787,505
2,314 116 1,773 48 - 5,492
34,946 1,434 4,123 465 10 53,024
- 801 - - - 80187,578$ 17,912$ 398,642$ 7,485$ 10,827$ 980,850$
2,645$ 229$ 618$ -$ -$ 3,793$
599 535 35,920 1,388 - 63,476
- - 9,736 - - 9,736
- 121 - - - 121
47,575 - - - - 47,57550,819$ 885$ 46,274$ 1,388$ -$ 124,701$
95$ 2,519$ 9,507$ 484$ 957$ 56,542$
18,176 3,703 168,025 2,671 9,202 412,596
18,488 10,805 174,836 2,942 668 387,011 36,759$ 17,027$ 352,368$ 6,097$ 10,827$ 856,149$
8,618$ 2,740$ 52,128$ 558$ 5,592$ 123,154$ - 198 - - - 6,951
3,433 1,846 30,642 871 97 73,581 - (40) 5,119 - - 9,541
663 518 246 136 - 5,866 12,714 5,262 88,135 1,565 5,689 219,093
1,562 692 6,360 151 5,554 23,160 7,249 1,159 32,395 688 - 79,346
198 - - - - 2,325 9,009 1,851 38,755 839 5,554 104,831
3,705 3,411 49,380 726 135 114,262
33,054 13,616 302,988 5,371 10,692 741,887
36,759$ 17,027$ 352,368$ 6,097$ 10,827$ 856,149$
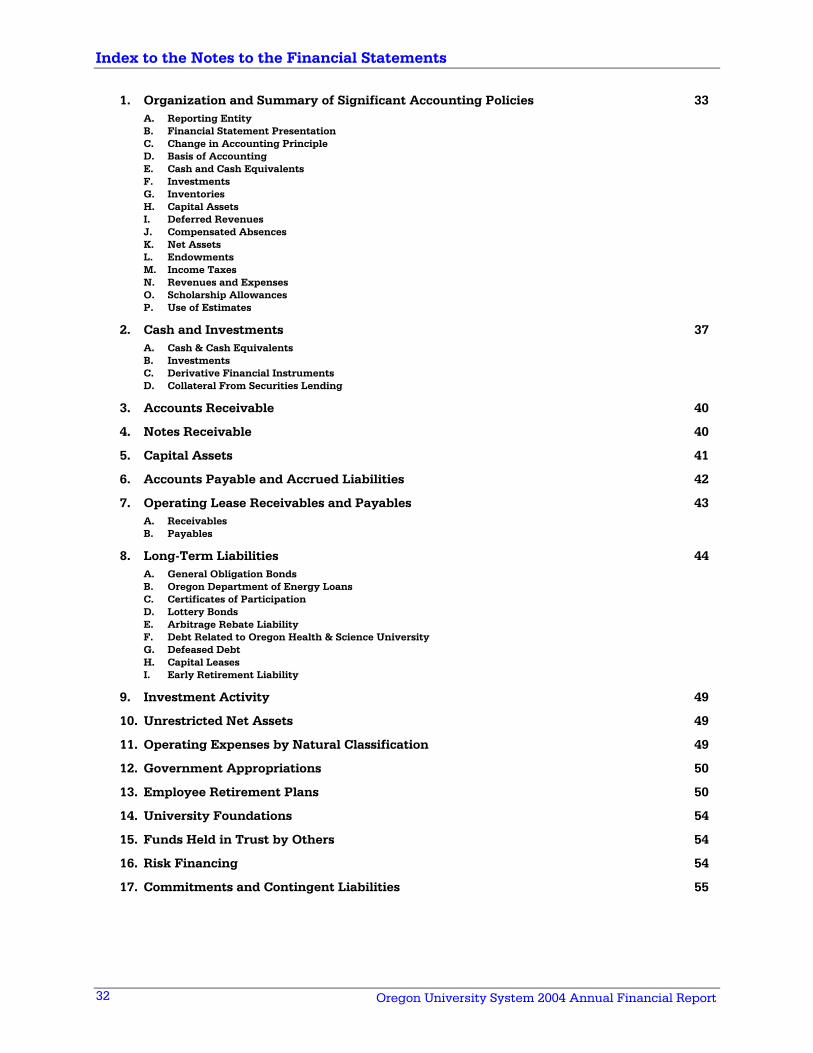
Oregon University System 2004 Annual Financial Report 32
Index to the Notes to the Financial Statements
1. Organization and Summary of Significant Accounting Policies 33 A. Reporting Entity B. Financial Statement Presentation C. Change in Accounting Principle D. Basis of Accounting E. Cash and Cash Equivalents F. Investments G. Inventories H. Capital Assets I. Deferred Revenues J. Compensated Absences K. Net Assets L. Endowments M. Income Taxes N. Revenues and Expenses O. Scholarship Allowances P. Use of Estimates
2. Cash and Investments 37 A. Cash & Cash Equivalents B. Investments C. Derivative Financial Instruments D. Collateral From Securities Lending
3. Accounts Receivable 40
4. Notes Receivable 40
5. Capital Assets 41
6. Accounts Payable and Accrued Liabilities 42
7. Operating Lease Receivables and Payables 43 A. Receivables B. Payables
8. Long-Term Liabilities 44 A. General Obligation Bonds B. Oregon Department of Energy Loans C. Certificates of Participation D. Lottery Bonds E. Arbitrage Rebate Liability F. Debt Related to Oregon Health & Science University G. Defeased Debt H. Capital Leases I. Early Retirement Liability
9. Investment Activity 49
10. Unrestricted Net Assets 49
11. Operating Expenses by Natural Classification 49
12. Government Appropriations 50
13. Employee Retirement Plans 50
14. University Foundations 54
15. Funds Held in Trust by Others 54
16. Risk Financing 54
17. Commitments and Contingent Liabilities 55
Notes to the Financial Statements For the Years Ended June 30, 2004 and 2003
Oregon University System 2004 Annual Financial Report 33
1. Organization and Summary of Significant Accounting Policies
A. Reporting Entity
The Oregon State Board of Higher Education (Board), a citizen board appointed by the Governor with confirmation by the Senate, governs the seven state-supported institutions of higher learning (institutions) in Oregon. These institutions are known as the Oregon University System (OUS). The law creating the Board was passed in 1929 by the Oregon Legislature and went into effect July 1, 1931.
The OUS financial reporting entity is reported under the heading of University System on the Basic Financial Statements and includes the accounts of Eastern Oregon University, Oregon Institute of Technology, Oregon State University, Portland State University, Southern Oregon University, University of Oregon, Western Oregon University and the Chancellor’s Office. The operations of most student government or associated student organizations are also included in the reporting entity due to OUS universities’ fiduciary responsibilities for these organizations. Organizations that are not financially accountable to OUS universities, such as booster and alumni organizations, are not included in the reporting entity.
OUS is a part of the primary government of the State of Oregon (State) and is included as a proprietary (enterprise) fund in the Comprehensive Annual Financial Report issued by the State.
B. Financial Statement Presentation
OUS financial accounting records are maintained in accordance with generally accepted accounting principles as prescribed in applicable pronouncements of Governmental Accounting Standards Board (GASB). OUS implemented GASB Statement No. 35, Basic Financial Statements – and Management’s Discussion and Analysis – for Public Colleges and Universities (No. 35) effective for the year ended June 30, 2002. To implement GASB No. 35, OUS adopted certain changes in accounting principles. In addition to establishing a fundamentally new financial reporting model for public universities, GASB No. 35 requires depreciation of capital assets and capitalization of library special collections. This implementation has resulted in significant changes to the presentation and captions of financial statements issued after July 1, 2001.
The financial statement presentation required by GASB No. 35 provides a comprehensive, entity-wide perspective of OUS assets, liabilities, net assets, revenues, expenses, changes in net assets, and cash flows; and replaces the fund-group perspective previously required.
OUS implemented GASB Statement No. 39, Determining Whether Certain Organizations Are Component Units (No. 39), effective for the year ended June 30, 2004. GASB No. 39 amends GASB Statement No. 14, The Financial Reporting Entity, and provides criteria for determining whether organizations should be reported as component units based on the nature and significance of their relationship with OUS and to clarify reporting requirements of those organizations. OUS includes component units that were selected for inclusion based on criteria established in GASB No. 39. OUS component units include Eastern Oregon University Foundation, Oregon Tech Foundation, Oregon State University Foundation, Portland State University Foundation, Southern Oregon University Foundation, University of Oregon Foundation, Western Oregon University Development Foundation, and Agricultural Research Foundation. These component units are discretely presented on a separate page to emphasize that they are tax-exempt non-profit organizations legally separate from OUS. The component units report under Financial Accounting Standards Board (FASB) Statement No. 117, Financial Reporting for Not-for-Profit Organizations, which differs from GASB pronouncements. No modifications have been made to the foundations’ financial information and care must be taken when assessing the consistency and comparability of the financial presentation between FASB and GASB. See “Note 14. University Foundations” for additional information about OUS institution related foundations.
Notes to the Financial Statements For the Years Ended June 30, 2004 and 2003
34 Oregon University System 2004 Annual Financial Report
In preparing the financial statements, significant interfund transactions and balances between universities have been eliminated.
The financial statements also include adoption of GASB Statements No. 37, Basic Financial Statements -- and Management’s Discussion and Analysis -- for State and Local Governments: Omnibus, and No. 38, Certain Financial Statements and Note Disclosures. Adoption of these pronouncements affected disclosures but had no effect on amounts reported in the financial statements. The fiscal year 2003 financial statements reflect certain reclassifications and restatements to conform to the fiscal year 2004 presentation.
C. Change in Accounting Principle
During the implementation of GASB No. 34 and No. 35 for the fiscal year 2002 financial statements, depreciation was calculated using the individual asset method for buildings using one record for each building wherein depreciation was calculated based on the original service date and original life of the building without considering the service dates of subsequent additions or major improvements to that building. During fiscal year 2003, OUS changed its method of applying the individual asset method to more accurately reflect the composite service life of each asset and its additions and major improvements. Each building can now have additional records relating to additions or improvements with a useful life assigned to the additions or improvements. During the review of the capital asset records relating to the change in method of determining depreciation, certain immaterial adjustments were made to capital asset records relating to amounts previously capitalized. The cumulative effect of this change in accounting principle and the adjustments as of the beginning of the fiscal year 2003 was an increase in net assets of $204,557,000. See “Note 5. Capital Assets,” for more information relating to the change in accounting principle and adjustments.
D. Basis of Accounting
For financial reporting purposes, OUS is considered a special-purpose government engaged only in business-type activities. Accordingly, the OUS financial statements are presented using the economic resources measurement focus and the accrual basis of accounting. Under the accrual basis, revenues are recognized when earned and expenses are recorded when a liability is incurred.
OUS has the option to apply all Financial Accounting Standards Board (FASB) pronouncements issued after November 30, 1989, unless FASB conflicts with GASB. OUS has elected to not apply FASB pronouncements issued after the applicable date.
E. Cash and Cash Equivalents
Cash and cash equivalents consist of highly liquid investments with original maturities of three months or less. Cash and cash equivalents include: Cash on hand; cash and investments held by the Oregon State Treasury Short-Term Fund (State Treasury STF); and cash deposits, if any, of debt proceeds in investment funds held by a trustee.
Cash and cash equivalents that are restricted for endowments, debt service, capital construction, and agency funds are classified as noncurrent assets in the Statements of Net Assets.
F. Investments
Investments are reported at fair value as determined by market prices. Unrealized gains or losses on investments are reported as investment activity in the Statements of Revenues, Expenses, and Changes in Net Assets.
Investments that are restricted for endowments, debt service, capital construction, and agency funds are classified as noncurrent assets in the Statements of Net Assets.
Notes to the Financial Statements For the Years Ended June 30, 2004 and 2003
Oregon University System 2004 Annual Financial Report 35
G. Inventories
Inventories are recorded at the lower of average cost or market and consist primarily of supplies in storerooms and physical plant stores.
H. Capital Assets
Capital assets are recorded at cost on the date acquired or at fair market value on the date donated. OUS policy is to capitalize equipment with unit costs of $5,000 or more and an estimated useful life of greater than one year. OUS also capitalizes major improvements to buildings that significantly increase the functionality of the building. Repairs and maintenance are charged to operating expense in the year in which the expense is incurred.
Depreciation is computed using the straight-line method over the estimated useful lives of the assets, generally 15 to 40 years for buildings, 10 to 20 years for infrastructure and land improvements, 10 years for library books and 5 to 11 years for equipment. Depreciation is not applied to museum collections, works of art or historical treasures, or library special collections.
I. Deferred Revenues
Deferred revenues include amounts received for tuition and fees, and auxiliary enterprise activities that relate to the subsequent fiscal year.
J. Compensated Absences
OUS accrues a liability for vacation leave and other compensated absences that were earned but not used during the current or prior fiscal year for which employees can receive compensation in a future period.
Sick leave is recorded as an expense when paid. There is no payout provision for unused sick leave and no liability exists for terminated employees.
K. Net Assets
OUS net assets are classified as follows:
Invested in capital assets, net of related debt
Investment in capital assets represents the total investment in capital assets, net of accumulated depreciation and outstanding debt obligations related to those capital assets.
Restricted net assets – nonexpendable
Nonexpendable restricted net assets consist of endowment funds in which donors have stipulated, as a condition of the gift instrument, that the principal is to be maintained inviolate and in perpetuity, and invested for the purpose of producing present and future income. The income may either be expended or, depending on the terms of the gift instrument, added to principal.
Restricted net assets – expendable
Restricted expendable net assets include resources in which OUS is legally or contractually obligated to spend resources in accordance with restrictions imposed by external third parties.
Unrestricted net assets
Unrestricted net assets are resources that may be used at the discretion of the Board.
When an expense is incurred that can be paid using either restricted or unrestricted resources, the decision whether to apply restricted or unrestricted resources first is a management matter, and the decision is made on a case-by-case basis.
Notes to the Financial Statements For the Years Ended June 30, 2004 and 2003
36 Oregon University System 2004 Annual Financial Report
L. Endowments
Oregon Revised Statues (ORS) Section 351.130 gives OUS the authority to use the interest, income, dividends, or profits of endowments. Current Board policy is to annually distribute, for spending purposes, four percent of the preceding 20 quarter moving average of the market value of the endowment funds and to maintain the purchasing power of the funds as nearly as prudent investment permits. Securities may be sold to provide for the income needs; however, the original corpus of endowments may not be invaded. For the years ended June 30, 2004 and 2003, the net amount of appreciation available for authorization for expenditure was $14,559,000 and $11,950,000, respectively.
Nonexpendable Endowments on the Statements of Net Assets of $14,682,000 and $14,686,000 at June 30, 2004 and 2003, respectively, represent the original corpus of true endowment funds and does not include the accumulated gains of those endowments.
M. Income Taxes
OUS is an agency of the State and is treated as a governmental entity for tax purposes. As such, OUS is generally not subject to federal and state income taxes. However, OUS remains subject to income taxes on any income that is derived from a trade or business regularly carried on and not in furtherance of the purpose for which it was granted exemption. No income tax provision has been recorded because, in the opinion of management, there is no significant amount of taxes on such unrelated business income.
N. Revenues and Expenses
OUS has classified its revenues and expenses as either operating or nonoperating according to the following criteria:
Operating revenues and expenses have the characteristics of exchange transactions. These transactions can be defined as an exchange in which two or more entities both receive and sacrifice value, such as purchases and sales of goods or services. Examples of operating revenues include (1) student tuition and fees; (2) sales and services of auxiliary enterprises; (3) most federal, state and local grants and contracts; and (4) other operating revenues. Examples of operating expenses include (1) employee salaries, benefits, and related expense; (2) scholarships and fellowships, net of scholarship discounts and allowances; (3) utilities, supplies and other services; (4) professional fees; and (5) depreciation expenses related to certain capital assets.
Nonoperating revenues have the characteristics of nonexchange transactions. Examples of nonoperating revenues include state appropriations, gifts, and contributions. Nonoperating expenses are defined in GASB No. 9, Reporting Cash Flows of Proprietary and Non-expendable Trust Funds and Governmental Entities That Use Proprietary Fund Accounting, and GASB No. 34. Examples of nonoperating expenses include interest on capital asset related debt and bond expenses.
O. Scholarship Allowances
Student tuition and fees and campus housing revenues included in auxiliary enterprise revenues are reported net of scholarship allowances. A scholarship allowance is the difference between the revenues charged to students and the amounts actually paid. Examples include tuition waivers and the revenues from financial aid programs (e.g., Pell Grants, Supplemental Educational Opportunity Grants, and State Need Grants) used for paying student tuition and fees and campus housing.
P. Use of Estimates
The preparation of financial statements in conformity with U.S. generally accepted accounting principles requires management to make estimates and assumptions that affect the reported amounts of assets and liabilities and disclosure of contingent assets and liabilities at the date
Notes to the Financial Statements For the Years Ended June 30, 2004 and 2003
Oregon University System 2004 Annual Financial Report 37
of the financial statements, and revenues and expenses during the year. Actual results could differ from those estimates.
2. Cash and Investments
A. Cash & Cash Equivalents
OUS maintains its cash balances on deposit with the Oregon State Treasury (State Treasury). The State Treasury maintains these and other state funds on a pooled basis. At the fiscal years ended June 30, 2004 and 2003, OUS carrying amounts of cash and cash equivalents were $546,699,000 and $468,682,000, respectively, while the State Treasury balances were $553,257,000 and $471,171,000, respectively. Differences between the OUS carrying amount and the State Treasury balance occur due to timing differences between transfers. All deposits are fully insured by federal depository insurance or secured by the statewide collateral pool that secures public deposits pursuant to Oregon Revised Statutes (ORS).
OUS cash and cash equivalents outside the State Treasury comprised $3,062,000 and $2,969,000 at June 30, 2004 and 2003, respectively. This cash is held in trust by a fiscal agent for bond principal and interest repayment of matured bonds.
B. Investments
OUS funds are invested by the State Treasury. OUS investment policies are governed by statute, the Oregon Investment Council (Council), and the Board. In accordance with ORS, investments of those funds are managed as a prudent investor would do, exercising reasonable care, skill and caution. While the State Treasury is authorized to use demand deposit accounts and fixed-income investments, equity investment transactions must be directed by external investment managers that are under contract to the Council.
Investments are reported at the fair values reported by the applicable investment trustee. OUS investments are classified in three categories of credit risk to give an indication of the level of risk assumed by OUS. The three categories of credit risk are:
(1) Insured or registered, or securities held by OUS or its agent in OUS’s name.
(2) Uninsured and unregistered, with securities held by the counterparty’s trust department or agent in OUS’s name.
(3) Uninsured and unregistered investments with securities held by the counterparty or by its trust department or agent but not in OUS’s name.
Categorized investments include debt instruments with a maturity of less than 90 days; such investments may reflect a reported value based on cost rather than fair value. However, cost approximates fair value. The following schedules present the fair value of OUS investments (in thousands):
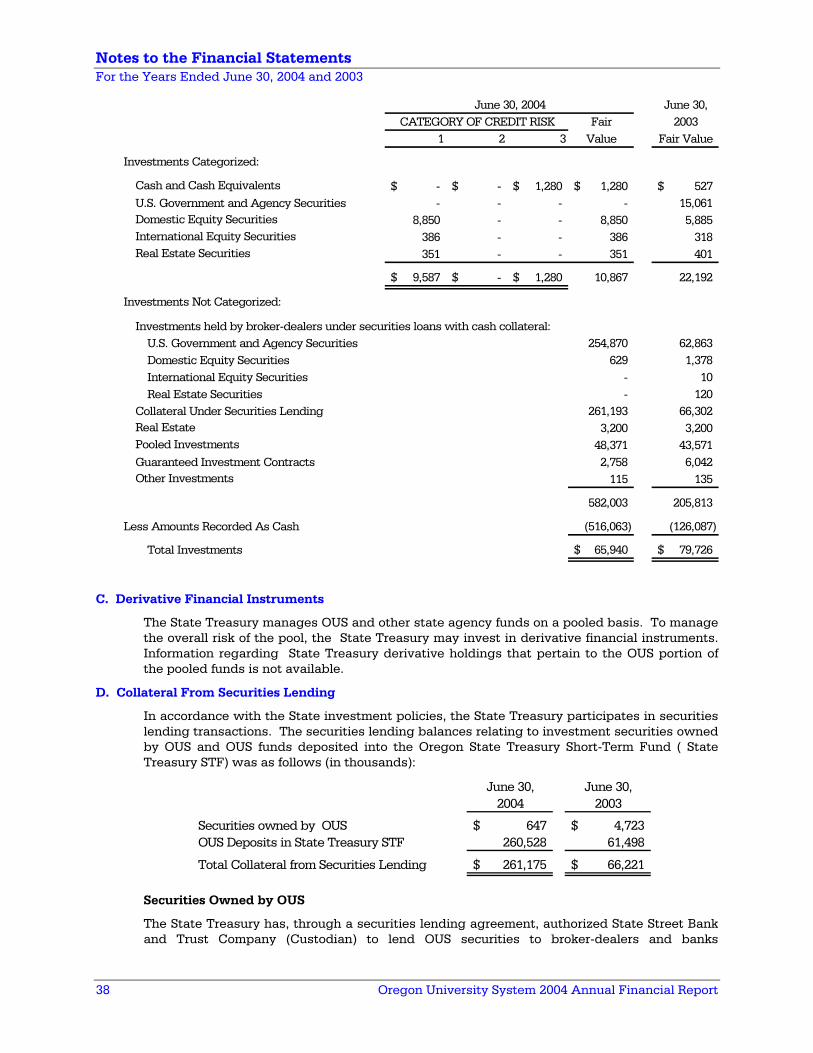
Notes to the Financial Statements For the Years Ended June 30, 2004 and 2003
38 Oregon University System 2004 Annual Financial Report
June 30,Fair 2003
1 2 3 Value Fair Value
Investments Categorized:
Cash and Cash Equivalents -$ -$ 1,280$ 1,280$ 527$ U.S. Government and Agency Securities - - - - 15,061 Domestic Equity Securities 8,850 - - 8,850 5,885 International Equity Securities 386 - - 386 318 Real Estate Securities 351 - - 351 401
9,587$ -$ 1,280$ 10,867 22,192
Investments Not Categorized:
Investments held by broker-dealers under securities loans with cash collateral: U.S. Government and Agency Securities 254,870 62,863 Domestic Equity Securities 629 1,378 International Equity Securities - 10 Real Estate Securities - 120
Collateral Under Securities Lending 261,193 66,302 Real Estate 3,200 3,200 Pooled Investments 48,371 43,571 Guaranteed Investment Contracts 2,758 6,042 Other Investments 115 135
582,003 205,813
Less Amounts Recorded As Cash (516,063) (126,087)
Total Investments 65,940$ 79,726$
June 30, 2004CATEGORY OF CREDIT RISK
C. Derivative Financial Instruments
The State Treasury manages OUS and other state agency funds on a pooled basis. To manage the overall risk of the pool, the State Treasury may invest in derivative financial instruments. Information regarding State Treasury derivative holdings that pertain to the OUS portion of the pooled funds is not available.
D. Collateral From Securities Lending
In accordance with the State investment policies, the State Treasury participates in securities lending transactions. The securities lending balances relating to investment securities owned by OUS and OUS funds deposited into the Oregon State Treasury Short-Term Fund ( State Treasury STF) was as follows (in thousands):
June 30, June 30,2004 2003
Securities owned by OUS 647$ 4,723$ OUS Deposits in State Treasury STF 260,528 61,498
Total Collateral from Securities Lending 261,175$ 66,221$
Securities Owned by OUS
The State Treasury has, through a securities lending agreement, authorized State Street Bank and Trust Company (Custodian) to lend OUS securities to broker-dealers and banks
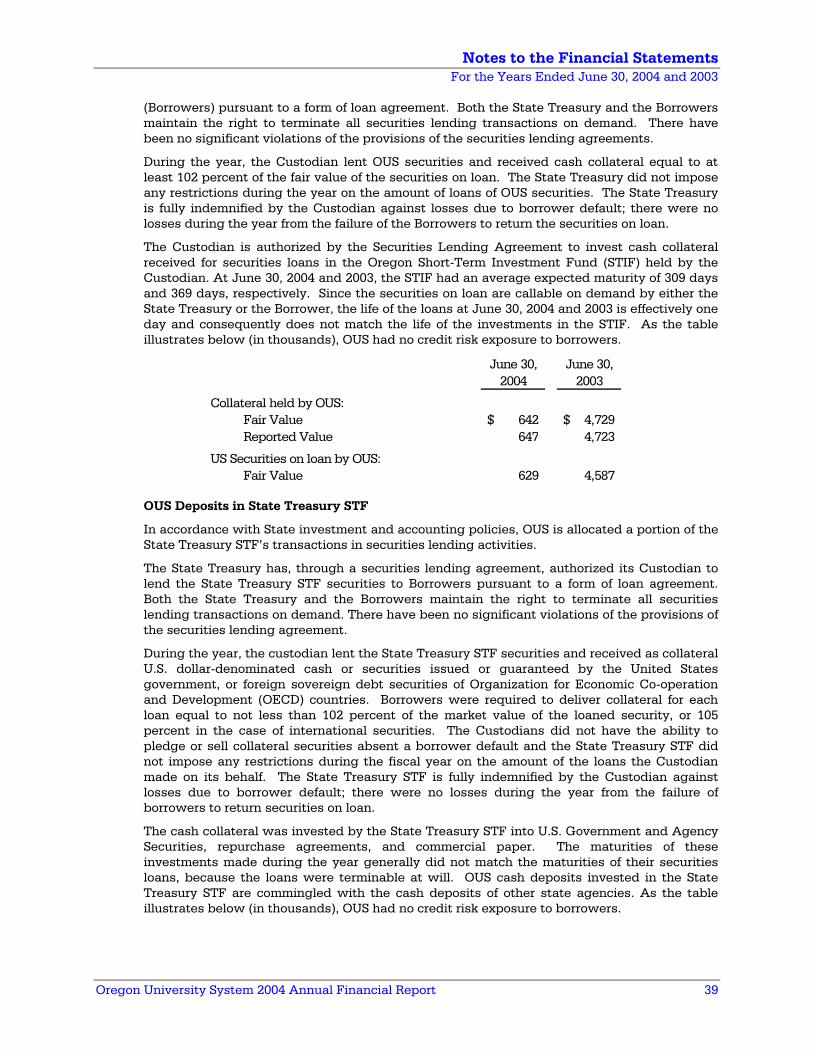
Notes to the Financial Statements For the Years Ended June 30, 2004 and 2003
Oregon University System 2004 Annual Financial Report 39
(Borrowers) pursuant to a form of loan agreement. Both the State Treasury and the Borrowers maintain the right to terminate all securities lending transactions on demand. There have been no significant violations of the provisions of the securities lending agreements.
During the year, the Custodian lent OUS securities and received cash collateral equal to at least 102 percent of the fair value of the securities on loan. The State Treasury did not impose any restrictions during the year on the amount of loans of OUS securities. The State Treasury is fully indemnified by the Custodian against losses due to borrower default; there were no losses during the year from the failure of the Borrowers to return the securities on loan.
The Custodian is authorized by the Securities Lending Agreement to invest cash collateral received for securities loans in the Oregon Short-Term Investment Fund (STIF) held by the Custodian. At June 30, 2004 and 2003, the STIF had an average expected maturity of 309 days and 369 days, respectively. Since the securities on loan are callable on demand by either the State Treasury or the Borrower, the life of the loans at June 30, 2004 and 2003 is effectively one day and consequently does not match the life of the investments in the STIF. As the table illustrates below (in thousands), OUS had no credit risk exposure to borrowers.
June 30, June 30,2004 2003
Collateral held by OUS:Fair Value 642$ 4,729$ Reported Value 647 4,723
US Securities on loan by OUS:Fair Value 629 4,587
OUS Deposits in State Treasury STF
In accordance with State investment and accounting policies, OUS is allocated a portion of the State Treasury STF’s transactions in securities lending activities.
The State Treasury has, through a securities lending agreement, authorized its Custodian to lend the State Treasury STF securities to Borrowers pursuant to a form of loan agreement. Both the State Treasury and the Borrowers maintain the right to terminate all securities lending transactions on demand. There have been no significant violations of the provisions of the securities lending agreement.
During the year, the custodian lent the State Treasury STF securities and received as collateral U.S. dollar-denominated cash or securities issued or guaranteed by the United States government, or foreign sovereign debt securities of Organization for Economic Co-operation and Development (OECD) countries. Borrowers were required to deliver collateral for each loan equal to not less than 102 percent of the market value of the loaned security, or 105 percent in the case of international securities. The Custodians did not have the ability to pledge or sell collateral securities absent a borrower default and the State Treasury STF did not impose any restrictions during the fiscal year on the amount of the loans the Custodian made on its behalf. The State Treasury STF is fully indemnified by the Custodian against losses due to borrower default; there were no losses during the year from the failure of borrowers to return securities on loan.
The cash collateral was invested by the State Treasury STF into U.S. Government and Agency Securities, repurchase agreements, and commercial paper. The maturities of these investments made during the year generally did not match the maturities of their securities loans, because the loans were terminable at will. OUS cash deposits invested in the State Treasury STF are commingled with the cash deposits of other state agencies. As the table illustrates below (in thousands), OUS had no credit risk exposure to borrowers.
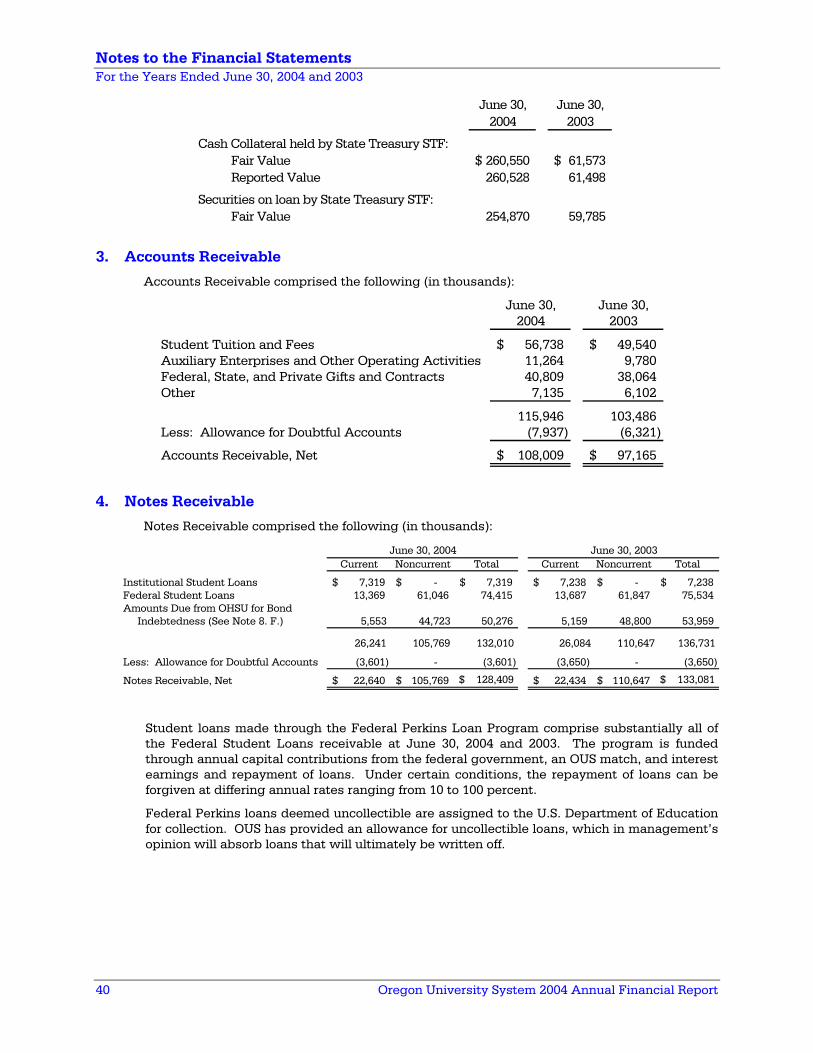
Notes to the Financial Statements For the Years Ended June 30, 2004 and 2003
40 Oregon University System 2004 Annual Financial Report
June 30, June 30,2004 2003
Cash Collateral held by State Treasury STF:Fair Value 260,550$ 61,573$ Reported Value 260,528 61,498
Securities on loan by State Treasury STF:Fair Value 254,870 59,785
3. Accounts Receivable
Accounts Receivable comprised the following (in thousands):
June 30, June 30,2004 2003
Student Tuition and Fees 56,738$ 49,540$ Auxiliary Enterprises and Other Operating Activities 11,264 9,780 Federal, State, and Private Gifts and Contracts 40,809 38,064 Other 7,135 6,102
115,946 103,486 Less: Allowance for Doubtful Accounts (7,937) (6,321)
Accounts Receivable, Net 108,009$ 97,165$
4. Notes Receivable
Notes Receivable comprised the following (in thousands):
Current Noncurrent Total Current Noncurrent Total
Institutional Student Loans 7,319$ -$ 7,319$ 7,238$ -$ 7,238$ Federal Student Loans 13,369 61,046 74,415 13,687 61,847 75,534 Amounts Due from OHSU for Bond Indebtedness (See Note 8. F.) 5,553 44,723 50,276 5,159 48,800 53,959
26,241 105,769 132,010 26,084 110,647 136,731
Less: Allowance for Doubtful Accounts (3,601) - (3,601) (3,650) - (3,650)
Notes Receivable, Net 22,640$ 105,769$ $ 128,409 22,434$ 110,647$ $ 133,081
June 30, 2004 June 30, 2003
Student loans made through the Federal Perkins Loan Program comprise substantially all of the Federal Student Loans receivable at June 30, 2004 and 2003. The program is funded through annual capital contributions from the federal government, an OUS match, and interest earnings and repayment of loans. Under certain conditions, the repayment of loans can be forgiven at differing annual rates ranging from 10 to 100 percent.
Federal Perkins loans deemed uncollectible are assigned to the U.S. Department of Education for collection. OUS has provided an allowance for uncollectible loans, which in management’s opinion will absorb loans that will ultimately be written off.
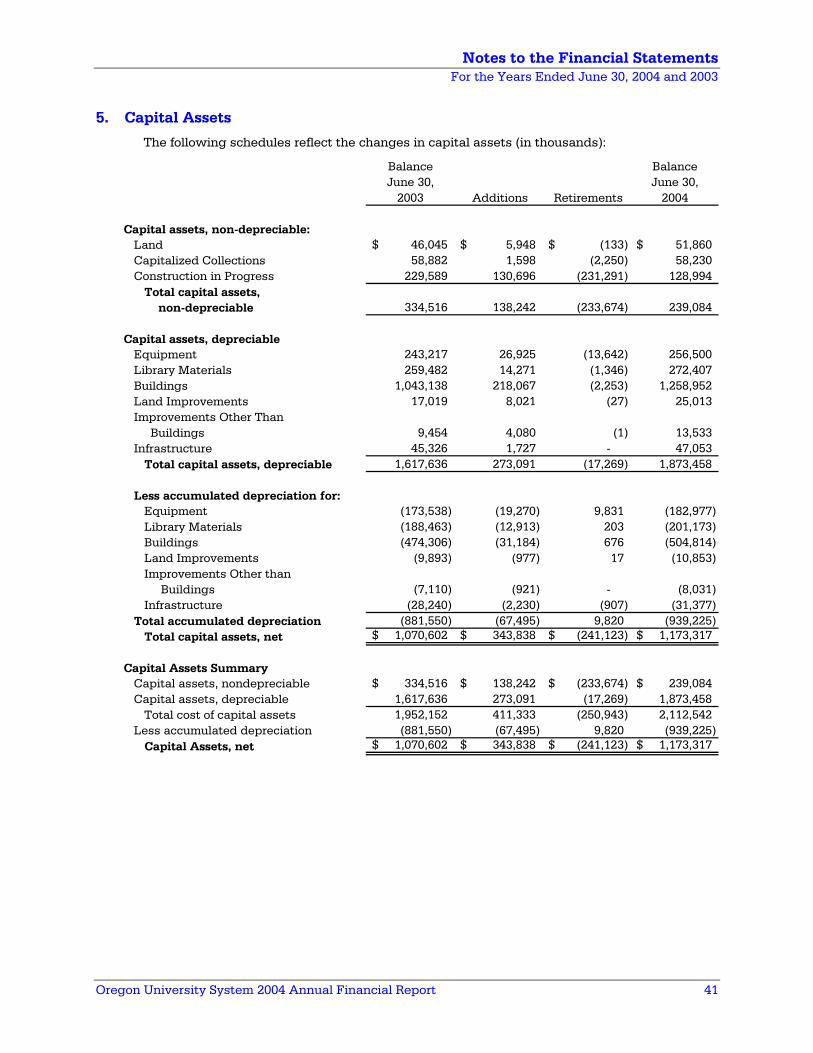
Notes to the Financial Statements For the Years Ended June 30, 2004 and 2003
Oregon University System 2004 Annual Financial Report 41
5. Capital Assets
The following schedules reflect the changes in capital assets (in thousands):
Balance BalanceJune 30, June 30,
2003 Additions Retirements 2004
Capital assets, non-depreciable:Land 46,045$ 5,948$ (133)$ 51,860$ Capitalized Collections 58,882 1,598 (2,250) 58,230 Construction in Progress 229,589 130,696 (231,291) 128,994
Total capital assets, non-depreciable 334,516 138,242 (233,674) 239,084
Capital assets, depreciableEquipment 243,217 26,925 (13,642) 256,500 Library Materials 259,482 14,271 (1,346) 272,407 Buildings 1,043,138 218,067 (2,253) 1,258,952 Land Improvements 17,019 8,021 (27) 25,013 Improvements Other Than Buildings 9,454 4,080 (1) 13,533 Infrastructure 45,326 1,727 - 47,053
Total capital assets, depreciable 1,617,636 273,091 (17,269) 1,873,458
Less accumulated depreciation for:Equipment (173,538) (19,270) 9,831 (182,977) Library Materials (188,463) (12,913) 203 (201,173) Buildings (474,306) (31,184) 676 (504,814) Land Improvements (9,893) (977) 17 (10,853) Improvements Other than Buildings (7,110) (921) - (8,031) Infrastructure (28,240) (2,230) (907) (31,377)
Total accumulated depreciation (881,550) (67,495) 9,820 (939,225) Total capital assets, net 1,070,602$ 343,838$ (241,123)$ 1,173,317$
Capital Assets SummaryCapital assets, nondepreciable 334,516$ 138,242$ (233,674)$ 239,084$ Capital assets, depreciable 1,617,636 273,091 (17,269) 1,873,458
Total cost of capital assets 1,952,152 411,333 (250,943) 2,112,542 Less accumulated depreciation (881,550) (67,495) 9,820 (939,225)
Capital Assets, net 1,070,602$ 343,838$ (241,123)$ 1,173,317$
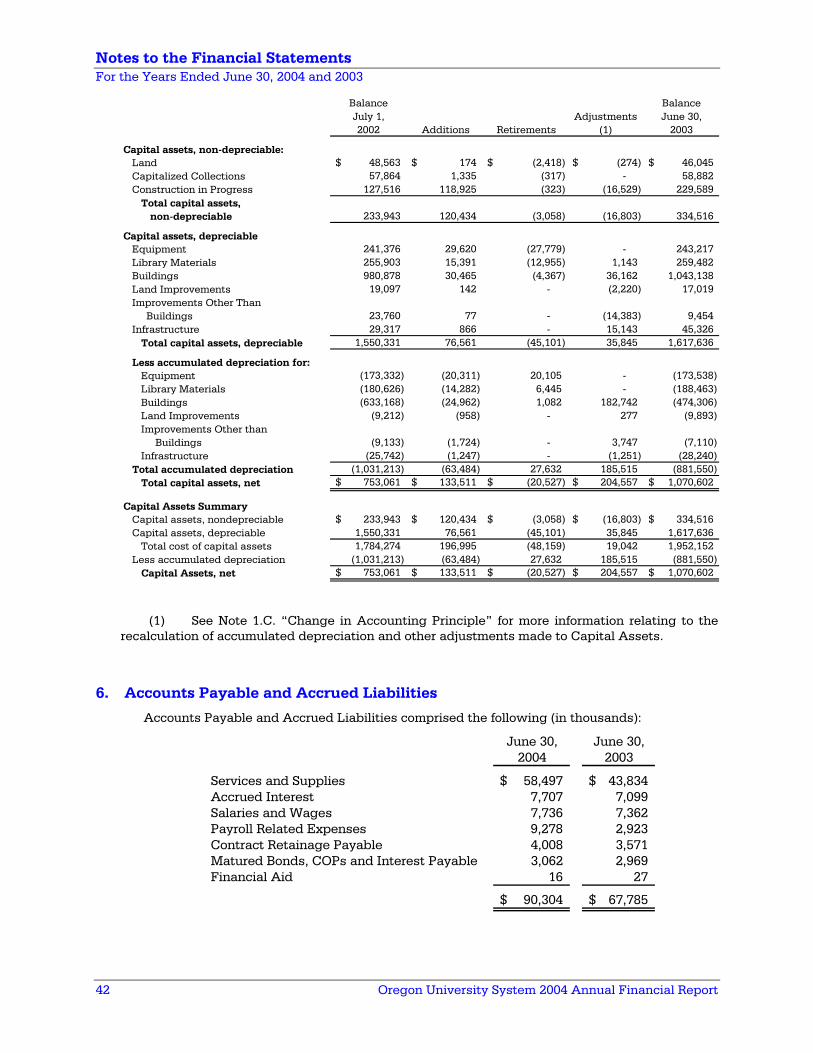
Notes to the Financial Statements For the Years Ended June 30, 2004 and 2003
42 Oregon University System 2004 Annual Financial Report
Balance BalanceJuly 1, Adjustments June 30,2002 Additions Retirements (1) 2003
Capital assets, non-depreciable:Land 48,563$ 174$ (2,418)$ (274)$ 46,045$ Capitalized Collections 57,864 1,335 (317) - 58,882 Construction in Progress 127,516 118,925 (323) (16,529) 229,589
Total capital assets, non-depreciable 233,943 120,434 (3,058) (16,803) 334,516
Capital assets, depreciableEquipment 241,376 29,620 (27,779) - 243,217 Library Materials 255,903 15,391 (12,955) 1,143 259,482 Buildings 980,878 30,465 (4,367) 36,162 1,043,138 Land Improvements 19,097 142 - (2,220) 17,019 Improvements Other Than Buildings 23,760 77 - (14,383) 9,454 Infrastructure 29,317 866 - 15,143 45,326
Total capital assets, depreciable 1,550,331 76,561 (45,101) 35,845 1,617,636
Less accumulated depreciation for:Equipment (173,332) (20,311) 20,105 - (173,538) Library Materials (180,626) (14,282) 6,445 - (188,463) Buildings (633,168) (24,962) 1,082 182,742 (474,306) Land Improvements (9,212) (958) - 277 (9,893) Improvements Other than Buildings (9,133) (1,724) - 3,747 (7,110) Infrastructure (25,742) (1,247) - (1,251) (28,240)
Total accumulated depreciation (1,031,213) (63,484) 27,632 185,515 (881,550) Total capital assets, net 753,061$ 133,511$ (20,527)$ 204,557$ 1,070,602$
Capital Assets SummaryCapital assets, nondepreciable 233,943$ 120,434$ (3,058)$ (16,803)$ 334,516$ Capital assets, depreciable 1,550,331 76,561 (45,101) 35,845 1,617,636
Total cost of capital assets 1,784,274 196,995 (48,159) 19,042 1,952,152 Less accumulated depreciation (1,031,213) (63,484) 27,632 185,515 (881,550)
Capital Assets, net 753,061$ 133,511$ (20,527)$ 204,557$ 1,070,602$
(1) See Note 1.C. “Change in Accounting Principle” for more information relating to the recalculation of accumulated depreciation and other adjustments made to Capital Assets.
6. Accounts Payable and Accrued Liabilities
Accounts Payable and Accrued Liabilities comprised the following (in thousands):
June 30, June 30,2004 2003
Services and Supplies 58,497$ 43,834$ Accrued Interest 7,707 7,099 Salaries and Wages 7,736 7,362Payroll Related Expenses 9,278 2,923 Contract Retainage Payable 4,008 3,571 Matured Bonds, COPs and Interest Payable 3,062 2,969 Financial Aid 16 27
90,304$ 67,785$
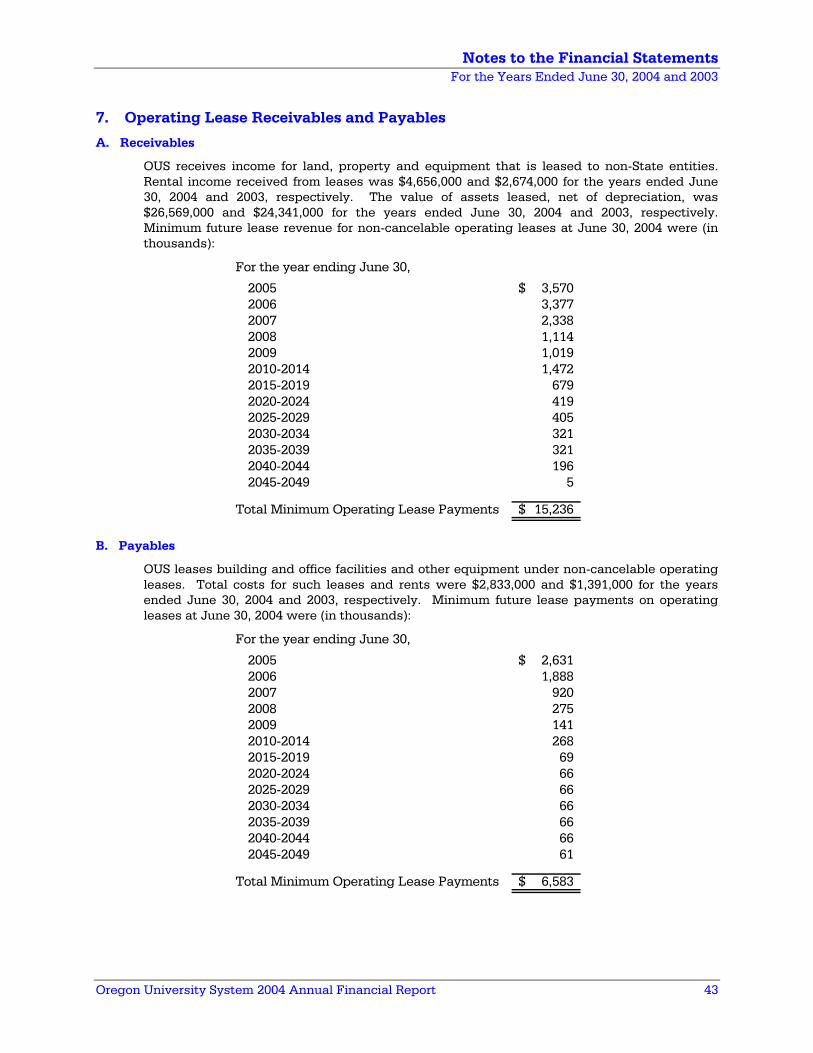
Notes to the Financial Statements For the Years Ended June 30, 2004 and 2003
Oregon University System 2004 Annual Financial Report 43
7. Operating Lease Receivables and Payables
A. Receivables
OUS receives income for land, property and equipment that is leased to non-State entities. Rental income received from leases was $4,656,000 and $2,674,000 for the years ended June 30, 2004 and 2003, respectively. The value of assets leased, net of depreciation, was $26,569,000 and $24,341,000 for the years ended June 30, 2004 and 2003, respectively. Minimum future lease revenue for non-cancelable operating leases at June 30, 2004 were (in thousands):
For the year ending June 30,
2005 3,570$ 2006 3,377 2007 2,338 2008 1,114 2009 1,019 2010-2014 1,472 2015-2019 679 2020-2024 419 2025-2029 405 2030-2034 321 2035-2039 321 2040-2044 196 2045-2049 5
Total Minimum Operating Lease Payments 15,236$
B. Payables
OUS leases building and office facilities and other equipment under non-cancelable operating leases. Total costs for such leases and rents were $2,833,000 and $1,391,000 for the years ended June 30, 2004 and 2003, respectively. Minimum future lease payments on operating leases at June 30, 2004 were (in thousands):
For the year ending June 30,
2005 2,631$ 2006 1,888 2007 920 2008 275 2009 141 2010-2014 268 2015-2019 69 2020-2024 66 2025-2029 66 2030-2034 66 2035-2039 66 2040-2044 66 2045-2049 61
Total Minimum Operating Lease Payments 6,583$
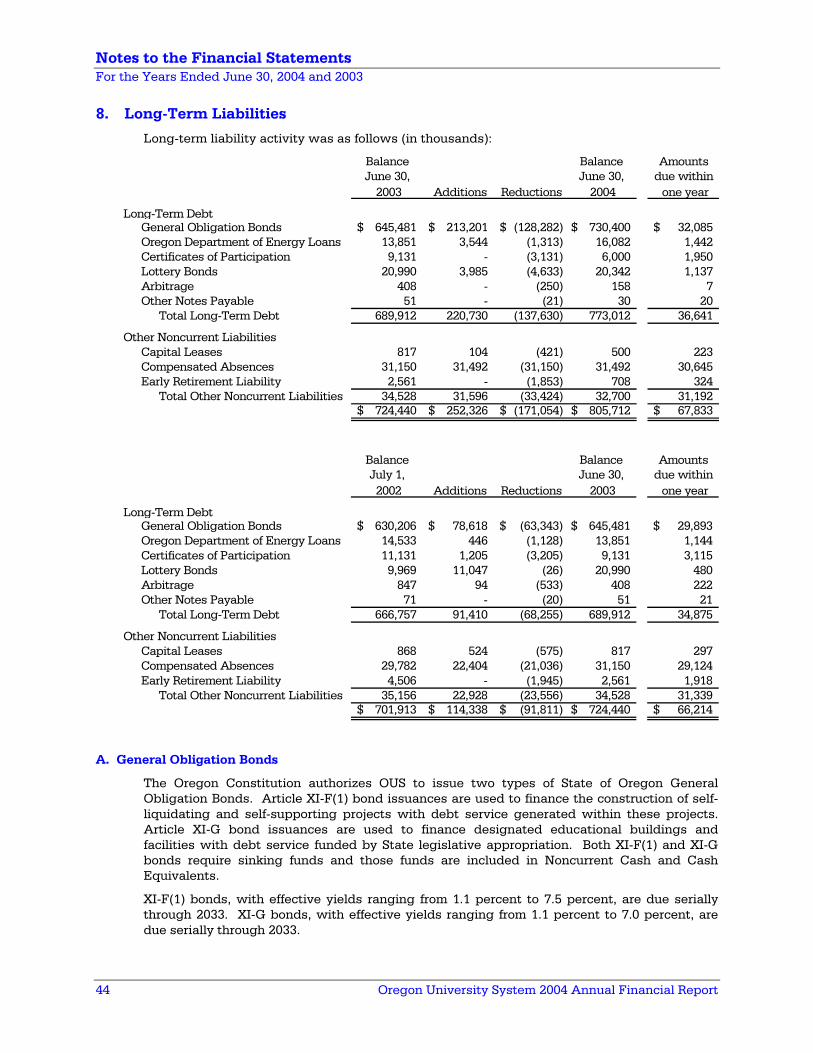
Notes to the Financial Statements For the Years Ended June 30, 2004 and 2003
44 Oregon University System 2004 Annual Financial Report
8. Long-Term Liabilities
Long-term liability activity was as follows (in thousands):
Balance Balance AmountsJune 30, June 30, due within
2003 Additions Reductions 2004 one year
Long-Term DebtGeneral Obligation Bonds 645,481$ 213,201$ (128,282)$ 730,400$ 32,085$ Oregon Department of Energy Loans 13,851 3,544 (1,313) 16,082 1,442 Certificates of Participation 9,131 - (3,131) 6,000 1,950 Lottery Bonds 20,990 3,985 (4,633) 20,342 1,137 Arbitrage 408 - (250) 158 7 Other Notes Payable 51 - (21) 30 20
Total Long-Term Debt 689,912 220,730 (137,630) 773,012 36,641
Other Noncurrent LiabilitiesCapital Leases 817 104 (421) 500 223 Compensated Absences 31,150 31,492 (31,150) 31,492 30,645 Early Retirement Liability 2,561 - (1,853) 708 324
Total Other Noncurrent Liabilities 34,528 31,596 (33,424) 32,700 31,192 724,440$ 252,326$ (171,054)$ 805,712$ 67,833$
Balance Balance AmountsJuly 1, June 30, due within 2002 Additions Reductions 2003 one year
Long-Term DebtGeneral Obligation Bonds 630,206$ 78,618$ (63,343)$ 645,481$ 29,893$ Oregon Department of Energy Loans 14,533 446 (1,128) 13,851 1,144 Certificates of Participation 11,131 1,205 (3,205) 9,131 3,115 Lottery Bonds 9,969 11,047 (26) 20,990 480 Arbitrage 847 94 (533) 408 222 Other Notes Payable 71 - (20) 51 21
Total Long-Term Debt 666,757 91,410 (68,255) 689,912 34,875
Other Noncurrent LiabilitiesCapital Leases 868 524 (575) 817 297 Compensated Absences 29,782 22,404 (21,036) 31,150 29,124 Early Retirement Liability 4,506 - (1,945) 2,561 1,918
Total Other Noncurrent Liabilities 35,156 22,928 (23,556) 34,528 31,339 701,913$ 114,338$ (91,811)$ 724,440$ 66,214$
A. General Obligation Bonds
The Oregon Constitution authorizes OUS to issue two types of State of Oregon General Obligation Bonds. Article XI-F(1) bond issuances are used to finance the construction of self-liquidating and self-supporting projects with debt service generated within these projects. Article XI-G bond issuances are used to finance designated educational buildings and facilities with debt service funded by State legislative appropriation. Both XI-F(1) and XI-G bonds require sinking funds and those funds are included in Noncurrent Cash and Cash Equivalents.
XI-F(1) bonds, with effective yields ranging from 1.1 percent to 7.5 percent, are due serially through 2033. XI-G bonds, with effective yields ranging from 1.1 percent to 7.0 percent, are due serially through 2033.
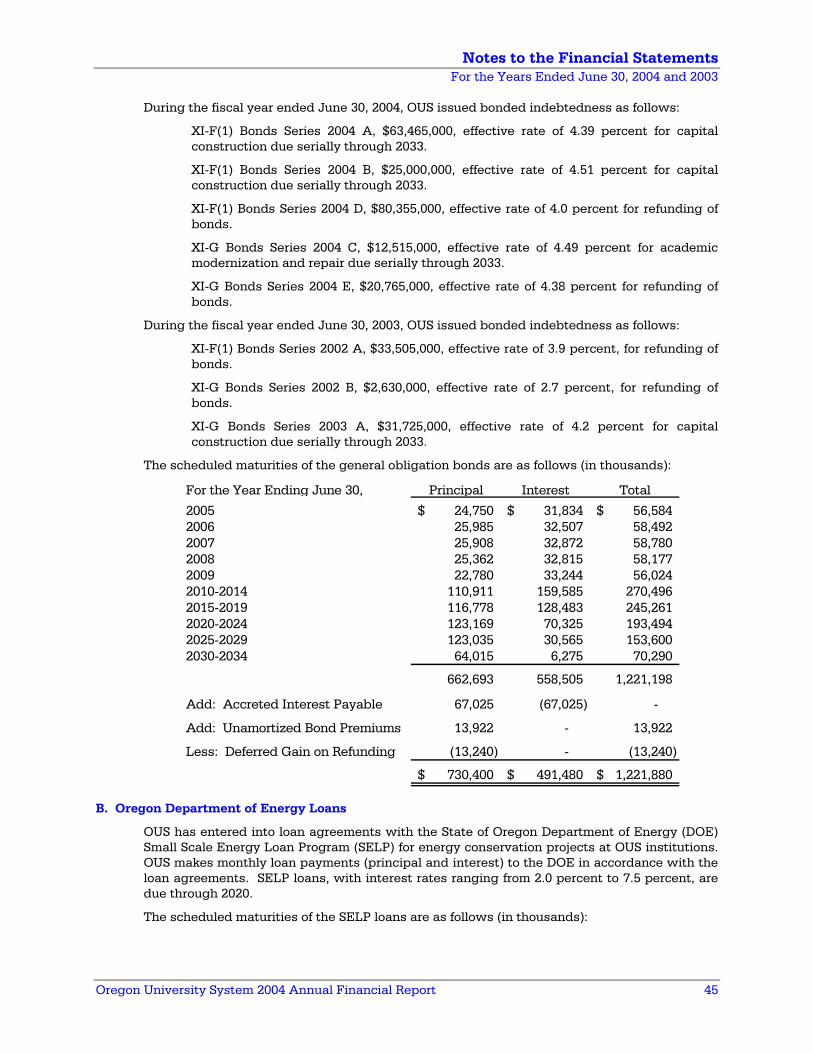
Notes to the Financial Statements For the Years Ended June 30, 2004 and 2003
Oregon University System 2004 Annual Financial Report 45
During the fiscal year ended June 30, 2004, OUS issued bonded indebtedness as follows:
XI-F(1) Bonds Series 2004 A, $63,465,000, effective rate of 4.39 percent for capital construction due serially through 2033.
XI-F(1) Bonds Series 2004 B, $25,000,000, effective rate of 4.51 percent for capital construction due serially through 2033.
XI-F(1) Bonds Series 2004 D, $80,355,000, effective rate of 4.0 percent for refunding of bonds.
XI-G Bonds Series 2004 C, $12,515,000, effective rate of 4.49 percent for academic modernization and repair due serially through 2033.
XI-G Bonds Series 2004 E, $20,765,000, effective rate of 4.38 percent for refunding of bonds.
During the fiscal year ended June 30, 2003, OUS issued bonded indebtedness as follows:
XI-F(1) Bonds Series 2002 A, $33,505,000, effective rate of 3.9 percent, for refunding of bonds.
XI-G Bonds Series 2002 B, $2,630,000, effective rate of 2.7 percent, for refunding of bonds.
XI-G Bonds Series 2003 A, $31,725,000, effective rate of 4.2 percent for capital construction due serially through 2033.
The scheduled maturities of the general obligation bonds are as follows (in thousands):
For the Year Ending June 30, Principal Interest Total
2005 24,750$ 31,834$ 56,584$ 2006 25,985 32,507 58,492 2007 25,908 32,872 58,780 2008 25,362 32,815 58,177 2009 22,780 33,244 56,024 2010-2014 110,911 159,585 270,496 2015-2019 116,778 128,483 245,261 2020-2024 123,169 70,325 193,494 2025-2029 123,035 30,565 153,600 2030-2034 64,015 6,275 70,290
662,693 558,505 1,221,198
Add: Accreted Interest Payable 67,025 (67,025) -
Add: Unamortized Bond Premiums 13,922 - 13,922
Less: Deferred Gain on Refunding (13,240) - (13,240)
730,400$ 491,480$ 1,221,880$
B. Oregon Department of Energy Loans
OUS has entered into loan agreements with the State of Oregon Department of Energy (DOE) Small Scale Energy Loan Program (SELP) for energy conservation projects at OUS institutions. OUS makes monthly loan payments (principal and interest) to the DOE in accordance with the loan agreements. SELP loans, with interest rates ranging from 2.0 percent to 7.5 percent, are due through 2020.
The scheduled maturities of the SELP loans are as follows (in thousands):
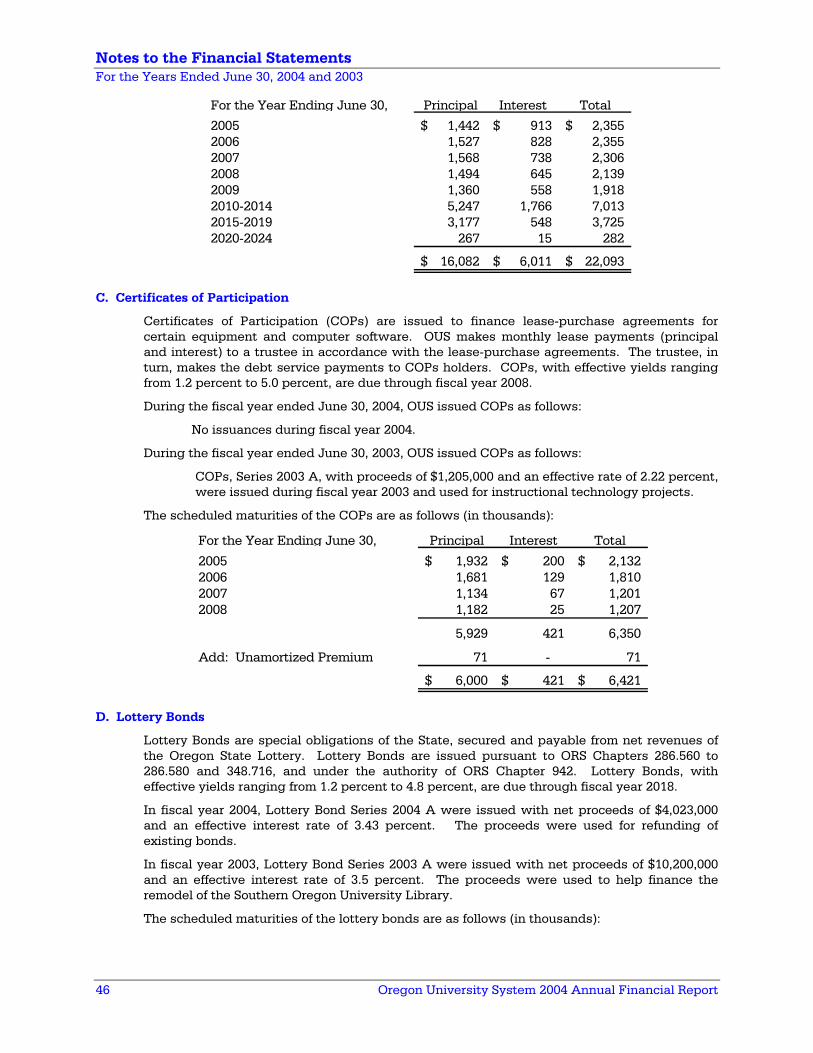
Notes to the Financial Statements For the Years Ended June 30, 2004 and 2003
46 Oregon University System 2004 Annual Financial Report
For the Year Ending June 30, Principal Interest Total
2005 1,442$ 913$ 2,355$ 2006 1,527 828 2,355 2007 1,568 738 2,306 2008 1,494 645 2,139 2009 1,360 558 1,918 2010-2014 5,247 1,766 7,013 2015-2019 3,177 548 3,725 2020-2024 267 15 282
16,082$ 6,011$ 22,093$
C. Certificates of Participation
Certificates of Participation (COPs) are issued to finance lease-purchase agreements for certain equipment and computer software. OUS makes monthly lease payments (principal and interest) to a trustee in accordance with the lease-purchase agreements. The trustee, in turn, makes the debt service payments to COPs holders. COPs, with effective yields ranging from 1.2 percent to 5.0 percent, are due through fiscal year 2008.
During the fiscal year ended June 30, 2004, OUS issued COPs as follows:
No issuances during fiscal year 2004.
During the fiscal year ended June 30, 2003, OUS issued COPs as follows:
COPs, Series 2003 A, with proceeds of $1,205,000 and an effective rate of 2.22 percent, were issued during fiscal year 2003 and used for instructional technology projects.
The scheduled maturities of the COPs are as follows (in thousands):
For the Year Ending June 30, Principal Interest Total
2005 1,932$ 200$ 2,132$ 2006 1,681 129 1,810 2007 1,134 67 1,201 2008 1,182 25 1,207
5,929 421 6,350
Add: Unamortized Premium 71 - 71
6,000$ 421$ 6,421$
D. Lottery Bonds
Lottery Bonds are special obligations of the State, secured and payable from net revenues of the Oregon State Lottery. Lottery Bonds are issued pursuant to ORS Chapters 286.560 to 286.580 and 348.716, and under the authority of ORS Chapter 942. Lottery Bonds, with effective yields ranging from 1.2 percent to 4.8 percent, are due through fiscal year 2018.
In fiscal year 2004, Lottery Bond Series 2004 A were issued with net proceeds of $4,023,000 and an effective interest rate of 3.43 percent. The proceeds were used for refunding of existing bonds.
In fiscal year 2003, Lottery Bond Series 2003 A were issued with net proceeds of $10,200,000 and an effective interest rate of 3.5 percent. The proceeds were used to help finance the remodel of the Southern Oregon University Library.
The scheduled maturities of the lottery bonds are as follows (in thousands):
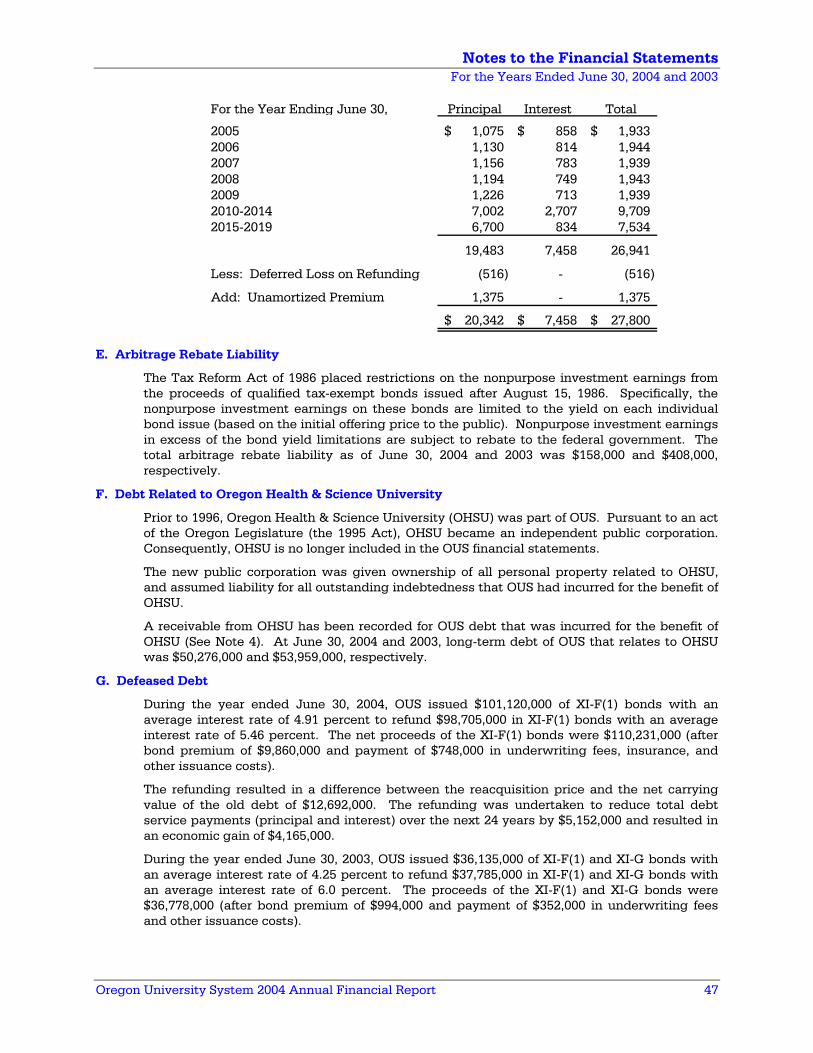
Notes to the Financial Statements For the Years Ended June 30, 2004 and 2003
Oregon University System 2004 Annual Financial Report 47
For the Year Ending June 30, Principal Interest Total
2005 1,075$ 858$ 1,933$ 2006 1,130 814 1,944 2007 1,156 783 1,939 2008 1,194 749 1,943 2009 1,226 713 1,939 2010-2014 7,002 2,707 9,709 2015-2019 6,700 834 7,534
19,483 7,458 26,941
Less: Deferred Loss on Refunding (516) - (516)
Add: Unamortized Premium 1,375 - 1,375
20,342$ 7,458$ 27,800$
E. Arbitrage Rebate Liability
The Tax Reform Act of 1986 placed restrictions on the nonpurpose investment earnings from the proceeds of qualified tax-exempt bonds issued after August 15, 1986. Specifically, the nonpurpose investment earnings on these bonds are limited to the yield on each individual bond issue (based on the initial offering price to the public). Nonpurpose investment earnings in excess of the bond yield limitations are subject to rebate to the federal government. The total arbitrage rebate liability as of June 30, 2004 and 2003 was $158,000 and $408,000, respectively.
F. Debt Related to Oregon Health & Science University
Prior to 1996, Oregon Health & Science University (OHSU) was part of OUS. Pursuant to an act of the Oregon Legislature (the 1995 Act), OHSU became an independent public corporation. Consequently, OHSU is no longer included in the OUS financial statements.
The new public corporation was given ownership of all personal property related to OHSU, and assumed liability for all outstanding indebtedness that OUS had incurred for the benefit of OHSU.
A receivable from OHSU has been recorded for OUS debt that was incurred for the benefit of OHSU (See Note 4). At June 30, 2004 and 2003, long-term debt of OUS that relates to OHSU was $50,276,000 and $53,959,000, respectively.
G. Defeased Debt
During the year ended June 30, 2004, OUS issued $101,120,000 of XI-F(1) bonds with an average interest rate of 4.91 percent to refund $98,705,000 in XI-F(1) bonds with an average interest rate of 5.46 percent. The net proceeds of the XI-F(1) bonds were $110,231,000 (after bond premium of $9,860,000 and payment of $748,000 in underwriting fees, insurance, and other issuance costs).
The refunding resulted in a difference between the reacquisition price and the net carrying value of the old debt of $12,692,000. The refunding was undertaken to reduce total debt service payments (principal and interest) over the next 24 years by $5,152,000 and resulted in an economic gain of $4,165,000.
During the year ended June 30, 2003, OUS issued $36,135,000 of XI-F(1) and XI-G bonds with an average interest rate of 4.25 percent to refund $37,785,000 in XI-F(1) and XI-G bonds with an average interest rate of 6.0 percent. The proceeds of the XI-F(1) and XI-G bonds were $36,778,000 (after bond premium of $994,000 and payment of $352,000 in underwriting fees and other issuance costs).
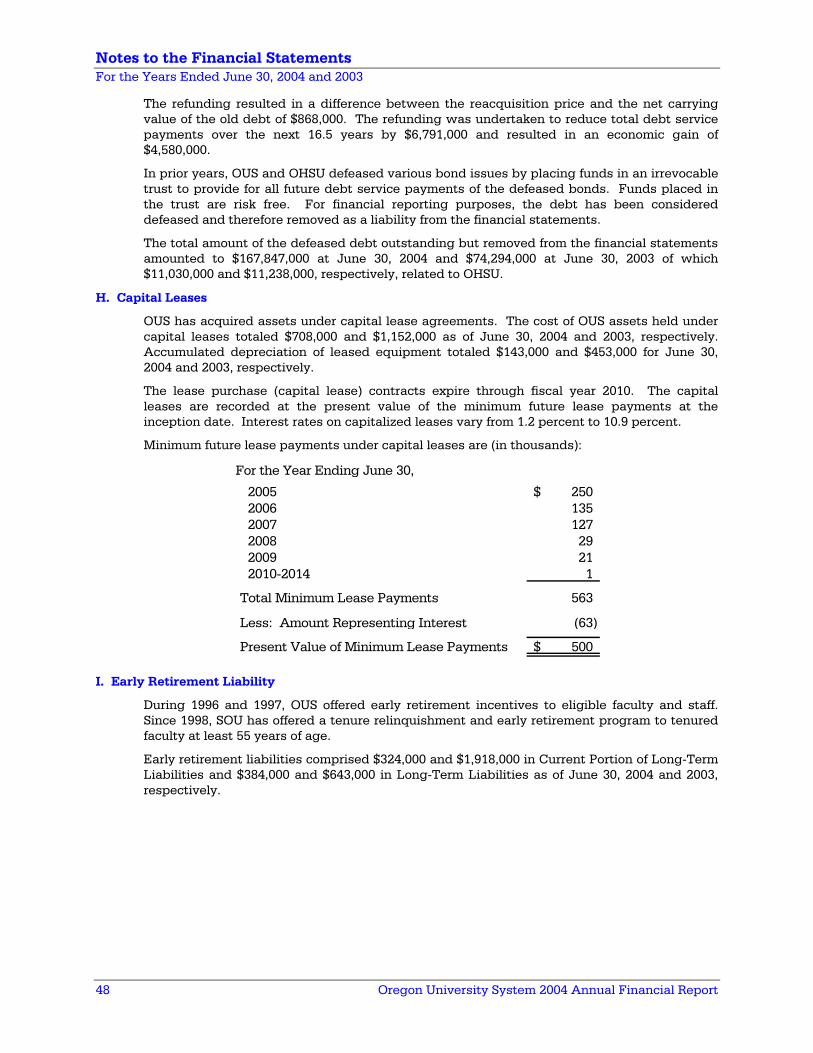
Notes to the Financial Statements For the Years Ended June 30, 2004 and 2003
48 Oregon University System 2004 Annual Financial Report
The refunding resulted in a difference between the reacquisition price and the net carrying value of the old debt of $868,000. The refunding was undertaken to reduce total debt service payments over the next 16.5 years by $6,791,000 and resulted in an economic gain of $4,580,000.
In prior years, OUS and OHSU defeased various bond issues by placing funds in an irrevocable trust to provide for all future debt service payments of the defeased bonds. Funds placed in the trust are risk free. For financial reporting purposes, the debt has been considered defeased and therefore removed as a liability from the financial statements.
The total amount of the defeased debt outstanding but removed from the financial statements amounted to $167,847,000 at June 30, 2004 and $74,294,000 at June 30, 2003 of which $11,030,000 and $11,238,000, respectively, related to OHSU.
H. Capital Leases
OUS has acquired assets under capital lease agreements. The cost of OUS assets held under capital leases totaled $708,000 and $1,152,000 as of June 30, 2004 and 2003, respectively. Accumulated depreciation of leased equipment totaled $143,000 and $453,000 for June 30, 2004 and 2003, respectively.
The lease purchase (capital lease) contracts expire through fiscal year 2010. The capital leases are recorded at the present value of the minimum future lease payments at the inception date. Interest rates on capitalized leases vary from 1.2 percent to 10.9 percent.
Minimum future lease payments under capital leases are (in thousands):
For the Year Ending June 30,
2005 250$ 2006 135 2007 127 2008 29 2009 21 2010-2014 1
Total Minimum Lease Payments 563
Less: Amount Representing Interest (63)
Present Value of Minimum Lease Payments 500$
I. Early Retirement Liability
During 1996 and 1997, OUS offered early retirement incentives to eligible faculty and staff. Since 1998, SOU has offered a tenure relinquishment and early retirement program to tenured faculty at least 55 years of age.
Early retirement liabilities comprised $324,000 and $1,918,000 in Current Portion of Long-Term Liabilities and $384,000 and $643,000 in Long-Term Liabilities as of June 30, 2004 and 2003, respectively.
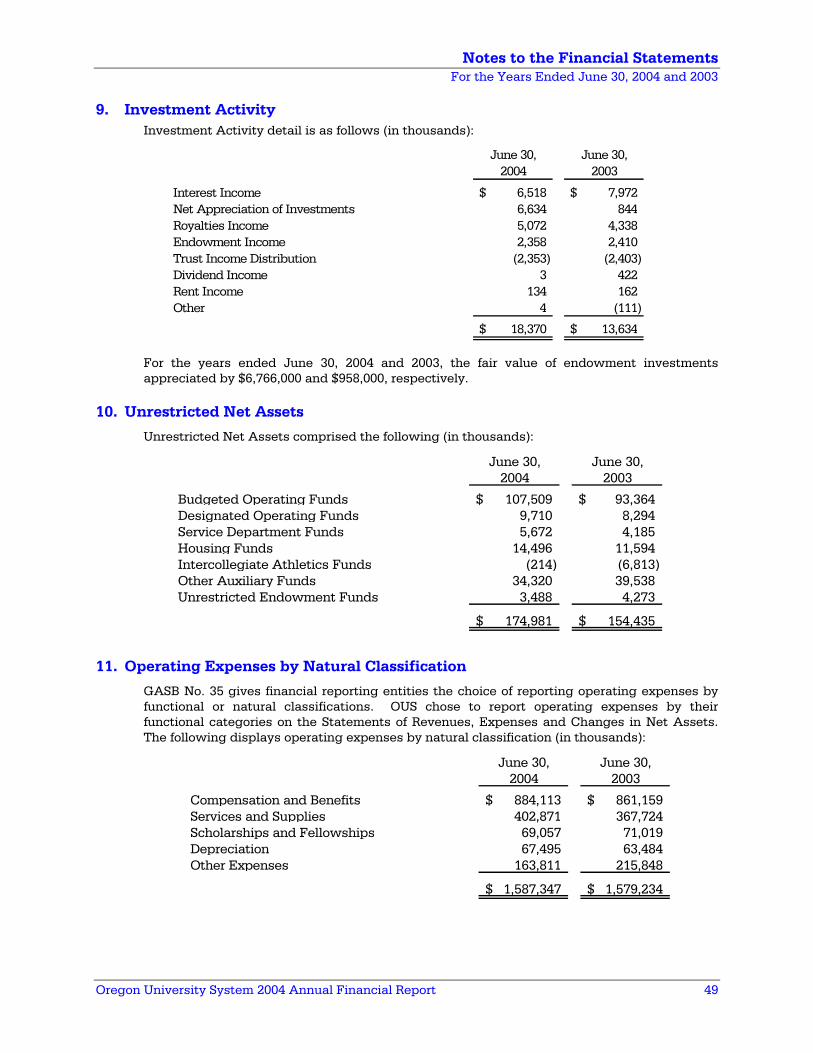
Notes to the Financial Statements For the Years Ended June 30, 2004 and 2003
Oregon University System 2004 Annual Financial Report 49
9. Investment Activity Investment Activity detail is as follows (in thousands):
June 30, June 30,2004 2003
Interest Income 6,518$ 7,972$ Net Appreciation of Investments 6,634 844 Royalties Income 5,072 4,338 Endowment Income 2,358 2,410 Trust Income Distribution (2,353) (2,403) Dividend Income 3 422 Rent Income 134 162 Other 4 (111)
18,370$ 13,634$
For the years ended June 30, 2004 and 2003, the fair value of endowment investments appreciated by $6,766,000 and $958,000, respectively.
10. Unrestricted Net Assets
Unrestricted Net Assets comprised the following (in thousands):
June 30, June 30,2004 2003
Budgeted Operating Funds 107,509$ 93,364$ Designated Operating Funds 9,710 8,294 Service Department Funds 5,672 4,185 Housing Funds 14,496 11,594 Intercollegiate Athletics Funds (214) (6,813) Other Auxiliary Funds 34,320 39,538 Unrestricted Endowment Funds 3,488 4,273
174,981$ 154,435$
11. Operating Expenses by Natural Classification
GASB No. 35 gives financial reporting entities the choice of reporting operating expenses by functional or natural classifications. OUS chose to report operating expenses by their functional categories on the Statements of Revenues, Expenses and Changes in Net Assets. The following displays operating expenses by natural classification (in thousands):
June 30, June 30,2004 2003
Compensation and Benefits 884,113$ 861,159$ Services and Supplies 402,871 367,724 Scholarships and Fellowships 69,057 71,019 Depreciation 67,495 63,484 Other Expenses 163,811 215,848
1,587,347$ 1,579,234$
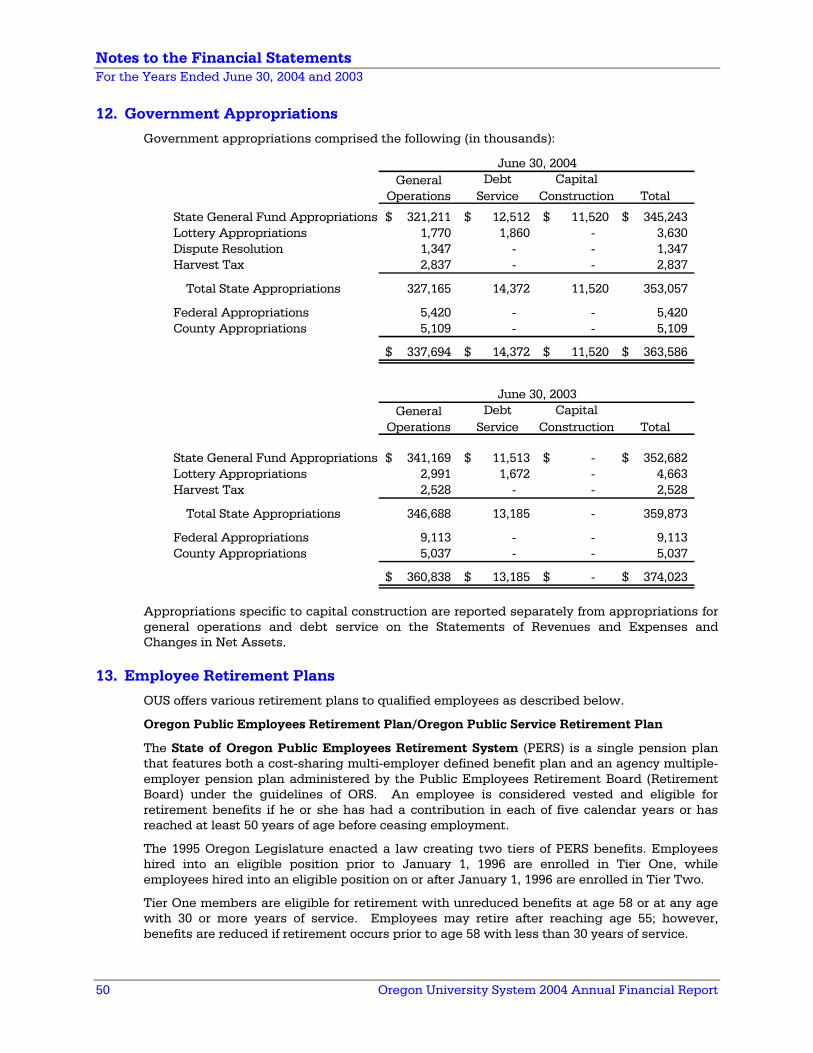
Notes to the Financial Statements For the Years Ended June 30, 2004 and 2003
50 Oregon University System 2004 Annual Financial Report
12. Government Appropriations
Government appropriations comprised the following (in thousands):
General Debt CapitalOperations Service Construction Total
State General Fund Appropriations 321,211$ 12,512$ 11,520$ 345,243$ Lottery Appropriations 1,770 1,860 - 3,630 Dispute Resolution 1,347 - - 1,347 Harvest Tax 2,837 - - 2,837
Total State Appropriations 327,165 14,372 11,520 353,057
Federal Appropriations 5,420 - - 5,420 County Appropriations 5,109 - - 5,109
337,694$ 14,372$ 11,520$ 363,586$
General Debt CapitalOperations Service Construction Total
State General Fund Appropriations 341,169$ 11,513$ -$ 352,682$ Lottery Appropriations 2,991 1,672 - 4,663 Harvest Tax 2,528 - - 2,528
Total State Appropriations 346,688 13,185 - 359,873
Federal Appropriations 9,113 - - 9,113 County Appropriations 5,037 - - 5,037
360,838$ 13,185$ -$ 374,023$
June 30, 2004
June 30, 2003
Appropriations specific to capital construction are reported separately from appropriations for general operations and debt service on the Statements of Revenues and Expenses and Changes in Net Assets.
13. Employee Retirement Plans
OUS offers various retirement plans to qualified employees as described below.
Oregon Public Employees Retirement Plan/Oregon Public Service Retirement Plan
The State of Oregon Public Employees Retirement System (PERS) is a single pension plan that features both a cost-sharing multi-employer defined benefit plan and an agency multiple-employer pension plan administered by the Public Employees Retirement Board (Retirement Board) under the guidelines of ORS. An employee is considered vested and eligible for retirement benefits if he or she has had a contribution in each of five calendar years or has reached at least 50 years of age before ceasing employment.
The 1995 Oregon Legislature enacted a law creating two tiers of PERS benefits. Employees hired into an eligible position prior to January 1, 1996 are enrolled in Tier One, while employees hired into an eligible position on or after January 1, 1996 are enrolled in Tier Two.
Tier One members are eligible for retirement with unreduced benefits at age 58 or at any age with 30 or more years of service. Employees may retire after reaching age 55; however, benefits are reduced if retirement occurs prior to age 58 with less than 30 years of service.
Notes to the Financial Statements For the Years Ended June 30, 2004 and 2003
Oregon University System 2004 Annual Financial Report 51
Tier Two members are eligible for retirement with unreduced benefits at age 60 or at any age with 30 or more years of service. Employees may retire after reaching age 55; however, benefits are reduced if retirement occurs prior to age 60 with less than 30 years of service.
PERS contribution requirements are established by ORS and may be amended by an act of the Oregon Legislature. PERS collects contributions from both employers and employees for the purpose of funding retirement benefits. Beginning July 1, 1979, the employee's contribution has been assumed and paid by the employer at the 6 percent rate set by law. The employer contribution rate from July 1, 2003 through October 31, 2003 was 11.79%. The employer contribution rate from November 1, 2003 through the year ended June 30, 2004 was 4.71 percent. The employer contribution rate through the year ended June 30, 2003 was 9.49 percent. OUS employer contributions to PERS for the years ending June 30, 2003, and 2002 were $36,370,000, and $35,746,000, respectively, equal to the required contributions for each year. See below for the employer contribution for PERS for the year ended June 30, 2004.
An actuarial valuation of PERS is performed every two years to determine the level of employer contributions. The most recently completed valuation was performed as of December 31, 2001. The valuation included projected salary increases at 4.25% percent in 2001.
The pension benefit obligation is a standardized disclosure measure of the present value of pension benefits. It is adjusted for the effects of projected salary increases estimated to be payable in the future as a result of employee service to date. The pension benefit obligation at December 31, 2001, for PERS as a whole, determined through an actuarial valuation performed as of that date, was $45.4 billion. PERS’ net assets available for benefits on that date (valued at market) were $39.8 billion. Information for OUS as a stand-alone entity is not available.
The ten-year historical trend information showing progress made in accumulating sufficient assets to pay benefits when due is presented in the separately issued PERS Component Unit Financial Report for the year ended June 30, 2004. The PERS defined benefit plan retirement plan is reported in a pension trust fund of the State. PERS issues a separate, publicly available financial report that includes audited financial statements and required supplementary information. That report may be obtained by writing to Fiscal Services Division, PERS, 11410 SW 68th Parkway, Tigard, OR, 97223 or by calling 1-888-320-7377 or 1-503-598-7377 (in Portland Metro area).
The Retirement Bond Debt Service Assessment was authorized by the State of Oregon Legislature in 2003 to sell general obligation bonds in the amount of $2 billion to pay a PERS unfunded actuarial liability. This action reduced the PERS contribution rate for PERS covered employers in November 2003.
The Oregon Department of Administrative Services is coordinating the debt service assessments to PERS employers to cover the bond debt service payments. PERS employers are assessed a percentage of PERS-subject payroll to fund the payments. The assessment rate will be adjusted biennially over the life of the twenty-four year debt repayment schedule.
The Oregon Public Service Retirement Plan (OPSRP) is a single pension plan that features both a defined benefit plan and a defined contribution plan administered by the Public Employees Retirement Board (Retirement Board) under the guidelines of ORS. An employee is considered vested and eligible for retirement benefits if he or she has had a contribution in each of five calendar years or has reached at least 50 years of age before ceasing employment.
The 2003 Oregon Legislature enacted a law creating OPSRP. Employees hired into eligible positions after August 29, 2003 are enrolled as well as PERS members who have a break in service.
OPSRP members are eligible for retirement with unreduced benefits at age 65 or age 58 with 30 or more years of service. Employees may retire after reaching age 55; however, benefits are reduced if retirement occurs prior to age 58 with less than 30 years of service.
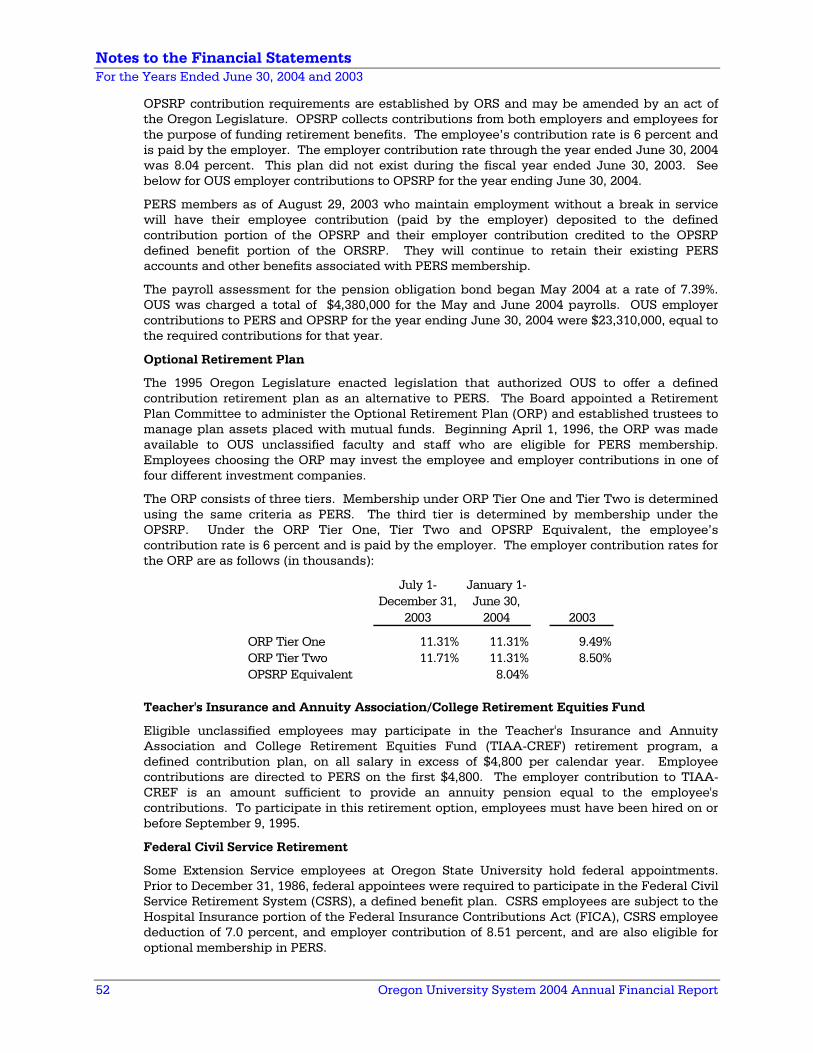
Notes to the Financial Statements For the Years Ended June 30, 2004 and 2003
52 Oregon University System 2004 Annual Financial Report
OPSRP contribution requirements are established by ORS and may be amended by an act of the Oregon Legislature. OPSRP collects contributions from both employers and employees for the purpose of funding retirement benefits. The employee’s contribution rate is 6 percent and is paid by the employer. The employer contribution rate through the year ended June 30, 2004 was 8.04 percent. This plan did not exist during the fiscal year ended June 30, 2003. See below for OUS employer contributions to OPSRP for the year ending June 30, 2004.
PERS members as of August 29, 2003 who maintain employment without a break in service will have their employee contribution (paid by the employer) deposited to the defined contribution portion of the OPSRP and their employer contribution credited to the OPSRP defined benefit portion of the ORSRP. They will continue to retain their existing PERS accounts and other benefits associated with PERS membership.
The payroll assessment for the pension obligation bond began May 2004 at a rate of 7.39%. OUS was charged a total of $4,380,000 for the May and June 2004 payrolls. OUS employer contributions to PERS and OPSRP for the year ending June 30, 2004 were $23,310,000, equal to the required contributions for that year.
Optional Retirement Plan
The 1995 Oregon Legislature enacted legislation that authorized OUS to offer a defined contribution retirement plan as an alternative to PERS. The Board appointed a Retirement Plan Committee to administer the Optional Retirement Plan (ORP) and established trustees to manage plan assets placed with mutual funds. Beginning April 1, 1996, the ORP was made available to OUS unclassified faculty and staff who are eligible for PERS membership. Employees choosing the ORP may invest the employee and employer contributions in one of four different investment companies.
The ORP consists of three tiers. Membership under ORP Tier One and Tier Two is determined using the same criteria as PERS. The third tier is determined by membership under the OPSRP. Under the ORP Tier One, Tier Two and OPSRP Equivalent, the employee’s contribution rate is 6 percent and is paid by the employer. The employer contribution rates for the ORP are as follows (in thousands):
July 1- January 1-December 31, June 30,
2003 2004 2003
ORP Tier One 11.31% 11.31% 9.49%ORP Tier Two 11.71% 11.31% 8.50%OPSRP Equivalent 8.04%
Teacher's Insurance and Annuity Association/College Retirement Equities Fund
Eligible unclassified employees may participate in the Teacher's Insurance and Annuity Association and College Retirement Equities Fund (TIAA-CREF) retirement program, a defined contribution plan, on all salary in excess of $4,800 per calendar year. Employee contributions are directed to PERS on the first $4,800. The employer contribution to TIAA-CREF is an amount sufficient to provide an annuity pension equal to the employee's contributions. To participate in this retirement option, employees must have been hired on or before September 9, 1995.
Federal Civil Service Retirement
Some Extension Service employees at Oregon State University hold federal appointments. Prior to December 31, 1986, federal appointees were required to participate in the Federal Civil Service Retirement System (CSRS), a defined benefit plan. CSRS employees are subject to the Hospital Insurance portion of the Federal Insurance Contributions Act (FICA), CSRS employee deduction of 7.0 percent, and employer contribution of 8.51 percent, and are also eligible for optional membership in PERS.
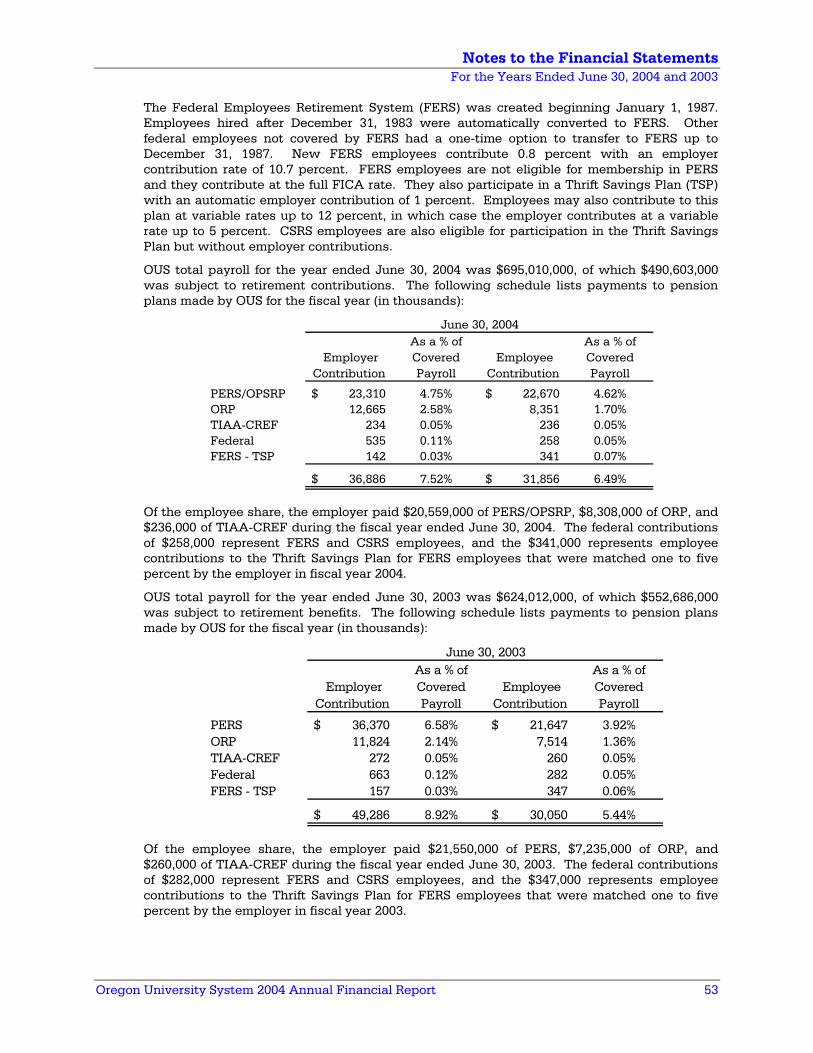
Notes to the Financial Statements For the Years Ended June 30, 2004 and 2003
Oregon University System 2004 Annual Financial Report 53
The Federal Employees Retirement System (FERS) was created beginning January 1, 1987. Employees hired after December 31, 1983 were automatically converted to FERS. Other federal employees not covered by FERS had a one-time option to transfer to FERS up to December 31, 1987. New FERS employees contribute 0.8 percent with an employer contribution rate of 10.7 percent. FERS employees are not eligible for membership in PERS and they contribute at the full FICA rate. They also participate in a Thrift Savings Plan (TSP) with an automatic employer contribution of 1 percent. Employees may also contribute to this plan at variable rates up to 12 percent, in which case the employer contributes at a variable rate up to 5 percent. CSRS employees are also eligible for participation in the Thrift Savings Plan but without employer contributions.
OUS total payroll for the year ended June 30, 2004 was $695,010,000, of which $490,603,000 was subject to retirement contributions. The following schedule lists payments to pension plans made by OUS for the fiscal year (in thousands):
Employer Contribution
As a % of Covered Payroll
Employee Contribution
As a % of Covered Payroll
PERS/OPSRP 23,310$ 4.75% 22,670$ 4.62%ORP 12,665 2.58% 8,351 1.70%TIAA-CREF 234 0.05% 236 0.05%Federal 535 0.11% 258 0.05%FERS - TSP 142 0.03% 341 0.07%
36,886$ 7.52% 31,856$ 6.49%
June 30, 2004
Of the employee share, the employer paid $20,559,000 of PERS/OPSRP, $8,308,000 of ORP, and $236,000 of TIAA-CREF during the fiscal year ended June 30, 2004. The federal contributions of $258,000 represent FERS and CSRS employees, and the $341,000 represents employee contributions to the Thrift Savings Plan for FERS employees that were matched one to five percent by the employer in fiscal year 2004.
OUS total payroll for the year ended June 30, 2003 was $624,012,000, of which $552,686,000 was subject to retirement benefits. The following schedule lists payments to pension plans made by OUS for the fiscal year (in thousands):
Employer Contribution
As a % of Covered Payroll
Employee Contribution
As a % of Covered Payroll
PERS 36,370$ 6.58% 21,647$ 3.92%ORP 11,824 2.14% 7,514 1.36%TIAA-CREF 272 0.05% 260 0.05%Federal 663 0.12% 282 0.05%FERS - TSP 157 0.03% 347 0.06%
49,286$ 8.92% 30,050$ 5.44%
June 30, 2003
Of the employee share, the employer paid $21,550,000 of PERS, $7,235,000 of ORP, and $260,000 of TIAA-CREF during the fiscal year ended June 30, 2003. The federal contributions of $282,000 represent FERS and CSRS employees, and the $347,000 represents employee contributions to the Thrift Savings Plan for FERS employees that were matched one to five percent by the employer in fiscal year 2003.
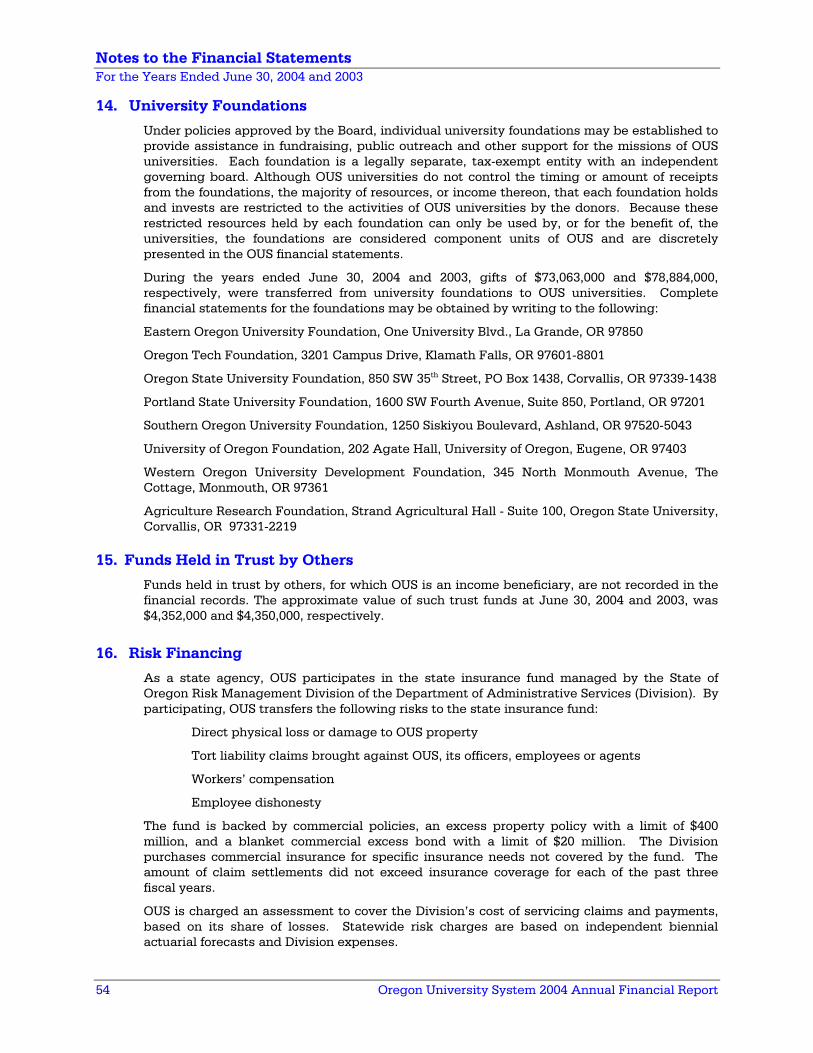
Notes to the Financial Statements For the Years Ended June 30, 2004 and 2003
54 Oregon University System 2004 Annual Financial Report
14. University Foundations
Under policies approved by the Board, individual university foundations may be established to provide assistance in fundraising, public outreach and other support for the missions of OUS universities. Each foundation is a legally separate, tax-exempt entity with an independent governing board. Although OUS universities do not control the timing or amount of receipts from the foundations, the majority of resources, or income thereon, that each foundation holds and invests are restricted to the activities of OUS universities by the donors. Because these restricted resources held by each foundation can only be used by, or for the benefit of, the universities, the foundations are considered component units of OUS and are discretely presented in the OUS financial statements.
During the years ended June 30, 2004 and 2003, gifts of $73,063,000 and $78,884,000, respectively, were transferred from university foundations to OUS universities. Complete financial statements for the foundations may be obtained by writing to the following:
Eastern Oregon University Foundation, One University Blvd., La Grande, OR 97850
Oregon Tech Foundation, 3201 Campus Drive, Klamath Falls, OR 97601-8801
Oregon State University Foundation, 850 SW 35th Street, PO Box 1438, Corvallis, OR 97339-1438
Portland State University Foundation, 1600 SW Fourth Avenue, Suite 850, Portland, OR 97201
Southern Oregon University Foundation, 1250 Siskiyou Boulevard, Ashland, OR 97520-5043
University of Oregon Foundation, 202 Agate Hall, University of Oregon, Eugene, OR 97403
Western Oregon University Development Foundation, 345 North Monmouth Avenue, The Cottage, Monmouth, OR 97361
Agriculture Research Foundation, Strand Agricultural Hall - Suite 100, Oregon State University, Corvallis, OR 97331-2219
15. Funds Held in Trust by Others
Funds held in trust by others, for which OUS is an income beneficiary, are not recorded in the financial records. The approximate value of such trust funds at June 30, 2004 and 2003, was $4,352,000 and $4,350,000, respectively.
16. Risk Financing
As a state agency, OUS participates in the state insurance fund managed by the State of Oregon Risk Management Division of the Department of Administrative Services (Division). By participating, OUS transfers the following risks to the state insurance fund:
Direct physical loss or damage to OUS property
Tort liability claims brought against OUS, its officers, employees or agents
Workers’ compensation
Employee dishonesty
The fund is backed by commercial policies, an excess property policy with a limit of $400 million, and a blanket commercial excess bond with a limit of $20 million. The Division purchases commercial insurance for specific insurance needs not covered by the fund. The amount of claim settlements did not exceed insurance coverage for each of the past three fiscal years.
OUS is charged an assessment to cover the Division’s cost of servicing claims and payments, based on its share of losses. Statewide risk charges are based on independent biennial actuarial forecasts and Division expenses.
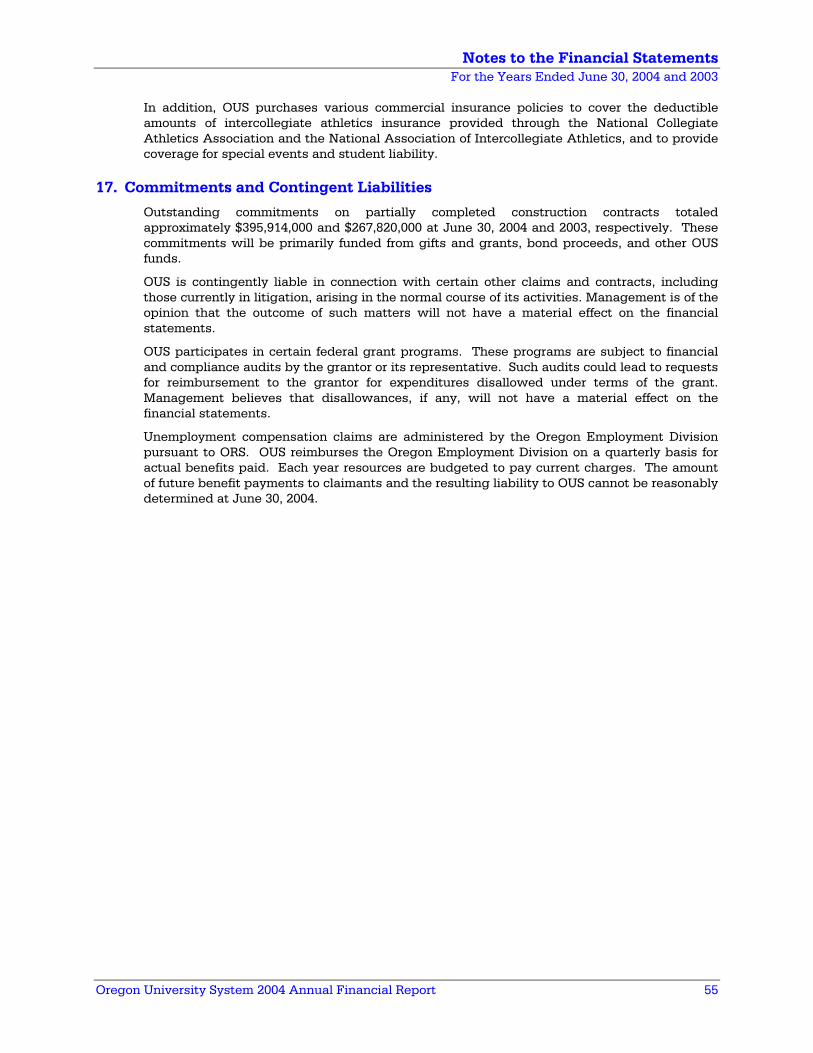
Notes to the Financial Statements For the Years Ended June 30, 2004 and 2003
Oregon University System 2004 Annual Financial Report 55
In addition, OUS purchases various commercial insurance policies to cover the deductible amounts of intercollegiate athletics insurance provided through the National Collegiate Athletics Association and the National Association of Intercollegiate Athletics, and to provide coverage for special events and student liability.
17. Commitments and Contingent Liabilities
Outstanding commitments on partially completed construction contracts totaled approximately $395,914,000 and $267,820,000 at June 30, 2004 and 2003, respectively. These commitments will be primarily funded from gifts and grants, bond proceeds, and other OUS funds.
OUS is contingently liable in connection with certain other claims and contracts, including those currently in litigation, arising in the normal course of its activities. Management is of the opinion that the outcome of such matters will not have a material effect on the financial statements.
OUS participates in certain federal grant programs. These programs are subject to financial and compliance audits by the grantor or its representative. Such audits could lead to requests for reimbursement to the grantor for expenditures disallowed under terms of the grant. Management believes that disallowances, if any, will not have a material effect on the financial statements.
Unemployment compensation claims are administered by the Oregon Employment Division pursuant to ORS. OUS reimburses the Oregon Employment Division on a quarterly basis for actual benefits paid. Each year resources are budgeted to pay current charges. The amount of future benefit payments to claimants and the resulting liability to OUS cannot be reasonably determined at June 30, 2004.
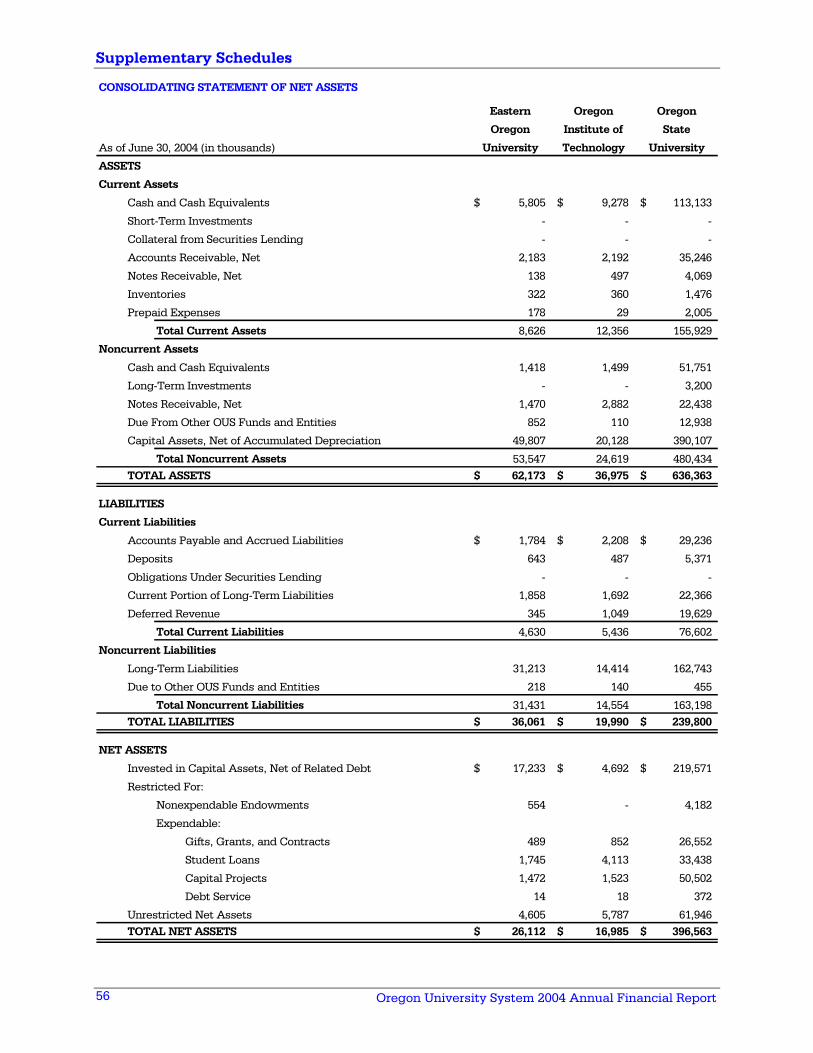
Supplementary Schedules
Oregon University System 2004 Annual Financial Report 56
Eastern Oregon Oregon
Oregon Institute of State
As of June 30, 2004 (in thousands) University Technology University
ASSETS
Current Assets
Cash and Cash Equivalents 5,805$ 9,278$ 113,133$
Short-Term Investments - - -
Collateral from Securities Lending - - -
Accounts Receivable, Net 2,183 2,192 35,246
Notes Receivable, Net 138 497 4,069
Inventories 322 360 1,476
Prepaid Expenses 178 29 2,005
Total Current Assets 8,626 12,356 155,929
Noncurrent Assets
Cash and Cash Equivalents 1,418 1,499 51,751
Long-Term Investments - - 3,200
Notes Receivable, Net 1,470 2,882 22,438
Due From Other OUS Funds and Entities 852 110 12,938
Capital Assets, Net of Accumulated Depreciation 49,807 20,128 390,107
Total Noncurrent Assets 53,547 24,619 480,434TOTAL ASSETS 62,173$ 36,975$ 636,363$
LIABILITIES
Current Liabilities
Accounts Payable and Accrued Liabilities 1,784$ 2,208$ 29,236$
Deposits 643 487 5,371
Obligations Under Securities Lending - - -
Current Portion of Long-Term Liabilities 1,858 1,692 22,366
Deferred Revenue 345 1,049 19,629
Total Current Liabilities 4,630 5,436 76,602
Noncurrent Liabilities
Long-Term Liabilities 31,213 14,414 162,743
Due to Other OUS Funds and Entities 218 140 455
Total Noncurrent Liabilities 31,431 14,554 163,198 TOTAL LIABILITIES 36,061$ 19,990$ 239,800$
NET ASSETS
Invested in Capital Assets, Net of Related Debt 17,233$ 4,692$ 219,571$
Restricted For:
Nonexpendable Endowments 554 - 4,182
Expendable:
Gifts, Grants, and Contracts 489 852 26,552
Student Loans 1,745 4,113 33,438
Capital Projects 1,472 1,523 50,502
Debt Service 14 18 372
Unrestricted Net Assets 4,605 5,787 61,946 TOTAL NET ASSETS 26,112$ 16,985$ 396,563$
CONSOLIDATING STATEMENT OF NET ASSETS
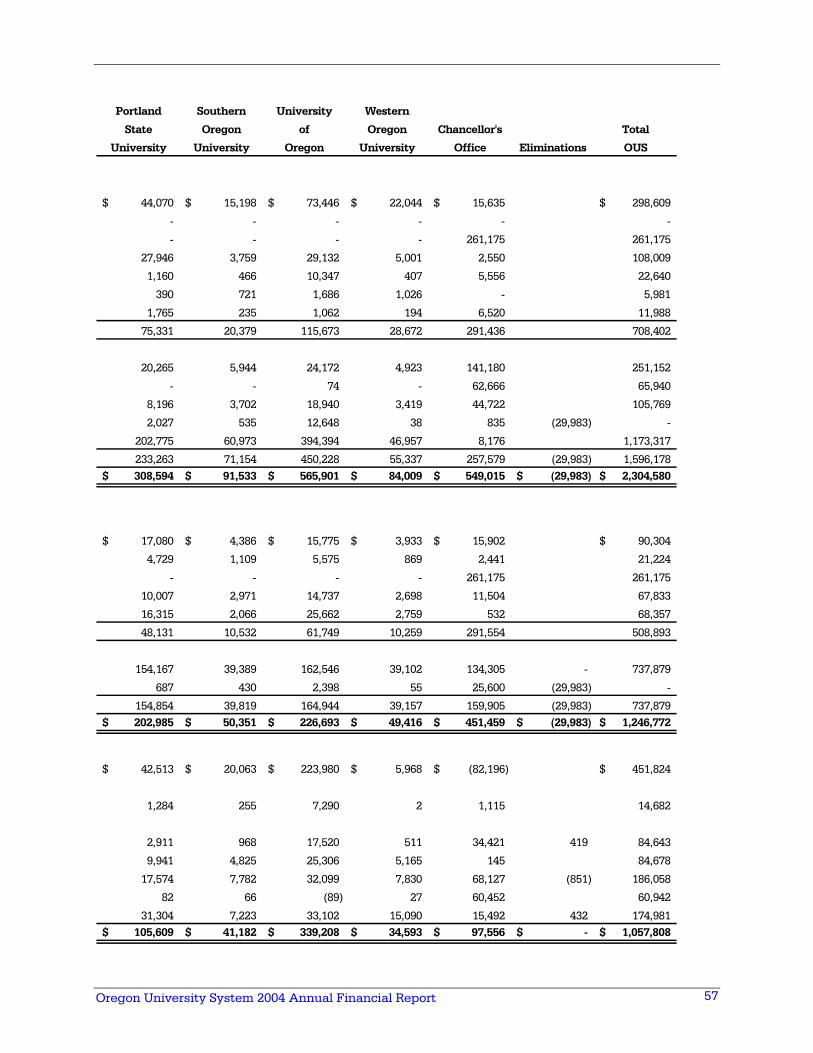
Oregon University System 2004 Annual Financial Report
57
Portland Southern University Western
State Oregon of Oregon Chancellor's Total
University University Oregon University Office Eliminations OUS
44,070$ 15,198$ 73,446$ 22,044$ 15,635$ 298,609$
- - - - - -
- - - - 261,175 261,175
27,946 3,759 29,132 5,001 2,550 108,009
1,160 466 10,347 407 5,556 22,640
390 721 1,686 1,026 - 5,981
1,765 235 1,062 194 6,520 11,988
75,331 20,379 115,673 28,672 291,436 708,402
20,265 5,944 24,172 4,923 141,180 251,152
- - 74 - 62,666 65,940
8,196 3,702 18,940 3,419 44,722 105,769
2,027 535 12,648 38 835 (29,983) -
202,775 60,973 394,394 46,957 8,176 1,173,317
233,263 71,154 450,228 55,337 257,579 (29,983) 1,596,178308,594$ 91,533$ 565,901$ 84,009$ 549,015$ (29,983)$ 2,304,580$
17,080$ 4,386$ 15,775$ 3,933$ 15,902$ 90,304$
4,729 1,109 5,575 869 2,441 21,224
- - - - 261,175 261,175
10,007 2,971 14,737 2,698 11,504 67,833
16,315 2,066 25,662 2,759 532 68,357
48,131 10,532 61,749 10,259 291,554 508,893
154,167 39,389 162,546 39,102 134,305 - 737,879
687 430 2,398 55 25,600 (29,983) -
154,854 39,819 164,944 39,157 159,905 (29,983) 737,879202,985$ 50,351$ 226,693$ 49,416$ 451,459$ (29,983)$ 1,246,772$
42,513$ 20,063$ 223,980$ 5,968$ (82,196)$ 451,824$
1,284 255 7,290 2 1,115 14,682
2,911 968 17,520 511 34,421 419 84,643
9,941 4,825 25,306 5,165 145 84,678
17,574 7,782 32,099 7,830 68,127 (851) 186,058
82 66 (89) 27 60,452 60,942
31,304 7,223 33,102 15,090 15,492 432 174,981 105,609$ 41,182$ 339,208$ 34,593$ 97,556$ -$ 1,057,808$
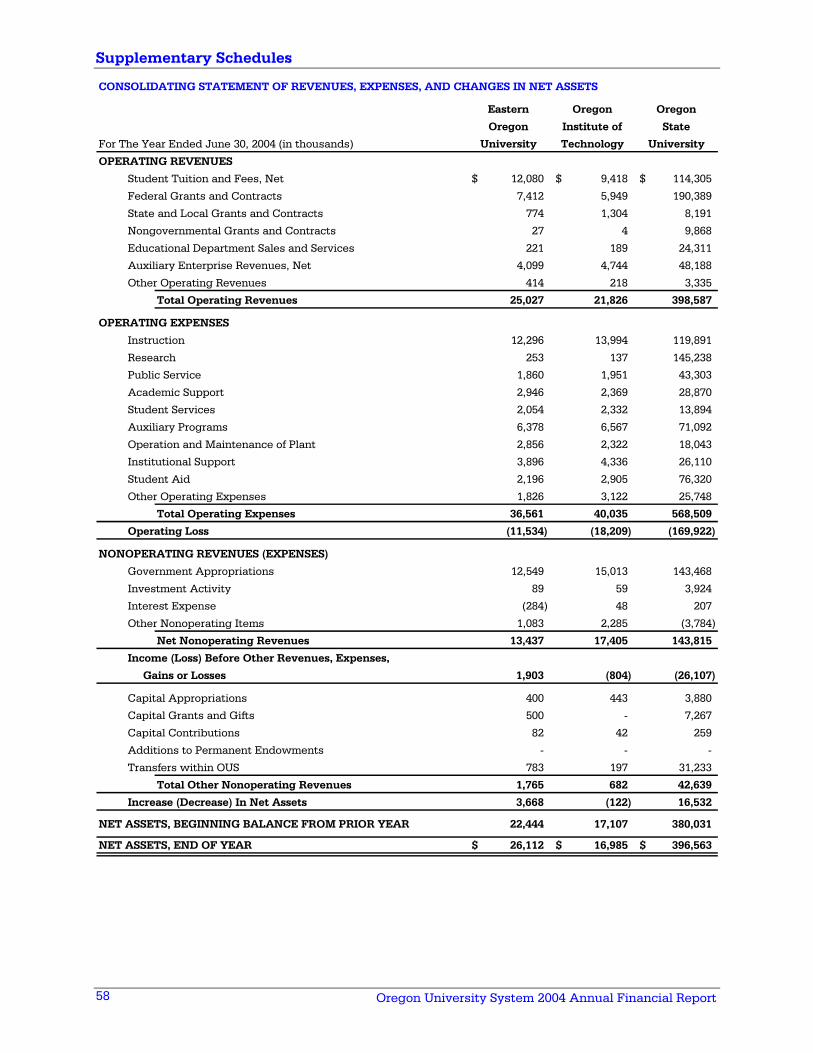
Supplementary Schedules
Oregon University System 2004 Annual Financial Report 58
Eastern Oregon Oregon
Oregon Institute of State
For The Year Ended June 30, 2004 (in thousands) University Technology University
OPERATING REVENUES
Student Tuition and Fees, Net 12,080$ 9,418$ 114,305$
Federal Grants and Contracts 7,412 5,949 190,389
State and Local Grants and Contracts 774 1,304 8,191
Nongovernmental Grants and Contracts 27 4 9,868
Educational Department Sales and Services 221 189 24,311
Auxiliary Enterprise Revenues, Net 4,099 4,744 48,188
Other Operating Revenues 414 218 3,335
Total Operating Revenues 25,027 21,826 398,587
OPERATING EXPENSES
Instruction 12,296 13,994 119,891
Research 253 137 145,238
Public Service 1,860 1,951 43,303
Academic Support 2,946 2,369 28,870
Student Services 2,054 2,332 13,894
Auxiliary Programs 6,378 6,567 71,092
Operation and Maintenance of Plant 2,856 2,322 18,043
Institutional Support 3,896 4,336 26,110
Student Aid 2,196 2,905 76,320
Other Operating Expenses 1,826 3,122 25,748
Total Operating Expenses 36,561 40,035 568,509
Operating Loss (11,534) (18,209) (169,922)
NONOPERATING REVENUES (EXPENSES)
Government Appropriations 12,549 15,013 143,468
Investment Activity 89 59 3,924
Interest Expense (284) 48 207
Other Nonoperating Items 1,083 2,285 (3,784)
Net Nonoperating Revenues 13,437 17,405 143,815
Income (Loss) Before Other Revenues, Expenses,
Gains or Losses 1,903 (804) (26,107)
Capital Appropriations 400 443 3,880
Capital Grants and Gifts 500 - 7,267
Capital Contributions 82 42 259
Additions to Permanent Endowments - - -
Transfers within OUS 783 197 31,233
Total Other Nonoperating Revenues 1,765 682 42,639
Increase (Decrease) In Net Assets 3,668 (122) 16,532
NET ASSETS, BEGINNING BALANCE FROM PRIOR YEAR 22,444 17,107 380,031
NET ASSETS, END OF YEAR 26,112$ 16,985$ 396,563$
CONSOLIDATING STATEMENT OF REVENUES, EXPENSES, AND CHANGES IN NET ASSETS
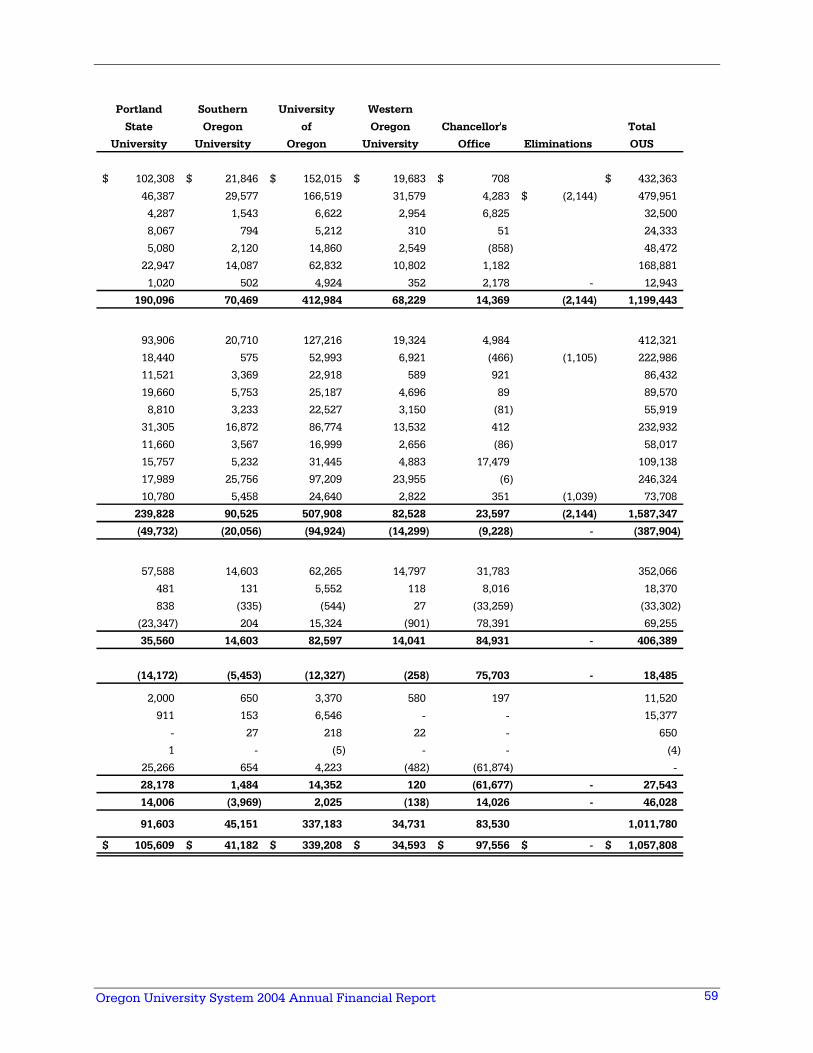
Oregon University System 2004 Annual Financial Report
59
Portland Southern University Western
State Oregon of Oregon Chancellor's Total
University University Oregon University Office Eliminations OUS
102,308$ 21,846$ 152,015$ 19,683$ 708$ 432,363$
46,387 29,577 166,519 31,579 4,283 (2,144)$ 479,951
4,287 1,543 6,622 2,954 6,825 32,500
8,067 794 5,212 310 51 24,333
5,080 2,120 14,860 2,549 (858) 48,472
22,947 14,087 62,832 10,802 1,182 168,881
1,020 502 4,924 352 2,178 - 12,943
190,096 70,469 412,984 68,229 14,369 (2,144) 1,199,443
93,906 20,710 127,216 19,324 4,984 412,321
18,440 575 52,993 6,921 (466) (1,105) 222,986
11,521 3,369 22,918 589 921 86,432
19,660 5,753 25,187 4,696 89 89,570
8,810 3,233 22,527 3,150 (81) 55,919
31,305 16,872 86,774 13,532 412 232,932
11,660 3,567 16,999 2,656 (86) 58,017
15,757 5,232 31,445 4,883 17,479 109,138
17,989 25,756 97,209 23,955 (6) 246,324
10,780 5,458 24,640 2,822 351 (1,039) 73,708
239,828 90,525 507,908 82,528 23,597 (2,144) 1,587,347
(49,732) (20,056) (94,924) (14,299) (9,228) - (387,904)
57,588 14,603 62,265 14,797 31,783 352,066
481 131 5,552 118 8,016 18,370
838 (335) (544) 27 (33,259) (33,302)
(23,347) 204 15,324 (901) 78,391 69,255
35,560 14,603 82,597 14,041 84,931 - 406,389
(14,172) (5,453) (12,327) (258) 75,703 - 18,485
2,000 650 3,370 580 197 11,520
911 153 6,546 - - 15,377
- 27 218 22 - 650
1 - (5) - - (4)
25,266 654 4,223 (482) (61,874) -
28,178 1,484 14,352 120 (61,677) - 27,543
14,006 (3,969) 2,025 (138) 14,026 - 46,028
91,603 45,151 337,183 34,731 83,530 1,011,780
105,609$ 41,182$ 339,208$ 34,593$ 97,556$ -$ 1,057,808$
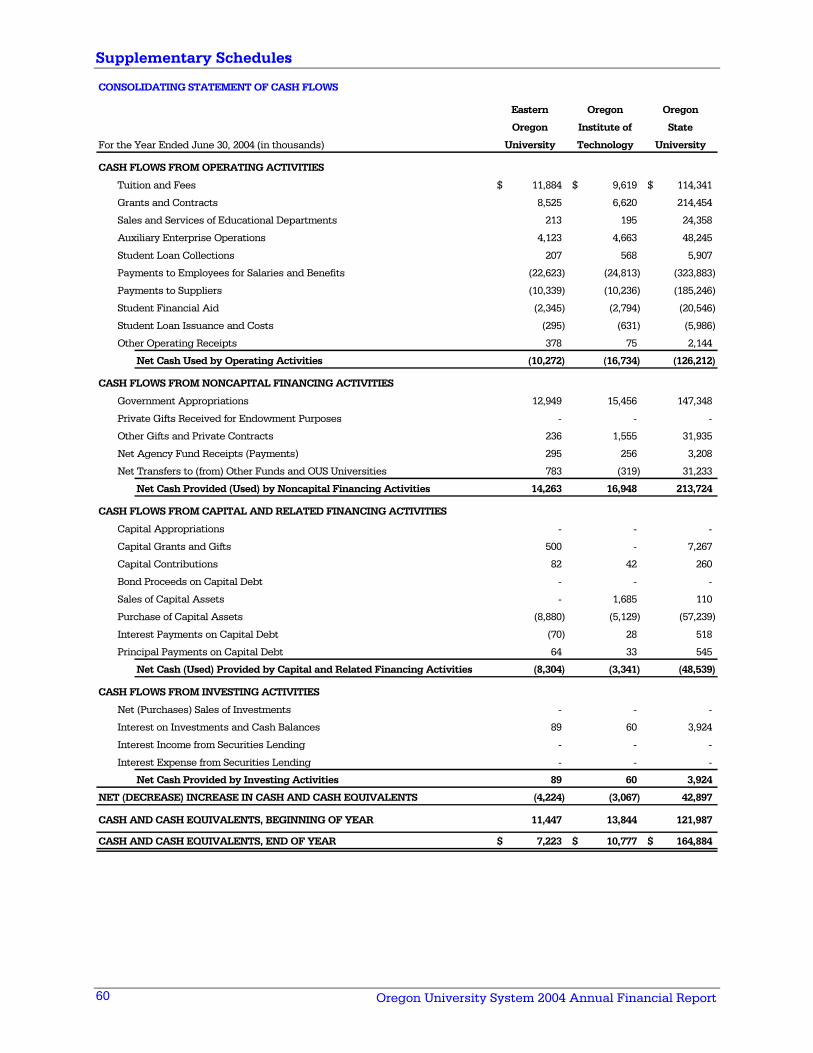
Supplementary Schedules
Oregon University System 2004 Annual Financial Report 60
Eastern Oregon Oregon
Oregon Institute of State
For the Year Ended June 30, 2004 (in thousands) University Technology University
CASH FLOWS FROM OPERATING ACTIVITIES
Tuition and Fees 11,884$ 9,619$ 114,341$
Grants and Contracts 8,525 6,620 214,454
Sales and Services of Educational Departments 213 195 24,358
Auxiliary Enterprise Operations 4,123 4,663 48,245
Student Loan Collections 207 568 5,907
Payments to Employees for Salaries and Benefits (22,623) (24,813) (323,883)
Payments to Suppliers (10,339) (10,236) (185,246)
Student Financial Aid (2,345) (2,794) (20,546)
Student Loan Issuance and Costs (295) (631) (5,986)
Other Operating Receipts 378 75 2,144
Net Cash Used by Operating Activities (10,272) (16,734) (126,212)
CASH FLOWS FROM NONCAPITAL FINANCING ACTIVITIES
Government Appropriations 12,949 15,456 147,348
Private Gifts Received for Endowment Purposes - - -
Other Gifts and Private Contracts 236 1,555 31,935
Net Agency Fund Receipts (Payments) 295 256 3,208
Net Transfers to (from) Other Funds and OUS Universities 783 (319) 31,233
Net Cash Provided (Used) by Noncapital Financing Activities 14,263 16,948 213,724
CASH FLOWS FROM CAPITAL AND RELATED FINANCING ACTIVITIES
Capital Appropriations - - -
Capital Grants and Gifts 500 - 7,267
Capital Contributions 82 42 260
Bond Proceeds on Capital Debt - - -
Sales of Capital Assets - 1,685 110
Purchase of Capital Assets (8,880) (5,129) (57,239)
Interest Payments on Capital Debt (70) 28 518
Principal Payments on Capital Debt 64 33 545
Net Cash (Used) Provided by Capital and Related Financing Activities (8,304) (3,341) (48,539)
CASH FLOWS FROM INVESTING ACTIVITIES
Net (Purchases) Sales of Investments - - -
Interest on Investments and Cash Balances 89 60 3,924
Interest Income from Securities Lending - - -
Interest Expense from Securities Lending - - -
Net Cash Provided by Investing Activities 89 60 3,924
NET (DECREASE) INCREASE IN CASH AND CASH EQUIVALENTS (4,224) (3,067) 42,897
CASH AND CASH EQUIVALENTS, BEGINNING OF YEAR 11,447 13,844 121,987
CASH AND CASH EQUIVALENTS, END OF YEAR 7,223$ 10,777$ 164,884$
CONSOLIDATING STATEMENT OF CASH FLOWS
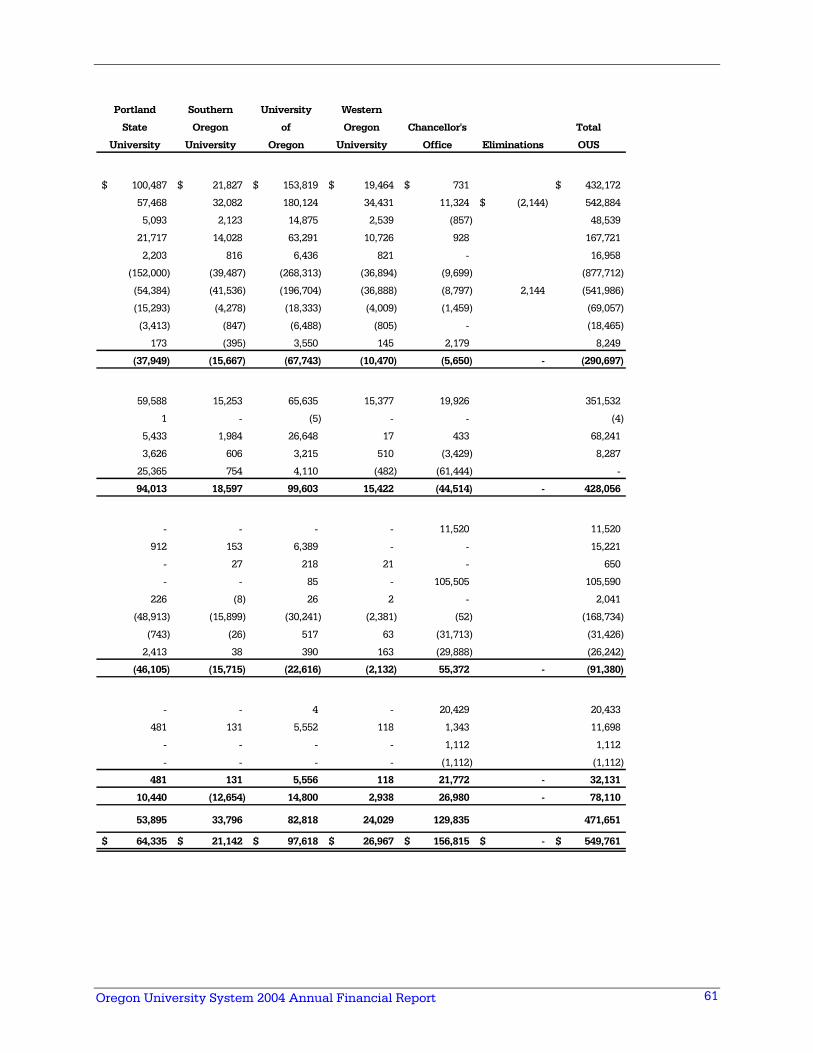
Oregon University System 2004 Annual Financial Report
61
Portland Southern University Western
State Oregon of Oregon Chancellor's Total
University University Oregon University Office Eliminations OUS
100,487$ 21,827$ 153,819$ 19,464$ 731$ 432,172$
57,468 32,082 180,124 34,431 11,324 (2,144)$ 542,884
5,093 2,123 14,875 2,539 (857) 48,539
21,717 14,028 63,291 10,726 928 167,721
2,203 816 6,436 821 - 16,958
(152,000) (39,487) (268,313) (36,894) (9,699) (877,712)
(54,384) (41,536) (196,704) (36,888) (8,797) 2,144 (541,986)
(15,293) (4,278) (18,333) (4,009) (1,459) (69,057)
(3,413) (847) (6,488) (805) - (18,465)
173 (395) 3,550 145 2,179 8,249
(37,949) (15,667) (67,743) (10,470) (5,650) - (290,697)
59,588 15,253 65,635 15,377 19,926 351,532
1 - (5) - - (4)
5,433 1,984 26,648 17 433 68,241
3,626 606 3,215 510 (3,429) 8,287
25,365 754 4,110 (482) (61,444) -
94,013 18,597 99,603 15,422 (44,514) - 428,056
- - - - 11,520 11,520
912 153 6,389 - - 15,221
- 27 218 21 - 650
- - 85 - 105,505 105,590
226 (8) 26 2 - 2,041
(48,913) (15,899) (30,241) (2,381) (52) (168,734)
(743) (26) 517 63 (31,713) (31,426)
2,413 38 390 163 (29,888) (26,242)
(46,105) (15,715) (22,616) (2,132) 55,372 - (91,380)
- - 4 - 20,429 20,433
481 131 5,552 118 1,343 11,698
- - - - 1,112 1,112
- - - - (1,112) (1,112)
481 131 5,556 118 21,772 - 32,131
10,440 (12,654) 14,800 2,938 26,980 - 78,110
53,895 33,796 82,818 24,029 129,835 471,651
64,335$ 21,142$ 97,618$ 26,967$ 156,815$ -$ 549,761$
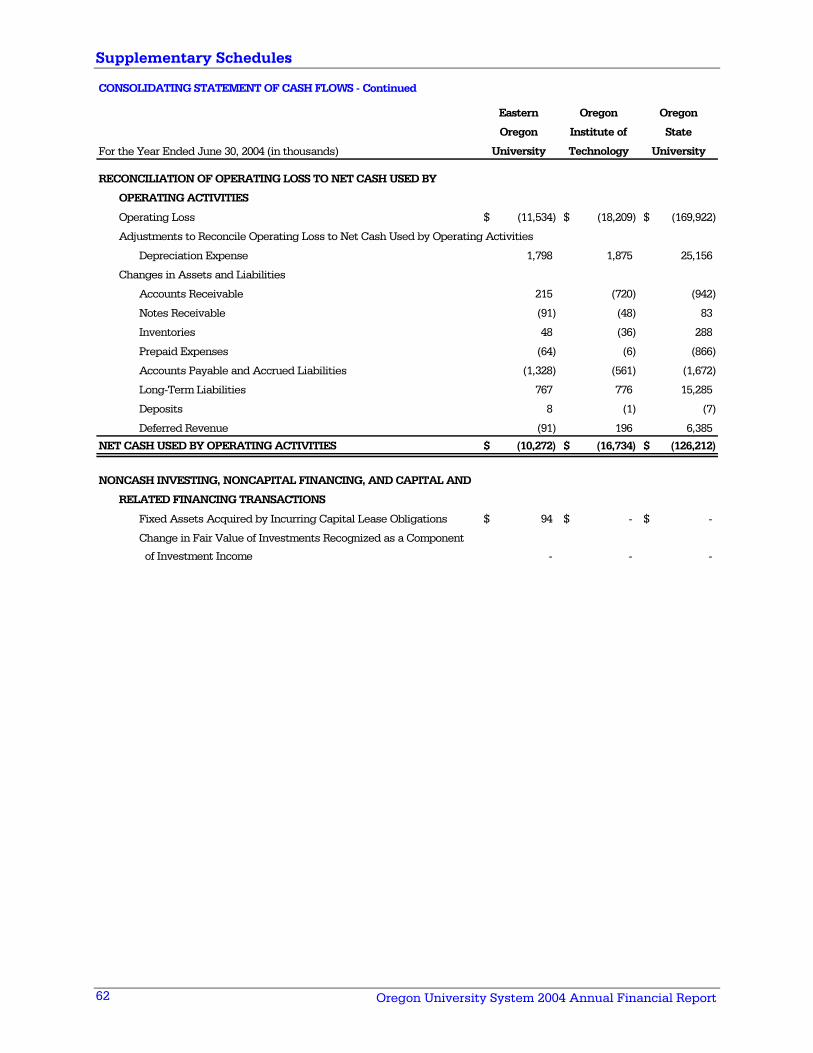
Supplementary Schedules
Oregon University System 2004 Annual Financial Report 62
Eastern Oregon Oregon
Oregon Institute of State
For the Year Ended June 30, 2004 (in thousands) University Technology University
RECONCILIATION OF OPERATING LOSS TO NET CASH USED BY
OPERATING ACTIVITIES
Operating Loss (11,534)$ (18,209)$ (169,922)$
Adjustments to Reconcile Operating Loss to Net Cash Used by Operating Activities
Depreciation Expense 1,798 1,875 25,156
Changes in Assets and Liabilities
Accounts Receivable 215 (720) (942)
Notes Receivable (91) (48) 83
Inventories 48 (36) 288
Prepaid Expenses (64) (6) (866)
Accounts Payable and Accrued Liabilities (1,328) (561) (1,672)
Long-Term Liabilities 767 776 15,285
Deposits 8 (1) (7)
Deferred Revenue (91) 196 6,385
NET CASH USED BY OPERATING ACTIVITIES (10,272)$ (16,734)$ (126,212)$
NONCASH INVESTING, NONCAPITAL FINANCING, AND CAPITAL AND
RELATED FINANCING TRANSACTIONS
Fixed Assets Acquired by Incurring Capital Lease Obligations 94$ -$ -$
Change in Fair Value of Investments Recognized as a Component
of Investment Income - - -
CONSOLIDATING STATEMENT OF CASH FLOWS - Continued
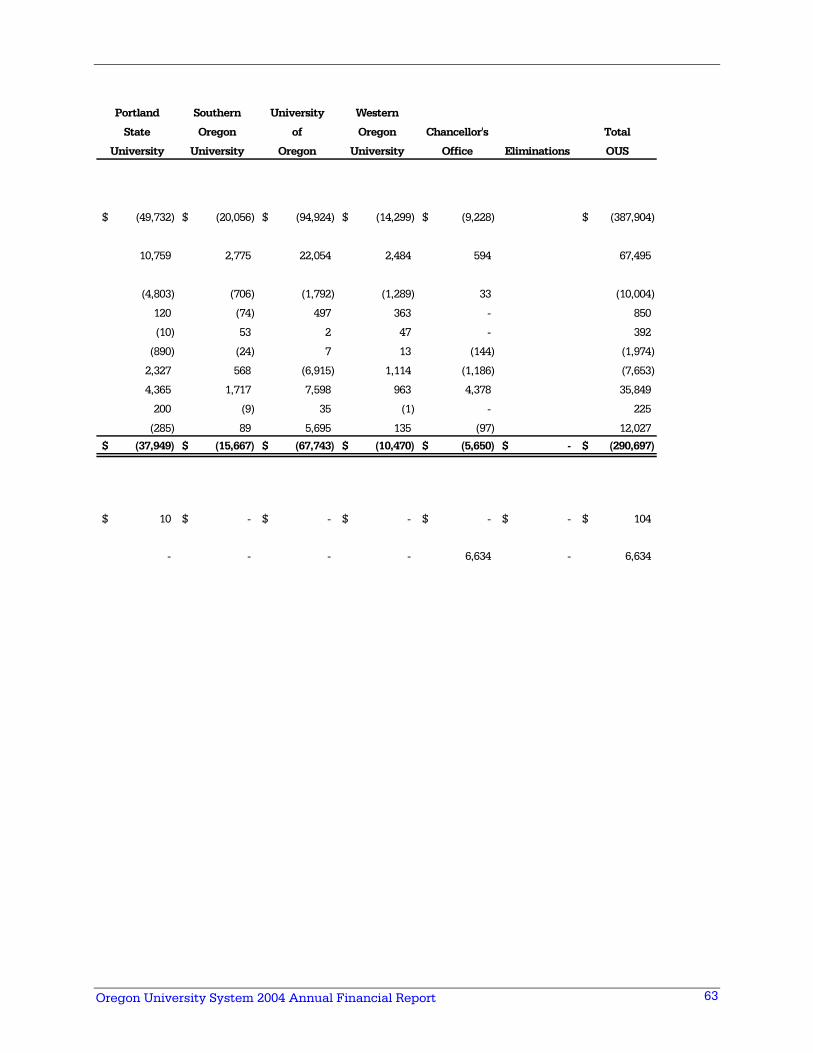
Oregon University System 2004 Annual Financial Report
63
Portland Southern University Western
State Oregon of Oregon Chancellor's Total
University University Oregon University Office Eliminations OUS
(49,732)$ (20,056)$ (94,924)$ (14,299)$ (9,228)$ (387,904)$
10,759 2,775 22,054 2,484 594 67,495
(4,803) (706) (1,792) (1,289) 33 (10,004)
120 (74) 497 363 - 850
(10) 53 2 47 - 392
(890) (24) 7 13 (144) (1,974)
2,327 568 (6,915) 1,114 (1,186) (7,653)
4,365 1,717 7,598 963 4,378 35,849
200 (9) 35 (1) - 225
(285) 89 5,695 135 (97) 12,027
(37,949)$ (15,667)$ (67,743)$ (10,470)$ (5,650)$ -$ (290,697)$
10$ -$ -$ -$ -$ -$ 104$
- - - - 6,634 - 6,634
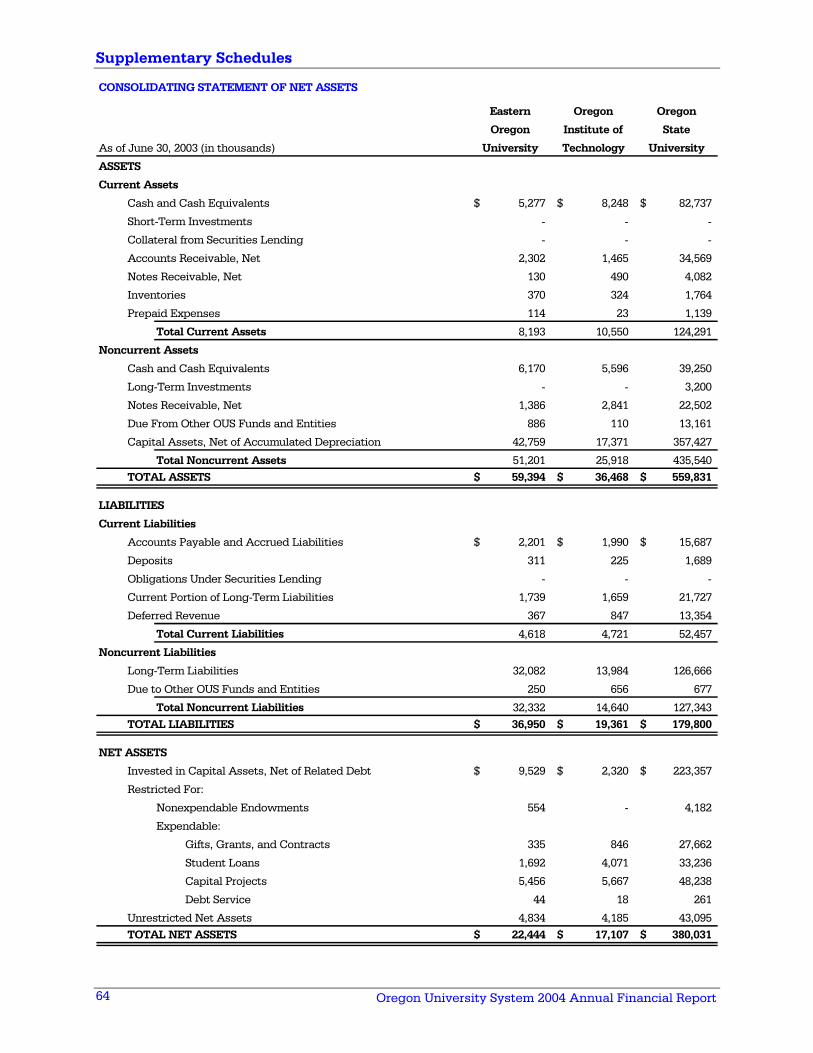
Supplementary Schedules
Oregon University System 2004 Annual Financial Report 64
Eastern Oregon Oregon
Oregon Institute of State
As of June 30, 2003 (in thousands) University Technology University
ASSETS
Current Assets
Cash and Cash Equivalents 5,277$ 8,248$ 82,737$
Short-Term Investments - - -
Collateral from Securities Lending - - -
Accounts Receivable, Net 2,302 1,465 34,569
Notes Receivable, Net 130 490 4,082
Inventories 370 324 1,764
Prepaid Expenses 114 23 1,139
Total Current Assets 8,193 10,550 124,291
Noncurrent Assets
Cash and Cash Equivalents 6,170 5,596 39,250
Long-Term Investments - - 3,200
Notes Receivable, Net 1,386 2,841 22,502
Due From Other OUS Funds and Entities 886 110 13,161
Capital Assets, Net of Accumulated Depreciation 42,759 17,371 357,427
Total Noncurrent Assets 51,201 25,918 435,540TOTAL ASSETS 59,394$ 36,468$ 559,831$
LIABILITIES
Current Liabilities
Accounts Payable and Accrued Liabilities 2,201$ 1,990$ 15,687$
Deposits 311 225 1,689
Obligations Under Securities Lending - - -
Current Portion of Long-Term Liabilities 1,739 1,659 21,727
Deferred Revenue 367 847 13,354
Total Current Liabilities 4,618 4,721 52,457
Noncurrent Liabilities
Long-Term Liabilities 32,082 13,984 126,666
Due to Other OUS Funds and Entities 250 656 677
Total Noncurrent Liabilities 32,332 14,640 127,343 TOTAL LIABILITIES 36,950$ 19,361$ 179,800$
NET ASSETS
Invested in Capital Assets, Net of Related Debt 9,529$ 2,320$ 223,357$
Restricted For:
Nonexpendable Endowments 554 - 4,182
Expendable:
Gifts, Grants, and Contracts 335 846 27,662
Student Loans 1,692 4,071 33,236
Capital Projects 5,456 5,667 48,238
Debt Service 44 18 261
Unrestricted Net Assets 4,834 4,185 43,095 TOTAL NET ASSETS 22,444$ 17,107$ 380,031$
CONSOLIDATING STATEMENT OF NET ASSETS
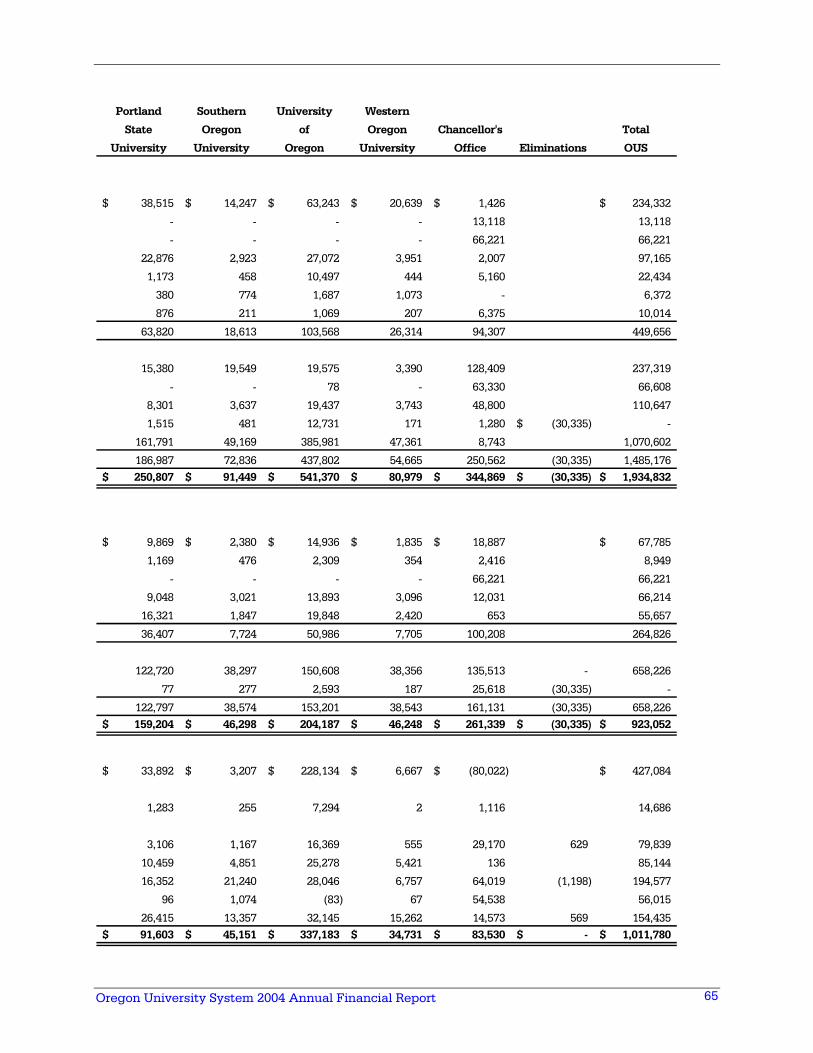
Oregon University System 2004 Annual Financial Report
65
Portland Southern University Western
State Oregon of Oregon Chancellor's Total
University University Oregon University Office Eliminations OUS
38,515$ 14,247$ 63,243$ 20,639$ 1,426$ 234,332$
- - - - 13,118 13,118
- - - - 66,221 66,221
22,876 2,923 27,072 3,951 2,007 97,165
1,173 458 10,497 444 5,160 22,434
380 774 1,687 1,073 - 6,372
876 211 1,069 207 6,375 10,014
63,820 18,613 103,568 26,314 94,307 449,656
15,380 19,549 19,575 3,390 128,409 237,319
- - 78 - 63,330 66,608
8,301 3,637 19,437 3,743 48,800 110,647
1,515 481 12,731 171 1,280 (30,335)$ -
161,791 49,169 385,981 47,361 8,743 1,070,602
186,987 72,836 437,802 54,665 250,562 (30,335) 1,485,176250,807$ 91,449$ 541,370$ 80,979$ 344,869$ (30,335)$ 1,934,832$
9,869$ 2,380$ 14,936$ 1,835$ 18,887$ 67,785$
1,169 476 2,309 354 2,416 8,949
- - - - 66,221 66,221
9,048 3,021 13,893 3,096 12,031 66,214
16,321 1,847 19,848 2,420 653 55,657
36,407 7,724 50,986 7,705 100,208 264,826
122,720 38,297 150,608 38,356 135,513 - 658,226
77 277 2,593 187 25,618 (30,335) -
122,797 38,574 153,201 38,543 161,131 (30,335) 658,226159,204$ 46,298$ 204,187$ 46,248$ 261,339$ (30,335)$ 923,052$
33,892$ 3,207$ 228,134$ 6,667$ (80,022)$ 427,084$
1,283 255 7,294 2 1,116 14,686
3,106 1,167 16,369 555 29,170 629 79,839
10,459 4,851 25,278 5,421 136 85,144
16,352 21,240 28,046 6,757 64,019 (1,198) 194,577
96 1,074 (83) 67 54,538 56,015
26,415 13,357 32,145 15,262 14,573 569 154,435 91,603$ 45,151$ 337,183$ 34,731$ 83,530$ -$ 1,011,780$
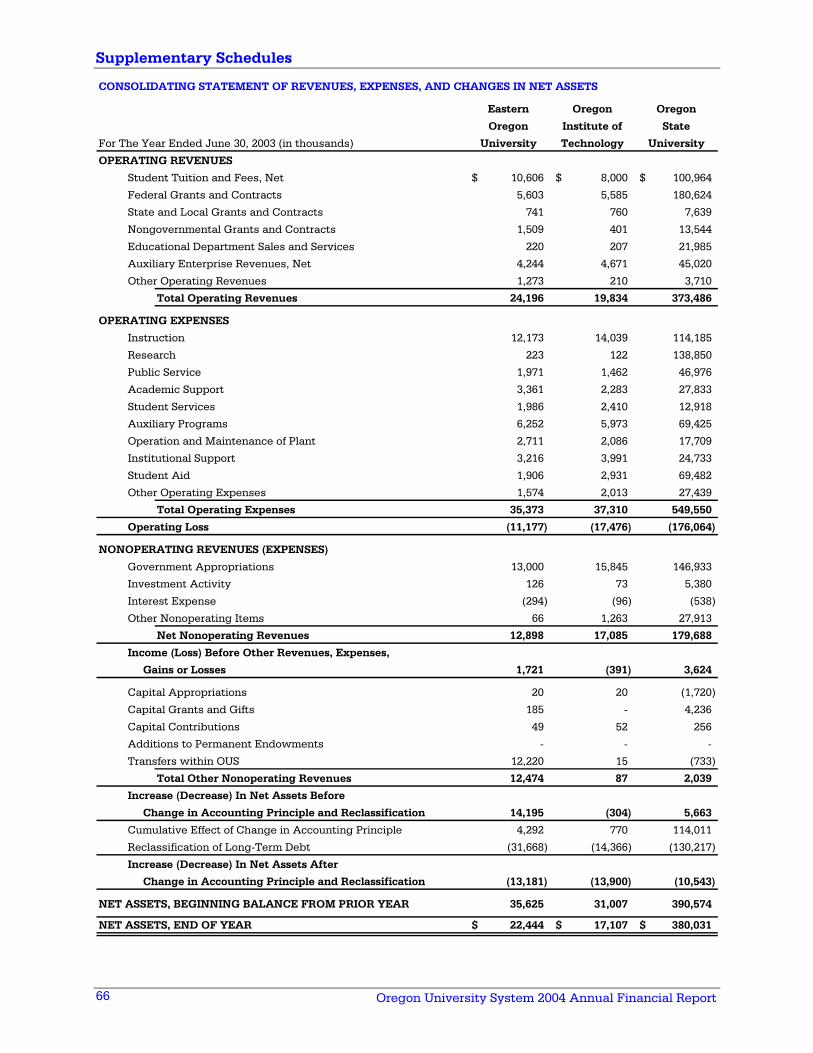
Supplementary Schedules
Oregon University System 2004 Annual Financial Report 66
Eastern Oregon Oregon
Oregon Institute of State
For The Year Ended June 30, 2003 (in thousands) University Technology University
OPERATING REVENUES
Student Tuition and Fees, Net 10,606$ 8,000$ 100,964$
Federal Grants and Contracts 5,603 5,585 180,624
State and Local Grants and Contracts 741 760 7,639
Nongovernmental Grants and Contracts 1,509 401 13,544
Educational Department Sales and Services 220 207 21,985
Auxiliary Enterprise Revenues, Net 4,244 4,671 45,020
Other Operating Revenues 1,273 210 3,710
Total Operating Revenues 24,196 19,834 373,486
OPERATING EXPENSES
Instruction 12,173 14,039 114,185
Research 223 122 138,850
Public Service 1,971 1,462 46,976
Academic Support 3,361 2,283 27,833
Student Services 1,986 2,410 12,918
Auxiliary Programs 6,252 5,973 69,425
Operation and Maintenance of Plant 2,711 2,086 17,709
Institutional Support 3,216 3,991 24,733
Student Aid 1,906 2,931 69,482
Other Operating Expenses 1,574 2,013 27,439
Total Operating Expenses 35,373 37,310 549,550
Operating Loss (11,177) (17,476) (176,064)
NONOPERATING REVENUES (EXPENSES)
Government Appropriations 13,000 15,845 146,933
Investment Activity 126 73 5,380
Interest Expense (294) (96) (538)
Other Nonoperating Items 66 1,263 27,913
Net Nonoperating Revenues 12,898 17,085 179,688
Income (Loss) Before Other Revenues, Expenses,
Gains or Losses 1,721 (391) 3,624
Capital Appropriations 20 20 (1,720)
Capital Grants and Gifts 185 - 4,236
Capital Contributions 49 52 256
Additions to Permanent Endowments - - -
Transfers within OUS 12,220 15 (733)
Total Other Nonoperating Revenues 12,474 87 2,039
Increase (Decrease) In Net Assets Before
Change in Accounting Principle and Reclassification 14,195 (304) 5,663
Cumulative Effect of Change in Accounting Principle 4,292 770 114,011
Reclassification of Long-Term Debt (31,668) (14,366) (130,217)
Increase (Decrease) In Net Assets After
Change in Accounting Principle and Reclassification (13,181) (13,900) (10,543)
NET ASSETS, BEGINNING BALANCE FROM PRIOR YEAR 35,625 31,007 390,574
NET ASSETS, END OF YEAR 22,444$ 17,107$ 380,031$
CONSOLIDATING STATEMENT OF REVENUES, EXPENSES, AND CHANGES IN NET ASSETS
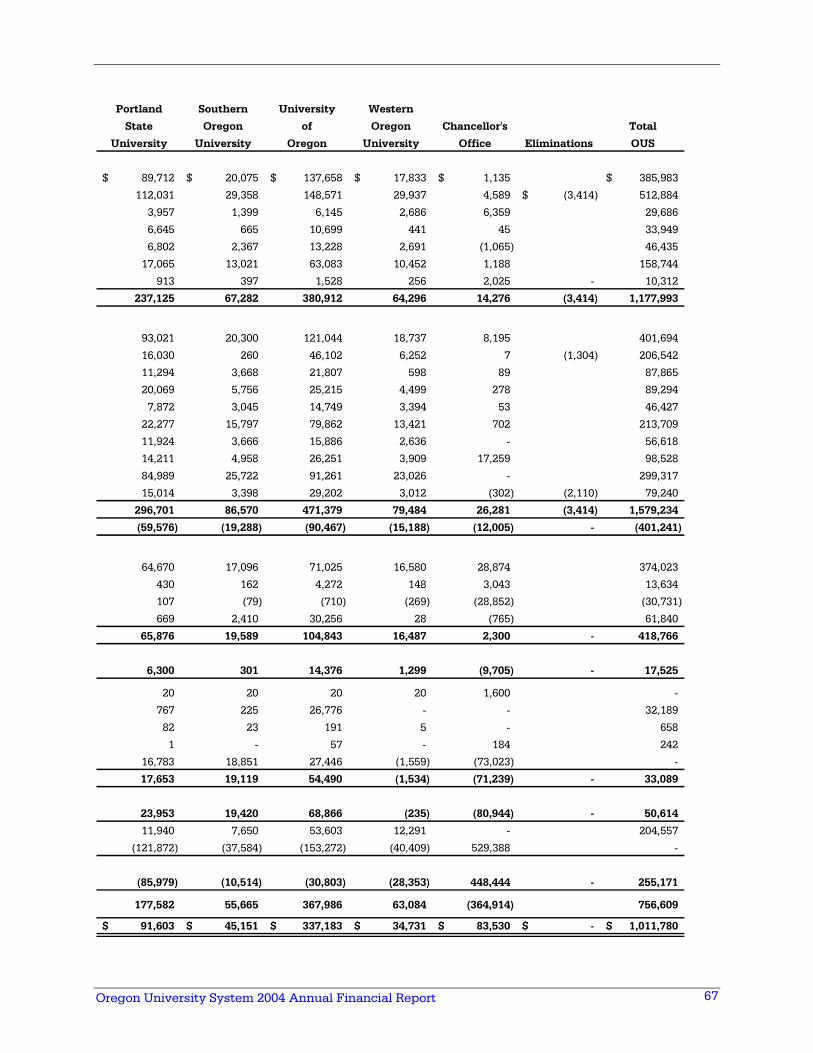
Oregon University System 2004 Annual Financial Report
67
Portland Southern University Western
State Oregon of Oregon Chancellor's Total
University University Oregon University Office Eliminations OUS
89,712$ 20,075$ 137,658$ 17,833$ 1,135$ 385,983$
112,031 29,358 148,571 29,937 4,589 (3,414)$ 512,884
3,957 1,399 6,145 2,686 6,359 29,686
6,645 665 10,699 441 45 33,949
6,802 2,367 13,228 2,691 (1,065) 46,435
17,065 13,021 63,083 10,452 1,188 158,744
913 397 1,528 256 2,025 - 10,312
237,125 67,282 380,912 64,296 14,276 (3,414) 1,177,993
93,021 20,300 121,044 18,737 8,195 401,694
16,030 260 46,102 6,252 7 (1,304) 206,542
11,294 3,668 21,807 598 89 87,865
20,069 5,756 25,215 4,499 278 89,294
7,872 3,045 14,749 3,394 53 46,427
22,277 15,797 79,862 13,421 702 213,709
11,924 3,666 15,886 2,636 - 56,618
14,211 4,958 26,251 3,909 17,259 98,528
84,989 25,722 91,261 23,026 - 299,317
15,014 3,398 29,202 3,012 (302) (2,110) 79,240
296,701 86,570 471,379 79,484 26,281 (3,414) 1,579,234
(59,576) (19,288) (90,467) (15,188) (12,005) - (401,241)
64,670 17,096 71,025 16,580 28,874 374,023
430 162 4,272 148 3,043 13,634
107 (79) (710) (269) (28,852) (30,731)
669 2,410 30,256 28 (765) 61,840
65,876 19,589 104,843 16,487 2,300 - 418,766
6,300 301 14,376 1,299 (9,705) - 17,525
20 20 20 20 1,600 -
767 225 26,776 - - 32,189
82 23 191 5 - 658
1 - 57 - 184 242
16,783 18,851 27,446 (1,559) (73,023) -
17,653 19,119 54,490 (1,534) (71,239) - 33,089
23,953 19,420 68,866 (235) (80,944) - 50,614
11,940 7,650 53,603 12,291 - 204,557
(121,872) (37,584) (153,272) (40,409) 529,388 -
(85,979) (10,514) (30,803) (28,353) 448,444 - 255,171
177,582 55,665 367,986 63,084 (364,914) 756,609
91,603$ 45,151$ 337,183$ 34,731$ 83,530$ -$ 1,011,780$
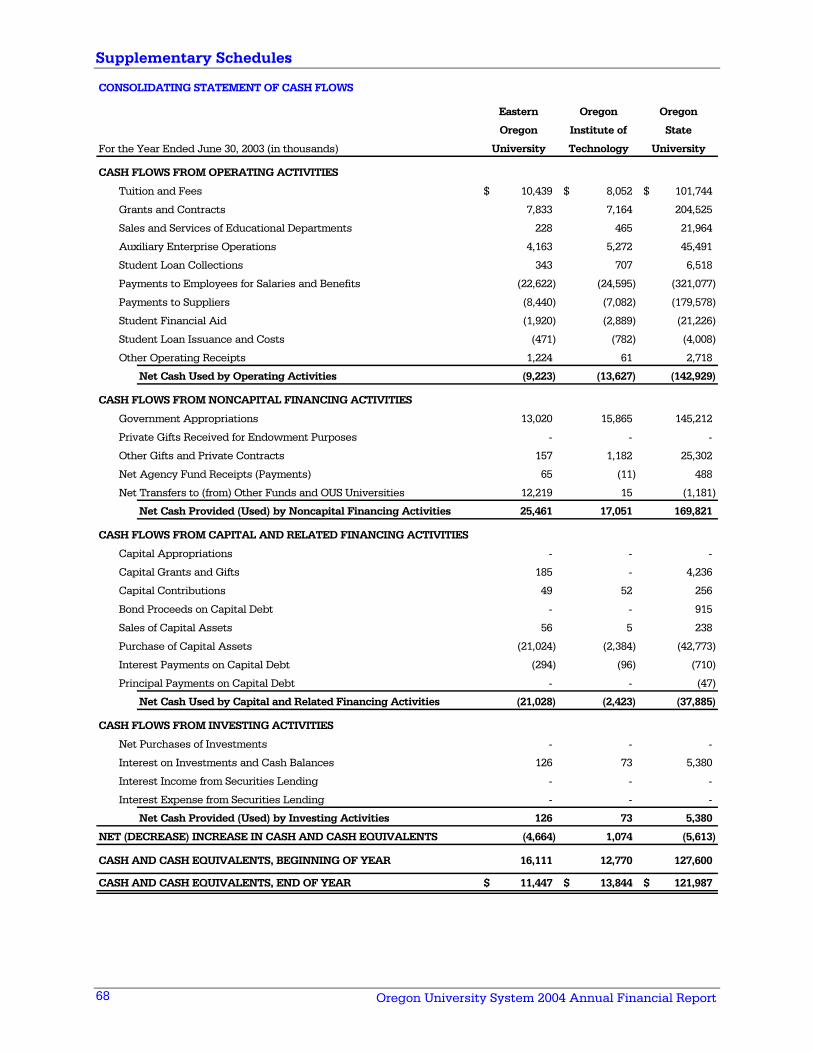
Supplementary Schedules
Oregon University System 2004 Annual Financial Report 68
Eastern Oregon Oregon
Oregon Institute of State
For the Year Ended June 30, 2003 (in thousands) University Technology University
CASH FLOWS FROM OPERATING ACTIVITIES
Tuition and Fees 10,439$ 8,052$ 101,744$
Grants and Contracts 7,833 7,164 204,525
Sales and Services of Educational Departments 228 465 21,964
Auxiliary Enterprise Operations 4,163 5,272 45,491
Student Loan Collections 343 707 6,518
Payments to Employees for Salaries and Benefits (22,622) (24,595) (321,077)
Payments to Suppliers (8,440) (7,082) (179,578)
Student Financial Aid (1,920) (2,889) (21,226)
Student Loan Issuance and Costs (471) (782) (4,008)
Other Operating Receipts 1,224 61 2,718
Net Cash Used by Operating Activities (9,223) (13,627) (142,929)
CASH FLOWS FROM NONCAPITAL FINANCING ACTIVITIES
Government Appropriations 13,020 15,865 145,212
Private Gifts Received for Endowment Purposes - - -
Other Gifts and Private Contracts 157 1,182 25,302
Net Agency Fund Receipts (Payments) 65 (11) 488
Net Transfers to (from) Other Funds and OUS Universities 12,219 15 (1,181)
Net Cash Provided (Used) by Noncapital Financing Activities 25,461 17,051 169,821
CASH FLOWS FROM CAPITAL AND RELATED FINANCING ACTIVITIES
Capital Appropriations - - -
Capital Grants and Gifts 185 - 4,236
Capital Contributions 49 52 256
Bond Proceeds on Capital Debt - - 915
Sales of Capital Assets 56 5 238
Purchase of Capital Assets (21,024) (2,384) (42,773)
Interest Payments on Capital Debt (294) (96) (710)
Principal Payments on Capital Debt - - (47)
Net Cash Used by Capital and Related Financing Activities (21,028) (2,423) (37,885)
CASH FLOWS FROM INVESTING ACTIVITIES
Net Purchases of Investments - - -
Interest on Investments and Cash Balances 126 73 5,380
Interest Income from Securities Lending - - -
Interest Expense from Securities Lending - - -
Net Cash Provided (Used) by Investing Activities 126 73 5,380
NET (DECREASE) INCREASE IN CASH AND CASH EQUIVALENTS (4,664) 1,074 (5,613)
CASH AND CASH EQUIVALENTS, BEGINNING OF YEAR 16,111 12,770 127,600
CASH AND CASH EQUIVALENTS, END OF YEAR 11,447$ 13,844$ 121,987$
CONSOLIDATING STATEMENT OF CASH FLOWS
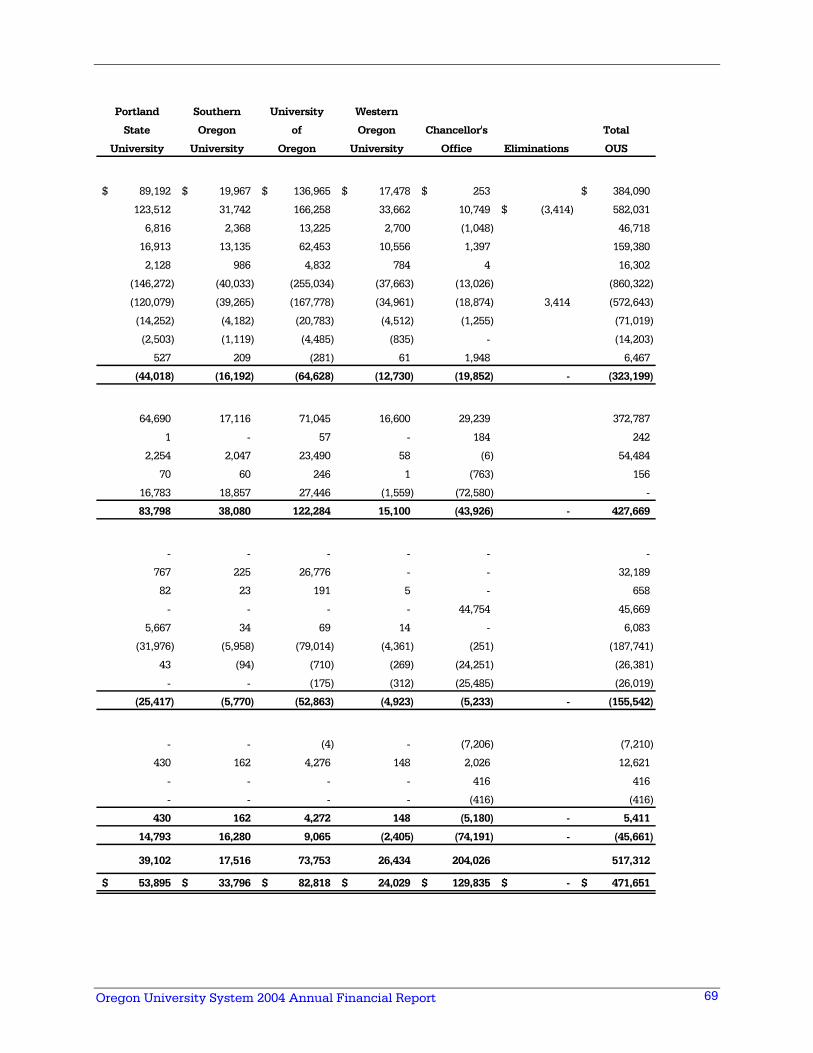
Oregon University System 2004 Annual Financial Report
69
Portland Southern University Western
State Oregon of Oregon Chancellor's Total
University University Oregon University Office Eliminations OUS
89,192$ 19,967$ 136,965$ 17,478$ 253$ 384,090$
123,512 31,742 166,258 33,662 10,749 (3,414)$ 582,031
6,816 2,368 13,225 2,700 (1,048) 46,718
16,913 13,135 62,453 10,556 1,397 159,380
2,128 986 4,832 784 4 16,302
(146,272) (40,033) (255,034) (37,663) (13,026) (860,322)
(120,079) (39,265) (167,778) (34,961) (18,874) 3,414 (572,643)
(14,252) (4,182) (20,783) (4,512) (1,255) (71,019)
(2,503) (1,119) (4,485) (835) - (14,203)
527 209 (281) 61 1,948 6,467
(44,018) (16,192) (64,628) (12,730) (19,852) - (323,199)
64,690 17,116 71,045 16,600 29,239 372,787
1 - 57 - 184 242
2,254 2,047 23,490 58 (6) 54,484
70 60 246 1 (763) 156
16,783 18,857 27,446 (1,559) (72,580) -
83,798 38,080 122,284 15,100 (43,926) - 427,669
- - - - - -
767 225 26,776 - - 32,189
82 23 191 5 - 658
- - - - 44,754 45,669
5,667 34 69 14 - 6,083
(31,976) (5,958) (79,014) (4,361) (251) (187,741)
43 (94) (710) (269) (24,251) (26,381)
- - (175) (312) (25,485) (26,019)
(25,417) (5,770) (52,863) (4,923) (5,233) - (155,542)
- - (4) - (7,206) (7,210)
430 162 4,276 148 2,026 12,621
- - - - 416 416
- - - - (416) (416)
430 162 4,272 148 (5,180) - 5,411
14,793 16,280 9,065 (2,405) (74,191) - (45,661)
39,102 17,516 73,753 26,434 204,026 517,312
53,895$ 33,796$ 82,818$ 24,029$ 129,835$ -$ 471,651$
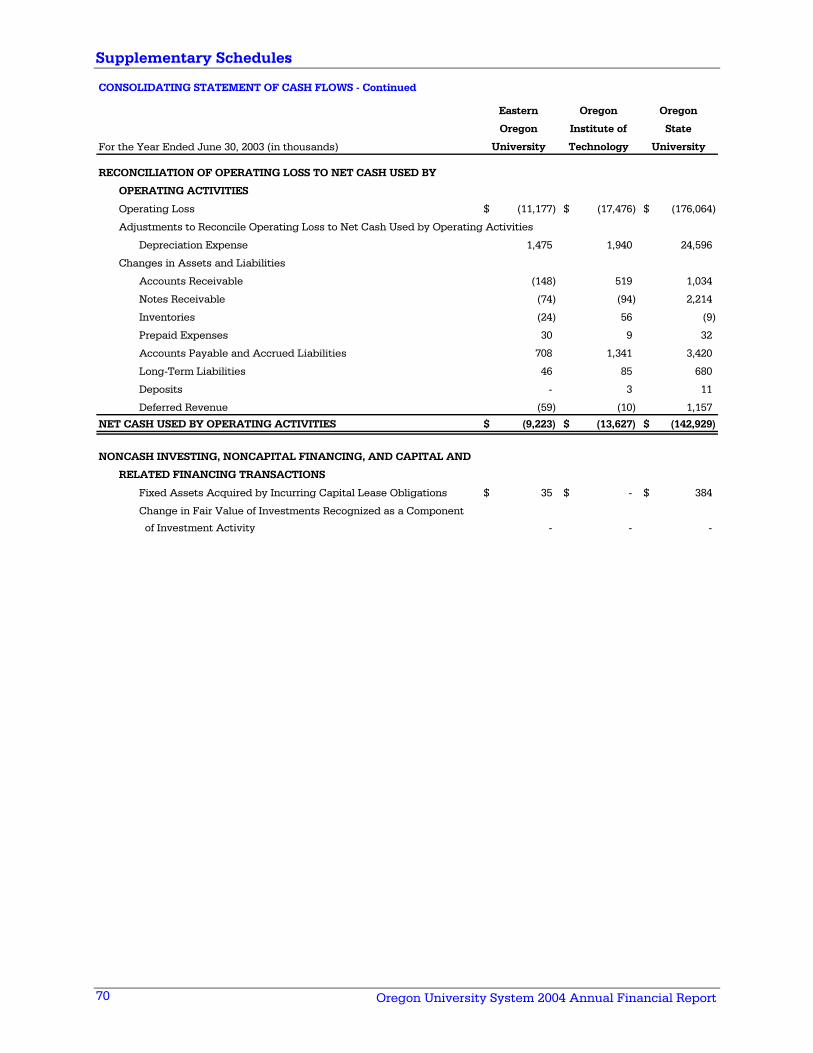
Supplementary Schedules
Oregon University System 2004 Annual Financial Report 70
Eastern Oregon Oregon
Oregon Institute of State
For the Year Ended June 30, 2003 (in thousands) University Technology University
RECONCILIATION OF OPERATING LOSS TO NET CASH USED BY
OPERATING ACTIVITIES
Operating Loss (11,177)$ (17,476)$ (176,064)$
Adjustments to Reconcile Operating Loss to Net Cash Used by Operating Activities
Depreciation Expense 1,475 1,940 24,596
Changes in Assets and Liabilities
Accounts Receivable (148) 519 1,034
Notes Receivable (74) (94) 2,214
Inventories (24) 56 (9)
Prepaid Expenses 30 9 32
Accounts Payable and Accrued Liabilities 708 1,341 3,420
Long-Term Liabilities 46 85 680
Deposits - 3 11
Deferred Revenue (59) (10) 1,157
NET CASH USED BY OPERATING ACTIVITIES (9,223)$ (13,627)$ (142,929)$
NONCASH INVESTING, NONCAPITAL FINANCING, AND CAPITAL AND
RELATED FINANCING TRANSACTIONS
Fixed Assets Acquired by Incurring Capital Lease Obligations 35$ -$ 384$
Change in Fair Value of Investments Recognized as a Component
of Investment Activity - - -
CONSOLIDATING STATEMENT OF CASH FLOWS - Continued
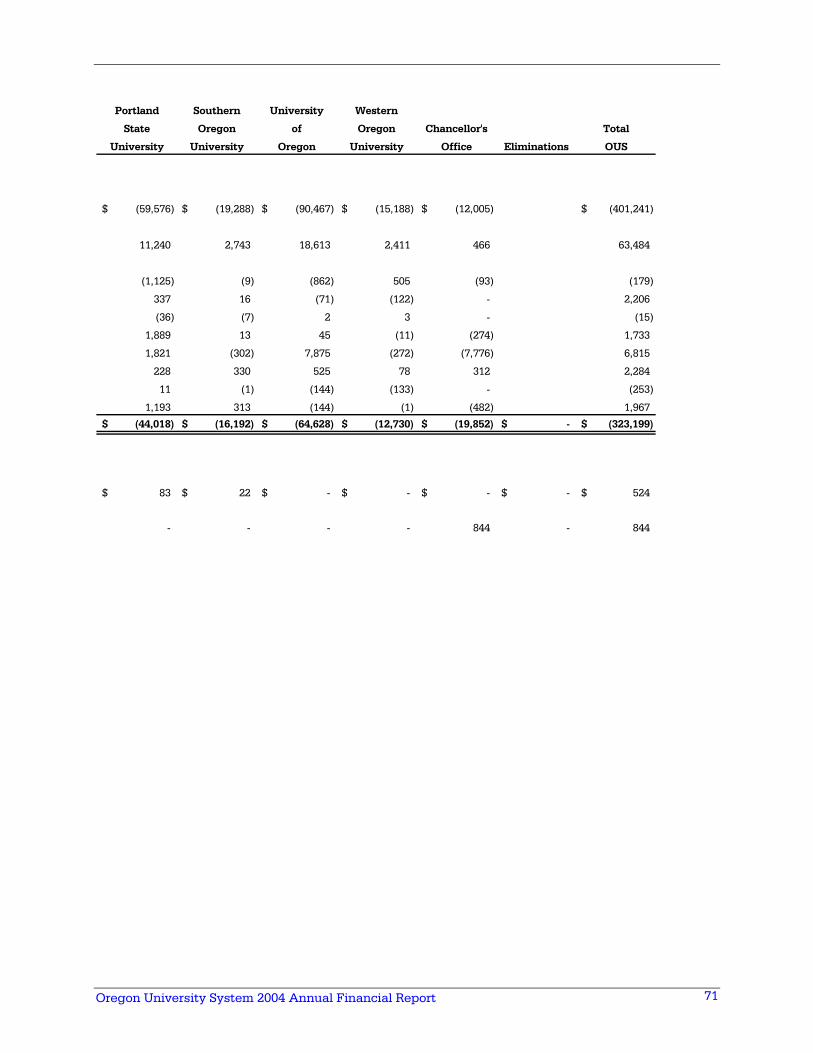
Oregon University System 2004 Annual Financial Report
71
Portland Southern University Western
State Oregon of Oregon Chancellor's Total
University University Oregon University Office Eliminations OUS
(59,576)$ (19,288)$ (90,467)$ (15,188)$ (12,005)$ (401,241)$
11,240 2,743 18,613 2,411 466 63,484
(1,125) (9) (862) 505 (93) (179)
337 16 (71) (122) - 2,206
(36) (7) 2 3 - (15)
1,889 13 45 (11) (274) 1,733
1,821 (302) 7,875 (272) (7,776) 6,815
228 330 525 78 312 2,284
11 (1) (144) (133) - (253)
1,193 313 (144) (1) (482) 1,967
(44,018)$ (16,192)$ (64,628)$ (12,730)$ (19,852)$ -$ (323,199)$
83$ 22$ -$ -$ -$ -$ 524$
- - - - 844 - 844