2011 community satisfaction survey report · 2011 community satisfaction survey report ... higher...
TRANSCRIPT
c:\documents and settings\cgilmartin\desktop\cover sheet.doc Page 1
INDIGO S
HIRE C
OUNCIL
BRIEFING MEETING 24 MAY 2011
2011 Community Satisfaction Survey
Report
May 2011

EXECUTIVE SUMMARY
This year’s survey indicates that two-thirds of respondents feel Council’s overall performance in
the last 12 months has been at an acceptable or high standard. Underpinning this result, as
indicated by respondents, is recognition of Council’s improved communication and engagement
processes, higher levels of customer service and quicker response to issues. There is still room
for improvement with about a third of respondents indicating some dissatisfaction with Council’s
overall performance.
More than 80 per cent of respondents said Council provided adequate information to the
community, with two thirds of respondents preferring information via the Council’s newsletter,
followed by articles in local media and community forums.
About a third of respondents indicated the best way for Council to support local businesses in
Indigo was through developing marketing initiatives to increase tourism, and another third felt
Council should continue to attract more businesses to the Shire.
Improving pathways and extending rail trails rated highly with respondents, reflecting ongoing
concerns. Respondents indicated a high level of involvement with their community and wanted
increased recognition and support of volunteers.
Natural environment and landscape, community spirit, the rural lifestyle and heritage continued to be important aspects of why people loved living in Indigo Shire. Over 40 per cent of respondents rated highly the need for better weed management.
In the town planning area, there was a slight decrease in the percentage of people who believe this area needs a lot of improvement, although this continues to be an area for improvement.
Fifty nine per cent of respondents felt they had had adequate input into the planning and development of their local area. 174 of the survey respondents have identified that they would be happy to participate in further discussion about the survey results.
The survey indicates positive trends in many areas of Council’s delivery of services. Council
will need to maintain its focus on these areas, while placing a greater emphasis on those areas
identified for improvement.
Page 3
Introduction
This report is a summary of the results gathered during the 2011 Indigo Community Survey that was conducted between
February and March 2011. The original Indigo Community Survey was conducted in 2009 as part of a community
engagement process to help Council formulate the Indigo Shire Council Plan 2009-12. In addition to the survey, which
was designed to gather residents’ ideas, a series of community-driven ‘dinner table conversations’ in the five major
towns was also conducted. This process, designed and driven by the community, shared a Local Government
Professionals (LGPro) award in 2009. The award is recognition of the valuable contribution residents made to the Council
Plan process. The theme of that award, A Place at the Table, was taken into other community engagement processes, in
particular Community Forums after monthly Council Meetings. During 2010, the numbers of people attending
Community Forums has almost doubled. Council’s Community Strengthening Project is being rolled out across the Shire
and is having a direct positive impact as more people become involved.
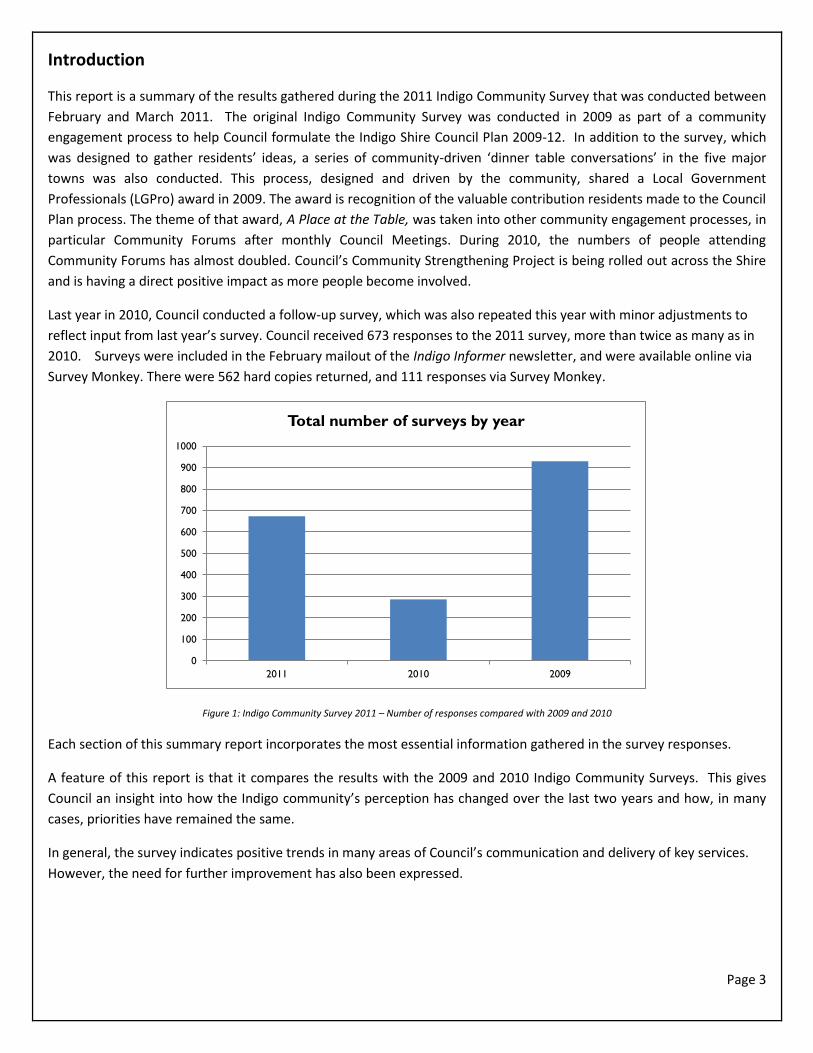
Last year in 2010, Council conducted a follow-up survey, which was also repeated this year with minor adjustments to
reflect input from last year’s survey. Council received 673 responses to the 2011 survey, more than twice as many as in
2010. Surveys were included in the February mailout of the Indigo Informer newsletter, and were available online via
Survey Monkey. There were 562 hard copies returned, and 111 responses via Survey Monkey.
Figure 1: Indigo Community Survey 2011 – Number of responses compared with 2009 and 2010
Each section of this summary report incorporates the most essential information gathered in the survey responses.
A feature of this report is that it compares the results with the 2009 and 2010 Indigo Community Surveys. This gives
Council an insight into how the Indigo community’s perception has changed over the last two years and how, in many
cases, priorities have remained the same.
In general, the survey indicates positive trends in many areas of Council’s communication and delivery of key services.
However, the need for further improvement has also been expressed.
0
100
200
300
400
500
600
700
800
900
1000
2011 2010 2009
Total number of surveys by year
Page 4
Demographics
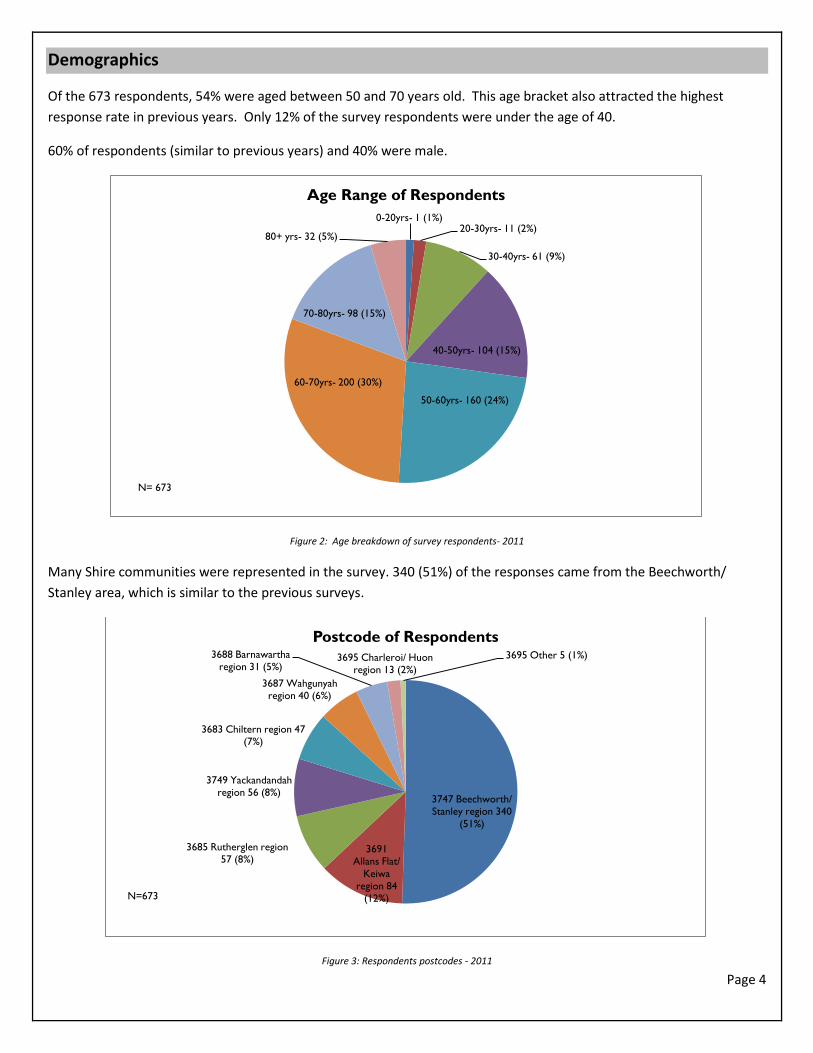
Of the 673 respondents, 54% were aged between 50 and 70 years old. This age bracket also attracted the highest
response rate in previous years. Only 12% of the survey respondents were under the age of 40.
60% of respondents (similar to previous years) and 40% were male.
Figure 2: Age breakdown of survey respondents- 2011
Many Shire communities were represented in the survey. 340 (51%) of the responses came from the Beechworth/
Stanley area, which is similar to the previous surveys.
Figure 3: Respondents postcodes - 2011
0-20yrs- 1 (1%) 20-30yrs- 11 (2%)
30-40yrs- 61 (9%)
40-50yrs- 104 (15%)
50-60yrs- 160 (24%)
60-70yrs- 200 (30%)
70-80yrs- 98 (15%)
80+ yrs- 32 (5%)
Age Range of Respondents
N= 673
3747 Beechworth/ Stanley region 340
(51%)
3691 Allans Flat/
Keiwa region 84
(12%)
3685 Rutherglen region 57 (8%)
3749 Yackandandah region 56 (8%)
3683 Chiltern region 47 (7%)
3687 Wahgunyah region 40 (6%)
3688 Barnawartha region 31 (5%)
3695 Charleroi/ Huon region 13 (2%)
3695 Other 5 (1%)
Postcode of Respondents
N=673
Page 5
What do you like?
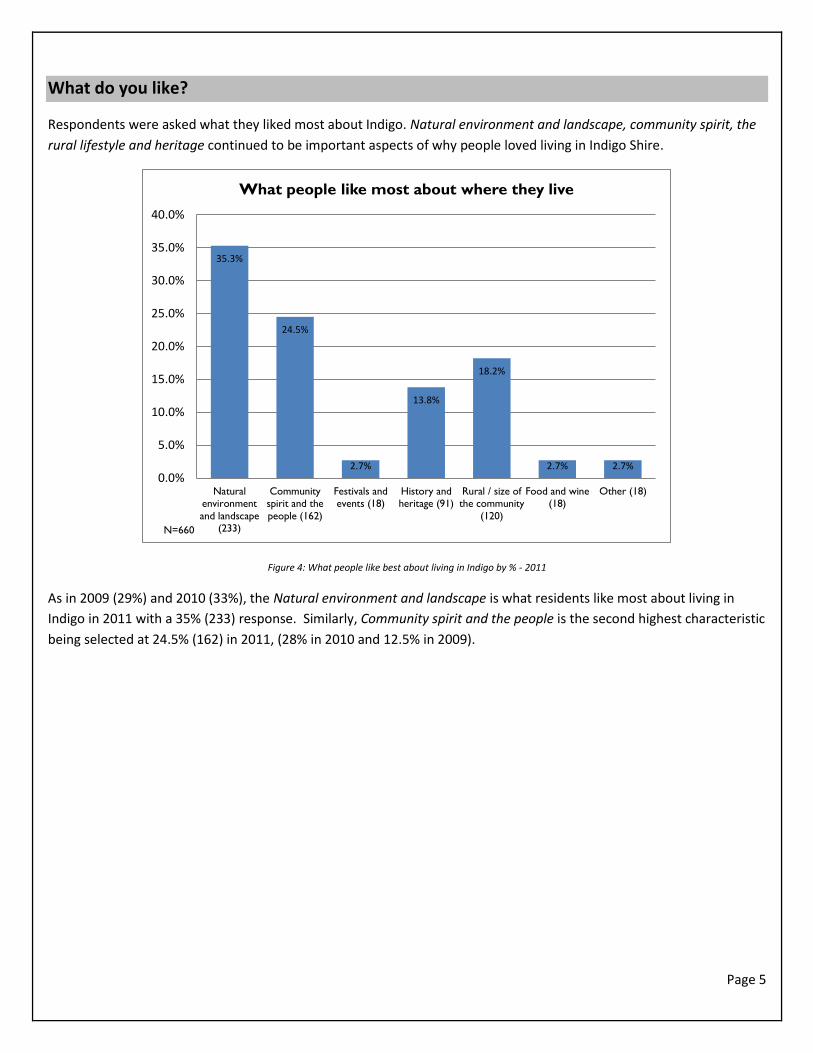
Respondents were asked what they liked most about Indigo. Natural environment and landscape, community spirit, the
rural lifestyle and heritage continued to be important aspects of why people loved living in Indigo Shire.
Figure 4: What people like best about living in Indigo by % - 2011
As in 2009 (29%) and 2010 (33%), the Natural environment and landscape is what residents like most about living in
Indigo in 2011 with a 35% (233) response. Similarly, Community spirit and the people is the second highest characteristic
being selected at 24.5% (162) in 2011, (28% in 2010 and 12.5% in 2009).
35.3%
24.5%
2.7%
13.8%
18.2%
2.7% 2.7% 0.0%
5.0%
10.0%
15.0%
20.0%
25.0%
30.0%
35.0%
40.0%
Naturalenvironment
and landscape(233)
Communityspirit and the
people (162)
Festivals andevents (18)
History andheritage (91)
Rural / size ofthe community
(120)
Food and wine(18)
Other (18)
What people like most about where they live
N=660
Page 6
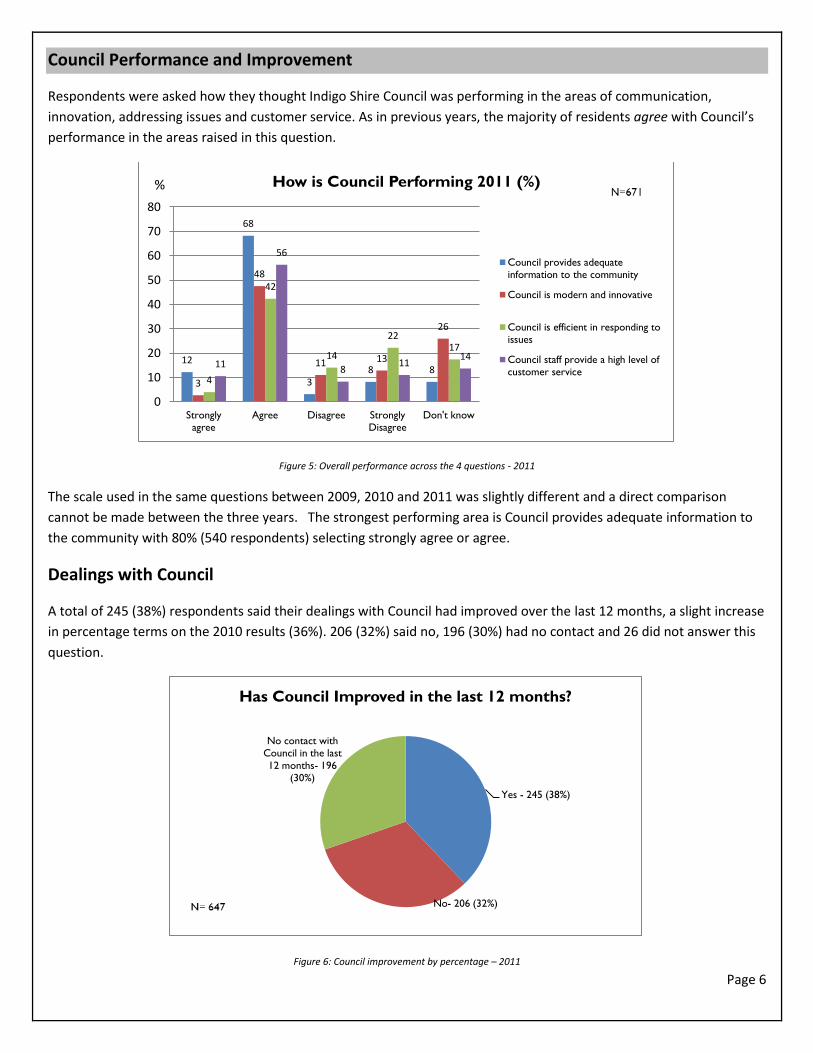
Council Performance and Improvement
Respondents were asked how they thought Indigo Shire Council was performing in the areas of communication,
innovation, addressing issues and customer service. As in previous years, the majority of residents agree with Council’s
performance in the areas raised in this question.
Figure 5: Overall performance across the 4 questions - 2011
The scale used in the same questions between 2009, 2010 and 2011 was slightly different and a direct comparison
cannot be made between the three years. The strongest performing area is Council provides adequate information to
the community with 80% (540 respondents) selecting strongly agree or agree.
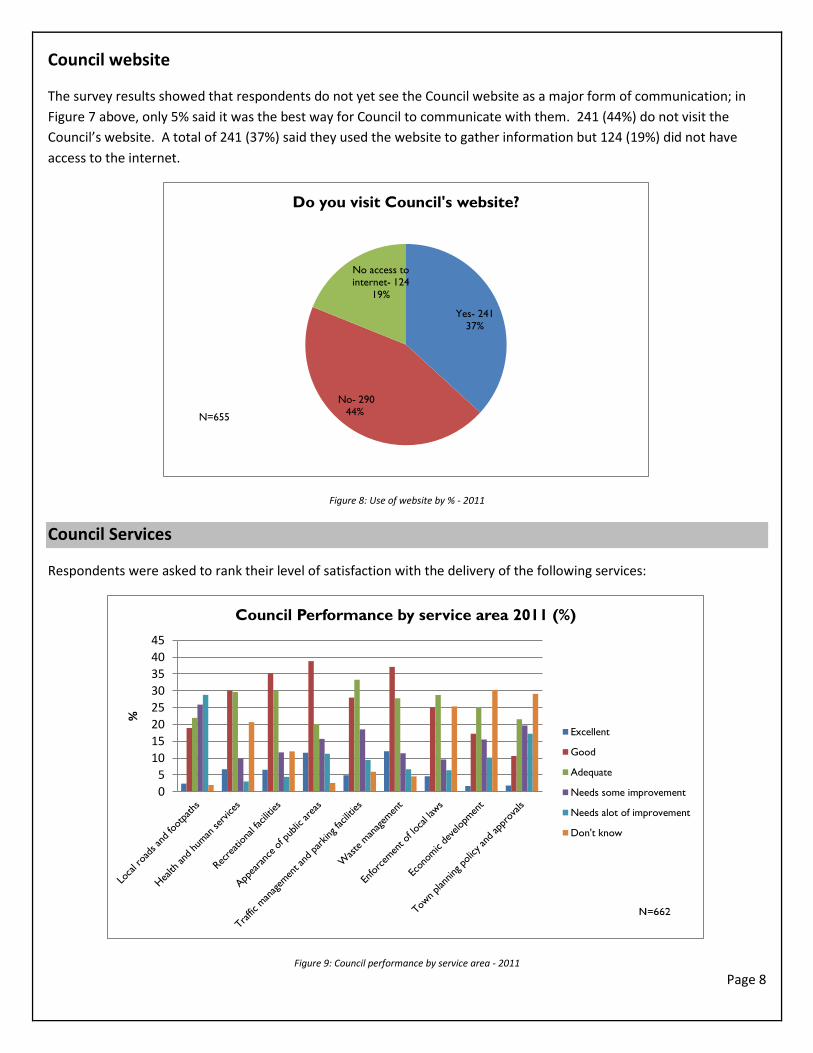
Dealings with Council
A total of 245 (38%) respondents said their dealings with Council had improved over the last 12 months, a slight increase
in percentage terms on the 2010 results (36%). 206 (32%) said no, 196 (30%) had no contact and 26 did not answer this
question.
Figure 6: Council improvement by percentage – 2011
12
68
3 8 8
3
48
11 13
26
4
42
14
22 17
11
56
8 11
14
0
10
20
30
40
50
60
70
80
Stronglyagree
Agree Disagree StronglyDisagree
Don't know
How is Council Performing 2011 (%)
Council provides adequateinformation to the community
Council is modern and innovative
Council is efficient in responding toissues
Council staff provide a high level of
customer service
%
Yes - 245 (38%)
No- 206 (32%)
No contact with Council in the last
12 months- 196
(30%)
Has Council Improved in the last 12 months?

Page 7
There were 299 additional comments in response to this question. Of these comments, 16 (6%) said it was the same and
131 (44%) provided positive comments that included, “A wonderful ‘can do’, cooperative attitude and pleasant manner
across the board. Well done” And “When I moved back into the area they were very helpful in assisting me to settle back
into the region.” A range of positive comments was also received on the way Council staff had responded to the floods,
including the public forums to discuss the issues. On a negative note, 85 or (28%) provided comments that response
times to phone calls and emails were longer than expected.
Communication
Respondents were asked to select the best way in which Council could communicate with them. The Information with
rates notices/ Indigo Informer were ranked the highest with 393 (61%) respondents indicating it was the most effective
means of communication. This was followed by providing information in the local newspapers 120 (19%) and
community forums 65 (10%).
Figure 7: The best way for Council to communicate by % - 2011
Mailouts of the Indigo Informer was the most effective communication tool in 2009 as well. Additional comments in this
section suggested that Council could make better use of email and Facebook and that Council should continue to use a
range of communication tools.
5%
19%
62%
10%
3% 2%
0%
10%
20%
30%
40%
50%
60%
70%
Regular updates on
the Council website
32
Information in local
newspapers 120
Information mailed
to residents i.e.
Indigo Informer 393
Regular community
forums in each
township/ area 65
Information displays
on community
noticeboards 17
Mail outs to
community
organisations 11
Best way for Council to communicate with you?
N=638
Page 8
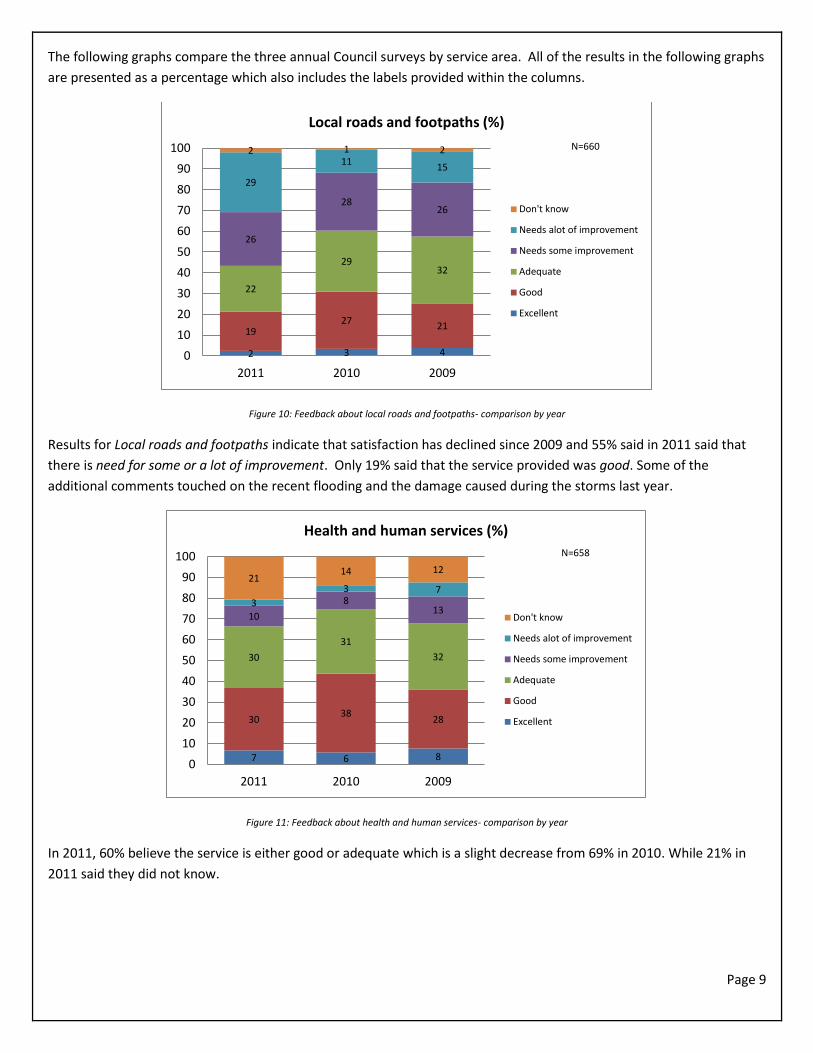
Council website
The survey results showed that respondents do not yet see the Council website as a major form of communication; in
Figure 7 above, only 5% said it was the best way for Council to communicate with them. 241 (44%) do not visit the
Council’s website. A total of 241 (37%) said they used the website to gather information but 124 (19%) did not have
access to the internet.
Figure 8: Use of website by % - 2011
Council Services
Respondents were asked to rank their level of satisfaction with the delivery of the following services:
Figure 9: Council performance by service area - 2011
Yes- 241 37%
No- 290 44%
No access to internet- 124
19%
Do you visit Council's website?
N=655
0
5
10
15
20
25
30
35
40
45
%
Council Performance by service area 2011 (%)
Excellent
Good
Adequate
Needs some improvement
Needs alot of improvement
Don't know
Page 9
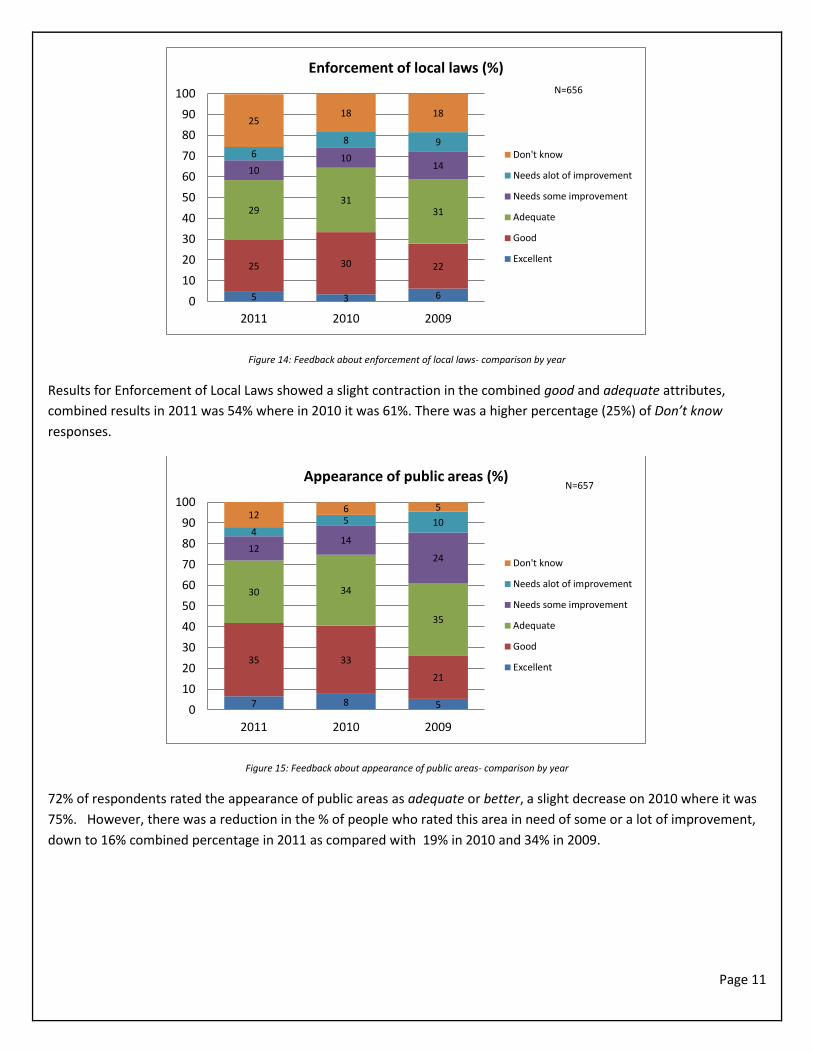
The following graphs compare the three annual Council surveys by service area. All of the results in the following graphs
are presented as a percentage which also includes the labels provided within the columns.
Figure 10: Feedback about local roads and footpaths- comparison by year
Results for Local roads and footpaths indicate that satisfaction has declined since 2009 and 55% said in 2011 said that
there is need for some or a lot of improvement. Only 19% said that the service provided was good. Some of the
additional comments touched on the recent flooding and the damage caused during the storms last year.
Figure 11: Feedback about health and human services- comparison by year
In 2011, 60% believe the service is either good or adequate which is a slight decrease from 69% in 2010. While 21% in
2011 said they did not know.
2 3 4
19 27
21
22
29 32
26
28 26
29
11 15
2 1 2
0
10
20
30
40
50
60
70
80
90
100
2011 2010 2009
Local roads and footpaths (%)
Don't know
Needs alot of improvement
Needs some improvement
Adequate
Good
Excellent
N=660
7 6 8
30 38
28
30
31
32
10
8 13
3
3 7 21
14 12
0
10
20
30
40
50
60
70
80
90
100
2011 2010 2009
Health and human services (%)
Don't know
Needs alot of improvement
Needs some improvement
Adequate
Good
Excellent
N=658

Page 10
Figure 12: Feedback about recreation facilities- comparison by year
Responses in relation to the good and adequate attributes is relatively stable, with 65% in 2011 and 67% in 2010, with a
higher 12% of people indicating they did not know in 2011.
Figure 13: Feedback about waste management- comparison by year
The results for Waste management remain fairly stable. There were negative comments about the lack of hard waste
collections, which has been commented on each year, and that tip fees are too high. In 2011, 77% rated the service as
adequate or better.
7 8 5
35 33
21
30 34
35
12 14
24
4 5 10
12 6 5
0
10
20
30
40
50
60
70
80
90
100
2011 2010 2009
Recreation facilities
Don't know
Needs alot of improvement
Needs some improvement
Adequate
Good
Excellent
N=658
12 12 10
37 42 33
28 25
27
11 16
14
7 5
9
5 1 6
0
10
20
30
40
50
60
70
80
90
100
2011 2010 2009
Waste management (%)
Don't know
Needs alot of improvement
Needs some improvement
Adequate
Good
Excellent
N=655
Page 11
Figure 14: Feedback about enforcement of local laws- comparison by year
Results for Enforcement of Local Laws showed a slight contraction in the combined good and adequate attributes,
combined results in 2011 was 54% where in 2010 it was 61%. There was a higher percentage (25%) of Don’t know
responses.
Figure 15: Feedback about appearance of public areas- comparison by year
72% of respondents rated the appearance of public areas as adequate or better, a slight decrease on 2010 where it was
75%. However, there was a reduction in the % of people who rated this area in need of some or a lot of improvement,
down to 16% combined percentage in 2011 as compared with 19% in 2010 and 34% in 2009.
5 3 6
25 30 22
29 31
31
10 10
14 6
8 9
25 18 18
0
10
20
30
40
50
60
70
80
90
100
2011 2010 2009
Enforcement of local laws (%)
Don't know
Needs alot of improvement
Needs some improvement
Adequate
Good
Excellent
N=656
7 8 5
35 33
21
30 34
35
12 14
24
4 5 10
12 6 5
0
10
20
30
40
50
60
70
80
90
100
2011 2010 2009
Appearance of public areas (%)
Don't know
Needs alot of improvement
Needs some improvement
Adequate
Good
Excellent
N=657

Page 12
Figure 16: Feedback about traffic management and parking facilities- comparison by year
Results have been consistent across the three surveys, for traffic management and parking facilities.
Figure 17: Feedback about economic development- comparison by year
There was a decrease in satisfaction where 44% rated economic develop as adequate or better in 2011 as compared with 55% in 2010 and 47% in 2009. There was a higher percentage (30%) of don’t know responses from previous years.
5 4 5
28 31 26
33 31 35
19 23 19
9 7 10
6 4 4
0
10
20
30
40
50
60
70
80
90
100
2011 2010 2009
Traffic management and parking facilities (%)
Don't know
Needs alot of improvement
Needs some improvement
Adequate
Good
Excellent
N=658
2 3 3
17 22
15
25
30
29
16
20
19
10
7 15
30 18 18
0
10
20
30
40
50
60
70
80
90
100
2011 2010 2009
Economic Development (%)
Don't know
Needs alot of improvement
Needs some improvement
Adequate
Good
Excellent
N=651

Page 13
Figure 18: Feedback about town planning policy and approvals- comparison by year
There is some variance between the three surveys. There is a marked increase in the percentage of people who answered don’t know (29%), with a slight contraction 17% in 2011 as compared with 24% in previous years, in the percentage of people who believe this area needs a lot of improvement.
Overall Council performance
In this survey we asked a new question, “Overall, across all areas of responsibility in the last 12 months, how do you feel
Council has performed?”
Figure 19: Overall Council performance - 2011
409 (63%) of respondents said that Council was providing an adequate, good or excellent service. 33 (5%) said they don’t know and 142 (22%) and 64 (32%) thought this area needs some improvement or a lot of improvement There were 221 additional comments, which were wide ranging, including:
More outdoor staff
Better representation of all towns, not just Beechworth
Better drainage and infrastructure
Building and planning procedures too difficult or slow
2 2 4 11
18 11
22
24 23
20
18 19
17
24 24
29 16 20
0
10
20
30
40
50
60
70
80
90
100
2011 2010 2009
Town planning policy and approvals (%)
Don't know
Needs alot of improvement
Needs some improvement
Adequate
Good
Excellent
N=650
1%
23%
39%
22%
10%
5%
0%5%
10%15%20%25%30%35%40%45%
Excellent -outstanding
performance- 8
Good - a highstandard- 149
Adequate - anacceptable
standard- 252
Needs someimprovement-
142
Needs a lot ofimprovement- 64
Don't Know /Can't Say- 33
Level of Performance
Overall Council Performance (%)
N=648
Page 14
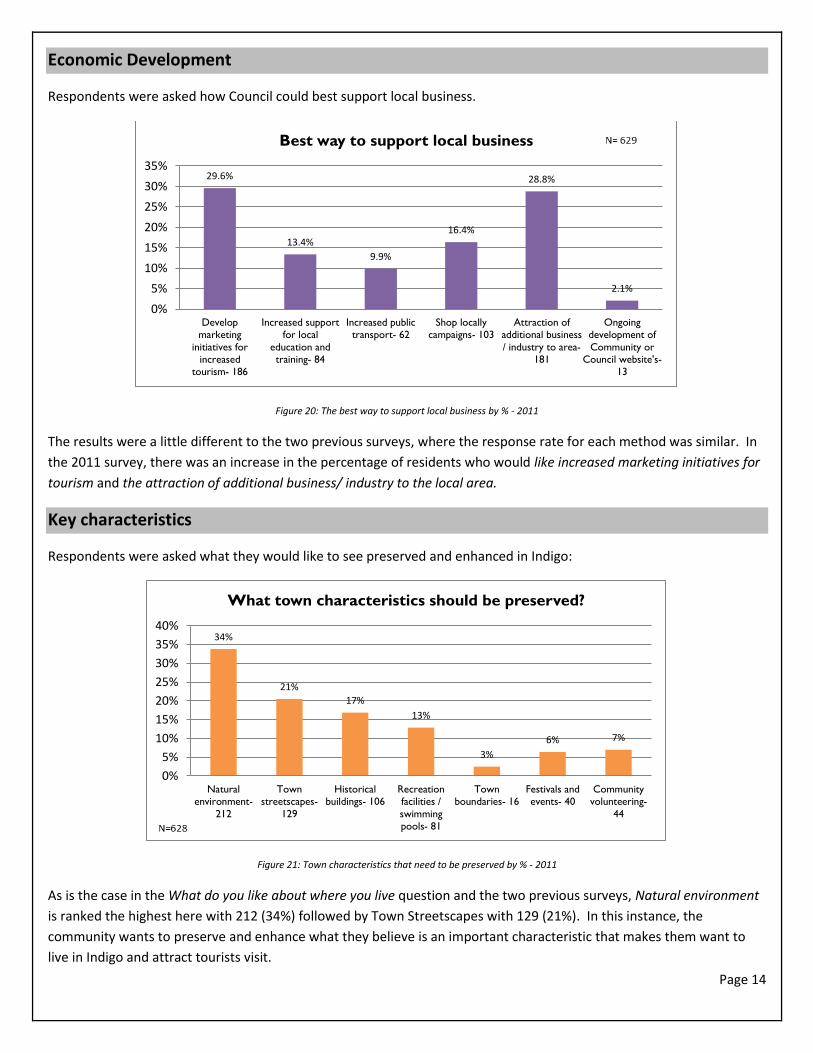
Economic Development
Respondents were asked how Council could best support local business.
Figure 20: The best way to support local business by % - 2011
The results were a little different to the two previous surveys, where the response rate for each method was similar. In
the 2011 survey, there was an increase in the percentage of residents who would like increased marketing initiatives for
tourism and the attraction of additional business/ industry to the local area.
Key characteristics
Respondents were asked what they would like to see preserved and enhanced in Indigo:
Figure 21: Town characteristics that need to be preserved by % - 2011
As is the case in the What do you like about where you live question and the two previous surveys, Natural environment
is ranked the highest here with 212 (34%) followed by Town Streetscapes with 129 (21%). In this instance, the
community wants to preserve and enhance what they believe is an important characteristic that makes them want to
live in Indigo and attract tourists visit.
29.6%
13.4%
9.9%
16.4%
28.8%
2.1%
0%
5%
10%
15%
20%
25%
30%
35%
Developmarketing
initiatives forincreased
tourism- 186
Increased supportfor local
education andtraining- 84
Increased publictransport- 62
Shop locallycampaigns- 103
Attraction ofadditional business
/ industry to area-181
Ongoingdevelopment of
Community orCouncil website's-
13
Best way to support local business
34%
21%
17%
13%
3%
6% 7%
0%
5%
10%
15%
20%
25%
30%
35%
40%
Naturalenvironment-
212
Townstreetscapes-
129
Historicalbuildings- 106
Recreationfacilities /
swimmingpools- 81
Townboundaries- 16
Festivals andevents- 40
Communityvolunteering-
44
What town characteristics should be preserved?
Page 15
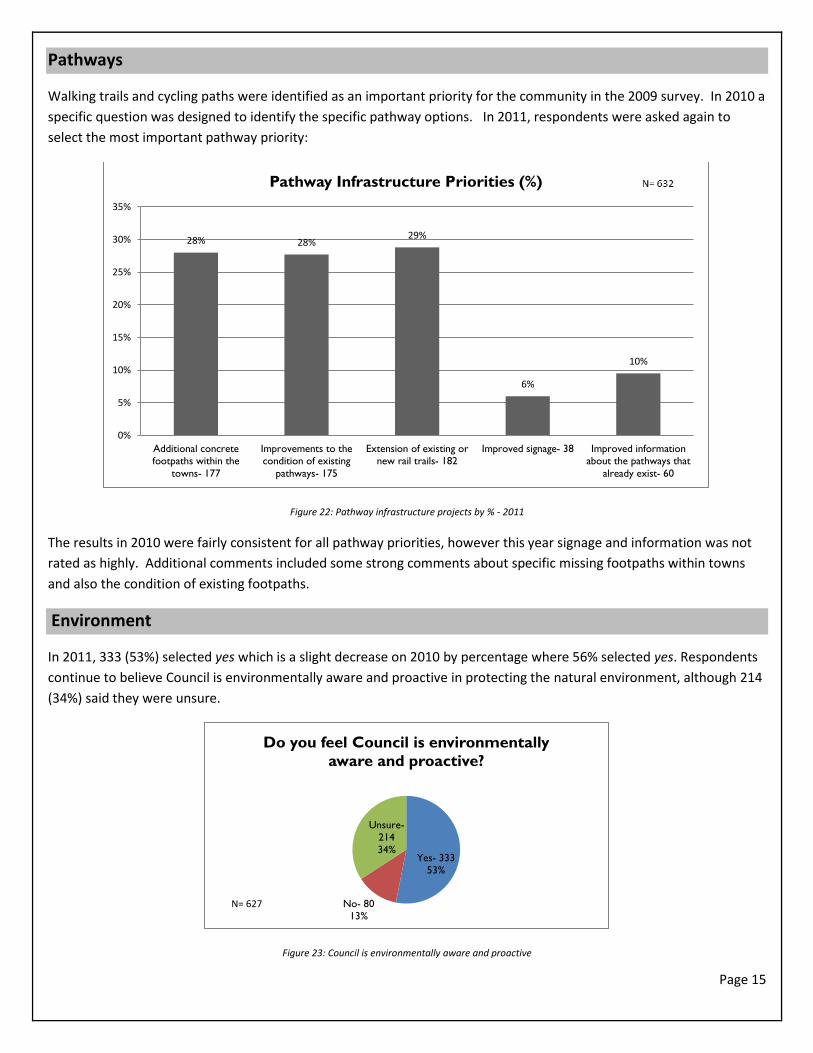
Pathways
Walking trails and cycling paths were identified as an important priority for the community in the 2009 survey. In 2010 a
specific question was designed to identify the specific pathway options. In 2011, respondents were asked again to
select the most important pathway priority:
Figure 22: Pathway infrastructure projects by % - 2011
The results in 2010 were fairly consistent for all pathway priorities, however this year signage and information was not
rated as highly. Additional comments included some strong comments about specific missing footpaths within towns
and also the condition of existing footpaths.
Environment
In 2011, 333 (53%) selected yes which is a slight decrease on 2010 by percentage where 56% selected yes. Respondents
continue to believe Council is environmentally aware and proactive in protecting the natural environment, although 214
(34%) said they were unsure.
Figure 23: Council is environmentally aware and proactive
28% 28% 29%
6%
10%
0%
5%
10%
15%
20%
25%
30%
35%
Additional concretefootpaths within the
towns- 177
Improvements to thecondition of existing
pathways- 175
Extension of existing ornew rail trails- 182
Improved signage- 38 Improved informationabout the pathways that
already exist- 60
Pathway Infrastructure Priorities (%)
Yes- 333 53%
No- 80 13%
Unsure- 214
34%
Do you feel Council is environmentally
aware and proactive?
N= 627
Page 16
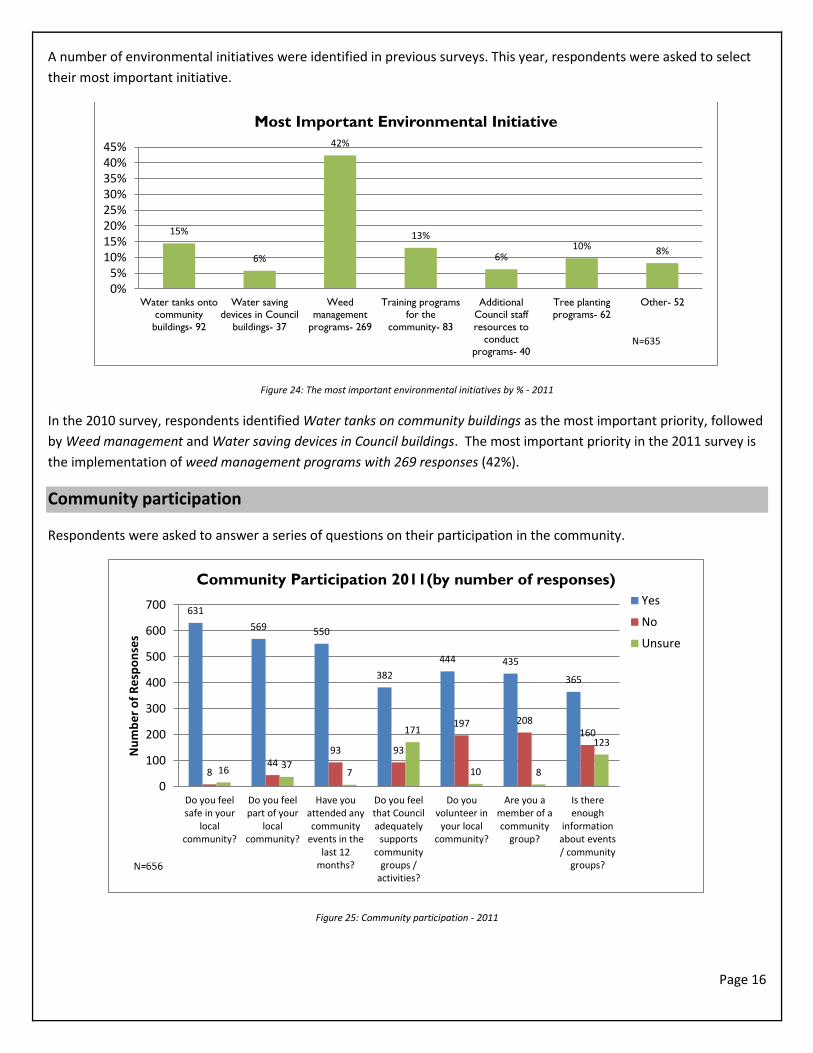
A number of environmental initiatives were identified in previous surveys. This year, respondents were asked to select
their most important initiative.
Figure 24: The most important environmental initiatives by % - 2011
In the 2010 survey, respondents identified Water tanks on community buildings as the most important priority, followed
by Weed management and Water saving devices in Council buildings. The most important priority in the 2011 survey is
the implementation of weed management programs with 269 responses (42%).
Community participation
Respondents were asked to answer a series of questions on their participation in the community.
Figure 25: Community participation - 2011
15%
6%
42%
13%
6% 10% 8%
0%5%
10%15%20%25%30%35%40%45%
Water tanks ontocommunity
buildings- 92
Water savingdevices in Council
buildings- 37
Weedmanagement
programs- 269
Training programsfor the
community- 83
AdditionalCouncil staff
resources toconduct
programs- 40
Tree plantingprograms- 62
Other- 52
Most Important Environmental Initiative
N=635
631
569 550
382
444 435
365
8 44
93 93
197 208 160
16 37
7
171
10 8
123
0
100
200
300
400
500
600
700
Do you feelsafe in your
localcommunity?
Do you feelpart of your
localcommunity?
Have youattended anycommunity
events in thelast 12
months?
Do you feelthat Counciladequately
supportscommunity
groups /activities?
Do youvolunteer in
your localcommunity?
Are you amember of acommunity
group?
Is thereenough
informationabout events/ community
groups?
Nu
mb
er
of
Re
spo
nse
s
Community Participation 2011(by number of responses)
Yes
No
Unsure
Page 17
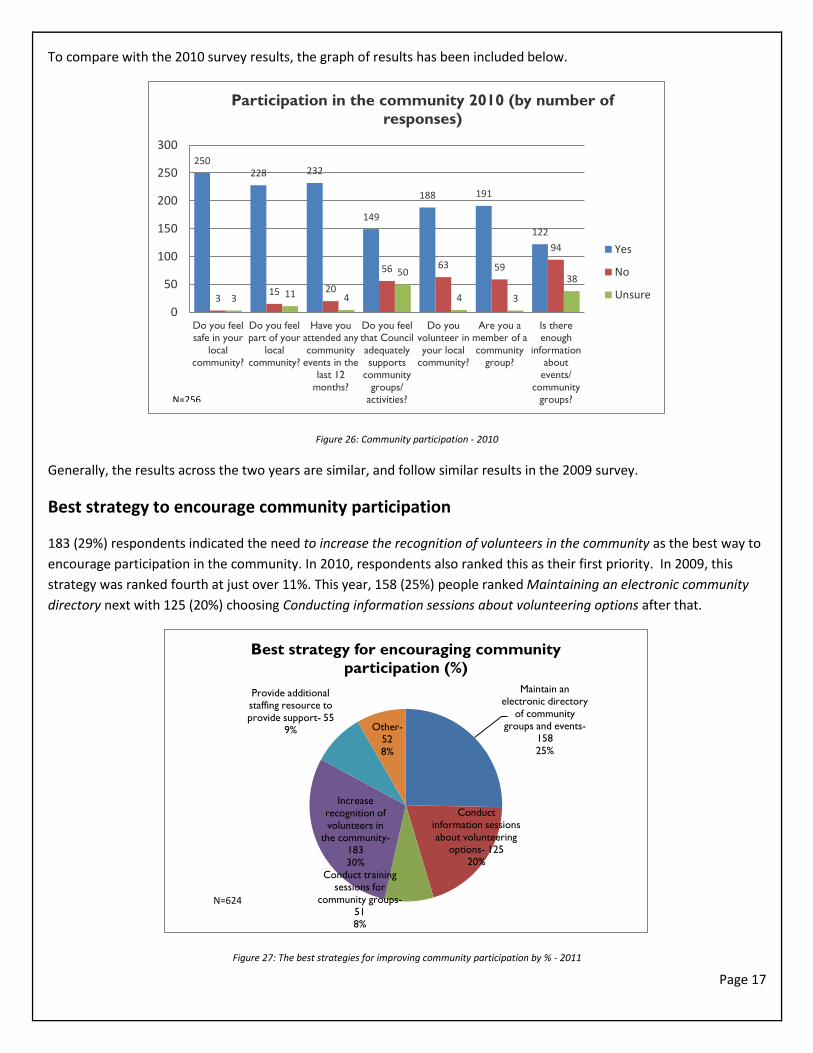
To compare with the 2010 survey results, the graph of results has been included below.
Figure 26: Community participation - 2010
Generally, the results across the two years are similar, and follow similar results in the 2009 survey.
Best strategy to encourage community participation
183 (29%) respondents indicated the need to increase the recognition of volunteers in the community as the best way to
encourage participation in the community. In 2010, respondents also ranked this as their first priority. In 2009, this
strategy was ranked fourth at just over 11%. This year, 158 (25%) people ranked Maintaining an electronic community
directory next with 125 (20%) choosing Conducting information sessions about volunteering options after that.
Figure 27: The best strategies for improving community participation by % - 2011
250 228 232
149
188 191
122
3 15 20
56 63 59
94
3 11 4
50
4 3
38
0
50
100
150
200
250
300
Do you feelsafe in your
localcommunity?
Do you feelpart of your
localcommunity?
Have youattended any
communityevents in the
last 12
months?
Do you feelthat Council
adequatelysupports
community
groups/activities?
Do youvolunteer in
your localcommunity?
Are you amember of a
communitygroup?
Is thereenough
informationabout
events/
communitygroups?
Participation in the community 2010 (by number of
responses)
Yes
No
Unsure
N=256
Maintain an electronic directory
of community groups and events-
158
25%
Conduct information sessions
about volunteering options- 125
20%
Conduct training sessions for
community groups- 51 8%
Increase
recognition of
volunteers in the community-
183
30%
Provide additional staffing resource to
provide support- 55 9% Other-
52
8%
Best strategy for encouraging community
participation (%)
N=624
Page 18
Additional comments from respondents suggest ways to recognise volunteers. Comments also include the need to
circulate information in hard copy format and via the post or newspapers, as people do not have access to the internet.
The Council’s Community Strengthening Project was mentioned in the comments as a positive program.
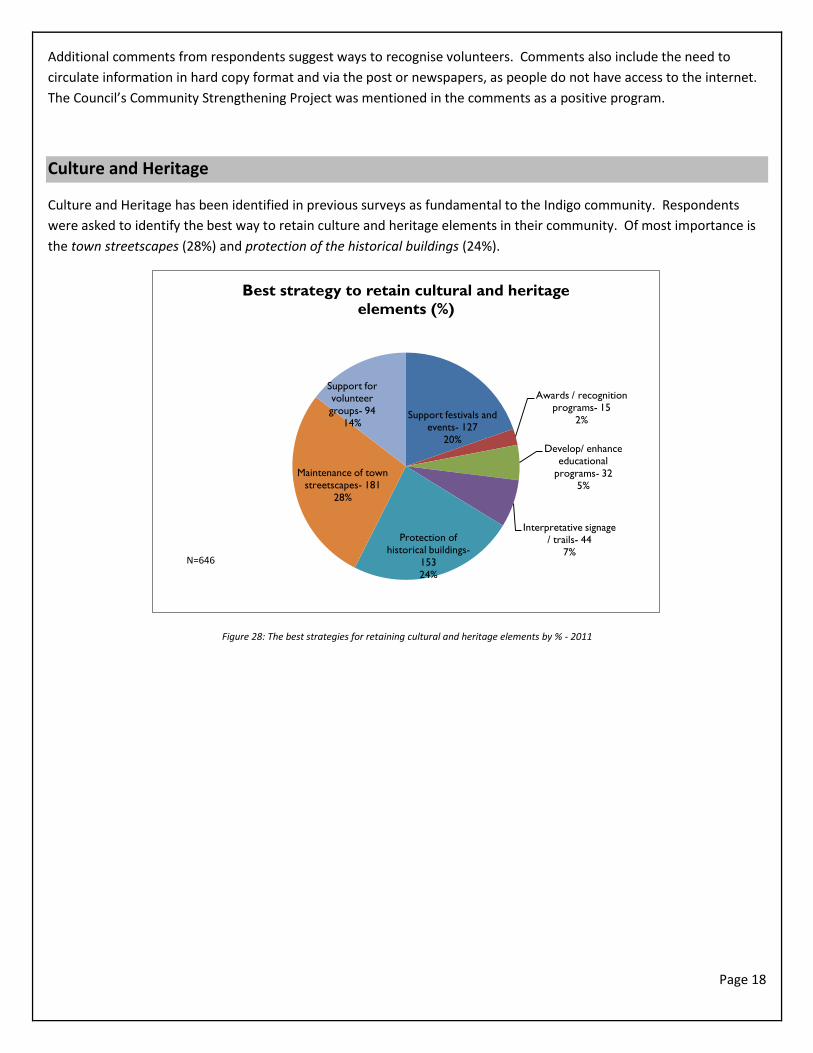
Culture and Heritage
Culture and Heritage has been identified in previous surveys as fundamental to the Indigo community. Respondents
were asked to identify the best way to retain culture and heritage elements in their community. Of most importance is
the town streetscapes (28%) and protection of the historical buildings (24%).
Figure 28: The best strategies for retaining cultural and heritage elements by % - 2011
Support festivals and events- 127
20%
Awards / recognition programs- 15
2%
Develop/ enhance educational
programs- 32
5%
Interpretative signage / trails- 44
7%
Protection of historical buildings-
153 24%
Maintenance of town streetscapes- 181
28%
Support for volunteer
groups- 94 14%
Best strategy to retain cultural and heritage
elements (%)
N=646
Page 19
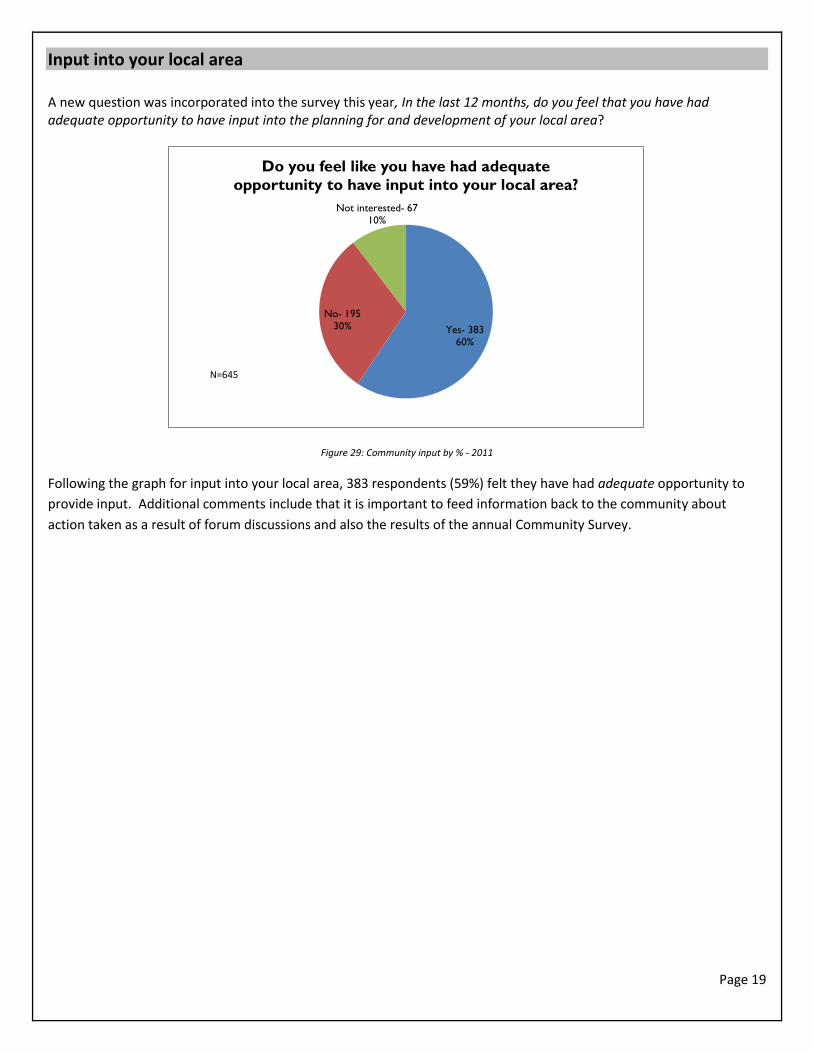
Input into your local area A new question was incorporated into the survey this year, In the last 12 months, do you feel that you have had adequate opportunity to have input into the planning for and development of your local area?
Figure 29: Community input by % - 2011
Following the graph for input into your local area, 383 respondents (59%) felt they have had adequate opportunity to
provide input. Additional comments include that it is important to feed information back to the community about
action taken as a result of forum discussions and also the results of the annual Community Survey.
Yes- 383 60%
No- 195
30%
Not interested- 67 10%
Do you feel like you have had adequate
opportunity to have input into your local area?
N=645