community satisfaction survey report
TRANSCRIPT

Project 11201 | NOVEMBER 2018
CITY OF SALISBURYCOMMUNITY SATISFACTION
SURVEY REPORT
1
Contents
PURPOSE AND METHODOLOGY 2
EXECUTIVE SUMMARY 3
ANALYSIS 7
• Satisfaction with Quality of Life in the Salisbury Council Area 8
• Satisfaction with Council services 22
• Net Promoter Score 37
• Core Council Services 41
• Safety with the Salisbury Council Area 51
• Communication and Contact 54
• Living in the city of Salisbury 62
APPENDICES:
1. Respondent Profile 72
2. Multiple Regression Tables 78
3. Guide to Reading the Report 81
4. Sampling Tolerance 83
5. Survey Tool 85
11201 – City of Salisbury Community Satisfaction Survey Report
Research Methodology
2
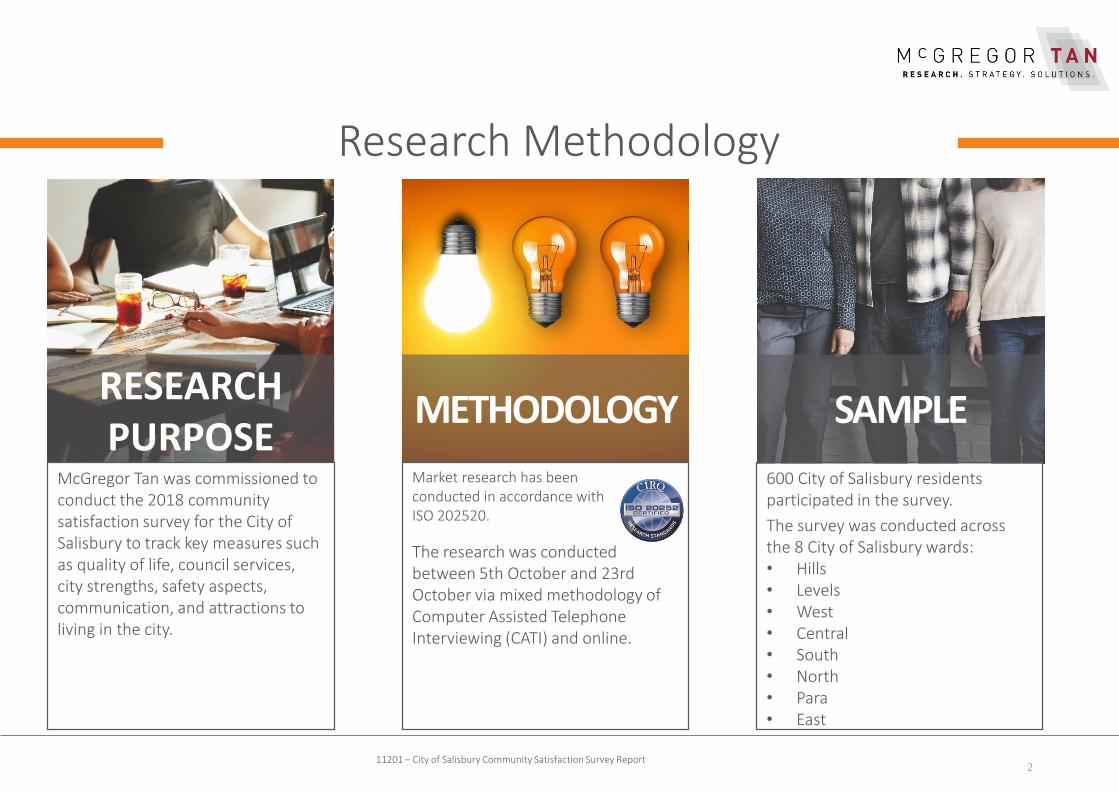
RESEARCH PURPOSE
McGregor Tan was commissioned to conduct the 2018 community satisfaction survey for the City of Salisbury to track key measures such as quality of life, council services, city strengths, safety aspects, communication, and attractions to living in the city.
METHODOLOGY
Market research has been conducted in accordance with ISO 202520.
The research was conducted between 5th October and 23rd October via mixed methodology of Computer Assisted Telephone Interviewing (CATI) and online.
600 City of Salisbury residents participated in the survey.
The survey was conducted across the 8 City of Salisbury wards:• Hills• Levels• West• Central• South• North• Para• East
SAMPLE
11201 – City of Salisbury Community Satisfaction Survey Report

EXECUTIVE SUMMARY
EXECUTIVE SUMMARY
McGregor Tan was commissioned by the City of Salisbury to conduct anannual survey with households within the City to measure the community’sperceptions on a range of services and attributes of the City, by tracking keymeasures such as quality of life, council services, city strengths, safetyaspects, communication, and attractions to living in the City.
The research was conducted between 5th October and 23rd October viamixed methodology of Computer Assisted Telephone Interviewing (CATI) andonline. 600 City of Salisbury residents participated in the survey that wasconducted across the 8 City of Salisbury wards: Hills, Levels, West, Central,South, North, Para, and East.
QUALITY OF LIFE
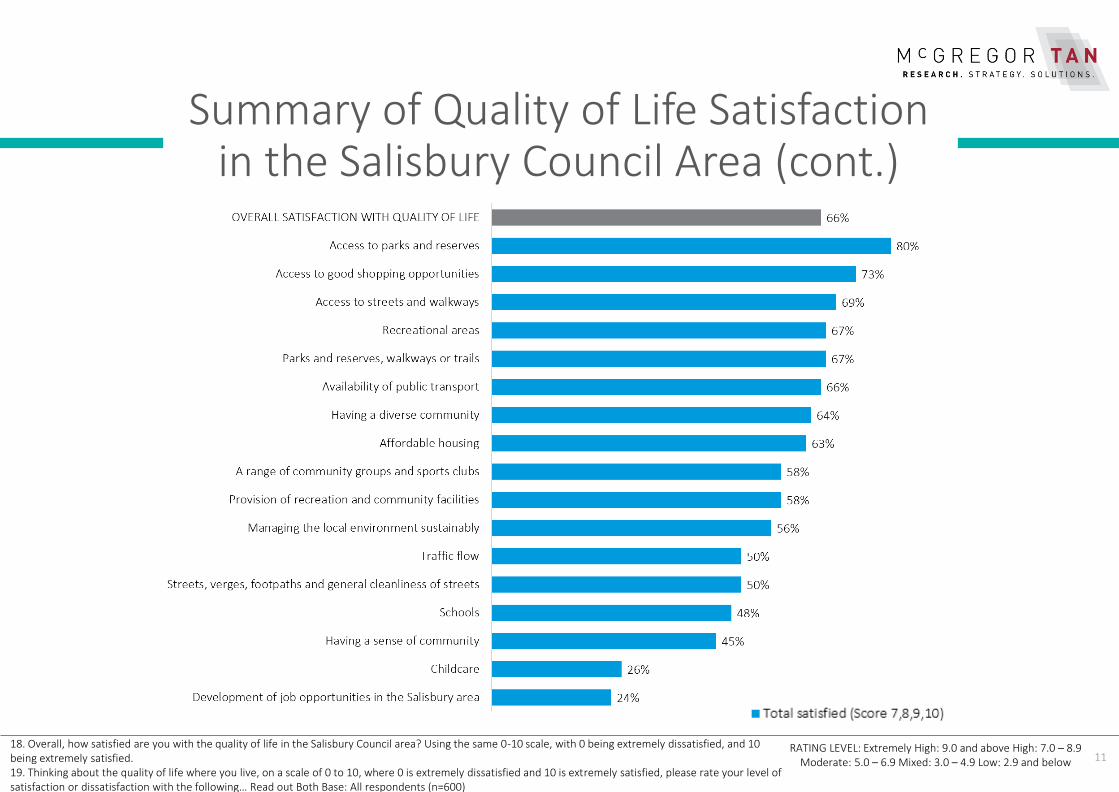
Research revealed a moderate level of satisfaction (mean rating of 6.9, downfrom 7.5 in 2016) with the quality of life in the Salisbury Council area, withrespondents most satisfied with access to parks and reserves, access to goodshopping opportunities, and access to streets and walkways, however theyare least satisfied with development of job opportunities in the Salisburyarea, childcare and having a sense of community.
Five key attribute drivers determined the overall satisfaction with the qualityof life in the Salisbury Council area –
• Access to parks and reserves
• Development of job opportunities in the Salisbury area
• Having a diverse community
• Having a sense of community
• Managing local environmental sustainability
COUNCIL SERVICES
Satisfaction with the services delivered by Salisbury Council has decreased,with two thirds (65%) of residents indicating they were satisfied with theservices delivered, recording a moderate rating of 6.8 (down from 7.4 in2016).
Respondents from the Central Ward (81%) are most satisfied with theCouncil’s services compared to other wards, whilst only 51% of those in theEast Ward were satisfied. The top 3 services respondents are most satisfiedwith include general rubbish collection and services, recycling collection andservices, and green waste collection and services, while the 3 servicesrespondents are least satisfied with include services for the disabled, theyouth and the aged. The main reason respondents felt dissatisfied was dueto the Council ignoring queries and requests for maintenance.
411201 – City of Salisbury Community Satisfaction Survey Report
EXECUTIVE SUMMARY
STRENGTHS
Parks and reserves (37%, up from 8% in 2016) and cost of housing (33%, upfrom 13% in 2016) were identified as key strengths of the City of Salisbury.Those who would be likely to promote living in the City of Salisburymentioned location (40%), shopping centres (39%) and availability ofservices (38%) as strengths of the City of Salisbury.
The top 3 services that are most important to respondents include generalrubbish collection and services, parks and reserves maintenance, and roadmaintenance.
NET PROMOTER SCORE
One in ten (18%) respondents indicated that they are highly likely torecommend living in the Salisbury Council area. City of Salisbury residentsrecorded an net promoter score of -20 for likelihood of recommending livingin the Council area. This score is higher than the City of Salisbury benchmarkscore of -34.
DEMOGRAPHICS
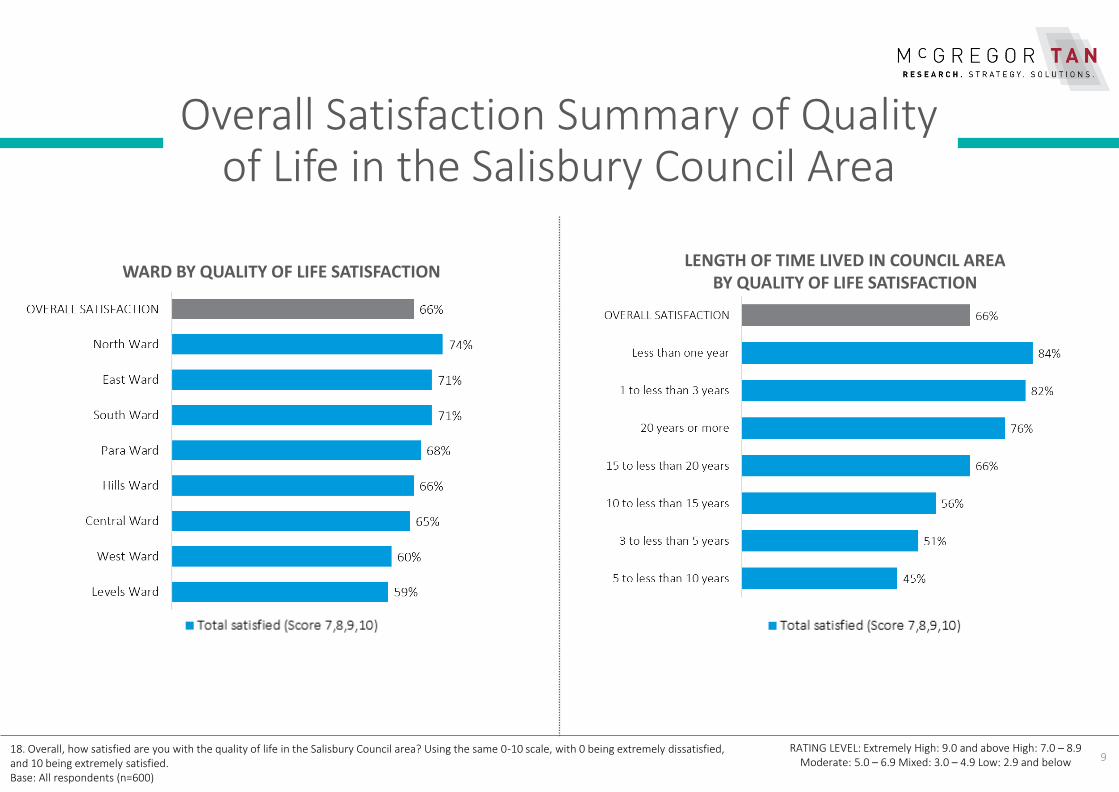
The highest level of satisfaction with the quality of life was at North Ward(74%) and lowest in the Levels Ward (59%). A higher percentage of malerespondents (67%) were satisfied compared to females (64%). Respondentswho have lived in the council area for less than 1 year seem to be more
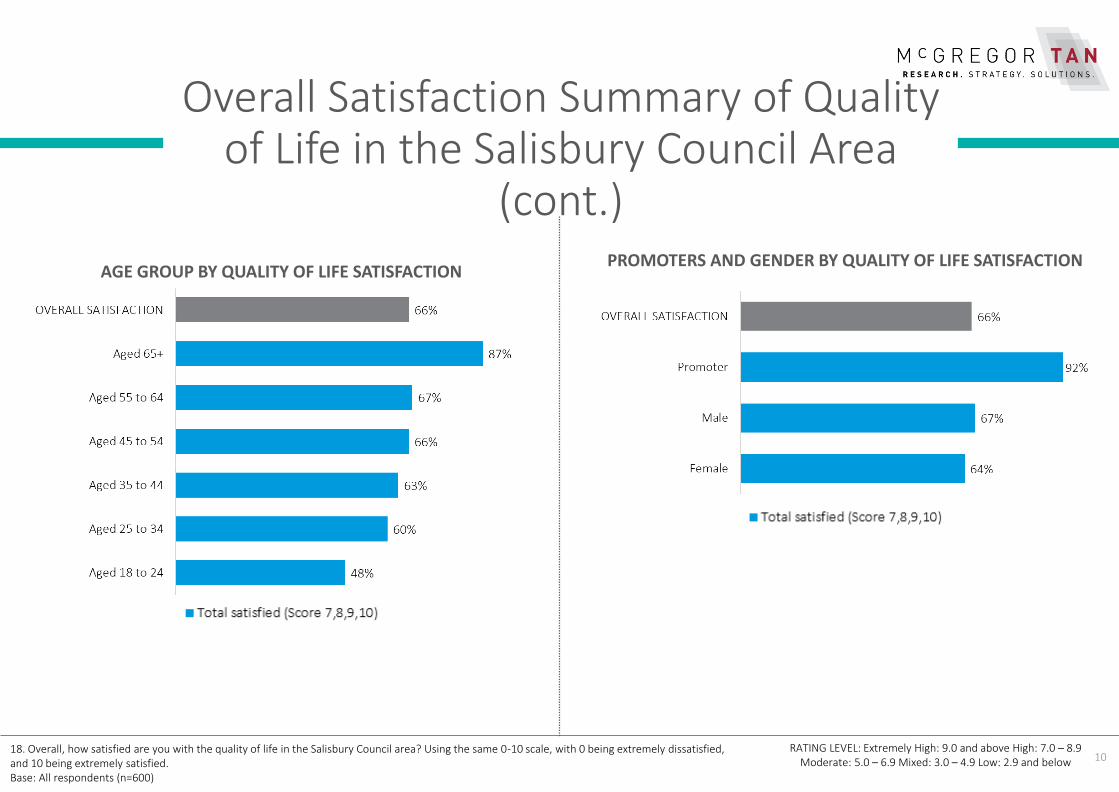
satisfied (84%) than others, while satisfaction levels are lowest (45%) forthose who have lived between 5 and 10 years. Respondents aged between18 and 24 are least satisfied with the quality of life in the City (48%), whilethose aged 65 plus are most satisfied (87%).
CORE COUNCIL SERVICES
Each Council service was identified as a core service by City of Salisburyresidents, with Parks and reserves maintenance (95%, down from 98% in2016), Footpath maintenance (94%, down from 96% in 2016), Green wastecollection and services (94%, down from 97% in 2016) and General rubbishcollection services (94%, down from 96% in 2016) being the 4 topresponses.
The respondents held the Council and State Government mainly responsiblefor the listed services. Other council services mentioned by respondentsinclude animal and pest control, better communication, community bus,community gardens, green waste collection, home care services, moreactivities for the youth and elderly, and more services for the elderly anddisabled.
511201 – City of Salisbury Community Satisfaction Survey Report

EXECUTIVE SUMMARY
SAFETY
More than half (55%) indicated they felt safe in the Salisbury Council area,recording a moderate rating of 6.2 (down from 7.1 in 2016). The mainreason respondents felt unsafe was due to the people in the area (38%). Ofthose who scored a 0-5 for safety, the top locations respondents felt unsafein are the train station (18%,unchanged from 2016), everywhere, all areas(15%, up from 14% in 2016) and Parabanks (15%).
When asked their particular reason for feeling unsafe, respondents citeddrug and alcohol problems (58%, up from 27% in 2016), hoons, gangs andyouths loitering (50%, up from 27% in 2016) and home invasions / break ins(47%, up from 25% in 2016) as the main reasons mentioned by residents.
COMMUNICATION
Responses showed a significant increase in all types of currentcommunication for the City of Salisbury residents, who are currentlyinformed about Council events, services and Council’s key directions by mail/ letterbox drop (56%, up from 53% in 2016), brochures / flyers / otherpublication (55%, up from 17% in 2016) and Salisbury Aware Magazine(43%, up from 28% in 2016).
Residents indicated they would prefer to find out about Council events,services and Council’s key directions via mail / letterbox drop (53%),
Facebook (33%) and brochures / flyers / other publications (32%). WhileFacebook is not in the top three current methods of communication forkeeping informed, it is a preferred way to find out about events, services andCouncil’s key directions, especially for the younger residents as they aremore likely to use social media. Those older, preferred over the phone or in-person communications.
Research indicated moderate to high levels of satisfaction when residentswere asked to rate their satisfaction with the contact they had with Councilstaff, and with elected members or councillors.
ATTRACTIONS
Cost of housing and location were listed as top responses to why residentswere attracted to living in the area. Respondents agreed with the fact thatthey liked living in their local community and could get help from family,friends and neighbours. The majority of respondents however, stated theydo not participate in any of the community activities listed.
611201 – City of Salisbury Community Satisfaction Survey Report

ANALYSIS
SATISFACTION WITH QUALITY
OF LIFE IN SALISBURY
COUNCIL AREA
9
Overall Satisfaction Summary of Quality of Life in the Salisbury Council Area
18. Overall, how satisfied are you with the quality of life in the Salisbury Council area? Using the same 0-10 scale, with 0 being extremely dissatisfied, and 10 being extremely satisfied.Base: All respondents (n=600)
RATING LEVEL: Extremely High: 9.0 and above High: 7.0 – 8.9 Moderate: 5.0 – 6.9 Mixed: 3.0 – 4.9 Low: 2.9 and below
WARD BY QUALITY OF LIFE SATISFACTIONLENGTH OF TIME LIVED IN COUNCIL AREA
BY QUALITY OF LIFE SATISFACTION
10
Overall Satisfaction Summary of Quality of Life in the Salisbury Council Area
(cont.)
18. Overall, how satisfied are you with the quality of life in the Salisbury Council area? Using the same 0-10 scale, with 0 being extremely dissatisfied, and 10 being extremely satisfied.Base: All respondents (n=600)
RATING LEVEL: Extremely High: 9.0 and above High: 7.0 – 8.9 Moderate: 5.0 – 6.9 Mixed: 3.0 – 4.9 Low: 2.9 and below
AGE GROUP BY QUALITY OF LIFE SATISFACTIONPROMOTERS AND GENDER BY QUALITY OF LIFE SATISFACTION
11
Summary of Quality of Life Satisfaction in the Salisbury Council Area (cont.)
RATING LEVEL: Extremely High: 9.0 and above High: 7.0 – 8.9 Moderate: 5.0 – 6.9 Mixed: 3.0 – 4.9 Low: 2.9 and below
18. Overall, how satisfied are you with the quality of life in the Salisbury Council area? Using the same 0-10 scale, with 0 being extremely dissatisfied, and 10 being extremely satisfied.19. Thinking about the quality of life where you live, on a scale of 0 to 10, where 0 is extremely dissatisfied and 10 is extremely satisfied, please rate your level of satisfaction or dissatisfaction with the following… Read out Both Base: All respondents (n=600)

Low (0,1,2,3)
Moderate (4,5,6)
High(7,8,9,10)
Mean score
Overall level of satisfaction with quality of life
6.9Extremely satisfied (score 10): 11% Extremely dissatisfied (score 0): 1%
Overall, satisfaction with the quality of life in the Salisbury Council area has decreased, with two thirds (66%) of residents indicating they were satisfied, recording a moderate rating of 6.9 ( from 7.5 in 2016).
Those aged 65 plus (87%), those who have lived in the Council area for 20 years or more (76%), those who indicated they are satisfied with the services delivered by Salisbury Council (83%) and those who indicated they would be likely to promote living in the City of Salisbury (92%) were more likely be satisfied with the quality of life in the Salisbury Council area.
12
Overall Satisfaction with Quality of Life in Salisbury Council Area
RATING LEVEL: Extremely High: 9.0 and above High: 7.0 – 8.9 Moderate: 5.0 – 6.9 Mixed: 3.0 – 4.9 Low: 2.9 and below
18. Overall, how satisfied are you with the quality of life in the Salisbury Council area? Using the same 0-10 scale, with 0 being extremely dissatisfied, and 10 being extremely satisfied.Base: All respondents (n=600)
TRACKING LEVEL OF OVERALL SATISFACTION WITH QUALITY OF LIFE
OVERALL SATISFACTION WITH QUALITY OF LIFE BY KEY DEMOGRAPHICS
2018 Average mean score
(6.9)
13
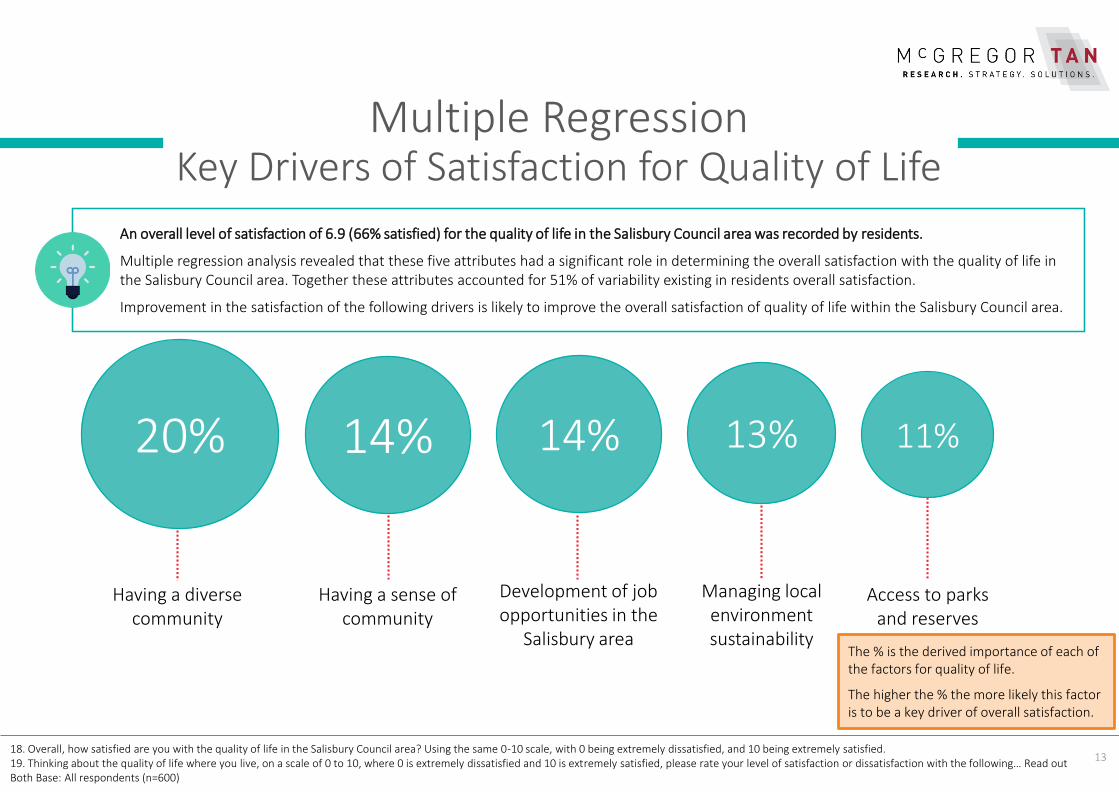
Multiple Regression Key Drivers of Satisfaction for Quality of Life
An overall level of satisfaction of 6.9 (66% satisfied) for the quality of life in the Salisbury Council area was recorded by residents.
Multiple regression analysis revealed that these five attributes had a significant role in determining the overall satisfaction with the quality of life in the Salisbury Council area. Together these attributes accounted for 51% of variability existing in residents overall satisfaction.
Improvement in the satisfaction of the following drivers is likely to improve the overall satisfaction of quality of life within the Salisbury Council area.
18. Overall, how satisfied are you with the quality of life in the Salisbury Council area? Using the same 0-10 scale, with 0 being extremely dissatisfied, and 10 being extremely satisfied.19. Thinking about the quality of life where you live, on a scale of 0 to 10, where 0 is extremely dissatisfied and 10 is extremely satisfied, please rate your level of satisfaction or dissatisfaction with the following… Read outBoth Base: All respondents (n=600)
The % is the derived importance of each of the factors for quality of life.
The higher the % the more likely this factor is to be a key driver of overall satisfaction.
20% 14% 14% 13%
Having a diverse community
Having a sense of community
Development of job opportunities in the
Salisbury area
Managing local environment sustainability
Access to parks and reserves
11%
Low (0,1,2,3)
Moderate (4,5,6)
High(7,8,9,10)
Mean score
Commentary
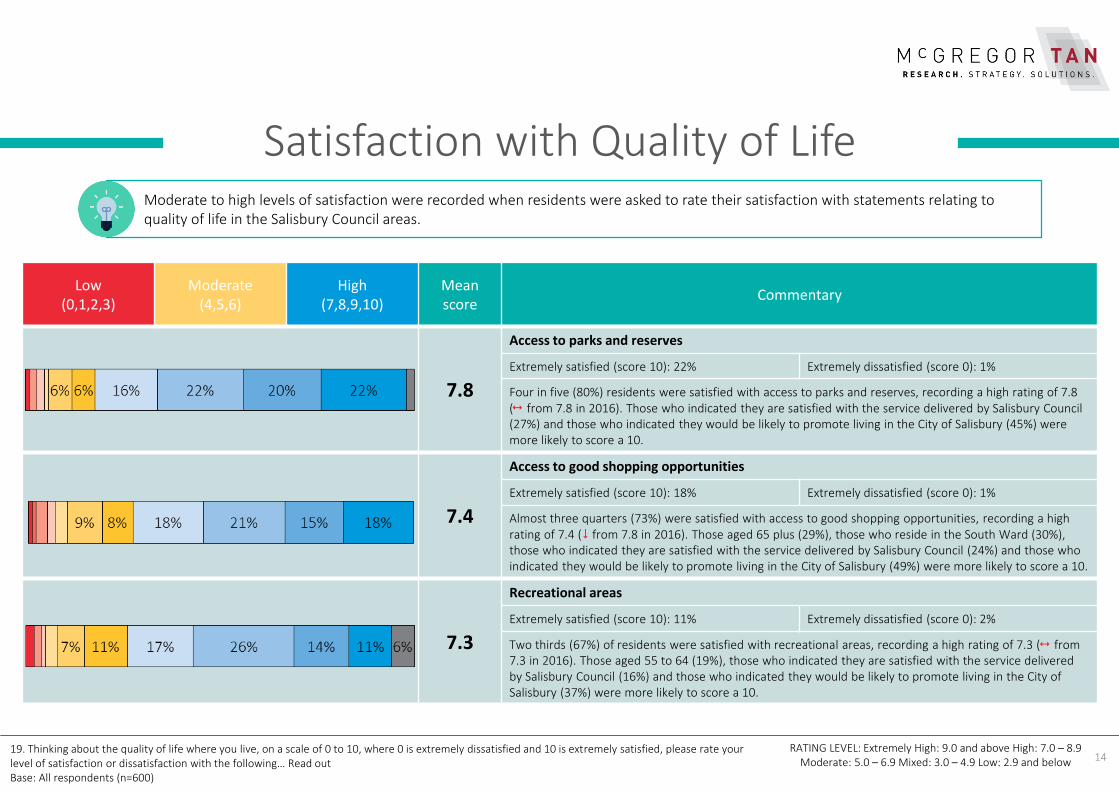
7.8
Access to parks and reserves
Extremely satisfied (score 10): 22% Extremely dissatisfied (score 0): 1%
Four in five (80%) residents were satisfied with access to parks and reserves, recording a high rating of 7.8 ( from 7.8 in 2016). Those who indicated they are satisfied with the service delivered by Salisbury Council (27%) and those who indicated they would be likely to promote living in the City of Salisbury (45%) were more likely to score a 10.
7.4
Access to good shopping opportunities
Extremely satisfied (score 10): 18% Extremely dissatisfied (score 0): 1%
Almost three quarters (73%) were satisfied with access to good shopping opportunities, recording a high rating of 7.4 ( from 7.8 in 2016). Those aged 65 plus (29%), those who reside in the South Ward (30%), those who indicated they are satisfied with the service delivered by Salisbury Council (24%) and those who indicated they would be likely to promote living in the City of Salisbury (49%) were more likely to score a 10.
7.3
Recreational areas
Extremely satisfied (score 10): 11% Extremely dissatisfied (score 0): 2%
Two thirds (67%) of residents were satisfied with recreational areas, recording a high rating of 7.3 ( from 7.3 in 2016). Those aged 55 to 64 (19%), those who indicated they are satisfied with the service delivered by Salisbury Council (16%) and those who indicated they would be likely to promote living in the City of Salisbury (37%) were more likely to score a 10.
14
Satisfaction with Quality of Life
RATING LEVEL: Extremely High: 9.0 and above High: 7.0 – 8.9 Moderate: 5.0 – 6.9 Mixed: 3.0 – 4.9 Low: 2.9 and below
19. Thinking about the quality of life where you live, on a scale of 0 to 10, where 0 is extremely dissatisfied and 10 is extremely satisfied, please rate your level of satisfaction or dissatisfaction with the following… Read outBase: All respondents (n=600)
Moderate to high levels of satisfaction were recorded when residents were asked to rate their satisfaction with statements relating to quality of life in the Salisbury Council areas.
Low (0,1,2,3)
Moderate (4,5,6)
High(7,8,9,10)
Mean score
Commentary
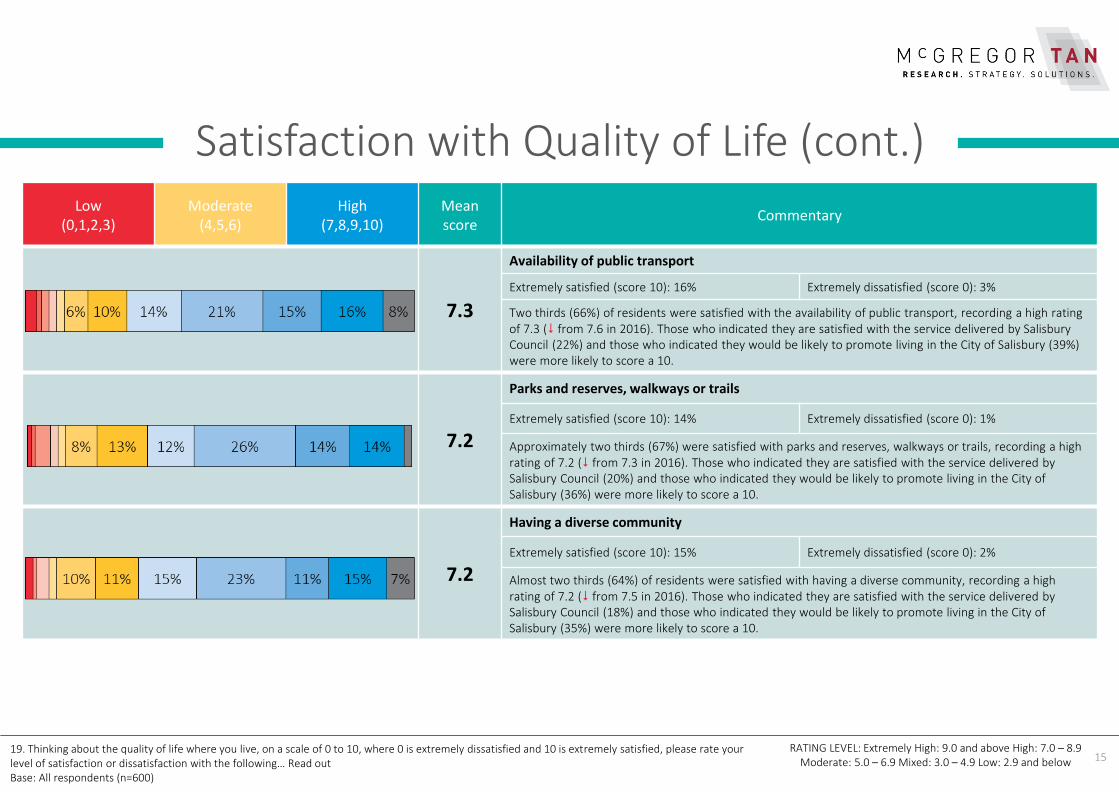
7.3
Availability of public transport
Extremely satisfied (score 10): 16% Extremely dissatisfied (score 0): 3%
Two thirds (66%) of residents were satisfied with the availability of public transport, recording a high rating of 7.3 ( from 7.6 in 2016). Those who indicated they are satisfied with the service delivered by Salisbury Council (22%) and those who indicated they would be likely to promote living in the City of Salisbury (39%) were more likely to score a 10.
7.2
Parks and reserves, walkways or trails
Extremely satisfied (score 10): 14% Extremely dissatisfied (score 0): 1%
Approximately two thirds (67%) were satisfied with parks and reserves, walkways or trails, recording a high rating of 7.2 ( from 7.3 in 2016). Those who indicated they are satisfied with the service delivered by Salisbury Council (20%) and those who indicated they would be likely to promote living in the City of Salisbury (36%) were more likely to score a 10.
7.2
Having a diverse community
Extremely satisfied (score 10): 15% Extremely dissatisfied (score 0): 2%
Almost two thirds (64%) of residents were satisfied with having a diverse community, recording a high rating of 7.2 ( from 7.5 in 2016). Those who indicated they are satisfied with the service delivered by Salisbury Council (18%) and those who indicated they would be likely to promote living in the City of Salisbury (35%) were more likely to score a 10.
15
Satisfaction with Quality of Life (cont.)
RATING LEVEL: Extremely High: 9.0 and above High: 7.0 – 8.9 Moderate: 5.0 – 6.9 Mixed: 3.0 – 4.9 Low: 2.9 and below
19. Thinking about the quality of life where you live, on a scale of 0 to 10, where 0 is extremely dissatisfied and 10 is extremely satisfied, please rate your level of satisfaction or dissatisfaction with the following… Read outBase: All respondents (n=600)

Low (0,1,2,3)
Moderate (4,5,6)
High(7,8,9,10)
Mean score
Commentary
7.2
Affordable housing
Extremely satisfied (score 10): 13% Extremely dissatisfied (score 0): 2%
More than three in five (63%) residents were satisfied with affordable housing, recording a high rating of 7.2 ( from 7.1 in 2016). Those who reside in the West Ward (25%), those who indicated they are satisfied with the service delivered by Salisbury Council (15%) and those who indicated they would be likely to promote living in the City of Salisbury (32%) were more likely to score a 10.
7.2
Schools
Extremely satisfied (score 10): 10% Extremely dissatisfied (score 0): 1%
Almost half (48%) were satisfied with schools, recording a high rating of 7.2 ( from 7.7 in 2016). Those who indicated they are satisfied with the service delivered by Salisbury Council (14%) and those who indicated they would be likely to promote living in the City of Salisbury (30%) were more likely to score a 10.
7.1
Access to streets and walkways
Extremely satisfied (score 10): 14% Extremely dissatisfied (score 0): 2%
Seven in ten (69%) residents were satisfied with access to streets and walkways, recording a high rating of 7.1 ( from 7.4 in 2016). Those who indicated they are satisfied with the service delivered by Salisbury Council (18%) and those who indicated they would be likely to promote living in the City of Salisbury (37%) were more likely to score a 10.
16
Satisfaction with Quality of Life (cont.)
RATING LEVEL: Extremely High: 9.0 and above High: 7.0 – 8.9 Moderate: 5.0 – 6.9 Mixed: 3.0 – 4.9 Low: 2.9 and below
19. Thinking about the quality of life where you live, on a scale of 0 to 10, where 0 is extremely dissatisfied and 10 is extremely satisfied, please rate your level of satisfaction or dissatisfaction with the following… Read outBase: All respondents (n=600)
Low (0,1,2,3)
Moderate (4,5,6)
High(7,8,9,10)
Mean score
Commentary
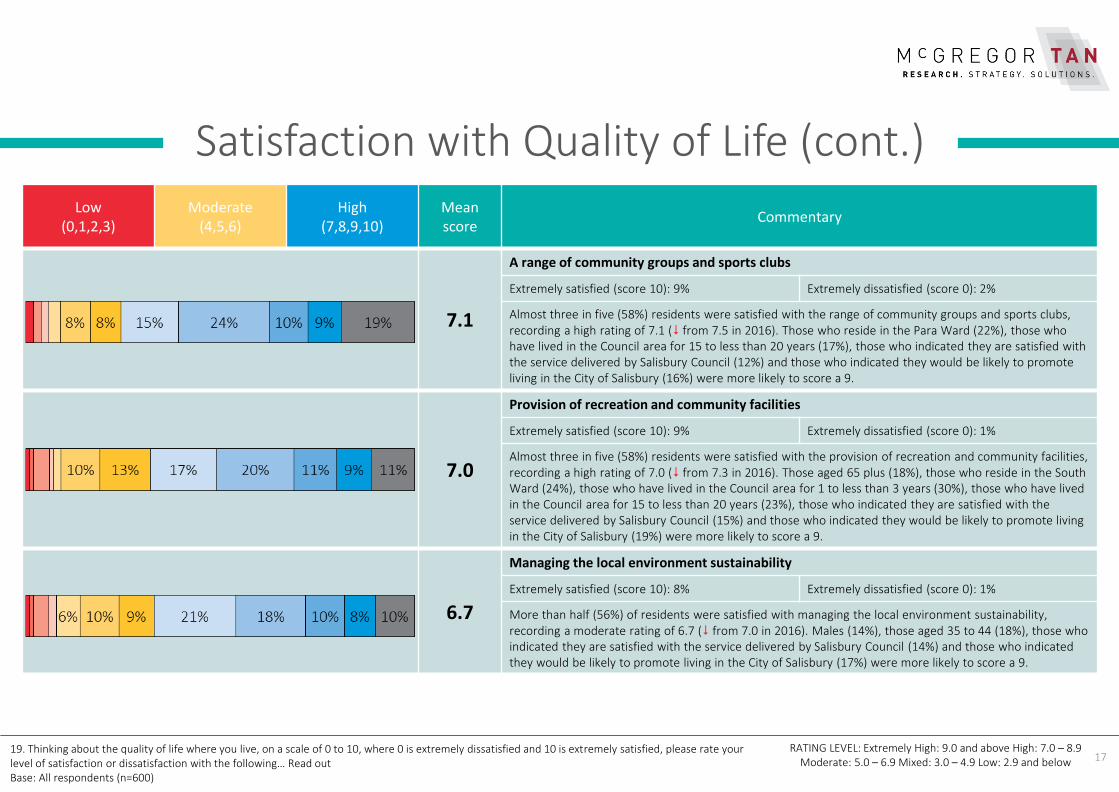
7.1
A range of community groups and sports clubs
Extremely satisfied (score 10): 9% Extremely dissatisfied (score 0): 2%
Almost three in five (58%) residents were satisfied with the range of community groups and sports clubs, recording a high rating of 7.1 ( from 7.5 in 2016). Those who reside in the Para Ward (22%), those who have lived in the Council area for 15 to less than 20 years (17%), those who indicated they are satisfied with the service delivered by Salisbury Council (12%) and those who indicated they would be likely to promote living in the City of Salisbury (16%) were more likely to score a 9.
7.0
Provision of recreation and community facilities
Extremely satisfied (score 10): 9% Extremely dissatisfied (score 0): 1%
Almost three in five (58%) residents were satisfied with the provision of recreation and community facilities, recording a high rating of 7.0 ( from 7.3 in 2016). Those aged 65 plus (18%), those who reside in the South Ward (24%), those who have lived in the Council area for 1 to less than 3 years (30%), those who have lived in the Council area for 15 to less than 20 years (23%), those who indicated they are satisfied with the service delivered by Salisbury Council (15%) and those who indicated they would be likely to promote living in the City of Salisbury (19%) were more likely to score a 9.
6.7
Managing the local environment sustainability
Extremely satisfied (score 10): 8% Extremely dissatisfied (score 0): 1%
More than half (56%) of residents were satisfied with managing the local environment sustainability, recording a moderate rating of 6.7 ( from 7.0 in 2016). Males (14%), those aged 35 to 44 (18%), those who indicated they are satisfied with the service delivered by Salisbury Council (14%) and those who indicated they would be likely to promote living in the City of Salisbury (17%) were more likely to score a 9.
17
Satisfaction with Quality of Life (cont.)
RATING LEVEL: Extremely High: 9.0 and above High: 7.0 – 8.9 Moderate: 5.0 – 6.9 Mixed: 3.0 – 4.9 Low: 2.9 and below
19. Thinking about the quality of life where you live, on a scale of 0 to 10, where 0 is extremely dissatisfied and 10 is extremely satisfied, please rate your level of satisfaction or dissatisfaction with the following… Read outBase: All respondents (n=600)

Low (0,1,2,3)
Moderate (4,5,6)
High(7,8,9,10)
Mean score
Commentary
6.7
Childcare
Extremely satisfied (score 10): 6% Extremely dissatisfied (score 0): 1%
A quarter (26%) of residents were satisfied with childcare, recording a moderate rating of 6.7 ( from 7.0 in 2016). Those who indicated they would be likely to promote living in the City of Salisbury (16%) and those from the Levels Ward (12%) were more likely to score a 10.
6.1
Having a sense of community
Extremely satisfied (score 10): 6% Extremely dissatisfied (score 0): 3%
More than two in five (45%) residents were satisfied with having a sense of community, recording a moderate rating of 6.1 ( from 6.6 in 2016). Those aged 65 plus (24%), those who have lived in the Council area for 20 years or more (21%) and those who indicated they are satisfied with the service delivered by Salisbury Council (21%) were more likely to score an 8.
6.0
Traffic flow
Extremely satisfied (score 10): 6% Extremely dissatisfied (score 0): 3%
Half (50%) of residents were satisfied with the traffic flow, recording a moderate rating of 6.0 ( from 6.5 in 2016). Those who indicated they are satisfied with the service delivered by Salisbury Council (25%) were more likely to score an 8.
5.9
Streets, verges, footpaths and general cleanliness of streets
Extremely satisfied (score 10): 7% Extremely dissatisfied (score 0): 5%
Half (50%) of residents were satisfied with streets, verges, footpaths and general cleanliness of streets, recording a moderate rating of 5.9 ( from 6.4 in 2016). Those aged 65 plus (29%), those who have lived in the Council area for 20 or more years (24%) and those who indicated they are satisfied with the service delivered by Salisbury Council (25%) were more likely to score an 8.
18
Satisfaction with Quality of Life (cont.)
RATING LEVEL: Extremely High: 9.0 and above High: 7.0 – 8.9 Moderate: 5.0 – 6.9 Mixed: 3.0 – 4.9 Low: 2.9 and below
19. Thinking about the quality of life where you live, on a scale of 0 to 10, where 0 is extremely dissatisfied and 10 is extremely satisfied, please rate your level of satisfaction or dissatisfaction with the following… Read outBase: All respondents (n=600)
Low (0,1,2,3)
Moderate (4,5,6)
High(7,8,9,10)
Mean score
Commentary
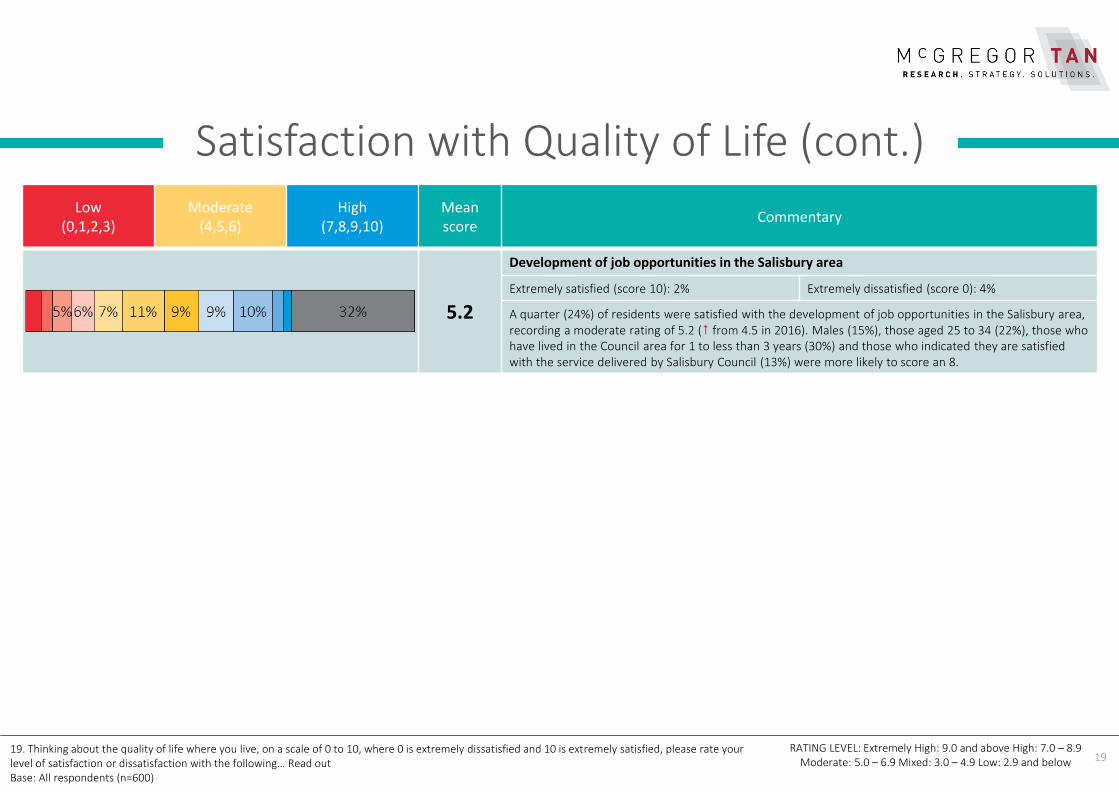
5.2
Development of job opportunities in the Salisbury area
Extremely satisfied (score 10): 2% Extremely dissatisfied (score 0): 4%
A quarter (24%) of residents were satisfied with the development of job opportunities in the Salisbury area, recording a moderate rating of 5.2 ( from 4.5 in 2016). Males (15%), those aged 25 to 34 (22%), those who have lived in the Council area for 1 to less than 3 years (30%) and those who indicated they are satisfied with the service delivered by Salisbury Council (13%) were more likely to score an 8.
19
Satisfaction with Quality of Life (cont.)
RATING LEVEL: Extremely High: 9.0 and above High: 7.0 – 8.9 Moderate: 5.0 – 6.9 Mixed: 3.0 – 4.9 Low: 2.9 and below
19. Thinking about the quality of life where you live, on a scale of 0 to 10, where 0 is extremely dissatisfied and 10 is extremely satisfied, please rate your level of satisfaction or dissatisfaction with the following… Read outBase: All respondents (n=600)
20
Satisfaction with Quality of Life (cont.)
RATING LEVEL: Extremely High: 9.0 and above High: 7.0 – 8.9 Moderate: 5.0 – 6.9 Mixed: 3.0 – 4.9 Low: 2.9 and below
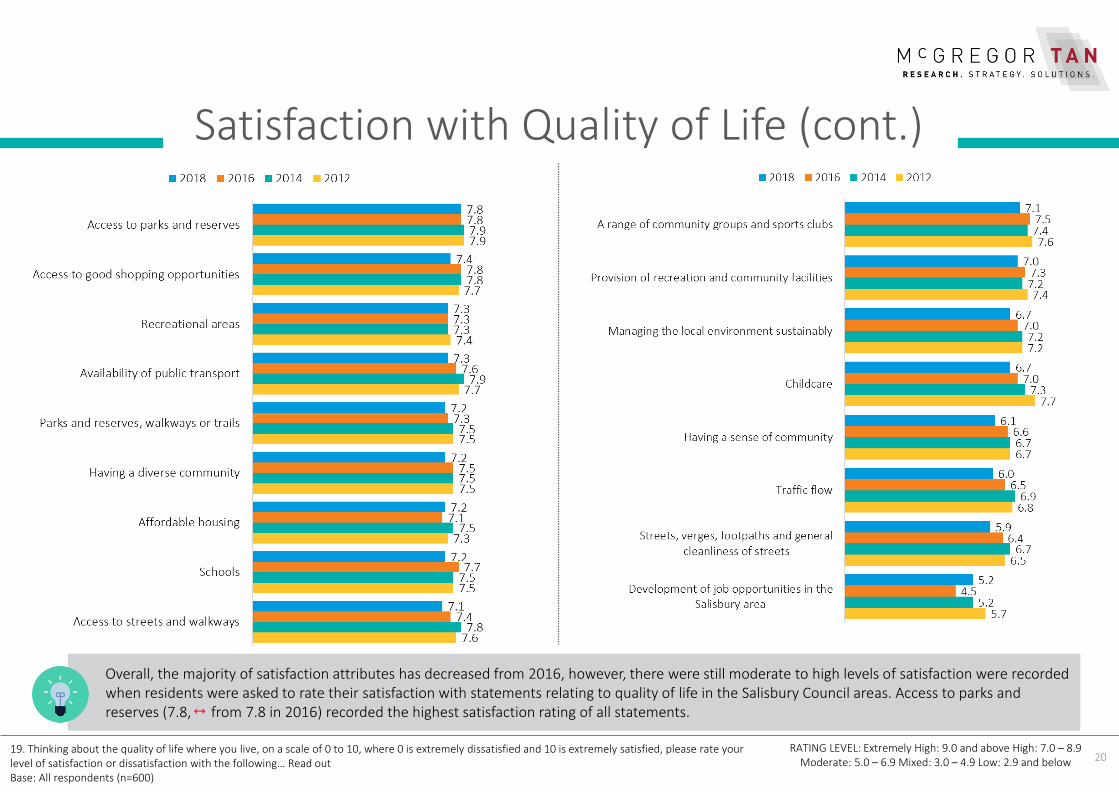
Overall, the majority of satisfaction attributes has decreased from 2016, however, there were still moderate to high levels of satisfaction were recorded when residents were asked to rate their satisfaction with statements relating to quality of life in the Salisbury Council areas. Access to parks and reserves (7.8, from 7.8 in 2016) recorded the highest satisfaction rating of all statements.
19. Thinking about the quality of life where you live, on a scale of 0 to 10, where 0 is extremely dissatisfied and 10 is extremely satisfied, please rate your level of satisfaction or dissatisfaction with the following… Read outBase: All respondents (n=600)
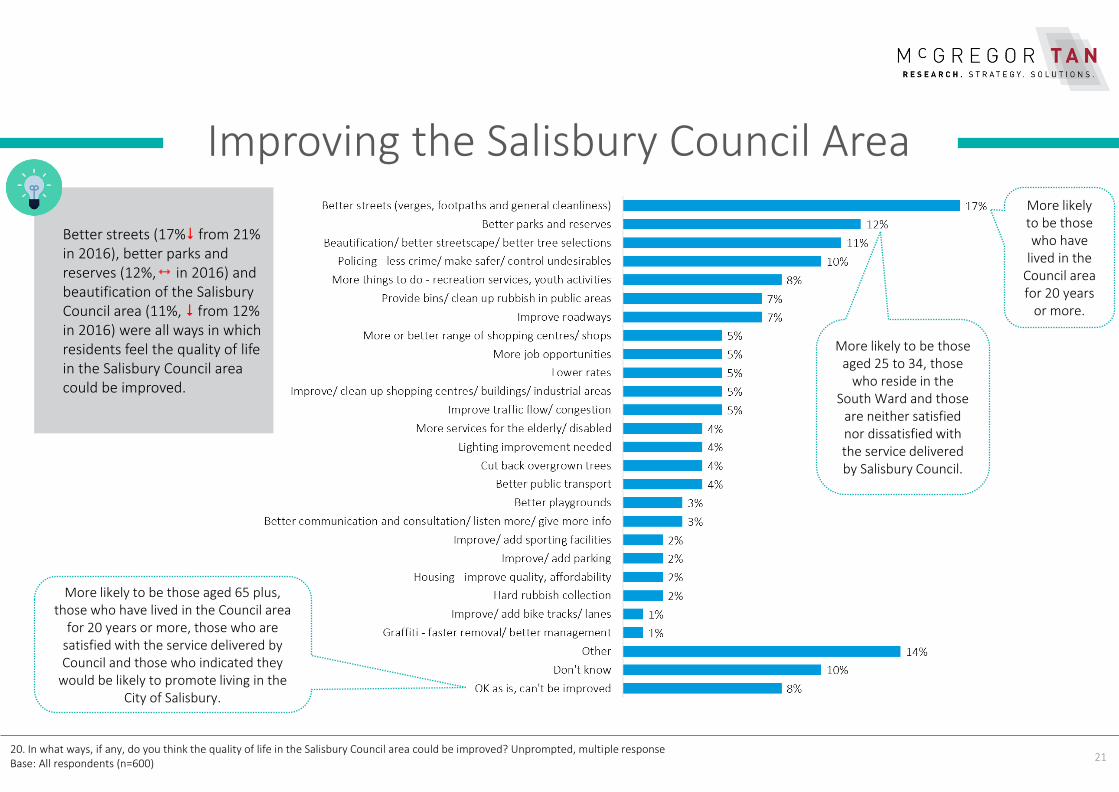
Better streets (17% from 21% in 2016), better parks and reserves (12%, in 2016) and beautification of the Salisbury Council area (11%, from 12% in 2016) were all ways in which residents feel the quality of life in the Salisbury Council area could be improved.
21
Improving the Salisbury Council Area
20. In what ways, if any, do you think the quality of life in the Salisbury Council area could be improved? Unprompted, multiple responseBase: All respondents (n=600)
More likely to be those aged 25 to 34, those
who reside in the South Ward and those
are neither satisfied nor dissatisfied with the service delivered by Salisbury Council.
More likely to be those who have
lived in the Council area for 20 years
or more.
More likely to be those aged 65 plus, those who have lived in the Council area
for 20 years or more, those who are satisfied with the service delivered by Council and those who indicated they
would be likely to promote living in the City of Salisbury.
SATISFACTION WITH COUNCIL
SERVICES
23
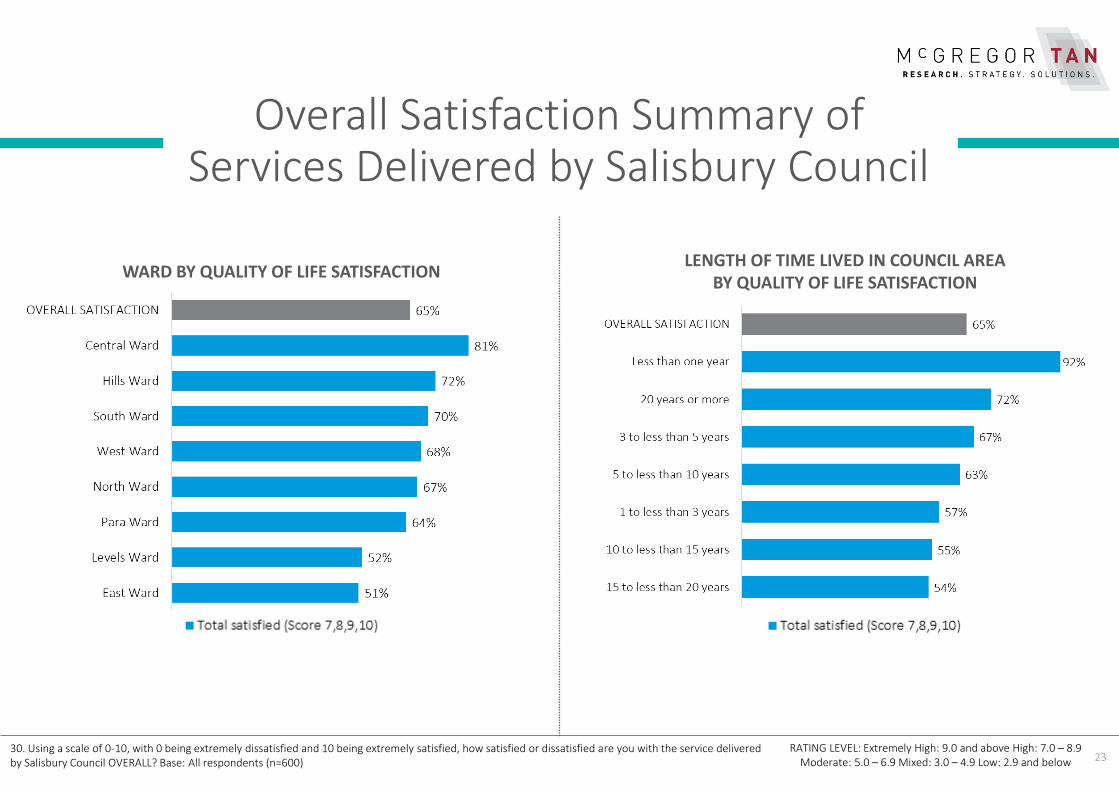
Overall Satisfaction Summary of Services Delivered by Salisbury Council
RATING LEVEL: Extremely High: 9.0 and above High: 7.0 – 8.9 Moderate: 5.0 – 6.9 Mixed: 3.0 – 4.9 Low: 2.9 and below
WARD BY QUALITY OF LIFE SATISFACTIONLENGTH OF TIME LIVED IN COUNCIL AREA
BY QUALITY OF LIFE SATISFACTION
30. Using a scale of 0-10, with 0 being extremely dissatisfied and 10 being extremely satisfied, how satisfied or dissatisfied are you with the service delivered by Salisbury Council OVERALL? Base: All respondents (n=600)
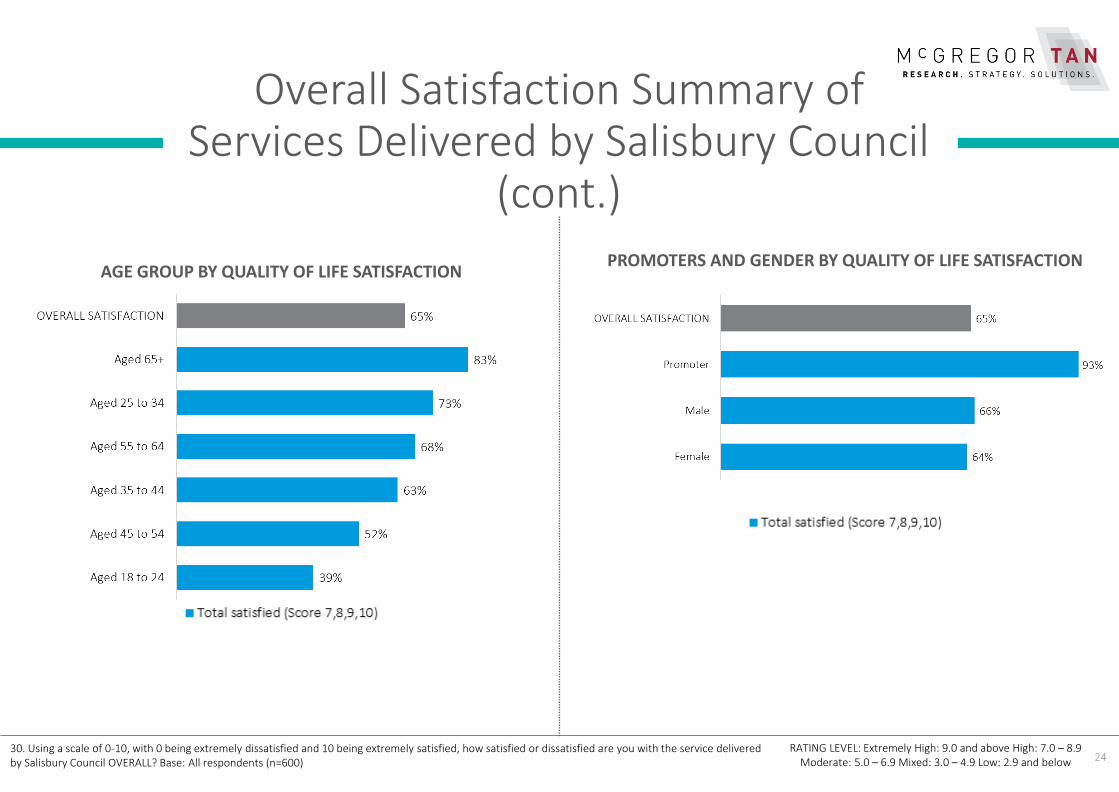
24
Overall Satisfaction Summary of Services Delivered by Salisbury Council
(cont.)
RATING LEVEL: Extremely High: 9.0 and above High: 7.0 – 8.9 Moderate: 5.0 – 6.9 Mixed: 3.0 – 4.9 Low: 2.9 and below
AGE GROUP BY QUALITY OF LIFE SATISFACTIONPROMOTERS AND GENDER BY QUALITY OF LIFE SATISFACTION
30. Using a scale of 0-10, with 0 being extremely dissatisfied and 10 being extremely satisfied, how satisfied or dissatisfied are you with the service delivered by Salisbury Council OVERALL? Base: All respondents (n=600)
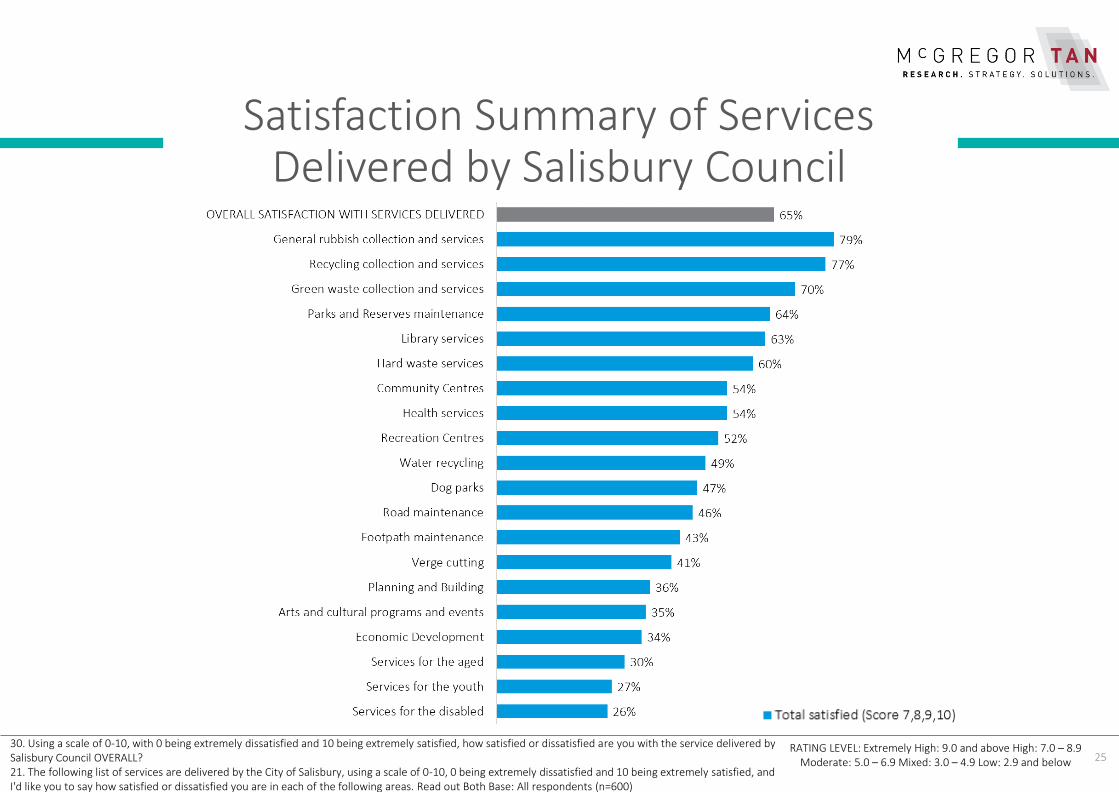
25
Satisfaction Summary of Services Delivered by Salisbury Council
30. Using a scale of 0-10, with 0 being extremely dissatisfied and 10 being extremely satisfied, how satisfied or dissatisfied are you with the service delivered by Salisbury Council OVERALL? 21. The following list of services are delivered by the City of Salisbury, using a scale of 0-10, 0 being extremely dissatisfied and 10 being extremely satisfied, and I'd like you to say how satisfied or dissatisfied you are in each of the following areas. Read out Both Base: All respondents (n=600)
RATING LEVEL: Extremely High: 9.0 and above High: 7.0 – 8.9 Moderate: 5.0 – 6.9 Mixed: 3.0 – 4.9 Low: 2.9 and below
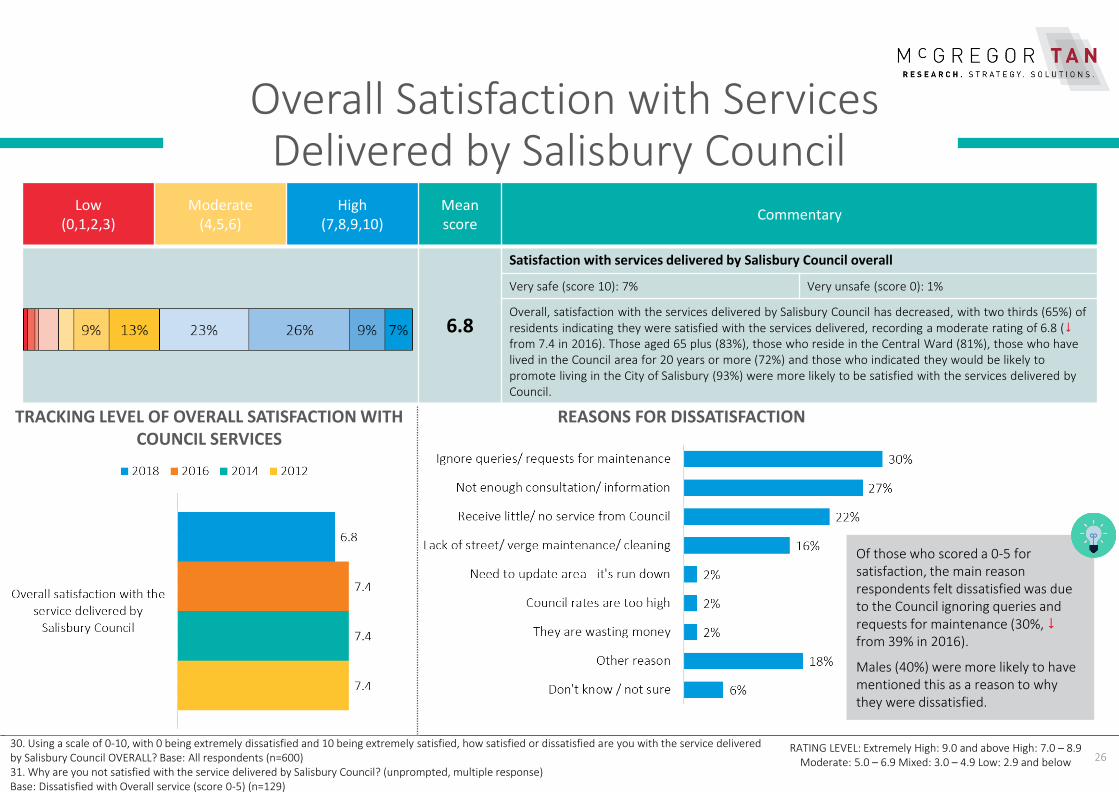
26
Overall Satisfaction with Services Delivered by Salisbury Council
Low (0,1,2,3)
Moderate (4,5,6)
High(7,8,9,10)
Mean score
Commentary
6.8
Satisfaction with services delivered by Salisbury Council overall
Very safe (score 10): 7% Very unsafe (score 0): 1%
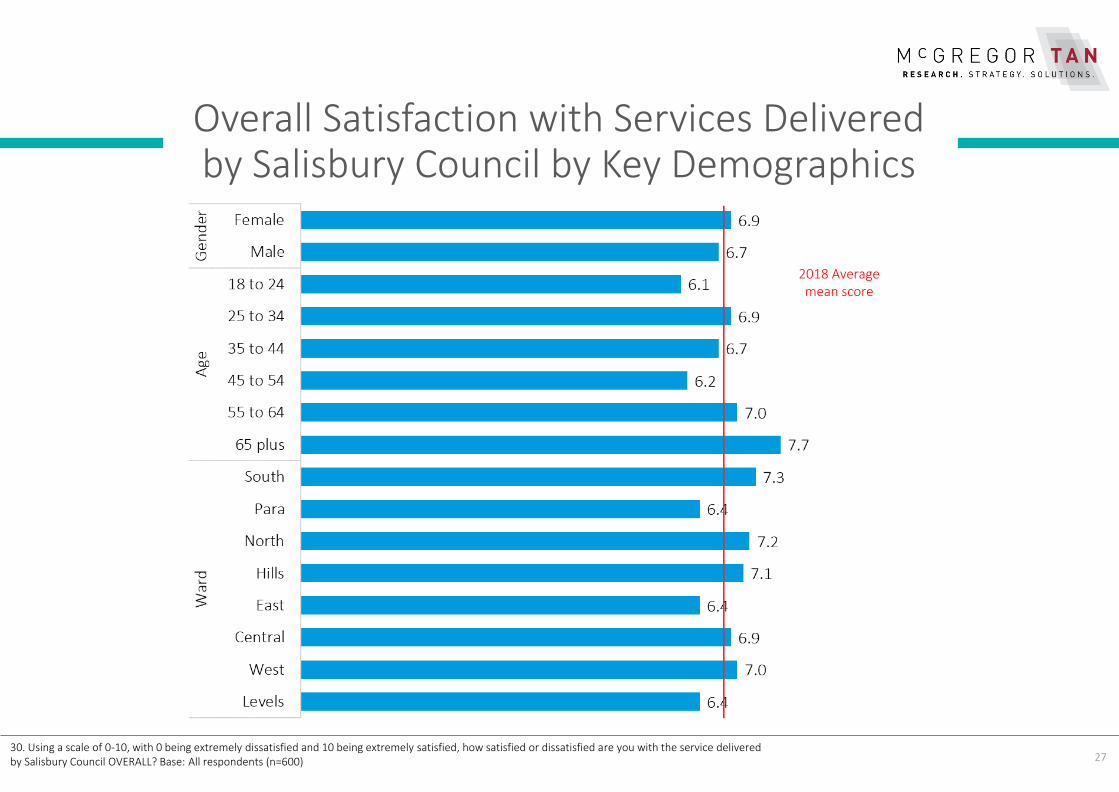
Overall, satisfaction with the services delivered by Salisbury Council has decreased, with two thirds (65%) of residents indicating they were satisfied with the services delivered, recording a moderate rating of 6.8 (from 7.4 in 2016). Those aged 65 plus (83%), those who reside in the Central Ward (81%), those who have lived in the Council area for 20 years or more (72%) and those who indicated they would be likely to promote living in the City of Salisbury (93%) were more likely to be satisfied with the services delivered by Council.
RATING LEVEL: Extremely High: 9.0 and above High: 7.0 – 8.9 Moderate: 5.0 – 6.9 Mixed: 3.0 – 4.9 Low: 2.9 and below
30. Using a scale of 0-10, with 0 being extremely dissatisfied and 10 being extremely satisfied, how satisfied or dissatisfied are you with the service delivered by Salisbury Council OVERALL? Base: All respondents (n=600)31. Why are you not satisfied with the service delivered by Salisbury Council? (unprompted, multiple response)Base: Dissatisfied with Overall service (score 0-5) (n=129)
REASONS FOR DISSATISFACTIONTRACKING LEVEL OF OVERALL SATISFACTION WITH COUNCIL SERVICES
Of those who scored a 0-5 for satisfaction, the main reason respondents felt dissatisfied was due to the Council ignoring queries and requests for maintenance (30%, from 39% in 2016).
Males (40%) were more likely to have mentioned this as a reason to why they were dissatisfied.
27
Overall Satisfaction with Services Delivered by Salisbury Council by Key Demographics
2018 Average mean score
30. Using a scale of 0-10, with 0 being extremely dissatisfied and 10 being extremely satisfied, how satisfied or dissatisfied are you with the service delivered by Salisbury Council OVERALL? Base: All respondents (n=600)

28
City of Salisbury’s Strengths
7. What do you consider to be the City of Salisbury's strengths? Unprompted, multiple responseBASE: All respondents (n=600)
Parks and reserves (37%, from 8% in 2016) and cost of housing (33%, from 13% in 2016) were identified as strengths of the City of Salisbury.
Residents who reside in the East Ward were more likely to identify parks and reserves (58%) and cost of housing (47%) as strengths of the City of Salisbury.
Residents aged 25 to 34 (55%) were also likely to identify cost of housing as a strength.
Those who have lived in the Salisbury Council area for 1 to less than 3 years were also likely to mention parks and reserves (68%) and cost of housing (60%).
While those who indicated they are satisfied with the service delivered by the Salisbury Council mentioned shopping centres (29%) and availability of services (29%) as strengths.
Those who would be likely to promote living in the City of Salisbury mentioned location (40%), shopping centres (39%) and availability of services (38%) as strengths of the City of Salisbury.
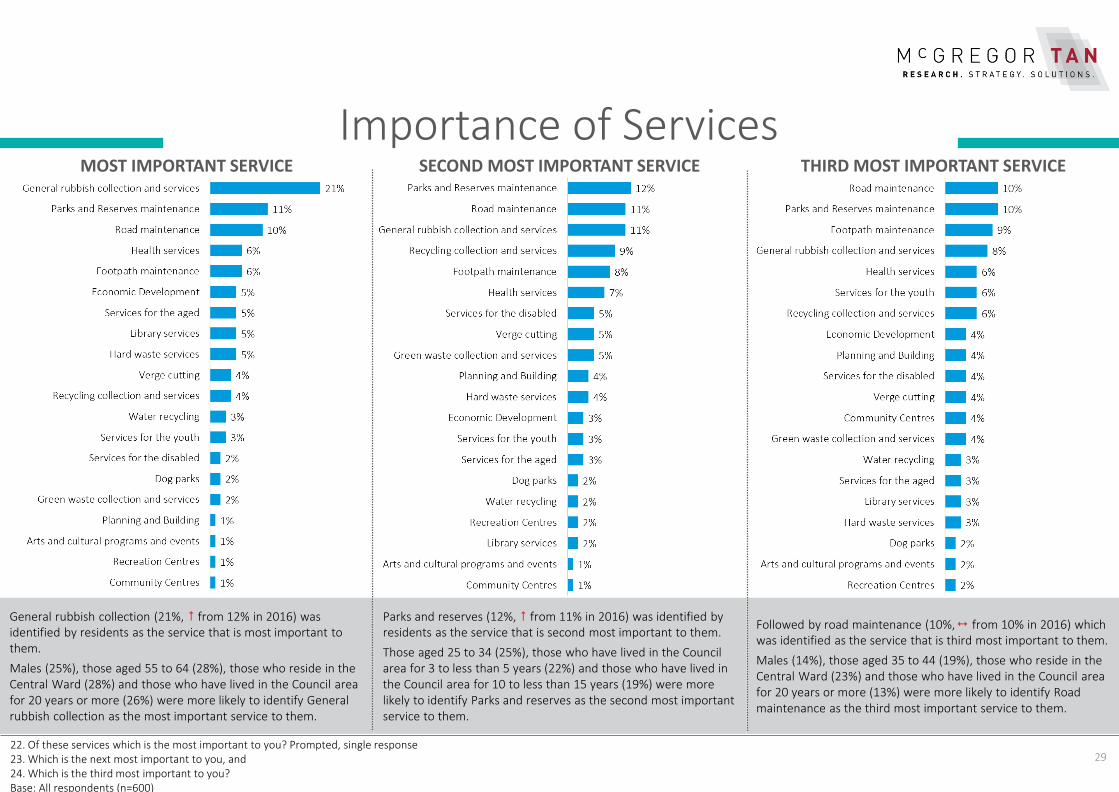
General rubbish collection (21%, from 12% in 2016) was identified by residents as the service that is most important to them.
Males (25%), those aged 55 to 64 (28%), those who reside in the Central Ward (28%) and those who have lived in the Council area for 20 years or more (26%) were more likely to identify General rubbish collection as the most important service to them.
Parks and reserves (12%, from 11% in 2016) was identified by residents as the service that is second most important to them.
Those aged 25 to 34 (25%), those who have lived in the Council area for 3 to less than 5 years (22%) and those who have lived in the Council area for 10 to less than 15 years (19%) were more likely to identify Parks and reserves as the second most important service to them.
Followed by road maintenance (10%, from 10% in 2016) which was identified as the service that is third most important to them.
Males (14%), those aged 35 to 44 (19%), those who reside in the Central Ward (23%) and those who have lived in the Council area for 20 years or more (13%) were more likely to identify Road maintenance as the third most important service to them.
29
Importance of Services
22. Of these services which is the most important to you? Prompted, single response23. Which is the next most important to you, and24. Which is the third most important to you?Base: All respondents (n=600)
MOST IMPORTANT SERVICE SECOND MOST IMPORTANT SERVICE THIRD MOST IMPORTANT SERVICE
Low (0,1,2,3)
Moderate (4,5,6)
High(7,8,9,10)
Mean score
Commentary
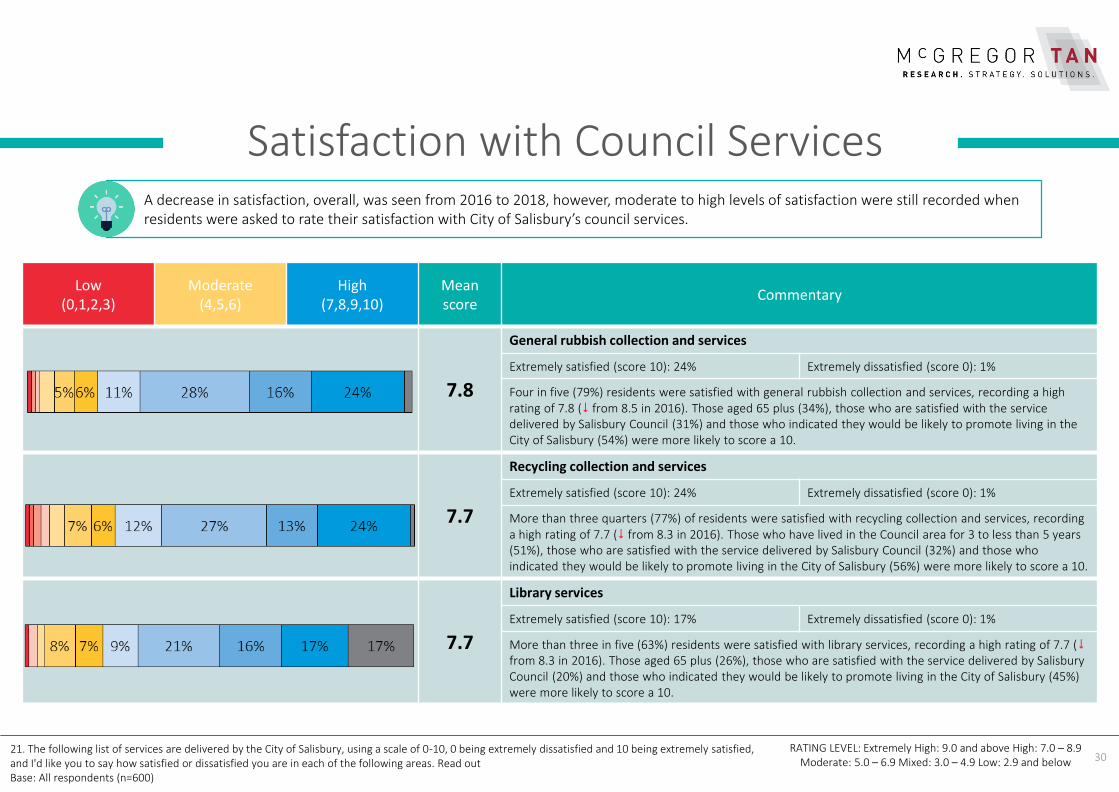
7.8
General rubbish collection and services
Extremely satisfied (score 10): 24% Extremely dissatisfied (score 0): 1%
Four in five (79%) residents were satisfied with general rubbish collection and services, recording a high rating of 7.8 ( from 8.5 in 2016). Those aged 65 plus (34%), those who are satisfied with the service delivered by Salisbury Council (31%) and those who indicated they would be likely to promote living in the City of Salisbury (54%) were more likely to score a 10.
7.7
Recycling collection and services
Extremely satisfied (score 10): 24% Extremely dissatisfied (score 0): 1%
More than three quarters (77%) of residents were satisfied with recycling collection and services, recording a high rating of 7.7 ( from 8.3 in 2016). Those who have lived in the Council area for 3 to less than 5 years (51%), those who are satisfied with the service delivered by Salisbury Council (32%) and those who indicated they would be likely to promote living in the City of Salisbury (56%) were more likely to score a 10.
7.7
Library services
Extremely satisfied (score 10): 17% Extremely dissatisfied (score 0): 1%
More than three in five (63%) residents were satisfied with library services, recording a high rating of 7.7 (from 8.3 in 2016). Those aged 65 plus (26%), those who are satisfied with the service delivered by Salisbury Council (20%) and those who indicated they would be likely to promote living in the City of Salisbury (45%) were more likely to score a 10.
30
Satisfaction with Council Services
RATING LEVEL: Extremely High: 9.0 and above High: 7.0 – 8.9 Moderate: 5.0 – 6.9 Mixed: 3.0 – 4.9 Low: 2.9 and below
21. The following list of services are delivered by the City of Salisbury, using a scale of 0-10, 0 being extremely dissatisfied and 10 being extremely satisfied, and I'd like you to say how satisfied or dissatisfied you are in each of the following areas. Read outBase: All respondents (n=600)
A decrease in satisfaction, overall, was seen from 2016 to 2018, however, moderate to high levels of satisfaction were still recorded when residents were asked to rate their satisfaction with City of Salisbury’s council services.
Low (0,1,2,3)
Moderate (4,5,6)
High(7,8,9,10)
Mean score
Commentary
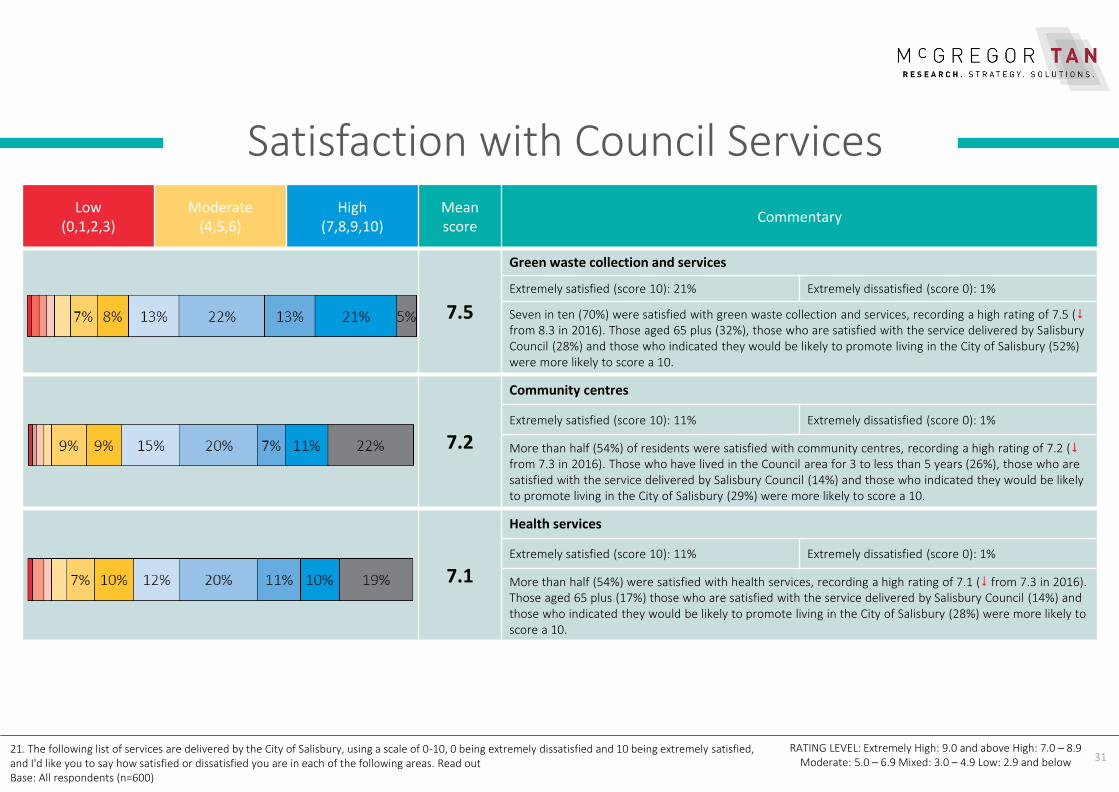
7.5
Green waste collection and services
Extremely satisfied (score 10): 21% Extremely dissatisfied (score 0): 1%
Seven in ten (70%) were satisfied with green waste collection and services, recording a high rating of 7.5 (from 8.3 in 2016). Those aged 65 plus (32%), those who are satisfied with the service delivered by Salisbury Council (28%) and those who indicated they would be likely to promote living in the City of Salisbury (52%) were more likely to score a 10.
7.2
Community centres
Extremely satisfied (score 10): 11% Extremely dissatisfied (score 0): 1%
More than half (54%) of residents were satisfied with community centres, recording a high rating of 7.2 (from 7.3 in 2016). Those who have lived in the Council area for 3 to less than 5 years (26%), those who are satisfied with the service delivered by Salisbury Council (14%) and those who indicated they would be likely to promote living in the City of Salisbury (29%) were more likely to score a 10.
7.1
Health services
Extremely satisfied (score 10): 11% Extremely dissatisfied (score 0): 1%
More than half (54%) were satisfied with health services, recording a high rating of 7.1 ( from 7.3 in 2016). Those aged 65 plus (17%) those who are satisfied with the service delivered by Salisbury Council (14%) and those who indicated they would be likely to promote living in the City of Salisbury (28%) were more likely to score a 10.
31
Satisfaction with Council Services
RATING LEVEL: Extremely High: 9.0 and above High: 7.0 – 8.9 Moderate: 5.0 – 6.9 Mixed: 3.0 – 4.9 Low: 2.9 and below
21. The following list of services are delivered by the City of Salisbury, using a scale of 0-10, 0 being extremely dissatisfied and 10 being extremely satisfied, and I'd like you to say how satisfied or dissatisfied you are in each of the following areas. Read outBase: All respondents (n=600)
Low (0,1,2,3)
Moderate (4,5,6)
High(7,8,9,10)
Mean score
Commentary
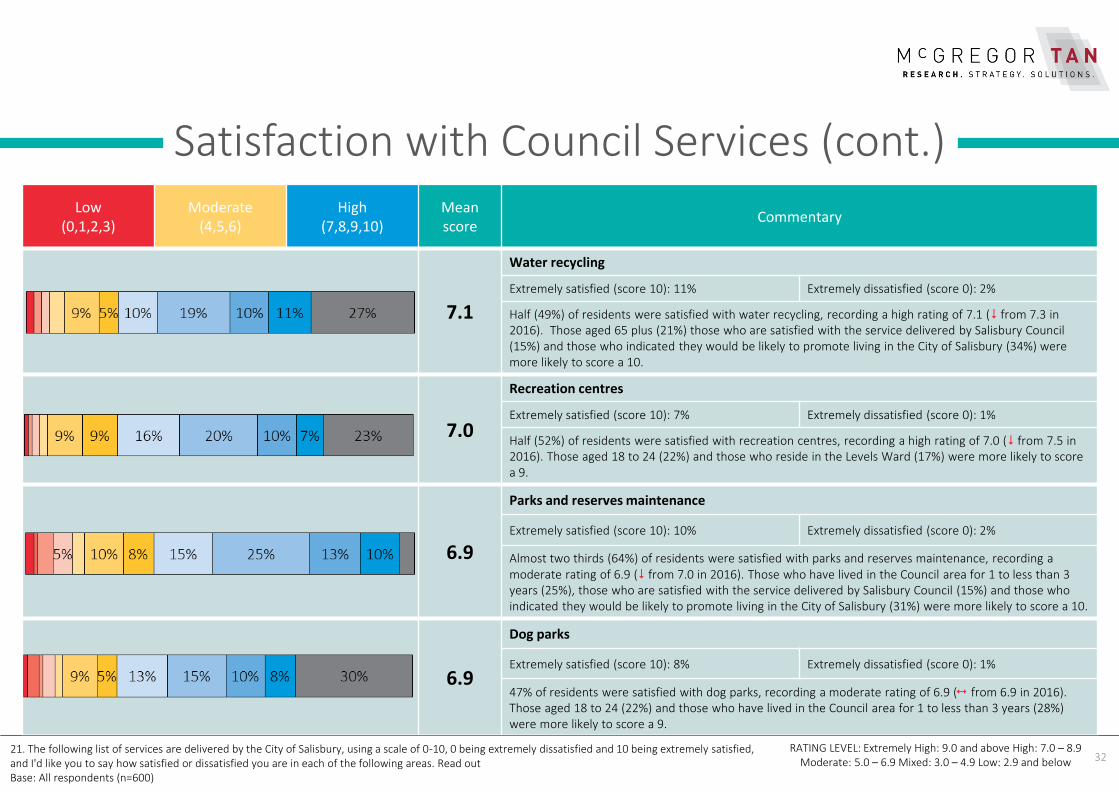
7.1
Water recycling
Extremely satisfied (score 10): 11% Extremely dissatisfied (score 0): 2%
Half (49%) of residents were satisfied with water recycling, recording a high rating of 7.1 ( from 7.3 in 2016). Those aged 65 plus (21%) those who are satisfied with the service delivered by Salisbury Council (15%) and those who indicated they would be likely to promote living in the City of Salisbury (34%) were more likely to score a 10.
7.0
Recreation centres
Extremely satisfied (score 10): 7% Extremely dissatisfied (score 0): 1%
Half (52%) of residents were satisfied with recreation centres, recording a high rating of 7.0 ( from 7.5 in 2016). Those aged 18 to 24 (22%) and those who reside in the Levels Ward (17%) were more likely to score a 9.
6.9
Parks and reserves maintenance
Extremely satisfied (score 10): 10% Extremely dissatisfied (score 0): 2%
Almost two thirds (64%) of residents were satisfied with parks and reserves maintenance, recording a moderate rating of 6.9 ( from 7.0 in 2016). Those who have lived in the Council area for 1 to less than 3 years (25%), those who are satisfied with the service delivered by Salisbury Council (15%) and those who indicated they would be likely to promote living in the City of Salisbury (31%) were more likely to score a 10.
6.9
Dog parks
Extremely satisfied (score 10): 8% Extremely dissatisfied (score 0): 1%
47% of residents were satisfied with dog parks, recording a moderate rating of 6.9 ( from 6.9 in 2016). Those aged 18 to 24 (22%) and those who have lived in the Council area for 1 to less than 3 years (28%) were more likely to score a 9.
32
Satisfaction with Council Services (cont.)
RATING LEVEL: Extremely High: 9.0 and above High: 7.0 – 8.9 Moderate: 5.0 – 6.9 Mixed: 3.0 – 4.9 Low: 2.9 and below
21. The following list of services are delivered by the City of Salisbury, using a scale of 0-10, 0 being extremely dissatisfied and 10 being extremely satisfied, and I'd like you to say how satisfied or dissatisfied you are in each of the following areas. Read outBase: All respondents (n=600)
Low (0,1,2,3)
Moderate (4,5,6)
High(7,8,9,10)
Mean score
Commentary
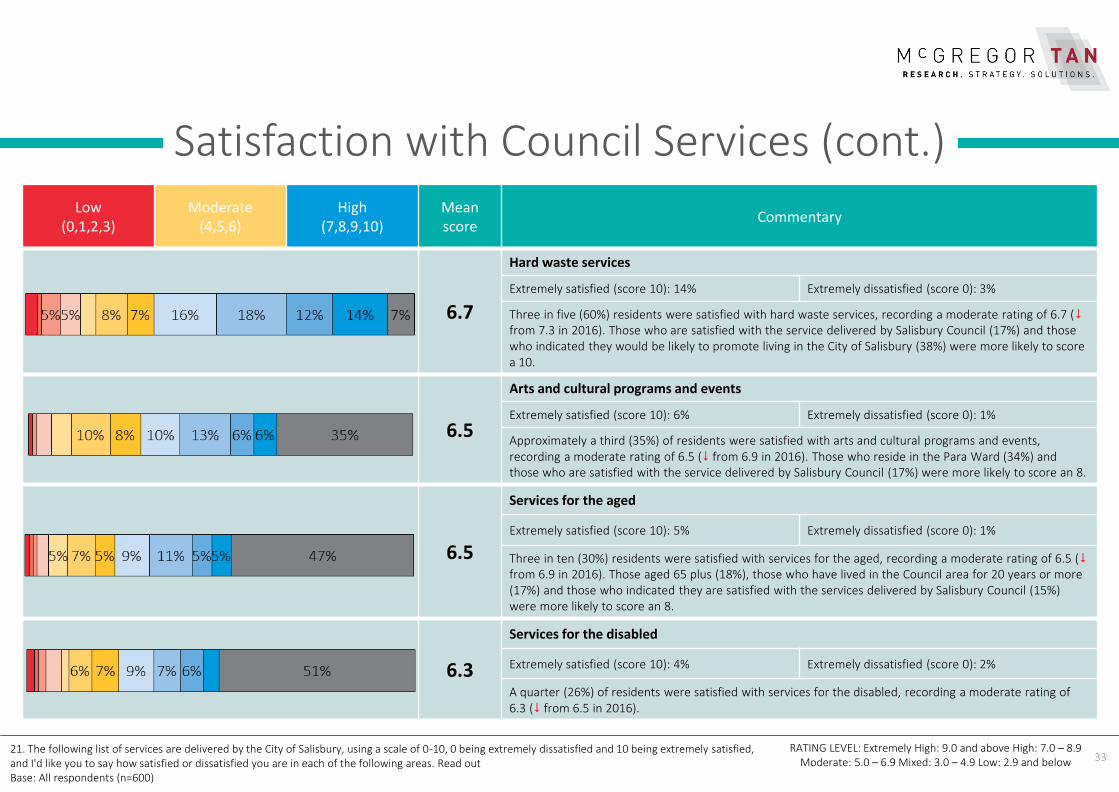
6.7
Hard waste services
Extremely satisfied (score 10): 14% Extremely dissatisfied (score 0): 3%
Three in five (60%) residents were satisfied with hard waste services, recording a moderate rating of 6.7 (from 7.3 in 2016). Those who are satisfied with the service delivered by Salisbury Council (17%) and those who indicated they would be likely to promote living in the City of Salisbury (38%) were more likely to score a 10.
6.5
Arts and cultural programs and events
Extremely satisfied (score 10): 6% Extremely dissatisfied (score 0): 1%
Approximately a third (35%) of residents were satisfied with arts and cultural programs and events, recording a moderate rating of 6.5 ( from 6.9 in 2016). Those who reside in the Para Ward (34%) and those who are satisfied with the service delivered by Salisbury Council (17%) were more likely to score an 8.
6.5
Services for the aged
Extremely satisfied (score 10): 5% Extremely dissatisfied (score 0): 1%
Three in ten (30%) residents were satisfied with services for the aged, recording a moderate rating of 6.5 (from 6.9 in 2016). Those aged 65 plus (18%), those who have lived in the Council area for 20 years or more (17%) and those who indicated they are satisfied with the services delivered by Salisbury Council (15%) were more likely to score an 8.
6.3
Services for the disabled
Extremely satisfied (score 10): 4% Extremely dissatisfied (score 0): 2%
A quarter (26%) of residents were satisfied with services for the disabled, recording a moderate rating of 6.3 ( from 6.5 in 2016).
33
Satisfaction with Council Services (cont.)
RATING LEVEL: Extremely High: 9.0 and above High: 7.0 – 8.9 Moderate: 5.0 – 6.9 Mixed: 3.0 – 4.9 Low: 2.9 and below
21. The following list of services are delivered by the City of Salisbury, using a scale of 0-10, 0 being extremely dissatisfied and 10 being extremely satisfied, and I'd like you to say how satisfied or dissatisfied you are in each of the following areas. Read outBase: All respondents (n=600)

Low (0,1,2,3)
Moderate (4,5,6)
High(7,8,9,10)
Mean score
Commentary
6.1
Services for the youth
Extremely satisfied (score 10): 3% Extremely dissatisfied (score 0): 2%
Just over a quarter (27%) of residents were satisfied with services for the youth, recording a moderate rating of 6.1 ( from 6.6 in 2016). Those aged 25 to 34 (20%) and those who indicated they are satisfied with the services delivered by Salisbury Council (14%) were more likely to score an 8.
6.0
Economic development
Extremely satisfied (score 10): 4% Extremely dissatisfied (score 0): 3%
A third (34%) of residents were satisfied with economic development, recording a moderate rating of 6.0 (from 5.7 in 2016). Those aged 25 to 34 (23%) and 65 plus (21%) and those who are satisfied with the service delivered by Salisbury Council (21%) were more likely to score a 8.
5.9
Planning and building
Extremely satisfied (score 10): 4% Extremely dissatisfied (score 0): 3%
Just over a third (36%) of residents were satisfied with planning and building, recording a moderate rating of 5.9 ( from 6.4 in 2016). Those aged 25 to 34 (24%) and those who indicated they are satisfied with the services delivered by Salisbury Council (18%) were more likely to score a 10.
5.8
Road maintenance
Extremely satisfied (score 10): 4% Extremely dissatisfied (score 0): 4%
Almost half (46%) of residents were satisfied with road maintenance, recording a moderate rating of 5.8 (from 6.4 in 2016). Those who reside in the Central Ward (35%) and those who indicated they are satisfied with the services delivered by Salisbury Council (27%) were more likely to score an 8.
34
Satisfaction with Council Services (cont.)
RATING LEVEL: Extremely High: 9.0 and above High: 7.0 – 8.9 Moderate: 5.0 – 6.9 Mixed: 3.0 – 4.9 Low: 2.9 and below
21. The following list of services are delivered by the City of Salisbury, using a scale of 0-10, 0 being extremely dissatisfied and 10 being extremely satisfied, and I'd like you to say how satisfied or dissatisfied you are in each of the following areas. Read outBase: All respondents (n=600)

Low (0,1,2,3)
Moderate (4,5,6)
High(7,8,9,10)
Mean score
Commentary
5.8
Footpath maintenance
Extremely satisfied (score 10): 6% Extremely dissatisfied (score 0): 6%
More than two in five (43%) residents were satisfied with footpath maintenance, recording a moderate rating of 5.8 ( from 6.1 in 2016). Those aged 65 plus (22%), those who reside in the Hills Ward (23%) and those who indicated they are satisfied with the services delivered by Salisbury Council (22%) were more likely to score an 8.
5.4
Verge cutting
Extremely satisfied (score 10): 6% Extremely dissatisfied (score 0): 8%
Two in five (41%) residents were satisfied with verge cutting, recording a moderate rating of 5.4 ( from 6.0 in 2016). Those who reside in the Central Ward (30%) and those who indicated they are satisfied with the services delivered by Salisbury Council (20%) were more likely to score an 8.
35
Satisfaction with Council Services (cont.)
RATING LEVEL: Extremely High: 9.0 and above High: 7.0 – 8.9 Moderate: 5.0 – 6.9 Mixed: 3.0 – 4.9 Low: 2.9 and below
21. The following list of services are delivered by the City of Salisbury, using a scale of 0-10, 0 being extremely dissatisfied and 10 being extremely satisfied, and I'd like you to say how satisfied or dissatisfied you are in each of the following areas. Read outBase: All respondents (n=600)
36
Satisfaction with Council Services (cont.)
RATING LEVEL: Extremely High: 9.0 and above High: 7.0 – 8.9 Moderate: 5.0 – 6.9 Mixed: 3.0 – 4.9 Low: 2.9 and below
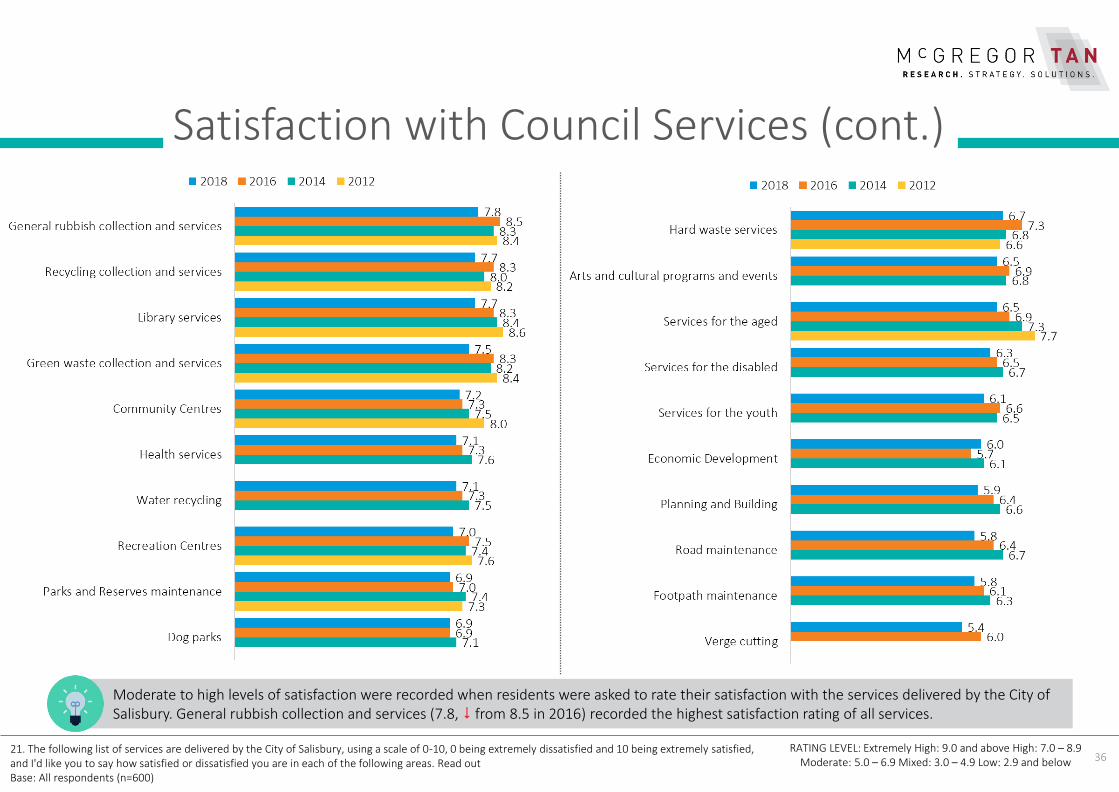
Moderate to high levels of satisfaction were recorded when residents were asked to rate their satisfaction with the services delivered by the City of Salisbury. General rubbish collection and services (7.8, from 8.5 in 2016) recorded the highest satisfaction rating of all services.
21. The following list of services are delivered by the City of Salisbury, using a scale of 0-10, 0 being extremely dissatisfied and 10 being extremely satisfied, and I'd like you to say how satisfied or dissatisfied you are in each of the following areas. Read outBase: All respondents (n=600)

NET PROMOTER SCORE (NPS)
Net Promoter ScoreNet Promoter Score®, or NPS®, measures customer experience and loyalty
and predicts business growth.
The NPS calculation is based on the answer to a key question, such as: ‘using
a 0-10 scale, how likely is it that you would recommend living in the
Salisbury Council area to others?’
Respondents are grouped as follows:
• Promoters (score 9-10) are loyal enthusiasts, or ‘super fans’, who will
keep buying and refer others, fuelling growth.
• Passives (score 7-8) are satisfied but unenthusiastic customers who
are vulnerable to competitive offerings.
• Detractors (score 0-6) are unhappy customers who can damage your
brand and impede growth through negative word-of-mouth.
38
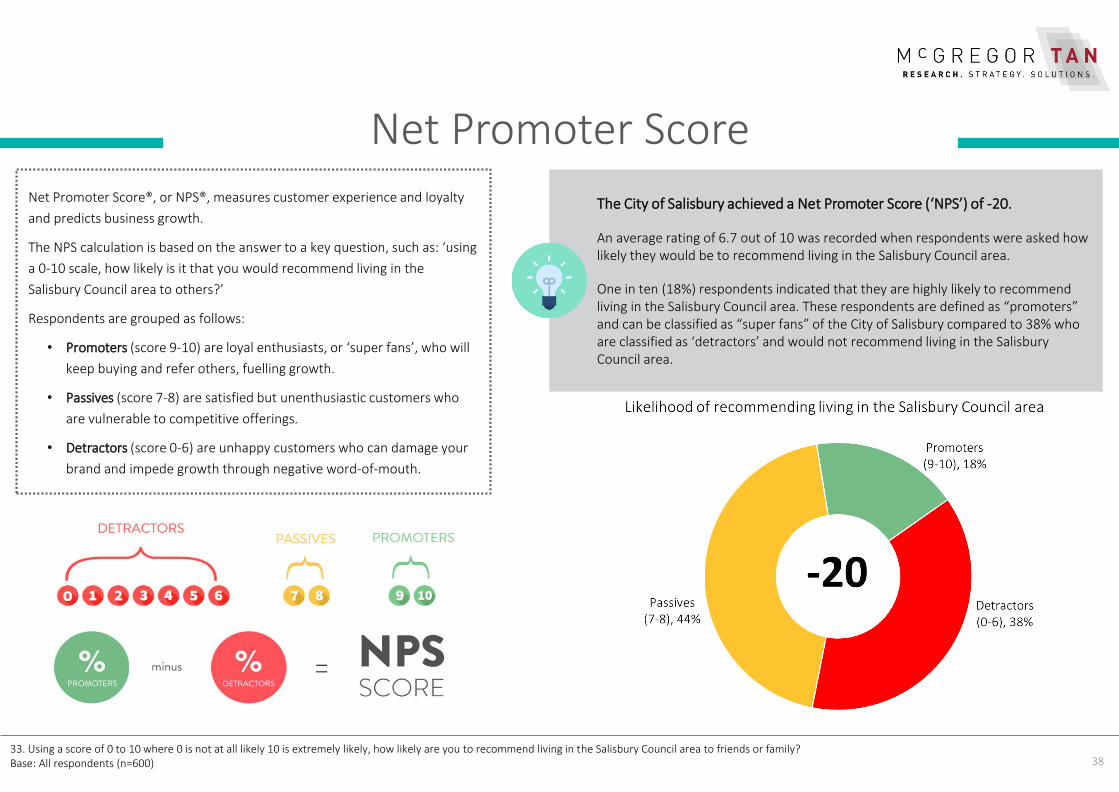
The City of Salisbury achieved a Net Promoter Score (‘NPS’) of -20.
An average rating of 6.7 out of 10 was recorded when respondents were asked how likely they would be to recommend living in the Salisbury Council area.
One in ten (18%) respondents indicated that they are highly likely to recommend living in the Salisbury Council area. These respondents are defined as “promoters” and can be classified as “super fans” of the City of Salisbury compared to 38% who are classified as ‘detractors’ and would not recommend living in the Salisbury Council area.
33. Using a score of 0 to 10 where 0 is not at all likely 10 is extremely likely, how likely are you to recommend living in the Salisbury Council area to friends or family?Base: All respondents (n=600)
Net Promoter Score (cont.)
3933. Using a score of 0 to 10 where 0 is not at all likely 10 is extremely likely, how likely are you to recommend living in the Salisbury Council area to friends or family?Base: All respondents (n=600)
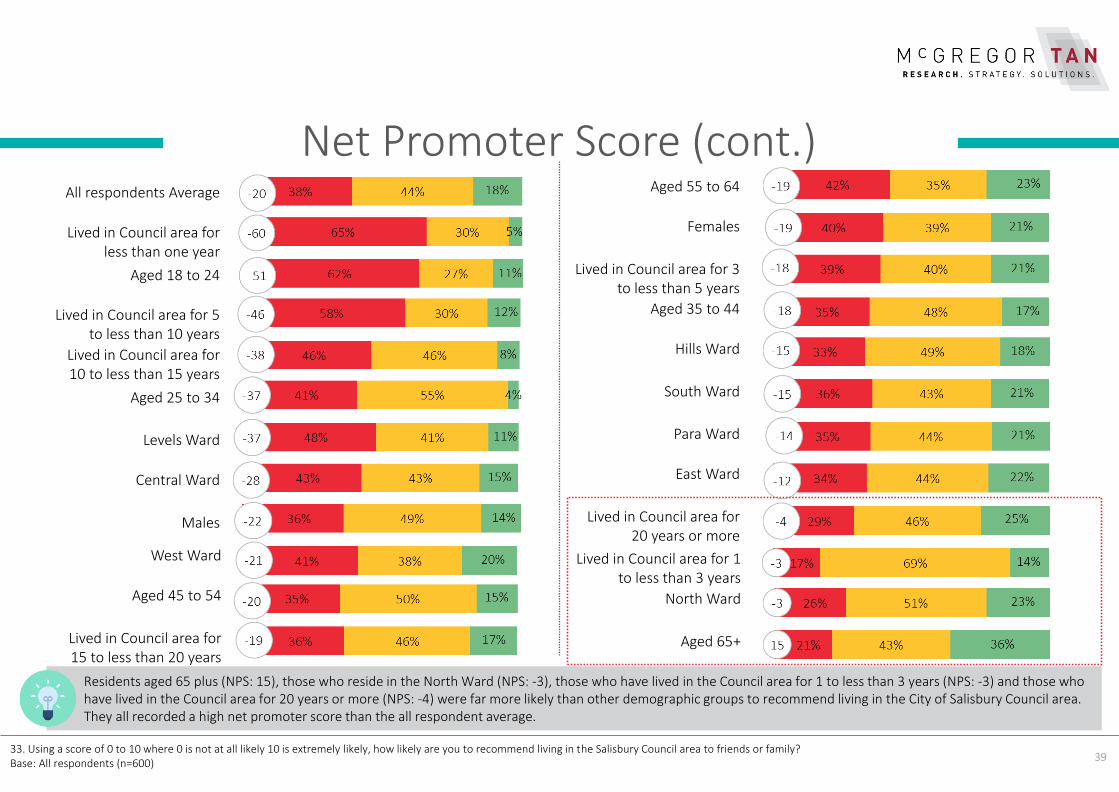
Residents aged 65 plus (NPS: 15), those who reside in the North Ward (NPS: -3), those who have lived in the Council area for 1 to less than 3 years (NPS: -3) and those who have lived in the Council area for 20 years or more (NPS: -4) were far more likely than other demographic groups to recommend living in the City of Salisbury Council area. They all recorded a high net promoter score than the all respondent average.
All respondents Average
Lived in Council area for less than one year
Aged 18 to 24
Lived in Council area for 5 to less than 10 years
Lived in Council area for 10 to less than 15 years
Aged 25 to 34
Levels Ward
Central Ward
Males
West Ward
Aged 45 to 54
Lived in Council area for 15 to less than 20 years
Aged 55 to 64
Females
Lived in Council area for 3 to less than 5 years
Aged 35 to 44
Hills Ward
South Ward
Para Ward
East Ward
Lived in Council area for 20 years or more
Lived in Council area for 1 to less than 3 years
North Ward
Aged 65+
40
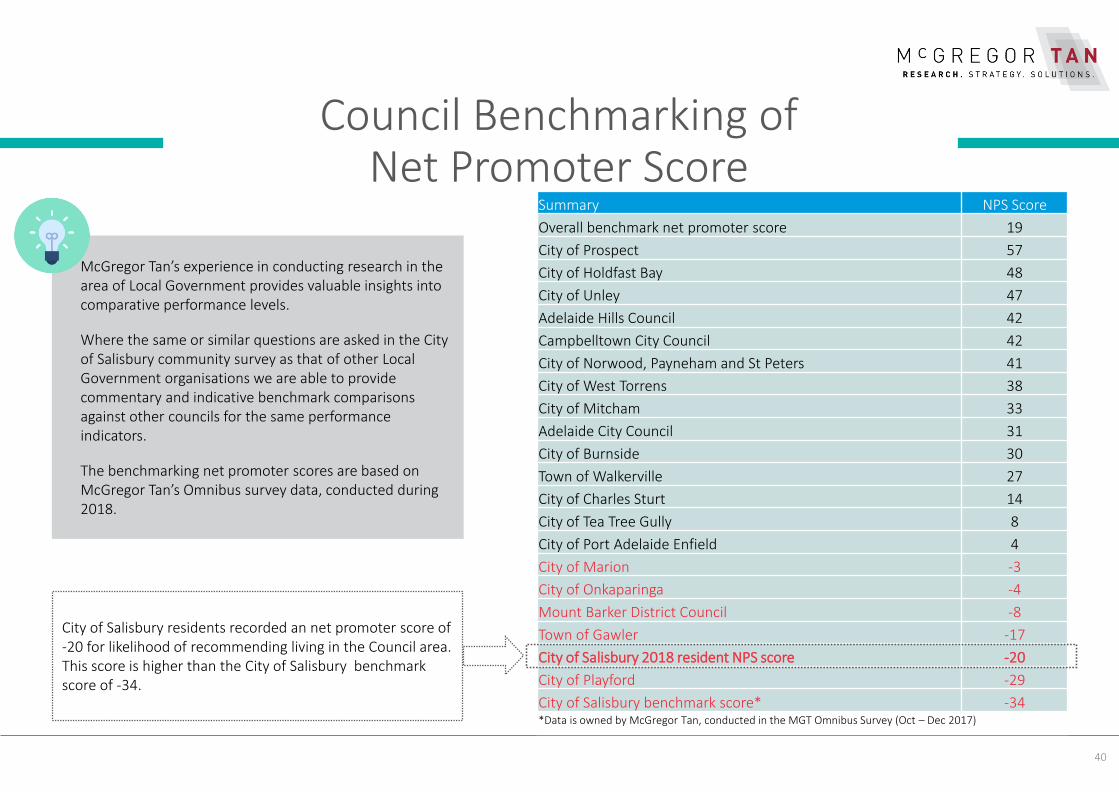
Council Benchmarking of Net Promoter Score
Summary NPS Score
Overall benchmark net promoter score 19
City of Prospect 57
City of Holdfast Bay 48
City of Unley 47
Adelaide Hills Council 42
Campbelltown City Council 42
City of Norwood, Payneham and St Peters 41
City of West Torrens 38
City of Mitcham 33
Adelaide City Council 31
City of Burnside 30
Town of Walkerville 27
City of Charles Sturt 14
City of Tea Tree Gully 8
City of Port Adelaide Enfield 4
City of Marion -3
City of Onkaparinga -4
Mount Barker District Council -8
Town of Gawler -17
City of Salisbury 2018 resident NPS score -20
City of Playford -29
City of Salisbury benchmark score* -34*Data is owned by McGregor Tan, conducted in the MGT Omnibus Survey (Oct – Dec 2017)
McGregor Tan’s experience in conducting research in the area of Local Government provides valuable insights into comparative performance levels.
Where the same or similar questions are asked in the City of Salisbury community survey as that of other Local Government organisations we are able to provide commentary and indicative benchmark comparisons against other councils for the same performance indicators.
The benchmarking net promoter scores are based on McGregor Tan’s Omnibus survey data, conducted during 2018.
City of Salisbury residents recorded an net promoter score of -20 for likelihood of recommending living in the Council area. This score is higher than the City of Salisbury benchmark score of -34.

CORE COUNCIL SERVICES
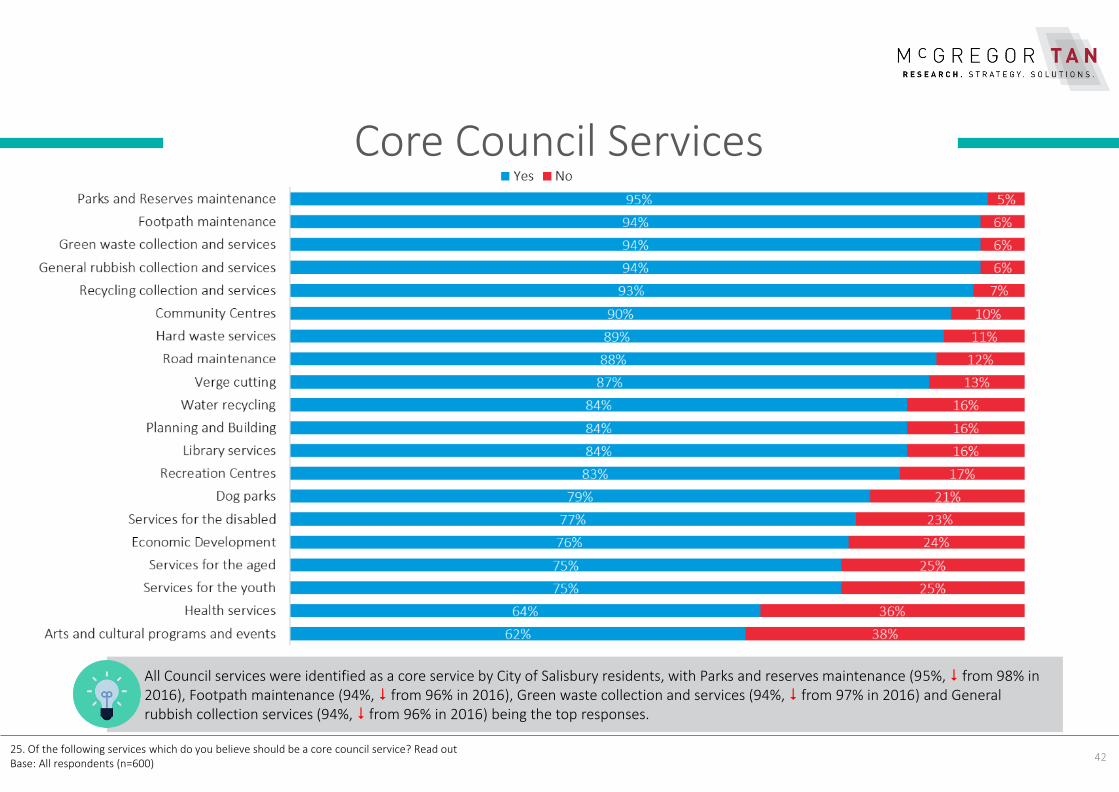
All Council services were identified as a core service by City of Salisbury residents, with Parks and reserves maintenance (95%, from 98% in 2016), Footpath maintenance (94%, from 96% in 2016), Green waste collection and services (94%, from 97% in 2016) and General rubbish collection services (94%, from 96% in 2016) being the top responses.
42
Core Council Services
25. Of the following services which do you believe should be a core council service? Read outBase: All respondents (n=600)
43
Core Council Services - Who should be responsible
25. Of the following services which do you believe should be a core council service? Read outBase: All respondents (n=600)
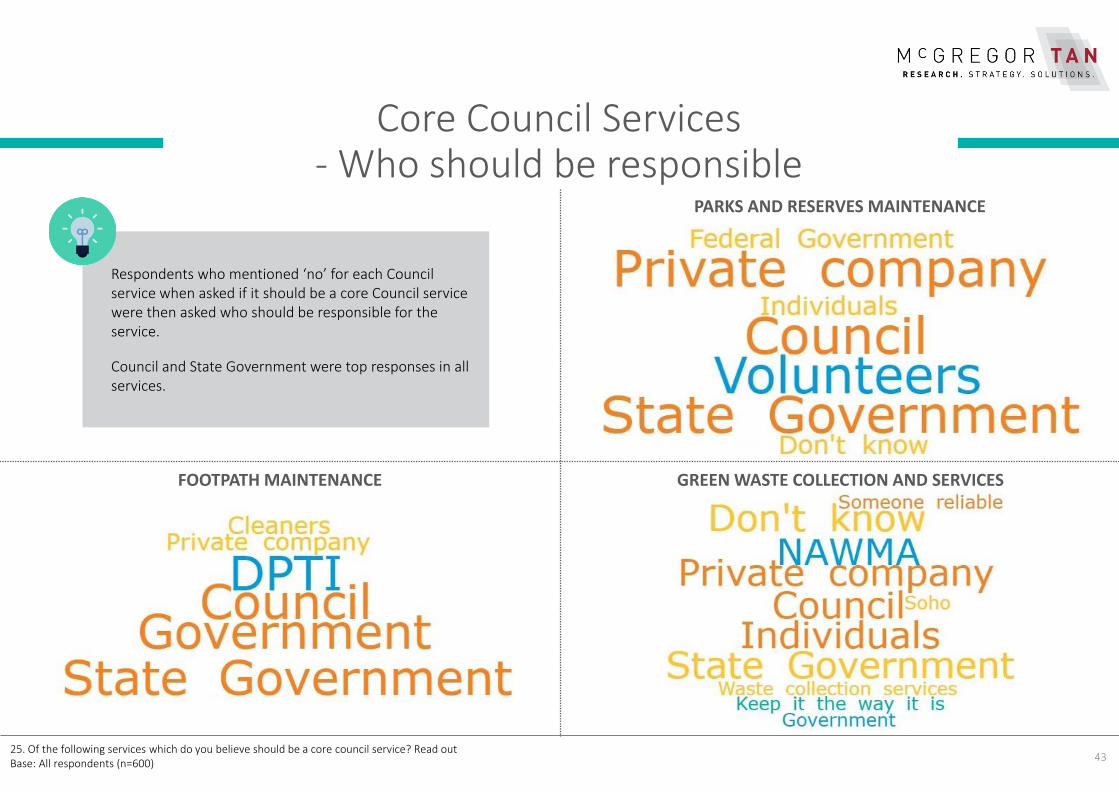
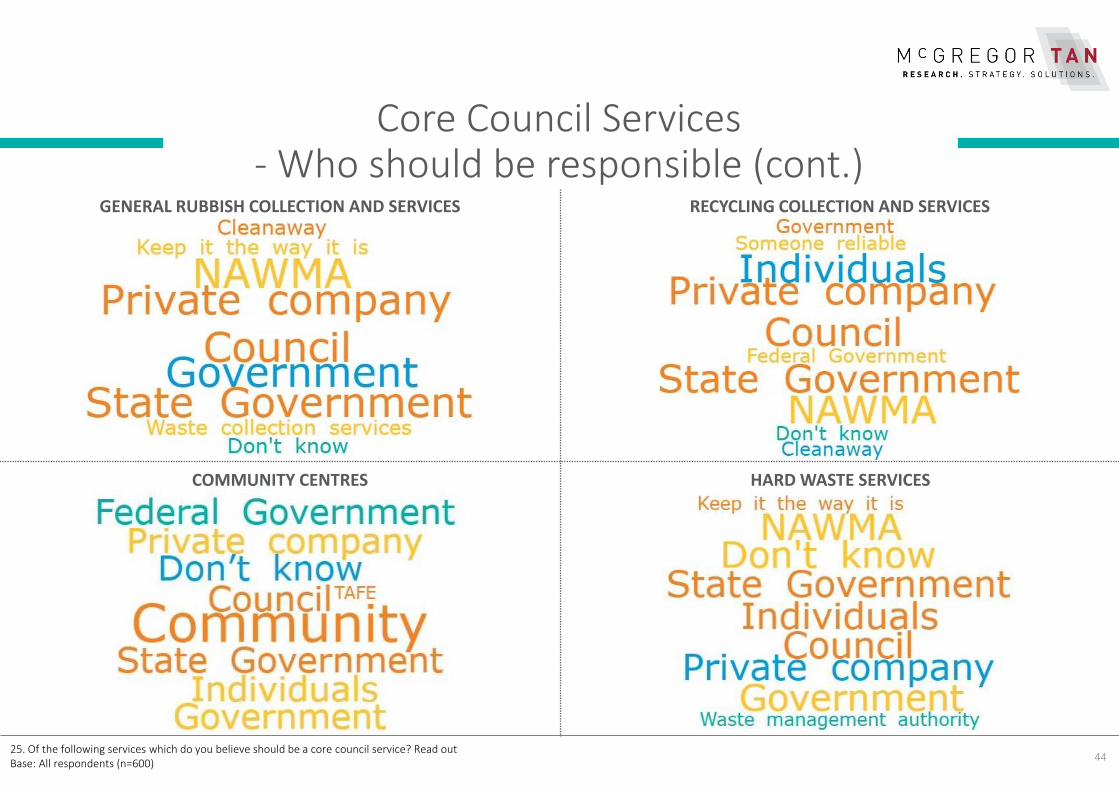
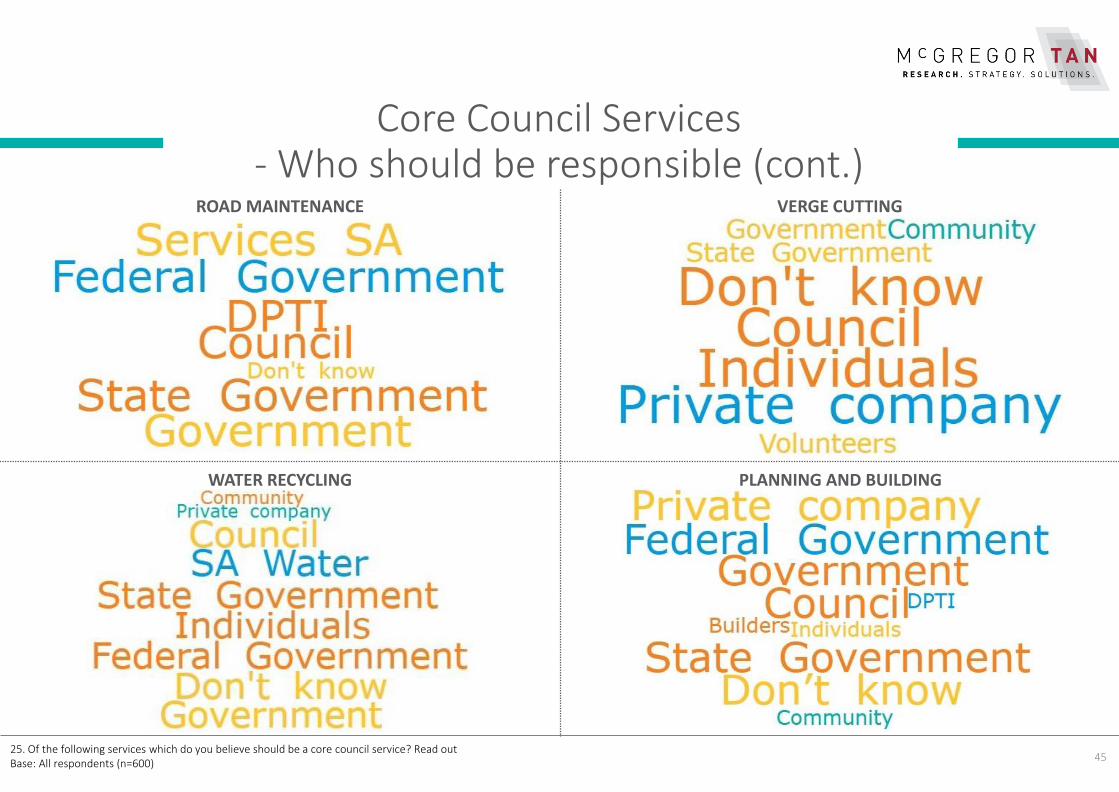
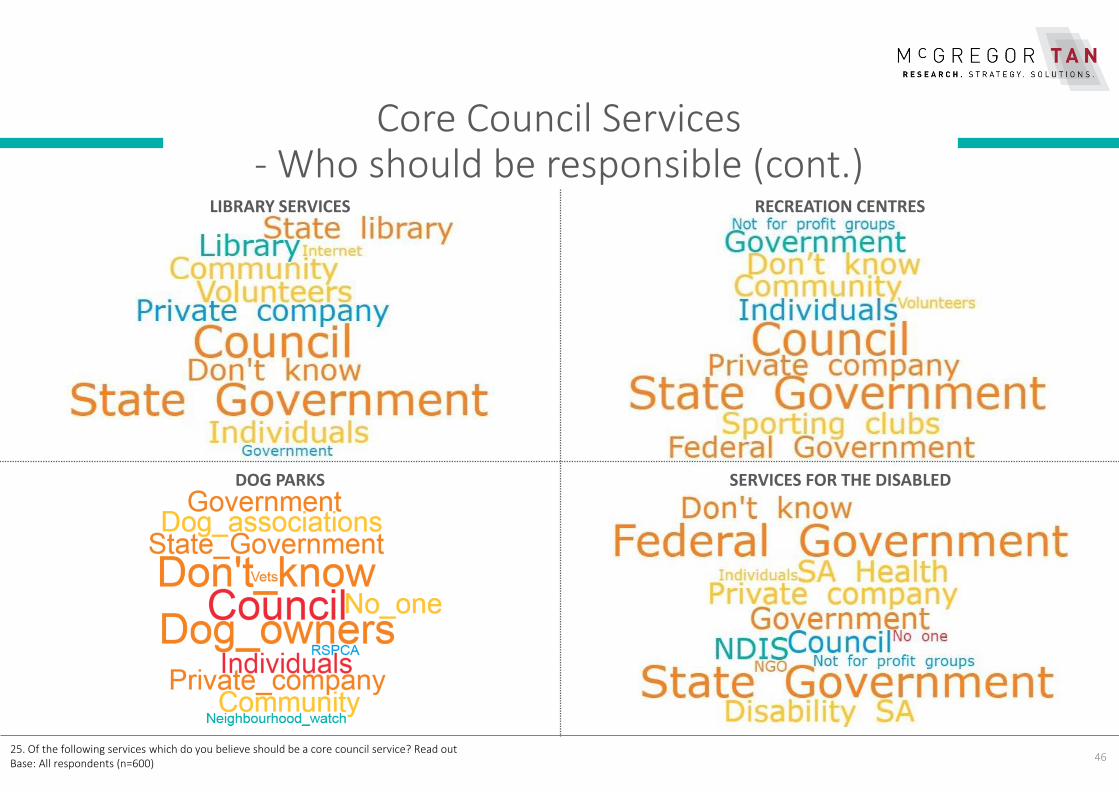
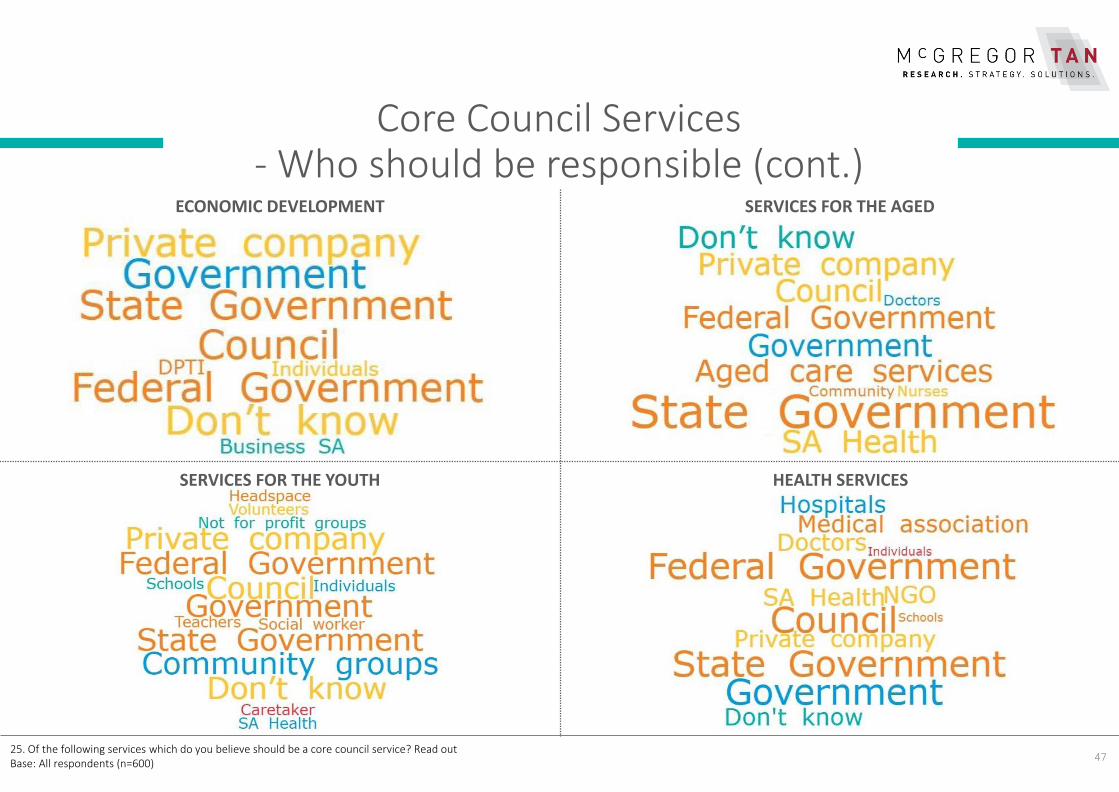
Respondents who mentioned ‘no’ for each Council service when asked if it should be a core Council service were then asked who should be responsible for the service.
Council and State Government were top responses in all services.
PARKS AND RESERVES MAINTENANCE
FOOTPATH MAINTENANCE GREEN WASTE COLLECTION AND SERVICES
44
Core Council Services - Who should be responsible (cont.)
25. Of the following services which do you believe should be a core council service? Read outBase: All respondents (n=600)
RECYCLING COLLECTION AND SERVICES
COMMUNITY CENTRES HARD WASTE SERVICES
GENERAL RUBBISH COLLECTION AND SERVICES
45
Core Council Services - Who should be responsible (cont.)
25. Of the following services which do you believe should be a core council service? Read outBase: All respondents (n=600)
VERGE CUTTING
WATER RECYCLING PLANNING AND BUILDING
ROAD MAINTENANCE
46
Core Council Services - Who should be responsible (cont.)
25. Of the following services which do you believe should be a core council service? Read outBase: All respondents (n=600)
RECREATION CENTRES
DOG PARKS SERVICES FOR THE DISABLED
LIBRARY SERVICES
47
Core Council Services - Who should be responsible (cont.)
25. Of the following services which do you believe should be a core council service? Read outBase: All respondents (n=600)
SERVICES FOR THE AGED
SERVICES FOR THE YOUTH HEALTH SERVICES
ECONOMIC DEVELOPMENT
48
Core Council Services - Who should be responsible (cont.)
25. Of the following services which do you believe should be a core council service? Read outBase: All respondents (n=600)
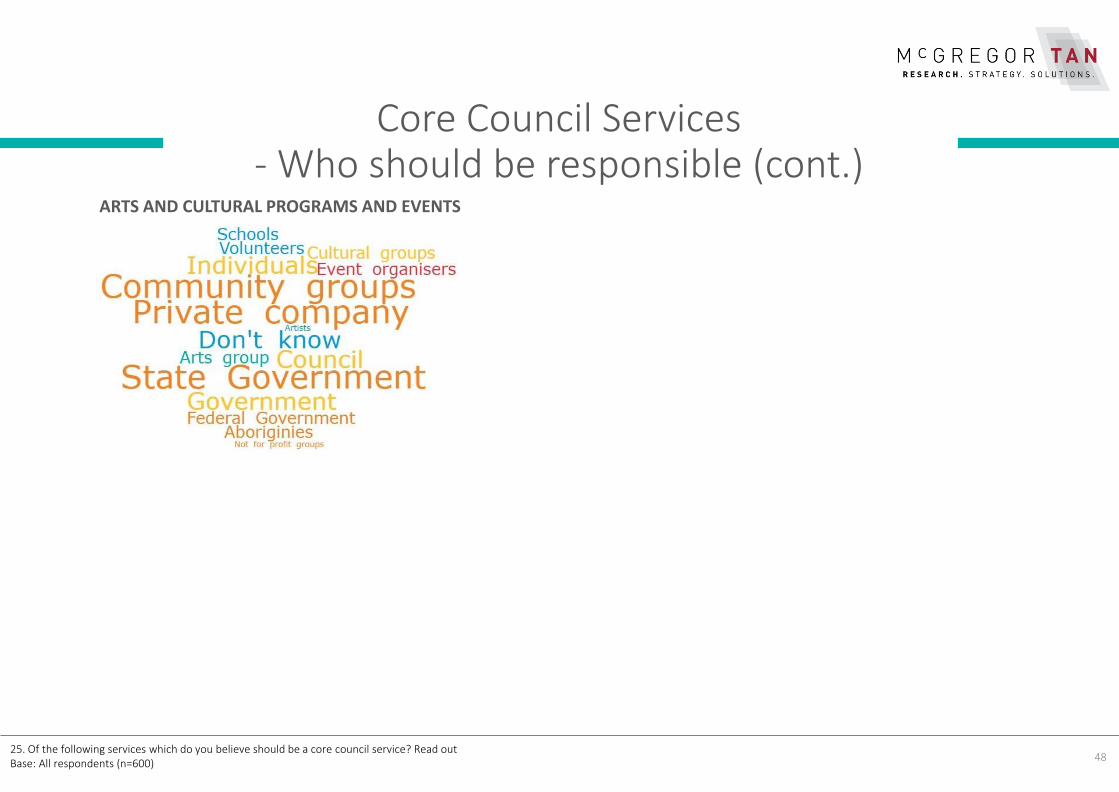
ARTS AND CULTURAL PROGRAMS AND EVENTS
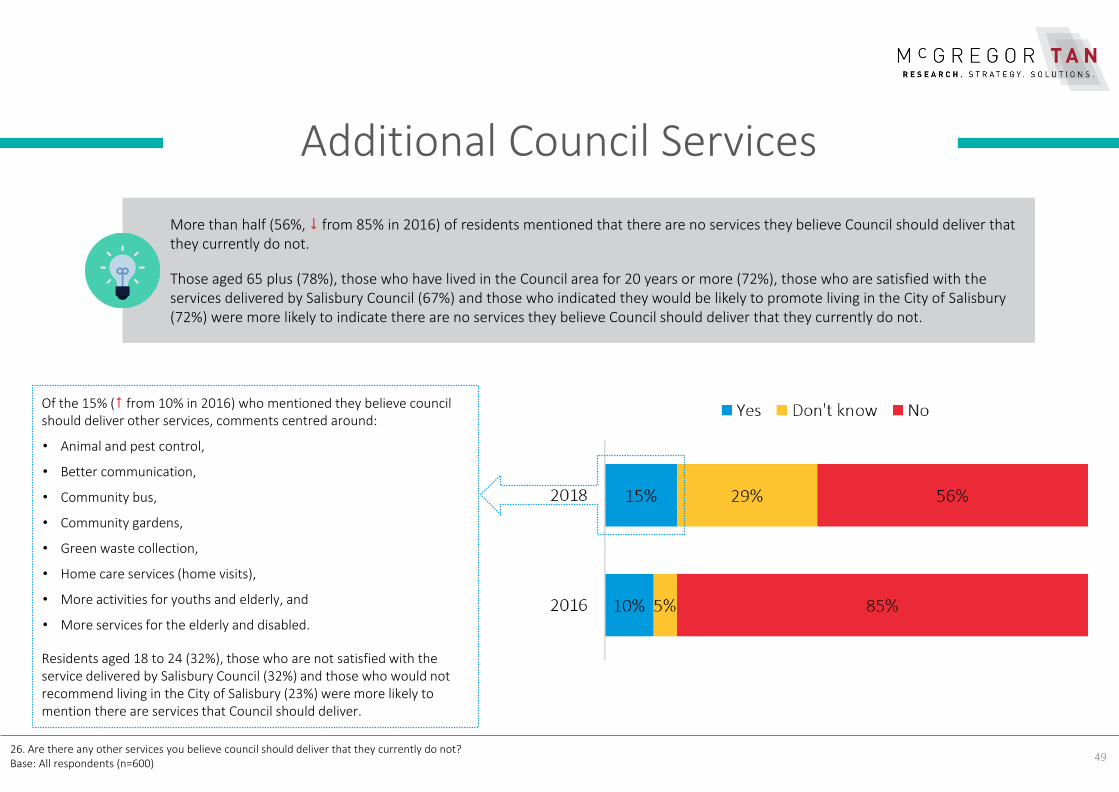
More than half (56%, from 85% in 2016) of residents mentioned that there are no services they believe Council should deliver that they currently do not.
Those aged 65 plus (78%), those who have lived in the Council area for 20 years or more (72%), those who are satisfied with the services delivered by Salisbury Council (67%) and those who indicated they would be likely to promote living in the City of Salisbury (72%) were more likely to indicate there are no services they believe Council should deliver that they currently do not.
49
Additional Council Services
26. Are there any other services you believe council should deliver that they currently do not?Base: All respondents (n=600)
Of the 15% ( from 10% in 2016) who mentioned they believe council should deliver other services, comments centred around:
• Animal and pest control,
• Better communication,
• Community bus,
• Community gardens,
• Green waste collection,
• Home care services (home visits),
• More activities for youths and elderly, and
• More services for the elderly and disabled.
Residents aged 18 to 24 (32%), those who are not satisfied with the service delivered by Salisbury Council (32%) and those who would not recommend living in the City of Salisbury (23%) were more likely to mention there are services that Council should deliver.
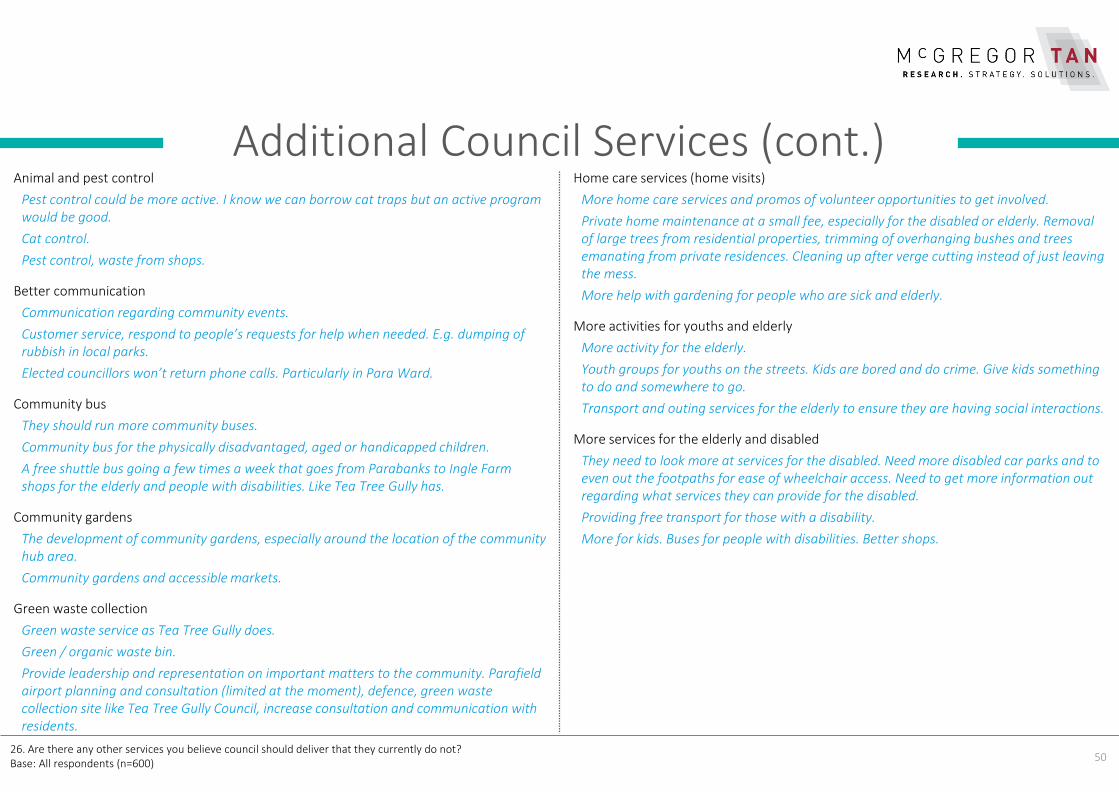
Animal and pest control
Pest control could be more active. I know we can borrow cat traps but an active program would be good.
Cat control.
Pest control, waste from shops.
Better communication
Communication regarding community events.
Customer service, respond to people’s requests for help when needed. E.g. dumping of rubbish in local parks.
Elected councillors won’t return phone calls. Particularly in Para Ward.
Community bus
They should run more community buses.
Community bus for the physically disadvantaged, aged or handicapped children.
A free shuttle bus going a few times a week that goes from Parabanks to Ingle Farm shops for the elderly and people with disabilities. Like Tea Tree Gully has.
Community gardens
The development of community gardens, especially around the location of the community hub area.
Community gardens and accessible markets.
Green waste collection
Green waste service as Tea Tree Gully does.
Green / organic waste bin.
Provide leadership and representation on important matters to the community. Parafield airport planning and consultation (limited at the moment), defence, green waste collection site like Tea Tree Gully Council, increase consultation and communication with residents.
Home care services (home visits)
More home care services and promos of volunteer opportunities to get involved.
Private home maintenance at a small fee, especially for the disabled or elderly. Removal of large trees from residential properties, trimming of overhanging bushes and trees emanating from private residences. Cleaning up after verge cutting instead of just leaving the mess.
More help with gardening for people who are sick and elderly.
More activities for youths and elderly
More activity for the elderly.
Youth groups for youths on the streets. Kids are bored and do crime. Give kids something to do and somewhere to go.
Transport and outing services for the elderly to ensure they are having social interactions.
More services for the elderly and disabled
They need to look more at services for the disabled. Need more disabled car parks and to even out the footpaths for ease of wheelchair access. Need to get more information out regarding what services they can provide for the disabled.
Providing free transport for those with a disability.
More for kids. Buses for people with disabilities. Better shops.
50
Additional Council Services (cont.)
26. Are there any other services you believe council should deliver that they currently do not?Base: All respondents (n=600)
SAFETY IN THE SALISBURY COUNCIL
AREA
52
Level of Safety in the Salisbury Council Area
Low (0,1,2,3)
Moderate (4,5,6)
High(7,8,9,10)
Mean score
Commentary
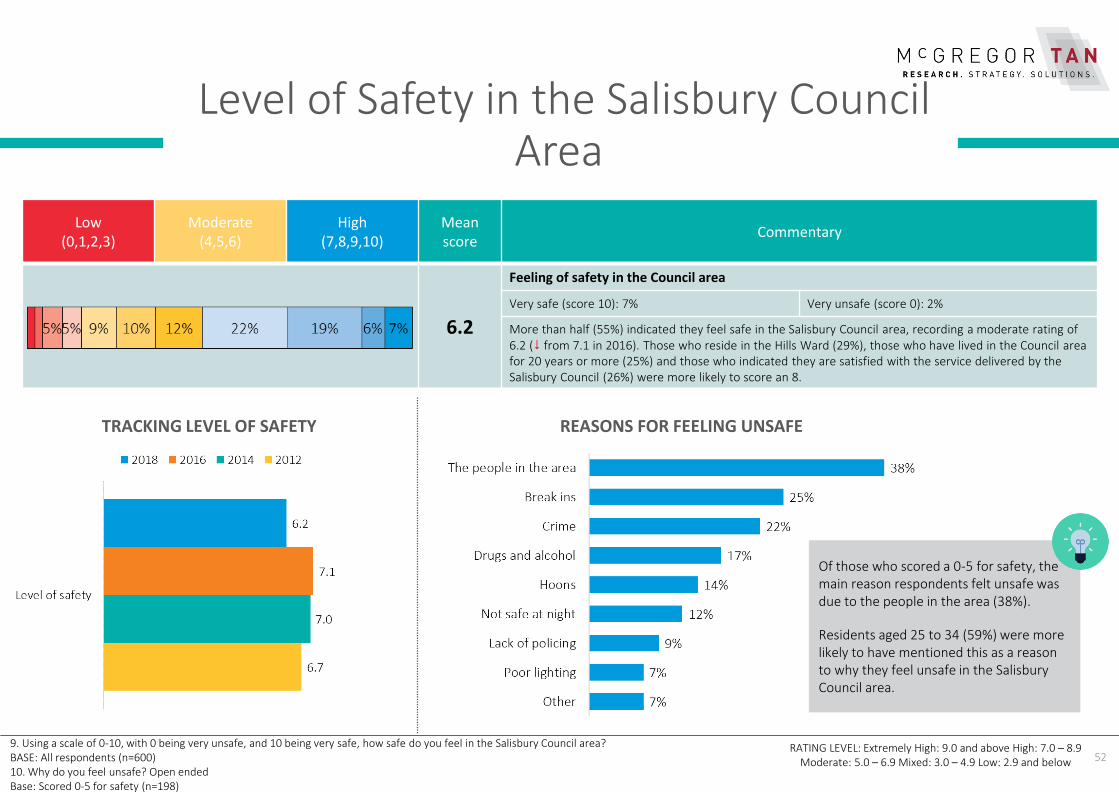
6.2
Feeling of safety in the Council area
Very safe (score 10): 7% Very unsafe (score 0): 2%
More than half (55%) indicated they feel safe in the Salisbury Council area, recording a moderate rating of 6.2 ( from 7.1 in 2016). Those who reside in the Hills Ward (29%), those who have lived in the Council area for 20 years or more (25%) and those who indicated they are satisfied with the service delivered by the Salisbury Council (26%) were more likely to score an 8.
RATING LEVEL: Extremely High: 9.0 and above High: 7.0 – 8.9 Moderate: 5.0 – 6.9 Mixed: 3.0 – 4.9 Low: 2.9 and below
9. Using a scale of 0-10, with 0 being very unsafe, and 10 being very safe, how safe do you feel in the Salisbury Council area? BASE: All respondents (n=600)10. Why do you feel unsafe? Open ended Base: Scored 0-5 for safety (n=198)
REASONS FOR FEELING UNSAFETRACKING LEVEL OF SAFETY
Of those who scored a 0-5 for safety, the main reason respondents felt unsafe was due to the people in the area (38%).
Residents aged 25 to 34 (59%) were more likely to have mentioned this as a reason to why they feel unsafe in the Salisbury Council area.
53
Particular Locations and Reasons for Feeling Unsafe
11. Is there a particular location within the Salisbury City Council area where you feel unsafe? Unprompted, multiple response 12. Is there a particular reason why you feel unsafe? Unprompted, multiple responseBoth Base: Scored 0-5 for safety (n=198)
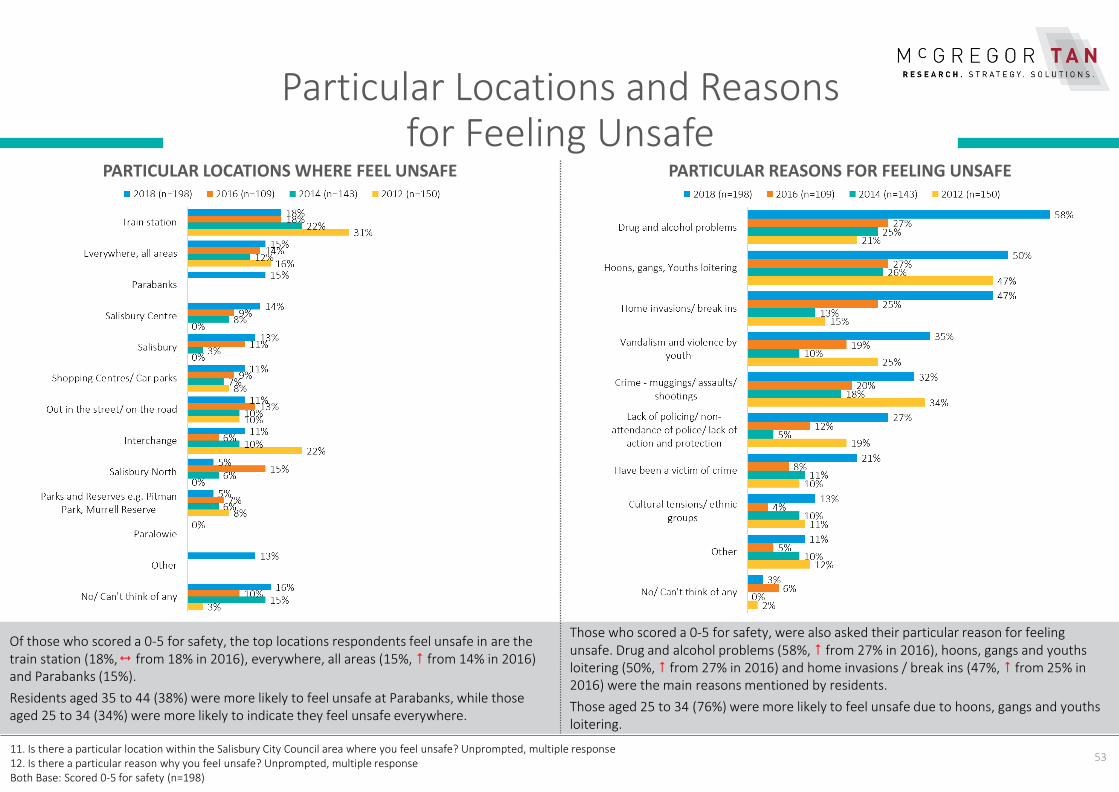
Of those who scored a 0-5 for safety, the top locations respondents feel unsafe in are the train station (18%, from 18% in 2016), everywhere, all areas (15%, from 14% in 2016) and Parabanks (15%).
Residents aged 35 to 44 (38%) were more likely to feel unsafe at Parabanks, while those aged 25 to 34 (34%) were more likely to indicate they feel unsafe everywhere.
Those who scored a 0-5 for safety, were also asked their particular reason for feeling unsafe. Drug and alcohol problems (58%, from 27% in 2016), hoons, gangs and youths loitering (50%, from 27% in 2016) and home invasions / break ins (47%, from 25% in 2016) were the main reasons mentioned by residents.
Those aged 25 to 34 (76%) were more likely to feel unsafe due to hoons, gangs and youths loitering.
PARTICULAR LOCATIONS WHERE FEEL UNSAFE PARTICULAR REASONS FOR FEELING UNSAFE

COMMUNICATION AND CONTACT
55
Method of Communication
27. In which ways does council keep you informed about events, services or Council’s key directions in the council area? Prompted, multiple response28. How would you prefer the council to keep you informed about events, services or Council’s key directions in the council area? Prompted, multiple responseBase: All respondents (n=600)
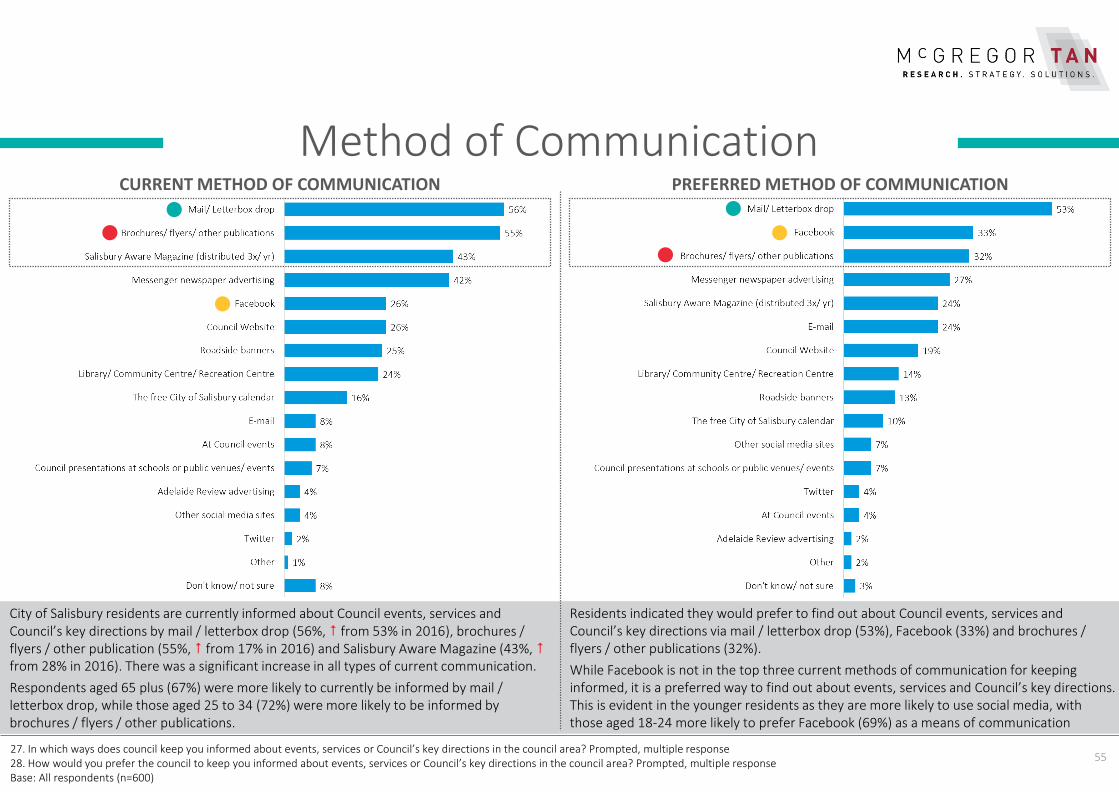
City of Salisbury residents are currently informed about Council events, services and Council’s key directions by mail / letterbox drop (56%, from 53% in 2016), brochures / flyers / other publication (55%, from 17% in 2016) and Salisbury Aware Magazine (43%, from 28% in 2016). There was a significant increase in all types of current communication.
Respondents aged 65 plus (67%) were more likely to currently be informed by mail / letterbox drop, while those aged 25 to 34 (72%) were more likely to be informed by brochures / flyers / other publications.
Residents indicated they would prefer to find out about Council events, services and Council’s key directions via mail / letterbox drop (53%), Facebook (33%) and brochures / flyers / other publications (32%).
While Facebook is not in the top three current methods of communication for keeping informed, it is a preferred way to find out about events, services and Council’s key directions. This is evident in the younger residents as they are more likely to use social media, with those aged 18-24 more likely to prefer Facebook (69%) as a means of communication
CURRENT METHOD OF COMMUNICATION PREFERRED METHOD OF COMMUNICATION

Half (48%, from 47% in 2016) of Salisbury Council residents prefer to engage with the Council over the phone, whilst 36% ( from 31% in 2016) prefer to engage in person.
56
Preferred Way to Engage with Council
29. How do you prefer to engage with Council? PromptedBase: All respondents (n=600)
More likely to be those aged 65 plus, those who reside in the Hills Ward, those who have lived in the Council area for 20 years or more and those who are satisfied with the services
delivered by Salisbury Council.
More likely to be those aged
55 to 64.More likely to be those aged 18 to 24 and 35 to 44.
More likely to be those aged 18 to 34 and those
who have lived in the Council area for 3 to less
than 5 years.
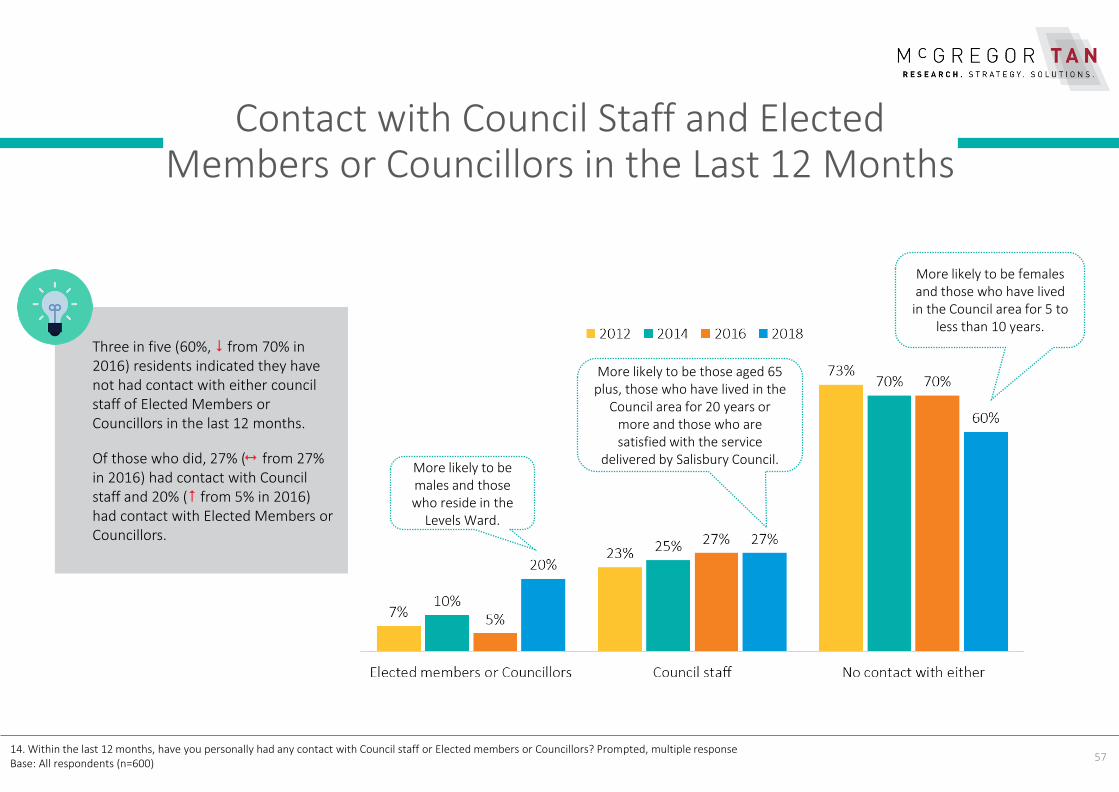
Three in five (60%, from 70% in 2016) residents indicated they have not had contact with either council staff of Elected Members or Councillors in the last 12 months.
Of those who did, 27% ( from 27% in 2016) had contact with Council staff and 20% ( from 5% in 2016) had contact with Elected Members or Councillors.
57
Contact with Council Staff and Elected Members or Councillors in the Last 12 Months
14. Within the last 12 months, have you personally had any contact with Council staff or Elected members or Councillors? Prompted, multiple responseBase: All respondents (n=600)
More likely to be males and those who reside in the
Levels Ward.
More likely to be those aged 65 plus, those who have lived in the
Council area for 20 years or more and those who are satisfied with the service
delivered by Salisbury Council.
More likely to be females and those who have lived
in the Council area for 5 to less than 10 years.
Low (0,1,2,3)
Moderate (4,5,6)
High(7,8,9,10)
Mean score
Commentary
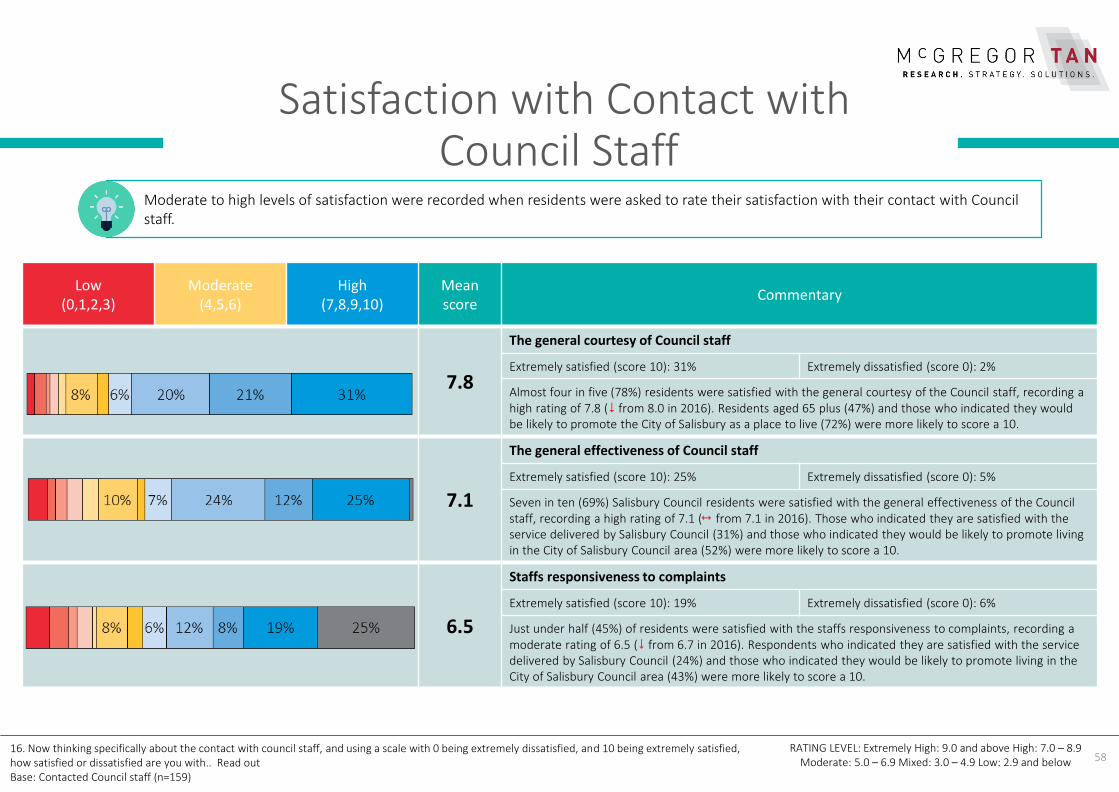
7.8
The general courtesy of Council staff
Extremely satisfied (score 10): 31% Extremely dissatisfied (score 0): 2%
Almost four in five (78%) residents were satisfied with the general courtesy of the Council staff, recording a high rating of 7.8 ( from 8.0 in 2016). Residents aged 65 plus (47%) and those who indicated they would be likely to promote the City of Salisbury as a place to live (72%) were more likely to score a 10.
7.1
The general effectiveness of Council staff
Extremely satisfied (score 10): 25% Extremely dissatisfied (score 0): 5%
Seven in ten (69%) Salisbury Council residents were satisfied with the general effectiveness of the Council staff, recording a high rating of 7.1 ( from 7.1 in 2016). Those who indicated they are satisfied with the service delivered by Salisbury Council (31%) and those who indicated they would be likely to promote living in the City of Salisbury Council area (52%) were more likely to score a 10.
6.5
Staffs responsiveness to complaints
Extremely satisfied (score 10): 19% Extremely dissatisfied (score 0): 6%
Just under half (45%) of residents were satisfied with the staffs responsiveness to complaints, recording a moderate rating of 6.5 ( from 6.7 in 2016). Respondents who indicated they are satisfied with the service delivered by Salisbury Council (24%) and those who indicated they would be likely to promote living in the City of Salisbury Council area (43%) were more likely to score a 10.
58
Satisfaction with Contact with Council Staff
RATING LEVEL: Extremely High: 9.0 and above High: 7.0 – 8.9 Moderate: 5.0 – 6.9 Mixed: 3.0 – 4.9 Low: 2.9 and below
16. Now thinking specifically about the contact with council staff, and using a scale with 0 being extremely dissatisfied, and 10 being extremely satisfied, how satisfied or dissatisfied are you with.. Read outBase: Contacted Council staff (n=159)
Moderate to high levels of satisfaction were recorded when residents were asked to rate their satisfaction with their contact with Council staff.
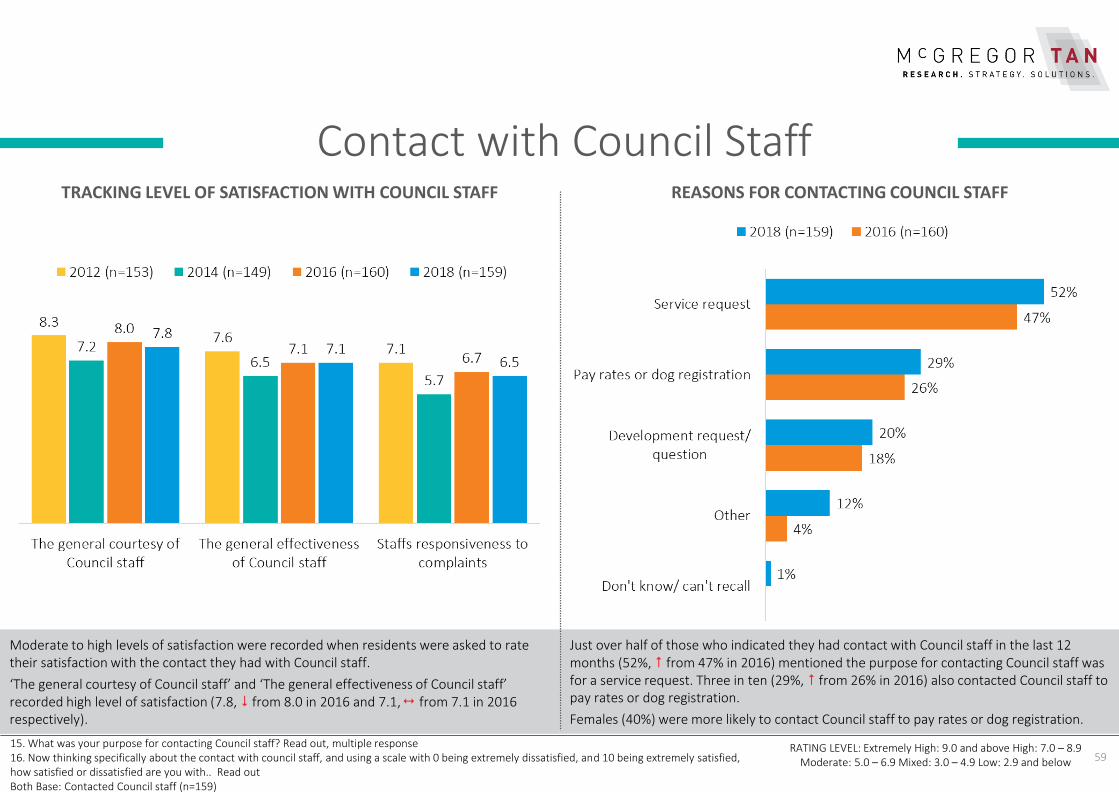
REASONS FOR CONTACTING COUNCIL STAFFTRACKING LEVEL OF SATISFACTION WITH COUNCIL STAFF
59
Contact with Council Staff
RATING LEVEL: Extremely High: 9.0 and above High: 7.0 – 8.9 Moderate: 5.0 – 6.9 Mixed: 3.0 – 4.9 Low: 2.9 and below
15. What was your purpose for contacting Council staff? Read out, multiple response16. Now thinking specifically about the contact with council staff, and using a scale with 0 being extremely dissatisfied, and 10 being extremely satisfied, how satisfied or dissatisfied are you with.. Read outBoth Base: Contacted Council staff (n=159)
Moderate to high levels of satisfaction were recorded when residents were asked to rate their satisfaction with the contact they had with Council staff.
‘The general courtesy of Council staff’ and ‘The general effectiveness of Council staff’ recorded high level of satisfaction (7.8, from 8.0 in 2016 and 7.1, from 7.1 in 2016 respectively).
Just over half of those who indicated they had contact with Council staff in the last 12 months (52%, from 47% in 2016) mentioned the purpose for contacting Council staff was for a service request. Three in ten (29%, from 26% in 2016) also contacted Council staff to pay rates or dog registration.
Females (40%) were more likely to contact Council staff to pay rates or dog registration.
Low (0,1,2,3)
Moderate (4,5,6)
High(7,8,9,10)
Mean score
Commentary
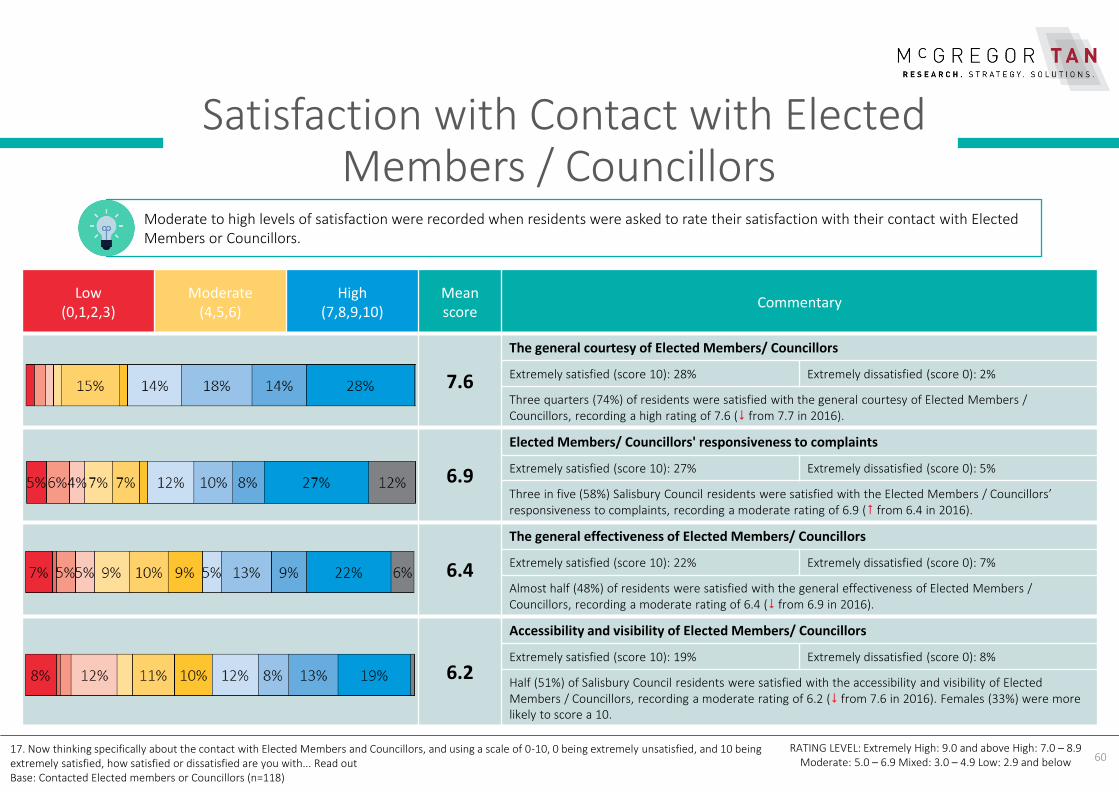
7.6
The general courtesy of Elected Members/ Councillors
Extremely satisfied (score 10): 28% Extremely dissatisfied (score 0): 2%
Three quarters (74%) of residents were satisfied with the general courtesy of Elected Members / Councillors, recording a high rating of 7.6 ( from 7.7 in 2016).
6.9
Elected Members/ Councillors' responsiveness to complaints
Extremely satisfied (score 10): 27% Extremely dissatisfied (score 0): 5%
Three in five (58%) Salisbury Council residents were satisfied with the Elected Members / Councillors’ responsiveness to complaints, recording a moderate rating of 6.9 ( from 6.4 in 2016).
6.4
The general effectiveness of Elected Members/ Councillors
Extremely satisfied (score 10): 22% Extremely dissatisfied (score 0): 7%
Almost half (48%) of residents were satisfied with the general effectiveness of Elected Members / Councillors, recording a moderate rating of 6.4 ( from 6.9 in 2016).
6.2
Accessibility and visibility of Elected Members/ Councillors
Extremely satisfied (score 10): 19% Extremely dissatisfied (score 0): 8%
Half (51%) of Salisbury Council residents were satisfied with the accessibility and visibility of Elected Members / Councillors, recording a moderate rating of 6.2 ( from 7.6 in 2016). Females (33%) were more likely to score a 10.
60
Satisfaction with Contact with Elected Members / Councillors
RATING LEVEL: Extremely High: 9.0 and above High: 7.0 – 8.9 Moderate: 5.0 – 6.9 Mixed: 3.0 – 4.9 Low: 2.9 and below
17. Now thinking specifically about the contact with Elected Members and Councillors, and using a scale of 0-10, 0 being extremely unsatisfied, and 10 being extremely satisfied, how satisfied or dissatisfied are you with... Read out Base: Contacted Elected members or Councillors (n=118)
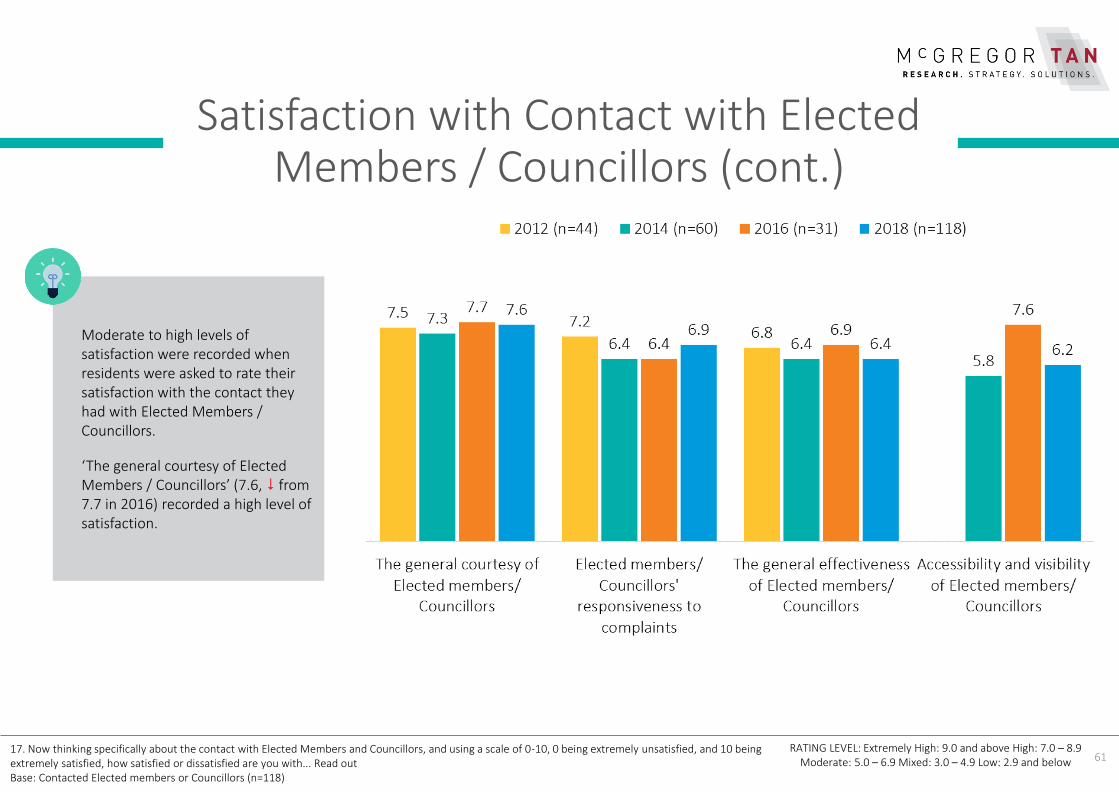
Moderate to high levels of satisfaction were recorded when residents were asked to rate their satisfaction with their contact with Elected Members or Councillors.
61
Satisfaction with Contact with Elected Members / Councillors (cont.)
RATING LEVEL: Extremely High: 9.0 and above High: 7.0 – 8.9 Moderate: 5.0 – 6.9 Mixed: 3.0 – 4.9 Low: 2.9 and below
Moderate to high levels of satisfaction were recorded when residents were asked to rate their satisfaction with the contact they had with Elected Members / Councillors.
‘The general courtesy of Elected Members / Councillors’ (7.6, from 7.7 in 2016) recorded a high level of satisfaction.
17. Now thinking specifically about the contact with Elected Members and Councillors, and using a scale of 0-10, 0 being extremely unsatisfied, and 10 being extremely satisfied, how satisfied or dissatisfied are you with... Read out Base: Contacted Elected members or Councillors (n=118)

LIVING IN THE CITY OF
SALISBURY

Those who have lived in the council area for less than 5 years mentioned that the cost of housing (54%, from 25% in 2016) was a main attraction when moving into the Salisbury Council area, followed by the location (47%, from 53% in 2016).
63
What Attracted Residents to Living in the Area
6. Thinking about when you moved into the Salisbury Council area, what attracted you to living in the area? Unprompted, multiple responseBASE: Lived in council area for less than 5 years (n=103)

64
What Attracted Residents to Living in the Area (cont.)
The cost of housing (42%) was an attraction for all residents when moving into the Salisbury Council area.
• Lived in the council area for less than 5 years (54%),
• Lived in the council area for more than 5 years (39%).
Residents who have lived in the Council area for 5 years or more and reside in the East Ward (53%) were more likely to indicate the cost of housing is what attracted them to the area, while those who have lived in the Council area for 5 years or more and reside in the South Ward (48%) were more likely to mention the location.
6. Thinking about when you moved into the Salisbury Council area, what attracted you to living in the area? Unprompted, multiple responseBASE: Lived in council area for less than 5 years (n=103)BASE: Lived in council area for more than 5 years (n=497)
65
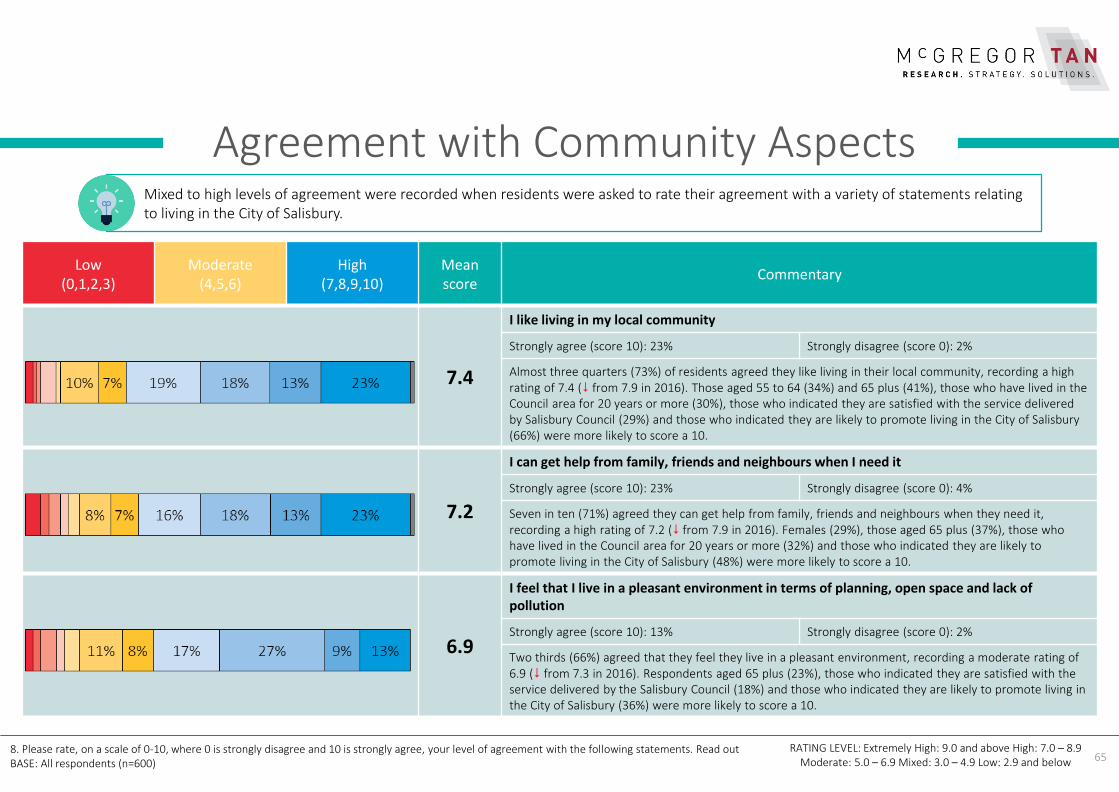
Agreement with Community Aspects
Low (0,1,2,3)
Moderate (4,5,6)
High(7,8,9,10)
Mean score
Commentary
7.4
I like living in my local community
Strongly agree (score 10): 23% Strongly disagree (score 0): 2%
Almost three quarters (73%) of residents agreed they like living in their local community, recording a high rating of 7.4 ( from 7.9 in 2016). Those aged 55 to 64 (34%) and 65 plus (41%), those who have lived in the Council area for 20 years or more (30%), those who indicated they are satisfied with the service delivered by Salisbury Council (29%) and those who indicated they are likely to promote living in the City of Salisbury (66%) were more likely to score a 10.
7.2
I can get help from family, friends and neighbours when I need it
Strongly agree (score 10): 23% Strongly disagree (score 0): 4%
Seven in ten (71%) agreed they can get help from family, friends and neighbours when they need it, recording a high rating of 7.2 ( from 7.9 in 2016). Females (29%), those aged 65 plus (37%), those who have lived in the Council area for 20 years or more (32%) and those who indicated they are likely to promote living in the City of Salisbury (48%) were more likely to score a 10.
6.9
I feel that I live in a pleasant environment in terms of planning, open space and lack of pollution
Strongly agree (score 10): 13% Strongly disagree (score 0): 2%
Two thirds (66%) agreed that they feel they live in a pleasant environment, recording a moderate rating of 6.9 ( from 7.3 in 2016). Respondents aged 65 plus (23%), those who indicated they are satisfied with the service delivered by the Salisbury Council (18%) and those who indicated they are likely to promote living in the City of Salisbury (36%) were more likely to score a 10.
Mixed to high levels of agreement were recorded when residents were asked to rate their agreement with a variety of statements relating to living in the City of Salisbury.
RATING LEVEL: Extremely High: 9.0 and above High: 7.0 – 8.9 Moderate: 5.0 – 6.9 Mixed: 3.0 – 4.9 Low: 2.9 and below
8. Please rate, on a scale of 0-10, where 0 is strongly disagree and 10 is strongly agree, your level of agreement with the following statements. Read outBASE: All respondents (n=600)
66
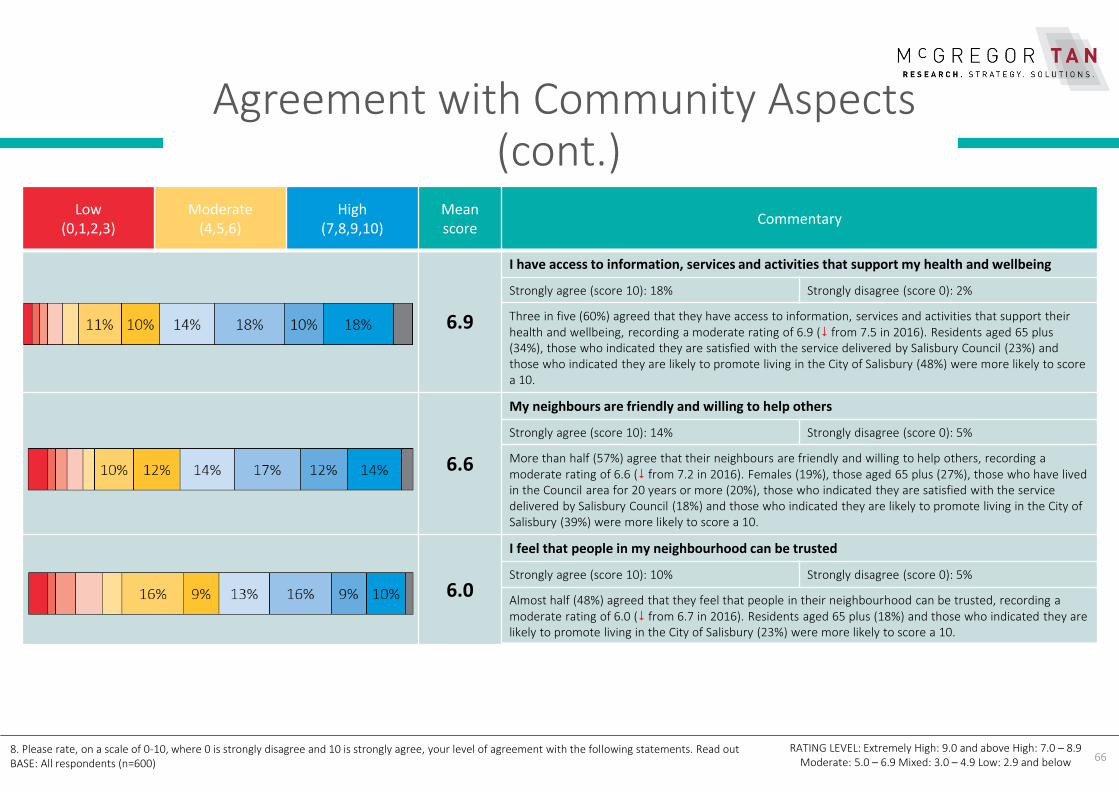
Agreement with Community Aspects (cont.)
Low (0,1,2,3)
Moderate (4,5,6)
High(7,8,9,10)
Mean score
Commentary
6.9
I have access to information, services and activities that support my health and wellbeing
Strongly agree (score 10): 18% Strongly disagree (score 0): 2%
Three in five (60%) agreed that they have access to information, services and activities that support their health and wellbeing, recording a moderate rating of 6.9 ( from 7.5 in 2016). Residents aged 65 plus (34%), those who indicated they are satisfied with the service delivered by Salisbury Council (23%) and those who indicated they are likely to promote living in the City of Salisbury (48%) were more likely to score a 10.
6.6
My neighbours are friendly and willing to help others
Strongly agree (score 10): 14% Strongly disagree (score 0): 5%
More than half (57%) agree that their neighbours are friendly and willing to help others, recording a moderate rating of 6.6 ( from 7.2 in 2016). Females (19%), those aged 65 plus (27%), those who have lived in the Council area for 20 years or more (20%), those who indicated they are satisfied with the service delivered by Salisbury Council (18%) and those who indicated they are likely to promote living in the City of Salisbury (39%) were more likely to score a 10.
6.0
I feel that people in my neighbourhood can be trusted
Strongly agree (score 10): 10% Strongly disagree (score 0): 5%
Almost half (48%) agreed that they feel that people in their neighbourhood can be trusted, recording a moderate rating of 6.0 ( from 6.7 in 2016). Residents aged 65 plus (18%) and those who indicated they are likely to promote living in the City of Salisbury (23%) were more likely to score a 10.
RATING LEVEL: Extremely High: 9.0 and above High: 7.0 – 8.9 Moderate: 5.0 – 6.9 Mixed: 3.0 – 4.9 Low: 2.9 and below
8. Please rate, on a scale of 0-10, where 0 is strongly disagree and 10 is strongly agree, your level of agreement with the following statements. Read outBASE: All respondents (n=600)
67
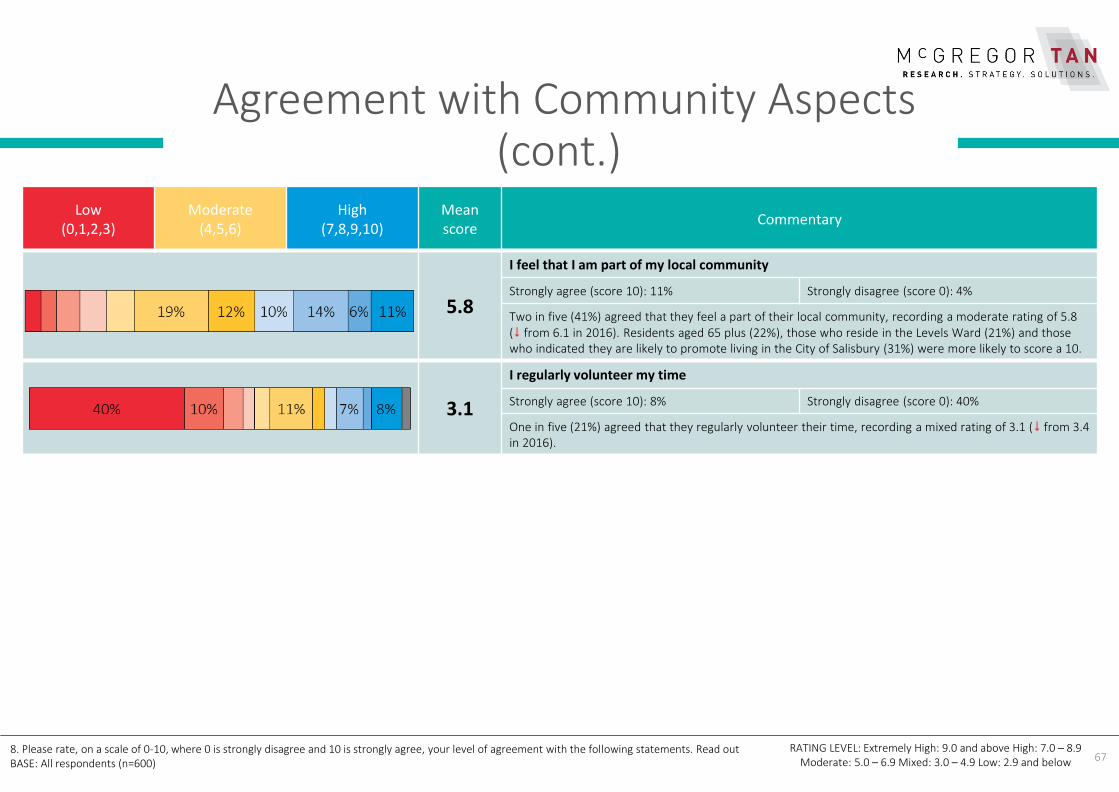
Agreement with Community Aspects (cont.)
Low (0,1,2,3)
Moderate (4,5,6)
High(7,8,9,10)
Mean score
Commentary
5.8
I feel that I am part of my local community
Strongly agree (score 10): 11% Strongly disagree (score 0): 4%
Two in five (41%) agreed that they feel a part of their local community, recording a moderate rating of 5.8 ( from 6.1 in 2016). Residents aged 65 plus (22%), those who reside in the Levels Ward (21%) and those who indicated they are likely to promote living in the City of Salisbury (31%) were more likely to score a 10.
3.1
I regularly volunteer my time
Strongly agree (score 10): 8% Strongly disagree (score 0): 40%
One in five (21%) agreed that they regularly volunteer their time, recording a mixed rating of 3.1 ( from 3.4 in 2016).
RATING LEVEL: Extremely High: 9.0 and above High: 7.0 – 8.9 Moderate: 5.0 – 6.9 Mixed: 3.0 – 4.9 Low: 2.9 and below
8. Please rate, on a scale of 0-10, where 0 is strongly disagree and 10 is strongly agree, your level of agreement with the following statements. Read outBASE: All respondents (n=600)
68
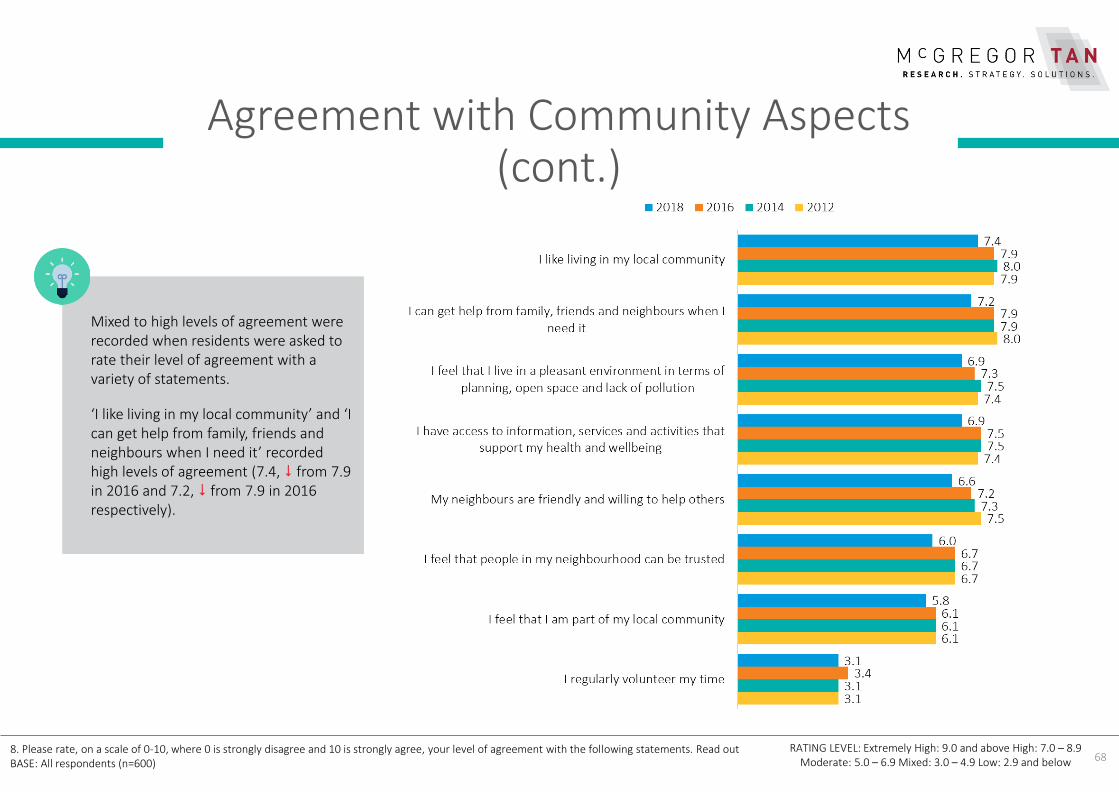
Agreement with Community Aspects (cont.)
8. Please rate, on a scale of 0-10, where 0 is strongly disagree and 10 is strongly agree, your level of agreement with the following statements. Read outBASE: All respondents (n=600)
RATING LEVEL: Extremely High: 9.0 and above High: 7.0 – 8.9 Moderate: 5.0 – 6.9 Mixed: 3.0 – 4.9 Low: 2.9 and below
Mixed to high levels of agreement were recorded when residents were asked to rate their level of agreement with a variety of statements.
‘I like living in my local community’ and ‘I can get help from family, friends and neighbours when I need it’ recorded high levels of agreement (7.4, from 7.9 in 2016 and 7.2, from 7.9 in 2016 respectively).
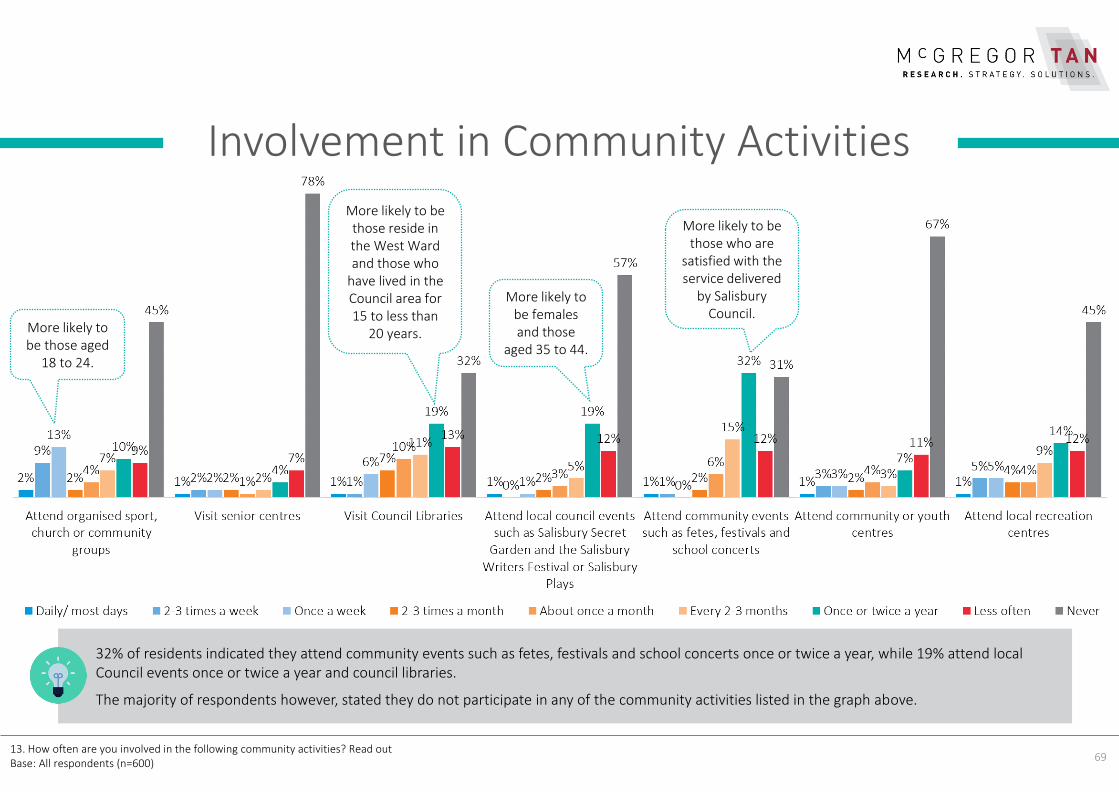
32% of residents indicated they attend community events such as fetes, festivals and school concerts once or twice a year, while 19% attend local Council events once or twice a year and council libraries.
The majority of respondents however, stated they do not participate in any of the community activities listed in the graph above.
69
Involvement in Community Activities
13. How often are you involved in the following community activities? Read outBase: All respondents (n=600)
More likely to be those who are
satisfied with the service delivered
by Salisbury Council.
More likely to be those reside in the West Ward and those who
have lived in the Council area for 15 to less than
20 years.
More likely to be females and those
aged 35 to 44.
More likely to be those aged
18 to 24.
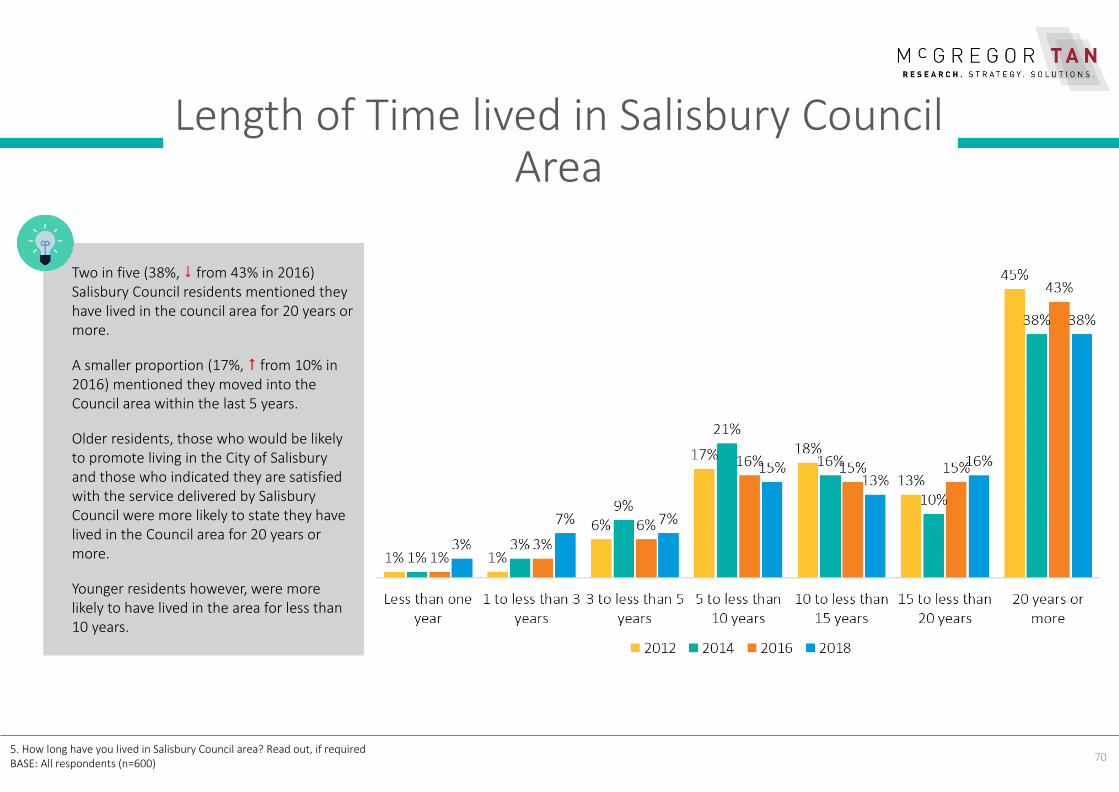
Two in five (38%, from 43% in 2016) Salisbury Council residents mentioned they have lived in the council area for 20 years or more.
A smaller proportion (17%, from 10% in 2016) mentioned they moved into the Council area within the last 5 years.
Older residents, those who would be likely to promote living in the City of Salisbury and those who indicated they are satisfied with the service delivered by Salisbury Council were more likely to state they have lived in the Council area for 20 years or more.
Younger residents however, were more likely to have lived in the area for less than 10 years.
70
Length of Time lived in Salisbury Council Area
5. How long have you lived in Salisbury Council area? Read out, if requiredBASE: All respondents (n=600)
Low (0,1,2,3)
Moderate (4,5,6)
High(7,8,9,10)
Mean score
Much more affordable or cheaper (score 10): 8%
Much less affordable or expensive (score 0): 1%
7.0
Three in five (62%) residents mentioned housing is more affordable or cheaper to rent or buy in the Salisbury Council area, compared to the rest of Adelaide, recording a high rating of 7.0 ( from 7.0 in 2016).
Respondents who reside in the East Ward (33%) and those who are satisfied with the services delivered by Salisbury Council (27%) were more likely to score an 8.
71
Perceptions of Housing Affordability
RATING LEVEL: Extremely High: 9.0 and above High: 7.0 – 8.9 Moderate: 5.0 – 6.9 Mixed: 3.0 – 4.9 Low: 2.9 and below
32. Compared to other areas across Adelaide, how affordable would you say it is to rent or buy housing in the Salisbury Council area? Please use a 0-10 scale where 0 means it is much less affordable, or more expensive, and 10 means it is much more affordable, or cheaper, than the rest of Adelaide? Base: All respondents (n=600)
TRACKING LEVEL OF HOUSING AFFORDABILITYPERCEPTIONS OF HOUSING AFFORDABILITY IN SALISBURY COUNCIL AREA

APPENDIX 1:RESPONDENT
PROFILE
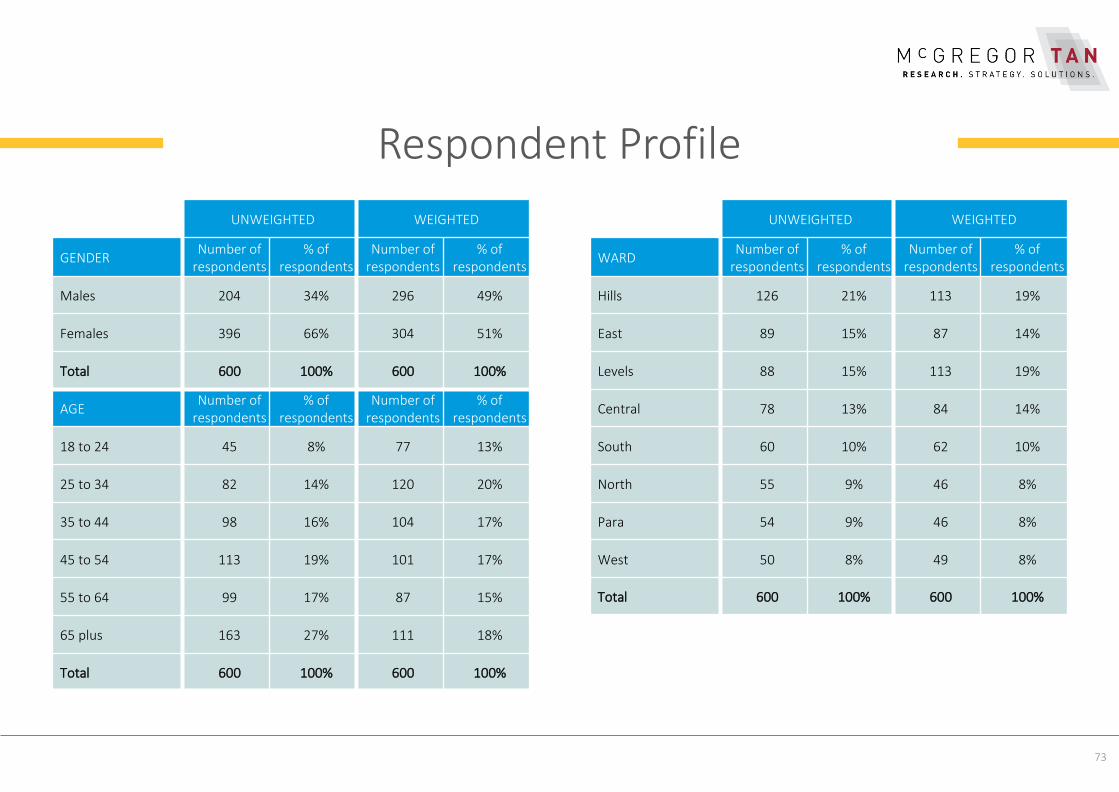
Respondent Profile
73
UNWEIGHTED WEIGHTED
GENDERNumber of
respondents% of
respondentsNumber of
respondents% of
respondents
Males 204 34% 296 49%
Females 396 66% 304 51%
Total 600 100% 600 100%
AGENumber of
respondents% of
respondentsNumber of
respondents% of
respondents
18 to 24 45 8% 77 13%
25 to 34 82 14% 120 20%
35 to 44 98 16% 104 17%
45 to 54 113 19% 101 17%
55 to 64 99 17% 87 15%
65 plus 163 27% 111 18%
Total 600 100% 600 100%
UNWEIGHTED WEIGHTED
WARDNumber of
respondents% of
respondentsNumber of
respondents% of
respondents
Hills 126 21% 113 19%
East 89 15% 87 14%
Levels 88 15% 113 19%
Central 78 13% 84 14%
South 60 10% 62 10%
North 55 9% 46 8%
Para 54 9% 46 8%
West 50 8% 49 8%
Total 600 100% 600 100%
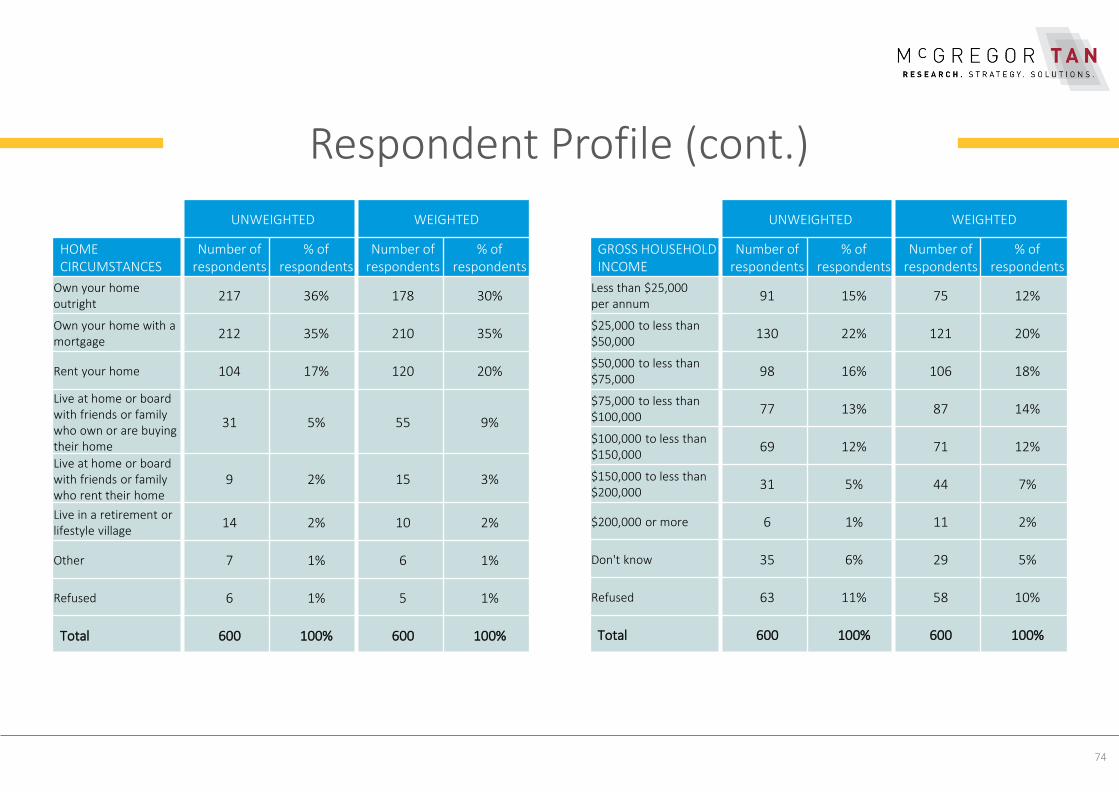
Respondent Profile (cont.)
74
UNWEIGHTED WEIGHTED
HOME CIRCUMSTANCES
Number of respondents
% of respondents
Number of respondents
% of respondents
Own your home outright
217 36% 178 30%
Own your home with a mortgage
212 35% 210 35%
Rent your home 104 17% 120 20%
Live at home or board with friends or family who own or are buying their home
31 5% 55 9%
Live at home or board with friends or family who rent their home
9 2% 15 3%
Live in a retirement or lifestyle village
14 2% 10 2%
Other 7 1% 6 1%
Refused 6 1% 5 1%
Total 600 100% 600 100%
UNWEIGHTED WEIGHTED
GROSS HOUSEHOLD INCOME
Number of respondents
% of respondents
Number of respondents
% of respondents
Less than $25,000 per annum
91 15% 75 12%
$25,000 to less than $50,000
130 22% 121 20%
$50,000 to less than $75,000
98 16% 106 18%
$75,000 to less than $100,000
77 13% 87 14%
$100,000 to less than $150,000
69 12% 71 12%
$150,000 to less than $200,000
31 5% 44 7%
$200,000 or more 6 1% 11 2%
Don't know 35 6% 29 5%
Refused 63 11% 58 10%
Total 600 100% 600 100%
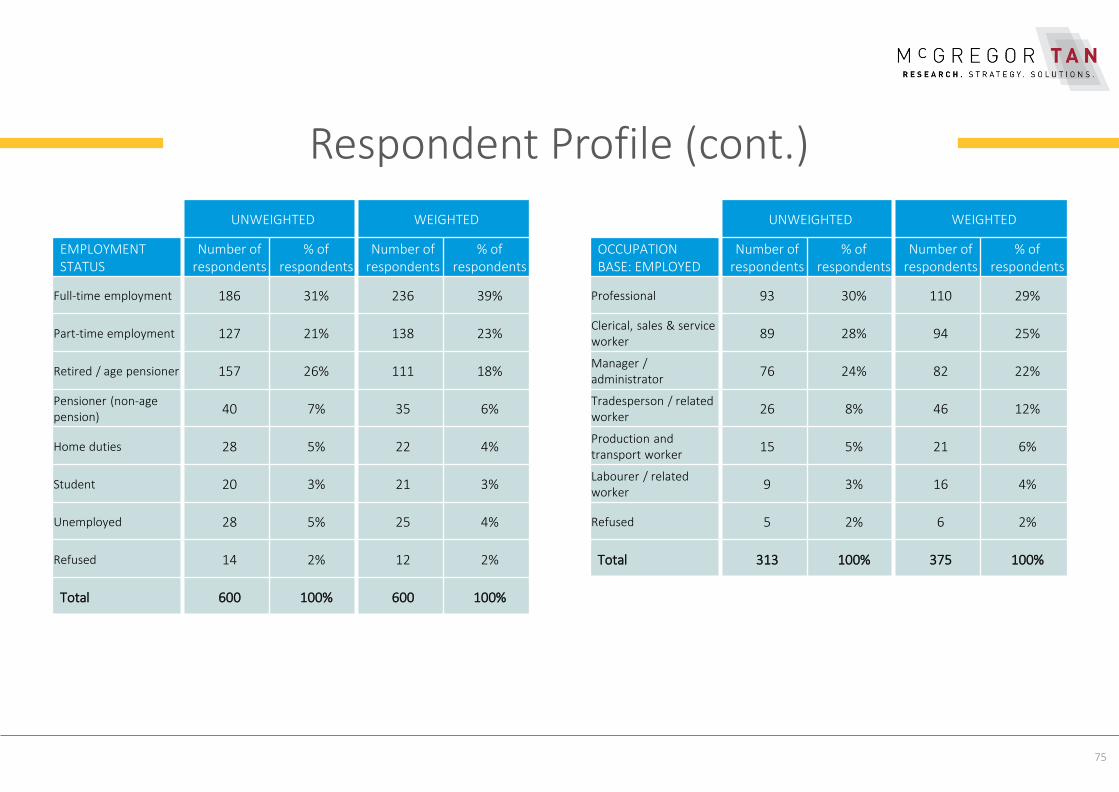
Respondent Profile (cont.)
75
UNWEIGHTED WEIGHTED
EMPLOYMENT STATUS
Number of respondents
% of respondents
Number of respondents
% of respondents
Full-time employment 186 31% 236 39%
Part-time employment 127 21% 138 23%
Retired / age pensioner 157 26% 111 18%
Pensioner (non-age pension)
40 7% 35 6%
Home duties 28 5% 22 4%
Student 20 3% 21 3%
Unemployed 28 5% 25 4%
Refused 14 2% 12 2%
Total 600 100% 600 100%
UNWEIGHTED WEIGHTED
OCCUPATIONBASE: EMPLOYED
Number of respondents
% of respondents
Number of respondents
% of respondents
Professional 93 30% 110 29%
Clerical, sales & service worker
89 28% 94 25%
Manager / administrator
76 24% 82 22%
Tradesperson / related worker
26 8% 46 12%
Production and transport worker
15 5% 21 6%
Labourer / related worker
9 3% 16 4%
Refused 5 2% 6 2%
Total 313 100% 375 100%

Respondent Profile (cont.)
76
UNWEIGHTED WEIGHTED
EDUCATIONNumber of
respondents% of
respondentsNumber of
respondents% of
respondents
Still at school 7 1% 7 1%
Left school aged 15 years or less
54 9% 39 7%
Left school after age 15 128 21% 118 20%
Left school after age 15 but still studying
10 2% 8 1%
Trade/ Apprenticeship 54 9% 58 10%
Certificate/ Diploma 207 35% 210 35%
Bachelor degree or higher
127 21% 148 25%
Refused 13 2% 12 2%
Total 600 100% 600 100%
UNWEIGHTED WEIGHTED
COUNTRY OF BIRTHNumber of
respondents% of
respondentsNumber of
respondents% of
respondents
Australia 464 77% 472 79%
Overseas 136 23% 128 21%
Total 600 100% 600 100%
TYPE OF SURVEYNumber of
respondents% of
respondentsNumber of
respondents% of
respondents
Online 318 53% 347 58%
CATI 282 47% 253 42%
Total 600 100% 600 100%
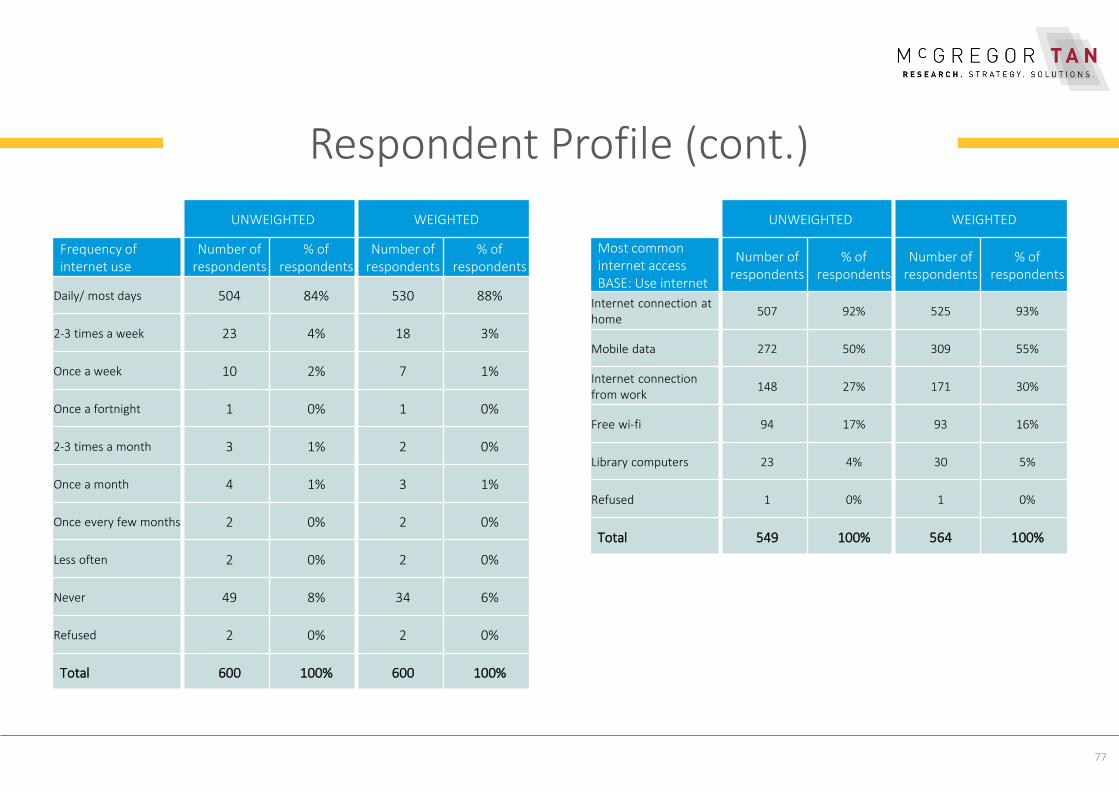
Respondent Profile (cont.)
77
UNWEIGHTED WEIGHTED
Frequency of internet use
Number of respondents
% of respondents
Number of respondents
% of respondents
Daily/ most days 504 84% 530 88%
2-3 times a week 23 4% 18 3%
Once a week 10 2% 7 1%
Once a fortnight 1 0% 1 0%
2-3 times a month 3 1% 2 0%
Once a month 4 1% 3 1%
Once every few months 2 0% 2 0%
Less often 2 0% 2 0%
Never 49 8% 34 6%
Refused 2 0% 2 0%
Total 600 100% 600 100%
UNWEIGHTED WEIGHTED
Most common internet accessBASE: Use internet
Number of respondents
% of respondents
Number of respondents
% of respondents
Internet connection at home
507 92% 525 93%
Mobile data 272 50% 309 55%
Internet connection from work
148 27% 171 30%
Free wi-fi 94 17% 93 16%
Library computers 23 4% 30 5%
Refused 1 0% 1 0%
Total 549 100% 564 100%
APPENDIX 2:MULTIPLE
REGRESSIONTABLES

79
Multiple r = .7139 F Ratio = 48.580
r Square = .5096 Probability = .001
Standard = 1.5180 Cases = 192
19. Thinking about the quality of life where you live, on a scale of 0 to 10, where 0 is extremely dissatisfied and 10 is extremely satisfied, please rate your level of satisfaction or dissatisfaction with the following…
Stepwise Multiple Regression
Dependent Variable: OVERALL SATISFACTION WITH QUALITY OF LIFE
Final Equation
Independent Variable Coeff. Beta F Ratio Prob.
Access to parks and reserves .1786 .1849 8.602 .004
Development of job opportunities in the Salisbury area .1560 .1836 9.378 .003
Having a diverse community .2218 .2484 10.997 .001
Having a sense of community .2242 .2715 13.368 .001
Constant 1.6031
18. Overall, how satisfied are you with the quality of life in the Salisbury Council area? Using the same 0-10 scale, with 0 being extremely dissatisfied, and 10 being extremely satisfied.19. Thinking about the quality of life where you live, on a scale of 0 to 10, where 0 is extremely dissatisfied and 10 is extremely satisfied, please rate your level of satisfaction or dissatisfaction with the following… Read outBoth Base: All respondents (n=600)
Multiple Regression Key Drivers of Satisfaction for Quality of Life
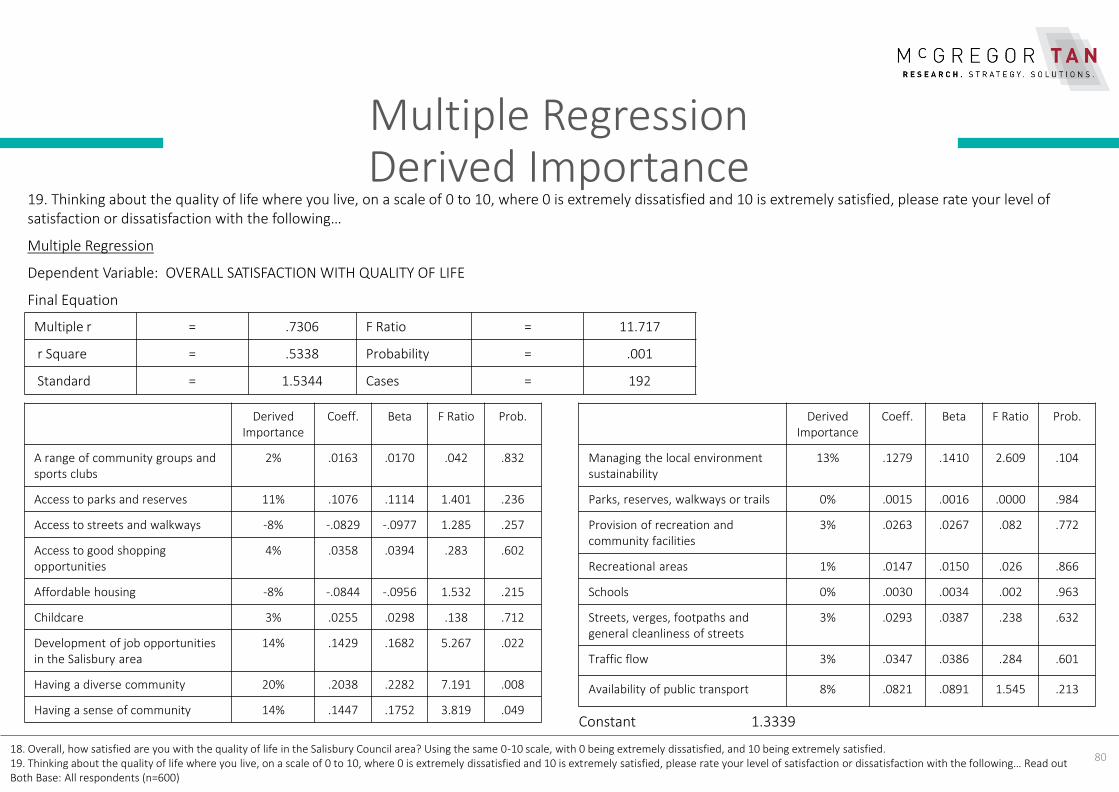
80
Multiple RegressionDerived Importance
Multiple r = .7306 F Ratio = 11.717
r Square = .5338 Probability = .001
Standard = 1.5344 Cases = 192
Derived Importance
Coeff. Beta F Ratio Prob.
A range of community groups and sports clubs
2% .0163 .0170 .042 .832
Access to parks and reserves 11% .1076 .1114 1.401 .236
Access to streets and walkways -8% -.0829 -.0977 1.285 .257
Access to good shopping opportunities
4% .0358 .0394 .283 .602
Affordable housing -8% -.0844 -.0956 1.532 .215
Childcare 3% .0255 .0298 .138 .712
Development of job opportunities in the Salisbury area
14% .1429 .1682 5.267 .022
Having a diverse community 20% .2038 .2282 7.191 .008
Having a sense of community 14% .1447 .1752 3.819 .049Constant 1.3339
18. Overall, how satisfied are you with the quality of life in the Salisbury Council area? Using the same 0-10 scale, with 0 being extremely dissatisfied, and 10 being extremely satisfied.19. Thinking about the quality of life where you live, on a scale of 0 to 10, where 0 is extremely dissatisfied and 10 is extremely satisfied, please rate your level of satisfaction or dissatisfaction with the following… Read outBoth Base: All respondents (n=600)
19. Thinking about the quality of life where you live, on a scale of 0 to 10, where 0 is extremely dissatisfied and 10 is extremely satisfied, please rate your level of satisfaction or dissatisfaction with the following…
Multiple Regression
Dependent Variable: OVERALL SATISFACTION WITH QUALITY OF LIFE
Final Equation
Derived Importance
Coeff. Beta F Ratio Prob.
Managing the local environment sustainability
13% .1279 .1410 2.609 .104
Parks, reserves, walkways or trails 0% .0015 .0016 .0000 .984
Provision of recreation and community facilities
3% .0263 .0267 .082 .772
Recreational areas 1% .0147 .0150 .026 .866
Schools 0% .0030 .0034 .002 .963
Streets, verges, footpaths and general cleanliness of streets
3% .0293 .0387 .238 .632
Traffic flow 3% .0347 .0386 .284 .601
Availability of public transport 8% .0821 .0891 1.545 .213
APPENDIX 3:GUIDE TO
READING THE REPORT

The core report is typically analysed in order of the questions asked in the survey. Relevant statistically significant findings as well as other observations of interest are analysed in this report.
Please note that, because of rounding, answers in single response questions will not always sum precisely to 100%.
In addition, as the base for percentages is the number of respondents answering a particular question (rather than the number ofresponses) multiple response questions sum to more than 100%.
The use of arrows may have been used in this report to show movement between surveys.
The current year % is up from the previous survey
The current year % is down from the previous survey
The current year % is the same as the previous survey
Survey, participants may have been to rate a variety of aspects on a 1 to 10 scale for importance, satisfaction or agreement. 1 being the lowest rating and 10 being the highest rating possible.
Typically in studies of this nature, an average rating of:
• 9.0 or above represents an extremely high level of importance, satisfaction or agreement
• 7.0 to 8.9 a high level
• 5.0 to 6.9 a moderate level
• between 3.0 and 4.9 a mixed rating and
• 2.9 and below a low level of importance, satisfaction or agreement
82
Guide to Reading the Report
Disclaimer StatementThe material in this report is assembled in good faith and is based on the perceptions of respondents who may have been surveyed. It is made available on the understanding that any views, suggestions or recommendations expressed in this report does not constitute professional advice, and McGregor Tan Research accepts no liability for its use.
RATING LEVEL: Extremely High: 9.0 and above High: 7.0 – 8.9 Moderate: 5.0 – 6.9 Mixed: 3.0 – 4.9 Low: 2.9 and below
APPENDIX 4:SAMPLING TOLERANCE

It should be borne in mind throughout this report that all data based on sample surveys are subject to a sampling tolerance.
That is, where a sample is used to represent an entire population, the resulting figures should not be regarded as absolute values, but rather as the mid-point of a range plus or minus x% (see sampling tolerance table).
Only variations clearly designated as significantly different are statistically valid differences and these are clearly pointed out in the report.
Other divergences are within the normal range of fluctuation at a 95% confidence level; they should be viewed with some caution and not treated as statistically reliable changes.
84
Sampling ToleranceMARGIN OF ERROR TABLE
(95% confidence level)
SAMPLE Percentages giving a particular answer
SIZE 5% 10% 15% 20% 25% 30% 35% 40% 45% 50%
95% 90% 85% 80% 75% 70% 65% 60% 55% 50%
50 6 9 10 11 12 13 14 14 14 14
100 4 6 7 8 9 9 10 10 10 10
150 4 5 6 7 7 8 8 8 8 8
200 3 4 5 6 6 6 7 7 7 7
250 3 4 5 5 6 6 6 6 6 6
300 3 4 4 5 5 5 6 6 6 6
400 2 3 4 4 4 5 5 5 5 5
500 2 3 3 4 4 4 4 4 4 5
600 2 2 3 3 4 4 4 4 4 4
700 2 2 3 3 3 4 4 4 4 4
800 2 2 3 3 3 3 3 4 4 4
900 2 2 2 3 3 3 3 3 3 3
1000 1 2 2 3 3 3 3 3 3 3
1500 1 2 3 2 2 2 3 3 3 3
2000 1 1 2 2 2 2 2 2 2 2
3000 1 1 1 2 2 2 2 2 2 2

APPENDIX 5:SURVEY TOOLS
Survey ToolProject No: 11201
City of Salisbury – 2018 Community SurveyCOMMERCIAL IN CONFIDENCE
FINAL
Online introduction:McGregor Tan, as an independent social and market research company, is conducting a survey about living in the City of Salisbury on behalf of Salisbury City Counciland would appreciate your opinion.
All completed surveys go into a draw for a chance to win $200 at the end of the month. You will also be entered into our annual McGregor Tan cash draw of $1,000.
CATI INTRODUCTIONGood afternoon/ evening, my name is … from McGregor Tan. We are conducting a survey about living in the city of Salisbury on behalf of Salisbury City Council.
We are speaking with people aged 15 and over who currently live in the Salisbury Council area.
All completed surveys go into a draw for a chance to win $200 at the end of the month. You will also be entered into our annual McGregor Tan cash draw of $1,000.
We do not sell, promote or endorse any product or service, there are no right or wrong answers, Participation in the survey voluntary. McGregor Tan complies withthe Privacy Act and we can assure you that all information given will remain confidential. Your details will only be used for research purposes and will not be sold to any third party.
Screener 1: Is your household located in the Salisbury Council area?
1. Yes Continue
2. No Terminate
3. Don’t know Terminate
86

Survey Tool (cont.)Screener 2: Does anyone in this household work in market research, or is anyone a staff member or an elected member of Salisbury City Council?
CATI ONLY:
As we are trying to talk to a good cross section of residents, is there anyone living in this household aged under 45?
We do not sell, promote or endorse any product or service, there are no right or wrong answers, Participation in the survey is voluntary. McGregor Tan complieswith the Privacy Act and we can assure you that all information given will remain confidential. Your details will only be used for research purposes and will not be sold to any third party. And before we start, I just need to let you know that this call may be monitored by my supervisor for training and coaching purposes. May we begin? Thank you."
The first few questions are so we can achieve a good demographic spread of respondents within the Council area.
1. What suburb do you live in?
1. Bolivar
2. Brahma Lodge
3. Burton
4. Cavan
5. Direk
6. Dry Creek
7. Edinburgh
8. Elizabeth Vale
Yes Try to arrange a call-back
No Continue
1. Yes Terminate
2. No Continue
87
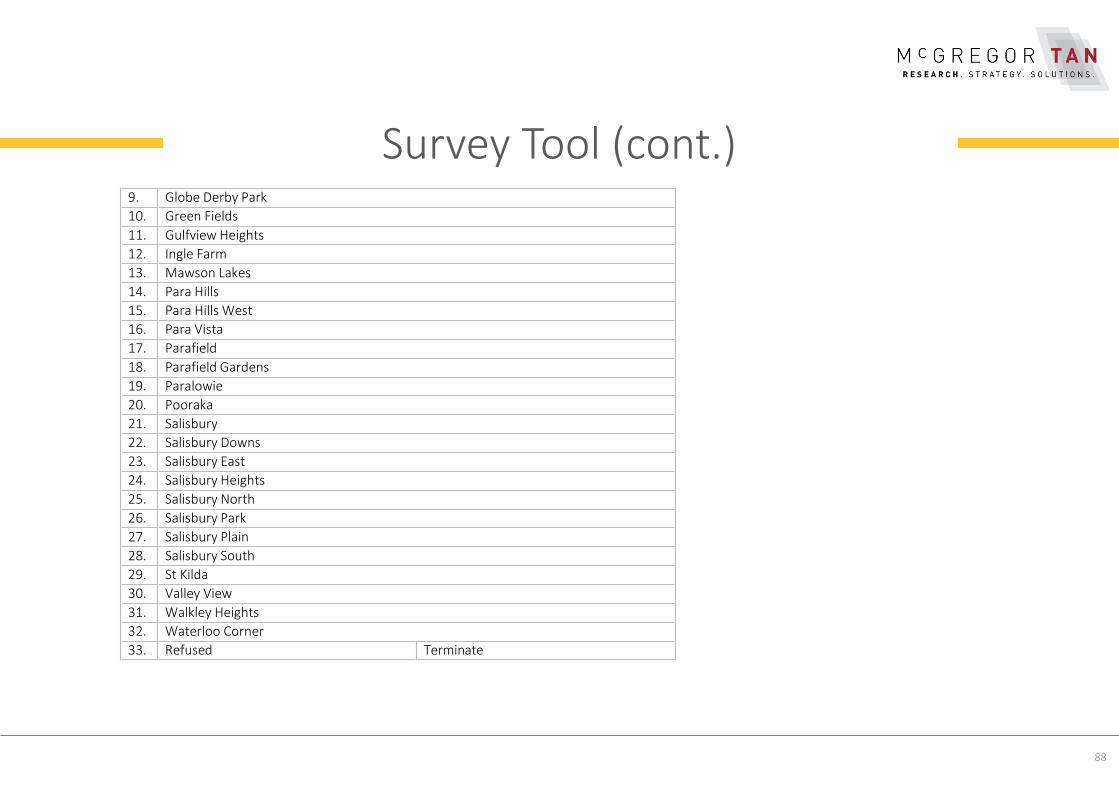
Survey Tool (cont.)9. Globe Derby Park
10. Green Fields
11. Gulfview Heights
12. Ingle Farm
13. Mawson Lakes
14. Para Hills
15. Para Hills West
16. Para Vista
17. Parafield
18. Parafield Gardens
19. Paralowie
20. Pooraka
21. Salisbury
22. Salisbury Downs
23. Salisbury East
24. Salisbury Heights
25. Salisbury North
26. Salisbury Park
27. Salisbury Plain
28. Salisbury South
29. St Kilda
30. Valley View
31. Walkley Heights
32. Waterloo Corner
33. Refused Terminate
88

Survey Tool (cont.)1b. Postcode (autocode)
5093 Para Vista (16)
Valley View (30)
5094 Cavan (4)
Dry Creek (6)
5095 Mawson Lakes (13)
Pooraka (20)
5096 Gulfview Heights (11)
Para Hills (14)
Para Hills West (15)
5098 Ingle Farm (12)
Walkley Heights (31)
5106 Parafield (17)
Salisbury South (28)
5107 Green Fields (10)
Parafield Gardens (18)
5108 Paralowie (19)
Salisbury (21)
Salisbury Downs (22)
Salisbury North (25)
5109 Brahma Lodge (2)
Salisbury East (23)
Salisbury Heights (24)
Salisbury Park (26)
Salisbury Plain (27)
5110 Bolivar (1)
Burton (3)
89
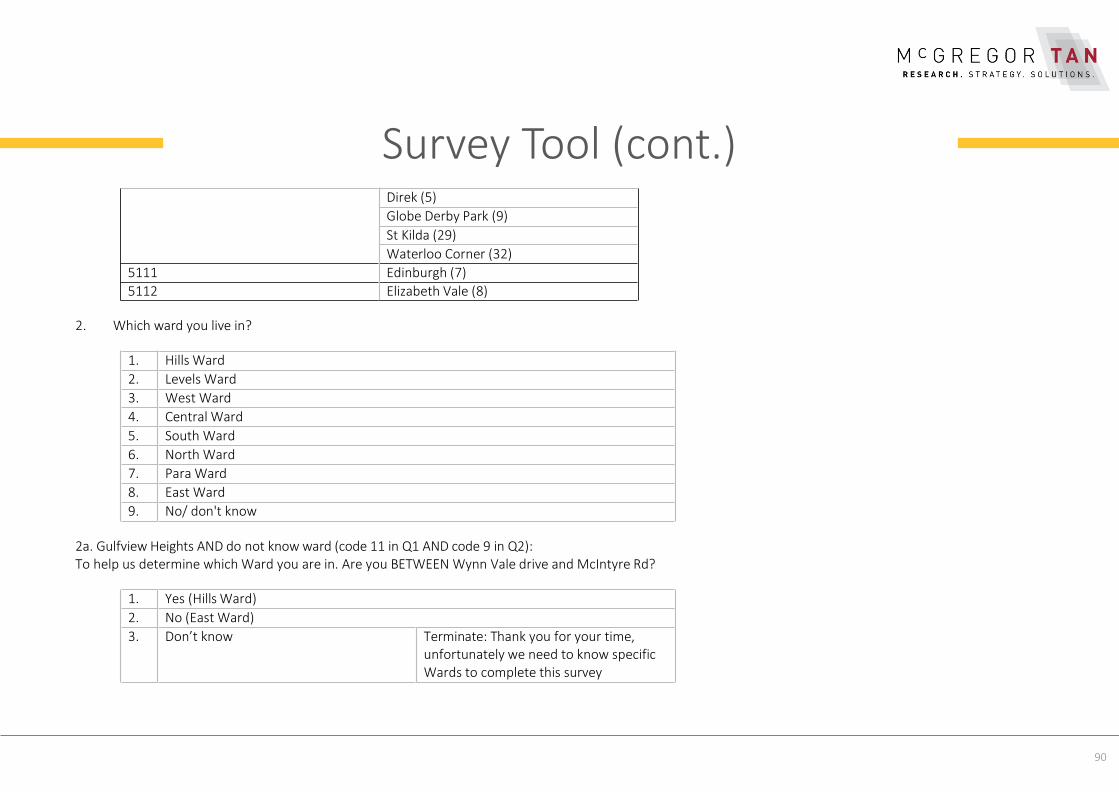
Survey Tool (cont.)
2. Which ward you live in?
2a. Gulfview Heights AND do not know ward (code 11 in Q1 AND code 9 in Q2):To help us determine which Ward you are in. Are you BETWEEN Wynn Vale drive and McIntyre Rd?
1. Yes (Hills Ward)
2. No (East Ward)
3. Don’t know Terminate: Thank you for your time, unfortunately we need to know specific Wards to complete this survey
1. Hills Ward
2. Levels Ward
3. West Ward
4. Central Ward
5. South Ward
6. North Ward
7. Para Ward
8. East Ward
9. No/ don't know
Direk (5)
Globe Derby Park (9)
St Kilda (29)
Waterloo Corner (32)
5111 Edinburgh (7)
5112 Elizabeth Vale (8)
90
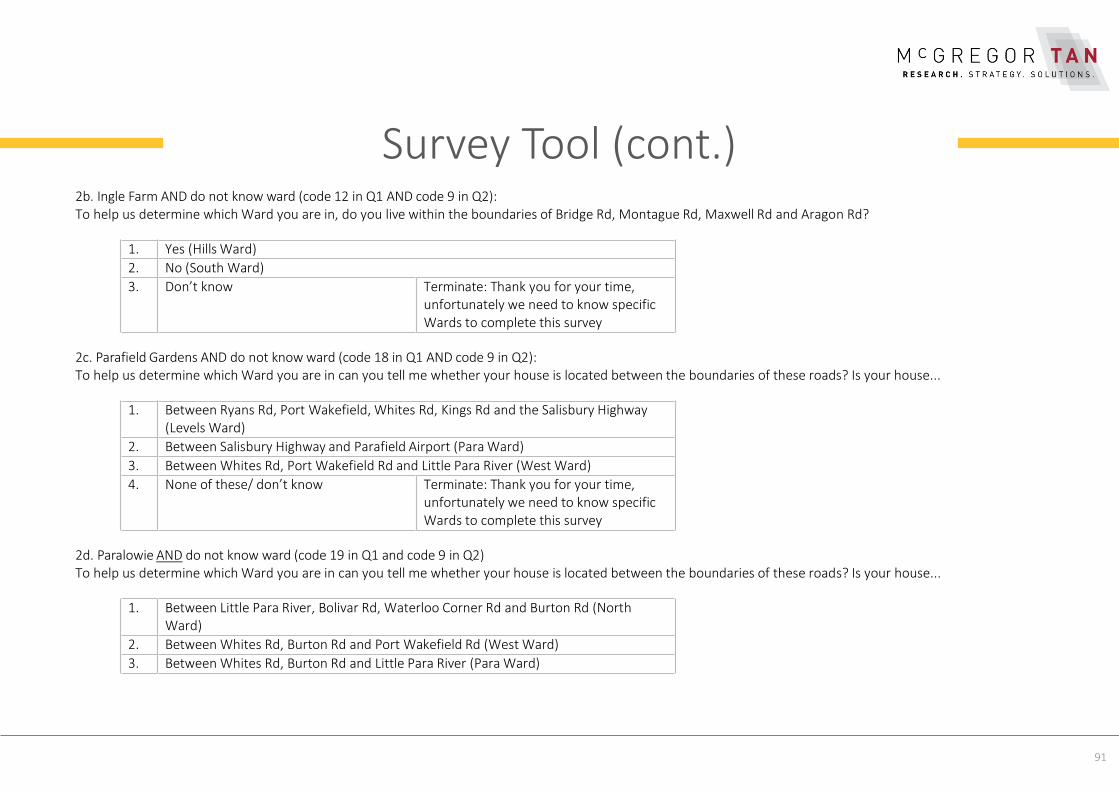
Survey Tool (cont.)2b. Ingle Farm AND do not know ward (code 12 in Q1 AND code 9 in Q2):To help us determine which Ward you are in, do you live within the boundaries of Bridge Rd, Montague Rd, Maxwell Rd and Aragon Rd?
2c. Parafield Gardens AND do not know ward (code 18 in Q1 AND code 9 in Q2):To help us determine which Ward you are in can you tell me whether your house is located between the boundaries of these roads? Is your house...
2d. Paralowie AND do not know ward (code 19 in Q1 and code 9 in Q2)To help us determine which Ward you are in can you tell me whether your house is located between the boundaries of these roads? Is your house...
1. Between Little Para River, Bolivar Rd, Waterloo Corner Rd and Burton Rd (NorthWard)
2. Between Whites Rd, Burton Rd and Port Wakefield Rd (West Ward)
3. Between Whites Rd, Burton Rd and Little Para River (Para Ward)
1. Between Ryans Rd, Port Wakefield, Whites Rd, Kings Rd and the Salisbury Highway(Levels Ward)
2. Between Salisbury Highway and Parafield Airport (Para Ward)
3. Between Whites Rd, Port Wakefield Rd and Little Para River (West Ward)
4. None of these/ don’t know Terminate: Thank you for your time, unfortunately we need to know specific Wards to complete this survey
1. Yes (Hills Ward)
2. No (South Ward)
3. Don’t know Terminate: Thank you for your time, unfortunately we need to know specific Wards to complete this survey
91
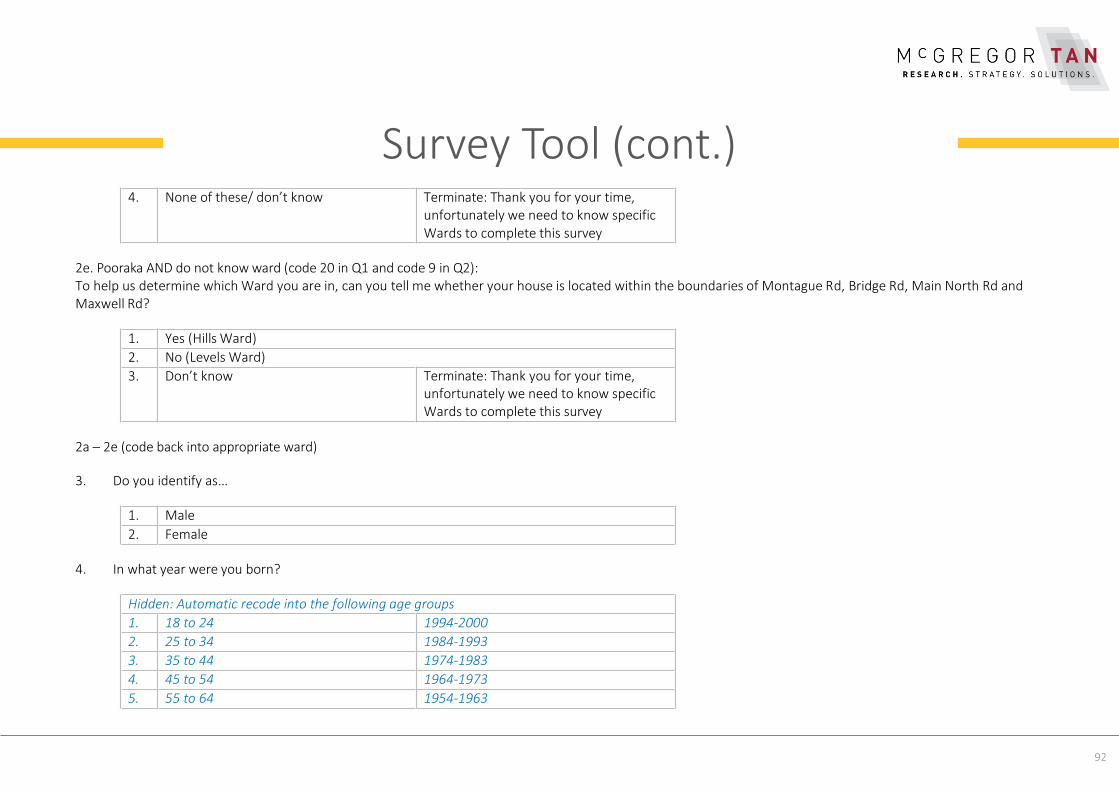
Survey Tool (cont.)
2e. Pooraka AND do not know ward (code 20 in Q1 and code 9 in Q2):To help us determine which Ward you are in, can you tell me whether your house is located within the boundaries of Montague Rd, Bridge Rd, Main North Rd andMaxwell Rd?
2a – 2e (code back into appropriate ward)
3. Do you identify as…
4. In what year were you born?
Hidden: Automatic recode into the following age groups
1. 18 to 24 1994-2000
2. 25 to 34 1984-1993
3. 35 to 44 1974-1983
4. 45 to 54 1964-1973
5. 55 to 64 1954-1963
1. Male
2. Female
1. Yes (Hills Ward)
2. No (Levels Ward)
3. Don’t know Terminate: Thank you for your time, unfortunately we need to know specific Wards to complete this survey
4. None of these/ don’t know Terminate: Thank you for your time, unfortunately we need to know specific Wards to complete this survey
92
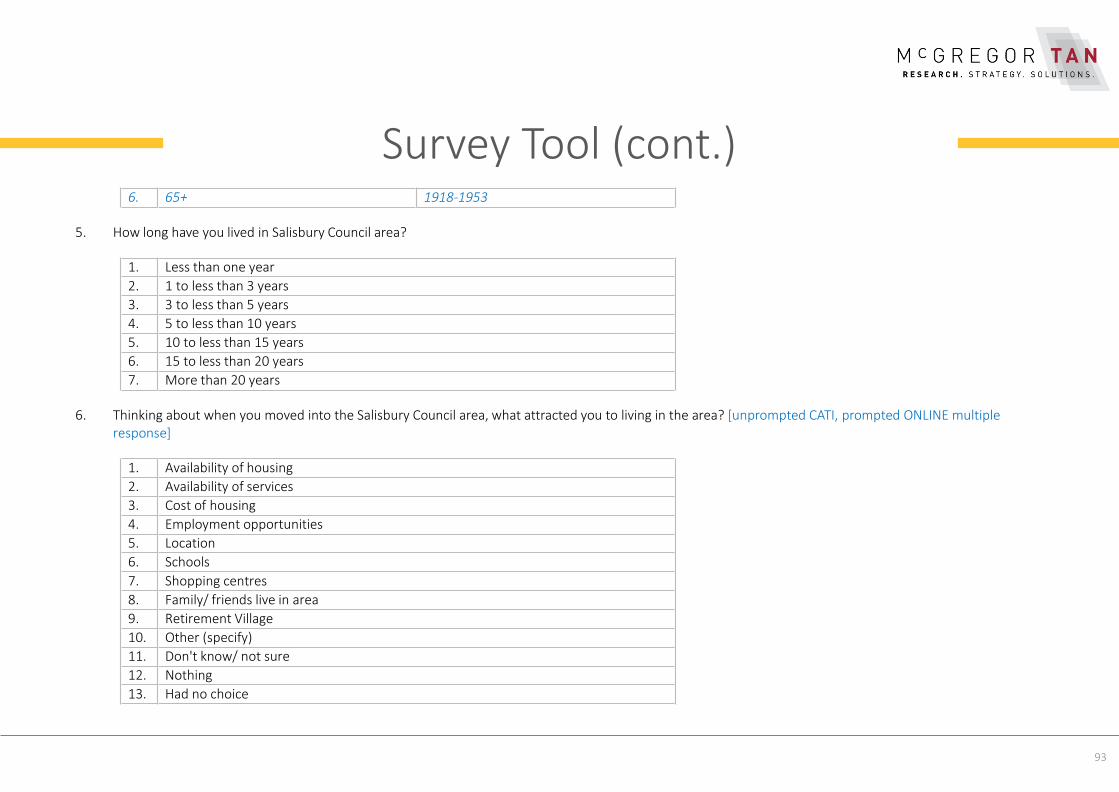
Survey Tool (cont.)
5. How long have you lived in Salisbury Council area?
6. Thinking about when you moved into the Salisbury Council area, what attracted you to living in the area? [unprompted CATI, prompted ONLINE multipleresponse]
1. Availability of housing
2. Availability of services
3. Cost of housing
4. Employment opportunities
5. Location
6. Schools
7. Shopping centres
8. Family/ friends live in area
9. Retirement Village
10. Other (specify)
11. Don't know/ not sure
12. Nothing
13. Had no choice
1. Less than one year
2. 1 to less than 3 years
3. 3 to less than 5 years
4. 5 to less than 10 years
5. 10 to less than 15 years
6. 15 to less than 20 years
7. More than 20 years
6. 65+ 1918-1953
93
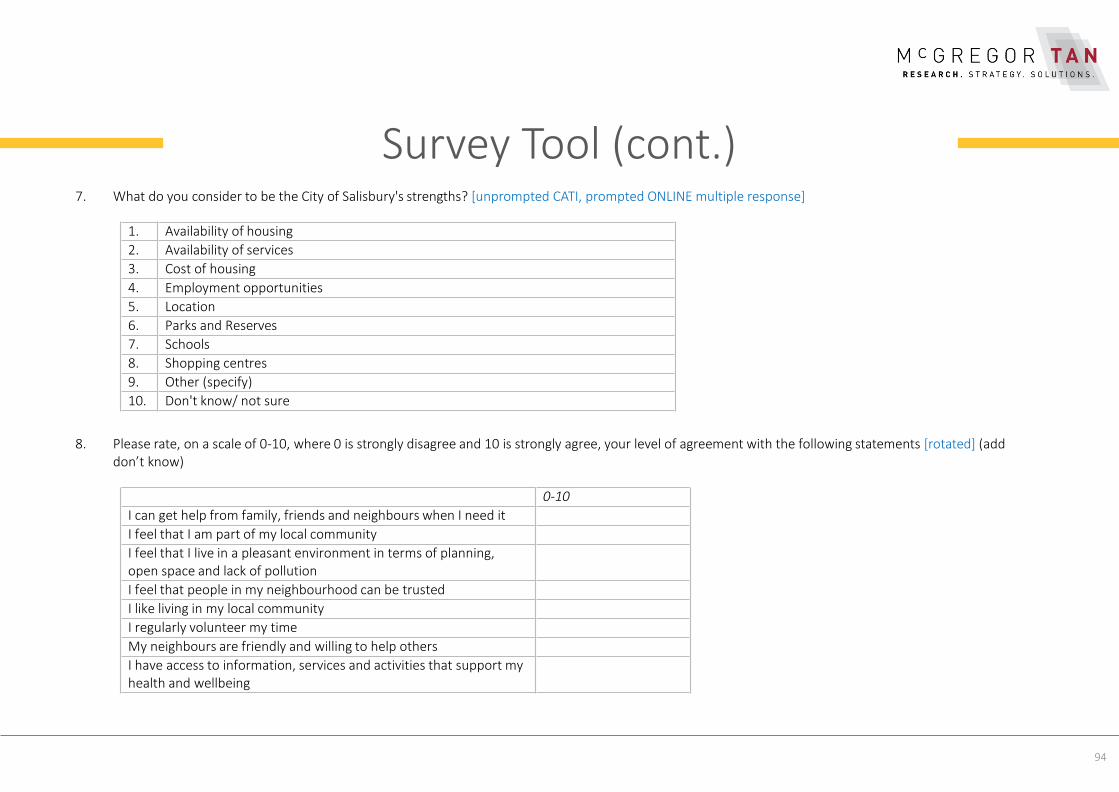
Survey Tool (cont.)7. What do you consider to be the City of Salisbury's strengths? [unprompted CATI, prompted ONLINE multiple response]
8. Please rate, on a scale of 0-10, where 0 is strongly disagree and 10 is strongly agree, your level of agreement with the following statements [rotated] (adddon’t know)
0-10
I can get help from family, friends and neighbours when I need it
I feel that I am part of my local community
I feel that I live in a pleasant environment in terms of planning, open space and lack of pollution
I feel that people in my neighbourhood can be trusted
I like living in my local community
I regularly volunteer my time
My neighbours are friendly and willing to help others
I have access to information, services and activities that support my health and wellbeing
1. Availability of housing
2. Availability of services
3. Cost of housing
4. Employment opportunities
5. Location
6. Parks and Reserves
7. Schools
8. Shopping centres
9. Other (specify)
10. Don't know/ not sure
94
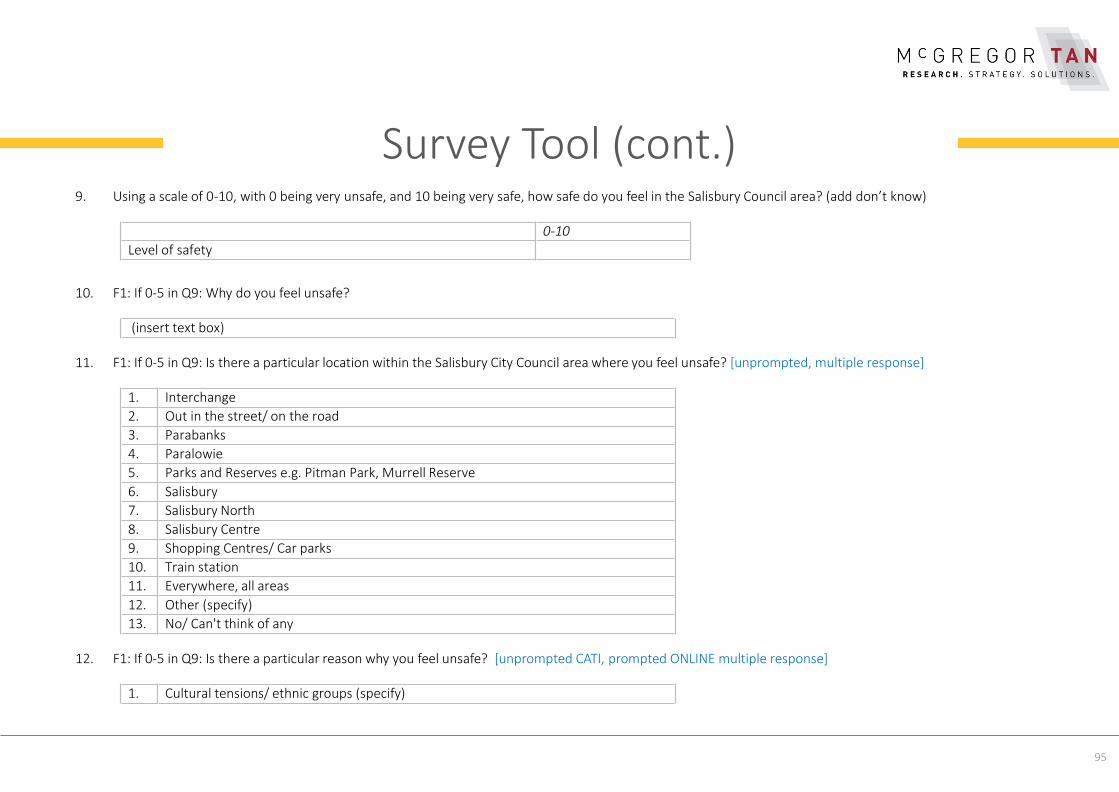
Survey Tool (cont.)9. Using a scale of 0-10, with 0 being very unsafe, and 10 being very safe, how safe do you feel in the Salisbury Council area? (add don’t know)
10. F1: If 0-5 in Q9: Why do you feel unsafe?
11. F1: If 0-5 in Q9: Is there a particular location within the Salisbury City Council area where you feel unsafe? [unprompted, multiple response]
12. F1: If 0-5 in Q9: Is there a particular reason why you feel unsafe? [unprompted CATI, prompted ONLINE multiple response]
1. Cultural tensions/ ethnic groups (specify)
1. Interchange
2. Out in the street/ on the road
3. Parabanks
4. Paralowie
5. Parks and Reserves e.g. Pitman Park, Murrell Reserve
6. Salisbury
7. Salisbury North
8. Salisbury Centre
9. Shopping Centres/ Car parks
10. Train station
11. Everywhere, all areas
12. Other (specify)
13. No/ Can't think of any
(insert text box)
0-10
Level of safety
95
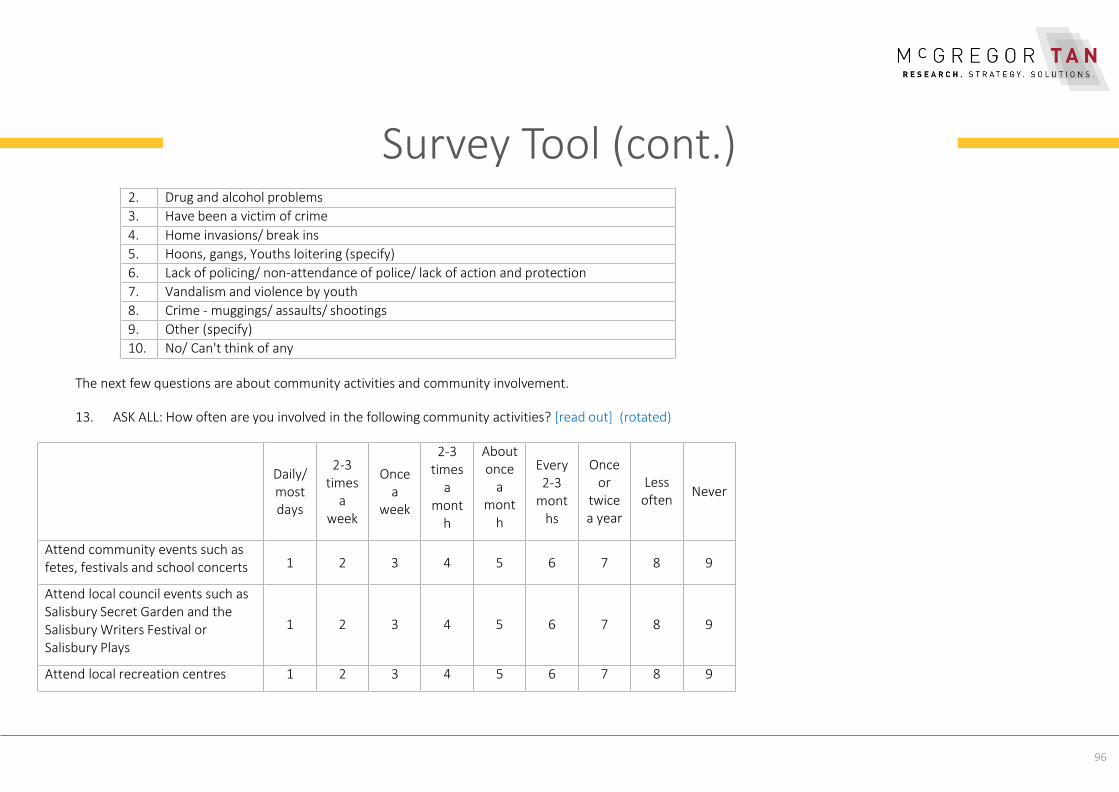
Survey Tool (cont.)
The next few questions are about community activities and community involvement.
13. ASK ALL: How often are you involved in the following community activities? [read out] (rotated)
Daily/ most days
2-3 times
a week
Once a
week
2-3 times
a mont
h
About once
amont
h
Every2-3
mont hs
Once or
twicea year
Less often
Never
Attend community events such as fetes, festivals and school concerts 1 2 3 4 5 6 7 8 9
Attend local council events such as Salisbury Secret Garden and the Salisbury Writers Festival or Salisbury Plays
1 2 3 4 5 6 7 8 9
Attend local recreation centres 1 2 3 4 5 6 7 8 9
2. Drug and alcohol problems
3. Have been a victim of crime
4. Home invasions/ break ins
5. Hoons, gangs, Youths loitering (specify)
6. Lack of policing/ non-attendance of police/ lack of action and protection
7. Vandalism and violence by youth
8. Crime - muggings/ assaults/ shootings
9. Other (specify)
10. No/ Can't think of any
96
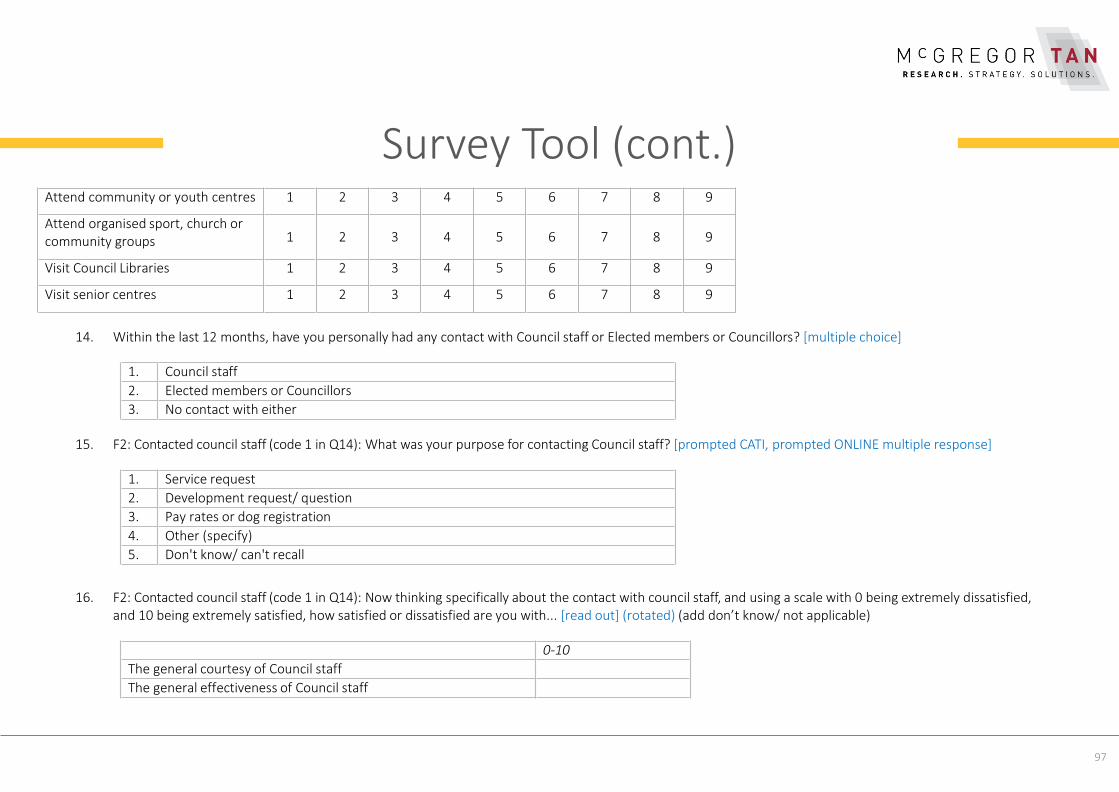
Survey Tool (cont.)
14. Within the last 12 months, have you personally had any contact with Council staff or Elected members or Councillors? [multiple choice]
15. F2: Contacted council staff (code 1 in Q14): What was your purpose for contacting Council staff? [prompted CATI, prompted ONLINE multiple response]
16. F2: Contacted council staff (code 1 in Q14): Now thinking specifically about the contact with council staff, and using a scale with 0 being extremely dissatisfied,and 10 being extremely satisfied, how satisfied or dissatisfied are you with... [read out] (rotated) (add don’t know/ not applicable)
0-10
The general courtesy of Council staff
The general effectiveness of Council staff
1. Service request
2. Development request/ question
3. Pay rates or dog registration
4. Other (specify)
5. Don't know/ can't recall
1. Council staff
2. Elected members or Councillors
3. No contact with either
Attend community or youth centres 1 2 3 4 5 6 7 8 9
Attend organised sport, church or community groups 1 2 3 4 5 6 7 8 9
Visit Council Libraries 1 2 3 4 5 6 7 8 9
Visit senior centres 1 2 3 4 5 6 7 8 9
97
Survey Tool (cont.)
17. F2: Contacted Elected members or Councillors (code 2 in Q14): Now thinking specifically about the contact with Elected Members and Councillors, and using ascale of 0-10, 0 being extremely dissatisfied, and 10 being extremely satisfied, how satisfied or dissatisfied are you with... [read out] (rotated) (add don’tknow/ not applicable)
18. Ask all: Overall, how satisfied are you with the quality of life in the Salisbury Council area? Using the same 0-10 scale, with 0 being extremely dissatisfied, and10 being extremely satisfied. (add don’t know/ not applicable)
19. Thinking about the quality of life where you live, on a scale of 0 to 10, where 0 is extremely dissatisfied and 10 is extremely satisfied, please rate your level ofsatisfaction or dissatisfaction with the following… [read out] (rotated) (add don’t know/ not applicable)
0-10
A range of community groups and sports clubs
Access to parks and reserves
Access to streets and walkways
Access to good shopping opportunities
Affordable housing
0-10
Satisfaction with quality of life
0-10
The general courtesy of Elected members/ Councillors
The general effectiveness of Elected members/ Councillors
Elected members/ Councillors’ responsiveness to complaints
Accessibility and visibility of Elected members/ Councillors
Staffs responsiveness to complaints
98
Survey Tool (cont.)
20. In what ways, if any, do you think the quality of life in the Salisbury Council area could be improved? [unprompted, multiple response]
1. Beautification/ better streetscape/ better tree selections
2. Better communication and consultation/ listen more/ give more info
3. Better parks and reserves
4. Better playgrounds
5. Better public transport
6. Better streets (verges, footpaths and general cleanliness)
7. Cut back overgrown trees
8. Graffiti - faster removal/ better management
9. Hard rubbish collection
10. Housing - improve quality, affordability
11. Improve roadways
12. Improve traffic flow/ congestion
13. Improve/ add bike tracks/ lanes
Childcare
Development of job opportunities in the Salisbury area
Having a diverse community
Having a sense of community
Managing the local environment sustainably
Parks and reserves, walkways or trails
Provision of recreation and community facilities
Recreational areas
Schools
Streets, verges, footpaths and general cleanliness of streets
Traffic flow
Availability of public transport
99

Survey Tool (cont.)
21. I am going to read out a list of services delivered by the City of Salisbury, using a scale of 0-10, 0 being extremely dissatisfied and 10 being extremely satisfied,and I'd like you to say how satisfied or dissatisfied you are in each of the following areas. [read out] (rotated) (add don’t know/ not applicable)
0-10
General rubbish collection and services
Hard waste services
Green waste collection and services
Recycling collection and services
Library services
Community Centres
Recreation Centres
Parks and Reserves maintenance
14. Improve/ add parking
15. Improve/ add sporting facilities
16. Improve/ clean up shopping centres/ buildings/ industrial areas
17. Lighting improvement needed
18. Lower rates
19. More job opportunities
20. More or better range of shopping centres/ shops
21. More services for the elderly/ disabled
22. More things to do - recreation services, youth activities
23. Policing - less crime/ make safer/ control undesirables
24. Provide bins/ clean up rubbish in public areas
25. Other (specify)
26. Don't know
27. OK as is, can't be improved
100
Survey Tool (cont.)
22. Of these services which is the most important to you? [read out, single response] (rotated)
23. Which is the next most important to you, and
24. Which is the third most important to you?
Q22 Most important
Q23 Second important
Q24 Third important
General rubbish collection and services 1 2 3
Hard waste services 1 2 3
Green waste collection and services 1 2 3
Recycling collection and services 1 2 3
Library services 1 2 3
Community Centres 1 2 3
Recreation Centres 1 2 3
Road maintenance
Footpath maintenance
Verge cutting
Services for the aged
Services for the youth
Water recycling
Arts and cultural programs and events
Dog parks
Health services
Services for the disabled
Planning and Building
Economic Development
101
Survey Tool (cont.)
25. Of the following services which do you believe should be a core council service?If no, ask 'Who do you think should be responsible for [pipe in response] delivery?'
Yes No
1. General rubbish collection and services 1 2
2. Hard waste services 1 2
3. Green waste collection and services 1 2
4. Recycling collection and services 1 2
5. Library services 1 2
6. Community Centres 1 2
7. Recreation Centres 1 2
8. Parks and Reserves maintenance 1 2
9. Road maintenance 1 2
10. Footpath maintenance 1 2
Parks and Reserves maintenance 1 2 3
Road maintenance 1 2 3
Footpath maintenance 1 2 3
Verge cutting 1 2 3
Services for the aged 1 2 3
Services for the youth 1 2 3
Water recycling 1 2 3
Arts and cultural programs and events 1 2 3
Dog parks 1 2 3
Health services 1 2 3
Services for the disabled 1 2 3
Planning and Building 1 2 3
Economic Development 1 2 3
102
Survey Tool (cont.)
26. Are there any other services you believe council should deliver that they currently do not?
The next few questions are about the Council's communication with residents.
27. In which ways does council keep you informed about events, services or Council’s key directions in the council area? [prompted CATI, prompted ONLINE,multiple response]
1. At Council events
2. Brochures/ flyers/ other publications
3. Council presentations at schools or public venues/ events
4. Council Website
5. E-mail
6. Facebook
1. Yes (specify)
2. No
3. Don’t know
11. Verge cutting 1 2
12. Services for the aged 1 2
13. Services for the youth 1 2
14. Water recycling 1 2
15. Arts and cultural programs and events 1 2
16. Dog parks 1 2
17. Health services 1 2
18. Services for the disabled 1 2
19. Planning and Building 1 2
20. Economic Development 1 2
103

Survey Tool (cont.)
28. How would you prefer the council to keep you informed about events, services or Council’s key directions in the council area? [read out, multiple response]
1. At Council events
2. Brochures/ flyers/ other publications
3. Council presentations at schools or public venues/ events
4. Council Website
5. E-mail
6. Facebook
7. Twitter
8. Other social media sites
9. Library/ Community Centre/ Recreation Centre
10. Mail/ Letterbox drop
11. Messenger newspaper advertising
12. Salisbury Aware Magazine (distributed 3x/ yr)
13. Adelaide Review advertising
14. Roadside banners
7. Twitter
8. Other social media sites
9. Library/ Community Centre/ Recreation Centre
10. Mail/ Letterbox drop
11. Messenger newspaper advertising
12. Salisbury Aware Magazine (distributed 3x/ yr)
13. Adelaide Review advertising
14. Roadside banners
15. The free City of Salisbury calendar
16. Other (specify)
17. Don't know/ not sure
104
Survey Tool (cont.)
29. How do you prefer to engage with Council?
30. Using a scale of 0-10, with 0 being extremely dissatisfied and 10 being extremely satisfied, how satisfied or dissatisfied are you with the service delivered bySalisbury Council OVERALL. (add don’t know)
31. F4: Dissatisfied (0-5 in Q30): Why are you not satisfied with the service delivered by Salisbury Council? (unprompted, multiple response)
1. Not enough consultation/ information
2. Receive little/ no service from Council
3. Lack of street/ verge maintenance/ cleaning
4. Ignore queries/ requests for maintenance
5. Other reason (specify)
6. Don't know/ not sure
0-10
Overall satisfaction with the service delivered by Salisbury Council
1. In person
2. Over the phone
3. Via the web
4. Via social media
5. Other (specify)
6. Don't know/ not sure
15. The free City of Salisbury calendar
16. Other (specify)
17. Don't know/ not sure
105

Survey Tool (cont.)32. Compared to other areas across Adelaide, how affordable would you say it is to rent or buy housing in the Salisbury Council area? Please use a 0-10 scale
where 0 means it is much less affordable, or more expensive, and 10 means it is much more affordable, or cheaper, than the rest of Adelaide.. (add don’tknow)
33. Using a score of 0 to 10 where 0 is not at all likely 10 is extremely likely, how likely are you to recommend living in the Salisbury Council area to others? (NetPromoter Score)
34. Which of the following best describes your current circumstances. Do you...? [read out 1-6]
35. What is your current employment status? [read out 1-7]
1. Part-time employment
2. Full-time employment
3. Unemployed
4. Home duties
1. Rent your home
2. Own your home outright
3. Own your home with a mortgage
4. Live at home or board with friends or family who rent their home
5. Live at home or board with friends or family who own or are buying their home
6. Live in a retirement or lifestyle village
7. Other
8. Refused
0-10
Affordability to rent or buy
106
Survey Tool (cont.)
36. F5: Employed (codes 1-2 in Q35): How do you describe your occupation?
37. Ask all: Which of the following best describes the highest education level you have completed? [read out 1-7]
1. Still at school
2. Left school aged 15 years or less
3. Left school after age 15
4. Left school after age 15 but still studying
5. Trade/ Apprenticeship
6. Certificate/ Diploma
7. Bachelor degree or higher
8. Refused
1. Manager/ administrator
2. Professional
3. Tradesperson/ related worker
4. Clerical, sales & service worker
5. Production and transport worker
6. Labourer/ related worker
7. Refused
5. Pensioner (non-age pension)
6. Retired/ age pensioner
7. Student
8. Refused
107
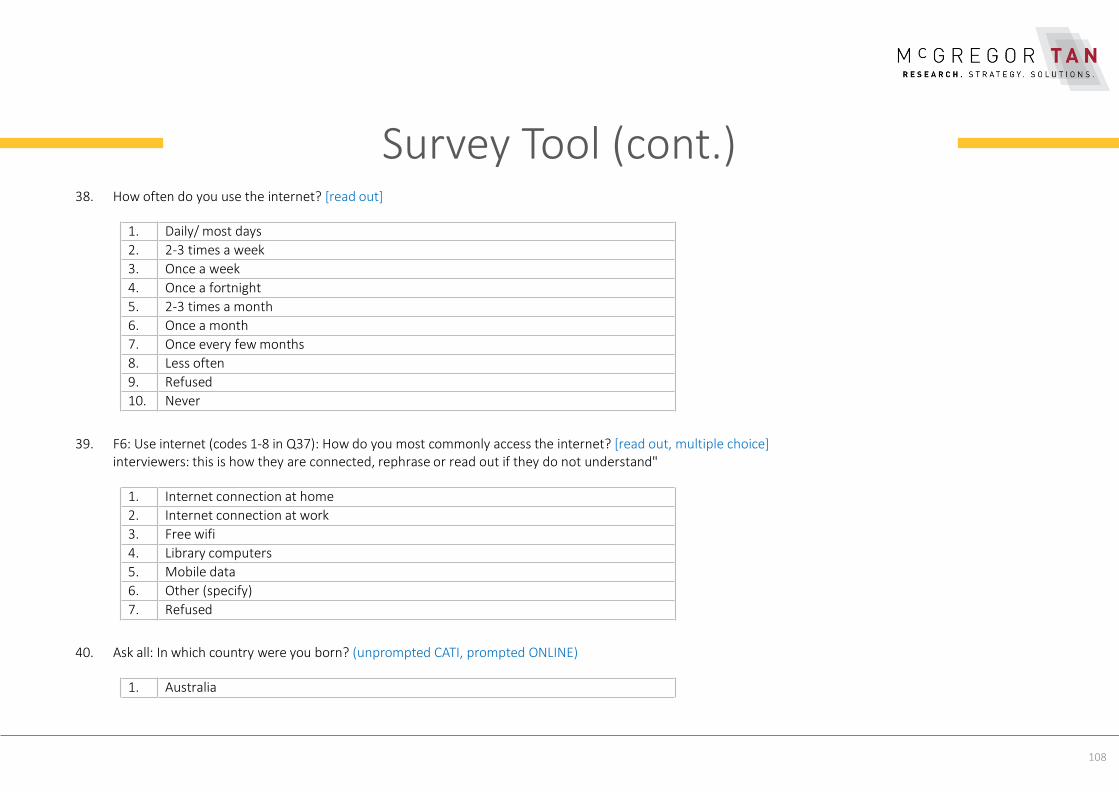
Survey Tool (cont.)38. How often do you use the internet? [read out]
39. F6: Use internet (codes 1-8 in Q37): How do you most commonly access the internet? [read out, multiple choice]interviewers: this is how they are connected, rephrase or read out if they do not understand"
40. Ask all: In which country were you born? (unprompted CATI, prompted ONLINE)
1. Australia
1. Internet connection at home
2. Internet connection at work
3. Free wifi
4. Library computers
5. Mobile data
6. Other (specify)
7. Refused
1. Daily/ most days
2. 2-3 times a week
3. Once a week
4. Once a fortnight
5. 2-3 times a month
6. Once a month
7. Once every few months
8. Less often
9. Refused
10. Never
108
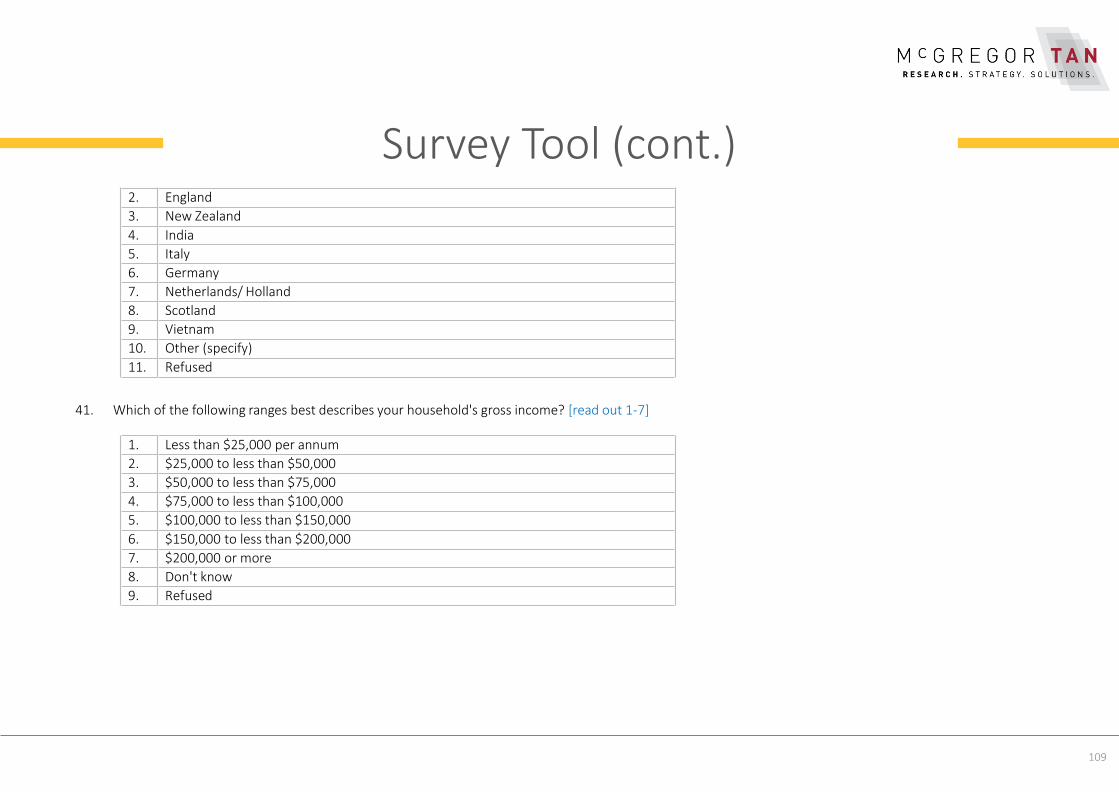
Survey Tool (cont.)
41. Which of the following ranges best describes your household's gross income? [read out 1-7]
1. Less than $25,000 per annum
2. $25,000 to less than $50,000
3. $50,000 to less than $75,000
4. $75,000 to less than $100,000
5. $100,000 to less than $150,000
6. $150,000 to less than $200,000
7. $200,000 or more
8. Don't know
9. Refused
2. England
3. New Zealand
4. India
5. Italy
6. Germany
7. Netherlands/ Holland
8. Scotland
9. Vietnam
10. Other (specify)
11. Refused
109
Survey Tool (cont.)That concludes the survey. On behalf of the City of Salisbury and McGregor Tan, thank you for your time.
ADD PRIZE DRAW
McGregor Tan is accredited to the highest professional industry standards (CIRQ ISO 20252) for the full scope of research and strategy services including customised research for consumer, social and commercial studies, as recognised by the Australian Market and Social Research Society.
110

WEBSITE: www.mcgregortan.com.auEMAIL: [email protected]
HEAD OFFICE:259 Glen Osmond Road, Frewville SA 5063P +61 8 8433 0200F +61 8 8338 2360
DARWIN OFFICE:Paspalis Business CentreLevel 1, 48 – 50 Smith Street MallDarwin NT 0800P +61 8 8981 5750
SYDNEY, MELBOURNE, BRISBANE, PERTH:P 1300 533 362
CONTACT