2015 lawsuit climate survey ranking states 2015 lawsuit climate survey constitutes the tenth...
TRANSCRIPT

SEPTEMBER 2015
Ranking the StatesA Survey of the Fairness and Reasonableness of State Liability Systems
2015 LAWSUIT CLIMATE SURVEY

2 2015 Lawsuit Climate Survey
© U.S. Chamber Institute for Legal Reform, September 2015. All rights reserved.
This publication, or part thereof, may not be reproduced in any form without the written permission of the U.S. Chamber Institute for Legal Reform. Forward requests for permission to reprint to: Reprint Permission Office, U.S. Chamber Institute for Legal Reform, 1615 H Street, N.W., Washington, D.C. 20062-2000 (202.463.5724).
2015 Ranking of State Liability Systems ...................................................... 1
Overall Rankings of State Liability Systems 2008-2015 ..................... 2
Overview ........................................................................................................................... 3Impact of Litigation Environment on Important Business Decisions ........................ 4 Average Percentage Across All Elements Among 50 States ..................................... 6Average Overall Score Among 50 States ........................................................................ 6Most Important Issues for Improving the Litigation Environment .............................. 7Worst Local Jurisdictions ................................................................................................... 7Conclusion ............................................................................................................................. 7Overall Rating of State Court Liability Systems Over Time .......................................... 9
Spotlight ................................................................................................................... 10Most Important Issues for Improving the Litigation Environment ............................ 11Worst Local Jurisdictions ................................................................................................. 12Top Issues Mentioned as Creating the Least Fair and Reasonable Litigation Environment ....................................................................................................... 13Summary of Top/Bottom 5 States by Key Elements ................................................14
Key Elements ............................................................................................................... 16Overall Treatment of Tort and Contract Litigation ........................................................ 17Having and Enforcing Meaningful Venue Requirements ........................................... 18Treatment of Class Action Suits and Mass Consolidation Suits ............................... 19Damages .............................................................................................................................. 20Timeliness of Summary Judgment or Dismissal ......................................................21Discovery........................................................................................................................22Scientific and Technical Evidence .............................................................................23Judges’ Impartiality ......................................................................................................24Judges’ Competence....................................................................................................25Juries’ Fairness .............................................................................................................26
Methodology ..........................................................................................................27
Overall Rankings of State Liability Systems 2002-2015 .................31
Table of Contents
Prepared for the U.S. Chamber Institute for Legal Reform by
Harris Poll

1 2015 Lawsuit Climate Survey: Ranking the States
2015 Ranking of State Liability Systems
1. Delaware
2. Vermont
3. Nebraska
4. Iowa
5. New Hampshire
6. Idaho
7. North Carolina
8. Wyoming
9. South Dakota
10. Utah
1–1011. Virginia
12. Alaska
13. Minnesota
14. Maine
15. North Dakota
16. Colorado
17. Massachusetts
18. Indiana
19. Kansas
20. Wisconsin
11–2021. New York
22. Connecticut
23. Tennessee
24. Michigan
25. Arizona
26. Rhode Island
27. Ohio
28. Maryland
29. Washington
30. Hawaii
21–3031. Georgia
32. Oregon
33. Oklahoma
34. Montana
35. Nevada
36. South Carolina
37. Pennsylvania
38. New Jersey
39. Kentucky
40. Texas
31–4041. Arkansas
42. Missouri
43. Mississippi
44. Florida
45. New Mexico
46. Alabama
47. California
48. Illinois
49. Louisiana
50. West Virginia
41–50

2U.S. Chamber Institute for Legal Reform
Scores displayed in this table have been rounded to one decimal point. However, when developing the ranking, scores were evaluated based on two decimal points. Therefore, states that appear tied based upon the scores in this table were not tied when two decimal points were taken into consideration.
DelawareVermontNebraskaIowaNew HampshireIdahoNorth CarolinaWyomingSouth DakotaUtahVirginiaAlaskaMinnesotaMaineNorth DakotaColoradoMassachusettsIndianaKansasWisconsinNew YorkConnecticutTennesseeMichiganArizonaRhode IslandOhioMarylandWashingtonHawaiiGeorgiaOregonOklahomaMontanaNevadaSouth CarolinaPennsylvaniaNew JerseyKentuckyTexasArkansasMissouriMississippiFloridaNew MexicoAlabamaCaliforniaIllinoisLouisianaWest Virginia
123456789
1011121314151617181920212223242526272829303132333435363738394041424344454647484950
76.573.873.072.270.770.570.269.769.569.068.368.168.068.067.967.867.867.767.666.666.365.965.765.565.464.664.263.963.862.862.461.261.060.560.459.459.459.359.058.557.756.656.356.055.255.149.948.046.546.3
1162
10216
203
1197
134
128
2319145
15182526271731303322292428424537394032383635344841444347464950
12535
161817151076
3311122894
1422232419301338292026352721314328393432403644374842414746454950
1827
162621231256
20113
139
184
1024251922331539323027452814173840433635294134314842374744464950
STATE 2015 RANK SCORE 2012 2010 2008
Overall Rankings of State Liability Systems 2008–2015

3 2015 Lawsuit Climate Survey: Ranking the States
The 2015 Lawsuit Climate Survey: Ranking the States was conducted for the U.S. Chamber Institute for Legal Reform by the Harris Poll to explore how fair and reasonable the states’ tort liability systems are perceived to be by U.S. businesses. The 2015 Lawsuit Climate Survey constitutes the tenth fielding of the survey and builds upon previous studies, the first of which was initiated in 2002.1 Prior to these rankings, information regarding the attitudes of the business community toward the legal systems in each of the states had been largely anecdotal. The 2015 Lawsuit Climate Survey aims to quantify how corporate attorneys, as significant participants in state courts, view the state systems by measuring and synthesizing their perceptions of key elements of each state’s liability system into a 1-50 ranking.
Participants in the survey were comprised of a national sample of 1,203 in-house general counsel, senior litigators or attorneys, and other senior executives at companies with at least $100 million in annual revenues2 who indicated they: (1) are knowledgeable about litigation matters; and (2) have recent litigation experience in each state they evaluate.
It is important to remember that, while courts and localities within a state may vary a great deal in fairness and reasonableness, respondents were asked to evaluate the state as a whole. To explore the nuances within each state would have required extensive questioning about each state and was beyond the scope and purpose of this study. It is possible that some states received low grades due to the negative reputation of one or more of their counties or jurisdictions.
The 2015 survey reveals that the overall average scores of the states are increasing, and senior attorneys see the litigation environment improving generally: half of the respondents (50%) view the fairness and reasonableness of state court liability systems in the United States as excellent or pretty good, up from 49% in 2012 and 44% in 2010. The remaining 50% view the system as only fair or poor, or declined to answer (1%).
Moreover, a state’s litigation environment continues to be important to senior litigators, with three-quarters (75%) of respondents reporting that it is likely to impact important business decisions at their companies, such as where to locate or do business. This is a significant increase from 70% in 2012 and 67% in 2010.
Overview
1. 2012, 2010, 2008, 2007, 2006, 2005, 2004, 2003, and 2002.
2. Smaller companies were not surveyed because they so infrequently have in-house law departments.

4U.S. Chamber Institute for Legal Reform
Results are given for a base of 1,203 general counsel/senior litigators.
*Differences between chart values and nets are due to rounding.
very unlikely8%
32%very likely 44%
somewhatlikelysomewhat
unlikely
16%
Impact of Litigation Environment on Important Business Decisions
How likely would you say it is that the litigation environment in a state could affect an important business decision at your company such as where to locate or do business?
75%*of respondents reported that a state’s
litigation environment is likely to
impact important business decisions.
OVERVIEW

5 2015 Lawsuit Climate Survey: Ranking the States
OVERVIEW
Respondents were asked to give states a grade (A through F) in each of the following areas:
Having and enforcing meaningful venue requirements
Overall treatment of tort and contract litigation
Treatment of class action suits and mass consolidation suits
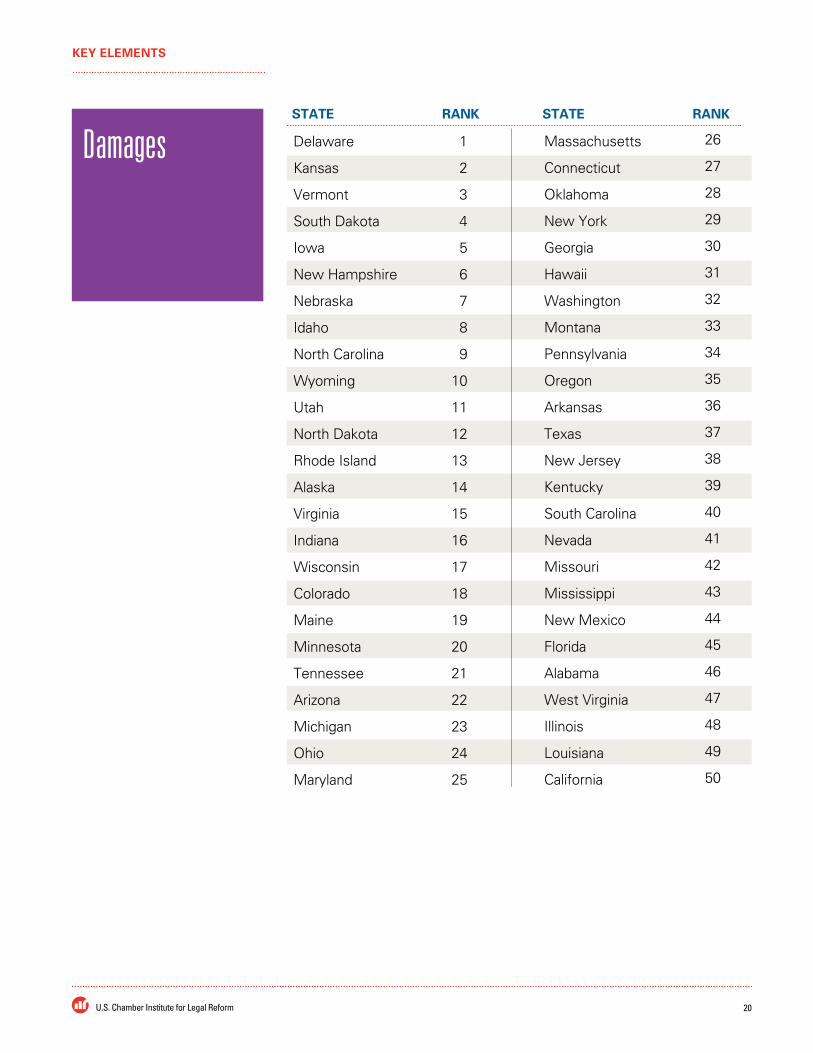
Damages
Timeliness of summary judgment or dismissal
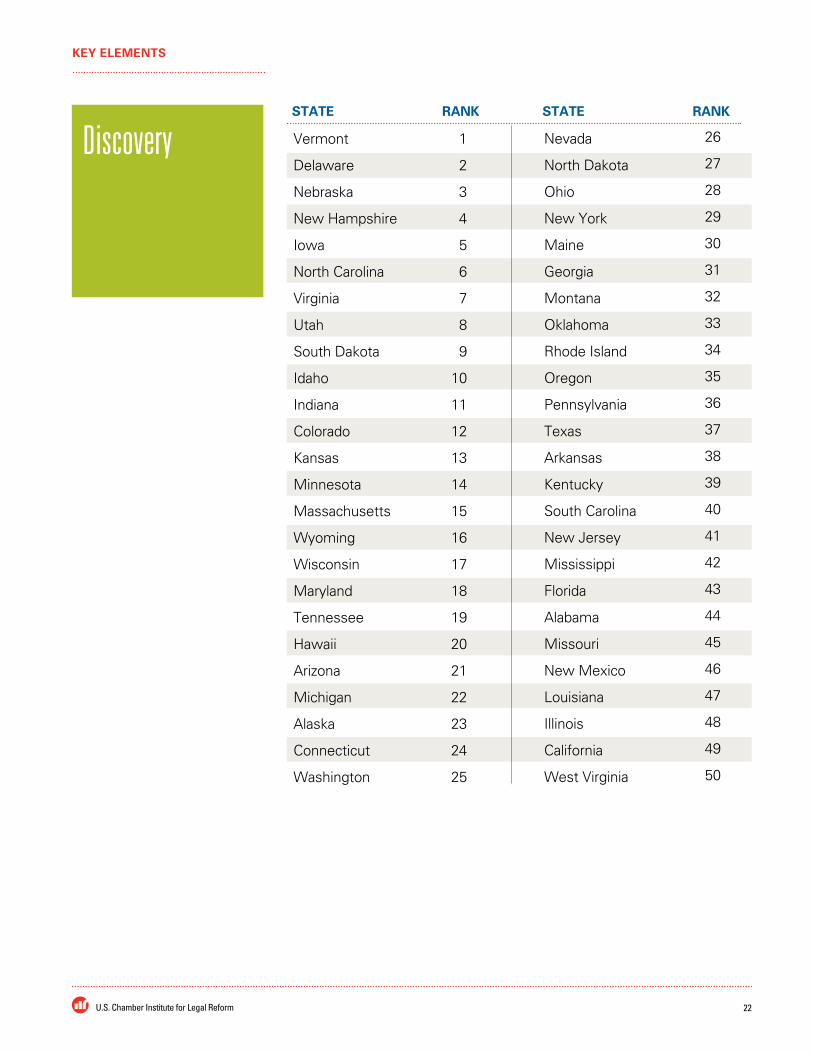
Discovery
Scientific and technical evidence
Judges’ impartiality
Judges’ competence
Juries’ fairness
Respondents were also asked to give the state an overall grade for creating a fair and reasonable litigation environment. These elements were then combined to create an overall ranking of state liability systems.

6U.S. Chamber Institute for Legal Reform
OVERVIEW
Taken as a whole, general counsel and senior litigators perceive state courts to be doing better than average on the various elements. States received significantly more A’s and B’s (52%) than D’s and F’s (16%) when all of the elements were averaged together.
AVERAGE PERCENTAGE ACROSS ALL ELEMENTS AMONG 50 STATES
Grade A
B
C
D
F
Not sure/ Decline to answer
Average Percentage
Since the inception of the survey, there has been a general increase in the overall average score (expressed numerically on a scale of 1 to 100) of state liability systems, and this trend continues with the 2015 survey. The 2015 score has increased by 0.8 percentage points, building on the significant increase made in 2012.
AVERAGE OVERALL SCORE AMONG 50 STATES
Year 2015
2012
2010
2008
2007
2006
2005
2004
2003
2002
Average Overall Score
61.7
60.9
57.9
59.4
58.1
55.3
52.8
53.2
50.7
52.7
14%
38%
27%
11%
5%
5%

7 2015 Lawsuit Climate Survey: Ranking the States
OVERVIEW
Most Important Issues for Improving the Litigation EnvironmentThe study also asked respondents to select the most important issue needed to improve the litigation environment. Eliminating unnecessary lawsuits was mentioned by 32% of the attorneys who completed the survey. Other top issues named were placing reasonable limits on discovery (15%), limiting punitive or other types of damages (11%), and increasing the effectiveness of judicial case management (11%).
Worst Local JurisdictionsIn order to understand if there are any cities or counties that might impact a state’s ranking, the respondents were asked to select cities or counties that have the least fair and reasonable litigation environments. Respondents were provided a list of cities or counties that have a reputation of being problematic when it comes to contract and tort litigation and had the option of inserting a city or county not on the list. The worst jurisdiction was East Texas (26%); followed by Chicago or Cook County, Illinois (20%); Los Angeles, California (16%); Madison County, Illinois (16%); and New Orleans or Orleans Parish, Louisiana (15%).
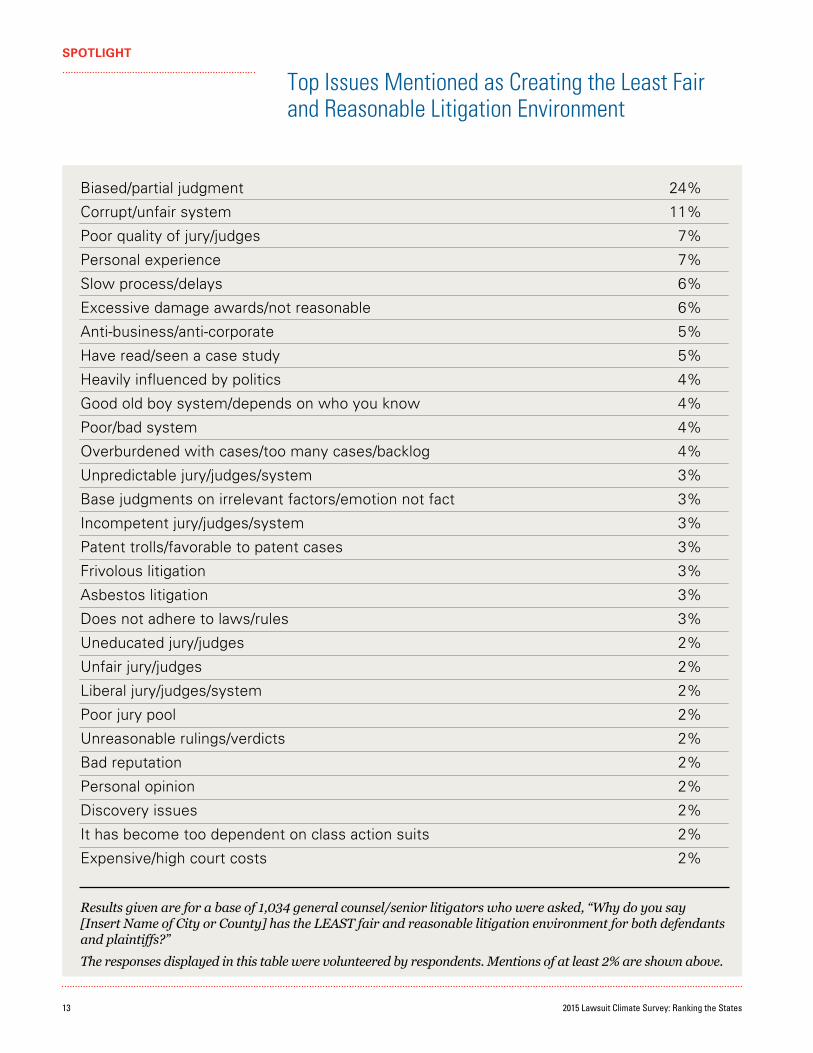
To understand why senior litigators view particular jurisdictions negatively, a follow-up question was asked to those who cited a jurisdiction. A quarter (24%) mentioned that the reason why a city or county has the least fair and reasonable litigation environment is because of biased or partial jury/judges. Similar to 2012, this is the number one reason by a large margin. The next reasons provided include corrupt/unfair system (11%), poor quality of jury/judges (7%), personal experience (7%), a slow process/delays (6%), and excessive damage awards (6%).
ConclusionSeveral organizations and academics3 have conducted and analyzed surveys of attitudes toward the state courts held by various constituencies. The objective of these studies has been to understand how the state courts are perceived, and in some instances to evaluate them, overall or in part. Until the annual State Liability Systems Ranking Study was initiated in 2002, no data existed on how the state courts are perceived by the business community, which is a significant user of, and participant in, the court system. This, the tenth such survey and state ranking, finds that while the overall average scores of the states are increasing, the senior lawyers in large corporations still have mixed perceptions about the fairness and reasonableness of state liability systems overall. They are split: about half believe that the states are doing an excellent or pretty good job with respect to their state liability systems, and the other half believe the states’ systems are only fair or poor. On the various elements, the general counsel and senior litigators give state courts more A’s and B’s than D’s and F’s.
3. Analysis of National Survey of Registered Voters, National Center for State Courts (2014); Citizen Perceptions of Judicial Realism in the American State Courts, Brigham Young University Center for the Study of Elections and Democracy (2014); Public Trust and Confidence Survey, State of Utah Administrative Office of the Courts (2012); The Sources of Public Confidence in State Courts, American Politics Research (2003); Perceptions of the U.S. Justice System, American Bar Association (1999).

8U.S. Chamber Institute for Legal Reform
“ Clearly, corporate counsel see specific areas for improvement in the individual states, and the perceptions of senior lawyers and executives in
large companies matter.”
An examination of individual state evaluations, however, reveals wide disparity among those states that are doing the best job and those states that are doing the worst job, with the highest performing state (Delaware) scoring 77 out of a possible 100, and the poorest performing state (West Virginia) scoring 46 out of 100. However, the poorest performing state score for West Virginia does reflect a 1 percentage point improvement over the 2012 survey results and an 11 percentage point improvement since 2010.
Clearly, corporate counsel see specific areas for improvement in the individual states, and the perceptions of senior lawyers and executives in large companies matter. This survey reveals that three in four senior lawyers and executives feel that the litigation environment in a state is likely to impact important business decisions, which could have economic consequences for the states. The challenge for the states is to focus on those areas where they received the lowest scores and then make improvements where they are needed.
OVERVIEW

9 2015 Lawsuit Climate Survey: Ranking the States
OVERVIEW
2002 2003 2004 2005 2006 2007 2008 2010 2012 2015
70%
60%
50%
40%
30%
20%
Excellent/Pretty Good (net)
Only Fair/Poor (net)
2015 results are given for a base of 1,203 general counsel/senior litigators.
Overall Rating of State Court Liability Systems Over Time
Overall, how would you describe the fairness and reasonableness of state court systems in America?

10U.S. Chamber Institute for Legal Reform
State policymakers inevitably want to know the reasons behind their state’s ranking, particularly if they fared poorly. Exactly what happens in the courts that businesses find unfair or unreasonable? When states receive less than optimal grades, what reforms should be considered when they contemplate their results? Are the problems in an individual state’s liability system state-wide, or is the state’s ranking skewed by one (or more) individual city or county court that is viewed as particularly unfair or unreasonable? The Spotlight section answers these questions by highlighting findings from The 2015 Lawsuit Climate Survey that provide additional context to the state ranking itself.
These Spotlight issues are important in-and-of themselves but are not part of the actual calculation of the overall rankings of state liability systems; they simply provide additional insight for policymakers to consider.
Spotlight

11 2015 Lawsuit Climate Survey: Ranking the States
Most Important Issues for Improving the Litigation Environment
Eliminating unnecessary lawsuits
Placing reasonable limits on discovery
Limiting punitive or other types of damages
Increasing the effectiveness of judicial case management
Ensuring timely court decisions
Assuring that liability is properly allocated among defendants
Addressing e-discovery
32%
15%
11%
11%
9%
9%
6%
Results are given for a base of 1,203 general counsel/senior litigators who were asked, “Which of the following do you think is the single most important improvement that should be made in a litigation environment?”
Respondents were provided with this closed end list of items to evaluate. Additional responses volunteered by respondents at “Other” were all below 1%.
SPOTLIGHT
Eliminating unnecessary
lawsuits
32%

12U.S. Chamber Institute for Legal Reform
Worst Local Jurisdictions
East Texas
Chicago or Cook County, Illinois
Los Angeles, California
Madison County, Illinois
New Orleans or Orleans Parish, Louisiana
New York, New York
San Francisco, California
Miami or Dade County, Florida
Philadelphia, Pennsylvania
St. Louis, Missouri
Detroit, Michigan
Washington, DC
26%
20%
16%
16%
15%
10%
10%
10%
7%
7%
7%
5%
Results are given for a base of 1,203 general counsel/senior litigators who were asked, “Thinking about the entire country, which of the following do you think are the worst city or county courts? That is, which city or county courts have the least fair and reasonable litigation environment for both defendants and plaintiffs?”
Respondents were asked to provide up to two responses to this closed end list of city and county courts. Other mentions volunteered by respondents at “Other” in the list were all below 1%.
SPOTLIGHT
13 2015 Lawsuit Climate Survey: Ranking the States
SPOTLIGHT
Top Issues Mentioned as Creating the Least Fair and Reasonable Litigation Environment
Biased/partial judgment
Corrupt/unfair system
Poor quality of jury/judges
Personal experience
Slow process/delays
Excessive damage awards/not reasonable
Anti-business/anti-corporate
Have read/seen a case study
Heavily influenced by politics
Good old boy system/depends on who you know
Poor/bad system
Overburdened with cases/too many cases/backlog
Unpredictable jury/judges/system
Base judgments on irrelevant factors/emotion not fact
Incompetent jury/judges/system
Patent trolls/favorable to patent cases
Frivolous litigation
Asbestos litigation
Does not adhere to laws/rules
Uneducated jury/judges
Unfair jury/judges
Liberal jury/judges/system
Poor jury pool
Unreasonable rulings/verdicts
Bad reputation
Personal opinion
Discovery issues
It has become too dependent on class action suits
Expensive/high court costs
Results given are for a base of 1,034 general counsel/senior litigators who were asked, “Why do you say [Insert Name of City or County] has the LEAST fair and reasonable litigation environment for both defendants and plaintiffs?”
The responses displayed in this table were volunteered by respondents. Mentions of at least 2% are shown above.
24%
11%
7%
7%
6%
6%
5%
5%
4%
4%
4%
4%
3%
3%
3%
3%
3%
3%
3%
2%
2%
2%
2%
2%
2%
2%
2%
2%
2%

Summary of Top/Bottom 5 States by Key ElementsBEST1. Delaware2. Vermont3. Nebraska4. South Dakota5. North Carolina
WORST50. West Virginia49. Louisiana48. Illinois47. California46. New Mexico
Overall treatment of tort and contract litigation
BEST1. Delaware2. Nebraska3. New York4. Vermont5. Minnesota
WORST50. Illinois49. West Virginia 48. Louisiana47. California46. New Mexico
Having and enforcing meaningful venue requirements
BEST1. Delaware 2. Kansas 3. Vermont4. South Dakota 5. Iowa
WORST50. California49. Louisiana48. Illinois47. West Virginia46. Alabama
Damages
BEST1. Delaware2. Vermont3. Nebraska4. Idaho5. Wyoming
WORST50. Louisiana 49. West Virginia48. California47. Illinois46. Alabama
Timeliness of summary judgment or dismissal
BEST1. Delaware 2. Vermont 3. Idaho4. Nebraska 5. Wyoming
WORST50. California49. Illinois48. Louisiana 47. West Virginia46. Missouri
Treatment of class action suits and mass consolidation suits
SPOTLIGHT
14U.S. Chamber Institute for Legal Reform

15 2015 Lawsuit Climate Survey: Ranking the States
BEST1. Vermont2. Delaware3. Nebraska4. New Hampshire 5. Iowa
WORST50. West Virginia49. California48. Illinois47. Louisiana46. New Mexico
Discovery
BEST1. Vermont2. Delaware3. Massachusetts4. New York5. Iowa
WORST50. West Virginia49. Louisiana48. Illinois47. Alabama46. Arkansas
Scientific and technical evidence
BEST1. Delaware2. Massachusetts3. Maine4. Wyoming5. Iowa
WORST50. Louisiana49. West Virginia48. Illinois47. New Mexico46. California
Judges’ competence
BEST1. Nebraska2. Delaware3. New Hampshire 4. Iowa5. Vermont
WORST50. Louisiana49. California48. Illinois47. West Virginia46. Alabama
Juries’ fairness
BEST1. Vermont2. Delaware3. Iowa4. Nebraska5. New Hampshire
WORST50. Louisiana49. West Virginia48. Illinois47. New Mexico46. Texas
Judges’ impartiality
SPOTLIGHT

Most state liability systems have elements that function well, and others that do not. In evaluating how the states are perceived overall, this survey attempts to illuminate the observed strengths and weaknesses of specific aspects of state liability systems. It helps to pinpoint particular areas that may have lowered or raised the overall rankings.
This section of the report shows the state rankings by Key Element—the ten individual elements that respondents were asked to grade in each state. These key elements are the heart of the survey and what are used to develop the (1–50) Overall Ranking of State Liability Systems, as described in the Methodology section.
Key Elements
16U.S. Chamber Institute for Legal Reform

17 2015 Lawsuit Climate Survey: Ranking the States
Delaware
Vermont
Nebraska
South Dakota
North Carolina
Iowa
Idaho
Virginia
Wyoming
New Hampshire
Indiana
Kansas
Colorado
North Dakota
Connecticut
Alaska
Maine
Utah
New York
Arizona
Wisconsin
Minnesota
Massachusetts
Michigan
Tennessee
1
2
3
4
5
6
7
8
9
10
11
12
13
14
15
16
17
18
19
20
21
22
23
24
25
STATE STATERANK RANK
Ohio
Rhode Island
Maryland
Oklahoma
Oregon
South Carolina
Washington
Georgia
Nevada
Montana
Texas
Kentucky
Pennsylvania
New Jersey
Arkansas
Hawaii
Alabama
Mississippi
Missouri
Florida
New Mexico
California
Illinois
Louisiana
West Virginia
26
27
28
29
30
31
32
33
34
35
36
37
38
39
40
41
42
43
44
45
46
47
48
49
50
Overall Treatment of Tort and Contract Litigation
KEY ELEMENTS

18U.S. Chamber Institute for Legal Reform
Delaware
Nebraska
New York
Vermont
Minnesota
Maine
Maryland
Idaho
Connecticut
Wyoming
North Carolina
New Hampshire
Kansas
Iowa
Utah
Virginia
Massachusetts
Ohio
South Dakota
North Dakota
Arizona
Wisconsin
Indiana
Alaska
Michigan
1
2
3
4
5
6
7
8
9
10
11
12
13
14
15
16
17
18
19
20
21
22
23
24
25
STATE STATERANK RANK
Colorado
Tennessee
Hawaii
Oregon
Oklahoma
Georgia
Washington
Nevada
South Carolina
Kentucky
Pennsylvania
New Jersey
Alabama
Texas
Montana
Rhode Island
Florida
Missouri
Mississippi
Arkansas
New Mexico
California
Louisiana
West Virginia
Illinois
26
27
28
29
30
31
32
33
34
35
36
37
38
39
40
41
42
43
44
45
46
47
48
49
50
Having and Enforcing Meaningful Venue Requirements
KEY ELEMENTS

19 2015 Lawsuit Climate Survey: Ranking the States
Delaware
Vermont
Idaho
Nebraska
Wyoming
South Dakota
North Dakota
Utah
Rhode Island
Iowa
Alaska
Tennessee
North Carolina
Colorado
Maine
Michigan
Indiana
Minnesota
Connecticut
Hawaii
New York
Virginia
Kansas
New Hampshire
Arizona
1
2
3
4
5
6
7
8
9
10
11
12
13
14
15
16
17
18
19
20
21
22
23
24
25
STATE STATERANK RANK
Massachusetts
Oregon
Wisconsin
Ohio
Georgia
Maryland
Washington
Texas
Montana
Pennsylvania
Nevada
Kentucky
South Carolina
Oklahoma
New Mexico
New Jersey
Alabama
Mississippi
Arkansas
Florida
Missouri
West Virginia
Louisiana
Illinois
California
26
27
28
29
30
31
32
33
34
35
36
37
38
39
40
41
42
43
44
45
46
47
48
49
50
Treatment of Class Action Suits and Mass Consolidation Suits
KEY ELEMENTS
20U.S. Chamber Institute for Legal Reform
Delaware
Kansas
Vermont
South Dakota
Iowa
New Hampshire
Nebraska
Idaho
North Carolina
Wyoming
Utah
North Dakota
Rhode Island
Alaska
Virginia
Indiana
Wisconsin
Colorado
Maine
Minnesota
Tennessee
Arizona
Michigan
Ohio
Maryland
1
2
3
4
5
6
7
8
9
10
11
12
13
14
15
16
17
18
19
20
21
22
23
24
25
STATE STATERANK RANK
Massachusetts
Connecticut
Oklahoma
New York
Georgia
Hawaii
Washington
Montana
Pennsylvania
Oregon
Arkansas
Texas
New Jersey
Kentucky
South Carolina
Nevada
Missouri
Mississippi
New Mexico
Florida
Alabama
West Virginia
Illinois
Louisiana
California
26
27
28
29
30
31
32
33
34
35
36
37
38
39
40
41
42
43
44
45
46
47
48
49
50
Damages
KEY ELEMENTS

21 2015 Lawsuit Climate Survey: Ranking the States
Delaware
Vermont
Nebraska
Idaho
Wyoming
Alaska
Iowa
North Carolina
New Hampshire
North Dakota
Utah
Hawaii
Maine
Minnesota
South Dakota
Wisconsin
Kansas
Massachusetts
Virginia
Michigan
Connecticut
Arizona
Indiana
Colorado
Tennessee
1
2
3
4
5
6
7
8
9
10
11
12
13
14
15
16
17
18
19
20
21
22
23
24
25
STATE STATERANK RANK
Oklahoma
Maryland
Rhode Island
Washington
Montana
Oregon
Nevada
Ohio
Texas
New York
Georgia
South Carolina
Kentucky
Pennsylvania
New Mexico
Mississippi
Missouri
Arkansas
New Jersey
Florida
Alabama
Illinois
California
West Virginia
Louisiana
26
27
28
29
30
31
32
33
34
35
36
37
38
39
40
41
42
43
44
45
46
47
48
49
50
Timeliness of Summary Judgment or Dismissal
KEY ELEMENTS
22U.S. Chamber Institute for Legal Reform
Vermont
Delaware
Nebraska
New Hampshire
Iowa
North Carolina
Virginia
Utah
South Dakota
Idaho
Indiana
Colorado
Kansas
Minnesota
Massachusetts
Wyoming
Wisconsin
Maryland
Tennessee
Hawaii
Arizona
Michigan
Alaska
Connecticut
Washington
1
2
3
4
5
6
7
8
9
10
11
12
13
14
15
16
17
18
19
20
21
22
23
24
25
STATE STATERANK RANK
Nevada
North Dakota
Ohio
New York
Maine
Georgia
Montana
Oklahoma
Rhode Island
Oregon
Pennsylvania
Texas
Arkansas
Kentucky
South Carolina
New Jersey
Mississippi
Florida
Alabama
Missouri
New Mexico
Louisiana
Illinois
California
West Virginia
26
27
28
29
30
31
32
33
34
35
36
37
38
39
40
41
42
43
44
45
46
47
48
49
50
Discovery
KEY ELEMENTS

23 2015 Lawsuit Climate Survey: Ranking the States
Vermont
Delaware
Massachusetts
New York
Iowa
North Carolina
Idaho
Minnesota
Colorado
Nebraska
South Dakota
Connecticut
Virginia
Utah
New Hampshire
Michigan
Indiana
Wyoming
Wisconsin
Rhode Island
Maine
North Dakota
Arizona
Alaska
Nevada
1
2
3
4
5
6
7
8
9
10
11
12
13
14
15
16
17
18
19
20
21
22
23
24
25
STATE STATERANK RANK
Washington
Ohio
Kansas
Maryland
Tennessee
Georgia
Pennsylvania
New Jersey
Montana
Hawaii
Oklahoma
Texas
Oregon
New Mexico
South Carolina
Florida
California
Missouri
Kentucky
Mississippi
Arkansas
Alabama
Illinois
Louisiana
West Virginia
26
27
28
29
30
31
32
33
34
35
36
37
38
39
40
41
42
43
44
45
46
47
48
49
50
Scientific and Technical Evidence
KEY ELEMENTS

24U.S. Chamber Institute for Legal Reform
Vermont
Delaware
Iowa
Nebraska
New Hampshire
North Dakota
North Carolina
Virginia
Utah
Colorado
Minnesota
Massachusetts
Wyoming
South Dakota
Alaska
Indiana
Kansas
Connecticut
Idaho
Wisconsin
Arizona
New York
Tennessee
Maine
Washington
1
2
3
4
5
6
7
8
9
10
11
12
13
14
15
16
17
18
19
20
21
22
23
24
25
STATE STATERANK RANK
Maryland
Ohio
Rhode Island
Michigan
Hawaii
Georgia
New Jersey
Oregon
Montana
Kentucky
Arkansas
Pennsylvania
Nevada
Florida
Missouri
Oklahoma
South Carolina
Alabama
Mississippi
California
Texas
New Mexico
Illinois
West Virginia
Louisiana
26
27
28
29
30
31
32
33
34
35
36
37
38
39
40
41
42
43
44
45
46
47
48
49
50
Judges’ Impartiality
KEY ELEMENTS

25 2015 Lawsuit Climate Survey: Ranking the States
Delaware
Massachusetts
Maine
Wyoming
Iowa
Nebraska
Alaska
Vermont
New Hampshire
Idaho
South Dakota
Utah
Virginia
Colorado
Minnesota
New York
Indiana
North Carolina
Kansas
Washington
Maryland
North Dakota
Tennessee
Wisconsin
Michigan
1
2
3
4
5
6
7
8
9
10
11
12
13
14
15
16
17
18
19
20
21
22
23
24
25
STATE STATERANK RANK
Rhode Island
Connecticut
Ohio
Georgia
Arizona
New Jersey
Hawaii
Pennsylvania
Montana
Missouri
Kentucky
Oregon
Nevada
Oklahoma
Mississippi
Arkansas
Texas
Florida
South Carolina
Alabama
California
New Mexico
Illinois
West Virginia
Louisiana
26
27
28
29
30
31
32
33
34
35
36
37
38
39
40
41
42
43
44
45
46
47
48
49
50
Judges’ Competence
KEY ELEMENTS

26U.S. Chamber Institute for Legal Reform
Nebraska
Delaware
New Hampshire
Iowa
Vermont
Maine
North Dakota
Rhode Island
Idaho
South Dakota
North Carolina
Alaska
Wyoming
Indiana
Kansas
Colorado
Utah
Virginia
Minnesota
Arizona
Wisconsin
Washington
Massachusetts
Tennessee
Connecticut
1
2
3
4
5
6
7
8
9
10
11
12
13
14
15
16
17
18
19
20
21
22
23
24
25
STATE STATERANK RANK
Hawaii
Michigan
Ohio
Montana
New York
Georgia
Maryland
Oregon
Nevada
Oklahoma
Kentucky
Pennsylvania
South Carolina
New Jersey
Missouri
Arkansas
Texas
New Mexico
Mississippi
Florida
Alabama
West Virginia
Illinois
California
Louisiana
26
27
28
29
30
31
32
33
34
35
36
37
38
39
40
41
42
43
44
45
46
47
48
49
50
Juries’ Fairness
KEY ELEMENTS

27 2015 Lawsuit Climate Survey: Ranking the States
MethodologyThe 2015 Lawsuit Climate Survey: Ranking the States was conducted for the U.S. Chamber Institute for Legal Reform by the Harris Poll. The final results are based on interviews with a national sample of 1,203 in-house general counsel, senior litigators or attorneys, and other senior executives who are knowledgeable about litigation matters at public and private companies with annual revenues of at least $100 million. The general counsel, senior litigators or attorneys, and other senior executives included in this study were involved in or very familiar with litigation in the states they evaluated within the past four years. On average, each telephone respondent evaluated four states, and each online respondent evaluated five states.4 As a result, these 1,203 individual respondents represent a total of 5,346 responses or state evaluations.
Phone interviews averaging 26 minutes in length were conducted with a total of 560 respondents and took place between March 9, 2015, and June 24, 2015. Online interviews using the same questionnaire and averaging 14 minutes in length were conducted with a total of 643 respondents and took place between March 12, 2015, and June 24, 2015. As a point of reference, the 2012 research was conducted between March 13, 2012, and June 25, 2012. The remaining prior years’ research was conducted during October to January in the years 2002–2010.
Sample DesignFor the telephone sample, a comprehensive list of general counsel at companies with annual revenues of at least $100 million was compiled using Hoovers Phone, InfoUSA, ALM Legal Intelligence and Leadership Directories. An alert letter was sent to the general counsel at each company. This letter provided general information about the study and notified the recipient of the option to take the survey online or by phone. 4. The number of evaluations was
rounded to the nearest whole number.
28U.S. Chamber Institute for Legal Reform
It told them that an interviewer from Harris Poll would be contacting them to set up an appointment for a telephone interview if that was their preference. The letter included a toll-free number for respondents to call and schedule an appointment for a telephone interview. It also alerted the respondent to a $100 incentive in the form of a gift card or charitable donation given in appreciation of the time invested in taking the survey.
For the online sample, the e-mail addresses for a representative sample of general counsel and other senior attorneys were drawn from Hoovers ConnectMail, ALM Law Journal, Today’s General Counsel, National Data Group, InfoUSA, ALM Legal Intelligence and Leadership Directories. Respondents received an electronic version of the alert letter, which included a password-protected link to take the survey. Once they accessed the survey online, all respondents were screened to ensure that they worked for companies with more than $100 million in annual revenues.
Sample CharacteristicsA vast majority (73%) of respondents were general counsel, corporate counsel, associate or assistant counsel, or some other senior litigator or attorney. The remaining respondents were senior executives knowledgeable about or responsible for litigation at their companies. Respondents had an average of 19 years of relevant legal experience, including in their current position, and had been involved in or familiar with litigation at their current companies for an average of 10 years. All respondents were familiar with or had litigated in the states they rated within the past four years; 78% fell within the past three years. The most common industry sector represented was manufacturing, followed by services and finance.
Telephone Interviewing ProceduresThe telephone interviews utilized a computer-assisted telephone interviewing (CATI) system, whereby trained interviewers call and immediately input responses into the computer. This system greatly enhances reporting reliability. It also reduces clerical error by eliminating the need for keypunching, since interviewers enter respondent answers directly into a computer terminal during the interview itself. This data entry program does not permit interviewers to inadvertently skip questions, as each question must be answered before the computer moves on to the next question. The data entry program also ensures that all skip patterns are correctly followed. Furthermore, the online data editing system refuses to accept punches that are out-of-range, demands confirmation of responses that exceed expected ranges, and asks for explanations for inconsistencies between certain key responses.
METHODOLOGY
29 2015 Lawsuit Climate Survey: Ranking the States
To achieve high participation, in addition to the alert letters, numerous telephone callbacks were made to reach respondents and conduct the interviews at a convenient time. Interviewers also offered to send respondents an e-mail invitation so that respondents could take the survey online on their own time.
Online Interviewing ProceduresAll online interviews were hosted on Harris Poll’s server and were conducted using a self-administered, online questionnaire via proprietary Web-assisted interviewing software. The mail version of the alert letter directed respondents to a URL and provided participants with a unique ID and password that they were required to enter on the landing page of the survey. Those who received an e-mail version of the alert letter accessed the survey by clicking on the password-protected URL included in the e-mail. Due to password protection, it was not possible for a respondent to answer the survey more than once. Respondents for whom we had e-mail addresses received an initial invitation as well as reminder e-mails.
Interviewing ProtocolAfter determining that respondents were qualified to participate in the survey using a series of screening questions, respondents identified the state liability systems with which they were familiar. The respondents were then asked to identify the last time they litigated in or were familiar with the states’ liability systems: responses included in this study were from respondents who were involved in or very familiar with litigation in the state within the past four years. From there, respondents were given the opportunity to evaluate the states’ liability systems, prioritized by most recent litigation experience. As stated earlier, respondents evaluated four states, on average, via telephone and five states, on average, online.
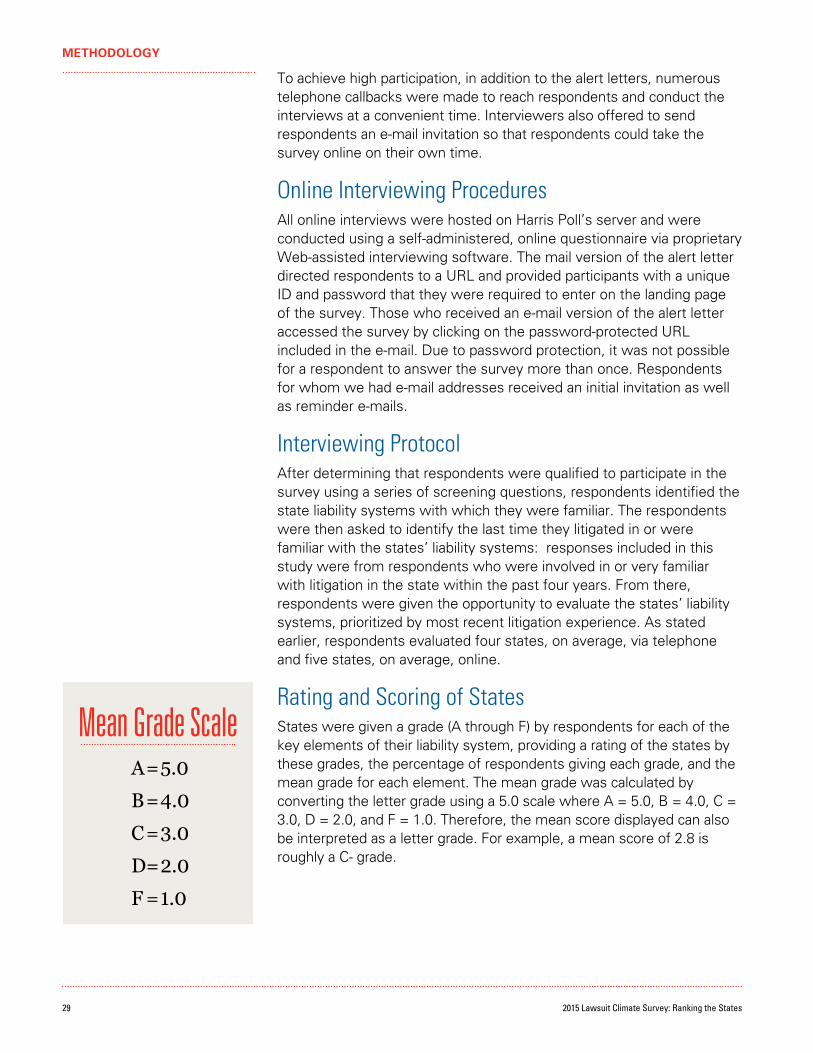
Rating and Scoring of StatesStates were given a grade (A through F) by respondents for each of the key elements of their liability system, providing a rating of the states by these grades, the percentage of respondents giving each grade, and the mean grade for each element. The mean grade was calculated by converting the letter grade using a 5.0 scale where A = 5.0, B = 4.0, C = 3.0, D = 2.0, and F = 1.0. Therefore, the mean score displayed can also be interpreted as a letter grade. For example, a mean score of 2.8 is roughly a C- grade.
METHODOLOGY
Mean Grade ScaleA = 5.0
B = 4.0
C = 3.0
D = 2.0
F = 1.0

30U.S. Chamber Institute for Legal Reform
The Overall Rankings of State Liability Systems table was developed by creating an index using the grades provided for each of the key elements plus the overall performance grade. All of the key elements were highly correlated with one another and with overall performance. The differences in the relationship between each element and overall performance were trivial, so it was determined that each element should contribute equally to the index score. To create the index, each grade across the elements plus the overall performance grade were rescaled from 0 to 100 (A = 100, B = 75, C = 50, D = 25, and F = 0). Then, any evaluation that contained 6 or more “not sure” or “decline to answer” responses per state was removed. A total of 5.2% of state evaluations were unusable. From the usable evaluations, the scores on the elements were then averaged together to create the index score from 0 to 100.
The scores displayed in this report have been rounded to one decimal point, but rankings are based on the full, unrounded number. States that appear tied based upon the scores in this report were tied when the unrounded numbers were taken into consideration.
For the Rankings on Key Elements, a score was calculated per element for each state based on the 0 to 100 rescaled performance grades. The states were then ranked by their mean scores on that element.
Reliability of Survey PercentagesThe results from any sample survey are subject to sampling variation. The sampling variation (or error) that applies to the results for this survey of 1,203 respondents is plus or minus 2.8 percentage points. That is, the chances are 95 in 100 that a survey result does not vary, plus or minus, by more than 2.8 percentage points from the result that would have been obtained if interviews were conducted with all persons in the universe represented by the sample. Note that survey results based on subgroups of smaller sizes can be subject to larger sampling error.
Sampling error of the type so far discussed is only one type of error. Survey research is also susceptible to other types of error, such as refusals to be interviewed (nonresponse error), question wording and question order, interviewer error, and weighting by demographic control data. Although it is difficult or impossible to quantify these types of error, the procedures followed by Harris Poll keep errors of these types to a minimum.
METHODOLOGY
Index Grade ScaleA = 100
B = 75
C = 50
D = 25
F = 0
A full copy of the report, including grades for each state on each of the key elements, is available at www.InstituteForLegalReform.com.

31 2015 Lawsuit Climate Survey: Ranking the States
DelawareVermontNebraskaIowaNew HampshireIdahoNorth CarolinaWyomingSouth DakotaUtahVirginiaAlaskaMinnesotaMaineNorth DakotaColoradoMassachusettsIndianaKansasWisconsinNew YorkConnecticutTennesseeMichiganArizonaRhode IslandOhioMarylandWashingtonHawaiiGeorgiaOregonOklahomaMontanaNevadaSouth CarolinaPennsylvaniaNew JerseyKentuckyTexasArkansasMissouriMississippiFloridaNew MexicoAlabamaCaliforniaIllinoisLouisianaWest Virginia
STATE
014-16
160
13-52
-1-41
-9-2-772
-4-14-5-3333
-8535
-7-1-7-49
11233
-6-1-4-6-85
-3-1-30
-200
RANKINGCHANGE
FROM 2012
Overall Rankings of State Liability Systems 2002–2015*
76.573.873.072.270.770.570.269.769.569.068.368.168.068.067.967.867.867.767.666.666.365.965.765.565.464.664.263.963.862.862.461.261.060.560.459.459.459.359.058.557.756.656.356.055.255.149.948.046.546.3
SCORE
89568290676291636290
1265889585989
10894
10212717686
10311411683
12592
12262
1088780679886
20312895
20274
1061282117598
306197131125
N
123456789
1011121314151617181920212223242526272829303132333435363738394041424344454647484950
2015 RANK
*Scores displayed in this table have been rounded to one decimal point. The column labels “N” represents the number of evaluations for a given state.

32U.S. Chamber Institute for Legal Reform
DelawareVermontNebraskaIowaNew HampshireIdahoNorth CarolinaWyomingSouth DakotaUtahVirginiaAlaskaMinnesotaMaineNorth DakotaColoradoMassachusettsIndianaKansasWisconsinNew YorkConnecticutTennesseeMichiganArizonaRhode IslandOhioMarylandWashingtonHawaiiGeorgiaOregonOklahomaMontanaNevadaSouth CarolinaPennsylvaniaNew JerseyKentuckyTexasArkansasMissouriMississippiFloridaNew MexicoAlabamaCaliforniaIllinoisLouisianaWest Virginia
STATE
1162
10216
203
1197
134
128
2319145
15182526271731303322292428424537394032383635344841444347464950
2012
1827
162621231256
20113
139
184
1024251922331539323027452814173840433635294134314842374744464950
2008
12125
12102098
144
337
113
13316
1617271822241935262315412825323729393430364443405042384845464749
2005
12535
161817151076
3311122894
1422232419301338292026352721314328393432403644374842414746454950
2010
127346
301622119
124325
2021188
131019147
231535242925423117384028373226334441344936394745464850
2007
1202475
19151763
338
12161328119
10221825231436322124392927314334403026354542415038374846444749
2004
124246
1810167
173
36149
128
32111523215
29221326192028462730333937423125344341354838404744454950
2006
11923
10132025478
329
166
12225
1511271726291837242321433914362834423130354645335040414844384749
2003
12165
17141620982
371918257
36124
1527102428113526223
402313414330423132384644295033394845344749
2002

202.463.5724 main 202.463.5302 fax
1615 H Street, NW Washington, DC 20062
instituteforlegalreform.com