a brief overview of gate oxide defect properties and … · a brief overview of gate oxide defect...
TRANSCRIPT

Contents lists available at ScienceDirect
Microelectronics Reliability
journal homepage: www.elsevier.com/locate/microrel
Invited paper
A brief overview of gate oxide defect properties and their relation toMOSFET instabilities and device and circuit time-dependent variability
B. Kaczera,⁎, J. Francoa, P. Weckxa, Ph.J. Roussela, V. Putchaa,b, E. Burya, M. Simicica,b,A. Chasina, D. Lintena, B. Parvaisa, F. Catthoora,b, G. Rzepac, M. Waltlc, T. Grasserc
a imec, Kapeldreef 75, B-3001 Leuven, Belgiumb KU Leuven, ESAT Department, B-3001 Leuven, Belgiumc TU Wien, Gusshausstrasse 27-29, A-1040 Vienna, Austria
A R T I C L E I N F O
Keywords:Bias Temperature Instability (BTI)Random Telegraph Noise (RTN)Gate oxide defectsVariabilityCircuit simulations
A B S T R A C T
A paradigm for MOSFET instabilities is outlined based on gate oxide traps and the detailed understanding oftheir properties. A model with trap energy levels in the gate dielectric and their misalignment with the channelFermi level is described, offering the most successful strategy to reduce both Positive and Negative BiasTemperature Instability (PBTI and NBTI) in a range of gate stacks. Trap temporal properties are determined bytunneling between the carrier reservoir and the trap itself, as well as thermal barriers related to atomic re-configuration. Trap electrostatic impact depends on the gate voltage and its spatial position, randomized byvariations in the channel potential. All internal properties of traps are distributed, resulting in distributions ofthe externally observable trap parameters, and in turn in time-dependent variability in devices and circuits.
1. Introduction
Electrically active gate oxide defects are an inevitable reality ofMOS-based devices. Indeed, their control and reduction in silicon di-oxide was one of the main enablers of silicon-based microelectronics[1,2]. The excess of gate oxide defects is also the main roadblock forpost-Si MOS technologies, such as those based on Ge and IIIV channels[3]. Gate oxide defects are responsible for sub-optimal FET parametersof as-fabricated devices, such as mobility, sub-threshold slope, andthreshold voltage, as well as a further degradation of these parametersduring device operation. Depending on the type of measurement andthe measurement conditions, these time-dependent instabilities arecommonly referred to as hysteresis, Bias Temperature Instability (BTI)and Random Telegraph Noise (RTN), the latter observable in smaller-area devices.
Negative BTI (NBTI), observed since the early period of MOSFETtechnology, remains a critical issue in present-day Si-based p-channelMOSFETs [4,5]. With the introduction of high-k gate dielectrics, Posi-tive BTI (PBTI) emerged as a concern for n-channel MOSFETs, later onminimized by high-k material quality improvement; nevertheless, PBTIstill represents a concern for beyond-Si technologies [3,6].
In general, the instabilities are caused by charging and dischargingof as-fabricated and generated bulk and interface states [7–9]. Over thelast decade we have concluded that a large body of observations in a
range of Si and post-Si gate stacks can be explained if the detailedproperties of the gate oxide defects are understood and invoked. Pri-marily, the trap energy levels in the gate dielectric and their misalignmentwith the channel Fermi level offer a picture that can explain manyfeatures of both PBTI and NBTI in a range of stacks. The channel/trapenergy level misalignment is also proposed as the most efficient methodto reduce BTI, particularly in post-Si gate stacks, and is discussed in thenext section, i.e., Section 2.
The rapid downscaling of FET devices brought about the possibilityto observe individual trapping and detrapping events and with it, directexperimental access to additional trap properties. These include theinternal barriers associated with the trap atomic reconfiguration (akastructural relaxation) during carrier capture and emission, which are e.g.responsible for the strong temperature dependence of the capture andemission times. A closer investigation then revealed even a more in-tricate, multi-state structure of some traps, allowing to explain complexRTN behavior, such as anomalous RTN and capture time frequencydependence [10,11].
Apart from their temporal properties, the electrostatics of singletraps could be investigated in deeply scaled devices. The effect of singletraps on the FET characteristics depends on the trap depth in the oxide,lateral position above the channel, as well as random variations in theFET channel potential [12]. The main properties of individual defectsare reviewed in Section 3.
https://doi.org/10.1016/j.microrel.2017.11.022Received 17 November 2017; Accepted 25 November 2017
⁎ Corresponding author.E-mail address: [email protected] (B. Kaczer).
Microelectronics Reliability 81 (2018) 186–194
Available online 04 January 20180026-2714/ © 2017 Elsevier Ltd. All rights reserved.
T

Decomposing transistor gate oxide reliability down into individualtraps and their well understood properties allows us to reassess andreassemble the time-dependent behavior of deeply scaled devices from“bottom up” [13]. The collective action of several traps in each deviceresults in within-device and device-to-device time-dependent varia-bility [9]. The methods of incorporating this variability in reliability-aware circuit simulations, the practical application of our under-standing, are briefly mentioned in Section 4.
2. Trap level perspective of BTI
Positive BTI (PBTI) came into prominence with the advent of high-kgate oxides [14]. We and others have noticed that the inclusion of rareearth elements in the high-k layer results in the reduction of thethreshold voltage shift ΔVth after a PBTI stress, Fig. 1 [15,16]. Re-markably, the instability reduction is accompanied by a larger oxideelectric field (or gate voltage) dependence. A larger field (or voltage)power-law exponent γ (i.e., the slope in a log-log plot) for the stack withdysprosium implies a larger reduction of instability (i.e., higher relia-bility) at lower, operating fields or voltages.
We have observed similar trends in p-channel FETs with Si-cappedSiGe and Ge channels, considered for beyond 10 nm VLSI nodes[17,18]. One can again see a major reduction in Negative BTI (NBTI)instability in Si-capped Ge-based devices, Fig. 2a, accompanied by anincrease in voltage acceleration at lower biases. NBTI reduction is alsoobserved when the SiGe quantum well thickness is increased, Fig. 2b.Most intriguingly, NBTI is reduced when the thickness of the Si cappinglayer decreases, Fig. 2c. This last observation is the most counter-intuitive, as reducing the Si cap brings the Si/SiO2 interface and thegate oxide traps spatially closer to the inversion layer holes, so a higherdegradation would be naively expected.
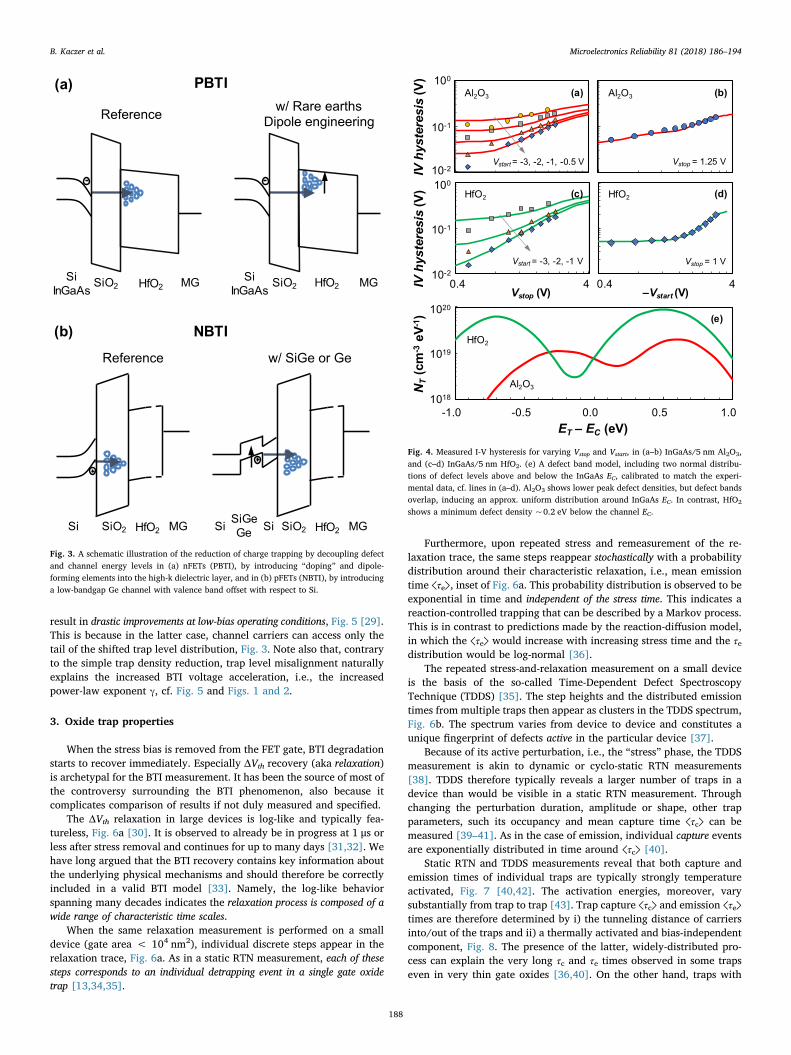
Based on these observations for both PBTI and NBTI, Figs. 1 and 2,respectively, we have proposed a unified model for BTI trapping, basedon channel carrier/trap energy level misalignment, see Fig. 3 [18]. In thecase of PBTI, when the energy level of electron traps is shifted upward,toward the gate oxide conduction band, Fig. 3a, the traps become lessaccessible for n-channel electrons. Analogously for NBTI in the p-channel stacks, the introduction of i) lower-band gap (Si)Ge, with dif-ferent valence band alignment to SiO2, ii) a wider (Si)Ge quantum wellwith narrower sub-bands, and iii) a thinner Si cap, Fig. 2a, b, and c,respectively, results in misaligning the channel holes with gate oxide
trap levels and decreased NBTI, Fig. 3b.We note that our model for BTI trapping is in fact merely re-
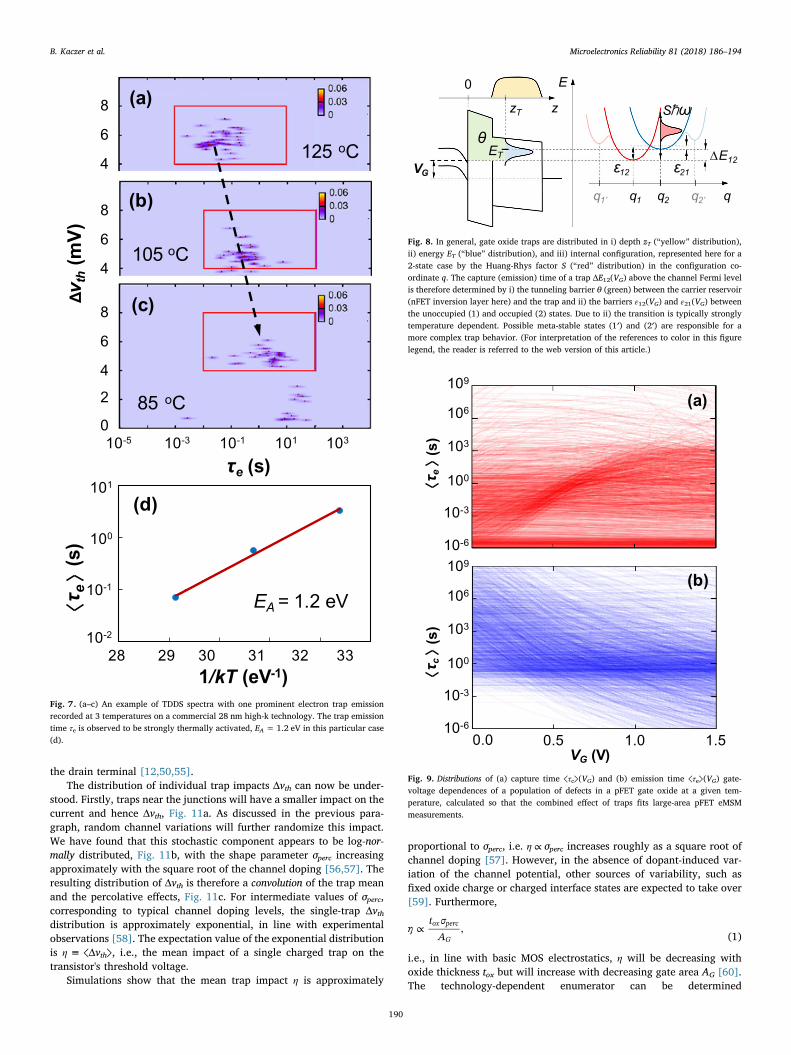
purposing established notions about charge trapping in MOS layers[11,19–21]. In our opinion, the trap-level picture of BTI should proveeven more useful going forward, as novel substrates and SiO2-free oxidecombinations are considered and studied [3]. For example, the trap-level model excellently explains multiple properties of I-V hysteresis inInGaAs/Al2O3 and InGaAs/HfO2 gate stacks, Fig. 4 [3].
Understanding BTI in terms of oxide trap energy levels is intuitiveand inherently enables multiple options to reduce BTI by gate stackdesign and processing. Trap level shifting can be achieved for exampleby rare-earth or even nitrogen “doping” of HfO2 (for electron traps)[22–24], dipole engineering [25,26], and dedicated anneals [27,28].
In the framework of the proposed picture we can argue the fol-lowing. Reducing the number of gate oxide defects will result in aproportional BTI reduction uniformly at all gate voltages. In contrast,misaligning the trap levels, without reducing the trap density, will
10-4
10-3
10-2
10-1
100
1
Eox
(MV cm-1
)
Vth
(V
)
2 5 10
ref
w/ Dy
T = 125 oC
trelax
= 10-3 s
tstress
= 6×10³ sSiO2 (1 nm)
HfSiO
DyO
TiN
re
f
w/ D
y
Fig. 1. A significant reduction of PBTI ΔVth observed in nFinFETs with Dy (stack “w/ Dy”,see inset) over the reference stack (“ref”) is ascribed to Dy diffusion into the HfSiO di-electric layer, resulting in trap “passivation” by energy level shifting. Note the accom-panying “signature” increase in the ΔVth oxide electric field (~gate voltage) dependenceEoxγ. A ~9% increase in equivalent oxide thickness of the “Dy” sample alone cannotexplain the improvement.
Neff(cm
-2)
3
(VG
– Vth0
) / Tinv
(MV cm-1)
1013
30
1012
1011
1010
Neff(cm
-2)
1013
1012
1011
1010
Neff(cm
-2)
1013
1012
1011
1010
Si ref
Si0.45
Ge0.55
Ge
Si0.45
Ge0.55
Si cap = 1.4 nm
QW = 3, 5, 7 nm
Si cap = 2 nm
1.4 nm
1.0 nm
0.65 nm
Si ref
Si0.45
Ge0.55
TiN
Si
(Si)Ge
HfO2
SiO2
IL
Si cap
(a)
(b)
(c)
T = 125 oC
trelax = 10-3 s
tstress = 1 s
Fig. 2. Plot of ΔNeff = Cox ΔVth / q vs. the oxide electric field estimate (VG − Vth0) / Tinvallows comparing BTI in disparate gate stacks. (a) A higher Ge fraction in the channel of apFET, see the inset of (b), lowers ΔNeff, i.e., boosts NBTI robustness. (b) The same effect isobserved as (b) SiGe quantum well thickness (QW) increases and (c) Si cap thicknessdecreases. In all three panels, note the voltage power-law exponent γ (slope in a log-logplot) increases in stacks with lower overall ΔNeff at operating voltages.
B. Kaczer et al. Microelectronics Reliability 81 (2018) 186–194
187
result in drastic improvements at low-bias operating conditions, Fig. 5 [29].This is because in the latter case, channel carriers can access only thetail of the shifted trap level distribution, Fig. 3. Note also that, contraryto the simple trap density reduction, trap level misalignment naturallyexplains the increased BTI voltage acceleration, i.e., the increasedpower-law exponent γ, cf. Fig. 5 and Figs. 1 and 2.
3. Oxide trap properties
When the stress bias is removed from the FET gate, BTI degradationstarts to recover immediately. Especially ΔVth recovery (aka relaxation)is archetypal for the BTI measurement. It has been the source of most ofthe controversy surrounding the BTI phenomenon, also because itcomplicates comparison of results if not duly measured and specified.
The ΔVth relaxation in large devices is log-like and typically fea-tureless, Fig. 6a [30]. It is observed to already be in progress at 1 μs orless after stress removal and continues for up to many days [31,32]. Wehave long argued that the BTI recovery contains key information aboutthe underlying physical mechanisms and should therefore be correctlyincluded in a valid BTI model [33]. Namely, the log-like behaviorspanning many decades indicates the relaxation process is composed of awide range of characteristic time scales.
When the same relaxation measurement is performed on a smalldevice (gate area < 104 nm2), individual discrete steps appear in therelaxation trace, Fig. 6a. As in a static RTN measurement, each of thesesteps corresponds to an individual detrapping event in a single gate oxidetrap [13,34,35].
Furthermore, upon repeated stress and remeasurement of the re-laxation trace, the same steps reappear stochastically with a probabilitydistribution around their characteristic relaxation, i.e., mean emissiontime ⟨τe⟩, inset of Fig. 6a. This probability distribution is observed to beexponential in time and independent of the stress time. This indicates areaction-controlled trapping that can be described by a Markov process.This is in contrast to predictions made by the reaction-diffusion model,in which the ⟨τe⟩ would increase with increasing stress time and the τedistribution would be log-normal [36].
The repeated stress-and-relaxation measurement on a small deviceis the basis of the so-called Time-Dependent Defect SpectroscopyTechnique (TDDS) [35]. The step heights and the distributed emissiontimes from multiple traps then appear as clusters in the TDDS spectrum,Fig. 6b. The spectrum varies from device to device and constitutes aunique fingerprint of defects active in the particular device [37].
Because of its active perturbation, i.e., the “stress” phase, the TDDSmeasurement is akin to dynamic or cyclo-static RTN measurements[38]. TDDS therefore typically reveals a larger number of traps in adevice than would be visible in a static RTN measurement. Throughchanging the perturbation duration, amplitude or shape, other trapparameters, such its occupancy and mean capture time ⟨τc⟩ can bemeasured [39–41]. As in the case of emission, individual capture eventsare exponentially distributed in time around ⟨τc⟩ [40].
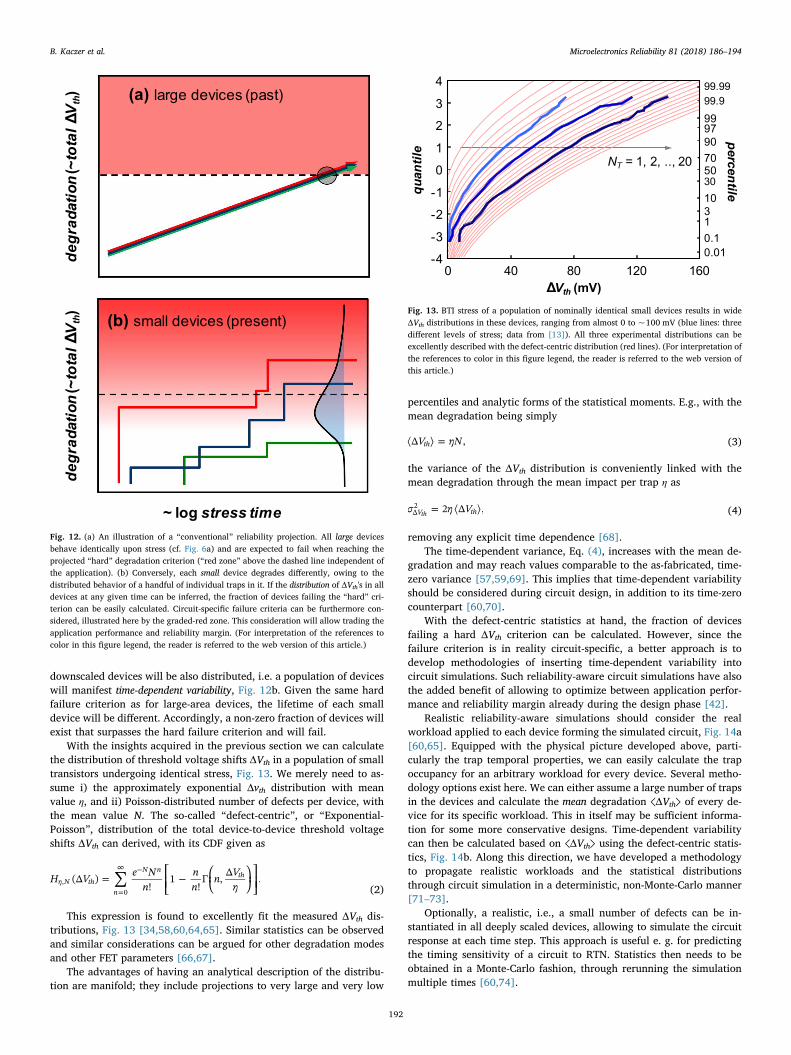
Static RTN and TDDS measurements reveal that both capture andemission times of individual traps are typically strongly temperatureactivated, Fig. 7 [40,42]. The activation energies, moreover, varysubstantially from trap to trap [43]. Trap capture ⟨τc⟩ and emission ⟨τe⟩times are therefore determined by i) the tunneling distance of carriersinto/out of the traps and ii) a thermally activated and bias-independentcomponent, Fig. 8. The presence of the latter, widely-distributed pro-cess can explain the very long τc and τe times observed in some trapseven in very thin gate oxides [36,40]. On the other hand, traps with
Reference
w/ SiGe or Ge
SiSiGe
GeSiO2 MGHfO2
SiSi SiO2 MGHfO2
Reference
SiO2 MGHfO2
Si
InGaAsHfO2
Si
InGaAsSiO2 MG
w/ Rare earths
Dipole engineering
(a) PBTI
(b) NBTI
Fig. 3. A schematic illustration of the reduction of charge trapping by decoupling defectand channel energy levels in (a) nFETs (PBTI), by introducing “doping” and dipole-forming elements into the high-k dielectric layer, and in (b) pFETs (NBTI), by introducinga low-bandgap Ge channel with valence band offset with respect to Si.
Al2O
3
Vstart = -3, -2, -1 V
Vstart = -3, -2, -1, -0.5 V Vstop = 1.25 V
Vstop = 1 V
(b)
(e)
Al2O
3(a)
100
10-1
10-2
HfO2(d)HfO2
(c)
100
10-1
10-2
Vstop (V)
44.044.0–Vstart (V)
NT
(cm
-3
eV
-1)
IV h
ysteresis
(V
)
Al2O3
HfO2
-1.0 -0.5 0.0 0.5 1.0
ET
– EC
(eV)
1020
1019
1018
IV h
ysteresis
(V
)
Fig. 4. Measured I-V hysteresis for varying Vstop and Vstart, in (a–b) InGaAs/5 nm Al2O3,and (c–d) InGaAs/5 nm HfO2. (e) A defect band model, including two normal distribu-tions of defect levels above and below the InGaAs EC, calibrated to match the experi-mental data, cf. lines in (a–d). Al2O3 shows lower peak defect densities, but defect bandsoverlap, inducing an approx. uniform distribution around InGaAs EC. In contrast, HfO2
shows a minimum defect density ~0.2 eV below the channel EC.
B. Kaczer et al. Microelectronics Reliability 81 (2018) 186–194
188

very short τc and τe times (< 10−3 s) will be typically interpreted instandard CV and Charge Pumping measurements as interface traps[44].
The thermally activated process is identified as a reconfiguration, ora structural relaxation of the atoms surrounding the trapping site during(dis-) charging. The total energy of the system during the (dis-) char-ging process is conserved through capture or emission of multiplephonons [11,45–49]. The energy barriers ε12(VG) and ε21(VG), asso-ciated respectively with capture and emission thermal activation aretied to the Huang-Rhys factor S, Fig. 8, and parabolic curvature ratio R(not shown) [11]. To account for the observed variations in the thermalactivation of ⟨τc⟩ and ⟨τe⟩, factor S, Fig. 8, and optionally, R, should beassumed to be distributed [27].
Capture and emission times ⟨τc⟩ and ⟨τe⟩ of each trap are thereforedetermined by its i) energy level ET (cf. Section 2), i) trap depth zT, and,for a 2-state system, iii) parameters S and R. Note that τc and τe dependon the gate voltage VG through its leveraging action on ΔE12, which inturn affects barriers ε12(VG) and ε21(VG), Fig. 8. The local availability ofcarriers in the reservoir should be also considered [50].
Finally, from the distributions of the above three factors, summarizedin Fig. 8, the distributions of ⟨τc⟩ and ⟨τe⟩ and their VG and T de-pendences can be calculated, Fig. 9 [51]. As will be discussed below,the ⟨τc⟩(VG, T) and ⟨τe⟩(VG, T) distributions will prove useful for trap-enhanced circuit simulations.
A closer examination of possible trap configurations reveals theinternal structure of some traps to be more complex than the basic 2states (i.e., charged and discharged). The additional meta-stable states,
Fig. 8, are then argued to be responsible for second-order effects, suchas switching oxide traps, anomalous RTN, multistate frequency de-pendence, and bias independent time constants, as well as gate leakage[10,11,52,53].
Let us now turn our attention from the trap temporal properties totheir impact on the FET electrostatics. In deeply scaled devices withlateral dimensions comparable to the Debye length, the potential dis-tribution in the channel cannot be considered smooth but modulated byindividual charged dopants and other sources of variability.Consequently, the source-to-drain conduction proceeds in a non-uni-form, percolative manner, Fig. 10a [12,54].
A single charged trap in the gate oxide will locally affect the channelpotential through a Coulombic interaction. The impact of single chargedtraps on the channel current, represented by the threshold voltage shiftΔvth,1 varies vastly, both in magnitude and in VG dependence, Fig. 10b.To a first-order approximation, we have found it to depend on thelateral location of the trap with respect to the current percolationpaths—traps closer to the paths, and specifically, percolation constric-tion spots, will have a significant impact. Conversely, charging of trapsacting over a region with little channel current will be barely noticed at
ref
(a)
1 2
(b)
VG
– Vth0
(V)
10-1 100 101
Vth
(a
.u
.)
10-6
10-5
100
10-4
10-3
10-2
10-1
ref
1
2
Fig. 5. (a) With respect to the reference case (ref), charge trapping is suppressed by i)reducing the dielectric defect density (Scenario 1), or ii) by carrier/defect energy de-coupling (Scenario 2). (b) Calculated ΔVth assuming a 10× defect density reduction(Scenario 1), or the reference defect density of states but with the mean shifted by 0.5 eV(Scenario 2). The latter case yields an exponential reduction of charge-trapping at op-erating VG. Note also that Scenario 2 reproduces the observation of increased power-lawexponent γ in Figs. 1 and 2.
0
10
20
30
40
50
10-3 10-1 101 103 105
relaxation time trelax
(a.u.)
ΔΔV
th
(a.u
.) ΔV
th
(m
V)
trelax
(a.u.)
10-1 10110-3
(a)
10-3 10-1 101 103
relaxation time trelax
(a.u.)
(b)
small device
large devices
e
e
e
Fig. 6. (a) ΔVth relaxation in large devices is generally featureless, log-like and distributedover a wide range of time scales. All large devices behave nearly identically. In contrast,multiple discrete detrapping events are visible in small device relaxation traces. Inset:upon repeated stress-and-relaxation measurement of a single small device, the same Δvthstep corresponding to the same detrapping event is observed with exponentially dis-tributed instances of emission times τe. (b) Emission times τe, together with the corre-sponding Δvth values, extracted from the repeated relaxation traces can be plotted inparallel for multiple traps into a 2D histogram, forming a TDDS spectrum of the device.Distribution magnitudes reflect respective trap occupancies.
1 vth is used to represent the effect of an individual trap, while Vth represents the totalFET threshold voltage shift due to multiple traps.
B. Kaczer et al. Microelectronics Reliability 81 (2018) 186–194
189
the drain terminal [12,50,55].The distribution of individual trap impacts Δvth can now be under-
stood. Firstly, traps near the junctions will have a smaller impact on thecurrent and hence Δvth, Fig. 11a. As discussed in the previous para-graph, random channel variations will further randomize this impact.We have found that this stochastic component appears to be log-nor-mally distributed, Fig. 11b, with the shape parameter σperc increasingapproximately with the square root of the channel doping [56,57]. Theresulting distribution of Δvth is therefore a convolution of the trap meanand the percolative effects, Fig. 11c. For intermediate values of σperc,corresponding to typical channel doping levels, the single-trap Δvthdistribution is approximately exponential, in line with experimentalobservations [58]. The expectation value of the exponential distributionis η ≡ ⟨Δvth⟩, i.e., the mean impact of a single charged trap on thetransistor's threshold voltage.
Simulations show that the mean trap impact η is approximately
proportional to σperc, i.e. η ∝ σperc increases roughly as a square root ofchannel doping [57]. However, in the absence of dopant-induced var-iation of the channel potential, other sources of variability, such asfixed oxide charge or charged interface states are expected to take over[59]. Furthermore,
∝ηt σ
A,ox perc
G (1)
i.e., in line with basic MOS electrostatics, η will be decreasing withoxide thickness tox but will increase with decreasing gate area AG [60].The technology-dependent enumerator can be determined
oC
28 29 30 31 32 33
(d)
1/kT (eV-1)
10-2
10-1
100
101
(s)
(a)
(b)
(c)
125 oC
85 oC
105
10-5 10-3 10-1 101 103
e (s)
0
2
4
6
8
4
6
8
4
6
8
v th
(mV)
EA = 1.2 eV
e
Fig. 7. (a–c) An example of TDDS spectra with one prominent electron trap emissionrecorded at 3 temperatures on a commercial 28 nm high-k technology. The trap emissiontime τe is observed to be strongly thermally activated, EA = 1.2 eV in this particular case(d).
E
q1
q2
q
12VG
z
ET
0
zT
∆E12
S
q1’
q2’
21
Fig. 8. In general, gate oxide traps are distributed in i) depth zT (“yellow” distribution),ii) energy ET (“blue” distribution), and iii) internal configuration, represented here for a2-state case by the Huang-Rhys factor S (“red” distribution) in the configuration co-ordinate q. The capture (emission) time of a trap ΔE12(VG) above the channel Fermi levelis therefore determined by i) the tunneling barrier θ (green) between the carrier reservoir(nFET inversion layer here) and the trap and ii) the barriers ε12(VG) and ε21(VG) betweenthe unoccupied (1) and occupied (2) states. Due to ii) the transition is typically stronglytemperature dependent. Possible meta-stable states (1′) and (2′) are responsible for amore complex trap behavior. (For interpretation of the references to color in this figurelegend, the reader is referred to the web version of this article.)
10-6
10-3
100
103
106
109
0.0 0.5 1.0
VG
(V)
10-6
10-3
100
103
106
109
(s
)
1.5
(a)
(b)
c(s
)e
Fig. 9. Distributions of (a) capture time ⟨τc⟩(VG) and (b) emission time ⟨τe⟩(VG) gate-voltage dependences of a population of defects in a pFET gate oxide at a given tem-perature, calculated so that the combined effect of traps fits large-area pFET eMSMmeasurements.
B. Kaczer et al. Microelectronics Reliability 81 (2018) 186–194
190

experimentally using e.g. FET arrays or matched pairs [60–62].In summary, three main quantities, ⟨τc⟩, ⟨τe⟩, and Δvth, describe the
relevant behavior of each gate oxide trap. The capture and emissionprocesses are controlled by tunneling between the carrier reservoir andthe trap itself, as well as internal thermal barriers, with both compo-nents depending on gate bias VG, the trap energy level ET and the depthzT in the gate oxide. The thermal barriers are further responsible for thetemperature dependence of the capture and emission processes. Trapenergy levels ET, depth zT, and the thermal barriers (determined byparameters S and R) are typically widely distributed across the trap po-pulation. The individual instances of capture and emission events of eachtrap are stochastic and are exponentially distributed in time around ⟨τc⟩and ⟨τe⟩, respectively [36].
The impact of a charged trap depends, in addition to VG and zT, onthe lateral position of the trap above the channel. The impact of singletraps on the FET threshold voltage Δvth is approximately exponentiallydistributed across the trap population. These distributions are instru-mental in propagating the individual trap properties to the device andcircuit levels.
4. Implications for devices and circuits
In the previous section we have seen that each trap behaves sto-chastically around mean values that vary widely from trap to trap. Inlarge-area devices the individual behavior of the many traps averagesout and noise measurements are the only way to access the trap
stochastic properties. As a consequence, large-area devices all degradeapproximately identically in standard BTI experiments and the lifetimecan be defined as a single value, determined by a parameter, e.g. ΔVth,crossing a predetermined failure criterion, Fig. 12a.
With technology downscaling, the oxide thickness was the first di-mension to be reduced to nm scales, resulting in the first distributed FETdegradation mechanism, TDDB [63]. The gate area of state-of-the-artdevices is so small that the gate oxide stack of each device contains justa handful of defects. Because i) each defect behaves stochastically anddifferently, according to the distributions described above, and ii) thenumber of defects per device fluctuates, BTI degradation in deeply
-0.4
VG
– Vth,i
(V)
0
-0.2 0.0 0.2 0.4 0.6
vth
(m
V)
20
40
60
Source
Drain
(a)
(b)
Fig. 10. (a) In small devices, channel conduction near Vth proceeds along percolationpaths in the channel potential randomized by discrete dopants and other sources ofvariability. Critical “constriction” spots are demarcated with circles. (b) Widely differentΔvth(VG) characteristics are found in nominally identical small-size pFET devices beforeand after the capture of a single hole, with the shape of the characteristics depending, to afirst-order approximation, on the distance between the trap and the nearest constrictionspot.
200
100
10-1
CC
DF
vth
(mV)
6040 80
10-2
10-3
10-4
vth,rdd
/ vth,cont
()
0
-2
-4
2
4
qu
an
tile
10-1 100 101
so
urc
e
0 10 20 30 40 50 60
x (nm)
vth
,co
nt(m
V)
dra
in
perc= 0 0.35 0.7
1
0 0.35 0.7 perc= 1
(a)
(b)
(c)
0
2
5
4
3
1
Fig. 11. (a) With realistic continuous (cont) FET doping profiles along the channel (di-rection x), traps close to the S/D junctions contribute less to Δvth,cont. (b) The ratio ofΔvth,RDD / Δvth,cont constitutes the added impact of Random Dopant Distributions (RDD).The distribution of this ratio can be acceptably described as log-normal, with parameterσperc (and μ = 0; note: σperc ≡ 0 means no additional RDD impact). (c) ComplementaryCDF plot of a convolution of i) Δvth,cont (a) and ii) different amounts of RDD impact,represented by σperc (b). The tails of the distributions are approximately exponential up to~ the 99.9th percentile (=1–10−3).
B. Kaczer et al. Microelectronics Reliability 81 (2018) 186–194
191
downscaled devices will be also distributed, i.e. a population of deviceswill manifest time-dependent variability, Fig. 12b. Given the same hardfailure criterion as for large-area devices, the lifetime of each smalldevice will be different. Accordingly, a non-zero fraction of devices willexist that surpasses the hard failure criterion and will fail.
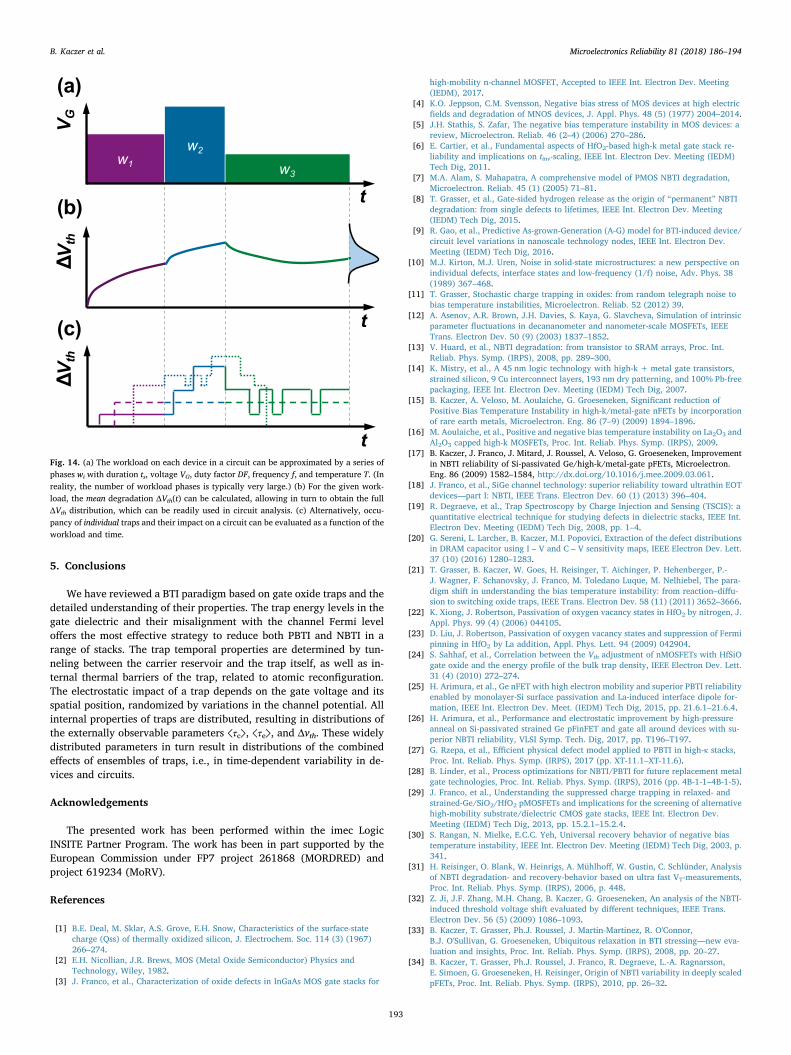
With the insights acquired in the previous section we can calculatethe distribution of threshold voltage shifts ΔVth in a population of smalltransistors undergoing identical stress, Fig. 13. We merely need to as-sume i) the approximately exponential Δvth distribution with meanvalue η, and ii) Poisson-distributed number of defects per device, withthe mean value N. The so-called “defect-centric”, or “Exponential-Poisson”, distribution of the total device-to-device threshold voltageshifts ΔVth can derived, with its CDF given as
∑ ⎜ ⎟= ⎡⎣⎢ − ⎛
⎝⎞⎠
⎤⎦⎥
=
∞ −H V e N
nnn
n Vη
(Δ )!
1!Γ , Δ .η N th
n
N nth
,0 (2)
This expression is found to excellently fit the measured ΔVth dis-tributions, Fig. 13 [34,58,60,64,65]. Similar statistics can be observedand similar considerations can be argued for other degradation modesand other FET parameters [66,67].
The advantages of having an analytical description of the distribu-tion are manifold; they include projections to very large and very low
percentiles and analytic forms of the statistical moments. E.g., with themean degradation being simply
⟨ ⟩ =V ηNΔ ,th (3)
the variance of the ΔVth distribution is conveniently linked with themean degradation through the mean impact per trap η as
= ⟨ ⟩σ η V2 Δ ,V thΔ2
th (4)
removing any explicit time dependence [68].The time-dependent variance, Eq. (4), increases with the mean de-
gradation and may reach values comparable to the as-fabricated, time-zero variance [57,59,69]. This implies that time-dependent variabilityshould be considered during circuit design, in addition to its time-zerocounterpart [60,70].
With the defect-centric statistics at hand, the fraction of devicesfailing a hard ΔVth criterion can be calculated. However, since thefailure criterion is in reality circuit-specific, a better approach is todevelop methodologies of inserting time-dependent variability intocircuit simulations. Such reliability-aware circuit simulations have alsothe added benefit of allowing to optimize between application perfor-mance and reliability margin already during the design phase [42].
Realistic reliability-aware simulations should consider the realworkload applied to each device forming the simulated circuit, Fig. 14a[60,65]. Equipped with the physical picture developed above, parti-cularly the trap temporal properties, we can easily calculate the trapoccupancy for an arbitrary workload for every device. Several metho-dology options exist here. We can either assume a large number of trapsin the devices and calculate the mean degradation ⟨ΔVth⟩ of every de-vice for its specific workload. This in itself may be sufficient informa-tion for some more conservative designs. Time-dependent variabilitycan then be calculated based on ⟨ΔVth⟩ using the defect-centric statis-tics, Fig. 14b. Along this direction, we have developed a methodologyto propagate realistic workloads and the statistical distributionsthrough circuit simulation in a deterministic, non-Monte-Carlo manner[71–73].
Optionally, a realistic, i.e., a small number of defects can be in-stantiated in all deeply scaled devices, allowing to simulate the circuitresponse at each time step. This approach is useful e. g. for predictingthe timing sensitivity of a circuit to RTN. Statistics then needs to beobtained in a Monte-Carlo fashion, through rerunning the simulationmultiple times [60,74].
(a) large devices (past)
~ log stress time
de
gra
datio
n(~
to
ta
lV
th)
(b) small devices (present)
de
gra
datio
n(~
to
ta
lV
th)
Fig. 12. (a) An illustration of a “conventional” reliability projection. All large devicesbehave identically upon stress (cf. Fig. 6a) and are expected to fail when reaching theprojected “hard” degradation criterion (“red zone” above the dashed line independent ofthe application). (b) Conversely, each small device degrades differently, owing to thedistributed behavior of a handful of individual traps in it. If the distribution of ΔVth's in alldevices at any given time can be inferred, the fraction of devices failing the “hard” cri-terion can be easily calculated. Circuit-specific failure criteria can be furthermore con-sidered, illustrated here by the graded-red zone. This consideration will allow trading theapplication performance and reliability margin. (For interpretation of the references tocolor in this figure legend, the reader is referred to the web version of this article.)
qu
an
tile
-3
-2
-1
0
1
2
3
4
0 40 80 120 160
0.01
0.1
1
3
10
30
50
70
90
97
99
99.9
99.99
NT
= 1, 2, .., 20
Vth
(mV)
percen
tile
-4
Fig. 13. BTI stress of a population of nominally identical small devices results in wideΔVth distributions in these devices, ranging from almost 0 to ~100 mV (blue lines: threedifferent levels of stress; data from [13]). All three experimental distributions can beexcellently described with the defect-centric distribution (red lines). (For interpretation ofthe references to color in this figure legend, the reader is referred to the web version ofthis article.)
B. Kaczer et al. Microelectronics Reliability 81 (2018) 186–194
192
5. Conclusions
We have reviewed a BTI paradigm based on gate oxide traps and thedetailed understanding of their properties. The trap energy levels in thegate dielectric and their misalignment with the channel Fermi leveloffers the most effective strategy to reduce both PBTI and NBTI in arange of stacks. The trap temporal properties are determined by tun-neling between the carrier reservoir and the trap itself, as well as in-ternal thermal barriers of the trap, related to atomic reconfiguration.The electrostatic impact of a trap depends on the gate voltage and itsspatial position, randomized by variations in the channel potential. Allinternal properties of traps are distributed, resulting in distributions ofthe externally observable parameters ⟨τc⟩, ⟨τe⟩, and Δvth. These widelydistributed parameters in turn result in distributions of the combinedeffects of ensembles of traps, i.e., in time-dependent variability in de-vices and circuits.
Acknowledgements
The presented work has been performed within the imec LogicINSITE Partner Program. The work has been in part supported by theEuropean Commission under FP7 project 261868 (MORDRED) andproject 619234 (MoRV).
References
[1] B.E. Deal, M. Sklar, A.S. Grove, E.H. Snow, Characteristics of the surface-statecharge (Qss) of thermally oxidized silicon, J. Electrochem. Soc. 114 (3) (1967)266–274.
[2] E.H. Nicollian, J.R. Brews, MOS (Metal Oxide Semiconductor) Physics andTechnology, Wiley, 1982.
[3] J. Franco, et al., Characterization of oxide defects in InGaAs MOS gate stacks for
high-mobility n-channel MOSFET, Accepted to IEEE Int. Electron Dev. Meeting(IEDM), 2017.
[4] K.O. Jeppson, C.M. Svensson, Negative bias stress of MOS devices at high electricfields and degradation of MNOS devices, J. Appl. Phys. 48 (5) (1977) 2004–2014.
[5] J.H. Stathis, S. Zafar, The negative bias temperature instability in MOS devices: areview, Microelectron. Reliab. 46 (2–4) (2006) 270–286.
[6] E. Cartier, et al., Fundamental aspects of HfO2-based high-k metal gate stack re-liability and implications on tinv-scaling, IEEE Int. Electron Dev. Meeting (IEDM)Tech Dig, 2011.
[7] M.A. Alam, S. Mahapatra, A comprehensive model of PMOS NBTI degradation,Microelectron. Reliab. 45 (1) (2005) 71–81.
[8] T. Grasser, et al., Gate-sided hydrogen release as the origin of “permanent” NBTIdegradation: from single defects to lifetimes, IEEE Int. Electron Dev. Meeting(IEDM) Tech Dig, 2015.
[9] R. Gao, et al., Predictive As-grown-Generation (A-G) model for BTI-induced device/circuit level variations in nanoscale technology nodes, IEEE Int. Electron Dev.Meeting (IEDM) Tech Dig, 2016.
[10] M.J. Kirton, M.J. Uren, Noise in solid-state microstructures: a new perspective onindividual defects, interface states and low-frequency (1/f) noise, Adv. Phys. 38(1989) 367–468.
[11] T. Grasser, Stochastic charge trapping in oxides: from random telegraph noise tobias temperature instabilities, Microelectron. Reliab. 52 (2012) 39.
[12] A. Asenov, A.R. Brown, J.H. Davies, S. Kaya, G. Slavcheva, Simulation of intrinsicparameter fluctuations in decananometer and nanometer-scale MOSFETs, IEEETrans. Electron Dev. 50 (9) (2003) 1837–1852.
[13] V. Huard, et al., NBTI degradation: from transistor to SRAM arrays, Proc. Int.Reliab. Phys. Symp. (IRPS), 2008, pp. 289–300.
[14] K. Mistry, et al., A 45 nm logic technology with high-k + metal gate transistors,strained silicon, 9 Cu interconnect layers, 193 nm dry patterning, and 100% Pb-freepackaging, IEEE Int. Electron Dev. Meeting (IEDM) Tech Dig, 2007.
[15] B. Kaczer, A. Veloso, M. Aoulaiche, G. Groeseneken, Significant reduction ofPositive Bias Temperature Instability in high-k/metal-gate nFETs by incorporationof rare earth metals, Microelectron. Eng. 86 (7–9) (2009) 1894–1896.
[16] M. Aoulaiche, et al., Positive and negative bias temperature instability on La2O3 andAl2O3 capped high-k MOSFETs, Proc. Int. Reliab. Phys. Symp. (IRPS), 2009.
[17] B. Kaczer, J. Franco, J. Mitard, J. Roussel, A. Veloso, G. Groeseneken, Improvementin NBTI reliability of Si-passivated Ge/high-k/metal-gate pFETs, Microelectron.Eng. 86 (2009) 1582–1584, http://dx.doi.org/10.1016/j.mee.2009.03.061.
[18] J. Franco, et al., SiGe channel technology: superior reliability toward ultrathin EOTdevices—part I: NBTI, IEEE Trans. Electron Dev. 60 (1) (2013) 396–404.
[19] R. Degraeve, et al., Trap Spectroscopy by Charge Injection and Sensing (TSCIS): aquantitative electrical technique for studying defects in dielectric stacks, IEEE Int.Electron Dev. Meeting (IEDM) Tech Dig, 2008, pp. 1–4.
[20] G. Sereni, L. Larcher, B. Kaczer, M.I. Popovici, Extraction of the defect distributionsin DRAM capacitor using I – V and C – V sensitivity maps, IEEE Electron Dev. Lett.37 (10) (2016) 1280–1283.
[21] T. Grasser, B. Kaczer, W. Goes, H. Reisinger, T. Aichinger, P. Hehenberger, P.-J. Wagner, F. Schanovsky, J. Franco, M. Toledano Luque, M. Nelhiebel, The para-digm shift in understanding the bias temperature instability: from reaction–diffu-sion to switching oxide traps, IEEE Trans. Electron Dev. 58 (11) (2011) 3652–3666.
[22] K. Xiong, J. Robertson, Passivation of oxygen vacancy states in HfO2 by nitrogen, J.Appl. Phys. 99 (4) (2006) 044105.
[23] D. Liu, J. Robertson, Passivation of oxygen vacancy states and suppression of Fermipinning in HfO2 by La addition, Appl. Phys. Lett. 94 (2009) 042904.
[24] S. Sahhaf, et al., Correlation between the Vth adjustment of nMOSFETs with HfSiOgate oxide and the energy profile of the bulk trap density, IEEE Electron Dev. Lett.31 (4) (2010) 272–274.
[25] H. Arimura, et al., Ge nFET with high electron mobility and superior PBTI reliabilityenabled by monolayer-Si surface passivation and La-induced interface dipole for-mation, IEEE Int. Electron Dev. Meet. (IEDM) Tech Dig, 2015, pp. 21.6.1–21.6.4.
[26] H. Arimura, et al., Performance and electrostatic improvement by high-pressureanneal on Si-passivated strained Ge pFinFET and gate all around devices with su-perior NBTI reliability, VLSI Symp. Tech. Dig, 2017, pp. T196–T197.
[27] G. Rzepa, et al., Efficient physical defect model applied to PBTI in high-κ stacks,Proc. Int. Reliab. Phys. Symp. (IRPS), 2017 (pp. XT-11.1–XT-11.6).
[28] B. Linder, et al., Process optimizations for NBTI/PBTI for future replacement metalgate technologies, Proc. Int. Reliab. Phys. Symp. (IRPS), 2016 (pp. 4B-1-1–4B-1-5).
[29] J. Franco, et al., Understanding the suppressed charge trapping in relaxed- andstrained-Ge/SiO2/HfO2 pMOSFETs and implications for the screening of alternativehigh-mobility substrate/dielectric CMOS gate stacks, IEEE Int. Electron Dev.Meeting (IEDM) Tech Dig, 2013, pp. 15.2.1–15.2.4.
[30] S. Rangan, N. Mielke, E.C.C. Yeh, Universal recovery behavior of negative biastemperature instability, IEEE Int. Electron Dev. Meeting (IEDM) Tech Dig, 2003, p.341.
[31] H. Reisinger, O. Blank, W. Heinrigs, A. Mühlhoff, W. Gustin, C. Schlünder, Analysisof NBTI degradation- and recovery-behavior based on ultra fast VT-measurements,Proc. Int. Reliab. Phys. Symp. (IRPS), 2006, p. 448.
[32] Z. Ji, J.F. Zhang, M.H. Chang, B. Kaczer, G. Groeseneken, An analysis of the NBTI-induced threshold voltage shift evaluated by different techniques, IEEE Trans.Electron Dev. 56 (5) (2009) 1086–1093.
[33] B. Kaczer, T. Grasser, Ph.J. Roussel, J. Martin-Martinez, R. O'Connor,B.J. O'Sullivan, G. Groeseneken, Ubiquitous relaxation in BTI stressing—new eva-luation and insights, Proc. Int. Reliab. Phys. Symp. (IRPS), 2008, pp. 20–27.
[34] B. Kaczer, T. Grasser, Ph.J. Roussel, J. Franco, R. Degraeve, L.-A. Ragnarsson,E. Simoen, G. Groeseneken, H. Reisinger, Origin of NBTI variability in deeply scaledpFETs, Proc. Int. Reliab. Phys. Symp. (IRPS), 2010, pp. 26–32.
w1
w2
w3
Vth
VG
t
Vth
t
t
(b)
(a)
(c)
Fig. 14. (a) The workload on each device in a circuit can be approximated by a series ofphases wi with duration ts, voltage VG, duty factor DF, frequency f, and temperature T. (Inreality, the number of workload phases is typically very large.) (b) For the given work-load, the mean degradation ΔVth(t) can be calculated, allowing in turn to obtain the fullΔVth distribution, which can be readily used in circuit analysis. (c) Alternatively, occu-pancy of individual traps and their impact on a circuit can be evaluated as a function of theworkload and time.
B. Kaczer et al. Microelectronics Reliability 81 (2018) 186–194
193

[35] T. Grasser, H. Reisinger, P.-J. Wagner, F. Schanovsky, W. Goes, B. Kaczer, The timedependent defect spectroscopy (TDDS) for the characterization of the bias tem-perature instability, Proc. Int. Reliab. Phys. Symp. (IRPS), 2010, pp. 16–25.
[36] T. Grasser, K. Rott, H. Reisinger, M. Waltl, F. Schanovsky, B. Kaczer, NBTI in na-noscale MOSFETs—the ultimate modeling benchmark, IEEE Trans. Electron. Dev.61 (11) (2014) 3586–3593.
[37] J. Chen, T. Tanamoto, H. Noguchi, Y. Mitani, Further investigations on traps sta-bilities in random telegraph signal noise and the application to a novel conceptphysical unclonable function (PUF) with robust reliabilities, Symp. VLSI Technol,2015.
[38] G. Wirth, R. da Silva, P. Srinivasan, J. Krick, R. Brederlow, Statistical model forMOSFET low-frequency noise under cyclo-stationary conditions, IEEE Int. ElectronDev. Meeting (IEDM) Tech Dig, 2009, p. 715.
[39] M. Toledano-Luque, B. Kaczer, P.J. Roussel, T. Grasser, G.I. Wirth, J. Franco,C. Vrancken, N. Horiguchi, G. Groeseneken, Response of a single trap to AC nega-tive bias temperature stress, Proc. Int. Reliab. Phys. Symp. (IRPS), 2011, pp. 1–8.
[40] M. Toledano-Luque, et al., Temperature and voltage dependences of the capture andemission times of individual traps in high-k dielectrics, Microelectron. Eng. 88 (7)(2011) 1243–1246.
[41] T. Grasser, K. Rott, H. Reisinger, P.-J. Wagner, W. Goes, F. Schanovsky, M. Waltl,M. Toledano-Luque, B. Kaczer, Advanced characterization of oxide traps: the dy-namic time-dependent defect spectroscopy, Proc. IEEE Int. Reliab. Phys. Symp.(IRPS), 2013 (pp. 2D.2.1–2D.2.7).
[42] B. Kaczer, C. Chen, P. Weckx, Ph.J. Roussel, M. Toledano-Luque, J. Franco, M. Cho,J. Watt, K. Chanda, G. Groeseneken, T. Grasser, Maximizing reliable performance ofadvanced CMOS circuits—a case study, Proc. Int. Reliab. Phys. Symp. (IRPS), 2014,p. 2D.4.1.
[43] T. Grasser, et al., On the microscopic structure of hole traps in pMOSFETs, IEEE Int.Electron Dev. Meeting (IEDM) Tech Dig, 2014.
[44] T. Grasser, T. Aichinger, G. Pobegen, H. Reisinger, P.-J. Wagner, J. Franco,M. Nelhiebel, B. Kaczer, The ‘permanent’ component of NBTI: composition andannealing, Proc. Int. Reliab. Phys. Symp. (IRPS), 2011, pp. 605–613.
[45] K. Huang, A. Rhys, Theory of light absorption and non-radiative transitions in F-centres, Proc. R. Soc. A 204 (1950) 406–423.
[46] C.H. Henry, D.V. Lang, Nonradiative capture and recombination by multiphononemission in GaAs and GaP, Phys. Rev. B 15 (2) (1977) 989–1016.
[47] W.B. Fowler, J.K. Rudra, M.E. Zvanut, F.J. Feigl, Hysteresis and Franck-Condonrelaxation in insulator-semiconductor tunneling, Phys. Rev. B 41 (12) (1990)8313–8317.
[48] A. Avellán, D. Schroeder, W. Krautschneider, Modeling random telegraph signals inthe gate current of metal-oxide-semiconductor field effect transistors after oxidebreakdown, J. Appl. Phys. 94 (1) (2003) 703–708.
[49] G. Rzepa, M. Waltl, W. Goes, B. Kaczer, T. Grasser, Microscopic oxide defectscausing BTI, RTN, and SILC on high-k FinFETs, Int. Conf. Sim. Semicond. ProcessesDevices (SISPAD), 2015.
[50] L. Gerrer, J. Ding, S.M. Amoroso, F. Adamu-Lema, R. Hussin, D. Reid, C. Millar,A. Asenov, Modelling RTN and BTI in nanoscale MOSFETs from device to circuit: areview, Microelectron. Reliab. 54 (4) (2014) 682–697.
[51] G. Rzepa, W. Goes, G. Rott, K. Rott, M. Karner, C. Kernstock, B. Kaczer, H. Reisinger,T. Grasser, Physical modeling of NBTI: from individual defects to devices, Int. Conf.Sim. Semicond. Processes Devices (SISPAD), 2014, pp. 81–84.
[52] W. Goes, M. Toledano-Luque, O. Baumgartner, M. Bina, F. Schanovsky, B. Kaczer,T. Grasser, Understanding correlated drain and gate current fluctuations, Proc. ofInt. Symp. Phys. Failure and Analysis Integrated Circuits (IPFA), 2013, pp. 51–56.
[53] Bury Erik, R. Degraeve, M. Cho, B. Kaczer, W. Goes, T. Grasser, N. Horiguchi,G. Groeseneken, Study of (correlated) trap sites in SILC, BTI and RTN in SiON andHKMG devices, Proc. of Int. Symp. Phys. Failure and Analysis Integrated Circuits(IPFA), 2013, pp. 250–253.
[54] K. Sonoda, K. Ishikawa, T. Eimori, O. Tsuchiya, Discrete dopant effects on statisticalvariation of random telegraph signal magnitude, IEEE Trans. Electron Dev. 54 (8)(2007) 1918–1925.
[55] J. Franco, B. Kaczer, M. Toledano-Luque, M.F. Bukhori, Ph.J. Roussel, J. Mitard, L.-Å. Ragnarsson, L. Witters, T. Chiarella, M. Togo, N. Horiguchi, T. Grasser,A. Asenov, G. Groeseneken, Impact of single charged gate oxide defects on theperformance and scaling of nanoscaled FETs, Proc. Int. Reliab. Phys. Symp. (IRPS),
2012, p. 5A.4.1.[56] B. Kaczer, S.M. Amoroso, R. Hussin, A. Asenov, J. Franco, P. Weckx, Ph.J. Roussel,
G. Rzepa, T. Grasser, N. Horiguchi, On the distribution of the FET threshold voltageshifts due to individual charged gate oxide defects, IEEE Int. Integrated ReliabilityWorkshop (IIRW) Final Report, 2016, pp. 18–20.
[57] B. Kaczer, et al., Benchmarking time-dependent variability of junctionless nanowireFETs, Proc. Int. Reliab. Phys. Symp. (IRPS), 2017 (pp. 2D-6.1–2D-6.7).
[58] B. Kaczer, Ph.J. Roussel, T. Grasser, G. Groeseneken, Statistics of multiple trappedcharges in the gate oxide of deeply scaled MOSFET devices—application to NBTI,IEEE Electron Dev. Lett. 31 (5) (2010) 411–413.
[59] M. Toledano-Luque, B. Kaczer, J. Franco, Ph.J. Roussel, M. Bina, T. Grasser, M. Cho,P. Weckx, G. Groeseneken, Degradation of time dependent variability due to in-terface state generation, Symp. VLSI Technol. (2013) (pp. T190–T191).
[60] B. Kaczer, et al., The defect-centric perspective of device and circuit reliability—-from gate oxide defects to circuits, Solid State Electron. 125 (2016) 52–62.
[61] M. Simicic, A. Subirats, P. Weckx, B. Kaczer, J. Franco, P. Roussel, D. Linten,A. Thean, G. Groeseneken, G. Gielen, Comparative experimental analysis of time-dependent variability using a transistor test array, Proc. Int. Reliab. Phys. Symp.(IRPS), 2016 (pp. XT-10-1–XT-10-6).
[62] B. Kaczer, J. Franco, Ph.J. Roussel, G. Groeseneken, T. Chiarella, N. Horiguchi,Tibor Grasser, Extraction of the random component of time-dependent variabilityusing matched pairs, IEEE Electron Dev. Lett. 36 (4) (2015) 300–302.
[63] R. Degraeve, G. Groeseneken, R. Bellens, M. Depas, H.E. Maes, A consistent modelfor the thickness dependence of intrinsic breakdown in ultra-thin oxides, IEEE Int.Electron Dev. Meeting (IEDM) Tech. Dig, 1995, p. 863.
[64] C. Prasad, M. Agostinelli, J. Hicks, S. Ramey, C. Auth, K. Mistry, S. Natarajan,P. Packan, I. Post, S. Bodapati, M. Giles, S. Gupta, S. Mudanai, K. Kuhn, Bias tem-perature instability variation on SiON/Poly, HK/MG and trigate architectures, Proc.IEEE Int. Reliab. Phys. Symp. (IRPS), 2014 (pp. 6A.5.1–6A.5.7).
[65] B. Kaczer, et al., The defect-centric perspective of device and circuit reliability—-from individual defects to circuits, 45th European Solid State Device ResearchConference (ESSDERC), 2015, pp. 218–225.
[66] B. Kaczer, et al., Origins and implications of increased channel hot carrier varia-bility in nFinFETs, Proc. IEEE Int. Reliab. Phys. Symp. (IRPS), 2015 (pp.3B.5.1–3B.5.6).
[67] J. Franco, et al., Statistical model of the NBTI-induced threshold voltage, sub-threshold swing, and transconductance degradations in advanced p-FinFETs, IEEEInt. Electron Dev. Meeting (IEDM) Tech Dig, 2016.
[69] P. Weckx, B. Kaczer, P. Raghavan, J. Franco, M. Simicic, P.J. Roussel, D. Linten,A. Thean, D. Verkest, F. Catthoor, G. Groeseneken, Characterization and simulationmethodology for time-dependent variability in advanced technologies, IEEE CustomIntegrated Circuits Conference (CICC), 2015, pp. 1–8.
[68] C. Monzio Compagnoni, R. Gusmeroli, A.S. Spinelli, A. Visconti, Analytical modelfor the electron-injection statistics during programming of nanoscale NAND flashmemories, IEEE Trans. Electron. Dev. 55 (11) (2008) 3192–3199.
[70] P. Weckx, B. Kaczer, M. Toledano-Luque, P. Raghavan, J. Franco, P.J. Roussel,G. Groeseneken, F. Catthoor, Implications of BTI-induced time-dependent statisticson yield estimation of digital circuits, IEEE Trans. Electron. Dev. 61 (3) (2014)666–673.
[71] P. Weckx, B. Kaczer, H. Kukner, Ph.J. Roussel, P. Raghavan, F. Catthoor,G. Groeseneken, Non-Monte-Carlo methodology for high-sigma simulations of cir-cuits under workload-dependent BTI degradation—application to 6T SRAM, Proc.Int. Reliab. Phys. Symp. (IRPS), 2014 (pp. 5D.2.1–5D.2.6).
[72] D. Rodopoulos, P. Weckx, M. Noltsis, F. Catthoor, D. Soudris, Atomistic pseudo-transient BTI simulation with inherent workload memory, IEEE Trans. DeviceMater. Reliab. 14 (2) (2014) 704–714.
[73] D. Stamoulis, et al., Capturing true workload dependency of BTI-induced de-gradation in CPU components, Proc. Great Lakes Symposium on VLSI(GLSVLSI2016), 2016, pp. 373–376.
[74] B. Kaczer, S. Mahato, V. Valduga de Almeida Camargo, M. Toledano-Luque,Ph.J. Roussel, T. Grasser, F. Catthoor, P. Dobrovolny, P. Zuber, G. Wirth,G. Groeseneken, Atomistic approach to variability of bias-temperature instability incircuit simulations, Proc. IEEE Int. Reliab. Phys. Symp. (IRPS), 2011, pp.XT.3.1–XT.3.5.
B. Kaczer et al. Microelectronics Reliability 81 (2018) 186–194
194