a data driven company how deloitte transformed...
TRANSCRIPT

A Data Driven Company
QlikView Business Discovery World Tour
Eindhoven, 9 October 2013
How Deloitte transformed itself
© 2013 Deloitte The Netherlands
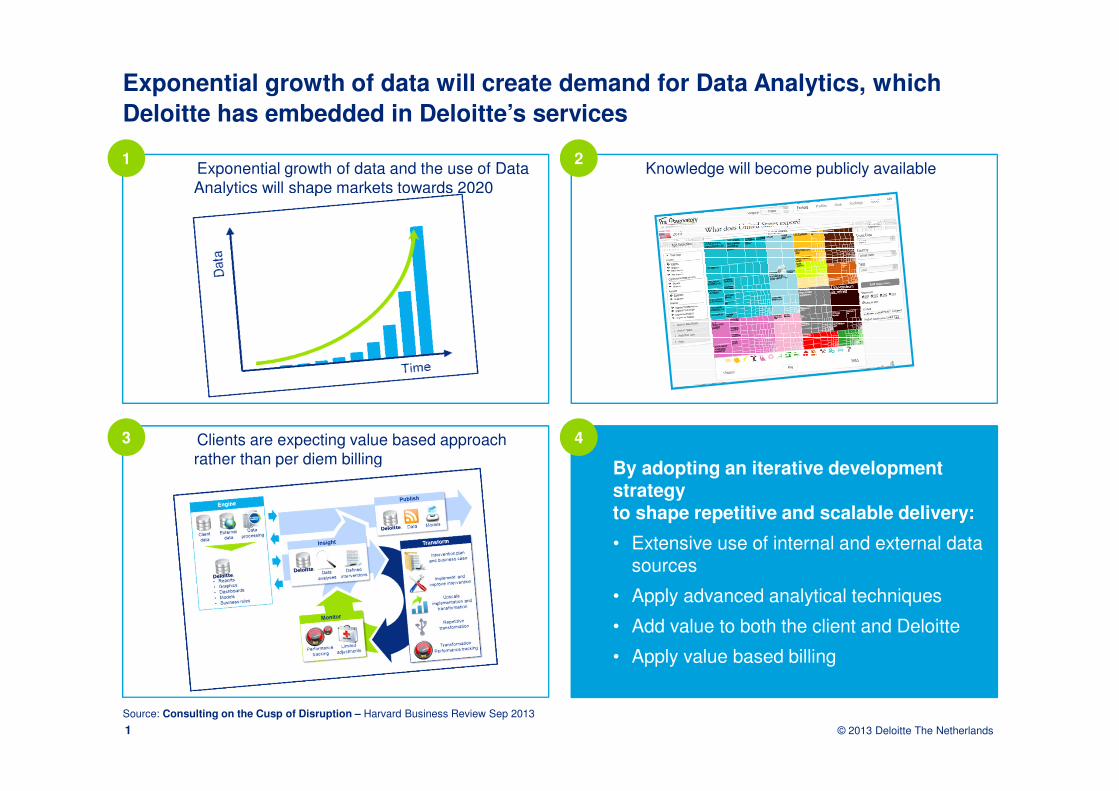
Exponential growth of data and the use of Data Analytics will shape markets towards 2020
Knowledge will become publicly available
Exponential growth of data will create demand for Data Analytics, which
Deloitte has embedded in Deloitte’s services
1
By adopting an iterative development strategyto shape repetitive and scalable delivery:
• Extensive use of internal and external data sources
• Apply advanced analytical techniques
• Add value to both the client and Deloitte
• Apply value based billing
Clients are expecting value based approach rather than per diem billing
Source: Consulting on the Cusp of Disruption – Harvard Business Review Sep 2013
3
1
4
2
© 2013 Deloitte The Netherlands
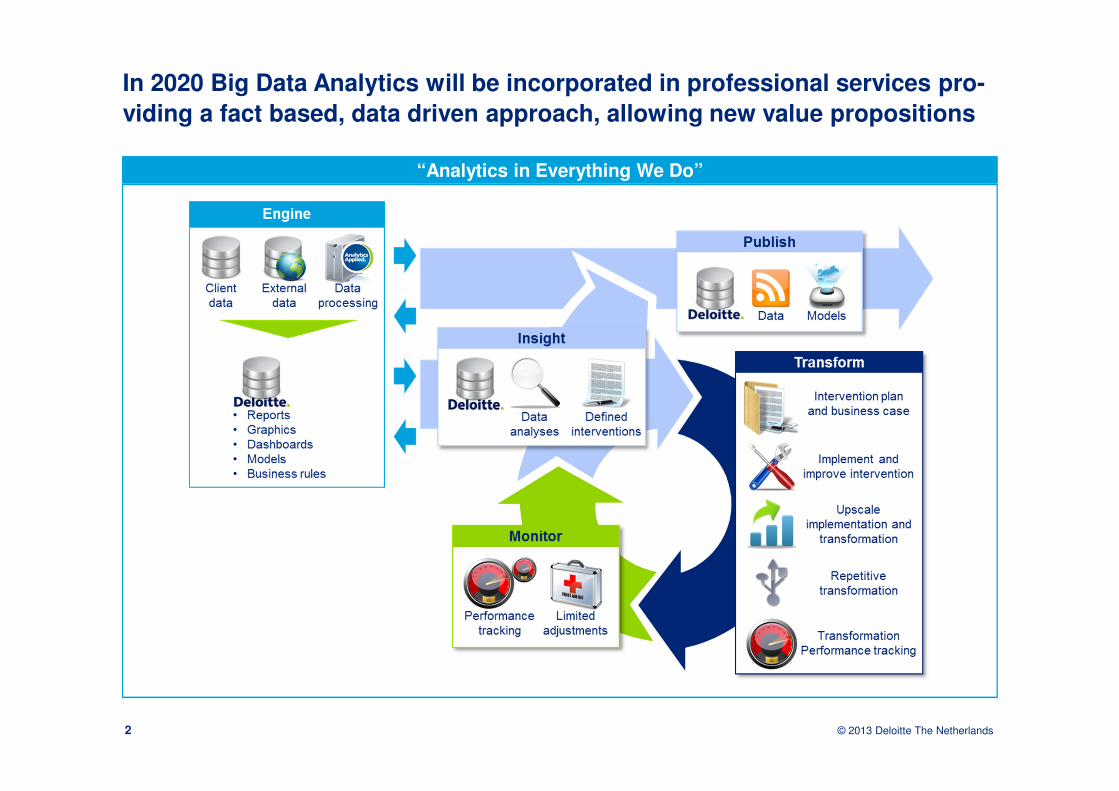
In 2020 Big Data Analytics will be incorporated in professional services pro-
viding a fact based, data driven approach, allowing new value propositions
2
“Analytics in Everything We Do”

© 2013 Deloitte The Netherlands
Deloitte Innovation is developing ground-breaking, proprietary analytics use-cases to support disruptive business propositions
Deloitte Mega Data Analytics Cloud is providing a flexible/agile infrastructure to support both projects and subscription-based analytics.
Deloitte HIVE brings specialized, high-end big data visualization capabilities to support strategic analysis
Our innovation and investment roadmap is aligned with our big data
analytics strategy
3
Managing internal data sets and Acquisition of external datasets to support rich big data analytics
3
1
4
2
© 2013 Deloitte The Netherlands
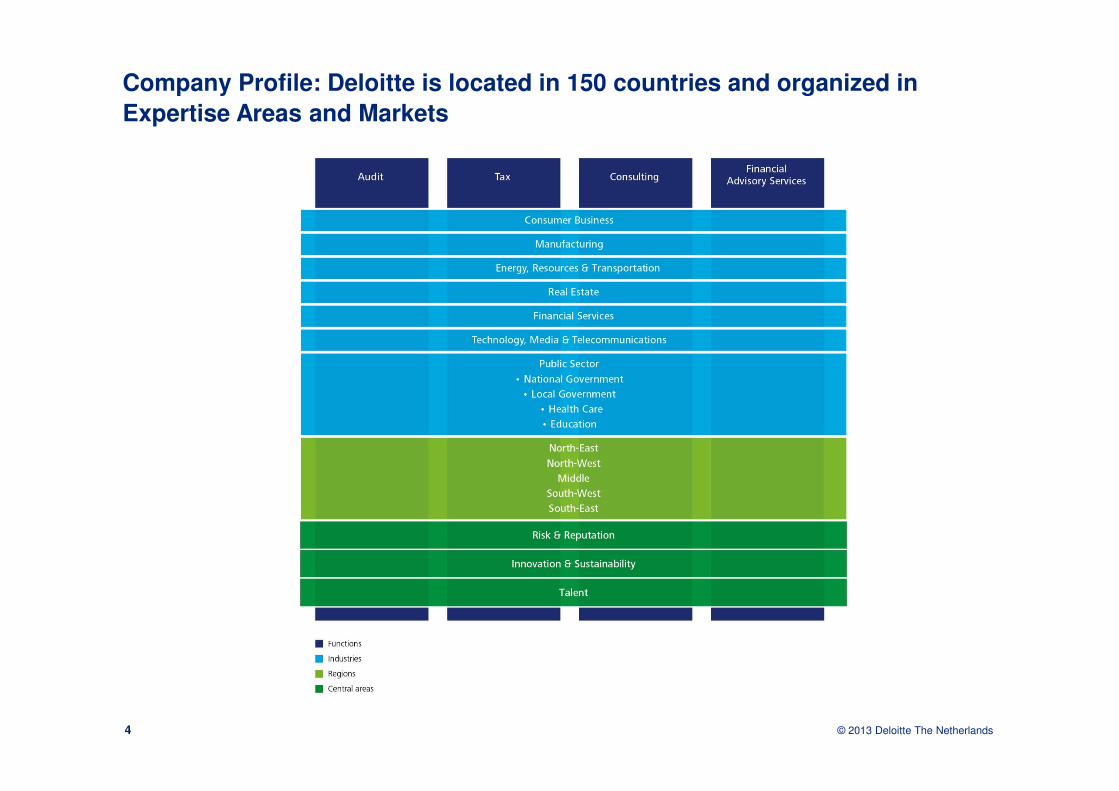
Company Profile: Deloitte is located in 150 countries and organized in
Expertise Areas and Markets
4
Example:Growth Enterprises Emerging
Markets (GEM) solution

© 2013 Deloitte The Netherlands
GEM Solution
Deloitte’s Growth Enterprises Emerging Markets (GEM) solution offers insights in the possibilities for a company to expand to new markets
Input Output
Questionnaire on Client specifics
• Industry specific
Deloitte knowhow
• Industry specific insights
• Customer demand
• Tax regulations between countries
• Country specific risks
Open databases
• GDP developments
• Ease of doing business
• Industry specific indicators
Company Readiness
• Organisational readiness
• Product/Service readiness
Preliminary market scan
• Export from participating countries to all countries
• Tailored to company, industry and origin country
Country Factsheet
• Client Specific factsheet
• Starting point for sales
Modular Setup
Easy to use interface
Build in QlikView
6
© 2013 Deloitte The Netherlands
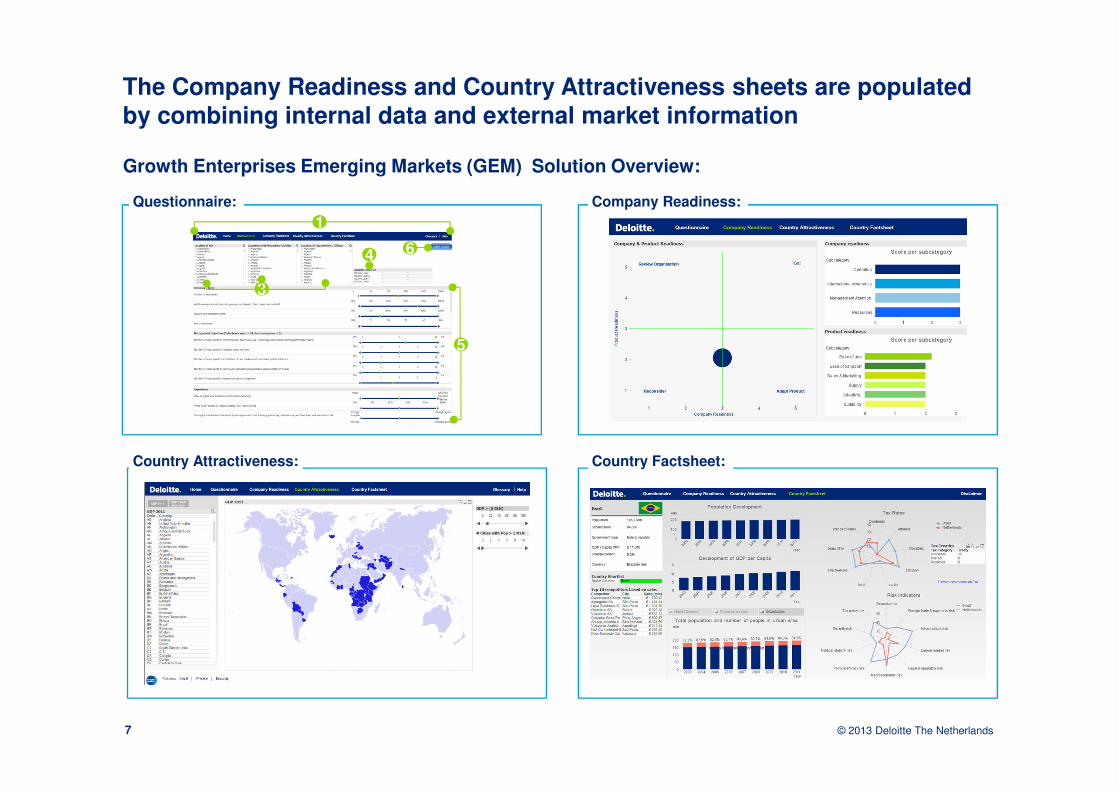
The Company Readiness and Country Attractiveness sheets are populatedby combining internal data and external market information
7
Questionnaire:
Country Attractiveness:
Growth Enterprises Emerging Markets (GEM) Solution Overview:
Company Readiness:
Country Factsheet:
2
3
5
4 6
1
© 2013 Deloitte The Netherlands
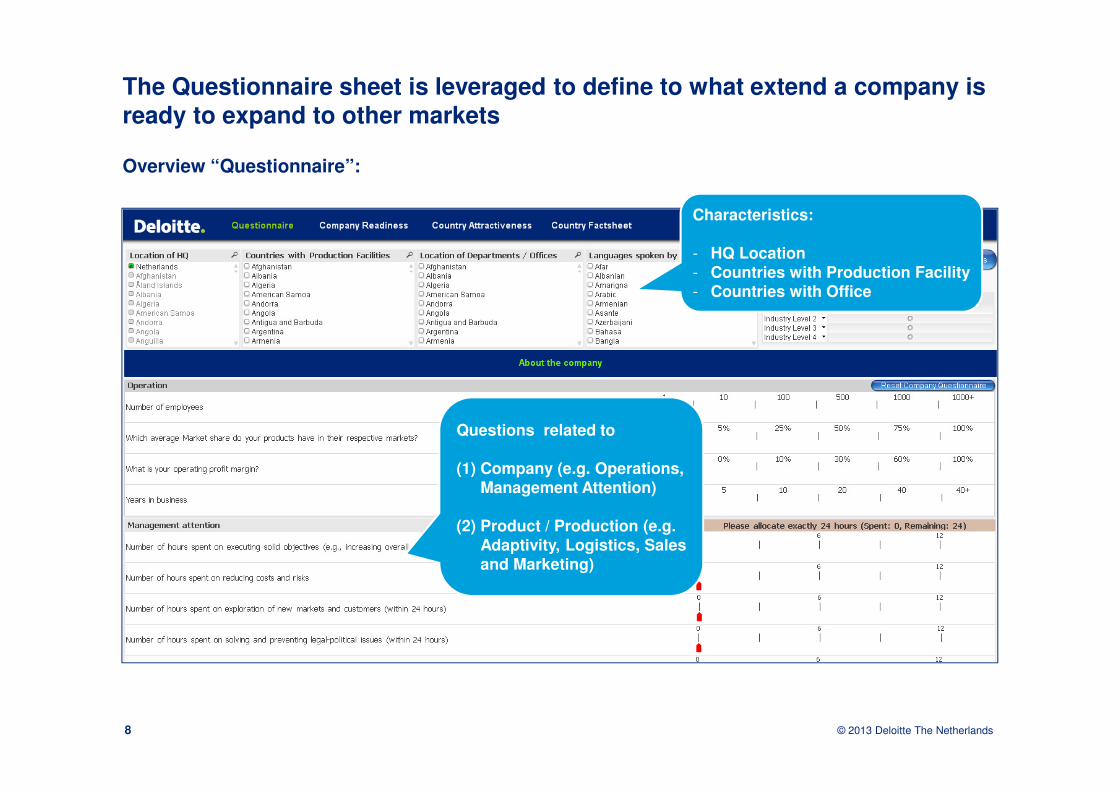
The Questionnaire sheet is leveraged to define to what extend a company is ready to expand to other markets
8
Questions related to
(1) Company (e.g. Operations, Management Attention)
(2) Product / Production (e.g. Adaptivity, Logistics, Sales and Marketing)
Characteristics:
- HQ Location- Countries with Production Facility- Countries with Office
Overview “Questionnaire”:
© 2013 Deloitte The Netherlands
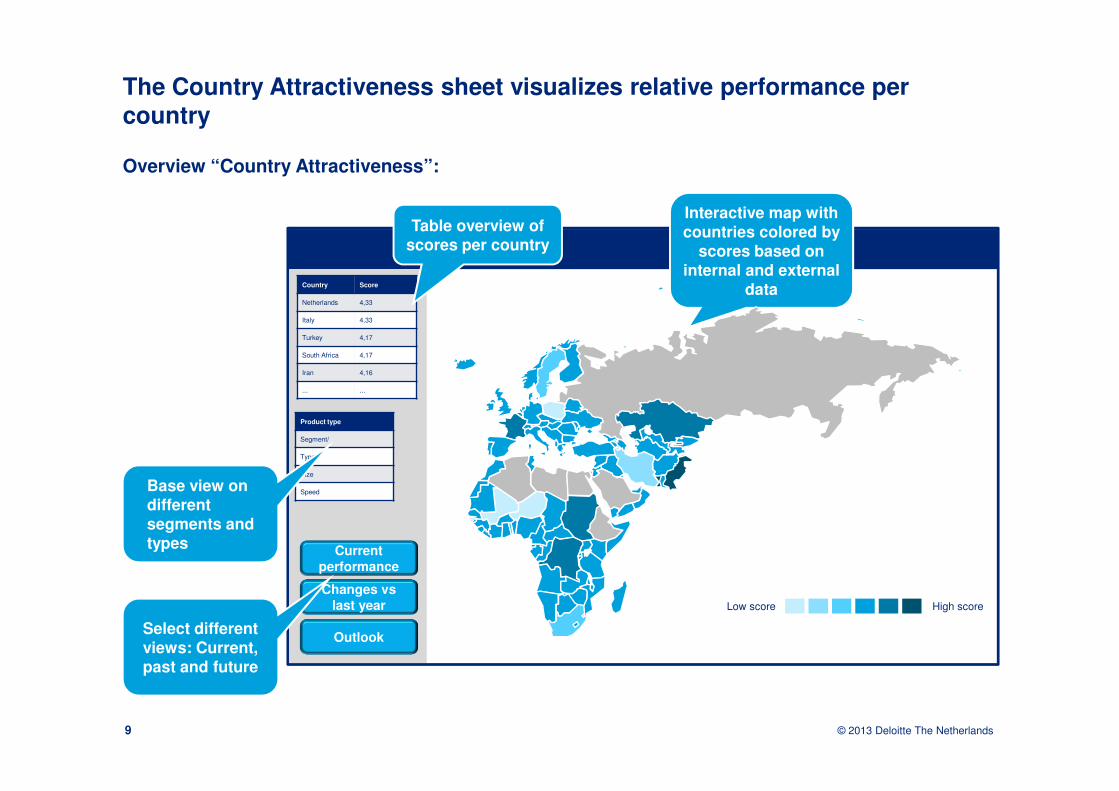
The Country Attractiveness sheet visualizes relative performance per country
9
Low score High score
Overview “Country Attractiveness”:
Country Score
Netherlands 4,33
Italy 4,33
Turkey 4,17
South Africa 4,17
Iran 4,16
... ...
Interactive map with countries colored by
scores based on internal and external
data
Current
performance
Changes vs
last year
Outlook
Table overview of scores per country
Product type
Segment/
Type
Size
SpeedBase view on different segments and types
Select different views: Current, past and future

© 2013 Deloitte The Netherlands
The Country Fact sheet offers detailed country information, providing an instant and comprehensive overview on the local market situation
10
Overview “Country Fact Sheet”:
Local risks, taxes, quality of networks
Country Macro developments
0
1
2
3
4
5
Population 311
Urbanization 78%
GDP 4,33
Unemployme
nt
9
Currency US dollar
Government
type
...
... ...
Marketsharedevelopment
Sales by product, distributor,
segment
Market developments over
time
Relative Performance compared to
similar countries
Table overview of demographic
factors of selected country
Product type
Segment/
Type
Size
Speed
Base view on different segments and types
© 2013 Deloitte The Netherlands
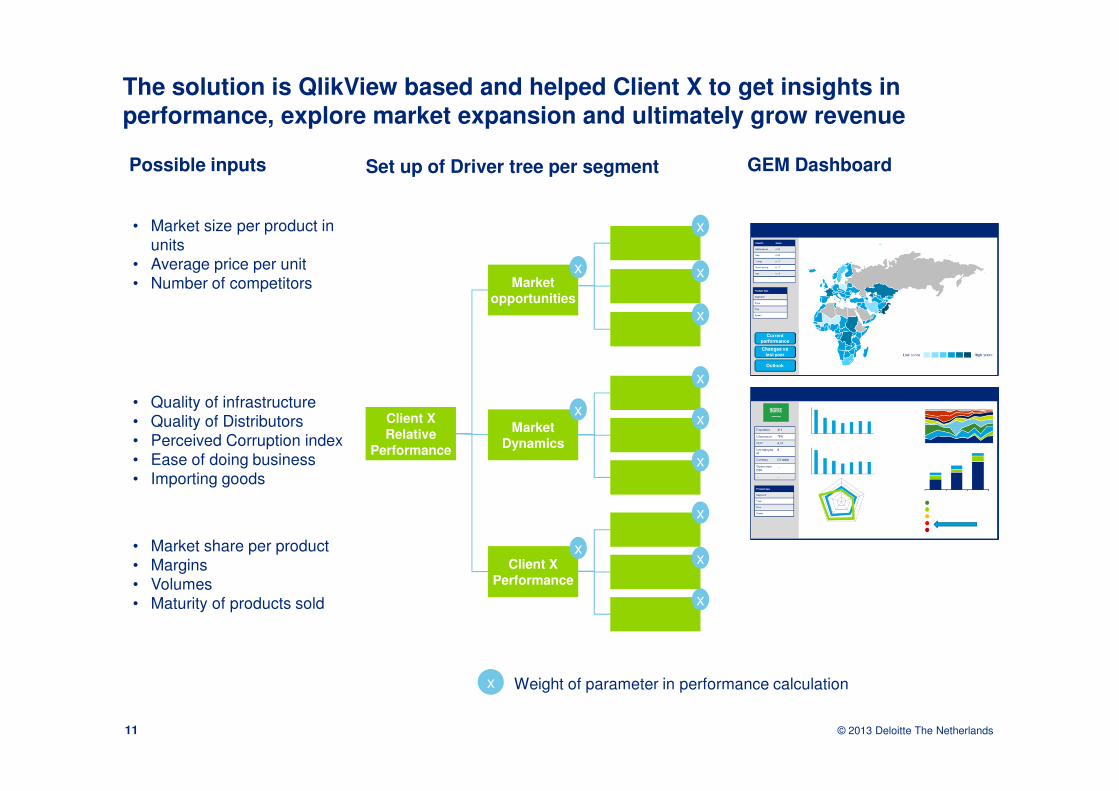
The solution is QlikView based and helped Client X to get insights in performance, explore market expansion and ultimately grow revenue
11
Set up of Driver tree per segmentPossible inputs
• Market size per product in
units• Average price per unit• Number of competitors
• Market share per product• Margins• Volumes• Maturity of products sold
• Quality of infrastructure• Quality of Distributors• Perceived Corruption index• Ease of doing business• Importing goods
x Weight of parameter in performance calculation
Client X
Relative
Performance
Market
opportunities
Market
Dynamics
Client X
Performance
x
x
x
x
x
x
x
x
x
x
x
x
GEM Dashboard
Example:Analytics for Global Mobility
© 2013 Deloitte The Netherlands
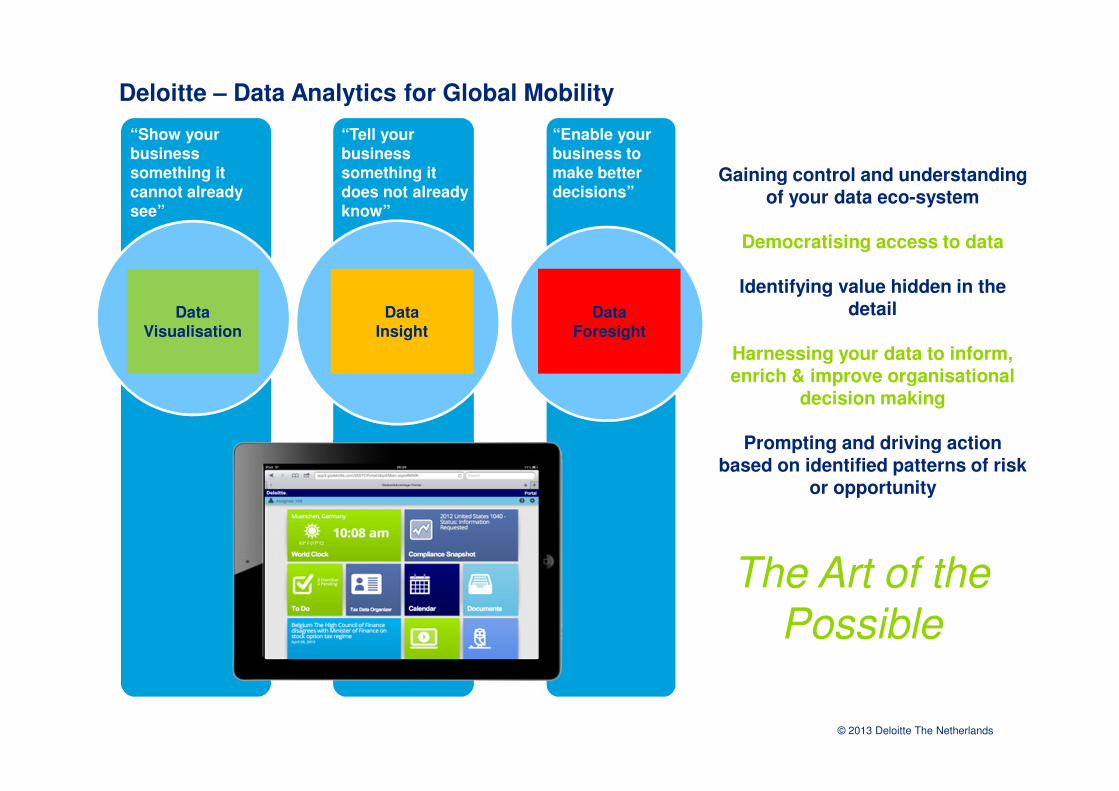
Data Insight
Data Visualisation
DataForesight
“Show your business something it
cannot already see”
“Tell your business something it does not already know”
“Enable your business to make better decisions”
Deloitte – Data Analytics for Global Mobility
Gaining control and understanding of your data eco-system
Democratising access to data
Identifying value hidden in the detail
Harnessing your data to inform, enrich & improve organisational
decision making
Prompting and driving action based on identified patterns of risk
or opportunity
The Art of the
Possible

© 2013 Deloitte The Netherlands
Business Travel Analyser
Business Travel Analyser
A fresh, global approach to the management and analysis of travel and other data sources to drive automated tax assessment, risk management and cost reduction whilst minimising traveler input
Data Acquisition
Data Analysis
ReportingTransform data into
action
Deloitte has a unique perspective on the age-old problem of tracking and reporting business travelers. We remove the traveler from the equation by sourcing, cleaning and importing vast amounts of data from our clients’ and their vendors’ systems and leveraging this for a number of use cases:
� Automated identification of taxable travelers using our proprietary global tax engine
� Social tax and corporate PE tax risk identification
� Immigration risk tracking according to parameters agreed with our clients
� Travel expense cost analysis, policy exception monitoring and fraud detection
� Strategic view of travel patterns for better short term project and workforce planning
� Integration with workflow tools to manage downstream regulatory compliance
© 2013 Deloitte The Netherlands
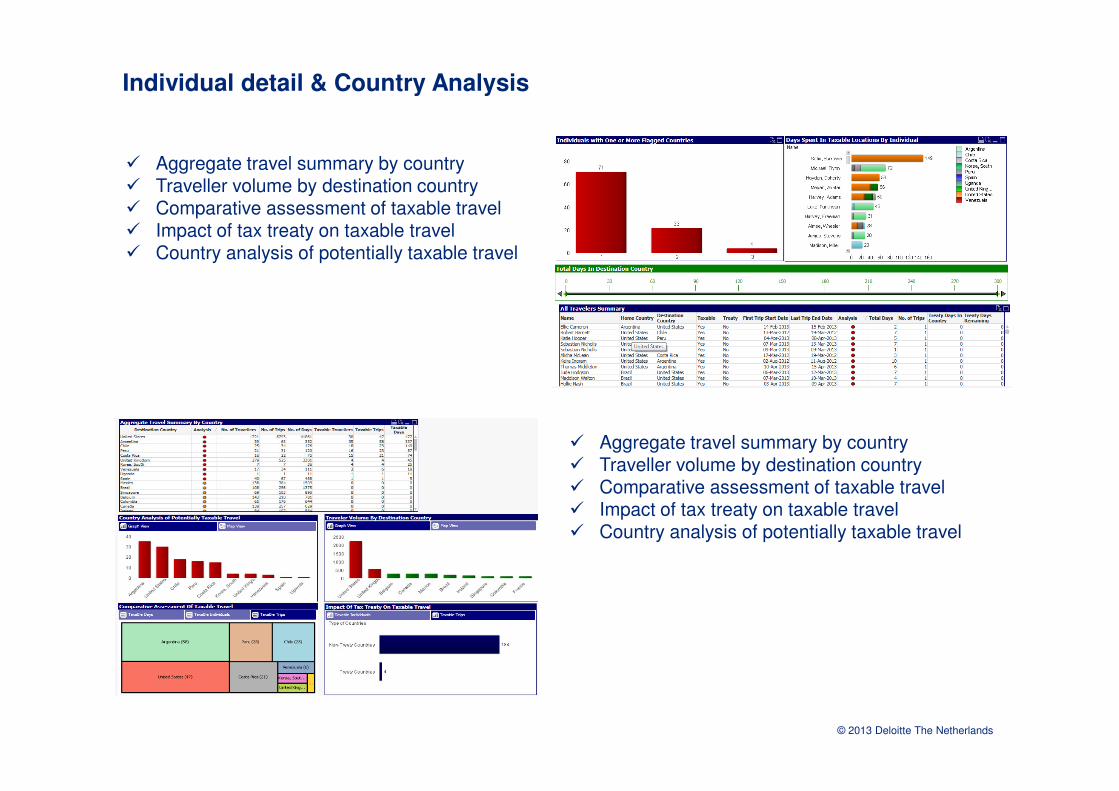
Individual detail & Country Analysis
� Aggregate travel summary by country� Traveller volume by destination country� Comparative assessment of taxable travel� Impact of tax treaty on taxable travel� Country analysis of potentially taxable travel
� Aggregate travel summary by country� Traveller volume by destination country� Comparative assessment of taxable travel� Impact of tax treaty on taxable travel� Country analysis of potentially taxable travel
© 2013 Deloitte The Netherlands
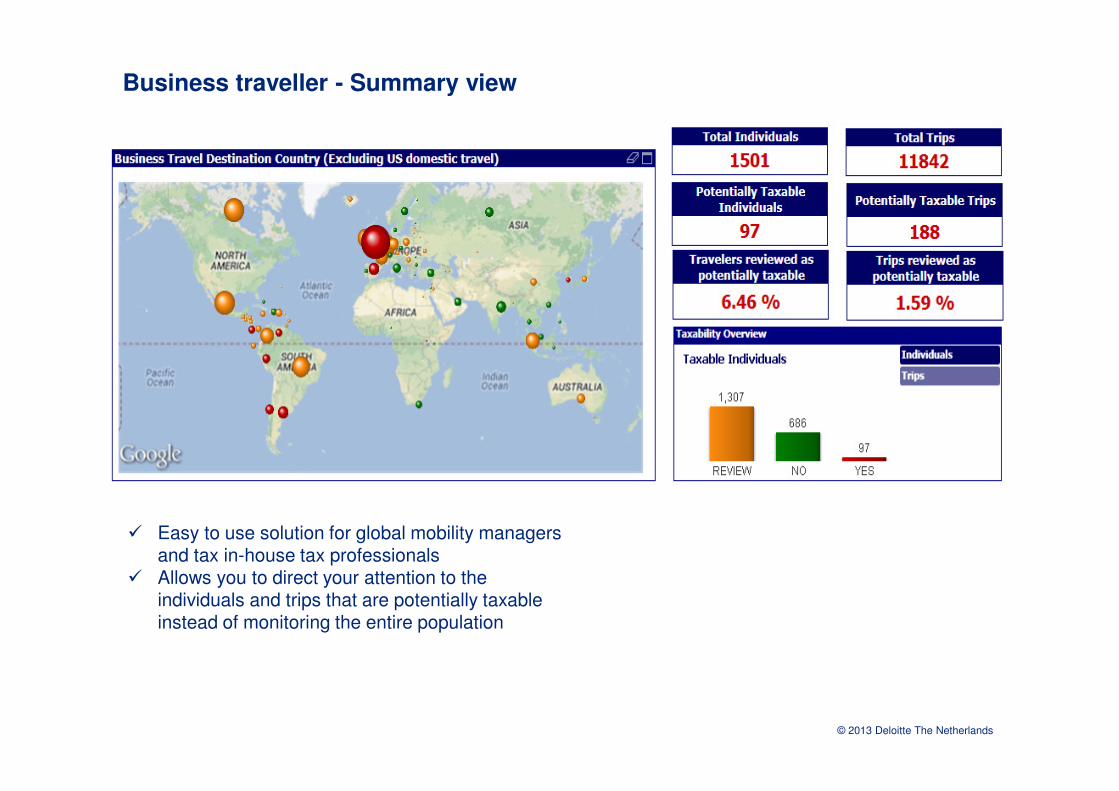
Business traveller - Summary view
� Easy to use solution for global mobility managers and tax in-house tax professionals
� Allows you to direct your attention to the individuals and trips that are potentially taxable instead of monitoring the entire population
Example:(Internal) Audit Analytics
© 2013 Deloitte The Netherlands18
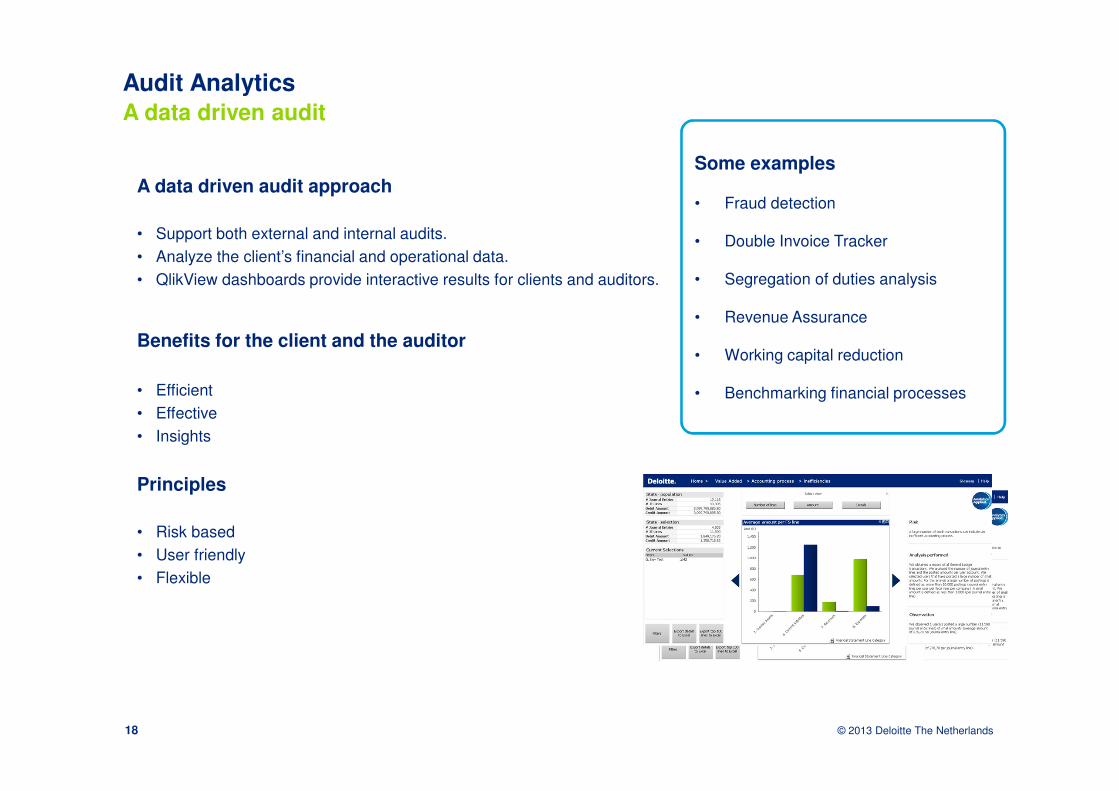
A data driven audit approach
• Support both external and internal audits.
• Analyze the client’s financial and operational data.
• QlikView dashboards provide interactive results for clients and auditors.
Benefits for the client and the auditor
• Efficient
• Effective
• Insights
Principles
• Risk based
• User friendly
• Flexible
Audit Analytics
A data driven audit
Some examples
• Fraud detection
• Double Invoice Tracker
• Segregation of duties analysis
• Revenue Assurance
• Working capital reduction
• Benchmarking financial processes
© 2013 Deloitte The Netherlands
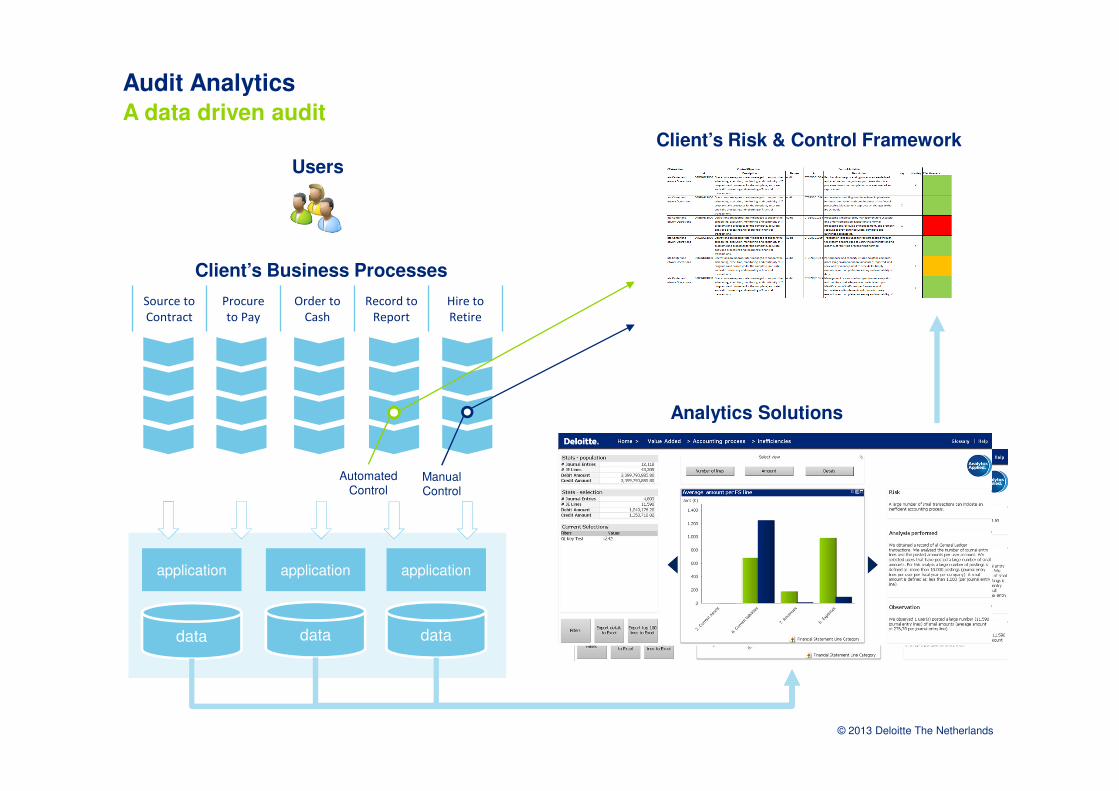
data
Client’s Business Processes
application
Users
Automated Control
Client’s Risk & Control Framework
ManualControl
Analytics Solutions
Source to
Contract
Procure
to Pay
Order to
Cash
Record to
Report
Hire to
Retire
application application
data data
Audit Analytics
A data driven audit
© 2013 Deloitte The Netherlands20
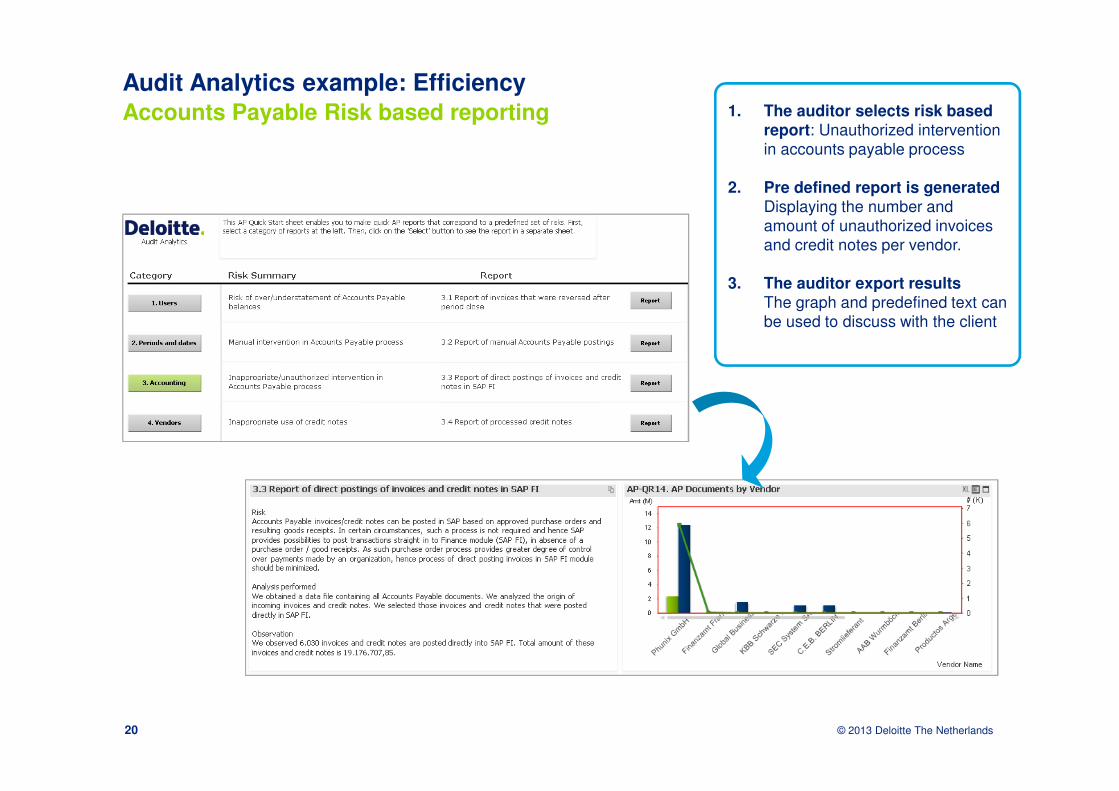
Audit Analytics example: Efficiency
Accounts Payable Risk based reporting 1. The auditor selects risk based report: Unauthorized intervention in accounts payable process
2. Pre defined report is generatedDisplaying the number and amount of unauthorized invoices
and credit notes per vendor.
3. The auditor export resultsThe graph and predefined text can be used to discuss with the client
© 2013 Deloitte The Netherlands21
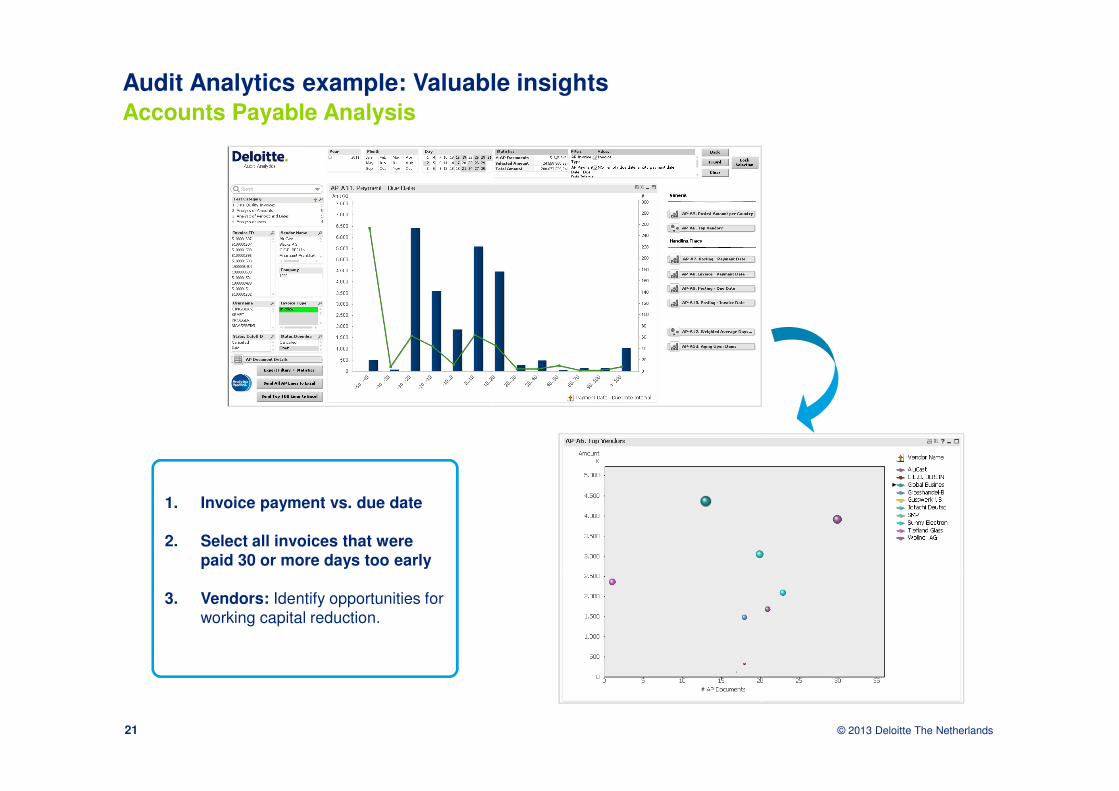
Audit Analytics example: Valuable insights
Accounts Payable Analysis
1. Invoice payment vs. due date
2. Select all invoices that were paid 30 or more days too early
3. Vendors: Identify opportunities for working capital reduction.
© 2013 Deloitte The Netherlands
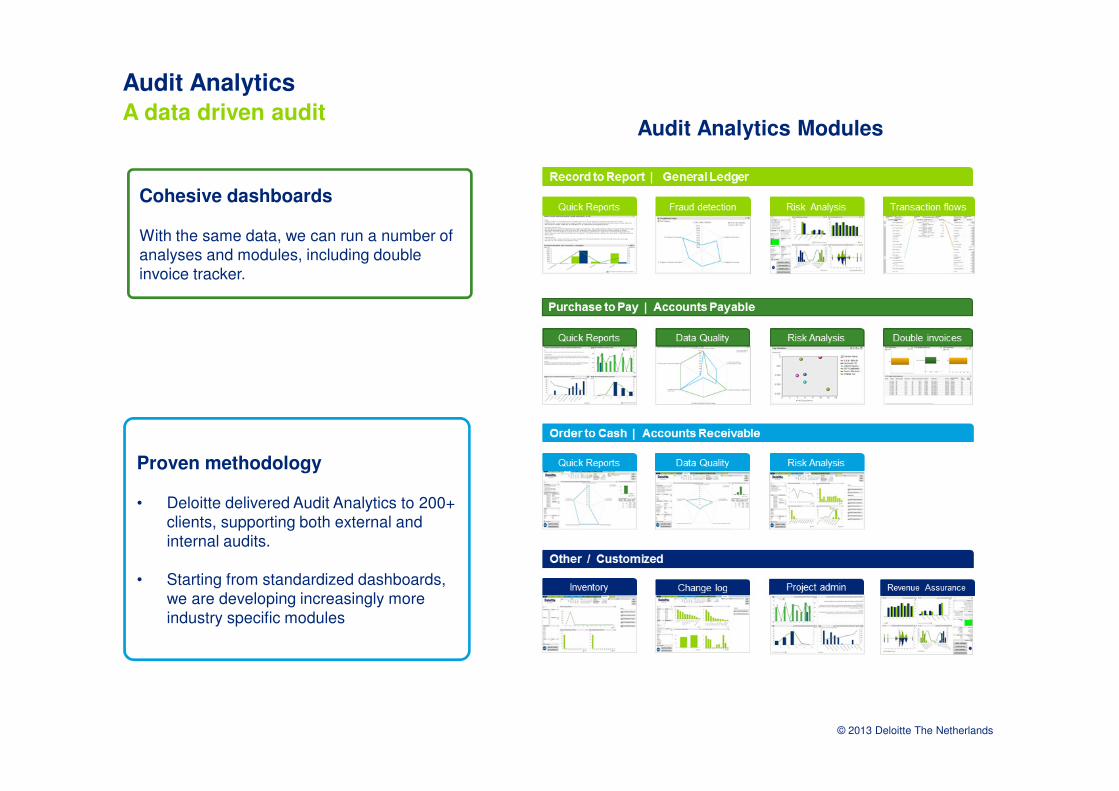
Audit Analytics
A data driven audit
Cohesive dashboards
With the same data, we can run a number of analyses and modules, including double invoice tracker.
Proven methodology
• Deloitte delivered Audit Analytics to 200+ clients, supporting both external and internal audits.
• Starting from standardized dashboards, we are developing increasingly more industry specific modules
Audit Analytics Modules
© 2013 Deloitte The Netherlands
Deloitte refers to one or more of Deloitte Touche Tohmatsu Limited, a UK private company limited by guarantee, and its network of member firms, each of which is a legally separate and independent entity. Please see www.deloitte.com/about for a detailed description of the legal structure of Deloitte Touche Tohmatsu Limited and its member firms.
Deloitte provides audit, tax, consulting, and financial advisory services to public and private clients spanning multiple industries. With a globally connected network of member firms in more than 150 countries, Deloitte brings world-class capabilities and deep local expertise to help clients succeed wherever they operate. Deloitte's approximately 170,000 professionals are committed to becoming the standard of excellence.
This publication is for internal distribution and use only among personnel of Deloitte Touche Tohmatsu Limited, its member firms, and their related entities (collectively, the “Deloitte Network”). None of the Deloitte Network shall be responsible for any loss whatsoever sustained by any person who relies on this publication.