a parametric study of flapped airfoil lift enhancement by
TRANSCRIPT
VOL. 35, NO. 4 – October - December 2011 TECHNICAL SOARING 125
A Parametric Study of Flapped Airfoil Lift Enhancement
by Vortex Generators
Natalie Souckova and Lukas Popelka
Institute of Thermomechanics, Academy of Sciences of the Czech Republic,
Prague, CZ 182 00, Czech Republic
[email protected], [email protected]
Milan Matejka
Department of Fluid Dynamics and Thermodynamics, FME, Czech Technical University in Prague,
Prague, CZ 166 07, Czech Republic
and
David Simurda
Institute of Thermomechanics, Academy of Sciences of the Czech Republic,
Prague, CZ 182 00, Czech Republic
Presented at the XXX OSTIV Congress, Szeged, Hungary, 28 July - 4 August 2010
Abstract This paper focuses on a suppression of the flow separation, which occurs on a deflected flap, by means of
vortex generators (VGs). An NACA 63A421 airfoil with a simple flap and vane-type vortex generators was
used. The investigation was carried out by using experimental and numerical methods. The data from the
numerical simulation of the flapped airfoil without VGs control were used for the vortex generator design. Two
different sizes and shapes, along with various spacing of the vortex generators, were tested. The flow past the
airfoil was visualized with tuft filaments and oil-flow visualization. The experiments were performed in closed
circuit wind tunnels with closed and open test sections. The lift curves for cases without and with vortex
generators were acquired for the determination of the lift coefficient improvement. The improvement was
achieved for several cases by means of all the applied methods.
Introduction The principle of vortex generator flow control is based on
generation of vortical structures, which transfer the high
momentum fluid towards the surface. The flow with higher
momentum can resist greater unfavorable pressure gradients.
The reduction or suppression of flow separation and the
related reduction in drag results in improved aerodynamic
characteristics, less noise, heat transfer enhancement, etc.
The vortex generators (VGs) can be of different shapes and
sizes. The optimal VG position depends on flow parameters
and flow separation location. This dependency limits the use
of VGs to applications with relatively fixed location of flow
separation. Because vortex generators are mounted in “pairs,”
the relative vortex generators placement in one pair influences
the type of originating vortices, co-rotating or counter-
rotating. The distance between the VGs also is important.
Vortex generators are classified according to the ratio of VG
height, h, and boundary layer height, as conventional
(h/ > 0.5), or low-profile (0.1 < h/ < 0.5). Due to the drag
penalties of conventional VGs, the low-profile VGs are a
subject of interest.
Considerable experimental research on the use of vortex
generators for flow control has been performed. A
comprehensive review of low-profile VGs focuses on basic
research, as well as on airfoil and non-airfoil investigations.1
However, there have not been many numerical simulations
dealing with airfoil section applications. One of the few
studies is concerned with passive and active flow separation
control. Direct numerical simulation (DNS) was used and the
vortex generator was modeled using the immersed-boundary
method.2 Unfortunately, there is a lack of solutions obtained
by commercial codes, and those that are available focus on
heat transfer in a channel.
The main subject of this work is the low-profile VG
control of flow separation on a deflected simple flap of an
NACA 63A421 airfoil. The investigation was carried out
using experimental and numerical methods. In the first step, a
non-control case was solved by means of numerical
simulation to determine the location of flow separation and
the boundary layer thickness. Information obtained from this
calculation was utilized for VG design according to the best
results of an earlier measurement, which dealt with vortex
generator flow control on a bump,3 and to the data for
rectangular vane VG also used on the bump.1 Then VGs were
TECHNICAL SOARING VOL. 35, NO. 4 – October - December 2011 126
applied to the flapped airfoil and their influence on the flow
was investigated using tuft filaments and oil-flow
visualization techniques. Furthermore, the flow control
effectiveness in terms of the lift coefficient was evaluated
from the pressure distribution measurements. All numerical
simulations presented in this paper were carried out using the
commercial code, Fluent. The entire research effort is
described in following sections.
Vortex generator design As is mentioned above, the first undertaking was a
numerical simulation of the baseline without flow control.
This baseline was an NACA 63A421 airfoil with a simple
flap, deflected at zero and 20 degrees, and set at angles of
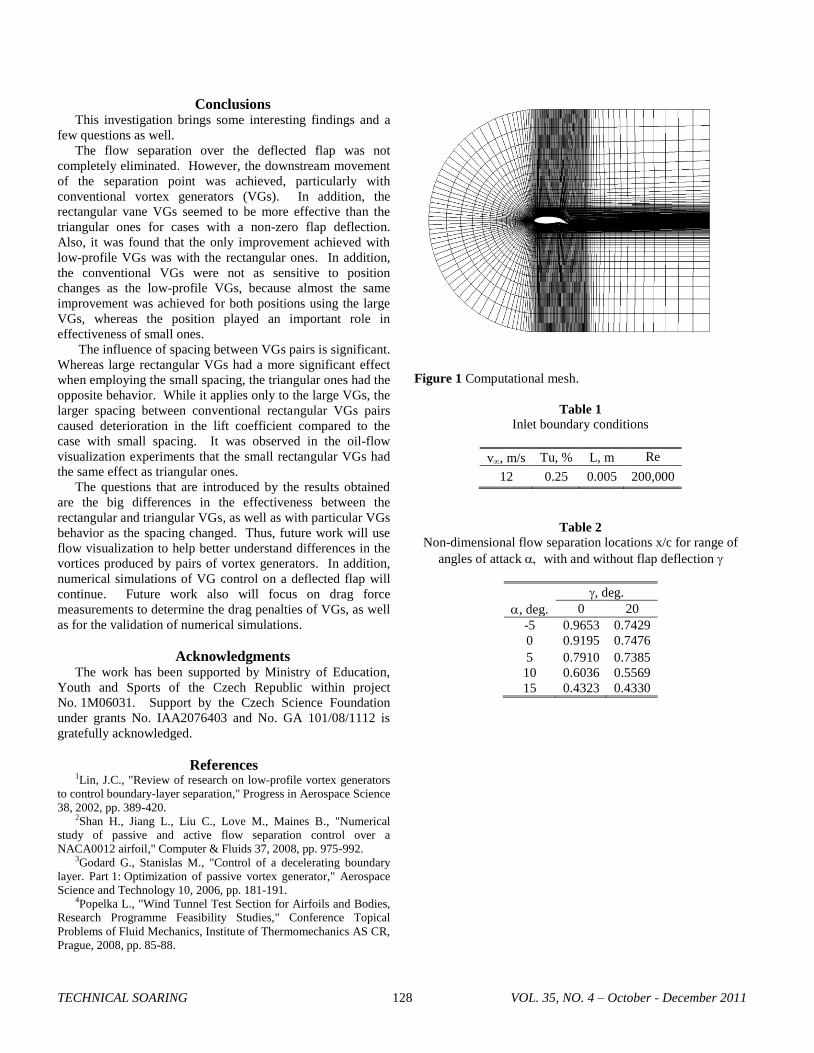
attack from -5 to 15 degrees. The two-dimensional grid
geometries were created in the program Gambit.
Subsequently, the computational structured meshes were set
up for all cases, as shown in Fig. 1. Solutions were obtained
under the assumptions of steady, two-dimensional,
incompressible viscous flow. Turbulence was modeled by
two-equation k- Shear-Stress Transport (SST) model, so
fully turbulent flow was expected. The inlet boundary
conditions, which correspond to the boundary conditions of
the experiment performed in Institute of Thermomechanics
(IT), are defined using the Reynolds number, Re, the free
stream velocity, v, the turbulence intensity, Tu, and the
length scale, L, the values of which are presented in Table 1.
Symmetry conditions were set on the upper and bottom edges
of the computational domain, the pressure-outlet boundary
condition was defined at the outlet of the domain, and
velocity-inlet boundary condition was used for the inlet part.
A second-order, upwind discretization scheme was selected
with respect to the mesh used.
The location of the separation point was identified from
the x-component of the wall shear stress distribution over the
upper surface of the geometry. The boundary condition for
separation point is given by
0w (1)
where w is shear stress.
The separation point locations are summarized in Table 2.
It is obvious that increasing of the angle of attack caused the
separation point to move towards the leading edge at zero flap
deflection. For the deflected flap case, however, the
separation point moved slightly around the edge of the
deflected flap up to an angle of attack of 5 degrees and, for
higher angles, it also moved towards the leading edge.
The location of the separation points and the parameters
defined in Table 3 were used as input data for the VG design.
However, with regard to the small size of the airfoil model
and the corresponding height of boundary layer, the VG
heights and their distances from the separation points were
determined while considering the manufacturing feasibility.
Experiments The efficiency of the VGs to remove, or at least reduce,
the presence of flow separation on a simple deflected flap, as
well as their influence on the flow over the flap were observed
using tufts and oil-flow visualization. In addition, their effect
on the lift was found by integrating measured pressure
distributions to determine lift coefficients as they depend on
the angle of attack.
Wind tunnel, model, and vortex generators Both pressure distribution measurement and tuft filament
visualizations were carried out in the wind tunnel of the
Department of Fluid Dynamics Laboratory of Institute of
Thermomechanics, Academy of Sciences, Czech Republic.
The closed circuit tunnel has a closed test section with
dimensions of 865 mm x 485 mm x 900 mm. Angle of attack
changes are enabled by electrically driven circular endplates.4
Oil flow visualizations were performed in the wind tunnel of
the Division of Fluid Dynamics Laboratory of FME, Czech
Technical University in Prague. The closed circuit tunnel has
an open test section with cross-section dimensions of
750 mm x 550 mm. The tunnel has a turbulence intensity of
3.5% at a free stream velocity of 16 m/s.
The NACA 63A421 airfoil having a simple flap was used.
The model, having chord length 250 mm and span 485 mm,
was fixed between two annular endplates made of transparent
Plexiglas. The flap/chord ratio was 30%. The model was
tested with a zero flap deflection and with a flap deflection of
20 deg.
Triangular and rectangular vane VGs were cut and formed
from plastic sheet material. The VGs heights were chosen as
1.5 mm (small VG) and 3 mm (large VG) for both vane types.
The other dimensions are given by the parameters in Table 3.
The VGs were attached to the model surface such that the
relative position of one vortex generator to the other within a
pair was such that counter-rotating (CtR) vortices were
produced, as shown in Figs. 2 and 3. Two spanwise rows of
VGs were located at the non-dimensional chordwise
locations, (x/c), of x1 = 0.5632 and x2 = 0.65 downstream of
the leading edge. The distance of VGs from the separation
points was not indicated because it changed with the angle of
attack, as shown in Table 2. During the measurements, the
spacing between VGs pairs was changed so that it either
corresponded with parameters in Table 3, (z1), or it was half
of that value, (z2). Low-profile VGs were mentioned earlier;
however, there are some cases where the boundary-layer
height is so small that a VG having the same height is no
longer low-profile. This can happen due to the boundary layer
height changing with angle of attack. Therefore, non low-
profile VG cases are indicated.
All measurements were carried out at a Reynolds number
of 200,000, and different ranges of angle of attack depending
on the measurement technique used.
VOL. 35, NO. 4 – October - December 2011 TECHNICAL SOARING 127
Tuft filaments visualization Initially, the flow over the model without VGs was
visualized to validate the numerical results, which showed the
absence of laminar separation bubbles. To do this, the model
was covered with tufts. The distance between tufts in each
row depended on tuft length, which was set to avoid their
mutual interference. After this, the tufts were kept only on the
flap and visualization of the flow-controlled cases was
performed, as shown in Fig. 4. The flow conditions indicated
in Table 1 were maintained. The angle of attack range was
from -5 to 15 degrees.
Oil-flow visualization Owing to the unexpected results from the tuft
observations, which are described in the Results and
Discussion section in more detail, oil visualization was
conducted for the zero angle of attack case. Initially, the
measurement of the same non-controlled case was carried out
and based on the observed separation bubble location, zig-zag
tape was fixed to upper surface of the model at x/c = 0.23
downstream of the leading edge. Fully turbulent flow over
most of the model was achieved, which led to separation
bubble suppression. Thus, the measurements of the non-
controlled as well as the controlled cases were performed with
the tape in place. Since these measurements were not
performed in the same wind tunnel as the previous one, the
different turbulence intensity of the free stream flow must be
noted.
Lift-curve measurement
The lift curve was obtained by integrating the measured
pressure distributions to determine lift coefficients. The
model with the zig-zag tape was used and cases with and
without VGs were measured. The pressure orifices on side
walls of the closed test section were employed to obtain the
pressure distributions. Flow conditions were consistent with
those of the tuft visualization experiments. The final lift
curves for angles of attack ranging from –2.5 to 22.5 degrees
include all of the necessary corrections.
Results and Discussion The results from the tuft observations show that separation
was suppressed on deflected flap only in the case of large
rectangular VGs (x1, z2) at zero angle of attack, as can be
seen in Figs. 5a and 5b. The flow separation on the airfoil
without a flap deflection only appears at an angle of attack of
15 degrees, where separation started approximately in the
middle of the chord, thus upstream of the VGs. Even though
separation occurred upstream of the VGs, an improvement
was still achieved with the large triangular VGs (x1, z2), as
can be observed in Figs. 6a and 6b. In both of the cases noted
here, the VGs used were of the conventional type. As these
findings are not completely logical, oil-flow visualization was
carried out.
The visualization for the clean model with and without a
flap deflection was performed first, see Figs. 7a and 7b. A
separation bubble is clearly observed in both of these cases.
Thus, the tufts in this case were unsuited for displaying the
separation bubble because either they affected the flow to
cause boundary-layer transition, or they could not display the
separation bubble because it was too small. The observations
for the controlled case using tufts did not display distinctly
how efficient the VGs were in suppressing flow separation on
the deflected flap. In some cases, this is because the VGs
were placed in the separation bubble which likely influenced
their efficiency, especially for the low-profile ones.
As mentioned earlier, the zig-zag tape was used to avoid
the situation described above. The subsequent oil-flow
visualizations confirmed that the separation bubble was
eliminated, and also displayed flow separation occurring near
the trailing edge for the case without flap deflection and
separated flow over the whole deflected flap, see Figs. 8a and
8b.
Next, the controlled cases were considered. It was found
that the rectangular VGs had some effect in almost all cases.
For the small (low-profile) VGs, there was a more significant
influence at the position closer to the separation point, as
presented in Figs. 9a and 9b, where downstream displacement
of the separation point was achieved. The VGs effectiveness
was better for larger spacing, as can be seen in Figs. 9b and
10. The large rectangular VGs (conventional) had
considerable effect in all cases. The separation point shifted
further downstream than it did for the small VGs, but the
influence of the VG position from separation was not obvious
(Figs. 11a and 11b). The triangular VGs did not have much
effect on the separated flow except in the case of the large
VGs (conventional, x2, z1), where only a slight influence
was achieved, see Fig. 12.
The last experiment conducted was to obtain pressure
distributions and the lift curve. The best results were obtained
for conventional VGs, as was the case observed in the oil flow
experiments. The largest lift coefficient increment was
achieved for conventional, rectangular VGs (x2, z2). Also,
the results for low-profile VGs were consistent with the oil-
flow results; although there were some differences, mainly
with the triangular, conventional VGs. The lift coefficient
improvement was obtained with both positions of the
triangular VGs, but they seemed to have little or no effect on
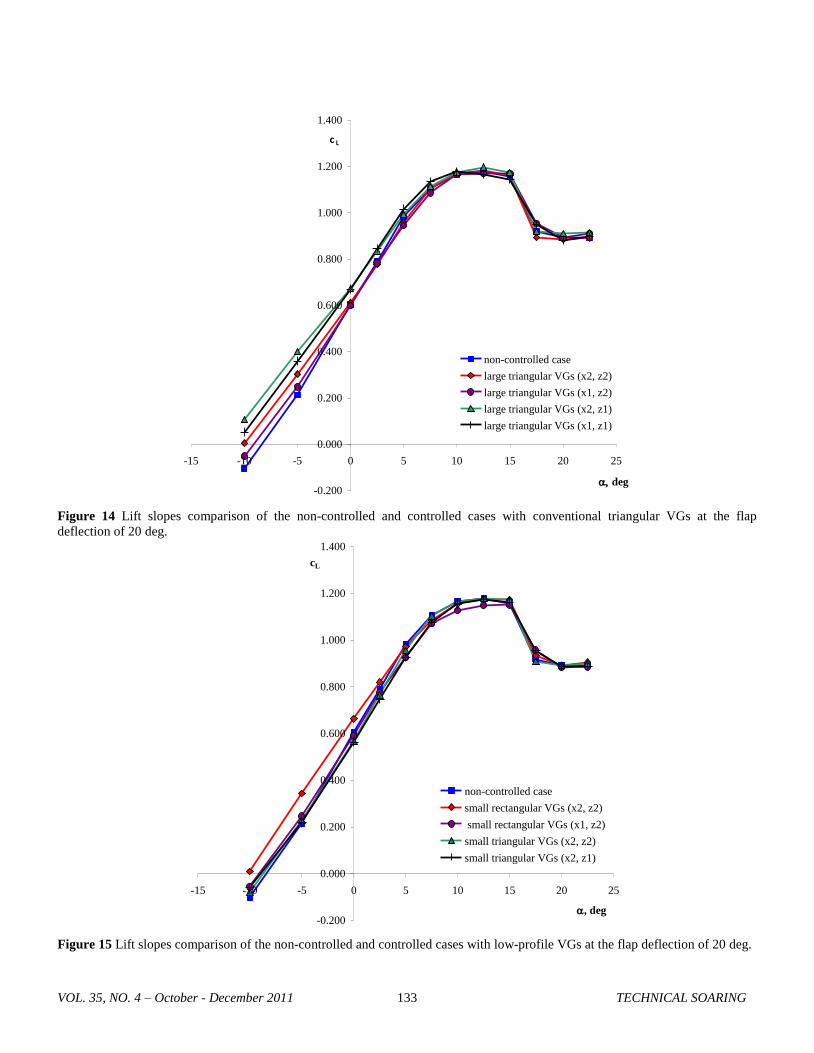
the oil-flow results for these cases. From the lift curves, it
also is evident that the range of the VGs effectiveness is up to
an angle of attack of 10 degrees. For higher angles, the
separation points occurred upstream of VGs and they no
longer had an effect on the separated flow over the deflected
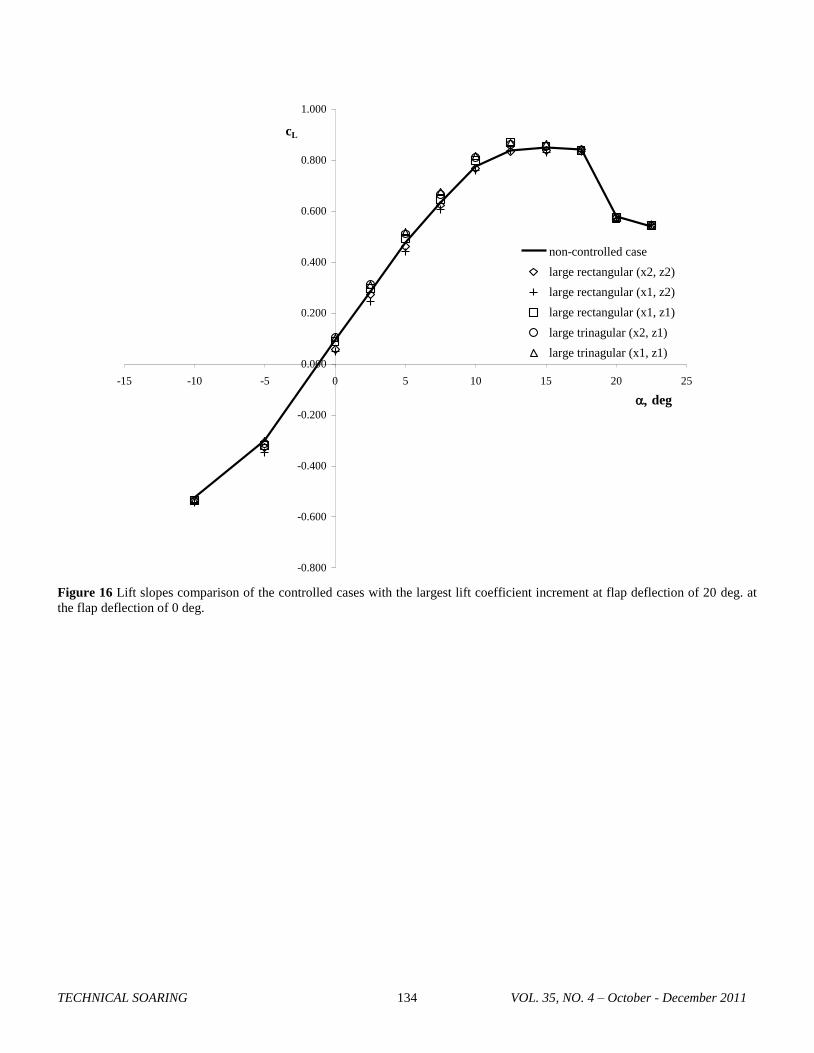
flap, as can be seen in Figs. 13-15. The comparison of the lift
curves for cases without a flap deflection showed an
increment of lift coefficient for angles of attack from 5 to 15
degrees, except the conventional rectangular VGs (x1, x2,
z2), which showed a slight lift coefficient decrease, as can be
seen in Fig. 16. These results correspond with those of the
tuft observations.
TECHNICAL SOARING VOL. 35, NO. 4 – October - December 2011 128
Conclusions
This investigation brings some interesting findings and a
few questions as well.
The flow separation over the deflected flap was not
completely eliminated. However, the downstream movement
of the separation point was achieved, particularly with
conventional vortex generators (VGs). In addition, the
rectangular vane VGs seemed to be more effective than the
triangular ones for cases with a non-zero flap deflection.
Also, it was found that the only improvement achieved with
low-profile VGs was with the rectangular ones. In addition,
the conventional VGs were not as sensitive to position
changes as the low-profile VGs, because almost the same
improvement was achieved for both positions using the large
VGs, whereas the position played an important role in
effectiveness of small ones.
The influence of spacing between VGs pairs is significant.
Whereas large rectangular VGs had a more significant effect
when employing the small spacing, the triangular ones had the
opposite behavior. While it applies only to the large VGs, the
larger spacing between conventional rectangular VGs pairs
caused deterioration in the lift coefficient compared to the
case with small spacing. It was observed in the oil-flow
visualization experiments that the small rectangular VGs had
the same effect as triangular ones.
The questions that are introduced by the results obtained
are the big differences in the effectiveness between the
rectangular and triangular VGs, as well as with particular VGs
behavior as the spacing changed. Thus, future work will use
flow visualization to help better understand differences in the
vortices produced by pairs of vortex generators. In addition,
numerical simulations of VG control on a deflected flap will
continue. Future work also will focus on drag force
measurements to determine the drag penalties of VGs, as well
as for the validation of numerical simulations.
Acknowledgments The work has been supported by Ministry of Education,
Youth and Sports of the Czech Republic within project
No. 1M06031. Support by the Czech Science Foundation
under grants No. IAA2076403 and No. GA 101/08/1112 is
gratefully acknowledged.
References 1Lin, J.C., "Review of research on low-profile vortex generators
to control boundary-layer separation," Progress in Aerospace Science
38, 2002, pp. 389-420. 2Shan H., Jiang L., Liu C., Love M., Maines B., "Numerical
study of passive and active flow separation control over a
NACA0012 airfoil," Computer & Fluids 37, 2008, pp. 975-992. 3Godard G., Stanislas M., "Control of a decelerating boundary
layer. Part 1: Optimization of passive vortex generator," Aerospace
Science and Technology 10, 2006, pp. 181-191. 4Popelka L., "Wind Tunnel Test Section for Airfoils and Bodies,
Research Programme Feasibility Studies," Conference Topical
Problems of Fluid Mechanics, Institute of Thermomechanics AS CR,
Prague, 2008, pp. 85-88.
Figure 1 Computational mesh.
Table 1
Inlet boundary conditions
v, m/s Tu, % L, m Re
12 0.25 0.005 200,000
Table 2 Non-dimensional flow separation locations x/c for range of
angles of attack with and without flap deflection
, deg.
, deg. 0 20
-5 0.9653 0.7429
0 0.9195 0.7476
5 0.7910 0.7385
10 0.6036 0.5569
15 0.4323 0.4330
VOL. 35, NO. 4 – October - December 2011 TECHNICAL SOARING 129
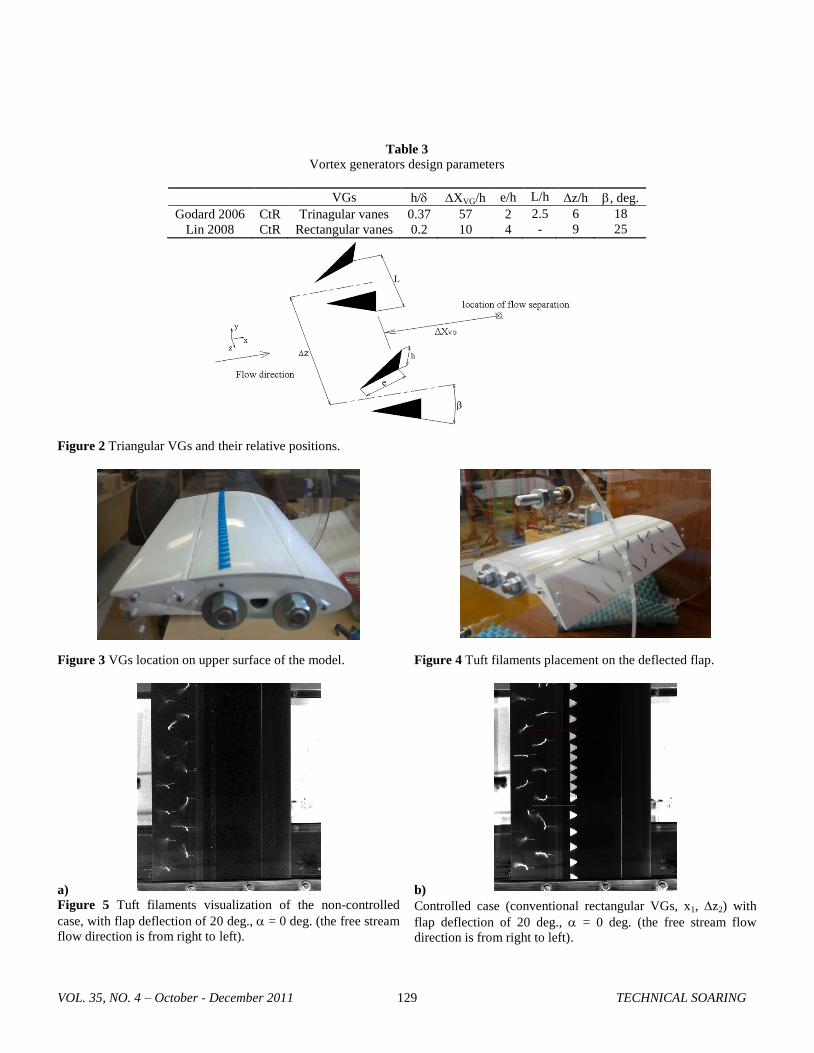
Table 3 Vortex generators design parameters
VGs h/ XVG/h e/h L/h z/h , deg.
Godard 2006
Lin 2008
CtR
CtR
Trinagular vanes
Rectangular vanes
0.37
0.2
57
10
2
4
2.5
-
6
9
18
25
Figure 2 Triangular VGs and their relative positions.
Figure 3 VGs location on upper surface of the model.
Figure 4 Tuft filaments placement on the deflected flap.
a)
Figure 5 Tuft filaments visualization of the non-controlled
case, with flap deflection of 20 deg., = 0 deg. (the free stream
flow direction is from right to left).
b)
Controlled case (conventional rectangular VGs, x1, z2) with
flap deflection of 20 deg., = 0 deg. (the free stream flow
direction is from right to left).
TECHNICAL SOARING VOL. 35, NO. 4 – October - December 2011 130
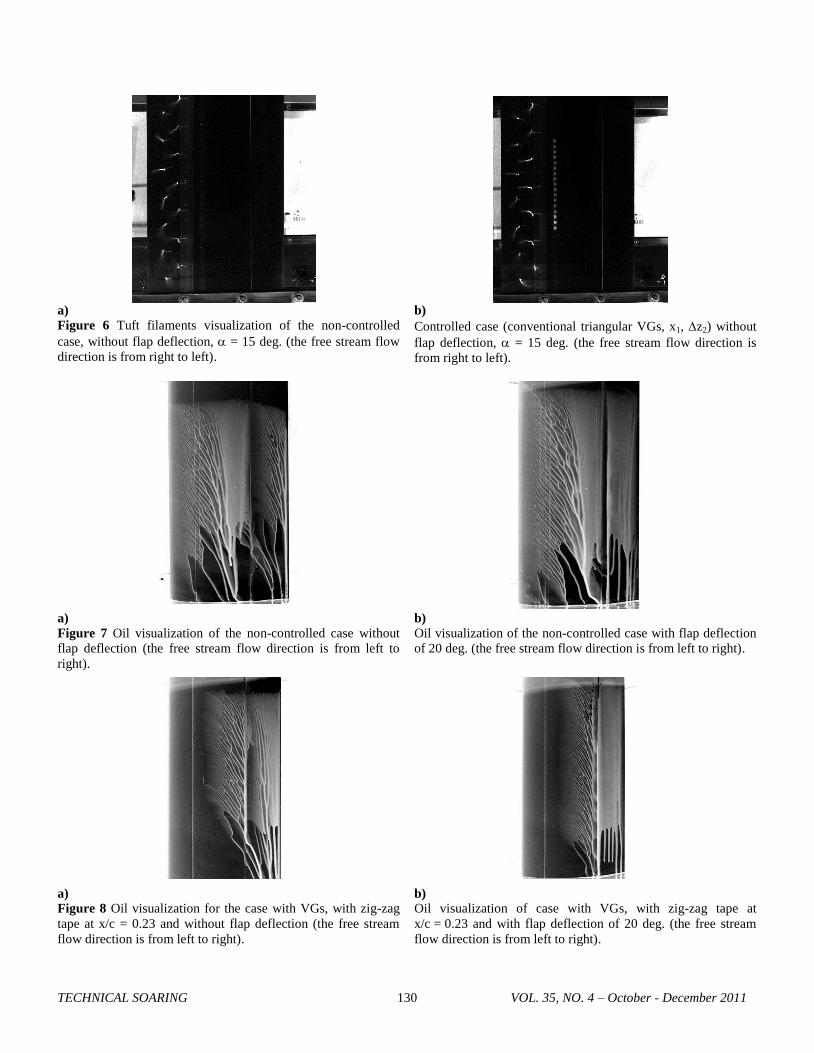
a)
Figure 6 Tuft filaments visualization of the non-controlled
case, without flap deflection, = 15 deg. (the free stream flow
direction is from right to left).
b)
Controlled case (conventional triangular VGs, x1, z2) without
flap deflection, = 15 deg. (the free stream flow direction is
from right to left).
a)
Figure 7 Oil visualization of the non-controlled case without
flap deflection (the free stream flow direction is from left to
right).
b)
Oil visualization of the non-controlled case with flap deflection
of 20 deg. (the free stream flow direction is from left to right).
a)
Figure 8 Oil visualization for the case with VGs, with zig-zag
tape at x/c = 0.23 and without flap deflection (the free stream
flow direction is from left to right).
b)
Oil visualization of case with VGs, with zig-zag tape at
x/c = 0.23 and with flap deflection of 20 deg. (the free stream
flow direction is from left to right).
VOL. 35, NO. 4 – October - December 2011 TECHNICAL SOARING 131
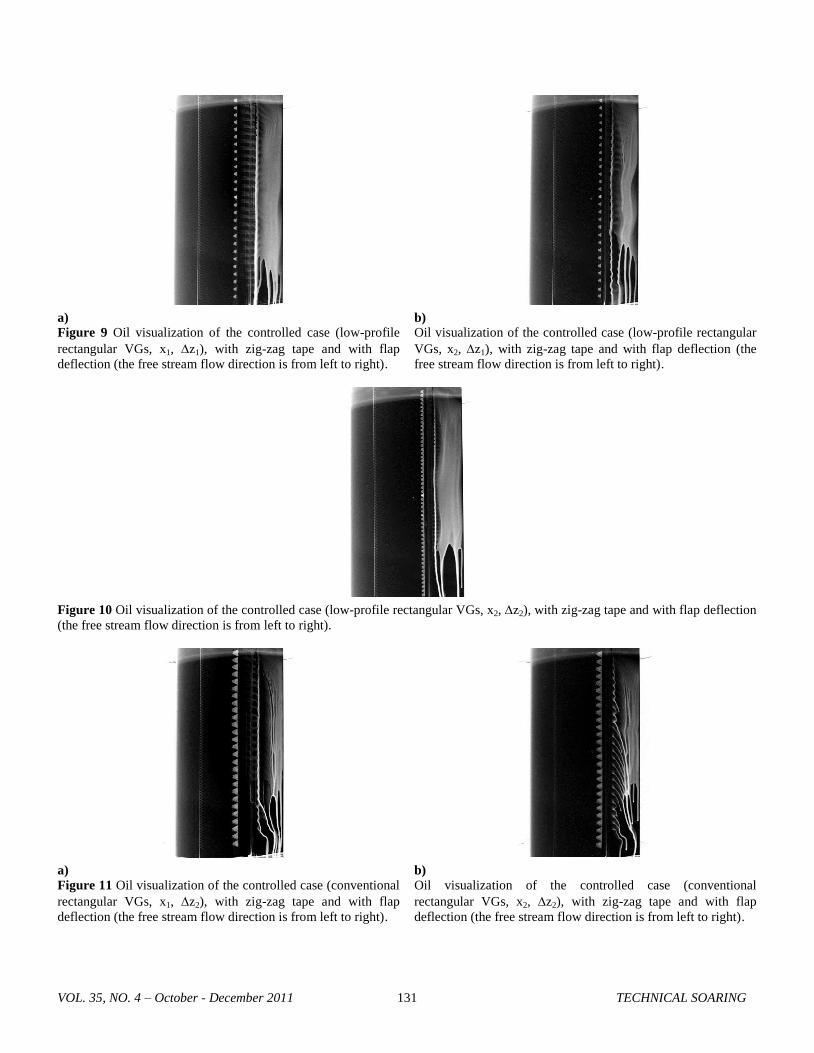
a)
Figure 9 Oil visualization of the controlled case (low-profile
rectangular VGs, x1, z1), with zig-zag tape and with flap
deflection (the free stream flow direction is from left to right).
b)
Oil visualization of the controlled case (low-profile rectangular
VGs, x2, z1), with zig-zag tape and with flap deflection (the
free stream flow direction is from left to right).
Figure 10 Oil visualization of the controlled case (low-profile rectangular VGs, x2, z2), with zig-zag tape and with flap deflection
(the free stream flow direction is from left to right).
a)
Figure 11 Oil visualization of the controlled case (conventional
rectangular VGs, x1, z2), with zig-zag tape and with flap
deflection (the free stream flow direction is from left to right).
b)
Oil visualization of the controlled case (conventional
rectangular VGs, x2, z2), with zig-zag tape and with flap
deflection (the free stream flow direction is from left to right).
TECHNICAL SOARING VOL. 35, NO. 4 – October - December 2011 132
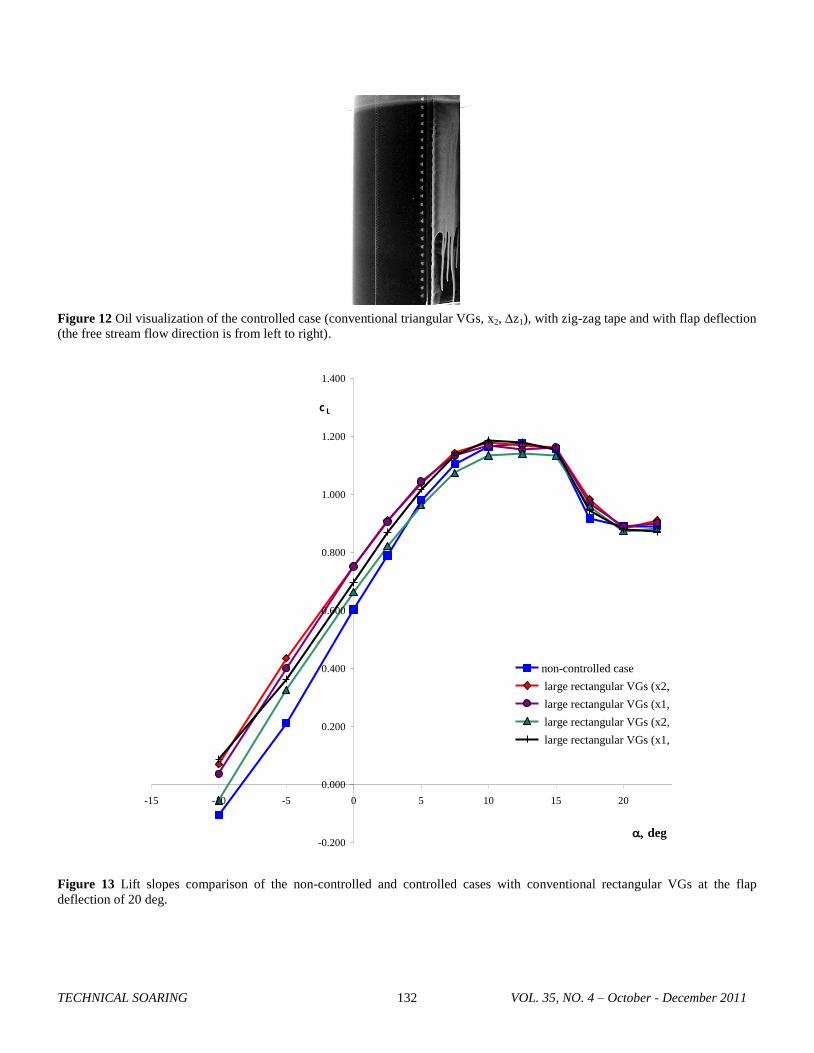
Figure 12 Oil visualization of the controlled case (conventional triangular VGs, x2, z1), with zig-zag tape and with flap deflection
(the free stream flow direction is from left to right).
Figure 13 Lift slopes comparison of the non-controlled and controlled cases with conventional rectangular VGs at the flap
deflection of 20 deg.
-0.200
0.000
0.200
0.400
0.600
0.800
1.000
1.200
1.400
-15 -10 -5 0 5 10 15 20 25
deg
c L
non-controlled case
large rectangular VGs (x2, z2)
large rectangular VGs (x1, z2)
large rectangular VGs (x2, z1)
large rectangular VGs (x1, z1)
VOL. 35, NO. 4 – October - December 2011 TECHNICAL SOARING 133
Figure 14 Lift slopes comparison of the non-controlled and controlled cases with conventional triangular VGs at the flap
deflection of 20 deg.
Figure 15 Lift slopes comparison of the non-controlled and controlled cases with low-profile VGs at the flap deflection of 20 deg.
-0.200
0.000
0.200
0.400
0.600
0.800
1.000
1.200
1.400
-15 -10 -5 0 5 10 15 20 25
deg
c L
non-controlled case
large triangular VGs (x2, z2)
large triangular VGs (x1, z2)
large triangular VGs (x2, z1)
large triangular VGs (x1, z1)
-0.200
0.000
0.200
0.400
0.600
0.800
1.000
1.200
1.400
-15 -10 -5 0 5 10 15 20 25
, deg
cL
non-controlled case
small rectangular VGs (x2, z2)
small rectangular VGs (x1, z2)
small triangular VGs (x2, z2)
small triangular VGs (x2, z1)
TECHNICAL SOARING VOL. 35, NO. 4 – October - December 2011 134
Figure 16 Lift slopes comparison of the controlled cases with the largest lift coefficient increment at flap deflection of 20 deg. at
the flap deflection of 0 deg.
-0.800
-0.600
-0.400
-0.200
0.000
0.200
0.400
0.600
0.800
1.000
-15 -10 -5 0 5 10 15 20 25
deg
cL
non-controlled case
large rectangular (x2, z2)
large rectangular (x1, z2)
large rectangular (x1, z1)
large trinagular (x2, z1)
large trinagular (x1, z1)