abstract - İyte kütüphanesi - ana sayfalibrary.iyte.edu.tr/tezler/master/... · web...
TRANSCRIPT
CHAPTER I
INTRODUCTION
Since the last decade of the last century, market shares of well-known companies
are threatened by the increasing competency on products and services. A lot of
companies are enlarging their variety of production and this process, as a whole, creates
a very competent environment. Capturing a reasonable market share in such an
environment requires more than implementing plain production techniques in an
effective way. The important step to get ahead in this competition is designing new
products in order to create difference and meeting the customer requirements. While
creating difference, it is easier to work on meeting the customer requirements instead of
trying to create new requirements for the customers.
Designing new products and innovation process requires more than satisfying
customer needs. But getting over customer requirements does not mean that those
requirements should be overlooked. Quite the contrary, the customer needs must be
well-understood beforehand in order to take a step further to create the difference. In
other words, the resultant product any industrial design process firstly have to satisfy
customer requirements and then take a step further to innovative design from the same
requirements. Any industrial design process omitting the customer expectations is most
likely to fail on the market.
Meeting customer requirements has also direct relationship with design quality.
There are numerous studies on qualitative approaches in industrial design and
production issues. Our study mainly focuses on the quality function deployment method
to be used in industrial design applications. The main idea of quality function
deployment approach is building a design strategy over the voice of customer. The
customer requirements should be carefully studied and defined to take the first steps in
the study before going further in the next phases. The next phases of the quality
function deployment are about converting the customer requirements into corresponding
technical requirements in order to combine both design and production issues in the
same study. In addition to these, the competent products which are already on the
market are studied on a technical basis in order to create a comparison possibilities for
the new design. This methodology integrates the customer requirements and competent
1
product specifications into the industrial design process so that the product will be likely
to capture a reasonable customer attraction on the market.
Our study consists of three main parts:
The first part of the study is about the design methods and user centered design
issues. Especially if industrial design is the case, the customer expectations cannot be
neglected and must be integrated into the design process. There are various methods and
studies for user-centered design where quality function deployment is one of the
rational methods.
The second part of the study is about getting into details quality function
deployment approach for industrial design. Quality concepts and studies in this chapter
are introduced from the industrial design perspective. The steps for building a house of
quality is explained and a sample application of quality function deployment to a design
project is presented at the end of the chapter.
The third part of the study is a case-study to show the steps of quality function
deployment for a hairdryer design project. Customer expectations are defined and the
house of quality matrix is built around these expectations and competent product
information.
In this study, documentary investigation, bibliographic analyses, descriptive
research and a small case study will be used for research.
2
CHAPTER II
DESIGN METHODS
and
USER-CENTERED DESIGN
2.1 OVERVIEW
Quality function deployment or any other method for creating a user-centered
approach to industrial design process is closely related with the basics of design itself.
Thus, before going into details of the quality function deployment mechanism, which
has been throughly explained in Chapter 3, it is essential to define the basic concepts of
design methods and user-centered design in this chapter.
While ‘design’ is considered to define a category of ‘innovation’, it is more
likely to mean the practices that contribute to the new product development activity.
Furthermore, as OECD (1992) emphasizes, ‘industrial design’ plays the most significant
role in the development of products and services. Therefore, while ‘design innovation’
is the subject matter, it is conceivable to consider an integrated contribution of a variety
of design practices with the central and harnessing position of ‘industrial design’ to the
innovative activity.
‘Design’ concept has a variety of definitions which arise from a variety of
perspectives. These perspectives lead to definitions in functional and strategic levels
addressing the general ‘design’ concept and ‘product / industrial design’ in particular.
The earliest recorded official use of the term ‘industrial design’ by the US
Commissioner of Patents dates back to 1913, to distinguish the ‘form’ of products, as
distinct from their ‘function’ (Lorenz, 1990).
While discussing ‘design’ as a strategic tool for competitive advantage and
eventually market success, Walsh et al. (1988) refered to such a concept. They mention
“new designs enhancing product quality but involving no technical change,” through
which they discuss incremental improvements in the quality of a product or service that
are less risky and expensive, short term, therefore constitute less a venture for the
producer (Walsh et al. 1988).
3
Walsh et al. (1992) argue that, terminologically, ‘design’ and ‘innovation’ often
refer to similar activities. Various activities including research, design, development,
market research and testing manufacturing engineering serve to convert “a new idea,
invention, or discovery into a novel product or industrial process in commercial or
social use” (Walsh et al., 1992).
Hilton (2002), broadly defines innovation as “about bringing change over an
extended period, either as a result of a new product or service.” Since his insight about
‘innovation’ is “bringing change” to a product or service, ‘design innovation’ appears to
conclude to a change in a product or service brought by design. Hence, according to
him, “an innovative design is only innovative once it has been successful in the
marketplace and brought about change” (Hilton, 2002).
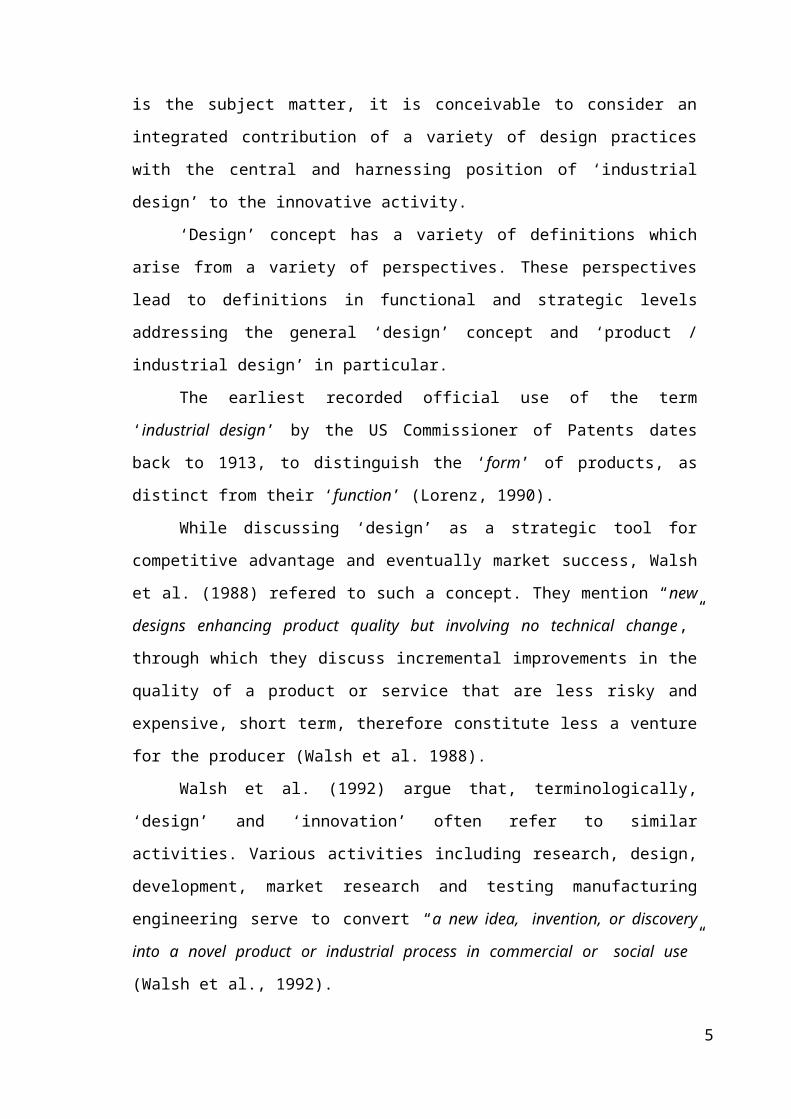
Table 2.1 Example products whose market potentials have been multiplied by design
(Oakley, 1990)
Oakley’s (1990) definition of design includes the definition of ‘design
innovation’. According to him, design effort is devoted to “help turn an invention into a
successful innovation – or to extend the usefulness of an existing innovation.” He also
describes this effort as a “fine-tuning to achieve a result that suits our needs more
accurately.” At this point, Oakley (1990) exemplifies his definition as described in the
Table 2.1. Oakley (1990) also points out that 99 percent of the new products in the
market is a derivation of an existing application, thus emphasizes the importance of
design effort in terms of introducing novelties by extending the usefulness of the
existing innovation.
By some means, the difference between ‘design innovation’ and ordinary
product design activity appears unclear. One reason to make a distinctive definition of
‘design innovation’ is the ‘novelty’ that the output of the design activity should
comprise. The degree of ‘novelty’ determines whether a ‘design innovation’ is an
incremental or a radical one. It is evident that ordinary design activity may not
4
Basic Innovation Designed Innovation
Bicycle
Cassette tape system Hovercraft
BMX Bicycle Walkman stereo (etc.) Hovermower
necessarily encompass a novelty, in terms of a competitive advantage in the market or a
meaningful benefit for user.
2.1.1 Product Life-cycle
Rosenau (1996) defines this lifecycle in four stages until the product disappears
in the market: (1) introduction, (2) growth, (3) maturity, and (4) decline.
All through a product’s lifecycle, numerous innovations, whether product
component or process innovations, come out in different degrees, radical or
incremental. Utterback and Abernathy (1975) rely on the analysis of their study in
developing ‘an integrative theory of the innovation process’. Utterback and Abernathy
(1975) put forward two models of development in a product’s life cycle and suggest a
number of integrated stages within the two models that distinguish with a couple of
variables. The relationship of these stages and two models of innovation are represented
in Figure 2.1.
Figure 2.1 Innovation and stages of development (Utterback and Abernathy, 1975).
The first model of development is the ‘model of process development’, where
Utterback and Abernathy (1975) identify definite stages in the development of a
5
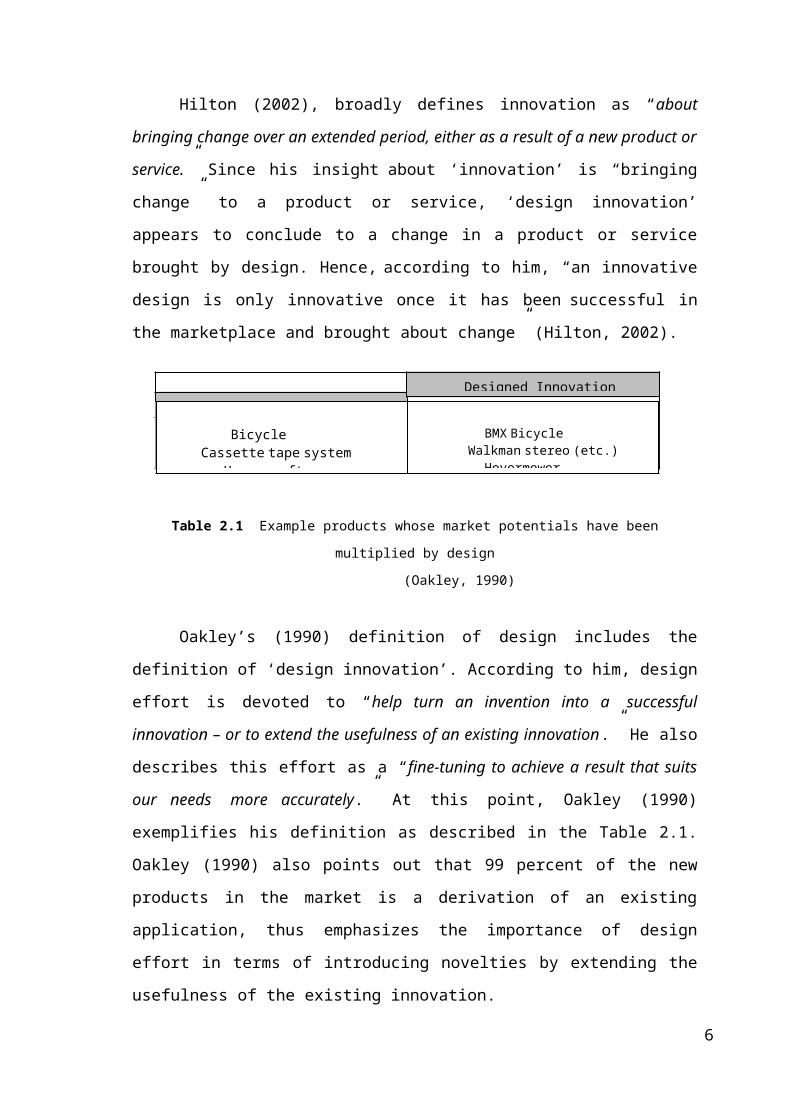
production process. These definite stages of the development in a production
processdistinguish in their characteristics of their evolutionary pattern. As per Utterback
and Abernathy (1975), as a production process develops over time, it becomes more
capital intensive, direct labor productivity improves through greater division of labor
and specialization, the flow of materials within the process takes on more of a straight
line flow quality, the product design becomes more standardized, and the process scale
becomes larger. Furthermore, in the development of a production process, evolution
take place not only in the characteristics of productivity factors but also in secondary
factors including the internal organizational structure, the development of a supplier
industry for special materials, and technology based oncapital goods. Utterback and
Abernathy (1975) define these stages as, ‘uncoordinated’, ‘segmental’, and ‘systemic’.
The ‘uncoordinated stage’ of the development of production process is the early
life of the process and product, where the process is organized mainly on
unstandardized and labor-driven operations that rely mostly on general-purpose
equipment. In this development stage of a production process, production is very
flexible and responds easily to environmental change, but is inefficient on the other
hand. In the ‘segmental stage’ of the development of production process, production
systems are more elaborated for increasing production efficiency. Although more sub
processes in this stage of development are highly automated, there still exist labor-
driven operations still enabling the flexibility of the process. The ‘systemic stage’ of
development is the most highly developed and integrated stage in a production process.
This stage demonstrates the maximum efficiency in production, but minimum flexibility
to respond the environmental variables. Within this stage, the processes grow to be very
integrated and automated; hence, changes and large-scale improvements become slow
and costly (Utterback and Abernathy, 1975).
The second model of development that Utterback and Abernathy (1975) put
forward along with their study is the ‘model of product development’. Within this
model, they study on the stages of development of products over time with sequentially
emphasizing on, initially ‘product performance’, then ‘product variety or
differentiation’ and lately, ‘product standardization and cost-efficiency’. These
sequential stages on the other hand may constitute the production company’s
competitive strategy in an industry. From this perspective, a company tending to
introduce technically advanced products that meet the market for the first time may
have a ‘performance-maximizing’ strategy, one tending to be a follower in obtaining
6
innovation but be ready to introduce new variations and improvements in a product may
have a ‘sales-maximizing’ competitive strategy, and a company entering a market at the
later stages of a product’s life cycle introducing more standardized and economic
versions of a product may have a ‘cost-minimizing’ strategy. Furthermore, a company’s
competitive strategy may tend to evolve from one strategy mentioned above to another
in time. In addition, through distinct stages of the development of a product or in the
different strategies of a production company, the level and sources of innovation vary.
Consequently, Utterback and Abernathy (1975) suggest a relationship between the
change in product characteristics and the development in production processes, on
which these scholars’ integrative theory mostly rely on.
According to Utterback and Abernathy (1975), a company with a ‘performance
maximizing’ strategy might emphasize unique products and product performance in the
early phases of a product’s life cycle. In this stage of the development of a product,
product innovations are mostly stimulated by new market needs and opportunities rather
than new scientific results and advanced technology. Also in this stage, there is a high
degree of market uncertainty for the product. In the ‘salesmaximizing’ stage of the
development of a product, market uncertainty is less along with product’s familiarity to
the market. In this stage, the competition in the market is based on product
differentiation with dominant or robust designs (as previously explained by the studies
of Rothwell and Gardiner, 1988). As the familiarity of the product in the market
increases and uncertainty reduces, companies increasingly tend to use advanced
technology for incremental product and process innovations. These innovations are
mostly stimulated by the demand for increased production output and result in new
organization models and product designs as well as improved production process. In the
later phases of a product’s life cycle, companies may tend to have a ‘cost-minimizing’
strategy where the market for the product becomes mature and the product becomes
standardized. As product variety is reduced, the emphasis tends to move on product
price and production efficiency. With the shift on price competition, production
processes become more capital intensive and product and process innovations tend to be
mostly incremental. In this stage of development in a product’s life cycle, sources of
innovation are mostly equipment suppliers (Utterback and Abernathy, 1975).
7
2.1.2 Design Innovation Process
Since the ‘innovation process’ starts with a new market opportunity and/or a
new invention and ends with the introduction of a salable product to the market, it
involves a series of sub-processes. For instance, within the framework of ‘product
innovation’, the ‘new product development’ process dominates the innovation process.
The ‘new product development’ process, itself, also consists of subprocesses, that might
include basic research, design, development, prototyping, testing, and so on. In this
context, terminologically, concepts including the ‘innovation process’, ‘new product
development process’, ‘product development rocess’, ‘product design and development
process’ are generally subject to confusion.
2.1.2.1 New Product Development
One common description of ‘new product development’ is “the process that
transforms technical ideas or market needs and opportunities into a new product on to
the market” (Walsh et al., 1992). ‘New product development’ and ‘technological
innovation’ concepts are often subject to confusion. Walsh et al. (1992) illustrates the
difference of new product development from technological innovation as “the ‘new
product’ concerned might involve only changes in form, components, materials, or even
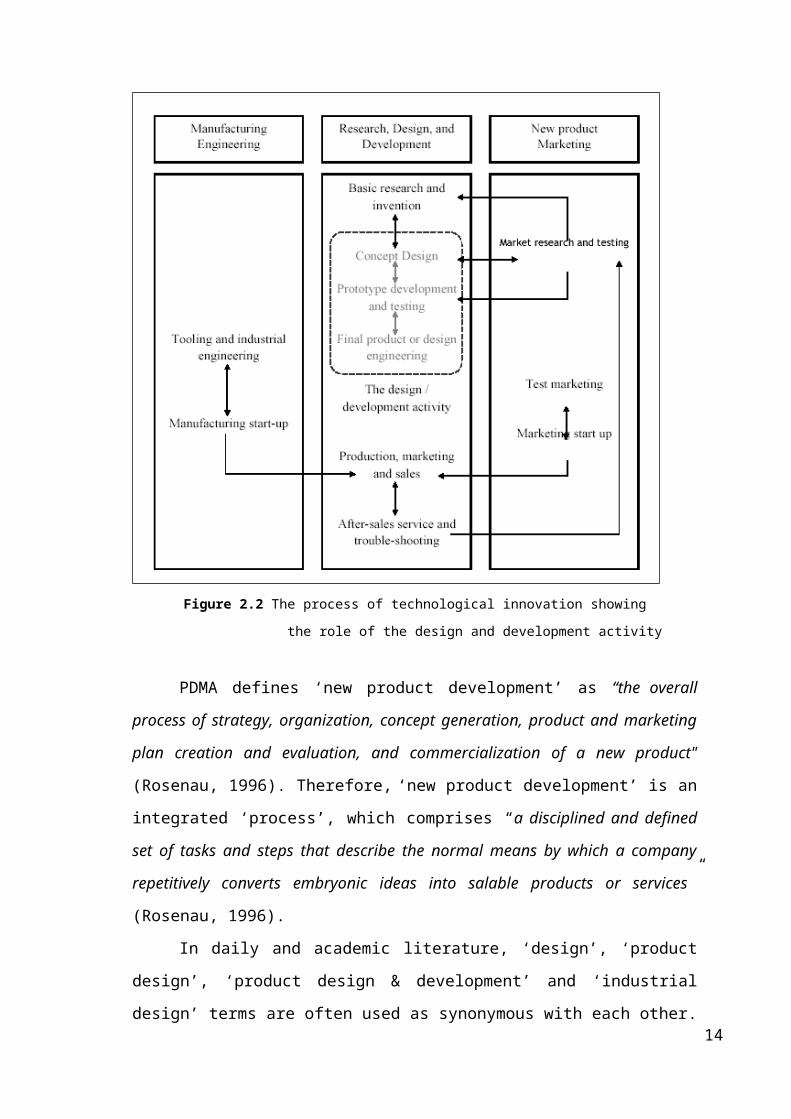
just packaging rather than changes in operation principle or technology”. Figure 2.2
represents a generic process of technological innovation and the place of the
development activity.
8
Figure 2.2 The process of technological innovation showing
the role of the design and development activity
PDMA defines ‘new product development’ as “the overall process of strategy,
organization, concept generation, product and marketing plan creation and evaluation,
and commercialization of a new product" (Rosenau, 1996). Therefore, ‘new product
development’ is an integrated ‘process’, which comprises “a disciplined and defined set
of tasks and steps that describe the normal means by which a company repetitively
converts embryonic ideas into salable products or services” (Rosenau, 1996).
In daily and academic literature, ‘design’, ‘product design’, ‘product design &
development’ and ‘industrial design’ terms are often used as synonymous with each
other. Some models of the product development process use ‘design and development’
as identical with the whole ‘product development process’ (Walsh et al., 1992). From
this perspective, ‘Product design and development’ stands in the core of the ‘new
product development’ process. Walsh et al. (1992) describes ‘product design and
9

development’ as “the activity that transforms the brief or initial market specification
into design concepts and prototypes and then into the detailed drawings, technical
specifications and other instructions needed to actually manufacture a new product.”
Walsh et al. (1992) mentions that design activity is subsequent with a
‘development’ activity, “in which prototypes are tested and modified until a satisfactory
preproduction version of the product has been evolved.” The development activity
provides feedback to the design activity for further refinement in the product or service
design to improve product eligibility for manufacturing and marketing.
2.1.2.2 Design Activity
The design activity comprises various subordinate activities addressing a
diversity of concerns. Freeman (1982) describes four kinds of design activity:
Experimental design: the design of prototypes and pilot plant leading the
preparation of production drawings for the commercial introduction of a new
product or process.
Routine design engineering: the adaptation of existing technology to specific
applications (typical of the design work done by many engineering firms when
installing new plant or equipment).
Fashion design: aesthetic and stylistic design of items ranging from textiles and
shoes to chairs, car bodies, and buildings. (This kind of design may result in
novel forms, shapes, or decorations, but often involves no technical change at
all.)
Design Management: the planning and coordinating activity necessary to create,
make and launch a new product on to the market (Freeman, 1983; Quoted from,
Walsh et al., 1992).
The design domain also comprises a variety of practices serving to different
industries. The Design Council (1988) classifies design practices into four distinct
categories:
Product design, including products ranging from ceramics and toys to specific
instruments;
Graphic design, covering everything from corporate identity and packaging to
magazines and film;
10
Interior design, including shops, buildings and exhibitions;
Fashion and textiles, ranging from clothing and carpets to jewellery (The
Design Council, 1988; Quoted from Walsh et al., 1992).
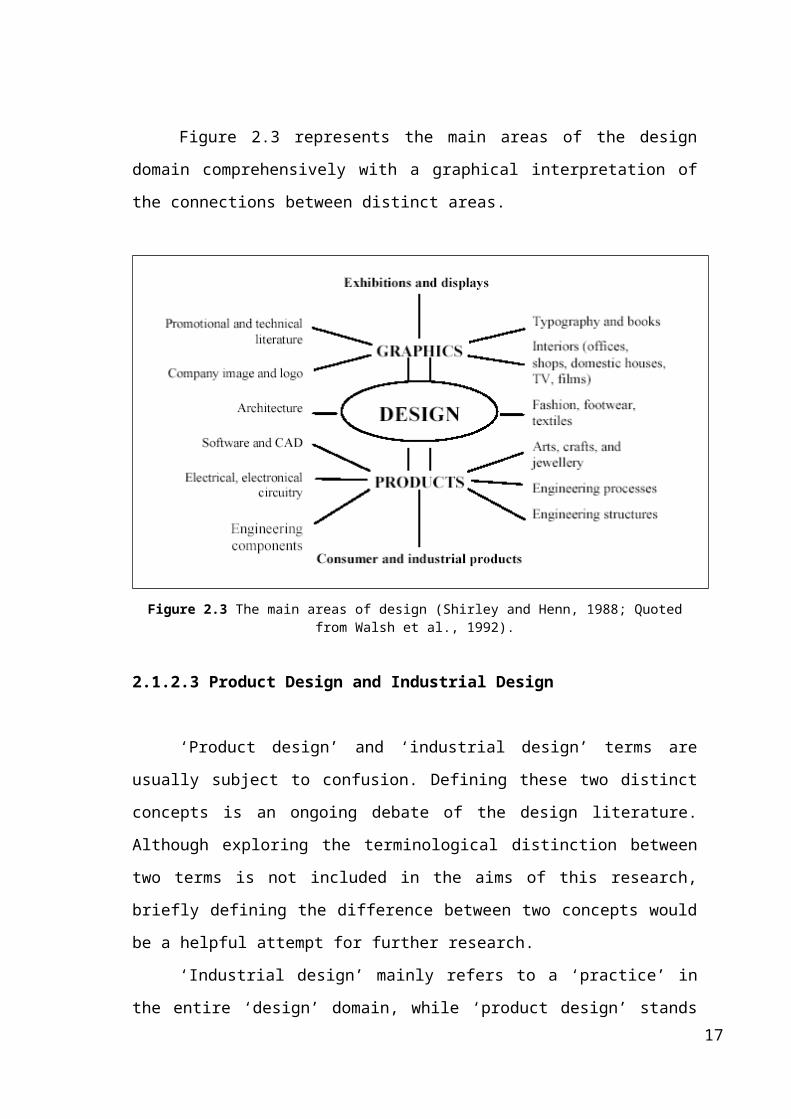
Figure 2.3 represents the main areas of the design domain comprehensively with
a graphical interpretation of the connections between distinct areas.
Figure 2.3 The main areas of design (Shirley and Henn, 1988; Quoted from Walsh et al., 1992).
2.1.2.3 Product Design and Industrial Design
‘Product design’ and ‘industrial design’ terms are usually subject to confusion.
Defining these two distinct concepts is an ongoing debate of the design literature.
Although exploring the terminological distinction between two terms is not included in
the aims of this research, briefly defining the difference between two concepts would be
a helpful attempt for further research.
‘Industrial design’ mainly refers to a ‘practice’ in the entire ‘design’ domain,
while ‘product design’ stands for ‘a combination of practices’. Thus ‘product design’
should be considered not as a ‘discipline’, but as an ‘activity’ consisting of the
contribution of various disciplines. A ‘product design’ activity appears to inevitably
encompass ‘industrial design’ as the central practice harnessing the contribution of all
other practices, for instance, engineering design, software design, interaction design,
11
design of product graphics, and so on. The level of contribution of other practices relies
on the characteristics of the product, for which the product design activity is devoted.
Walsh et al. (1992) attempt to clarify the controlling role of industrial design
within a product design activity. According to them, “industrial design seeks to rectify
the omissions of engineering; a conscious attempt to bring from visual order to
engineering hardware where the technology does not of itself provide these features”
(Walsh et al., 1992). They also emphasize the role of design function in accessing all
the specialized functions within and outside the company that includes the design
function, and assembling the necessary information as input to the product design
process.
Consequently, along with a variety of definitions of ‘industrial design’ on which
the literature agrees, ‘product design’ refers to ‘a collaborative design activity with a
harnessing role of industrial design’ devoted to design a particular product or a range of
products.
2.2 USER-CENTERED APPROACH TO DESIGN ACTIVITY
Holt et al. (1984) describes need assessment activity as a process to be executed
parallel to the innovation process and according to them, “overall responsibility for
need assessment should be given to one organizational unit, but those participating in
product innovation processes should master and use proper need assessment methods in
their work.”
Nevertheless, the emergence of user-centered design has naturally clarified the
scene and brought together design practice and user research activity. The contribution
of user-centered practices in the design activity has augmented the understanding of
‘user’ needs. As per Sanders (2001), the emergence of user-centered design has
happened by a step-by-step contribution of user-centered practices in the practice of
design. The gradual convergence of user-centered practices and design practice has
initiated by the contribution of practices from ‘biological’ and ‘social’ sciences to the
practice of design and augmented the understanding of user experience (Sanders, 2001).
Buur (2002) argues that the user-centered approach has emerged as a reaction to
the requirement for meeting user needs in the design of computer interfaces, and later
evolved as a design field comprising of a variety of approaches. Buur (2002) describes
the emergence of the user-centered approach as follows:
12
The term User Centered Design has grown in popularity up through the 1990’s
as a reaction to the one-shot involvement of users in usability testing, and to the
cognitive psychology dominance of the Human Computer Interaction field. This
reaction has hardly fostered a new, coherent field of design and research, but it has
sparked a beginning of something new for those who have adopted the term. User
Centered Design presently covers a diversity of attitudes and approaches as to just how
it is best to involve users and ensure user-centeredness in design. And in this fast
moving world of emerging technologies and changing roles, it is not likely that we will
see a convergence, or that a convergence is even worth wishing for – A standard for the
Good is the Enemy of the Best (Buur, 2002).
Sanders (2001) argues that the emergence of the user-centered approach to the
design practice initiates with the contribution of ergonomics and human factors
practices to the design practice those aim to meet the bodily needs of users. However,
this approach recently covers the contribution of a broad range of practices to the design
discipline and aims to meet a wide scope of emerging needs of users. Sanders (2001)
outlines the development of the user-centered approach in terms of step-by-step
contribution of user-centered practices to the design practice as follows:
• Fit to the body was emphasized in the field of ‘ergonomics’ or ‘human
factors’.
• Fit to the mind was seen in the introduction of ‘cognitive ergonomics’, leading
to new fields such as information design and interaction design in the 1980’s.
• Fit to the social aspects of human behavior came with the advent of
‘applied ethnography’ and ‘contextual inquiry’ in the 1990’s.
• Fit to the emotional domain is just now receiving attention, as seen in interest
areas such as ‘affective human factors’.
• Fit to the dreams and aspirations of the people who will buy and use the
goods and services that we design is the next step (Sanders, 2001).
User-centered approach is not only a model providing need-related information
to the design process, but also an understanding that focuses on user experience rather
than the product or the design problem. Marzano (1997) emphasizes the shift from
focusing on products to user experience as “What consumers want is not products, but
benefits. We therefore need to shift our focus from products to customer benefits.”
According to Kelley (2001), before the emergence of the user-centered approach, the
13
focus was purely on products and the users of the products were seen as “stupid.” He
exemplifies this approach with the statement of an executive from the 1930s automotive
industry as “It’s not that we build such bad cars; it’s that they are such lousy
customers.” Moreover, Sanders (2002a) identifies user-centered design as “designing
objects for users.”
2.3 SOURCES OF DESIGN METHODS
The innovative activity entails certain kinds of sources and methods to persist.
The still ongoing change of our era is challenging the innovative activity and inevitably,
the sources and methods that it requires. There has been a shift in the innovation process
from the execution of incentive led methods by an individual innovator, to the
implementation of predefined and structured methods executed by specialized teams
with new forms of input knowledge. The change has also given rise to a shift in the
source of innovation from merely searching for technological opportunities to a well-
balanced coupling between technical competency and assessment of the needs and
preferences of the users.
The case for ‘design innovation’ appears to be rather vague. The emergence of
‘design innovation’ brings new challenges to the innovative activity with the
contribution of ‘design methods’ and human-centered approach to the methods of the
innovative activity. Nevertheless, how does the increasing importance of assessing user
needs as a source of innovation effects the design methods stands to be a question in the
‘design innovation’ context.
2.3.1 Users and User Needs as a Source of Innovation
Before studying the ‘users’ and their needs as a source of innovation, it is
essential to clarify the terminological distinctions between the terms ‘user’, ‘consumer’,
and ‘customer’, which are often used as synonymous for each other.
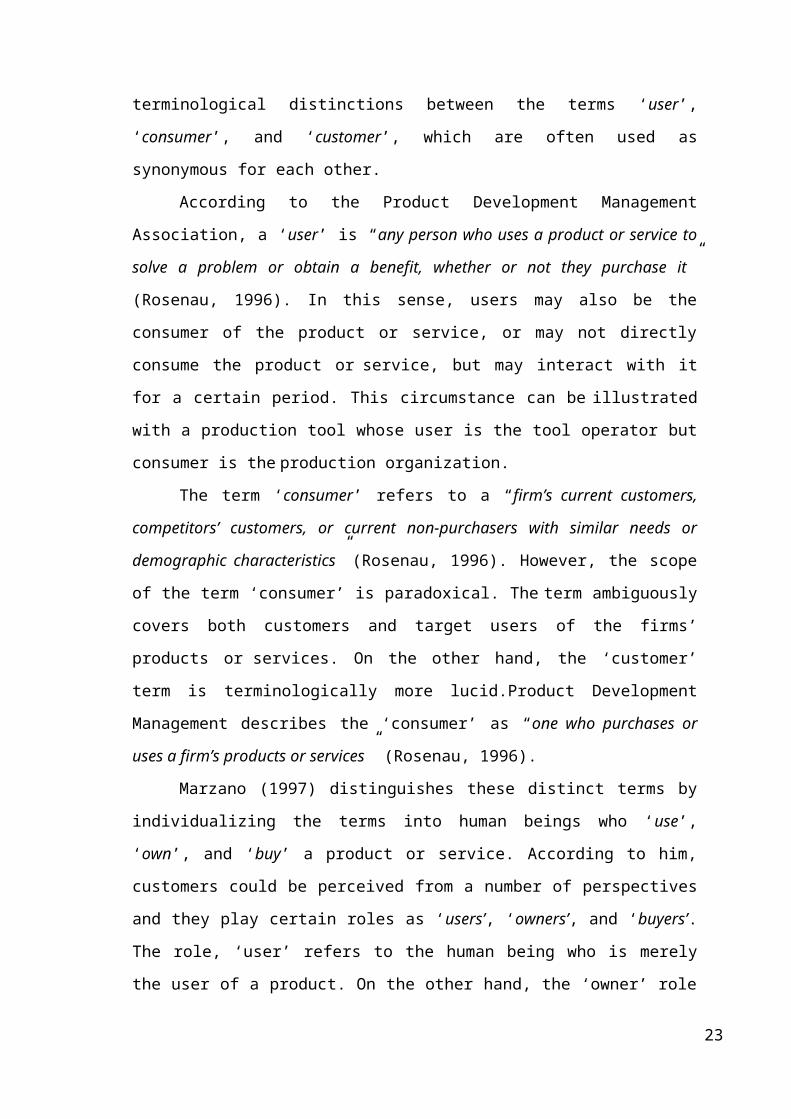
According to the Product Development Management Association, a ‘user’ is
“any person who uses a product or service to solve a problem or obtain a benefit,
whether or not they purchase it” (Rosenau, 1996). In this sense, users may also be the
consumer of the product or service, or may not directly consume the product or service,
but may interact with it for a certain period. This circumstance can be illustrated with a
14
production tool whose user is the tool operator but consumer is the production
organization.
The term ‘consumer’ refers to a “firm’s current customers, competitors’
customers, or current non-purchasers with similar needs or demographic
characteristics” (Rosenau, 1996). However, the scope of the term ‘consumer’ is
paradoxical. The term ambiguously covers both customers and target users of the firms’
products or services. On the other hand, the ‘customer’ term is terminologically more
lucid.Product Development Management describes the ‘consumer’ as “one who
purchases or uses a firm’s products or services” (Rosenau, 1996).
Marzano (1997) distinguishes these distinct terms by individualizing the terms
into human beings who ‘use’, ‘own’, and ‘buy’ a product or service. According to him,
customers could be perceived from a number of perspectives and they play certain roles
as ‘users’, ‘owners’, and ‘buyers’. The role, ‘user’ refers to the human being who is
merely the user of a product. On the other hand, the ‘owner’ role represents the
‘consumer’, while the ‘buyer’ is the ‘purchaser’ or the ‘customer’ of a product or
service.
Both innovation and design literatures refer to the term ‘user’ to define the
human being for whom their activities intend to develop new products or services.
Therefore, in search of an understanding of the needs of the human being, primarily the
‘user’ term is supposed to be referred to. Conversely, while the purchasing
characteristics of a user are considered, the term ‘consumer’ should be mentioned.
Otherwise, the usage of the term ‘customer’ is more likely to relate merely to the
purchasing characteristics and needs of a user.
The studies on innovations have shown that the innovation process may start due
to information about a technological opportunity, however in the majority of the studied
cases, the process is started by the assessment of user needs (Holt et al., 1984).
Therefore, it can be concluded that an in-depth understanding of the user needs is
crucial for successful product innovation. This viewpoint also emphasizes the ‘demand
factors’ as the most valuable source of innovation by means of which a developed
product or service would address the users’ real needs.
Marzano (1997) mentions that to survive, any company has to respond to the
real needs of the consumers, that is “something that has meaning.” According to him,
“the future is apparently too complex to be foreseen by the limited mind of one person,”
therefore, the only way to predict the consumers’ future needs is to involve them to the
15
process of developing new products and services (Marzano, 1997). Thus, Marzano
(1997) emphasizes the role of thoroughly understanding of the needs of the user in new
product development process. He also highlights the obvious shift from individual
initiative to user assessment as a source of innovation.
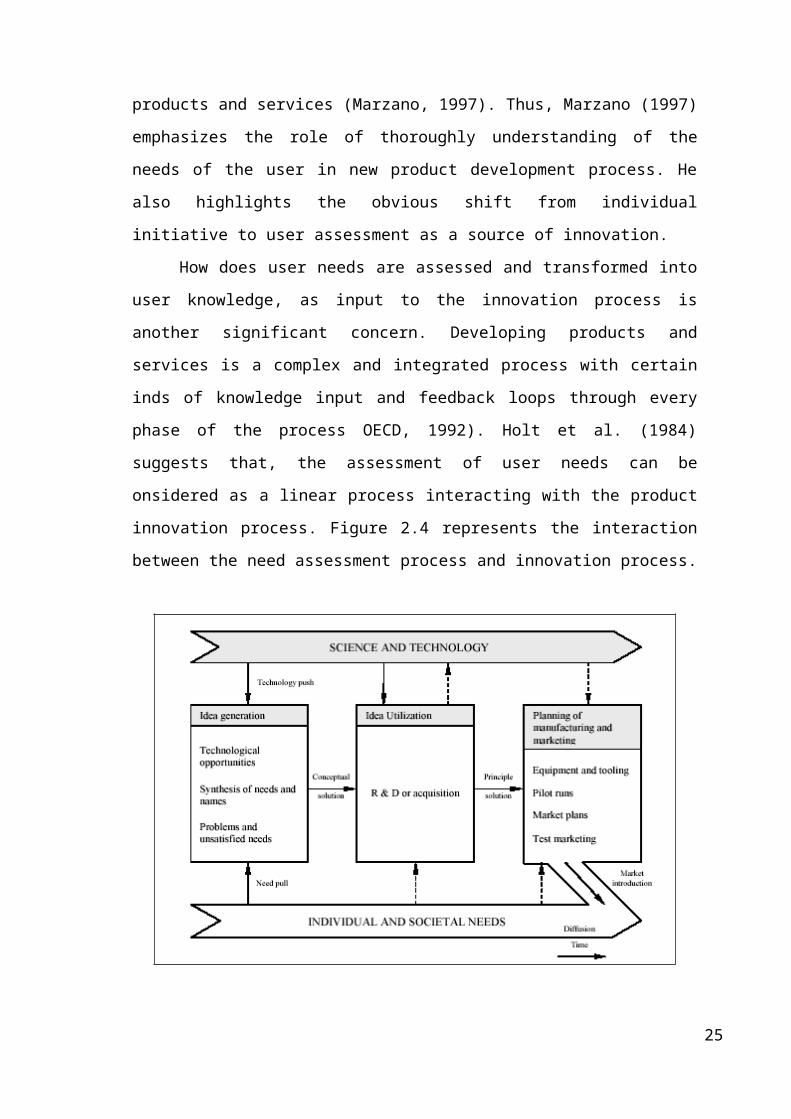
How does user needs are assessed and transformed into user knowledge, as input
to the innovation process is another significant concern. Developing products and
services is a complex and integrated process with certain inds of knowledge input and
feedback loops through every phase of the process OECD, 1992). Holt et al. (1984)
suggests that, the assessment of user needs can be onsidered as a linear process
interacting with the product innovation process. Figure 2.4 represents the interaction
between the need assessment process and innovation process.
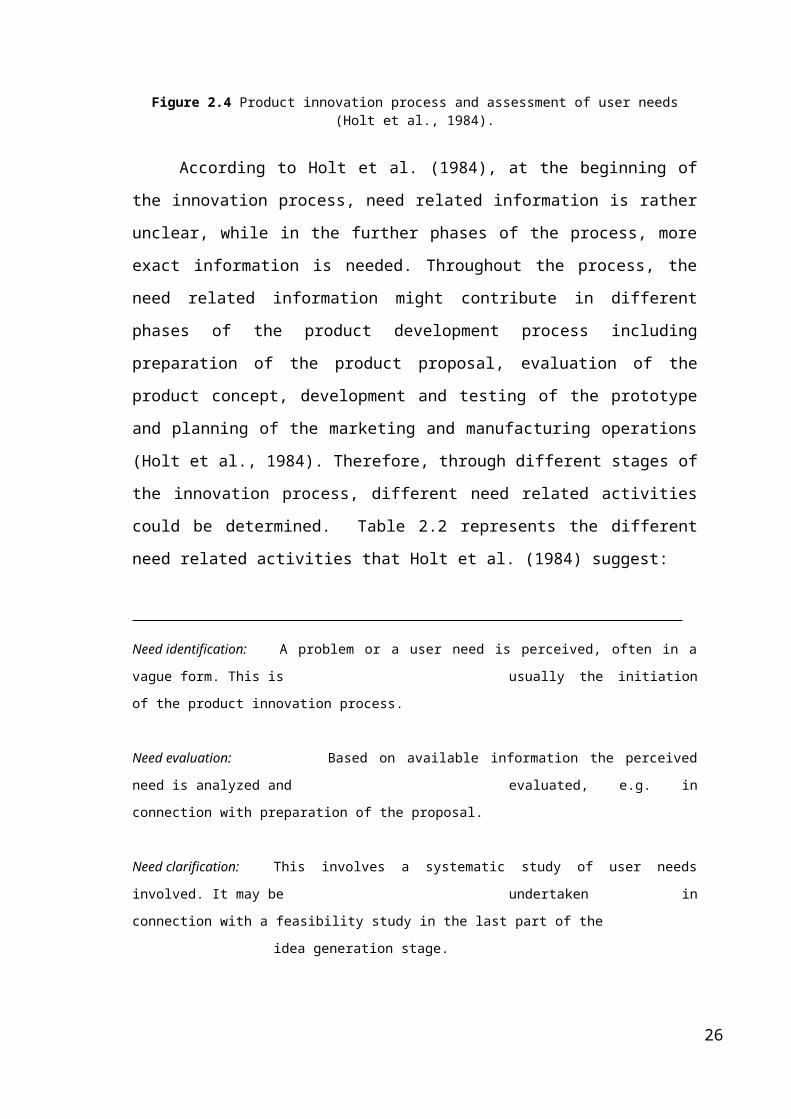
Figure 2.4 Product innovation process and assessment of user needs (Holt et al., 1984).
According to Holt et al. (1984), at the beginning of the innovation process, need
related information is rather unclear, while in the further phases of the process, more
exact information is needed. Throughout the process, the need related information might
contribute in different phases of the product development process including preparation
of the product proposal, evaluation of the product concept, development and testing of
the prototype and planning of the marketing and manufacturing operations (Holt et al.,
16
1984). Therefore, through different stages of the innovation process, different need
related activities could be determined. Table 2.2 represents the different need related
activities that Holt et al. (1984) suggest:
Need identification: A problem or a user need is perceived, often in a vague form. This is
usually the initiation of the product innovation process.
Need evaluation: Based on available information the perceived need is analyzed and
evaluated, e.g. in connection with preparation of the proposal.
Need clarification: This involves a systematic study of user needs involved. It may be
undertaken in connection with a feasibility study in the last part of the
idea generation stage.
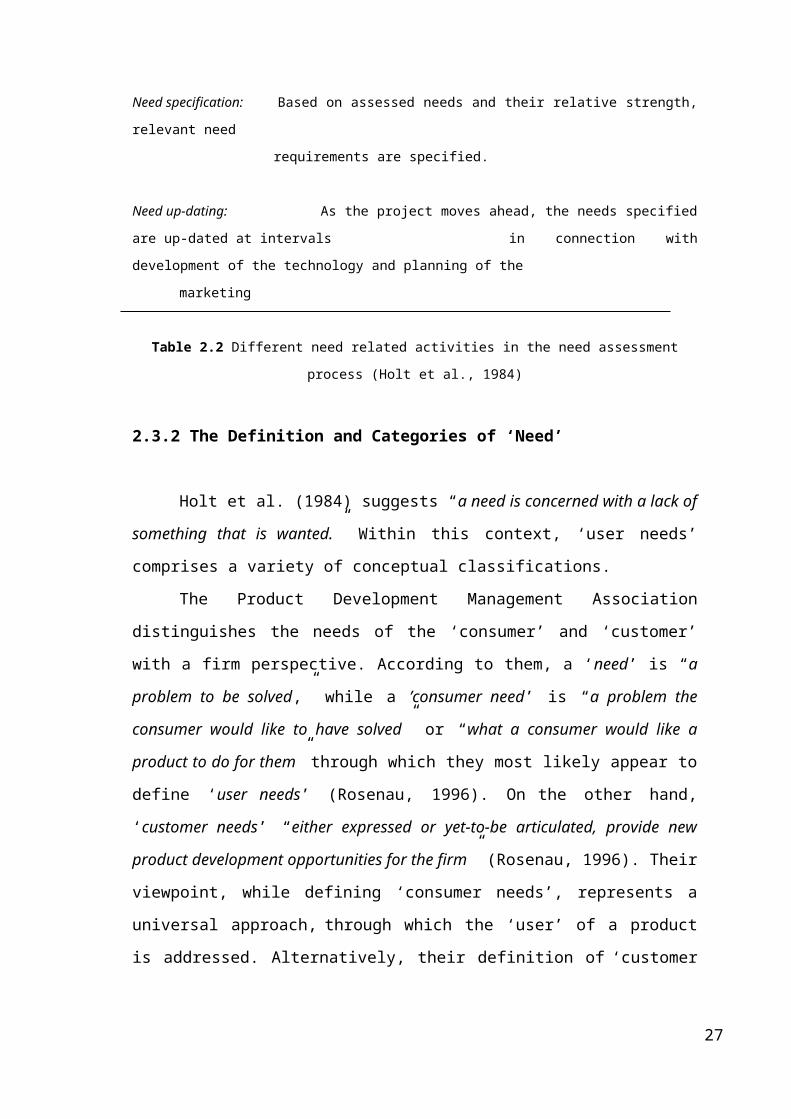
Need specification: Based on assessed needs and their relative strength, relevant need
requirements are specified.
Need up-dating: As the project moves ahead, the needs specified are up-dated at intervals
in connection with development of the technology and planning of the
marketing
Table 2.2 Different need related activities in the need assessment process (Holt et al., 1984)
2.3.2 The Definition and Categories of ‘Need’
Holt et al. (1984) suggests “a need is concerned with a lack of something that is
wanted.” Within this context, ‘user needs’ comprises a variety of conceptual
classifications.
The Product Development Management Association distinguishes the needs of
the ‘consumer’ and ‘customer’ with a firm perspective. According to them, a ‘need’ is
“a problem to be solved,” while a ’consumer need’ is “a problem the consumer would
like to have solved” or “what a consumer would like a product to do for them” through
which they most likely appear to define ‘user needs’ (Rosenau, 1996). On the other
hand, ‘customer needs’ “either expressed or yet-to-be articulated, provide new product
development opportunities for the firm” (Rosenau, 1996). Their viewpoint, while
defining ‘consumer needs’, represents a universal approach, through which the ‘user’ of
17
a product is addressed. Alternatively, their definition of ‘customer needs’ mostly refer
to user need knowledge that would constitute input for the new product development
process.
Since the term ‘need’ also conceptually covers a wide scope of implications;
Holt et al. (1984) classify ‘user needs’ with a variety of contexts. Their classification
mainly relies on ‘time’ and ‘emotion’ variables and whether the need is an individual or
a societal one. Considering the ‘time’ variable, user needs comprise:
• Existing needs: recognized discrepancy between existing and wanted
situation,
• Future needs: do not exist at present, but will materialize in the future (Holt
et al., 1984).
Existing needs of users are rather easy to assess, as users are mostly aware of
what are their needs in a conscious manner. The main aim of assessing existing needs is
to satisfying functional and emotional needs of the user considering a particular product
or service. Through assessing this kind of need, product appeal is the focus of the
assessment activity and factors including safety, durability, ease of maintenance,
environmental pollution, preservation of resources, and so on are disregarded (Holt et
al., 1984). Information related to existing needs is mainly utilized to the product design
& development activities in order to improve a product or service.
Assessing future needs of users is important particularly for developing radically
new products through the new product development process. The assessment of future
needs provide the innovation process with changes in “need patterns and user
preferences” caused by socio-cultural changes including “growing urbanization,
increasing purchasing power, higher level of education, energy saving, environmental
protection” and so on (Holt et al., 1984). Assessing future needs is also important from
the innovating firm’s perspective in order to plan future innovation activities and
product development facilities. Since developing relatively new products takes a
particular time from product proposal to market introduction, future need related
information is important for the firm “to look into the future and find out what the
needs, wants and tastes will be when the product is ready for the market” (Holt et al.,
1984).
Holt et al. (1984) argue that, besides future needs; ‘new needs’ might emerge
along with new technological opportunities as well. According to them, users could be
aware of their needs only if they know actual possibilities of a product or service.
18
Marzano (1997) also outlines, “people are notoriously unable to forecast what is
possible.” As per him, people do not know what they want until they actually see the
possibilities. However, the emergence of a ‘new need’ is only due to the materialization
of a technical opportunity.
Another variable that leads to the classification of user needs is ‘emotion’. Holt
et al. (1984) distinguish user needs as:
• Emotional needs: these are concerned with novelty, style, color and other
characteristics of an aesthetic nature,
• Rational needs: these are concerned with function and use (Holt et al., 1984).
Holt et al. (1984) discuss that satisfying the needs of the user is a subjective
issue, which is mostly achieved at the emotional level. In the emotional extent,
satisfying user needs rely on responding the need with proper ‘values’ that users
appreciate. These values could be categorized as (1) “affective values, pertaining to
emotions aroused by the use of the product,” (2) “symbolic values, referring to self-
image and status the product holds for the user,” and (3) “character values, which refer
to the personality of the product” (Holt et al., 1984). The emotional needs of users
change also in time, through which significant changes in tastes and preferences take
place. Holt et al. (1984) exemplify this circumstance with the textile industry, in which
tastes are changed in shorter periods, i.e. seasons.
The last variable to determine the classification of user needs is ‘scale’, which
determines whether the need is an ‘individual’ or a ‘societal’ one. Individual needs
comprise the basic user needs including “food, clothing, et cetera” (Holt et al., 1984).
These needs have been considerably satisfied in mostly industrialized societies, whereas
societal needs stands to be unfulfilled in a number of areas including “energy,
transportation, communication, medical care, occupational health and safety, the
quality of working life, education, leisure time, resource depletion, energy conservation,
environmental protection, et cetera” (Holt et al., 1984).
Considering all mentioned above, the ‘need’ concept is a multifaceted concern
that has to be studied from a variety of perspectives. Innovation studies clearly show
that user needs constitute the most important and valuable source for innovation in the
search for developing products or services that are meaningful to the users.
19
2.3.3 Methods for Assessing User Needs
The studies on innovation have shown that ‘need assessment’ is the most
valuable input for the innovation process to develop successful products and services
(Holt et al., 1984).
In contrast, in today’s dynamic environment with enormous changes in user
needs and expectations, utmost technological advancements, growing international
competition and decreasing product life cycles, the only way for companies to survive is
a good coupling of thoroughly understanding user needs with an awareness of
technological possibilities (Crush, 2000; Holt et al., 1984). To understand the real needs
of the users, it is needed to apply systematic, well-defined procedures and ‘methods’
through the process of collecting need related information.
Studies on innovation conclude with a number of ‘methods’ defined to assess
user needs. These methods vary in a couple of factors, such as the industrial sector,
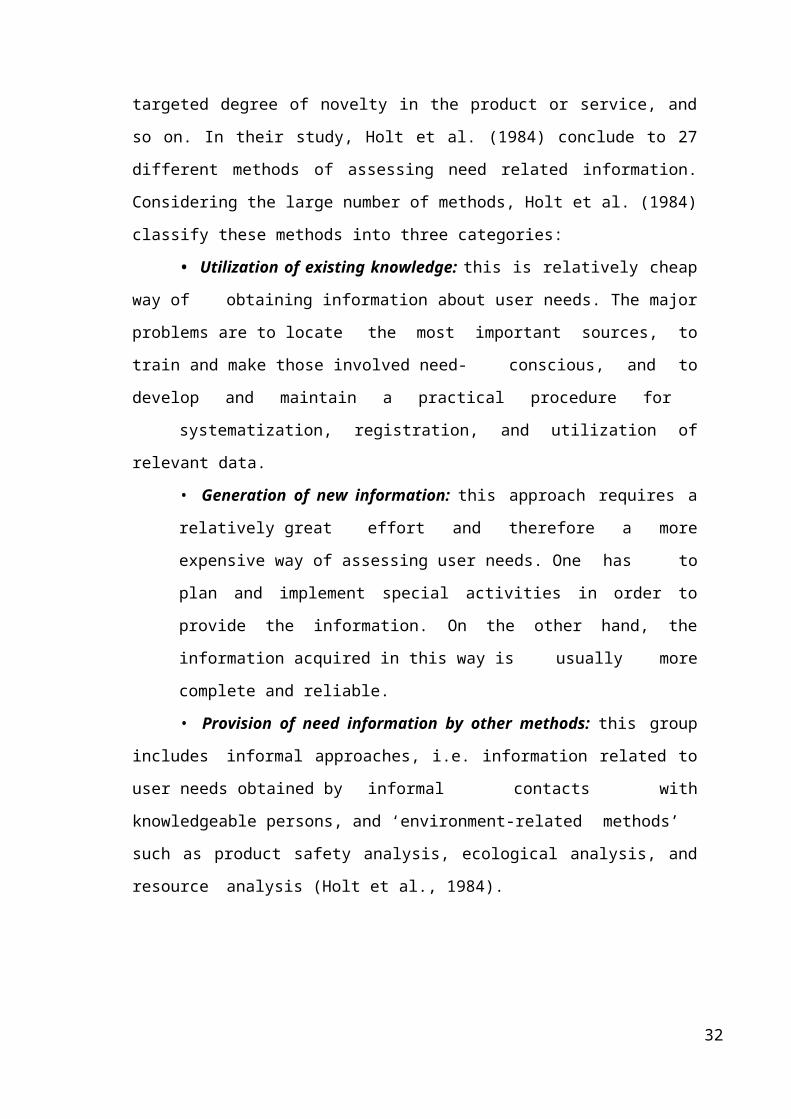
targeted degree of novelty in the product or service, and so on. In their study, Holt et al.
(1984) conclude to 27 different methods of assessing need related information.
Considering the large number of methods, Holt et al. (1984) classify these methods into
three categories:
• Utilization of existing knowledge: this is relatively cheap way of
obtaining information about user needs. The major problems are to locate
the most important sources, to train and make those involved need-
conscious, and to develop and maintain a practical procedure for
systematization, registration, and utilization of relevant data.
• Generation of new information: this approach requires a relatively great
effort and therefore a more expensive way of assessing user needs. One has to
plan and implement special activities in order to provide the information. On the
other hand, the information acquired in this way is usually more complete and
reliable.
• Provision of need information by other methods: this group includes
informal approaches, i.e. information related to user needs obtained by
informal contacts with knowledgeable persons, and ‘environment-related
methods’ such as product safety analysis, ecological analysis, and resource
analysis (Holt et al., 1984).
20
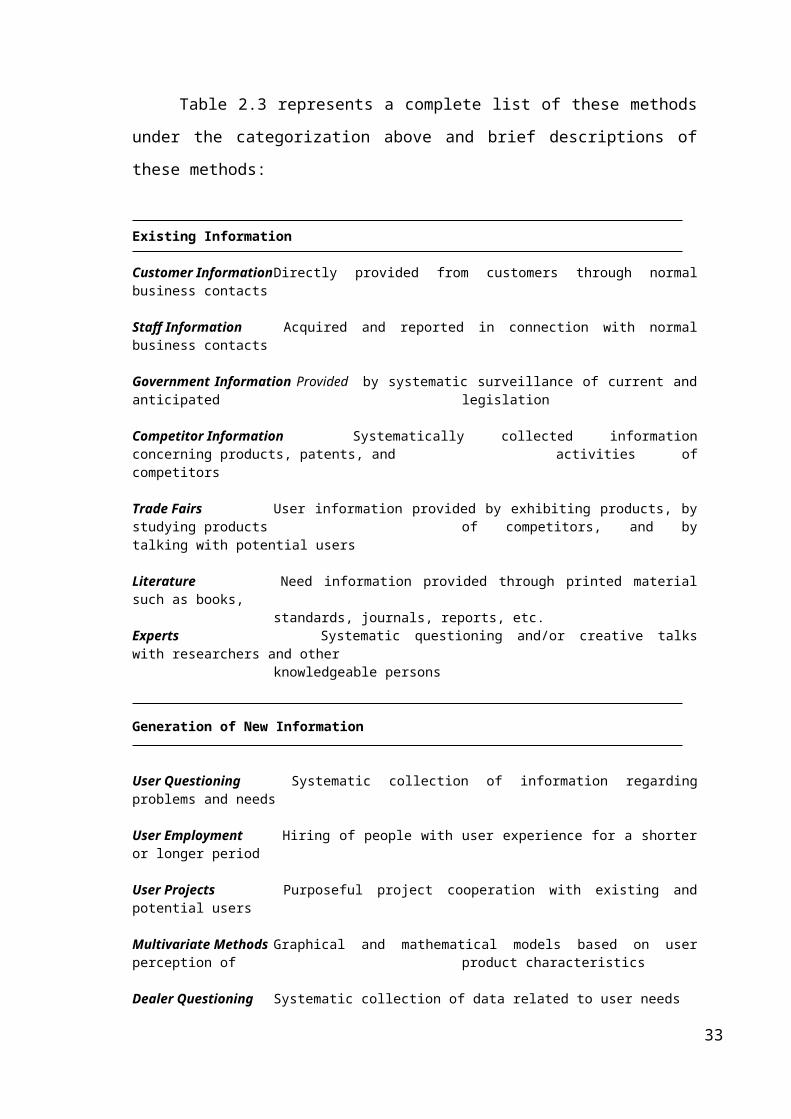
Table 2.3 represents a complete list of these methods under the categorization
above and brief descriptions of these methods:
Existing Information
Customer Information Directly provided from customers through normal business contacts
Staff Information Acquired and reported in connection with normal business contacts
Government Information Provided by systematic surveillance of current and anticipated legislation
Competitor Information Systematically collected information concerning products, patents, and activities of competitors
Trade Fairs User information provided by exhibiting products, by studying products of competitors, and by talking with potential users
Literature Need information provided through printed material such as books,standards, journals, reports, etc.
Experts Systematic questioning and/or creative talks with researchers and otherknowledgeable persons
Generation of New Information
User Questioning Systematic collection of information regarding problems and needs
User Employment Hiring of people with user experience for a shorter or longer period
User Projects Purposeful project cooperation with existing and potential users
Multivariate Methods Graphical and mathematical models based on user perception of product characteristics
Dealer Questioning Systematic collection of data related to user needs
User Observation Systematic study of what is unsatisfactory by observing and analyzing the behavior of those involved
Active Need Experience Working in a relevant environment for a certain period of time
Simulation Performing or observing the work in a laboratory or other setting where a real-life situation is created
Brainstorming Creative thinking based on free association, deferred judgment, and crossfertilization
Confrontation Creative thinking stimulated by analogies
Morphological Analysis Creative thinking by a systematic break-down of problem in parts
Progressive Abstraction Ranking of relevant needs in a hierarchical order
Value Analysis Creative thinking stimulated by study of primary and secondary function and their costs
21

Delphi Method Succession of iterative statement with participants interacting by written communication
Scenario Writing Development of alternative futures
System Analysis Systematic analysis of problems and needs caused by changes in a system or related subsystems
Other Methods
Informal Contacts Information provided through informal talks with people willing to indicate problems, needs and wishes
Product Safety Analysis Study of product in order to minimize injuries, damages, and losses
Ecological Analysis Improve environmental consequences of a proposed product
Resource Analysis Improve resource utilization in a proposed product
Table 2.3 Methods for obtaining need related information (Holt et al., 1984).
2.3.4 Organizing for Need Assessment Activity
The study of Holt et al. (1984) represents only a fraction of methods designed
for need assessment to be used the innovation process. The vast number of methods in
the literature also entails organizations to progress a careful selection, planning, and
application of a ‘system’ of methods. Holt et al. (1984) argues that this activity of
developing a ‘system’ of assessing user needs would influence by a number of factors in
a firm including business concept, corporate strategy, type of market, driving force
behind technological development, structure of the user segment, access to the user
segment, and attitude of management.
Another concern in developing a system for the need assessment activity is the
selection of proper organization to execute this systematic activity. The innovation
literature does not generally signify a type of organization to carry out the need
assessment activity. However, innovation studies mostly agree that the overall task of
assessing user needs should be assigned to a specified organizational unit and other
organizations, those execute the innovation process, should manage the applicable need
assessment methods through developing and marketing new products or services (Holt
et al., 1984).
22
Holt et al. (1984) also suggest “successful identification of user needs depends
considerably on the personal sensitivity of those who are in contact with users, i.e.
their ability to perceive needs and unsolved problems.” In this sense, the members of
the organization to be in contact with users should be selected from people with high
sensitivity to problems and needs of users. Holt et al. (1984) mentions that people “with
a creative mind” are more apt to identify problems and needs of the users.
2.3.5 Customer Expectations v.s. Product Configuration
It is crucial to understand the customer expectations before designing a new
product. A simple example on the importance of this issue is explained below.
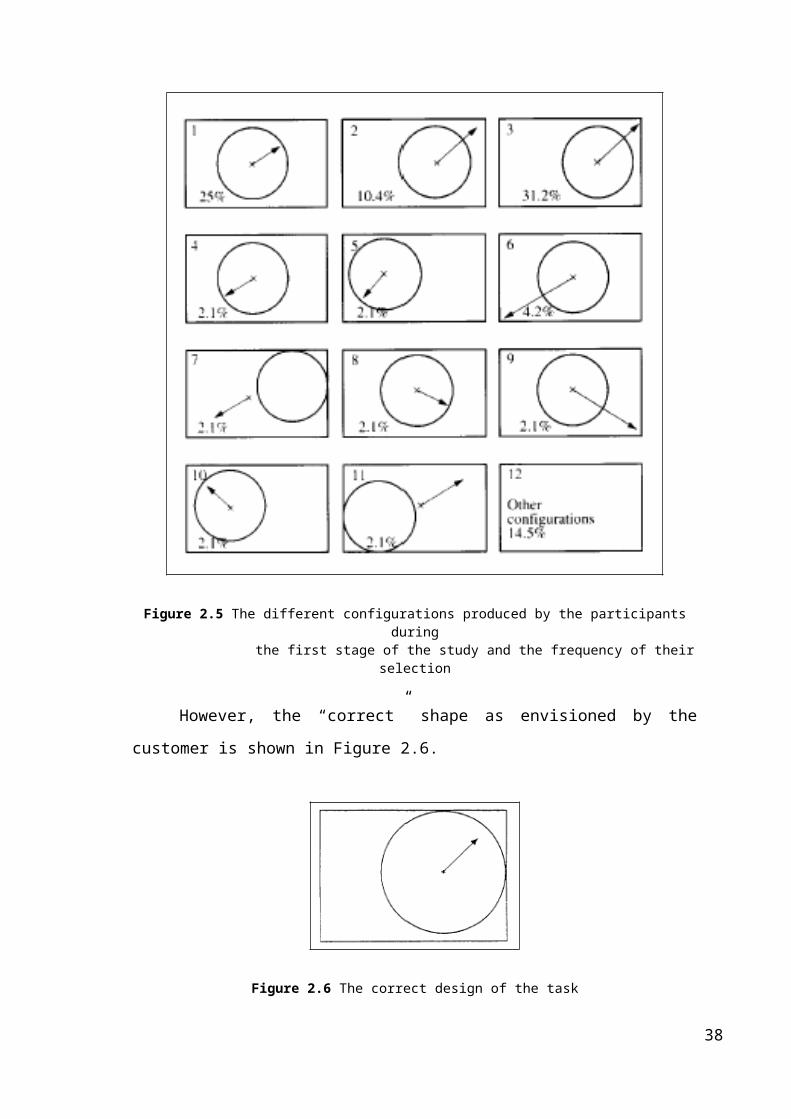
Meeting customer expectations is not a straightforward issue. A study has been
made to investigate the causes of differences between initial customer requirements and
product specifications (Globerson, 1997). Experimental subjects were asked to perform
a simple task according to written instructions. The instructions were written so as to
purposely include uncertainty and ambiguity. The instructions were as follows:
On a sheet of paper, draw a rectangle,
Inside the rectangle, draw a circle,
From the center of the circle, draw an arrow towards one of the corners.
The study was administered to 96 students as part of an advanced MBA course in
project management. A typical participant had a BSc degree in engineering and worked
in a project environment either as a designer or as a project manager. The study
consisted of three stages, as follows:
Stage 1: Participants were requiested to sketch the shape/ product according to
the above description, without the opportunity to ask clarification questions
Stage 2: Participants were asked to write quaestions whose answers would
clarify the ambiguity and uncertainty concering the task description.
Stage 3: Participants were requiested to chart the product again, using the new
information they had obtained.
Figure 2.5 presents the design results of the first stage:
23
Figure 2.5 The different configurations produced by the participants during the first stage of the study and the frequency of their selection
However, the “correct” shape as envisioned by the customer is shown in Figure
2.6.
Figure 2.6 The correct design of the task
It has been discovered that the following additional information is required to
draw and design described in Figure 2.6 correctly:
Dimensions of the rectangle,
24
Location of the circle,
Diameter of the circle,
Origin of the arrow,
Length of the arrow,
Direction of the arrow.
Both customer and designer face ambiguity and uncertainty when dealign with the
configuration of a new product. A customer may not be aware that (s)he cannot specify
all the configuration parameters required for accurate design of the product. By the
same token, the designer is aware only of the parameters mentioned by the customer,
although they may not properly represent his/her complete perception of the desired
product. The only effective way to close this gap is to make sure that the customer is
suitably involved in the design process so that all relevant design parameters are
incorporated. Designers should accept the fact that the initial product requirement
document does not necessarily represent the end result that the customer wishes to see.
Therefore, in spite of the design-freeze concept used in project management,
organizational culture should support customer and producers in dealing with ongoing
product requirement changes.
The idea is the importance of the well-known TQM phrase “do it right the first
time”. In this case it means that customer requirements should be done right the first
time since the product configuration is derived from them. Therefore, companies should
involve designers in the stage of defining the functional needs, since these dictate the
product configuration.
Since a customer is rarely able to completely specify his needs in the initial
stage, changes will have to be introduced into the initial design. Therefore, a mechanism
for introducing future changes must also be specified in the initial contract.
2.4 DESIGN KNOWLEDGE, PROCESS, METHODS
The practice of ‘design’ utilizes certain forms of input and specific methods
through the design process. Apart from other practices, ‘design’ practice pays particular
attention to ‘design methods’, mostly due to the ‘ill-defined’ nature of design problems,
which are ‘context’ and ‘situation’ dependent. Design activity deals with a large number
25
of different and, often, conflicting aspects, which entails a systematic and
methodological approach to the problems (Buijs, 1998).
The resolution of these ill-defined problems also needs the utilization of certain
forms of knowledge to be obtained from a variety of sources. The knowledge that
design activity requires might also incorporate ‘tacit’ forms of knowledge and depend
on ‘expertise’ in particular industries (OECD, 1992). Therefore, due to the nature of the
design activity, a number of sources of knowledge are employed through the design
process.
2.4.1 Design Knowledge
As stated before, design activity incorporates certain forms of knowledge that
might comprise ‘tacit’ or ‘explicit’ information. For Buijs (1998), design activity is a
process of information processing. The mentioned ‘information’ here comprises of
information about the customer, competitors and their products, manufacturing
processes, available materials, environmental consequences, logistics, after-sales
service, maintenance, safety regulations, legal standards, quality, distribution system,
and about the socio-cultural context in which the customers want to use a new product
(Buijs, 1998).
Alternatively, Friedman (2000) suggests that ‘knowledge’ differs from
‘information’ in that ‘knowledge’ represents “agency and purpose.” According to him,
“information may be stored in information systems” while “knowledge is embodied in
human beings.” Here, Friedman (2000) emphasizes that ‘knowledge’ is an individual
act based on individual accumulation of acquaintance and understanding gained by
experience.
Moreover, Friedman (2000) puts forward that design knowledge comprises of
several domains of knowledge, those represented in the taxonomy in Table 2.4.
According to him, each domain of knowledge requires the design practitioner a broad
scope of skills and awareness with a systematic way of thinking to utilize them through
design practice.
Furthermore, the increasing change and enhancement in user needs entail design
practitioners to apply sophisticated level of knowledge in order to respond user needs
satisfactorily (Popovic, 1999). Therefore, henceforth, design practice needs a more in-
depth assessment of user knowledge and “integrate design knowledge and domain-
26
specific knowledge about the product users” (Popovic, 1999). User knowledge must
comprise a thorough understanding of users, their needs, their knowledge and
experience of the products and services they use. Popovic (1999) suggests, “designers
should begin designing with good knowledge of the users, and include users as a part of
the project team.”
Domain 1: Domain 2: Domain 3: Domain 4:
Skills for Learning and The Human World The Artifact The Environment Leading
Table 2.4 Taxonomy of the domains of design knowledge (Friedman, 2000).
27
2.4.2 Design Process
The design literature involves numerous models describing the nature of this
process. However, these models do not agree with each other that makes it impractical
to depict a generic model of the design process.
Fox (1993) explains that product design is a business and requires the
knowledge and skills to determine cost and the ability to take decision associated with
cost. The process of manufacturing parts and assembling them is a skill that must be
incorporated into the design process rather than added on at the end. Figure 2.7 shows a
matrix of the skills that form this generic design team against the elements of the
knowledge base for a typical design.The primary skills for each contributor are shown
shaded, while those of a secondary nature are shown unshaded.
Artist Industrial Design
Concept design
Product design Detail
CREATION
FORM
INNOVATION
DRAWING
MATERIALS
ANALYSIS
PHYSICS
COSTING
MANUFACTURING
Figure 2.7 The Skills of Design
The artist’s role is to bring aesthetic excellence to the design of the product . The
aim is to appeal to the customer with beauty and an appearance that does not intrude
excessively into the customer’world. The artist needs to be skilled in creation, form and
drawing, and to a lesser extent innovation.
The industrial designer adds practical aesthetic to design, usually in the way of
form, and will become influenced by the ergonomic and humon factor aspect of the
28
design. These skills move toward the more practical end of the scale with emphasis
onthe knowledge of materials, particularly as used to enhance appearance and form.
The concept designer is the central figure in the design activity and must have
knowledge of all aspect of the design from the materials that enable the shaping of the
form required by the industrial designer to the costing of each part to be manufactured.
A sensitive path must be trod between all the aspects of the design to deliver a balance
that is acceptable for a successful product. The skills of the concept designer are broad
and understanding of all aspects is extensive. The product designer is less involved with
creativity and form and more with practical consideration such as cost and
manufacturing.
The attention of the dealer is focused on the construction of the drawing and the
documentation which gives the design its final definition, recording every element of
the manufacturing as an information package for the future.
Jones (1992) illustrates the design activity as a three-stage process embodying
analysis, synthesis, and evaluation stages. He identifies these three stages as: (1)
‘divergence’ through which the design problem is broken into pieces, (2)
‘transformation’ comprising the rearrangement of pieces in a new way, (3)
‘convergence’ testing the output of the ‘transformation’ phase by putting the new
arrangement into practice. The model of Jones (1992) of the design process represents
an extensive approach to the design process that most of other approaches agree to some
extent. Furthermore, in this model, every stage is increasingly less general and more
detailed than the one before it (Jones, 1992).
The initial stage of this model is the ‘divergence’ phase, which aims “to de
structure or destroy, the original brief while identifying these features of the design
situation that will permit a valuable and feasible degree of change” (Jones, 1992). In
this phase, the boundaries of the design problem are extended so that it can provide
designers a wide space to seek a solution to the studied design problem. Through this
phase, the points that are open to any change are identified as well as the fixed points of
the design problem. According to Jones (1992), the second phase of the design process
is ‘transformation’, which is the stage of high level creativity. In this stage, “judgments
of values, as well as of technicalities, are combined in decisions that should reflect the
political, economic and operational realities of the design situation” (Jones, 1992).
Jones (1992) argues that the output of this stage does not represent an optimal solution,
but a general character of the design solution.
29

The third and eventual phase of this model of the design process is
‘convergence’, which aims “to reduce a range of options to a single chosen design as
quickly and cheaply as can be managed and without the need for unforeseen retreats”
(Jones, 1992). Through this phase, the imperfect solutions of the ‘transformation’ phase
are finalized to an optimal design and launched as the final output of the whole design
process.
Figure 2.8 Simplified four-stage model of the design process (Cross, 2001).
The model of Jones (1992) represents a very general outlook of the design
process that almost every study on the nature of the design process agrees. However, the
design literature signifies a variety of models of the design activity with different levels
of specification. Cross (2001) also suggests a simplified model of the design process
that consists of four stages that are (1) exploration (2) generation (3) evaluation (4)
communication. Figure 2.8 represents his simplified model of the design process.
In this model, the ‘exploration’ phase represents the phase when the designer
investigates both the problems of the design situation and solutions concerning those
problems. In the ‘generation’ phase, the designer generates design proposals, through
which he or she considers many aspects in relation with the proposal, including
materials, components, functions, structure, and so on. Later, in the ‘evaluation’ phase,
the generated design proposals are evaluated and refined in order to ensure that the
design proposal meets certain criteria to be a solution to the defined design problem.
The eventual stage of the design process is ‘communication’ through which the
30
evaluated design proposal is given the final form. The output of this phase is the
detailed description of the final form of the design that signifies a guide the production
of the artifact.
Cross (2001) also suggests that the ‘evaluation’ phase does not always lead to
the ‘communication’ phase and may give a feedback to the ‘generation’ stage of the
design process. According to him, these ‘feedback loops’ provides the generation of
new and more satisfactory concepts and helps the process achieve a less imperfect
output of the design process. Within this perspective, Cross (2001) refers to French
(1985), who suggests that feedback loops might return to earlier stages of the process.
According to French (1985), the analysis of the problem is a rather small but important
phase of the design process that feedback loops should provide returns to this initial
phase.
Figure 2.9 French’s model of the design process
31
In his model (Figure 2.9), the process starts with the input of a ‘need’ that
activates the first phase of the process, which is the ‘analysis of the problem’. The major
output of this phase is the ‘statement of problem’ along with the information on certain
design criteria relevant to the design problem. The statement of problem leads to the
‘conceptual design’ phase, through which “engineering science, practical knowledge,
production methods and commercial aspects need to be brought together” (French,
1985). The output of the ‘conceptual design’ phase is broad solutions of the design
problem in certain ‘schemes’. In the next phase, named the ‘embodiment of schemes’,
these schemes are evaluated and arranged in a final set of drawings. ‘Detailing’ is the
eventual stage of the design process, through which the details of the final design are
decided and transformed into final drawings as the output of the design process.
Whereas the model that French (1985) suggests that the initial stage of analyzing
the problem is important, some studies on the nature of design process discuss that the
initial stage of the design process needs far more ‘analytical’ work and an in-depth
understanding of the design process. These studies exemplify this situation mentioning
“plenty of examples of excellent solutions to the wrong problem” (Cross, 2001). The
model that Jones (1992) suggests could also be considered as a simplified example of
these ‘analytical’ models of the design process.
One of the significant models of the above-mentioned ‘analytical’ approach is
that of Archer (1984). His model comprises six types of activity including:
Programming: establish crucial issues; propose a course of action,
Data collection: collect, classify, and store data,
Analysis: identify sub-problems; prepare performance (or design) specifications;
reappraise proposed programme and estimate,
Synthesis: prepare outline design proposals
Development: develop prototype design(s); prepare and execute validation
studies,
Communication: prepare manufacturing documentation (Original source,
Archer, 1984; Quoted from, Cross, 2001).
The model that Archer (1984) suggests distinguishes from other models in that it
utilizes multiple sources of knowledge and embodies numerous feedback loops
throughout the process. Archer (1984) also splits the design process into three main
phases, which are (1) analytical, (2) creative and (3) executive. According to Archer
32
(1984), in the ‘analytical phase’, the activities comprise ‘objective observation’ and
‘inductive reasoning’ while the ‘creative phase’ mostly rely on ‘involvement’,
subjective judgment’, and ‘deductive reasoning’. Eventually in the ‘executive phase’,
final decisions are made; the design is finalized in the form of drawings, schedules, etc
(Archer, 1984). Figure 2.10 represents Archer’s model extensively.
Figure 2.10 Archer’s model of the design process (left), and his three-phase summary of his model (right)
Recent studies on the nature of the design process suggest more detailed and
interactive models of the process. However, in the same way as Cross (2001) discusses,
they by some means obscure the general structure of the design process. Therefore,
considering the aims of this study, models that rather represent the general structure of
the design process are studied.
2.4.3 Design Methods
Design literature describes a set of ‘design methods’ whereas some sources
mention a ‘design methodology’. Whether these two phrases refer to each other or not is
usually subject to confusion. Although a ‘design methodology’ may exist within a
distinct context, ‘design methods’ should be referred to while implying certain
procedures and techniques executed through the design activity.
33

The emergence and development of conventional design methods mainly rely on
individual efforts and insights of design practitioners and other individuals in relation to
the production of artifacts, while conventional methods have emerged due to the needs
of the complicated nature of the design activity.
2.4.3.1 Conventional Methods
Jones (1992) argues that the initiator of the design activity is the ‘craftsman’
who was the “maker-of-things”. The craftsman uses the skills and methods of the
craftsmanship to evolve shapes into products. Nevertheless, the factors that resulted in
the occurrence of the ‘industrial revolution’ also brought about new skills and methods
in early design activity. In fact, the most significant change in the design activity is the
need for ‘drawing’ a product or structure before its production, which eventually led to
the emergence of the method, ‘design-by-drawing’ (Jones, 1992; Cross, 2001).
2.4.3.2. Creative Methods
Since creative thinking is an extremely important part of the design process,
some design methods are devoted to stimulate creativity in design process. The most
well-known and practiced creative methods are ‘brainstorming’, ‘synectics’, and
‘enlarging the search space / removing mental blocks’ (Cross, 2001; Jones, 1992).
Brainstorming: Jones (1992) defines ‘brainstorming’ method as aiming “to
stimulate a group of people to produce many ideas quickly.” Although he mentions that,
this method increases the ‘quantity’ of the ideas, he argues that it may also foster the
‘quality’ of the ideas generated. His argument is supported by the definition suggested
by Cross (2001), who describes this method as an activity “for generating a large
number of ideas, most of which will subsequently be discarded.” From this perspective,
it can be concluded that ‘brainstorming’ method aims to quickly elucidate as much ideas
as possible to avoid overlooking valuable ones.
The ‘brainstorming’ method provides the design process with a variety of
perspectives that could not be gained through conventional methods. This method could
be applied simply and directly and at any stage of the design process, unless the design
process is stabilized. The ‘brainstorming’ activity might also be used to generate
‘information’ instead of ‘ideas’ (Jones, 1992).
34

Synectics: According to Jones (1992), in ‘synectics’, the aim is “to direct the
spontaneous activity of the brain and the nervous system towards the exploration and
transformation of design problems.” Cross (2001) identifies ‘synectics’ as the
formalization of “analogical thinking.” Similar to ‘brainstorming’, ‘synectics’ is a
group activity, through which the members of the group try to generate and combine
ideas to develop a creative solution to a certain problem. This method differs from
‘brainstorming’ in that the group tries to generate ideas together on a particular design
problem, instead of trying to generate as much ideas as possible. In addition, a
‘synectics’ session takes much longer than a ‘brainstorming’ session (Jones, 1992;
Cross, 2001). In conclusion, the ‘synectics’ method provides unusual and creative
solutions for a design problem, however it involves certain risks and disadvantages.
Enlarging the Search Space: The aim of this method is expanding the solution
areas of the design problem with certain techniques. Jones (1992) identifies this method
as “removing mental blocks” which aims “to find new directions of search when the
apparent search space has yielded no wholly acceptable solution.” Cross (2001)
suggests four techniques in practicing this method as (1) ‘transformation’ through which
the search for a solution is transformed from one solution area to another, (2) ‘random
input’ which is used to facilitate creativity by providing random inputs from any source,
(3) ‘why? why? why?’ by which the search space is extended through asking ‘why?’
questions about the problem, (4) ‘counter-planning’ which is used to challenge an
existing solution to a problem by suggesting its opposite. This method is rather
applicable when the search area for a complex problem is limited to generate any
solutions.
2.4.3.3. Rational Methods
The creative phase is the most important stage of the design process in search of
‘novelty’ through the design activity. However, the design activity also requires certain
methods that bring a systematic approach to the whole design process. Hence, ‘rational
methods’ aims to enhance the quality of both the design decisions and the product. This
method also encourages teamwork, by which the tasks could be divided into minor tasks
to be achieved by a team. The checklist illustrates the systematic approach to a set of
35
tasks, whereas the design activity entails complicated methods or a set of methods to be
systemized.
Cross (2001) indicates a set of rational methods covering all stages of the design
process. Figure 2.11 represents an overview of his set of methods in different stages of
the design process.
Figure 2.11 Simplification of Cross’s set of rational methods (Cross, 2001)
According to Cross (2001), these methods serve different purposes in different
stages of the design activity. In his suggestion, each method might lead to the initiation
of the subsequent one, whereas alternative methods might replace the methods applied
in his coupling. He suggests the following combination of methods to be applied in the
subsequent stages of the design process.
The Objectives Tree Method: This method refers to the important first step of
the design process where the objectives of the design activity are clarified. Cross (2001)
defines the aim of the ‘objectives tree method’ as “to clarify design objectives and sub-
objectives, and the relationships between them.” While practicing this method, three
main steps should be followed. Initially, a list of design objectives is prepared utilizing
a variety of sources such as the design brief, expectations of the client, arguments of the
design team and so on. In the latter step, the listed objectives and sub-objectives are
grouped in a hierarchical order. Eventually, an illustrative tree of objectives is drawn
representing the hierarchical relationships and linkages between all objectives.
36
The ‘objectives tree method’ helps the design team achieve a clear and helpful
statement of objectives, which represents the set of objectives and the outline of the path
that would be followed in order to achieve those objectives. The output of this method
also helps the design team and their clients agree on the stated objectives.
The Function Analysis Method: To adequately meet the stated objectives of the
design activity, instead of solutions, essential functions of a solution should be
established. This attempt defines the level of the design problem, i.e. whether a problem
should need a radical design change or a design improvement. Regarding this, the
‘function analysis method’ aims “to establish the functions required, and the system
boundary, or a new design” (Cross, 2001).
According to Cross (2001), the ‘function analysis method’ entails five main
steps to be carried out, which are (1) expressing the overall function of the design
activity in terms of transforming process inputs into outputs, (2) dividing the overall
function of the design activity into a set of essential sub-functions, (3) illustrating the
interactions between sub-functions in a block diagram, (4) drawing the system boundary
that defines the functional limits of the design solution, and (5) searching for suitable
components to meets the sub-functions and the interactions among them.
In conclusion, the ‘function analysis method’ method draws the outline of the
essential functions that the output of the design activity would be expected to satisfy.
Therefore, the design team is enabled to develop alternative solutions that meet these
predefined functions.
The Performance Specification Method: Although identifying the objectives
and functions of the design activity clarifies the requirements of a design solution, they
are not identified in exact limits. For that reason, certain boundaries should be set to the
solution space for the design team to search for solutions. Cross (2002) describes the
aim of ‘the performance specification method’ as “to make an accurate specification of
performance required of a design solution.”
Cross (2001) signifies the procedure of this method in four phases that comprise
(1) considering the different extents (the level of generality) that the solution might
cover in an applicable manner, (2) deciding on the extent to study in, (3) apart from any
solutions, identifying the required performance characteristics, and (4) precisely
specifying specific performance requirements for each characteristics.
In summary, the ‘performance specification method’ helps the design team
determine and specify the design problem in order to establish the study space and
37
means of adequately resolving the problem for the designers. This method identifies the
necessary performance that the solution should achieve instead of physical components
of the product. Furthermore, Cross (2001) suggests that the ‘performance specification
method’ could also be used in the later phases of the design process in evaluating the
arrived solutions whether they exist within the specified boundaries of the specified
performance.
The Morphological Chart Method: Considering all of the phases of the design
process, ‘generating alternatives’ stage stands to be the most essential and central one,
through which novel solutions or re-orderings of existing solutions to a design problem
is generated in different levels of novelty. In this essential phase of the design process,
the ‘morphological chart method’ provides designers with “the complete range of
elements, components, or sub-solutions that can be combined together to make a
solution” (Cross, 2001).
Cross (2001) suggests that the ‘morphological chart method’ would be classified
as a rational method, while according to Jones (1992), this method is essential to search
for creative ideas, therefore might stand to be a creative method.
The practice of ‘morphological chart method’ aims “to widen the area of search
for solutions to a design problem” (Jones, 1992). The aim of this method appears
similar to that of ‘enlarging the search space’ method, while the use of ‘morphological
charts’ differs in its use in the “exploration of unbounded and undefined problems”
(Jones, 1992). Cross (2001) signifies the aim of this method as “to generate the
complete range of alternative design solutions for a product, and hence to widen the
search for potential new solutions.”
Jones (1992) identifies the ‘morphological chart method’ to develop in three
main steps, which are (1) definition of the functions that any satisfactory design should
be able to perform, (2) listing a broad range of sub-solutions on a chart, and (3)
selection of an satisfactory set of sub-solutions that meets the set of functions.
In summary, according to Jones (1992), facilitating creative thinking by
‘morphological charts’ prevents the design team to overlook novel solutions to the
design problem. Furthermore, this method has the advantage of concluding a matrix in a
short time if the set of functions are identified properly at the initial stage of the activity.
The Weighted Objectives Method: Subsequent to the generation of alternatives,
these alternative solutions need to be evaluated in order to choose the solution which
best fits the statement of objectives that the design solution has initially meant to
38
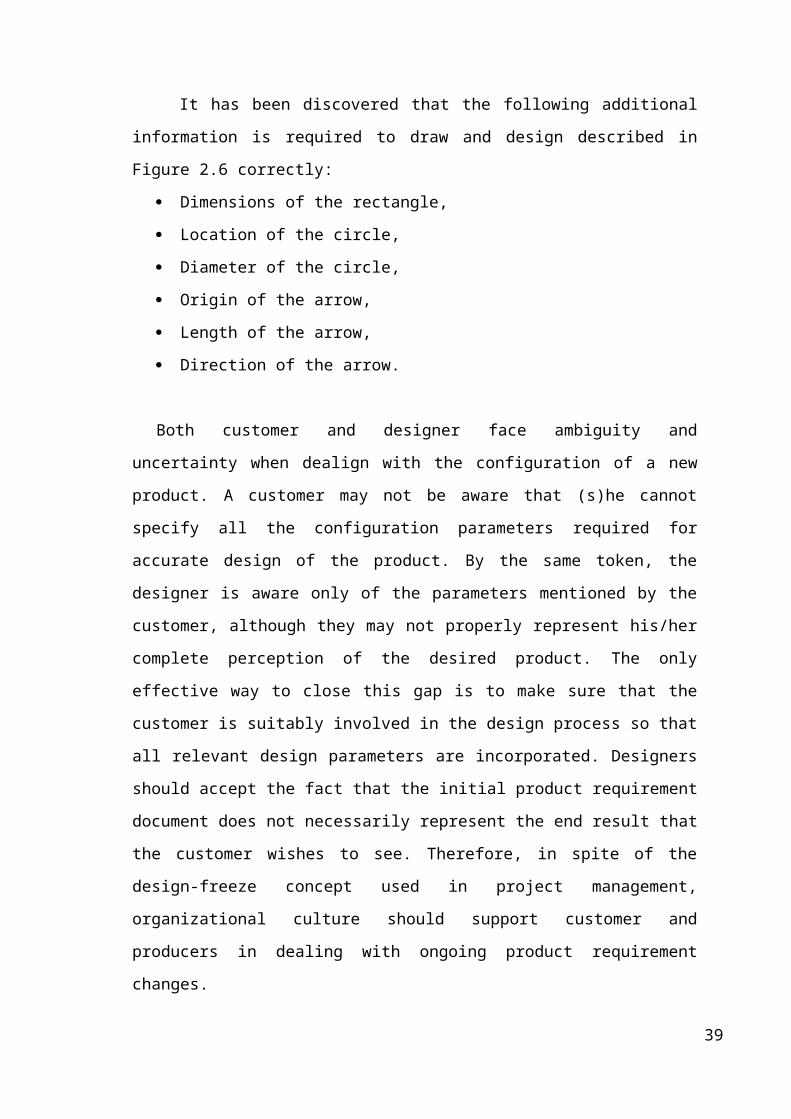
achieve. However, particular characteristics of different solutions might match different
aspects in the design objectives. Therefore, the ‘weighted objectives method’ provides
the evaluation and comparison among alternative solutions by differently weighing the
initial design objectives (Cross, 2001).
Cross (2001) mentions that the main aim of the ‘weighted objectives method’
method is “to compare the utility values of alternative design proposals, on the basis of
performance against differentially weighted objectives.” The practice of this method
entails a five-step-process to be carried out including (1) listing the initial design
objectives, (2) identifying numerical rankings to the objectives and ordering them, (3)
giving comparative weightings to the objectives, (4) determining certain performance
parameters or utility scores for all objectives, and (5) analyzing and comparing the
comparative utility values of the alternative solutions, multiplying each parameter score
by its weighted value and arriving to the alternative solution having the highest sum
value.
The ‘weighted objectives method’ appears to be the most rational method
reviewed in this section. Since the evaluation method is merely based on the assignment
of quantitative measures to the qualitative aspects of a design solution, the numerical
output of this method might not represent the best selection. For that reason, Cross
(2001) discusses that the evaluation the results values might based on the comparison
and discussion of utility value profiles instead of simply choosing the highest sum
value.
The Value Engineering Method: The design process is also applicable for
improving the ‘value’ of an existing product, while the same effort could be devoted to
increasing the ‘value’ of a novel design solution by improving the details of the design.
Cross (2001) classifies the ‘value’ that a product might have as (1) the value of a
product to its purchaser; the extent that the purchaser perceives a product as worthy, and
(2) the cost of a product to its producer; the extent that the producer reduces the design,
manufacturing and delivery costs of a product. Therefore, the ‘value engineering
method’ seeks to improve a product by reducing cost or increasing value, or usually to
achieve both.
According to Cross (2001), the aim of the ‘value engineering method’ is “to
increase or maintain the value of a product to its purchaser while reducing its cost to its
producer.” Cross (2001) identifies five main phases to be followed through this process
including (1) making a list of the components of the product and determining the
39

function of each component, (2) identifying the values of determined functions, (3)
specifying the costs of the components, (4) investigating solutions for improving the
value of the product without increasing the cost or reducing the cost of the product with
no change in the value, and (5) assessing and selecting the alternative improvements.
Cross (2001) emphasizes that the operation of the ‘value engineering method’ method
necessitates the participation of members of different departments, such as design,
marketing, production, and so on.
The ‘improving details’ phase of the process of design is necessary for
improving the value or reducing the cost of both an existing product and an eventually
arrived design solution. Therefore, the ‘value engineering method’ appears to be
essential to improve the quality of the output of the design process and eventually the
product.
The Quality Function Deployment Method: Cross (2001) discusses that there
exists a disagreement between the marketing ‘attributes’ and production
‘characteristics’ of a product, which is mostly due to a distinction between the
specifications of the design solution and the needs of customers. As per him,
understanding the needs and expectations of customers, in terms of product ‘attributes’,
is essential to meet them with appropriate characteristics of the design solution.
Accordingly, he suggests the ‘quality function deployment (QFD) method’ aiming “to
set targets to be achieved for the engineering characteristics of a product, such that
they satisfy customer requirements” (Cross, 2001).
Cross (2001) describes seven major steps in executing the QFD method, that are
(1) identifying customer preferences in terms of product attributes, (2) classifying the
attributes in terms of importance, (3) assessing the attributes of the competing products,
(4) drawing a matrix of product attributes counter to design characteristics, (5)
identifying the relationships between product attributes and design characteristics, (6)
identifying the possible interactions between design characteristics, and (7) specify
necessary figures to be achieved to ascertain the design characteristics.
In conclusion, the QFD method suggests that “the voice of the customer” is the
most valuable factor in the commercial success of a product (Cross, 2001). Thus, the
QFD method is based on in-depth understanding of the customer and the determining
design characteristics in the light of its findings. Cross (2001) mentions that QFD
method is such an excessively comprehensive method that it could be utilized in
multiple stages of the design process.
40
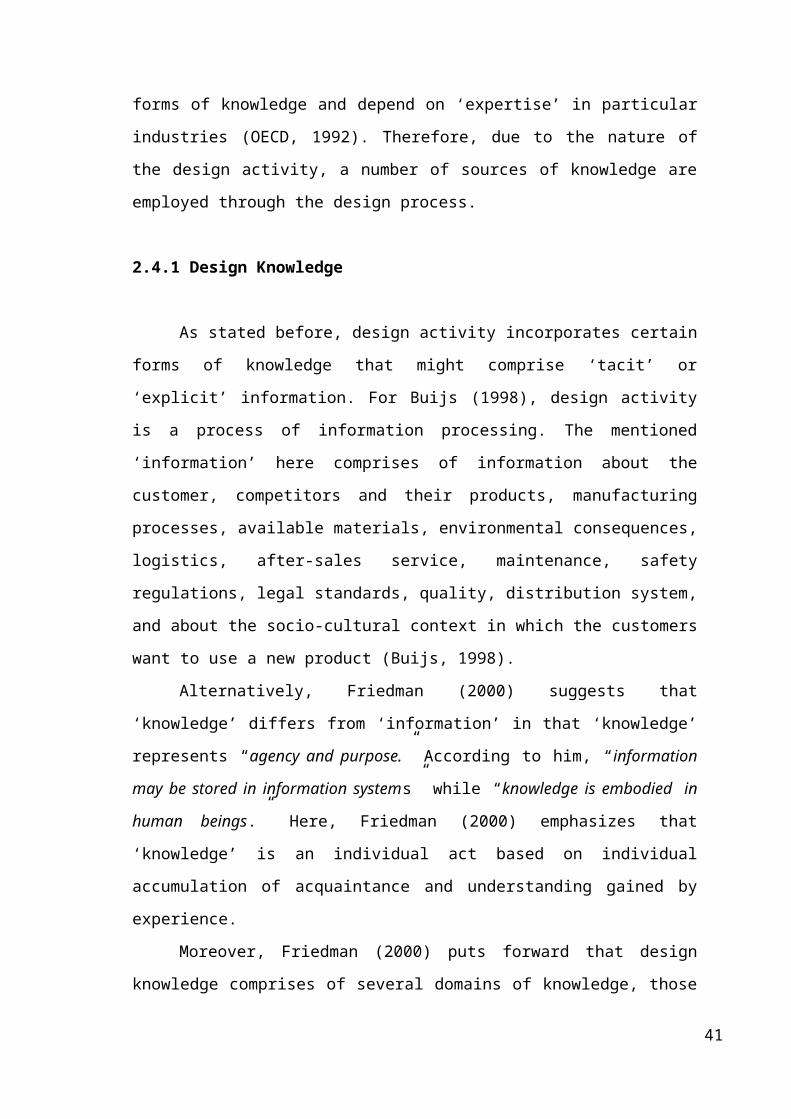
CHAPTER III
QUALITY FUNCTION DEPLOYMENT
for INDUSTRIAL DESIGN
3.1 OVERVIEW
While Quality Function Deployment method integrates customer requirements
into the product design process, the technical and aesthetical requirements about the
corresponding customer expectations are defined in the study. Although the
requirements for the engineering designer and industrial designer can sometimes be
seen quite different from each other, they both work on the product itself at the same
time. The design process as a whole is not a sequential combination of engineering
design and industrial design phases, in fact such a differentiation makes the latter phase
obsolete. The main idea is simultaneous combination of the engineering design and
industrial design activities in order to meet the customer expectations on the final
product itself.
Industrial design can be understood as a part of engineering design, or as
running parallel to engineering design. However, when industrial design activity is
engaged in the more aesthetic or style concerns of a product it can also be understood as
running parallel with marketing and brand activity. (Dumas, 2002)
Actually, description of the design process applies equally to industrial design as
to engineering design. The difference is in the tools that they have available or prefer
use at various points in the design cycle. And this may be dictated by the type of
designs that they undertake.
The engineering designer is primarily concerned with the functional aspects of a
product, whereas aesthetics is the principal concern of the industrial designer. Both have
an interest in the ergonomics of the design. This does not mean that engineers are not
concerned with aesthetics or that industrial designers do not concern themselves with
the technical function. It is simply a matter of priorities and perspective.
All technical products are a mixture of technical, ergonomic and aesthetic
properties. The degree to which one or other of the properties dominates will determine
41

whether the design should be the primary concern of the engineering designer or the
industrial designer. For example, it is obvious that mining machinery must be the
province of the engineering designer. It is also obvious that household equipment will
be the province of the industrial designer.
The important thing to note that all products that are not simply decorative
systems have both technical and aesthetic properties. The comprehensive designer must
be prepared to deal with them. This does not mean that when an engineer is designing a
technical system they should try to do the work of an industrial designer. But,
engineering designers should at least be aware of the rules and principles of industrial
design, so that they will know to consult an industrial designer. To do this properly,
they must work with the designer respecting their expertise. They should not depend on
industrial designer to simply give them the answer. As with all experts the engineers
must require that the industrial designers educate them about those rules and principles
and the why of the specific recommendation.
For the engineer, the time for consulting an industrial designer is important. It is
extremely poor practice to involve the industrial designer after the engineering design is
fully established. In such a case the industrial designer can only deal with the external
appearance, simply styling. The best procedure is to involve the industrial designer as
early as possible, in the phases of conceptualization, or at the latest before the
dimensional layout is completed. The concepts of concurrent engineering apply to the
industrial design component as well as any other. (Kardos, 1997)
It can be summarized that the quality function deployment studies for product
design consists of the customer expectations to be assessed both by the engineering
designers and industrial designers. The roots of quality function deployment studies
depend on prior quality approaches and concepts. Hence; quality and quality function
deployment concepts will be introduced in this chapter and finally a sample application
of quality function deployment application to a new product design (Triceratops) will be
demonstrated at the end of the chapter.
3.1.1 Definition of Quality
According to Dale (2003) in today’s business world there is no single accepted
definition of quality. However, irrespective of the context in which it is used, it is
usually meant to distinguish one organization, event, product, service, process, person,
42
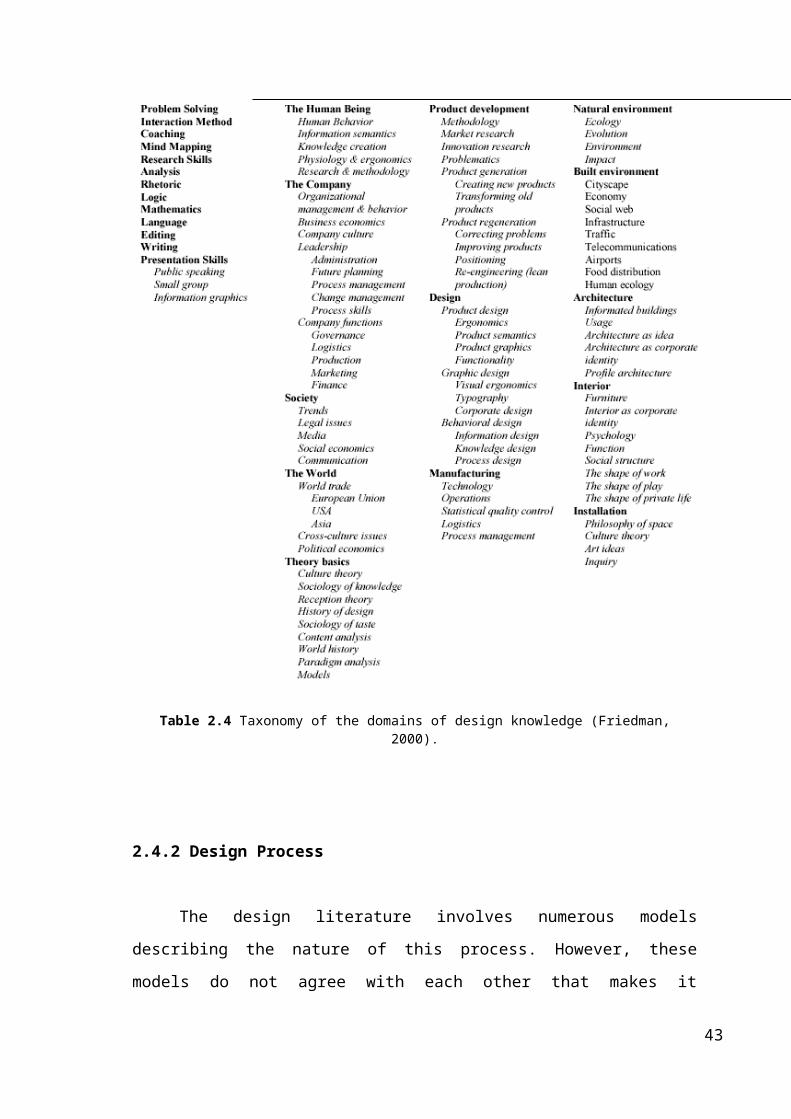
result, action, or communication from another. For the word to have the desired effect
as intended by the user and to prevent any form of misunderstanding in the
communication, the following points need to be considered:
The person using the word must have a clear and full understanding of its
meaning.
The people/audience to whom the communication is directed should have
a similar understanding of quality to the person making the communication.
Within an organization, to prevent confusion and ensure that everyone in
each department and function is focused on the same objectives, there should be
an agreed definition of quality. For example:
o Betz Dearborn Ltd. defines quality as: “That which gives
complete customer satisfaction.”
o Rank Xerox (UK) as: “Providing our customers, internal and
external, with products and services that fully satisfy their negotiated
requirements.”
o North-West Water Ltd. uses the term “business quality” and
defines this as: “Understanding and then satisfying customer
requirements in order to improve our business results. Continuously
improving our behavior and attitudes as well as our processes, products
and services. Ensuring that a customer focus is visible is all that we do.”
There are a number of ways or senses in which quality may be defined, some
being broader than others but they all can be boiled down to either meeting
requirements and specifications or satisfying and delighting the customer.
3.1.1.1 Qualitative
According to Dale (2003) it is usually in a non-technical situation and BS EN
ISO9000 (2000) says that “the term ‘quality’ can be used with adjectives such as ‘poor’,
‘good’ or ‘excellent’.” The following are some examples of this :
In advertising slogans to assist in building an image and persuade buyers
that its production and services are the best: Esso – “Quality at Work”; Hayfield
Textiles – “Committed to Quality”; Kenco – “Superior Quality”; Philips
Whirlpool – “Brings Quality to Life”.
43
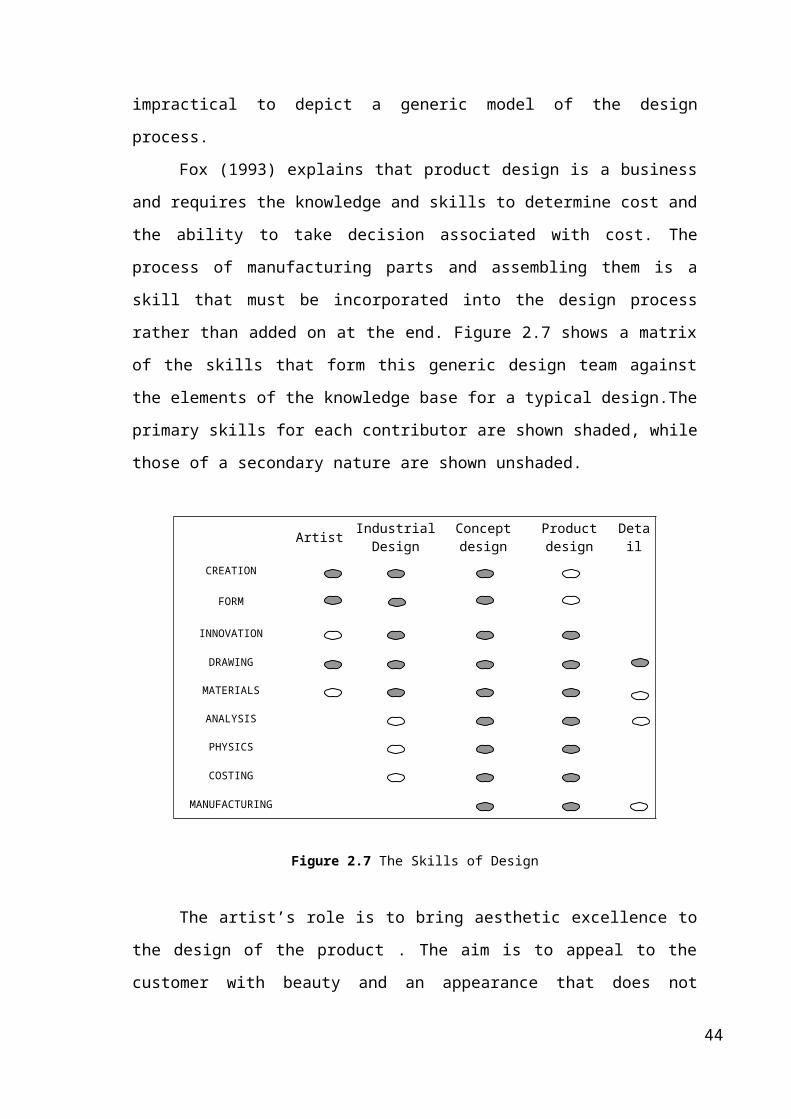
By television and radio commentators: “a quality player”, “a quality
goal”, “a quality try”.
By directors and managers: “quality performance”, “quality of
communications”.
By people, in general: “quality product”, “top quality”, “high quality”,
“original quality”, “quality time”, “quality of communications”, “quality
person”, “loss of quality”, “German quality”, “100 per cent quality”.
3.1.1.2 Quantitative
According to Dale (2003) the traditional quantitative term which is still used in
some situations is acceptable quality level (AQL). This is defined in as: “When a
continuing series of lots is considered, a quality level which for the purposes of
sampling inspection is the limit of a satisfactory process”. This is when quality is
paradoxically defined in terms of non-conforming parts per hundred. (i.e. some defined
degree of imperfection)
An AQL is often imposed by a customer on its supplier in relation to a particular
contract. In this type of situation the customer will inspect the incoming batch according
to the appropriate sampling scheme. If more than the allowed numbers of defects are
found in the sample the entire batch is returned to the supplier or the supplier can, at the
request of the customer, sort out the conforming from nonconforming product on the
customer’s site. The employment of an AQL is also used by some companies under the
mistaken belief that trying to eliminate all defects is too costly.
The setting of an AQL by a company can work against a “right first time”
mentality in its people as it appears to condone the production and delivery of
nonconforming parts or services, suggesting that errors are acceptable to the
organization.
It is tantamount to planning for failure. For example, take a final product which
is made up of 3,000 parts: if the standard set is a 1 per cent AQL, this would mean that
the product is planned to contain 30 non-conforming parts. In all reality there are likely
to be many more because of the vagaries of the sampling used in the plan or scheme,
whereby acceptance or rejection of the batch of product is decided.
44
3.1.1.3 Why is Quality Important?
The answer of this question just considers the unsatisfactory examples of
product and/or quality service. Goodman et al. (2000), based on a range of studies
carried out by TARP (Technical Assistance Research Programs), outline two arguments
that are effective in selling quality to senior management: “First, quality and service
improvements can be directly and logically linked to enhanced revenue within one’s
own company; and secondly, higher quality allows companies to obtain higher
margins.”
The following extracts some quantitative evidence in relation to these
arguments:
“Problems decrease customer loyalty by 15 per cent to 30 per cent”
“50 per cent of individual consumers and 25 per cent of business
customers who have problems never complain to anyone at the company”
“If the call center can resolve a customer’s problem using quality
service, thus changing a dissatisfied customer to a satisfied one, the company
usually gets an increase in loyalty of 50 percentage points”
“One potential customer will be lost for every 50 who hear someone
complain about a product or service”
“Market leaders can change between 5 per cent and 10 per cent
premiums for outstanding quality and service”
3.1.2 Quality of Product and Quality of Process
According to Kafol(1999) in order to reach the quality in customer’s desire, two
conceptual questions are essential :
First question: “Do products or services satisfy demands and expectations of
customer?”
The answer is determined by customer satisfaction with the product or the
service. The quality of a product can be achieved through these 4 significant factors:
Quality of planning is defined by the level of compatibility between
market/customer demands and product or service individual features during the
planning phase (Example: Complex use of a product is/isn’t in accordance with
customer’s demand for simple use).
45
Quality of design depends on the level of realization of previously planned
product features in the design phase.
Quality of manufacture is defined by the level of consistency in planned vs.
designed product features. The measure of quality of manufacture in mass
production is statistically 100% (all items).
Quality of post-sale service is defined by the supplier ability to respond properly
on customer demands and needs after the purchase (Examples: user’s manual,
spare parts repair and supply). The 100% safety is perfect.
If the quality of products or services is not enough, the customers will feel
displeased and make reclamation. The number of complaints and reclamation is
measure for product quality achievement and important indicator of Customer’s
discontent.
Second question: “Is product or service quality as demanded and expected
available with rational price?”
The answer here is defined by efficiency (in flow and correlation) of processes
through which the product quality has been made. The quality of processes that
influence the quality of product depends on the level of coordination or deviation of
activities being performed inside each process in particular and between all processes in
total as well as at the end of it/them. The makers of processes are organization units or
individuals; therefore, their training represents a significant factor in achieving the
quality of process. The other significant factor is conscious and continuous monitoring
on purpose and analysis and improvement of daily practice and processes. The third
significant factor for process quality achievement is dualistic:
Detection of the lack of synchronization, deviations and problems in the process
as early as possible,
Solving the problems where they arise.
3.1.3 American and Japan Approach to Quality
According to Kafol(1999) American approach and understanding of quality is
focused on searching and removing of negative features of products or services, others,
those that bother customers or make them discontented – like mistakes, deformations or
misses.
46

The objective of the American approach is to remove the discontent of a
customer and to achieve 0 mistakes, 0 corrections and 0 reclamations of customers. The
indicators of that kind of quality are the number of mistakes, number of corrections, and
number of reclamation of customers. The characteristics of that type of quality are clear
and visible, and statistical methods like control lists, etc., can be successfully used in
observation. Kaoru Ishikawa marked this type of quality as “Backward Looking
Quality”, and Kano (1984), who developed Ishikawa's concept further, named it “Must-
be-Quality”.
Japanese approach to quality is oriented to search and "production" of positive
product features or those that customer likes or is satisfied by. That way, a "producer" is
directed to those features of a product by which his product differs from similar ones
and his advantage over the others is assured. Unlike to the first type features that are
clear and visible, these features are less obvious or even hidden.
The statistical methods are not useful and successful for achievement of this type
of quality. One of successful approaches uses a method of analysis of particularly
successful or unsuccessful examples, and the results obtained can form a basis for
standardization of positive improvements and negative attitude removal.
The best approach to this type of quality problems seems to be the one that
establishes and consequently tracks the PDCA (plan-action-do-check) loop for each
particular case. Kaoru Ishikawa named this type of quality “Forward Looking Quality”,
and Kano (1984) called it as “Attractive Quality”.
Kano (1984) says that the relationship between these two types of quality is a
dualistic one, which means positive changes in one side (discontent) do not
automatically result positively on the other (satisfaction). For example; some products
are being well sold in spite of numbers of reclamation, because they have some feature
that customers like; on the other side, other products with less reclamation aren’t
because they have no feature that customers like and are satisfied by.
As put by Kano, the “Must-be-Quality” is the quality that customer expects
anyway (the basic quality) but the “Attractive Quality” is something more; it is the
quality that customer recognizes by his own as attractive and decides to buy exactly that
product to satisfy a need.
The first approach (negative characteristic removal, 0 corrections, 0 mistakes
and 0 reclamations) enables an enterprise to decrease the costs. On the other side, the
second approach (production of positive, i.e. customer attractive features) enables new
47
markets to be reached as well as an increase in participation on present markets, in price
and in trade rate can follow.
Both of the goals decrease in costs and increase in trade rate, is significant for
profit enlargement so the enterprise must target the both, not only the first or the second
goal alone.
3.1.4.The Design Quality
According to Fox (1993) Combining both definition of design and quality we
can infer that design quality is ‘The processes and activities that need to be carried out
to enable the manufacture of a product that fully meets customer requirements.’
There is acceptance today that the concept of a design team handing over a
design to manufacturing is not the way to do it. Gone are the days when the product
designer’s work was over with the delivery of a set of drawing for the manufacturing
manager to make. This ‘hand-over’ practice was employed not so long ago and
manufacturing would be quite justifiably appalled to be expected to produce a design
that had no consideration withrespect to the manufacturing process, product quantities,
tooling, etc.
Concurrent or simultaneous engineering is now widelyaccepted as the best and
only way to go. This embodies communications and interactions with a wide variety of
functions: marketing, manufacturing, business planing, finance and servicing. All these
entities play a role in the activities of product delivery and have to work together and
communicate effectively to bring quality to the process.
From the designer’s point of view it is important to distinguish between the need
to deliver quality drawing and the need to develop the correct information for these
drawing. Making a complete and through input into the processes that ultimately deliver
the drawing themselves is paramount to design quality. As an example, a designer
designing for a simple drive system consisting of an electric motor driving apulley
under a torsional load via a toothed belt can be considered. Quite often this will be done
quit intuitively by a designer who will do no more than put ideas down on paper as a set
of drawings. The outcome is normally satisfactory because the designer quite likely has
sufficient experience and inheret knowledge of such systems. However, without any
understanding of output load, load capability of the belt, input power of the motor,
whether intuitive or not, the design will be prone to failure. In any case, unless the
48
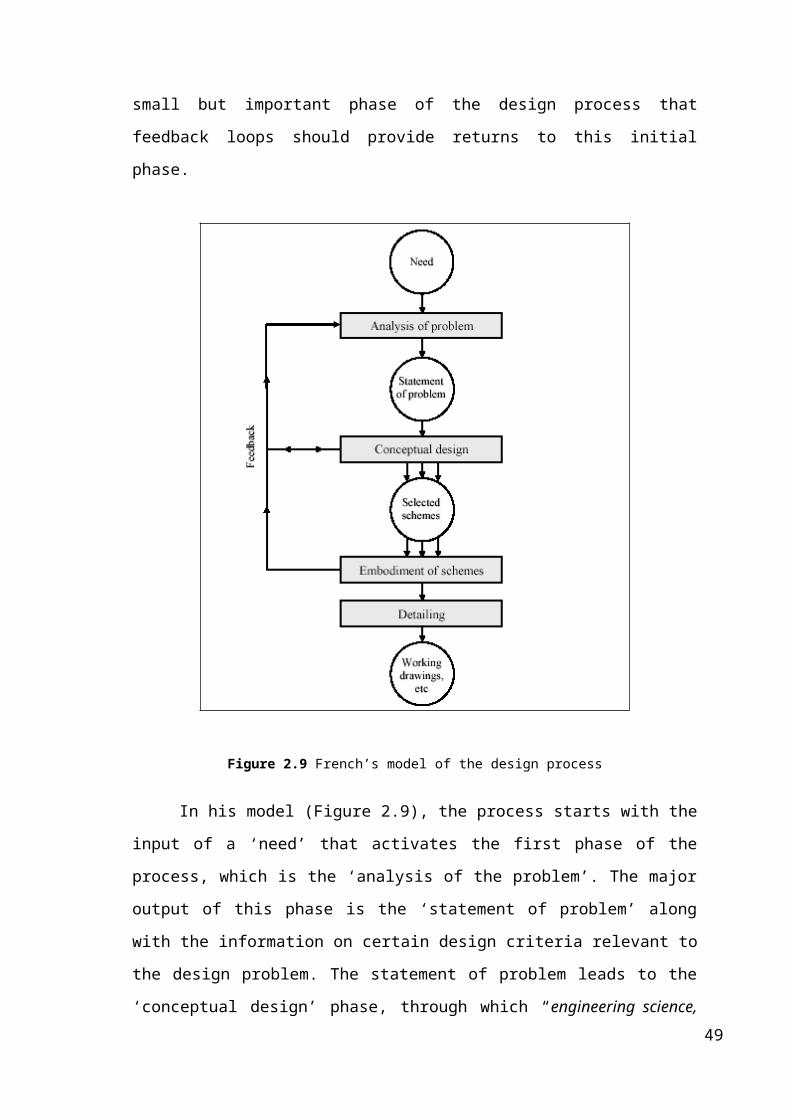
engineering analysis of the system is completed at some minimum level, the system
design can at best only be overdesigned. Overdesign can be just as great an enemy to
design quality as inadequate design,since it inevitably affects cost and other important
aspects of the product such as schedule and space, all of which may be important to the
customer and will therefore make the final product less competitive. Often the design
quality is entirely dependent on the quality of the designer on the team because the
project relies on their experince and knowledge. When discussing how to get a good
design completed quickly, chief engineers usually say: “Give me my choice of designer
and I will give you a quality design”. While this is one way of doing it, it is essential to
put some structure around the process in order to maximize the performance of every
member of the team. After all, it would be an extreme luxury always to be able to run a
design team with only the very best designers. Additionally, the intuitive approach leads
to a design that is rarely optimized. Such a process leads to a style that uses the iteration
of hardware to solve design problems. This is a path which is expensive both in terms of
money and schedule. Even though optimization may have been regarded as a luxury in
the past, today, with fierce competition from Japan and Europe, optimization is essential
to get that extra quality which will enable modern industries to gain that competitive
advantage vital to their survival.
A study of people´s perception of what design is revealed some interesting
insight. A group of engineer personnel, spanning disciplines including laboratory
technicians, design engineers, managers and designers, was asked to state in a few
words how they would describe the design process as they saw it. The result were
analysed for references to a number of different attributes considered key features of the
design process. Each description submitted was analysed for reference to:
Generation of concepts
Understanding operation or function
Translation of information for manufacturing
Conversion into hardware
The results showed that most people in the group felt that generation the concepts,
translation for manufacturing and conversion of ideas into hardware feature heavily in
their concept of the design process. There was, however, a markedly low vote for
understanding in terms of the function of the design. Although not statistically valid,
this studies highlight the tendency for people to think of design only as a creation and
49

implementation process, neglecting the vital intermediate step of functional
understanding and optimization. This has led to a process whole style is to create, try-it-
out, fix-it, or more simply a process of iteration.
Iteration as a method for improving quality and reliability has been shown quite
conclusively to be time consuming, costly, inefficient and ineffective. It has developed
from the gradual acceptance into the engineering profession of unqualified and
untrained people who have been allowed to practise the profession. In many occasions,
an untrained person ‘have a go’ at resolving a problem by trying something that looked
as if it might do the trick. It often appears to be the easy way out of a problem to the
untrained eye. There is no doubt that iteration can be as effective as any other method of
improving the design in the development of a simple product. However, once a certain,
fairly low level of sophistication or complexity is introduced to a product or system,
iteration can no longer be employed as the best method of improvement. For example, a
customized chip for an integrated circuit has to be correct before the mask is made,
since the mask may cost as much as ₤100 000, the chip costing only pence to
manufacture. Any process of iteration in this case to get the design of the mask right
would be absolutely prohibitive.
In seeking a high quality design one always looking for ways of achieving what
the customer wants in all its aspects. There is a general belief that all the customer
wants is a product that functions effectively and reliably. Very often, one hears this
comment made by a consumer in respect of cars, washing machines, etc. What is
implied here, but often unsaid, is that for instance it must be done at an acceptable cost.
From the point of view of the business situation, it must also be completed and on the
market prior to competitive products in order to gain an adequate market share. It must
look attractive, not be too noisy, not pollute the atmosphere and it must be able to be
manufactured and serviced. Each one of these design requirements has an effect on each
of the others. For example, one can make the product more serviceable by adding, say,
quick-release features, but these will cost more and may even detract from the reliability
of the product. A cheaper motor or fan may satisfy the requirements of the function but
may be more noisy, and so on.
So one could regard the process of a high quality design as one that provides the
best balance between all the requirement of the customer. The achievement of this
balance is highly complex process of communication between different diciplines and
an equally complex process of managing the relationships and interactions of these
50
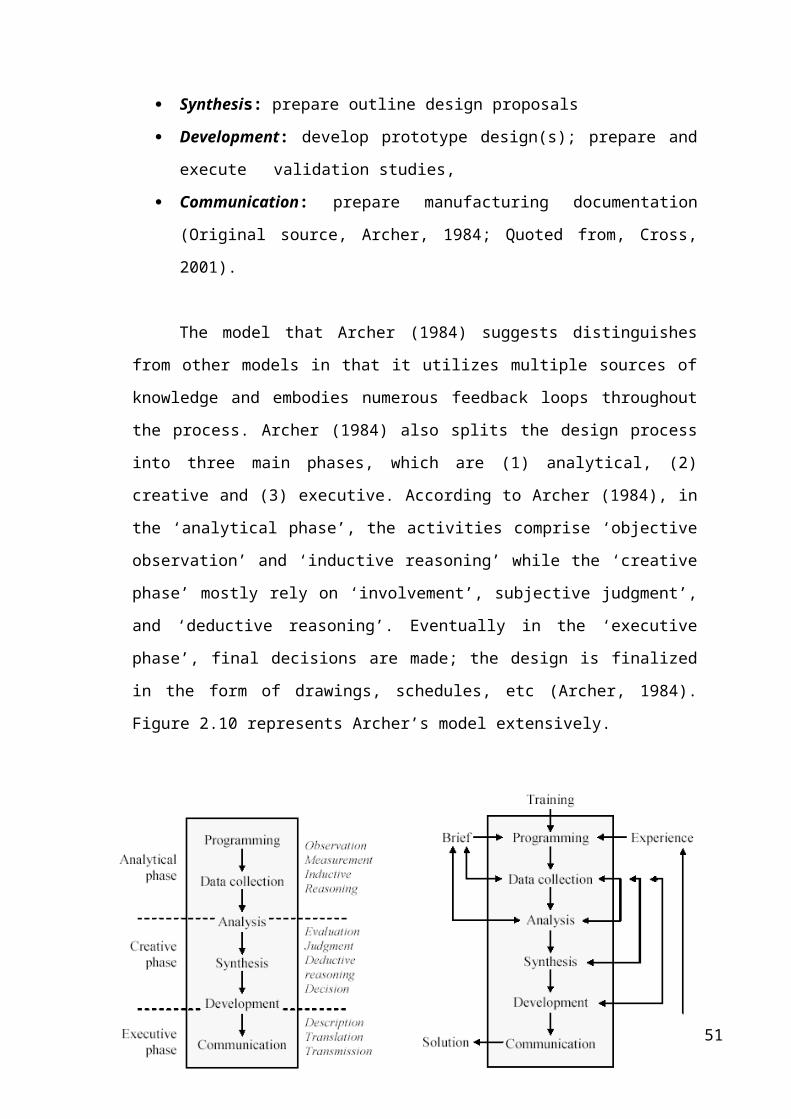
interfaces. A design manager has to give attantion to each aspect of the design process
and no one element can be left alone for long without needing some attention, either to
solve a problem or to deal with some interaction that has occurred.
3.1.5. The Evolution of Quality Management
According to Dale (2003) systems for improving and managing quality have
evolved rapidly in recent years. During the last two decades or so simple inspection
activities have been replaced or supplemented by quality control, quality assurance has
been developed and refined, and now many companies, using a process of continuous
and company-wide improvement, are working towards TQM. In this progression, four
fairly discrete stages can be identified: inspection, quality control, quality assurance and
total quality management; it should be noted that the terms are used here to indicate
levels in a hierarchical progression of quality management (Figure 3.1). British and
International Standards definitions of these terms are given to provide the reader with
some understanding, but the discussion and examination are not restricted by these
definitions.
Figure 3.1 The four levels in the evolution of TQM
51
3.2 TOTAL QUALITY MANAGEMENT
TQM is a technnique used by manufacturing and service organizations to meet
or exceed the expectations of the customer. The focus of TQM is the customer.It helps
organizations reduce cycle time, lower costs, and increase innovation.
In order to satisfy customers, organizations attempt to provide them with quality
product or service at the right time and at the right place. A quality product or service
has the features, characteristics, and attributes to satisfy a given need. The dimensions
of quality are performance, features, reliability, conformance, durability, serviceability,
and aesthetics. TQM has been defined in several ways. The Department of Defense
defined TQM as a strategy for continuously improving performance at every level, and
in all areas of responsibility. It combines fundamental management techniques, existing
improvement efforts, and specilized tools under a disciplined structure focused on
continuously improving all processes. Improved performance is directed at satisfying
such broad goals as cost, quality, schedule, and mission need and suitability. Increasing
user satisfaction if the overriding objective.
The elements of TQM are continuous improvement, employee empowerment
benchmarking, just-in-time techniques. TQM tools such as Quality Function
Deployment, Pareto Charts, Process Charts, Cause and Effect Diagrams, and Statistical
Process Control Techniques.
3.2.1 History of TQM
Total Quality Management (TQM) is a participative management style that
stresses total staff commitment to customer satisfaction. TQM is the part of
management organized for the use of creating and implementing a continuous
improvement process that constantly improves the organization's effectiveness and also
the efficiency. The main responsibility lies on not the workers or employees of a
corporation, but rather lies on the management. There are many very effective ways that
corporations have implemented these strategies of TQM, but most commonly, it is
acquired through data collection, flow charts, and diagrams. The development of Total
Quality Management is attributed to Taylor (1911):, an engineer and the first
management consultant. Statisticians, such as Walter A. Shewhart, Joseph M. Juran,
52
Philip B. Cosby and most importantly Dr. W. Edwards Deming (1900-1993), were
responsible for initiating the Total Quality Management process and share a common
role in participatory management and employee improvement. Crosby believed and
emphasized the "zero-defects" program of TQM. He noted his definition of quality as
"meeting the customer's requirements for the first time and every time." Joseph Juran
believed that system problems could be addressed through three fundamental
managerial processes. (planning, control, and improvement) Like his colleague's, Dr.
Deming determined that quality is not acquired by the workers' abilities, but rather by
their system of work, which would entail top managerial consultation. Dr. Deming
taught concepts that were new to quality control, problem solving and team work just to
name a couple. Dr. Deming took the idea of control of managers and turned it into one
of the most common and popular forms of management, today known as Total Quality
Management.
3.2.2 Overview of TQM
Organization-wide quality improvement (Total Quality Management) has
become a common practice among manufacturing, service, and public sector entities.
This strategy implies a whole host of organizational practices: focus on customers,
process analysis and improvement, study and reduction of variation, empowerment and
teamwork, etc. (Dooley et al, 1999) These practices affect the technical, social, and
sociotechnical aspects of the organization, and thus rely upon a broad base of relevant
theory. The key point in any discussion of quality is the concept of 'customer'. We tend
to associate customer with 'consumer', i.e., the end user of the product or service. A
broader definition of customer would be "anyone who receives my product or service".
This makes it possible then to discuss both internal and external customers. All models
of organizational quality (e.g., Malcolm Baldrige National Quality Award criteria
(1993), Deming (1986), Juran (1988), Feigenbaum (1983), etc.) possess the attribute of
being leader driven, customer focused systems. Customer requirements must be
completely understood, and all internal operations should be focused on providing value
to the customer. Likewise, customer feedback becomes a mechanism for process
improvement, and customer satisfaction can be a key indicator of an organization's
quality performance.
53
The manner in which customer quality is improved is by focus on organizational
processes. (Dooley et al, 1999) This requires the ability to define key processes in terms
of customers, suppliers, resources, environment, and transformations. Once the key
processes are defined, quality characteristics that will be measured and used to infer
process behavior are chosen. Data on the quality characteristics is analyzed and
subsequent action is taken. This "problem solving" typically follows the steps of the
scientific method, i.e., hypothesize (Plan), test (Do), analyze (Study), and act upon
results (Act), or PDSA.
Statistical methods are typically used to analyze data within PDSA. Variation in
the data is composed from two sources: common causes and special causes. Common
causes are those sources of variation that represent the process routine. They represent
variation or uncertainty that is expected from the existing process. Special causes are
sources of variation that cannot be considered part of the routine process, and thus are
deterring the process from operating in its most economical fashion (Shewhart 1931).
PDSA can be used to identify special causes and remove them, so that the process is
operating in its most economical state. Once the process has been brought into a state of
statistical control, changes in the process routine can be made and thus reduce the
variation due to common causes. It is well understood that changes in the process
routine constitute the majority of opportunity for process improvement.
In order for all the process analysis and subsequent activity to work, the
organization needs to develop its internal human resources to their full potential, and
develop organizational structures that encourage development of organizational
knowledge. Typically, teams of individuals are used for process improvement, and
training and education support the team missions. Team success depends to some extent
on how well they are supported. This in turn requires empowerment of the workforce.
Participatory management and employee involvement are typical management
components within TQM. These changes in behavior and attitude are essential in
successful TQM. For example, TQM requires the organization to move from
authoritarian leadership to facilitation leadership - such changes in organizational
culture may be the most difficult step in implementing TQM.
In summary, the quality system starts with customer focus, which leads to using
the scientific method (PDSA) to improve organizational processes. Process
improvement takes place in the context of gathering and understanding process data and
using multiple knowledge resources (teams) to synthesize that knowledge. Process
54
improvement can only succeed in a nurturing environment, typified by employee
empowerment, management facilitation, and change in organizational culture.
Dooley et al. (1999) claim that quality improvement efforts (either at the team or
organizational levels) draw upon five theoretical areas: domain knowledge (knowledge
pertinent to the specific application) and the four requisite areas of statistics, cognitive
psychology, organization behavior and theory, and systems theory. One needs to
understand systemically the process being studied (systems theory) and data coming
from that process that is indicative of its behavior (statistics). One needs to understand
the social (organization behavior and theory) and technical (domain knowledge) factors
involved in the process. Finally, one must know how to learn about the process in
greater detail, and how human perception affects and is affected by such knowledge
(cognitive psychology). Thus, quality improvement draws upon a rich body of theory.
Figure 3.2 Total quality management umbrella (Oakbrook , 1999)
As depicted in figure3.2, TQM activities quality planing quality assurance
countinuous quality improvement and quality function deployment are represented as
part of a larger set of tools and strategies under the total quality management umbrella.
Quality assurance and continuous quality improvement activities focus on results. The
tools include checksheets, graphs, histograms, Pareto diagrams, cause-and-effect
diagrams, scatter diagrams, and control charts and diagrams. In contrast, quality
planning and quality function deployment focus on design. They utilize new
55

management and planning tools including affinity diagrams, relation diagrams, tree
diagrams, matrix diagrams, and matrix data analysis.
3.3 QUALITY FUNCTION DEPLOYMENT
According to Mazur (1999), Quality Function Deployment is a unique system
for developing new products which aims to assure that the initial quality of the product
or service will satisfy the customer. In today’s turbo economy, traditional design
methods that rely on extensive concept and market testing and multiple rollouts take too
much time and increase risk that copycat products enter the market first. Best efforts
driven by internal requirements risk failure to recognize important customer needs. The
tools and methods can reduce these with a robust, traceable, and structured system of
planning. QFD differs from traditional quality methods that focus on zero defects; after
all nothing wrong does not mean anything is right.
QFD focuses on delivering positive value by seeking out both spoken and
unspoken needs, translating these into actions and designs, and communicating these
throughout each organization on the value chain to the end customer.
Further, QFD allows customers to prioritize their requirements and benchmark
us against our competitors. Then, QFD directs us to optimize those aspects of our
products and services that will deliver the greatest competitive advantage. No business
can afford to waste constrained financial, time and human resources on things
customers don't value or where they are already the clear leader.
3.3.1 Quality Function Deployment Process
According to M. Martin and K. Ishii, Quality Function Deployment is a product
development tool that acts as a set of planning and communication routines. It focuses
and coordinates commonly used product development processes (benchmarking, market
research, etc.). The name quality function deployment results from one way of
interpreting the Japanese name for the process. Many people feel that the name is
somewhat confusing so do not try to interpret it too literally. The basic idea is that the
customer needs are carried (deployed) throughout the entire design process and that this
will help create a quality product.
56
QFD is a tool for guidance .It must be utilized with a number of other
management and technical tools (strategy planning, rapid prototyping, design of
experiments, design for assembly, etc.) to produce an effective development project. It
should be used for guidance, and should not be thought of as a spreadsheet that
automates the design process. Human judgment and leadership still must be utilized to
make QFD an effective tool for the product development team.
Figure 3.3 QFD Matrices (John Hauser and Don Clausing)
These four matrices allow the voice of the customer to flow down to the actual
production requirements . If all four of these matrices are developed for a particular
product, then you would actually be able to trace back how a particular production
process affects the customer. Generally, most people only use the first matrix (the
“House of Quality”). Thus, QFD synonymously referred to as the “House of Quality”.
Using all four of the QFD matrices is a powerful concept, but in reality it is often
difficult to achieve due to the time and resource constraints involved in a project. The
first matrix (the House of Quality) is the most important since it captures the customer
requirements and the benchmarking information for the project. Following that, the
other matrices should be sketched out to the level of detail that the project engineers feel
is useful. In some cases, spending just two or three hours roughly sketching out the
flow-down of the requirements through the matrices can give some major insights. In
other cases, a more detailed look at the flow-down may give advantages that can not be
seen otherwise. It is up to you and your team to make the decision.
For maximum effectiveness, representatives from all phases of a product’s life-
cycle (marketing, design, manufacturing, sales, etc.) should participate on the QFD
team in order to facilitate the results of the QFD work.
57
3.3.2 Purpose and Structure of QFD
QFD is a set of planning and communication routines that focuses and
coordinates skills within an organization (Hauser & Clausing 1988). Its main purposes
are to:
1. Focus team attention ; QFD focuses and helps align the team on the needs of
the marketplace and allows them to make the tradeoffs between cost, quality, and
delivery. It accomplishes this by using the voice of the customer to help set engineering
metric target values for the design, and by setting up a process to ensure the most
efficient use of benchmarking resources.
2. Help manage large amounts of data ; the process facilitates cross-functional
teamwork through graphical decision-making processes, and organizes important
information in one location.
3. Maintain product development history ; by creating updated versions of each
QFD matrix and archiving old versions on a regular basis, QFD captures the
development history of the product.
The basics of QFD are outlined in Table 3.1
What? Tool for planning and communication. Why use it? Focuses team on designing products to reflect customers’ desires and tastes while making the necessary trade-offs. How does it work? Deploys the needs of the customers all the way through to the target specifications. Helps plan benchmarking activities.
Table 3.1: QFD Basics
QFD organizes the collected data into a matrix format. Each of the different
areas of the matrix are referred to as “rooms” and the first matrix of the QFD process
itself is referred to as the “house” (because of its distinctive look) and is often referred
to as the “House of Quality” (Figure 3.4)
Room 1 Customer Requirements ; requirements for the product as stated by the
customers, including a weighting of the importance of that requirement to the
customer.
58
Room 2 Engineering Metrics ; technical metrics that measure one or more of
the customer requirements .
Room 3 Relationship Matrix ; indicates which engineering metrics affect which
customer requirements. These relationships are estimated by the team and are
given a 9/3/1/0 rating. A strong relationship between the customer requirement
and the engineering metric is given a rating of “9.” This relationship is given a 9.
The 9/3/1/0 rating system is used rather than a continuous rating system (such as
0 – 10) to force the team to make decisions about which are truly the most
important relationships. Also, if a continuous system is used, a team can get
bogged down in trying to determine if a relationship is an 8 or 9, or a 2 or 3, etc.
The 9/3/1/0 system makes the decision process easier.
Room 4 Customer Perception Benchmarking ; involves collecting information
from consumers to determine how your product compares with the competition.
Room 5 Technical Benchmarking ; use the engineering metrics to objectively
measure how well your product compares with the competition.
Room 6 Correlation matrix ; this roof matrix shows conflicts or synergies
between the different engineering metrics
Room 7 Technical Targets – the quantitative targets for the engineering
metrics.
Room 8 Importance of Metrics (Relative Weights) – a calculation
determining the relative importance of the engineering metrics. For each
engineering metric, a SumProduct of the customer weights and relationship
matrix column is calculated . These scores are then normalized to produce the
relative weight of that metric.
59
Figure 3.4 Outline of QFD Matrix (House of Quality)
3.3.3 History of QFD
QFD was conceived in Japan in the late 1960s, during an era when Japanese
industries broke from their post-World War II mode of product development through
imitation and copying and moved to product development based on originality. QFD
was born in this environment as a method or concept for new product development
under the umbrella of Total Quality Control.
According to Akao (1997), after World War II, Statistical Quality Control (SQC)
was introduced to Japan and became the central quality activity, primarily in the area of
manufacturing. Later, it was integrated with the teachings of Dr. Juran, who during his
1954 visit to Japan emphasized the importance of making quality control a part of
business management, and the teaching of Dr. Kaoru Ishikawa, who spearheaded the
Company Wide Quality Control movement by convincing the top management of
companies of the importance of having every employee take part.
The Japanese automobile industry was in the midst of rapid growth, going
through endless new product development and model changes. At that time, the
following two issues became the seeds out of which QFD was conceived;
People started to recognize the importance of design quality, but how it could be
done was not found in any books available in those days.
60
Companies were already using QC process charts, but the charts were produced
at the manufacturing site after the new products were being churned out of the
line.
There was another flow that merged into QFD from Value Engineering. Value
Engineering showed a way to define functions of a product. It was Mr. Katsuyoshi
Ishihara who expanded this thinking to business process functions. Business process
function deployment subsequently became linked to “narrowly defined QFD”. Dr.
Mizuno described narrowly defined QFD as a “step-by-step deployment of a job
function or operation that embodies quality, into their details through systematization of
targets and means.” (Mizuno, Shigeru , Yoji Akao,1978) It is useful when creating a
“quality assurance activity table,” a part of the QA system documentation.
In contrast, broadly defined QFD refers to the combination of the quality
deployment (QD) described earlier and the narrowly defined QFD. QFD today was
molded and took shape through multiple flows and concepts. These include the initial
flow that showed how to map out QA control points, the flows from quality deployment
and value engineering, the narrowly defined QFD, and the quality chart.
There is also another point in QFD that; many product developers say that
customer requirements are often too vague, never mentioned, change during the project,
and even when met, are frequently not what customers want to buy. In QFD, several
tools are employed to clarify vague requirements, discover hidden ones, and prevent
changes or misunderstandings by correctly analyzing their root benefits. Prompting the
development of these tools was a study done by Kano et. al. in Japan in 1984 that
demonstrated that there were different types of requirements that needed different
approaches to understand.
3.3.4 QFD-based Design Process
According to Chaplin and Terninko (2000) a fundamental difference between
the traditional manufacturing design process and the design process using QFD is the
allocation of time, money, and staff. Traditionally, the allocation of resources begins
modestly and increases to a peak as problems and breakdowns requiring corrective
action occur (after production or deployment of the service) (Figure 3.5). In contrast,
61
QFD embodies the philosophy of “doing it right the first time’’ by allocating more time
and resources up front.
Figure:3.5 Allocation of resources.( Sullivan,1996)
In traditional design and implementation projects, the allocation of resources
increases as a function of time right up to implimentation. In QFD, in contrast, there is
an allocation of more resources up front and less are needed at the time of producing a
product or delivering a service.
Several years ago, Ford Motor Company tracked the allocation of resources as
the number of engineering changes per unit. A plot of the number of engineering
changesper unit of time for a traditional design project showed a peak of activity just
before the product goes to market (Figure 3.6). This was the result of building a
prototype to identify failure modes. The process was repeated several times. During the
1980s, each new concept for a car required an average of 3.7 engineering changes. Once
production started, there was an initial decline in the number of engineering changes,
but this proved only temporary as customers discovered errors in function. When QFD
was used as a basis for the design process, the curve for the number of changes
managed over a period of time peaked 14 to 17 months prior to the start of production.
This first peak represented resources expended in solving the major aspects in the
design process and dealing with conflicts that were likely to arise early in the design
phase. Because most changes were made prior to the start of production, the net result
was a significant saving of resources.
62
Figure 3.6 Number of engineering or product changes.( Sullivan, 1996)
Although we know of no comparable data for service industries, consider how
much of your day-to-day management activities are spent tracking “defects’’ in service
processes and then instituting “corrective actions.’’ Surveys have suggested that
healthcare managers expend 40 percent of their time engaged in addressing service
commitment breakdowns and conflict resolution. (Lippitt 1982).
3.3.4.1 Kano’s Model of Customer Satisfaction
Customer satisfaction model, often used in QFD, is the Kano model developed
by Prof. N. Kano. KA uses a diagram for characterising customer needs. In his model,
Kano distinguishes between three types of product requirements which influence
customer satisfaction in different ways when met: (Sauerwein, E., Bailom, F., Matzler,
K., Hinterhuber, H.H., 1996)
Must-be requirements: If these requirements are not fulfilled, the customer will
be extremely dissatisfied. On the other hand, as the customer takes these
requirements for granted, their fulfillmentwill not increase his satisfaction. The
must-be requirements are basic criteria of a product. Fulfilling the must-be
requirements will only lead to a state of "not dissatisfied". The customer regards
the must-be requirements as prerequisites, he takes them for granted and
therefore does not explicitly demand them. Must-be requirements are in any case
a decisive competitive factor, and if they are not fulfilled, the customer will not
be interested in the product at all.
63
One-dimensional requirements: With regard to these requirements, customer
satisfaction is proportional to the level of fulfillment - the higher the level of
fulfillment, the higher the customer’s satisfaction and vice versa. One-
dimensional requirements are usually explicitly demanded by the customer.
Attractive requirements: These requirements are the product criteria which have
the greatest influence on how satisfied a customer will be with a given product.
Attractive requirements are neither explicitly expressed nor expected by the
customer. Fulfilling these requirements leads to more than proportional
satisfaction. If they are not met, however, there is no feeling of dissatisfaction.
Figure 3.7 Kano’s model of customer satisfaction
The advantages of classifying customer requirements by means of the Kano method
are very clear;
Priorities for product development. It is, for example, not very useful to invest in
improving must-be requirements which are already at a satisfactory level but
better to improve one-dimensional or attractive requirements as they have a
greater influence on perceived product quality and consequently on the
customer’s level of satisfaction.
64
Product requirements are better understood: The product criteria which have the
greatest influence on the customer’s satisfaction can be identified. Classifying
product requirements into must-be, one-dimensional and attractive dimensions
can be used to focus on.
Kano’s model of customer satisfaction can be optimally combined with quality
function deployment. Kano’s model is used to establish the importance of
individual product features for the customer’s satisfaction and thus it creates the
optimal prerequisite for processoriented product development activities.
Kano’s method provides valuable help in trade-off situations in the product
development stage. If two product requirements cannot be met simultaneously
due to technical or financial reasons, the criterion can be identified which has the
greatest influence on customer satisfaction.
Must-be, one-dimensional and attractive requirements differ, as a rule, in the
utility expectations of different customer segments. From this starting point,
customer-tailored solutions for special problems can be elaborated which
guarantee an optimal level of satisfaction in the different customer segments.
Discovering and fulfilling attractive requirements creates a wide range of
possibilities for differentiation. A product which merely satisfies the must-be
and one-dimensional requirements is perceived as average and therefore
interchangeable.
3.3.4.2 QFD and Kano’s Model
Quality function deployment is becoming quite popular. By combing it with
Kano’s modelmethod for understanding customer-defined quality the following benefits
can be gained: (Matzler, K. And Hinterhuber H.H, 1998)
There is adeeper understanding of customer requirements and problems
Trade-offs within product development can be maneged more effectively
There fewer start-up problems
Competitive analysis is eaiser (improved market research)
Control points are clarified (reduced development time, better planning)
Effective communication between divisions (departments)is facilitated;
Design intent is carried through to manufacturing(quality is built in
‘upstream’
65
3.3.5 Sample Application of QFD
The movie “Jurassic Park” included an encounter with a sick Triceratops lying
on her side. In the theme park attraction, a veterinarian attends to a sick but standing
“Sarah” who seems to acknowledge visitors to her paddock where she is being
examined. The 24 foot Triceratops looks, feels, acts, and even smells like a real animal,
complete with breathing, blinking and pupil dilation, flinching, sneezing, drooling, and
excreting. Visitors are never more than six feet away and can even pet her.(Mazur and
Bolt, 1999)
Given these encounters, the overall goal was to make a creature more believable
and lifelike than any before. State-of-the-art at that time was the DinoAlive exhibit at an
Osaka Japan museum, that relied on hydraulics to give them smooth, quick movements.
The creature was designed by Vickers Inc. of Troy Michigan which set a very high
benchmark for realism of motion and appearance. For example; the 40 foot high
Tyrannosaurus Rex could move from a resting position to fully erect in only 1 ½
seconds. The Jurassic ride in Hollywood also reflected where the industry was in June
of 1996. The animals were fairly realistic but not convincing especially if one was able
to stop the show and examine them closely. There was also a great concern with
reliability. Thus, very stringent requirements were made so those close encounters such
as petting would be thoroughly convincing.
3.3.5.1 QFD Template
A project worth doing well deserves to have QFD tailored to the needs of the
company, the team, the customers, and the customer’s customers. QFD was used in the
conceptual stage to bridge the gap between the artist and the engineer so the process
was really tailored to suite the fast turn-around working environment in which the
program ran.
The conceptual design Scope of Work document that was used to drive the QFD
study specified that the outcome should include such specifications as degrees of
freedom of movement, maximum velocity, range of motion, skin characteristics, etc.
These were to correspond to various scenarios that the animators portrayed in some 60
storyboards which included such activities as sneezing, playing, moving legs, etc. Given
the time and cost budgets, the MD Robotics team wanted to put its earliest efforts on the
66
most important aspects of the dinosaur. The scope of work, however, did not indicate
that any one storyboard activity was more critical than another, they were all equally
important.
Bolt led a review of the Scope of Work document, and three key elements
emerged:
1. achieve a clear understanding of the experience/benefits Universal wished to
achieve
2. trace these benefits into engineering requirements
3. translate the engineering requirements into cost effective conceptual designs
To clarify the customer requirements, we began a Voice of Customer Analysis of
the “scope of work” document. Table 3.2 (Customer Context Table) was first used to
break down the details of the “scope of work” into singular statements and to then
reword them with regards to the context of use. Table 3.3 (Customer Voice Table) was
then used to sort the statements in first as benefits vs. features, and then to detail the
features into additional categories that then became the axes of the subsequent matrices.
A deployment flow chart is shown in Figure 3.8
Figure 3.8 QFD Flow Chart for Triceratops Encounter
67
3.3.5.2 Voice of Customer Analysis
Table 3.2 is commonly used to clarify complex customer requirements,
particularly ion the context of use of the product or service. Context is easily described
by the second column (who is using, what is it used for, when is it used, why is it used,
and how is it used).
The Voice of Customer states “animal-like reactions to the guests” who are
described as families with elementary school age children visiting the Triceratops
Encounter paddock after experiencing the thrill rides of the park. The reworded data
reduces the complex requirement into singular terms to address the contextual concerns.
Simply put, this attraction must not be a let-down after action rides of the park, and
must keep the interest of children ranging from young enough to be amazed by seeing a
“live” dinosaur to young teens amazed to see something so lifelike in terms of both
appearance and behavior. The reworded data begins the process of analyzing the voice
of customer into such details.
Table 3.2 Voice of Customer - Customer Context Table (partial)
Table 3.3 sorts these reworded data on whether they are describe a feature of the
product or the benefit to the customer the feature must provide. Product features are
further broken down into performance measurements, functions, reliability, safety,
technologies, materials, components, etc. In this case, for conceptual design, the
categories were storyboards, body motions, technical requirements, and concepts (Table
3.3).
68

Table 3.3 Voice of Customer Table – Customer Voice Table (partial)
These “voice of customer” tables structured and analyzed both hidden and
known requirements of the final product. Voice of Customer Analysis in QFD also has
the tools and methods to move up and down the customer value chain and can translate
and link the requirements of end user (guests), operator of the attraction, maintenance,
installers, theme park management, and animators. These are the features and benefits
for the end product, but what of the benefits to the consumer?
Since no consumer had ever seen a moving dinosaur, their interpretation of
“realistic” was limited to their personal imagination based on illustrations, cartoons, or
other robotics. It was relatively easy to see that the operator, maintenance, installer,
management, and animator could be visited at an existing amusement park, but what
about the dinosaur?
As a vendor to the space industry, MD Robotics engineers were adept at
simulating environments. It is well known that swimming pools and high altitude drops
are used to simulate the micro-gravity of space, and are frequently used by aerospace
vendors during design. To simulate the Triceratops Encounter, they visited a petting zoo
in Toronto where they could observe children encountering live animals. This helped
them better understand what the expectations and interactions children would be
familiar with. What they learned was that the general public look for anthropomorphic
qualities in the animals; in other words they attach human emotional states to the
actions of the animals. The other point that was noted was that with the dawning of the
information age, people and specifically children, are incredibly knowledgeable when it
comes to dinosaurs. To have a convincing animal, the stance, motion and look must be
correct with the state of knowledge within the paleontology world today. As a result, the
emotional states detected were structured with an Affinity Diagram and Hierarchy
Diagram (Table 3.4).
69
Table 3.4 Hierarchy of Emotional States (partial)
These emotional states were presented to the animators for prior itization based
on the contribution of each emotional state to making the attraction popular and
enjoyable. An interesting dichotomy arose because the animators placed a higher
priority on a natural looking effect which tended to emphasize gross body motion
associated with distant viewing, while guests at the zoo wanted more contact with the
head which tended to emphasize detailed head sub-mechanisms such as tongue, nostrils,
etc.) The main means the animators used to convey the creative requirements to the MD
Robotics team was through storyboards. An example of these is shown in Figure 3.9
70
Figure 3.9 Example of Storyboard
3.3.5.3 Emotion Deployment
The emotional states priorit ized by both the Hall Train animators and the petting
zoo guests were then used to prioritize the animators’ 65 storyboards in order to
determine which postures and positions most strongly correlated with the most
important emotional states. Using this process we formed the emotional state vs.
storyboard matrix. This enable the design team to get a feeling for how important each
storyboard was to the show. Table 3.5 shows this deployment matrix.
71

Table 3.5 Emotional State vs. Storyboard Matrix (partial)
In this matrix, the emotional states are weighted on a 1-5 scale, 5 being most
important. The degree of correlation between each body motion and emotional state are
indicated in the intersecting cells of the matrix, using the values of 1 for some
correlation, 3 for average correlation, and 9 for strong correlation. The emotional state
weight is then multiplied by the correlation value in each cell, and the results are
summed column by column (absolute weight). This tells which body motion has the
most and the strongest overall contribution to the most important emotional states. As
mentioned above, there was a dichotomy between the animators and the petting zoo
visitors, and a “sales point” was factored in to add more importance to head contact
storyboards.
In QFD, sales points are that further emphasize exciting requirements multipliers
(1 not exciting, 1.2 exciting, 1.5 very exciting). The absolute weights were then
multiplied by the sales points, and normalized to a percentage to yield the Storyboard
weights. The Storyboards with high weights are critical to conveying an exciting show
to the visitors. For example, the triceratops flaring its nostrils is crucial to conveying it
is happy or startled (Figure 3.10)
72
Figure 3.10 Nostril Flare (from Storyboard)
73
CHAPTER IV
CASE STUDY
Quality Function Deployment can be implemented in various areas, from
enhancement of service quality to innovative product design. As a result, there had been
several alternatives to work on at the beginning, such as; a new rim design for CMS, a
new mini-refrigerator design for Klimasan or a new fan design for Raksev (In addition
to these, there were several completed QFD applications in those areas).
However, applying QFD approach to a project requires serious teamwork and
information interchange between many different organizations or departments of a
single organization. Covering every aspect and technical detail of the real project with a
single person is not feasible unless extensive technical support is provided by the
company or organization. It should be emphasised that applying QFD to a real-world
project requires at least a basic team to handle the several aspects of a project (Such as
the QFD case example, design of a triceraptor for an amusement park, that has been
introduced in prior chapter).
4.1. DEFINITION OF THE CASE
The study is about designing a hairdryer. The main reason of why we have
chosen this topic is to use the pre-analyzed technical requirements (Martin and Ishii,
2003). The customer studies and questionnaires are applied to 45 people and two
hairdryer models from different brands are selected for competitive products.
The competitor products analyzed are Arçelik 5187 and Braun CP 1600 models.
The main reason that we have chosen these products is they were in the same marketing
category having similar price ranges. Another important point was the need for
technical specifications of products in order to be evaluated in the customer perception
matrix (Figure 4.3). The product specifications are achieved from official suppliers and
data sheets (Figure 4.4).
74
4.2 QFD APPROACH FOR THE CASE
Every customer requirement is important and these requirements are ordered by
their importance in the QFD approach. There are numerous methods for defining
customer requirements. Holt et al. introduced 27 different methods under 3 categories to
assess customer needs. We used:
Utilization existing knowledge
o Customer information
o Competitor information
o Literature
o Experts
Generation of new information
o User questioning
Other methods
o Informal contacts
The main reason that we have chosen these methods is the ease of use and
minimum cost factor. There are much complicated and effective methods for assessing
customer requirements (such as laboratory experiments etc.) however such techniques
are costly. The participants are asked to prioritize (1-most important, 8-less important)
the product properties (Table A.1).
4.2.1 Customer Requirements
This section documents a structured list of a product’s customer requirements
described in their own word (The Voice of the Customer). The customer requirements
refer to the key needs. These requirements are calculated from Figure A.1 as summing
up each requirement and diving this value by total rating value (the lower the final
value, the more important the requirement is like 9-3-1)
75
Figure 4.1 Customer Requirements
4.2.2. Relationship Matrix
This section for the main body of the house of quality matrix. The idea is
translating the requirements expressed by customer into the technical characteristics of
the product. The structure is a two-dimensional matrix with cells that relate the
combinations of individual customer and technical requirements. The interrelationship
between customer requirements and technical requirements is weighted usually on a
four point scale (9 represents strong, 3 represents medium, 1 represents low, and 0 or
blank represents none). Technical Priority is calculated for each requirement.
Each rating is multiplied by the customer weight and summed across all
customer requirements to become the raw score. This value is normalized by dividing
each raw score by the sum of all the raw scores for the relative weight. The relative
weight shows the amount of customer value attributed to each objective design
requirement.
76
Technical Requirements
Figure 4.2 The Relationship Matrix
4.2.3 Customer Perception Assessment
In these sections, we studied the competitive products to determine how they
rate on the customer and technical metrics. This involves customer perception testing
and technical benchmarking. The competitive products (A and B) are tested to
determine how they rate on the customer requirements (Figure 4.3).
Figure 4.3 The Customer Perception
77

4.2.4 Targets
This section is typically made up from three parts; technical requirements,
competitive benchmarks and targets.
Technical requirements part is the relative importance each technical
requirement of the product in meeting the customer’s specified needs. It can be
calculated from the weightings contained in the planning and interrelationships matrix
sections. Each interrelationships weighting is multiplied by the overall weighting from
the planning matrix. These values are then summed down the columns to give a priority
score for each technical requirement. (Figure 4.2)
A: Arçelik 5187 (Figure A.1)
B: Braun CP 1600 (Figure A.2)
Competitive Benchmarking describes each of the technical requirements that have been
identified as important characteristics of the existing competitor products. (Figure 4.4)
78
Figure 4.4 Targets
As shown in Figure 4.4, the corresponding competitor values are denoted by the
letters A and B. Instead of using numerical values for each property, we have simplified
the representation by assigning letters to the properties.
Targets; the final output of the house of quality matrix is a set of engineering
target values to be met by the new product design. The process of building this matrix
enables these targets to be set and prioritised based on an understanding of the customer
needs, the competition’s current performance.
4.2.5 Interpretation of Results
As a result; of course every customer requirement is important on its own,
however, as depicted in Figure 4.1, “dries quickly” and “operates safely” properties
have the highest overall weighting factors which are 9.
79

80
Figure 4.5 The House of Quality
Figure 4.2 shows the absolute technical priorities that the studies should be
focused on. It can be seen that “air flow rate” and “air temperature” are the most
important ones with 174 and 102 consecutively.
Figure 4.3 denotes the competitor conditions and target values on the same
properties where our new product should not stand back from their competitors and
possess the desired specifications in order to capture market.
The final structure of the house of quality matrix for the case study is shown in
Figure 4.5.
4.2.6 Advancing Through Phase 2 for External Design
81
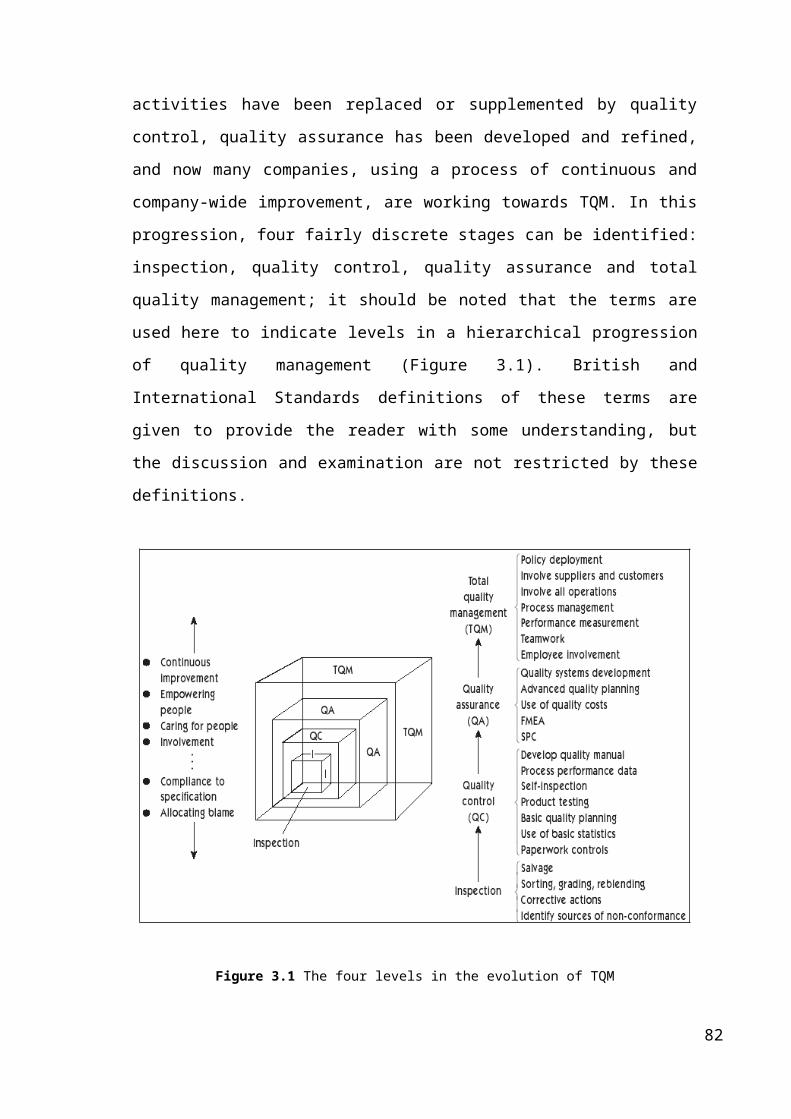
Figure 4.6 Relationship Matrix of the Second Phase
Completing the initial phase of the case study, the second phase is iterating the
house of quality matrix one more time to define the external design requirements for
corresponding technical requirements. The relationship matrix of second phase is
depicted in Figure 4.6 above.
4.3 FINDINGS AND ANALYSIS
The achievement of this study is, of course, meeting customer requirements to
increase customer satisfaction. Every single customer and every single customer need is
important on its own. However, it can be more feasible to create a method for
improving overall customer satisfaction by analyzing the QFD results. As a result of the
QFD study, the final product is planned to be able meet the customer requirements in
the right way.
82
4.3.1 Phase 1
Target airflow rate is 28,3 l/min where both competitor products do not have
adequate outputs. New product can be advantageous with an airflow rate just below
target value.
Target air temperature is 82 °C, B product is very close to this value. Hence,
new product should strictly obey this target air temperature value.
Technical requirements are the most important factors that influence customer
expectations in the house of quality. However, the following technical requirements
should also be satisfied for competency.
The weight of the new hairdryer should be as light as possible because both of
the competitive products are quite well in this requirement.
The size of the new hairdryer should be smaller than 20,3 cm X 15,2 cm, and
product B has a fine compact size to be taken into consideration.
The noise levels of the competitor products are not satisfying and if the noise
level of the new product is around 50 dB (from 15 cm), this can create a significant
advantage over the competitors at this technical requirement.
The power consumption and the number of switch settings parameters are the
most unimportant technical requirements from the customer point of view. The
competitor products both have mediocre power consumption levels and if the power
consumption of the new product is around the competitor values, that would be okay.
However, the number of switch settings of competitor products are below 4, so new
product must be designed to have not more than 3 switch settings in order not to make
the product more complicated than its competitors.
4.3.2 Phase 2
As shown in Figure 4.6, the technical requirements are evaluated by their
corresponding external design requirements. It has been defined that the design of the
noozle is the most important external design parameter on the overall project. The
design of the body is second important parameter with respect to technical requirement
analysis.
It is interesting to emphasis that the primary technical priorities (air temperature
and air flow rate) that have been rated due to the voice of customer had a significant
83

affect on external design parameters. Even though the design of the body is expected to
achieve the highest overall percentage on external design, the design of the noozle
appeared to be the most important factor due to its relationship with primary technical
priorities.
The design of the switch mechanism, the design of the handle and the design of
the cabling mechanism consecutively achieved their priorities as external design
parameters. It is obvious from Figure 4.6 that the choice of coloring to be used as an
external design parameter had no direct interrelationship with technical priorities. This
also means that it gives the evaluators an idea that a separate study (survey, interview,
etc.) can be implemented to decide on the coloring of new product.
CHAPTER V
CONCLUSION & FUTURE WORK
Quality Function Deployment has been used by quality conscious organizations
around the world for over 30 years. Its adaptability to nearly any product development
project has earned QFD the reputation of being a methodical approach to assure customer
satisfaction with the quality of new products and services.
84

There has been a steady upstream migration of QFD since 1960s. For the first ten
years, QFD focused on internal deployments within the company’s operations to assure that
quality requirements are accurately communicated throughout the development and
production process. In its second decade of use, QFD incorporated external analyses of
customer requirements based on examining actual uses by the customers. In its third decade,
QFD stands in the initial phases of product concepting . Further, QFD is now being used to
integrate the hardware, software, service, and process aspects that are common in most
products today.
There are three main categories of design methods which are conventional methods,
creative methods and rational methods. QFD is one of the rational methods and at the same
time, QFD is also used as a technique in TQM. With QFD approach, there are several
techniques and tools for defining user requirements to apply QFD as a user-centered design
method.
In this study, two pre-defined commercial products (competent products) are
evaluated for user requirements and target properties in order to deploy foundations of a
new product design. When there exists a design prototype for a new product the attributes
of the prototype can be modified to meet the findings of QFD study. As a result, the new
product design will be implemented in the consideration of user requirements plus its
market share and competency level against similar products can be estimated beforehand.
The design process for every part of a product or service in a design project may
not be the same all the time. Depending on the type of project, sometimes only
professional standards, sometimes professional standards and criteria for customer
requirements and sometimes customer requirements and concepts satisfying those
customer requirements can be used. The designer can decide which point of view
should be used on every stage of the design process with the help of QFD approach.
The design categories can be realized with QFD and with the establishment of right
investments the competency of the new product can be increased on the market.
A research has been made in this study with people who are mostly employed
and aged between 20 and 30. Considering the results of the research that has been made
for potential customers, a new hairdryer product design can be based on the customer
requirements. For example, our study shows that a hairdryer which dries quickly is an
important factor in the voice of customer and new hairdryer designs can be
implemented with a new approach instead of making improvements on ordinary
hairdryer designs.
85

Figure 5.1 1200W Hard Bonnet Hair Dryer (Individualization studies for commercial products)
Figure 5.2 Infrared hair-drying lamp Considering new alternatives for conventional systems to develop new products or services.
REFERENCES
Akao, Y., 1997. “QFD: Past, Present, and Future”, International Symposium on QFD,
Linköping
Archer, L. B., 1984. Systematic Method for Designers, in Developments in Design
Methodology, Ed. Cross, N., Wiley, Chichester, UK. BS EN ISO9000 2000. Quality Management Systems: Fundamentals and Vocabulary.
London:British Standard Institution.
86

BS4778 1991, Quality Vocabulary, part 2: Quality Concepts and Related Definitions.
London: British Standards Institution.
Bolt, A. and Mazur, G. H., 1999. “Jurassic QFD: Integrating Service and Product
Quality Function Deployment”, The Eleventh Symposium on Quality Function
Deployment, Novi, Michigan.
Buijs, J., 1998. Viewpoint: Towards a New Theory X, Creativity and Innovation
Management, 7 / 1, 17-22.
Buur, J., 2002. The Practice of User Centered Design in Manufacturing Industry,
Mads Clausen Institute for Product Innovation, Sonderborg, Denmark (in press).
Chaplin, Ed, Md. ,Terninko, John, Ph.D., 2000. Customer-Driven Healthcare : Qfd
for Process Improvement and Cost Reduction
Cross, N., 2001. Engineering Design Methods: Strategies for Product Design, John
Wiley & Sons Ltd., UK.
Crush, P., 2000. New Product Development: Letting staff be creative, Marketing, 13,
27.
Dale, B.G., 2003. “Developing , Introducing and Sustaining TQM”:
http://www.blackwellpublishing.com/images/Content_store/Sample_chapter/
0631236147%5CDale_C01.pdf.
Deming, W.E. 1986. Out of the Crisis. (Cambridge, MA: MIT-CAES).
Dooley, Kevin J. and Johnson, Timothy L. ,1999, TQM, Chaos and Complexity
Department of Mechanical Engineering, University of Minnesota Minneapolis,
MN 55455 USA David H. Bush SciMed Life Systems Maple Grove, MN
55369 USA.
Dumas, A., 2002. “Theory and Practice of Industrial Design”.
Fox, J., 1993. ‘Quality Through Design:Key to Successful Product Delivery’,
McGraw-Hill, Cambridge
Freeman, C., 1982. The Economics of Industrial Innovation, 2nd edition, Frances
Pinter, London.
French, M. J., 1985. Conceptual Design for Engineers, Design Council, London.
Friedman, K., 2000. Creating Design Knowledge: From Research into Practice,
IDATER 2000, Loughborough University, UK.
Globerson, S. ,1997, “Discrepancies between customer expectations and product
87
configuration” International Journal of Project Management Vol.15 No.4
pp.199-203
Goodman, J., O’Brien, P. and Segal, E. 2000. Turning CEOs into quality champions.
Quality Progress
Hauser, John and Don Clausing, 1988. “The House of Quality.” Harvard Business
Review, May-June, pp. 63-73.
Hilton, K., 2002. Defining ‘Design Innovation’, Reply to Mail List Inquiry, Post Time:
April 01, 2002.
Holt, K., Geschka, H. and Peterlongo, G., 1984. Need Assessment: A Key to
Useroriented Product Innovation, John Wiley & Sons Ltd., Chichester.
Jones, J. C., 1992. Design Methods, Van Nostrand Reinhold, New York.
Juran, J., 1988. Juran on Planning for Quality. (New York: The Free Press).
Juran, J., & F. Gryna 1980. Quality Planning and Analysis. (New York: McGraw
Hill).
Kafol L., 1999. “TQM - Nature and Development”,
http://www.mfze.unsa.ba/casopis/broj12/TQMbit,%20nastanak%20i
%20razvoj.df.
Kano, N., 1984. Shinichi Tsuji, Nobuhiko Seraku, and Fumio Takerhashi.
“Miryokuteki Hinshitsu to Atarimae Hinshitsu” (“Attractive Quality and Must-
Be Quality”). Quality, JSQC 14(2) Tokyo, Japan, Society for Quality Control.
Kardos, G. , 1997. “Design – An Engineering Perspective”,
http://www.carleton.ca/~gkardos/88403/dsgnmthd/dsnview/dsnview.html.
Kelley, T., 2001. The Art of Innovation: Lessons in Creativity from IDEO, America’s
Leading Design Firm, Currency Books, New York.
Lippitt, G.L. 1982. Managing conflict in today's organizations. Training &
Development Journal, 36 (7), 67-74.
Lorenz, C., 1990. The Design Dimension, Basil Blackwell, Oxford.
Mazur G. , Bolt A., 1999 Jurassic QFD Integrating Service and Product Quality
Function Deployment, The Eleventh Symposium on Quality Function
Deployment Novi, Michigan.
Martin M., Ishii K., 2003. “ Introduction to Quality Function Deployment (QFD)”.
Marzano, S., 1997. What does the smile in my grandfather’s mirror have to do with
customer’s first choice, Corporate Presentation, Philips Electronics N.V.
Eindhoven, The Netherlands.
88

Matzler, K. And Hinterhuber H.H., 1998. “How to make product development
projects more successful by integrating Kano’model of customer satisfaction
into quality function deployment”, Technovation, 18(1), pp. 25-38.
Mizuno, Shigeru , Yoji Akao ed. , 1978. Quality Function Deployment: A Company
Wide Quality Approach. (in Japanese) JUSE Press.
Oakbrook, 1999 . Journal on Quality Improvement III:Joint Commission on
Accreditation of health-care Organizations.
Oakley, M., 1990. Design Management: A Handbook of Issues & Methods, Basil
Blackwell, Oxford.
OECD (Organisation for Economic Co-operation and Development),
1992.Technology and The Economy: The Key Relationships, OECD
Publications, Paris.
Popovic, V., 1999. Product Evaluation Methods and Their Importance in Designing
Interactive Artifacts in Human Factors in Product Design: Current Practice and
Future Trends, Pp. 26-35, Eds. Green, W. S. and Jordan, W. P., Taylor &
Francis, London.
Rothwell, R. and Gardiner, P., 1988. Re-Innovation and Robust Designs: Producer
and User Benefits, Journal of Marketing Management, 3 / 3, 64-72.
Rosenau, D. M., 1996. The PDMA Handbook of New Product Development, John
Wiley & Sons, US.
Sanders, E. B. N., 2001. A New Design Space, Proceedings of ICSID 2001 Seoul:
Exploring Emerging Design Paradigm, Oullim, Seoul, Korea, 317- 324.
Sanders, E. B. N., 2002a. Beyond User-Centered Design (Two Parts), Online Published
Article, http://www.sonicrim.com/red/us/pub.html.
Sauerwein, E., Bailom, F., Matzler, K., Hinterhuber, H.H., 1996. “The Kano
Model: How to Delight Your Customer”, in: Preprints Volume I of the IX.
International Working Seminar on Production Economics,
Innsbruck/Igls/Austria, pp. 313 -327.
Shewhart, W.A., 1931. Economic Control of Quality of Manufactured Product
Sullivan, L. P., 1996. “Quality Function Deployment,’’ Quality Progress.
Taylor, F. 1911. Principles of Scientific Management. (New York: Harper & Bros)
89

Trogisch, S., “Evaluation of the Quality Function Deployment Methodology towards
Sustainable Biogas Integration”, Profactor Produktionsforschungs GmbH,
Wehrgrabengasse 1-5, A-4400 Steyr.
Utterback, M. J. and Abernathy, W. J., 1975. A Dynamic Model of Process and
Product Innovation, OMEGA, The International Journal of Management
Science, 3 / 6.
Walsh, V., Roy, R., Potter, S. and Bruce, M., 1992 Winning by design: Technology,
product design and international competitiveness. Basil Blackwell, Oxford.
Walsh, V., Roy, R. and Bruce, M., 1988 Competitive by design, Journal of Marketing
Management, 4 / 2.
APPENDIX A
90
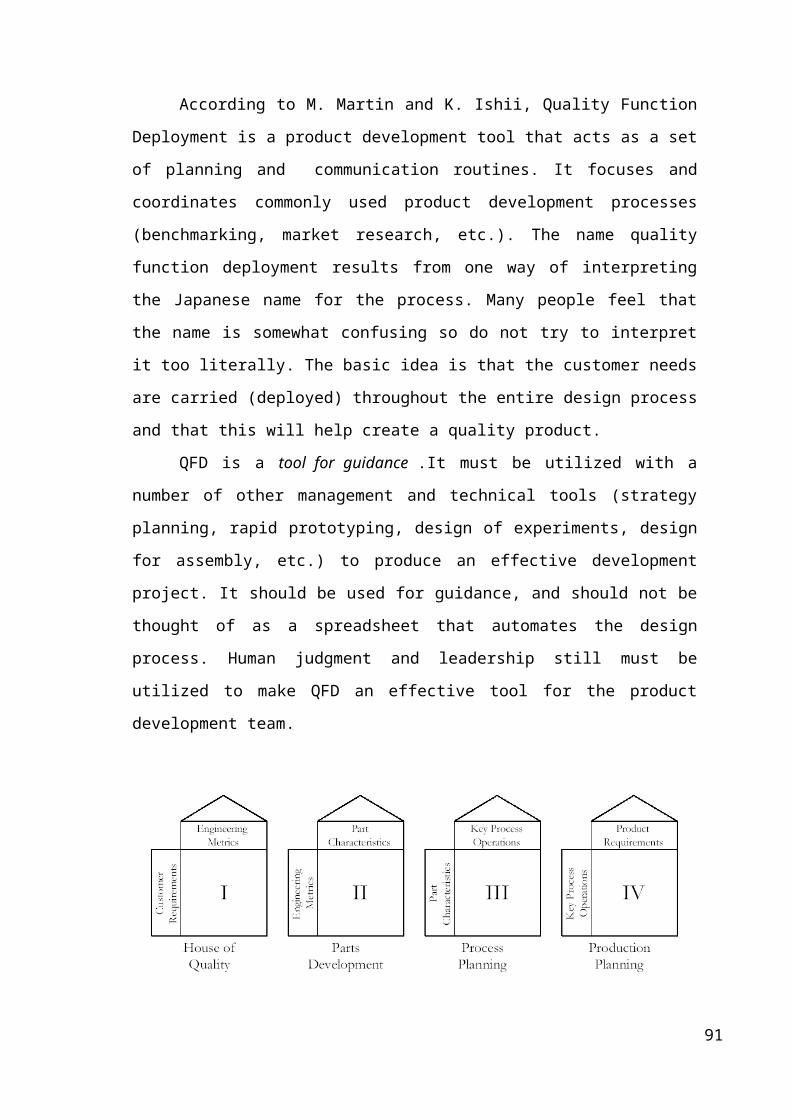
Table A.1: Raw “Voice of Customer” Data
91
Figure A.1: Arçelik 5187
Figure A.2: Braun CP 1600
92