abstract title of dissertation: evaluation of behavioral
TRANSCRIPT
ABSTRACT
Title of dissertation: EVALUATION OF BEHAVIORAL THEORY AND
INTEGRATED INTERNET/TELEPHONE TECHNOLOGIES TO SUPPORT MILITARY OBESITY AND WEIGHT MANAGEMENT PROGRAMS
Amy Rossi Mobley, Doctor of Philosophy, 2006 Dissertation directed by: Professor Mark Kantor Department of Nutrition & Food Science
The primary objective of the study was to evaluate the interaction of two different
weight management interventions and two methods of follow up counseling on weight
loss in overweight active duty military service members after 3 months. Participants
(n=172) were randomized to one of four groups using a 2 x 2 factorial treatment
structure: (1) Standard ‘Class’ + ‘In-person’ follow up counseling every 3 months, (2)
‘Class’ + weekly ‘Internet’ weight management follow up, (3) ‘Tailored’ behaviorally
based counseling session + ‘In-person’ follow up every 3 months, or 4) ‘Tailored’ +
‘Internet’. The secondary objective was to determine the relationship between stages of
change for five different weight control behaviors (dietary fat, fruits and vegetables,
portion control, beverage choices, exercise) and weight loss after 3 months.
Measurements were taken at 0 (baseline) and 3 months and included body weight, body
composition, waist circumference, blood pressure, fasting blood glucose, lipid levels,

stages of change and dietary assessment. Analysis of covariance with repeated measures
was used to compare outcome differences among groups over time.
There was no significant difference in weight loss or other outcomes among
treatment groups at 3 months. However, the ‘Tailored + Internet’ (-1.33 ± 0.66 kg,
p<0.05) and ‘Class + In-person’ (-1.4 ± 0.63 kg, p<0.05) groups lost significant weight
compared to baseline after 3 months. The ‘Tailored + Internet’ group also lost significant
total fat, trunk fat and percent body fat and had reduced waist circumference after 3
months while the ‘Class + In-person’ group significantly lost lean body mass but not fat
when compared to baseline. Furthermore, being in the action stage for each weight
control behavior did not result in significantly more weight loss than being in the pre-
action stages.
These results suggest that although the ‘Tailored + Internet’ group lost significant
weight and body fat after 3 months when compared to baseline, no treatment was
superior. Future research should explore other approaches, such as those found in an
ecological model of health behavior, because of the influence of other environmental
factors on weight management in the military.

EVALUATION OF BEHAVIORAL THEORY AND INTEGRATED
INTERNET/TELEPHONE TECHNOLOGIES TO SUPPORT MILITARY OBESITY AND WEIGHT MANAGEMENT PROGRAMS
By
Amy Rossi Mobley
Dissertation submitted to the Faculty of the Graduate School of the University of Maryland, College Park in partial fulfillment
of the requirements for the degree of Doctor of Philosophy
2006 Professor Mark Kantor, Chair Professor Phylis Moser-Veillon Professor Larry Douglass Professor Deborah Young Professor Sharon Desmond

©Copyright by
Amy Rossi Mobley
2006

ii
DEDICATION
For Stacey and Abbey

iii
ACKNOWLEDGEMENTS
Foremost, I would like to thank my committee members for their support and
mentorship during these past four years. Dr. Mark Kantor, my advisor, has been an
amazing listener and coach. Thank you for your support. Dr. Phylis Moser-Veillon was
a wonderful mentor during classes, teaching and research. Dr. Sharon Desmond helped
me to complement my nutrition background with public health knowledge and insight.
Dr. Debbie Young worked with me tirelessly in interpreting the world of accelerometry.
And, last but not least, I want to thank Dr. Larry Douglass for his incredible patience,
time, and instruction these past several months on helping me to use and interpret SAS.
I would like to thank the individuals who assisted with the research project at
Walter Reed Army Medical Center (WRAMC) and the US Army Medical Research and
Materiel Command for funding the study. Thank you to Dr. Stacey Mobley for bringing
this project to fruition. Many thanks to “HEALTH-e Forces,” Bob Goldberg, LTC
Veronica Thurmond, MAJ Anne Andrews, Nasim Adimi, LT Ruth Robinson, Nick
Garcia and several others for their assistance on the research project.
I also would like to extend my appreciation to my family, especially my parents,
for always encouraging me to pursue my education and dreams. In addition, I want to
thank my dog Abbey for keeping my feet warm under my desk and dragging me outside
for numerous breaks. Most of all, I would like to acknowledge my husband, Dr. Stacey
Lloyd Mobley, for his never ending support and encouragement these past 10 years. He
has been my biggest cheerleader throughout graduate school(s), work and personal life.
He has taught me the three “Ps” for success during this journey: patience, persistence and
problem-solving. His unconditional love and support will always be cherished.

iv
TABLE OF CONTENTS Dedication………………………………………………………………………......ii Acknowledgements………………………………………………………………...iii List of Tables……………………………………………………………………….vii List of Figures…………………………………………………………………….. ix List of Abbreviations…………………………………………………………….. x Chapter I: Introduction…………………………………………………………... 1
Background and significance………………………………………………. 1 Rationale…………………………………………………………………… 4 Objectives…………………………………………………………………. 6
Chapter II: Literature review…………………………………………………… 8
Overview of weight management approaches in adults…………………… 8 Risk factors associated with obesity………………………………..……… 10 Behavioral modification……………………………………………………. 10
Transtheoretical model of health behavior………………………… 11 Alternative methods to weight management follow-up counseling………...15
Internet/telephone usage for weight management…………………. 15 Military weight management programs……………………………………. 18
Overview…………………………………………………………… 18 Previous military research…………………………………………..21
Chapter III: Development of a weight control stage of change instrument and
interactive nutrition & fitness website for military weight management programs…………………………………………………………………... 23 Overview…………………………………………………………………… 23 Development of Stages of Change Instrument…………………………….. 23
Cognitive Interviewing for Stages of Change Instrument…………. 24 Key Findings from Cognitive Interviews………………….. 25
Validation of Stages of Change Instrument……………………….. 26 Key Findings from Validation……………………………... 28 Development of Army Interactive Nutrition & Fitness On-line Website…. 31
Security and Confidentiality of the A-INFO Web site…………….. 33 A-INFO Testing……………………………………………………. 34 Chapter IV: Comparison of the impact of four weight management
interventions on body weight, risk factors associated with obesity and other parameters related to overweight and obesity in active duty military service members ……………………………………………….. 35 Abstract…………………………………………………………………….. 35

v
Introduction………………………………………………………………… 36 Materials and Methods…………………………………………………….. 37 Subjects…………………………………………………………….. 37 Sample Size Estimation……………………………………………. 38 Inclusion and Exclusion Criteria…………………………………… 39 Consent Process……………………………………………………. 39 Study Design and Treatment………………………………………..40
Data Collection…………………………………………………….. 43 General Information……………………………………….. 44 Anthropometric Assessment……………………………….. 44 Body Composition Assessment……………………………. 45 Clinical and Biochemical Assessment……………………... 45 Dietary Assessment………………………………………… 46 Physical Activity Assessment……………………………… 46 Stages of Change Assessment………………………………47 Data Analysis………………………………………………………. 48 Results………………………………………………………………………51 Baseline characteristics…………………………………………….. 51 Data used for analyses…………………………………………….. 57 Changes in weight and body mass index ………………………….. 58 Changes in body composition …………………………………….. 64
Changes in risk factors associated with obesity …………………… 64 Change in diet …………………………………………………….. 66
Preliminary 6 months results for weight and body mass index……. 67 Average use and barriers to use of the A-INFO website………….. 71 Attrition……………………………………………………………. 73 Discussion…………………………………………………………………. 75
Chapter V: Changes in weight control “stage of change” behaviors
and corresponding weight loss in active duty military service members during participation in a weight loss study………………….. 89 Abstract……………………………………………………………………. 89 Introduction………………………………………………………………… 90 Materials and Methods……………………………………………………. 91 Subjects……………………………………………………………. 92 Data Collection…………………………………………………….. 92 Anthropometric Assessment………………………………. 92 Stages of Change Assessment…………………………….. 92 Data Analysis……………………………………………………… 93 Results…………………………………………………………………….. 95
Baseline ‘stages of change’……………………………………….. 95 Changes in ‘stages of change’ at 3 months………………………… 95 Relationship of ‘stages of change’ to weight loss after 3 months…. 97
Discussion…………………………………………………………………. 100

vi
Chapter VI: Conclusions…………………………………………………………. 107 Major findings……………………………………………………………… 107 Strengths…………………………………………………………………… 108 Limitations…………………………………………………………………. 109 Future Directions………………………………………………………….. 110
Appendices………………………………………………………………………… 113
APPENDIX A: Cognitive Interviewing Questions…………………………113 APPENDIX B: Stages of Change Instrument……………………………… 119 APPENDIX C: Message Library…………………………………………... 127 APPENDIX D: Sample Screen Shots of A-INFO…………………………. 134 APPENDIX E: Institutional Review Board Approval Letters…………….. 138 APPENDIX F: Screening Form……………………………………………. 141 APPENDIX G: Exclusion List……………………………………………...142 APPENDIX H: Consent Form…………………………………………….. 143 APPENDIX I: Authorization for Research Use of Protected Health Info... 148 APPENDIX J: A-INFO Usage Survey…………………………………….. 150 APPENDIX K: General Information Form………………………………... 151 APPENDIX L: Measured Use of A-INFO Web Account over 3 months… 155 APPENDIX M: Responses to A-INFO Web Survey……………………… 156 APPENDIX N: Select Characteristics of 3 Month Completers & Dropouts.157 APPENDIX O: Select Characteristics of 6 Month Completers & Dropouts.158 APPENDIX P: Tables of Raw Data………………………………………. 159
List of References…………………………………………………………………. 213

vii
LIST OF TABLES Table Page 2.1 Stages and processes of change of the TTM………………………………. 12 3.1 Weight control behavior criteria for “action”……………………………… 28 3.2 Sample weight control intervention for exercise………………………….. 31 4.1 Timetable of research project procedures and outcome measures…………. 43 4.2 Baseline demographics…………………………………………………….. 52 4.3 Baseline anthropometric and clinical measurements……………………… 53 4.4 Baseline biochemical parameters…………………………………………...54 4.5 Baseline diet………………………………………………………………...55 4.6 Select characteristics of subjects who completed 3 month appointment….. 59 4.7 Impact of education level*followup interaction on weight (n=123)………. 60 4.8 Impact of marital status*followup interaction on weight (n=123)………….60 4.9 Impact of marital status*diet*followup interaction on weight (n=123)…… 60 4.10 Impact of marital status*diet*followup interaction on weight (n=172)…… 61 4.11 Change in weight for completers after 3 months (n=123)…………………. 61 4.12 Changes in weight after 3 months, “intent-to-treat” analysis………………62 4.13 Changes in anthropometric and clinical measurements after 3 months…… 65 4.14 Changes in biochemical parameters after 3 months……………………….. 65 4.15 Changes in diet after 3 months…………………………………………….. 66 4.16 Select characteristics of subjects who completed 6 month appointment….. 67 4.17 Impact of marital status*followup interaction on weight (n=66)………….. 68 4.18 Impact of education level*followup interaction on weight (n=66)…………69

viii
4.19 Change in weight and body mass index for completers after 6 months…… 71 4.20 Total dropouts and pending appointments from study…………………….. 74 5.1 Baseline weight control behaviors (stages of change)……………………... 96 5.2 Weight control behaviors (stages of change) before and after 3 months….. 98 5.3 Relationship of stage of change to weight change…………………………. 99

ix
LIST OF FIGURES
Figure Page 4.1 Study design……………………………………………………………….. 38 4.2 Weight change after 3 months for completers only……………………….. 62 4.3 Weight change after 3 months, “intent-to-treat” analysis.…………………. 63 4.4 Trends in adjusted mean body weight over 6 months for completers only...70 4.5 Weight change after 6 months for completers only………………………... 70

x
LIST OF ABBREVIATIONS A-INFO Army Interactive Nutrition & Fitness On-line ANOVA Analysis of variance ANCOVA Analysis of covariance ATP III Adult Treatment Panel III AWCP Army Weight Control Program BMI Body mass index DEXA Dual Energy X-ray Absorptiometry DHHS Department of Health and Human Services FBG Fasting blood glucose HDL High density lipoprotein cholesterol LDL Low density lipoprotein cholesterol mmHg Millimeters of mercury NHLBI National Heart, Lung and Blood Institute NIH National Institutes of Health POC Processes of change PROC FREQ Frequency procedure in Statistical Analysis Software PROC MEANS Means procedure in Statistical Analysis Software SD Standard deviation SE Standard error SOC Stages of change TG Triglycerides TBI Tailored behavioral intervention

xi
TTM Transtheoretical Model of Health Behavior USDA United States Department of Agriculture WC Waist circumference WRAMC Walter Reed Army Medical Center WTS “Weigh to Stay”
1
Chapter I: Introduction Background and significance The prevalence of overweight and obesity among adults in the United States
has reached epidemic proportions. The 1999-2000 National Health and Nutrition
Examination Survey (NHANES) revealed that 64.5% of adults ages 20 years and older
are overweight or obese, an increase from 55.9% reported from NHANES III data
(1988-1994) (1). At the same time, the U.S. military is experiencing trends in
overweight similar to the pattern among the general population. A study revealed that
54% of military personnel were classified as overweight in 1998, compared to 50%
being overweight in 1995 (2). Currently, 60% of men and 40% of women are
considered overweight or obese in the U.S. Army (3).
Not only can excess weight in soldiers affect military duties and performance
but it can also increase the risk for disease and obesity-related costs. A study
conducted among active duty U.S. Navy personnel revealed that an estimated
$5,842,627 in medical expenses was attributed to obesity-related costs, a figure that
could be substantially reduced by improving obesity interventions (4). Furthermore,
once active duty military service members retire, those who are overweight or obese
may experience increased risk of chronic disease and conditions such as diabetes,
hypertension and high levels of blood cholesterol compared to their normal weight
counterparts (5).
The military is also experiencing problems with recruitment and retention of
qualified soldiers because civilians and soldiers are unable to meet military weight
standards. Currently, 13-18% of U.S. men and 17-43% of U.S. women would be

2
ineligible for military duty because they exceed body weight prerequisites (6).
Furthermore, 80% of the military personnel that initially exceed the weight standards
during recruitment eventually separate from the military before finishing their first
term. In addition, more than 1400 personnel were discharged from the military in
2002 because they were unable to meet the body weight and body fat standards (6).
In response to the problem of overweight in the U.S. military, a Subcommittee
on Military Weight Management under the Committee on Military Nutrition Research
of the Institute of Medicine (IOM) was appointed in 1999 to: 1) Identify strategies for
the most effective interventions for weight loss and weight maintenance, 2) Evaluate
each intervention’s appropriateness or need for research, and 3) Develop a more
standard Department of Defense-wide approach to weight management in the military
environment (3).
The Military Weight Management Subcommittee released its report, ‘State of
the Science and Opportunities for Military Weight Management” in 2003. The report
recommended using standard methodology to evaluate the effectiveness of current
military weight management programs, instituting Internet/computer-based
applications for world-wide access, and further exploring established program features
such as behavioral modification and structured follow-up. The report concluded that
an effective and safe weight loss program should include a combination of increased
energy expenditure through exercise and daily activity, reduced energy intake,
behavior modification, and lifestyle changes (3).
Unfortunately, the Army’s current weight management program, the Army
Weight Control Program (AWCP), does not fulfill all of these recommendations. The

3
AWCP includes a general, classroom presentation called “Weigh to Stay” (WTS). It
is similar to other weight control programs in that it is not specifically tailored to an
individual’s needs and does not address psychosocial issues such as individual weight
control behaviors and readiness to change. Even though a technique often cited for
improving long-term weight loss is the development of individualized, matched
treatments for patients, implementing WTS mistakenly assumes that all enrollees are
ready to make weight control related changes (7). The WTS program also has not
been closely evaluated for its effectiveness and it lacks the capability to properly track
individuals enrolled in the program. The trend of an increasing prevalence of
overweight military personnel and low attendance at follow-up appointments
(Personal Communication, Wellness Services, Walter Reed Army Medical Center) in
WTS confirms the need to re-evaluate this current nutrition education component of
the AWCP.
The Transtheoretical Model of Health Behavior (TTM) includes the constructs
“stages of change” (SOC) and “processes of change” (POC). Although this model has
been used with various populations to understand and predict weight control behaviors
and weight loss, these two constructs have not been applied previously to a weight
control intervention in soldiers. An effective nutrition and fitness education
component, however, is crucial in the AWCP to help soldiers achieve the highest
physical standards possible to fulfill the demands of their duties under combat
conditions, especially in the time of war.
As far as we know, this is the first study to develop an individualized
behavioral-based weight control program for soldiers using the Internet. Our findings

4
could have a significant impact on reducing the prevalence of overweight men and
women in the U.S. Army.
Rationale
According to Brownell, a successful weight control program should be
comprehensive and emphasize a number of factors such as: 1) The importance of
behaviors and coping skills, 2) Integrative changes in nutrition and eating, exercise,
cognition and social support, 3) A combination of cognitive and behavioral factors to
focus on weight maintenance and 4) An individualized program tailored to one’s aspects
of behavior (8).
An effective weight control intervention should help individuals progress from
their current stage of change to the action and maintenance stages (9). Most interventions
mistakenly just provide information and assume that an individual is ready to lose weight
(10). However, many individuals are not ready to take action, as only 25% of them are
typically ready to change a health behavior (11). Approximately half of individuals
(~50%) are categorized as being in the precontemplation stage, meaning that they may
not even realize that they have a problem with their weight (11).
As previously mentioned, WTS does not address psychosocial issues such as
individual weight control behaviors and readiness to change, thus it assumes that soldiers
enrolled are ready to lose weight. In addition, the impact of WTS has not been closely
evaluated for its success and lacks the capability to properly track individuals enrolled in
the program.
Another challenge with respect to weight management in the military is the
current inability to provide “structured follow-up due to the mobility of the military

5
population.” This issue was addressed by clinicians at the U.S. Military Nutrition
Symposium (October, 2003). With rapid increases in Internet and mobile telephone use
over the past decade, a web-based weight management system with telephone integration
offers opportunities to improve the delivery of weight management care to the military.
The methodology used in previous studies have neither combined the Internet and
telephone nor integrated dietary behavioral psychology with currently available
technology. Furthermore, the methods and instruments have not been developed or
customized for the military environment; hence, their applications are limited to the
civilian sector. This study uses the latest research in dietary behavioral therapy for
weight loss together with telephone and Internet technology to create an innovative
personalized “Web/Telephone Weight Control and Maintenance” account for soldiers as
described later. The development of this account is the first of its kind in the military and
may serve as a weight management model for all uniform services or for other
populations. Furthermore, this study may provide a framework to support future
programs that can be implemented in U.S. Army facilities throughout the world to
positively impact weight control in soldiers.

6
Research Objectives and Hypotheses
Primary Objectives:
1. To evaluate four different weight loss treatments consisting of the interaction of two
weight management treatments (standard classroom vs. tailored behavioral) and two
follow-up counseling methods (in-person vs. Internet only) on weight loss and other
weight related parameters (body composition, waist circumference, blood pressure (BP),
fasting blood glucose (FBG), blood lipids, diet, exercise, SOC) in active duty military
personnel after 3 and 6 months.
Hypothesis: The tailored behavioral-based dietary intervention with Internet
follow-up will promote the most weight loss while improving body composition
and other weight-related outcomes (waist circumference, BP, FBG, blood lipids,
diet, exercise, SOC) compared to the other interventions after 3 and 6 months.
1a. To determine if the tailored behavioral intervention (TBI) promotes more weight loss
and weight related improvements (body composition, waist circumference, BP, FBG,
blood lipids, diet, exercise, SOC) than a non-tailored, standard classroom intervention
(WTS) regardless of the type of follow-up method after 3 and 6 months.
Hypothesis: The tailored behavioral-based dietary intervention will promote the
most weight loss and fat reduction while improving body composition and other
weight-related outcomes (waist circumference, BP, FBG, blood lipids, diet,
exercise, SOC) compared to the standard classroom intervention (Weigh to Stay)
regardless of follow-up method after 3 and 6 months.
1b. To determine if the Internet follow-up method promotes more weight loss and weight
related improvements (body composition, waist circumference, BP, FBG, blood lipids,

7
diet, exercise, SOC) than the in-person follow-up regardless of the type of dietary
intervention approach after 3 and 6 months.
Hypothesis: The Internet follow-up method will promote the most weight loss and
fat reduction while improving body composition and other weight-related
outcomes (waist circumference, BP, FBG, blood lipids, diet, exercise, SOC)
compared to the in-person follow-up regardless of dietary treatment method type
after 3 and 6 months.
Secondary Objective:
2. To determine if there is a relationship between weight control behaviors (using stages
of change) and weight loss in active duty military personnel after 3 and 6 months
participation in a weight loss study.
Hypothesis: Individuals that are in the action or maintenance stage for each of the
five weight control behaviors (dietary fat, fruits and vegetables, portion control,
beverages and exercise) will have more weight loss after 3 and 6 months
participation in a weight loss study.

8
Chapter II: Literature review
Overview of weight management approaches in adults
According to the National Heart Lung and Blood Institute (NHLBI) of the
National Institutes of Health and the North American Association for the Study of
Obesity, the three main components of a successful weight loss program in adults are
diet, exercise and behavior modification (12). Successful weight loss and maintenance
require lifestyle rather than short-term changes (13). Standard recommendations for diet
include restricting energy to a deficit of 500-1000 kilocalories (kcal) per day to result in a
1-2 pound weight loss per week. A diet comprised of 30% kcal from fat, 15% kcal from
protein and 55% kcal or more from carbohydrate is typically recommended (12).
In addition to caloric restriction, increased physical activity is recommended to
expend calories, spare lean body mass and improve cardiovascular fitness. Physical
activity recommendations vary, but a common goal is to participate in 30 minutes of
accumulated moderate activity most days of the week. Besides planned bouts of activity,
simple lifestyle changes, such as taking the stairs instead of an elevator and parking
further away from a destination are also recommended. However, physical activity
produces minimal weight loss alone unless accompanied by caloric restriction (14).
Increased and sustained physical activity to increase energy expenditure over time is
crucial for weight loss maintenance (14).
Behavior change is a cornerstone of successful weight management. Strategies
such as self-monitoring, stimulus control, cognitive restructuring, stress management,
social support and relapse prevention are vital in efforts to change habits and lose weight
(15). Furthermore, an important but often overlooked component of a weight-loss

9
behavioral intervention is to also assess an individual’s readiness to change behaviors to
lose weight.
An evidence based algorithm for the treatment of obesity in adults has been
established by the NHLBI (14). A 5-10% weight loss over a 6 month time period is
typically recommended if an individual has a BMI ≥ 30 kg/m2. Weight loss is also
recommended for individuals with a BMI ≥ 25 kg/m2 or a high-risk waist circumference
(>88 cm for women, >102 cm for men) and at least 2 other risk factors (co-morbidities of
obesity) for chronic disease such as hypertension, elevated LDL-cholesterol, low HDL-
cholesterol, impaired fasting glucose (≥100 mg/dL), current smoker, family history of
coronary heart disease, or older age (≥55 years for women, ≥45 years for men).
However, weight loss may not always be recommended. For example, an individual with
a BMI of 25–29.9 kg/m2, fewer than 2 other risk factors (co-morbidities for chronic
disease) and who is not ready to lose weight, should be counseled on how to maintain
their current weight.
Other options for weight loss, if lifestyle change alone is not effective, are
pharmacotherapy or gastric surgery. Pharmacotherapy should only be considered if an
individual has a BMI ≥ 27 kg/m2 and 2 risk factors or a BMI ≥ 30 kg/m2.
Pharmacotherapy should not be provided until an individual has attempted lifestyle
changes and has not lost at least 1 lb per week after 6 months (12). Gastric surgery is the
most extreme option for individuals with a BMI ≥ 35 kg/m2 and at least two other risk
factors or a BMI ≥ 40 kg/m2. Surgery only should be considered if all other approaches
have failed. Medical monitoring is essential if weight loss approaches involve drugs
and/or surgery.

10
Risk factors associated with obesity
The treatment of overweight and obesity is important for reducing risk factors
(comorbidities) commonly associated with obesity including elevated blood pressure,
abnormal blood lipids levels and elevated fasting blood glucose levels. Multiple
randomized controlled trials have provided strong evidence that weight reduction
resulting from lifestyle change can reduce blood pressure in overweight and obese
individuals (14). Strong evidence also exists that weight loss through lifestyle change
can lower triglycerides and increase HDL-cholesterol levels (14, 16). Weight loss is also
associated with reductions in blood levels of total cholesterol and LDL-cholesterol (14,
16, 17). Furthermore, there is compelling evidence from lifestyle trials that weight loss
reduces fasting blood glucose levels in overweight and obese individuals who are not
diabetic (14).
An individual having multiple risk factors is at risk for developing the metabolic
syndrome. The risk factors for metabolic syndrome include: high-risk waist
circumference (≥88 cm women, ≥102 cm men), impaired fasting glucose (≥100 mg/dL),
elevated triglycerides (≥150 mg/dL), low levels of HDL cholesterol (<50 mg/dL women,
<40 mg/dL men) and elevated blood pressure (≥130 mmHg systolic or ≥85 mmHg
diastolic). Taking medications to control blood glucose, triglycerides, HDL-cholesterol
and blood pressure also qualify as a risk factor regardless of current measurement.
Behavioral Modification
Several health behavior theories and models have been used in the development
and implementation of dietary and physical activity interventions. These include the
Health Belief Model, Social Cognitive Theory, Theory of Reasoned Action and Theory

11
of Planned Behavior and the Transtheoretical Model of Health Behavior (TTM). The
TTM was chosen for this intervention because it has been used previously to study diet
and physical activity behaviors and because two of its constructs, stages of change (SOC)
and processes of change (POC) provide a user-friendly framework for an interactive,
tailored, computer based-intervention.
The Transtheoretical Model of Health Behavior
Prochaska and DiClemente proposed the Transtheoretical Model (TTM) in the
early 1980’s to explain the underlying structure of behavior change in smokers (18, 19).
The TTM is comprised of four major constructs: stages of change, self-efficacy,
decisional balance and processes of change. “Stages of change” is the most commonly
used construct of the model and is made up of five stages: precontemplation,
contemplation, preparation, action, and maintenance. These stages were identified as the
central organizing construct or temporal dimension of the TTM to help determine when
individuals would change their attitudes, intentions and behaviors with respect to
smoking (20).
Processes of change (POC), another major construct and independent variable
dimension of the TTM, is comprised of covert and overt approaches that individuals use
to progress through the SOC (20). Although some studies have applied the POC when
tailoring interventions, additional research is especially needed on this construct of the
TTM because it has been tested the least in dietary interventions (11). A brief summary
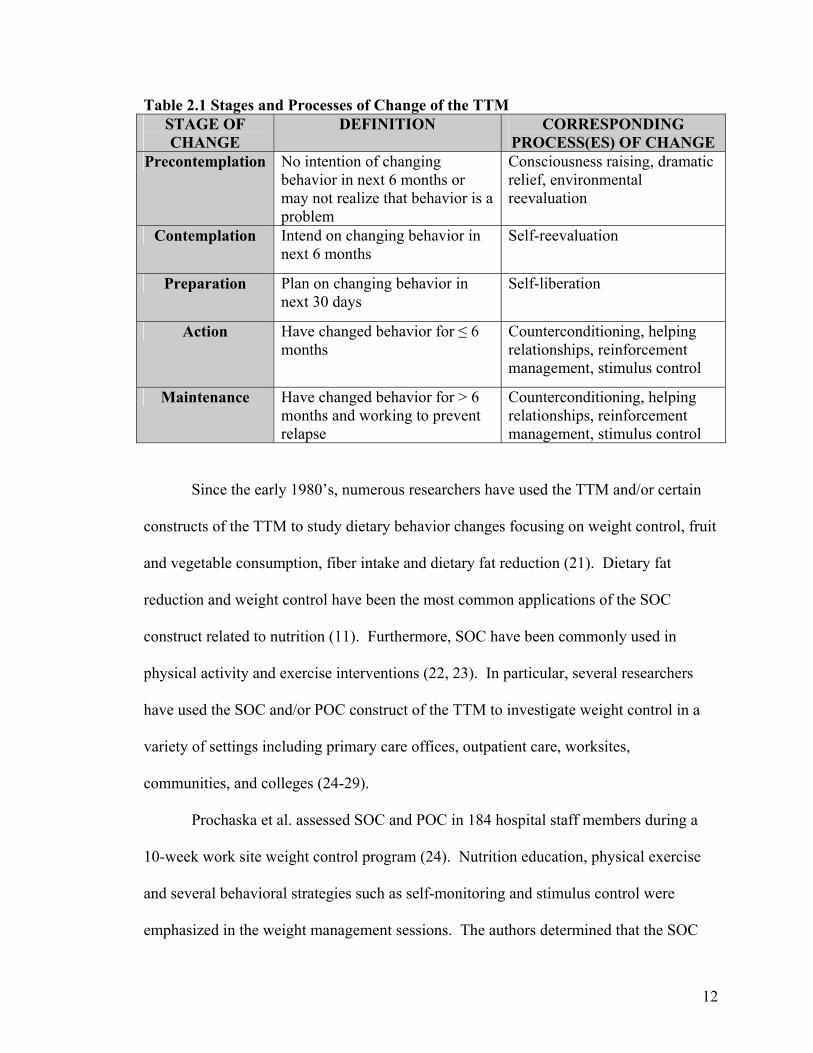
of the stages and processes of change of the TTM is presented in Table 2.1.
12
Table 2.1 Stages and Processes of Change of the TTM STAGE OF CHANGE
DEFINITION CORRESPONDING PROCESS(ES) OF CHANGE
Precontemplation No intention of changing behavior in next 6 months or may not realize that behavior is a problem
Consciousness raising, dramatic relief, environmental reevaluation
Contemplation Intend on changing behavior in next 6 months
Self-reevaluation
Preparation Plan on changing behavior in next 30 days
Self-liberation
Action Have changed behavior for ≤ 6 months
Counterconditioning, helping relationships, reinforcement management, stimulus control
Maintenance Have changed behavior for > 6 months and working to prevent relapse
Counterconditioning, helping relationships, reinforcement management, stimulus control
Since the early 1980’s, numerous researchers have used the TTM and/or certain
constructs of the TTM to study dietary behavior changes focusing on weight control, fruit
and vegetable consumption, fiber intake and dietary fat reduction (21). Dietary fat
reduction and weight control have been the most common applications of the SOC
construct related to nutrition (11). Furthermore, SOC have been commonly used in
physical activity and exercise interventions (22, 23). In particular, several researchers
have used the SOC and/or POC construct of the TTM to investigate weight control in a
variety of settings including primary care offices, outpatient care, worksites,
communities, and colleges (24-29).
Prochaska et al. assessed SOC and POC in 184 hospital staff members during a
10-week work site weight control program (24). Nutrition education, physical exercise
and several behavioral strategies such as self-monitoring and stimulus control were
emphasized in the weight management sessions. The authors determined that the SOC

13
and POC of various weight control behaviors were related to attendance and outcomes of
the program. For example, participants who were in the action stage had the best
attendance and exhibited the greatest weight loss. By the end of the program, more
participants were in the action stage than the contemplation stage. This study
demonstrated the effectiveness of tailored interventions, especially for individuals who
were not initially in the action stage.
Other researchers have used more than one construct of the TTM. In a study
involving 264 college students, O’Connell et al. concluded that SOC and decisional
balance are valid tools for weight loss related behaviors and may be applicable to a
clinically overweight population (28).
It is important to note that “weight control” is not an actual behavior.
Specifically, decreasing fat intake, decreasing portion sizes of food, decreasing the
amount of high calorie beverages, increasing the amount of fruits and vegetables in the
diet and increasing physical activity are behaviors that may lead to weight loss.
Successful weight control relies on changing multiple behaviors and it is important to
recognize than an individual may have a heterogeneous stage of change profile for
different weight control behaviors.
For example, in an obesity intervention involving 284 family practice patients,
SOC was assessed for 6 weight-related behaviors including planned exercise, daily
activity, fruit consumption, vegetable consumption, dietary fat intake and portion sizes.
(30). The data indicated that patients were in different stages for the various behaviors.
Patients in the action and maintenance stages for exercise/activity, fruit intake, reduced
dietary fat and portion control had lower BMIs or waist circumferences than patients in

14
the contemplation or preparation stages. The results underscored the importance of using
tailored treatments and approaches that are specifically designed for the behavior being
considered, and to take into account an individual’s readiness to change.
In a weight loss study designed to determine why tailored nutrition education
materials are more effective in changing behaviors compared to non-tailored materials in
198 overweight adults, different types of nutrition education materials were evaluated to
assess the impact on personal connections, self-efficacy, behavioral intention, self-
assessment, and number and polarity of thoughts (31). The results indicated that
individuals who received the tailored materials had more positive personal connections
with the information, higher behavioral intentions, positive self-assessment and more
positive thoughts regarding weight loss compared to individuals receiving the non-
tailored materials.
A study based on SOC and involving over 500 adult primary care patients
evaluated the effect of a tailored intervention on fat and fruit and vegetable consumption
(32). Nutrition messages were generated by a computer program based on each
individual’s stage of change for fat, fruit and vegetables. A tailored newsletter was then
mailed to each participant in the study, and subjects were resurveyed 4 months after
receiving the tailored intervention. The results revealed that the patients were more likely
to read and remember tailored versus non-tailored information. Furthermore, those
receiving the tailored newsletter had significant decreases in total fat and saturated fat
intake compared to a control group. Fruit and vegetable intake was not significantly
affected but the authors speculated that this was most likely due to a seasonal affect. This
study demonstrated how tailored messages based on the SOC can not only help

15
individuals progress to higher stages (as documented in other studies), but that such
messages also promoted actual behavior changes. In addition, it has been estimated that
if individuals can advance just one stage for a given behavior, then they double the
chances of reaching the action stage for that behavior within a 6 month period. (33).
Alternative methods to weight management follow-up counseling
Conventional approaches to treating obesity have been largely ineffective, and
obesity continues to burden the health status of the population. Therefore, seeking
alternative methods of treatment are necessary. In-person nutritional counseling by a
registered dietitian is a standard option in weight management but it can be financially
burdensome, especially if one does not have health care insurance or if the insurance does
not cover nutritional counseling. Furthermore, information on physical activity may or
may not be addressed by a dietitian. Individual counseling is also time-consuming and
qualified nutrition professionals may not be available in all communities. Thus, providing
weight loss counseling electronically through the Internet/web should be explored as a
potential alternative for treating overweight and obesity.
Internet/Telephone Use for Weight Management
Access and use of the Internet has grown substantially in recent years, making it
an ideal channel for disseminating health information (34). However, the majority of
nutrition information available on the Internet is not necessarily tailored to an individual
but instead, is rather general (e.g. Dietary Guidelines for Americans,
http://www.health.gov/dietaryguidelines/dga2005/document/).
Recently, computer technology has offered the capability to individually tailor
health education messages, which can be developed using health behavior models such as

16
the TTM. Because tailoring weight control interventions to individuals during in-person
visits can prove to be time consuming for a nutrition counselor, the use of technology
such as the Internet offers a promising alternative. Using this technology can decrease
demands on nutrition counselors and therefore decrease staff time while allowing greater
flexibility in scheduling personal weight management counseling sessions.
Computer-tailored nutrition education has gained popularity in recent years as an
innovative approach that is more effective in motivating individuals to change dietary
habits than non-tailored nutrition information available by computer (35, 36). A
randomized controlled trial of approximately 200 Dutch adults was conducted to evaluate
the effect of a tailored computer intervention versus a control intervention (non-tailored
and non-computerized) on an individual’s awareness and intention to change fat, fruit and
vegetable intake (37). After a post-test, participants in the tailored group had
significantly higher intentions to reduce fat intake and were more aware of their fat and
fruit consumption. In addition, computer literacy did not impact the results, indicating
that computer tailoring may still be effective even among individuals who have little
prior computer experience.
Although not a randomized trial, Block et al. investigated the impact of a tailored
intervention that was mailed electronically to corporate worksite employees over a 12
week period. (38). SOC for fruit and vegetable and fat intake were assessed at baseline
and after 12 weeks. A screening questionnaire was used to assess dietary fat and fruit
and vegetable intake. Participants reported increased fruit and vegetable intake and
decreased dietary fat intake and also progressed to higher SOC after the 12 week

17
intervention. This program demonstrated promising results using a feasible approach of
e-mail tailoring.
Internet technology has been used in previous studies to provide education and
behavioral therapy for weight loss (34, 39, 40). A study of individuals with type 2
diabetes being counseled through the Internet was shown to be more effective than the
Internet alone in reducing weight (4.4 lbs vs. 2.0 lbs lost respectively) and waist
circumference (7.2 cm vs. 4.4 cm lost, respectively) (41). However, this study used an
Internet program which was solely educational rather than personally tailored through
interaction. In addition, the Internet program was not structured using behavioral models
for weight loss. In a different study by Tate et al., the effect of a behavioral versus non-
behavioral web-based weight loss program was evaluated in overweight adults (34). The
group receiving the behavioral-based Internet education had significantly greater
reductions in weight and waist circumference compared to the non-behavioral treatment
group.
Harvey-Berino et al. evaluated the feasibility of Internet support for weight
maintenance in a pilot study by comparing weight loss of 46 obese individuals after 22
weeks of either in-person or Internet follow up. The results revealed that weight
maintenance was no different among groups suggesting that the Internet follow up was
equally as effective as the in-person counseling (39). In addition, there were no
differences in the drop-out rate between the two groups. The same research team then
tested these findings in 255 overweight adults by evaluating weight maintenance after 12
months of standard in-person follow-up or Internet support. This study showed that

18
Internet support provides comparable results to in-person counseling in regard to weight
maintenance and may serve as an alternative to in-person counseling (42).
The use of telephone technology in nutrition counseling has also been tested
previously. Robinson et. al. conducted a study using a telephone-based system and
showed a reduction in the levels of low density lipoprotein-cholesterol (LDL) in patients
who received weekly telephone calls to review laboratory values and receive advice on
diet and physical activity (43).
Military weight management programs
Overview
Each branch of the military (Army, Navy, Air Force, Marine Corps) has similar
but different programs and resources related to weight management for their active duty
military personnel (3). The programs are similar in that they include some sort of
nutritional class or counseling but the type of intervention and frequency may vary. Each
branch of the military takes measurements such as weight on all active duty personnel at
least once annually. With certain exceptions and at some discretion of the commander,
each branch of the military enforces consequences for personnel not meeting established
weight and/or body fat standards. These consequences include denial of promotion,
schooling, awards, and reenlistment, and may be as extreme as being discharged from the
military. This, in turn, may foster feelings of resentment and perpetuate poor diet and
exercise habits among military personnel in attempts to achieve military weight and body
fat standards (44, 45) .
The Army Weight Control Program
In 1980, President Carter requested that the Armed Forces explore ways to

19
improve overall fitness. Consequently, a panel of experts recommended that the Army
Weight Control Program (AWCP) be revised and improved (Army Regulation (AR)
600-9). The AWCP, originally established in 1976, was created to ensure that all
Army personnel are able to uphold the physical demands of their duties under combat
conditions as well as meet the standards of professional appearance (46).
The AWCP is a comprehensive, multidisciplinary program mandated to assist,
educate and motivate overweight soldiers to meet the weight and body fat standards
established within AR 600-9. The premise is that physically fit soldiers will have
optimal body composition. Fit soldiers presumably are better able to perform
physically related tasks, are at less risk of injury, have higher Army Physical Fitness
test scores and convey a trim and “soldierly” appearance (3). The objectives of the
AWCP include assisting in establishing and maintaining discipline, operational
readiness, optimal physical fitness and health among Army personnel. The current
AWCP has not been revised since 1987.
Soldiers are weighed every 6 months (with exceptions for pregnant women,
women up to 6 months postpartum, and hospitalized and medically treated soldiers)
and weight is assessed using height and weight tables based on age and gender. If a
soldier exceeds these standards, body “tape” circumference measurements are taken to
calculate body fat percentage. Male soldiers are measured at specified areas around
the abdomen and neck and female soldiers are measured around the neck, forearm,
wrist, and hip. These measurements are included in a previously validated regression
equation to predict percent body fat. The acceptable age-dependent body fat range is
20-26% for men and 30-36% for women. If a soldier exceeds the body fat cut-offs
20
based on age and gender, then the soldier’s record(s) are flagged and s/he is required
to enter the AWCP. While enrolled in the AWCP, the soldier cannot be considered for
promotion, authorized to attend military and civilian schools or assigned to command
positions.
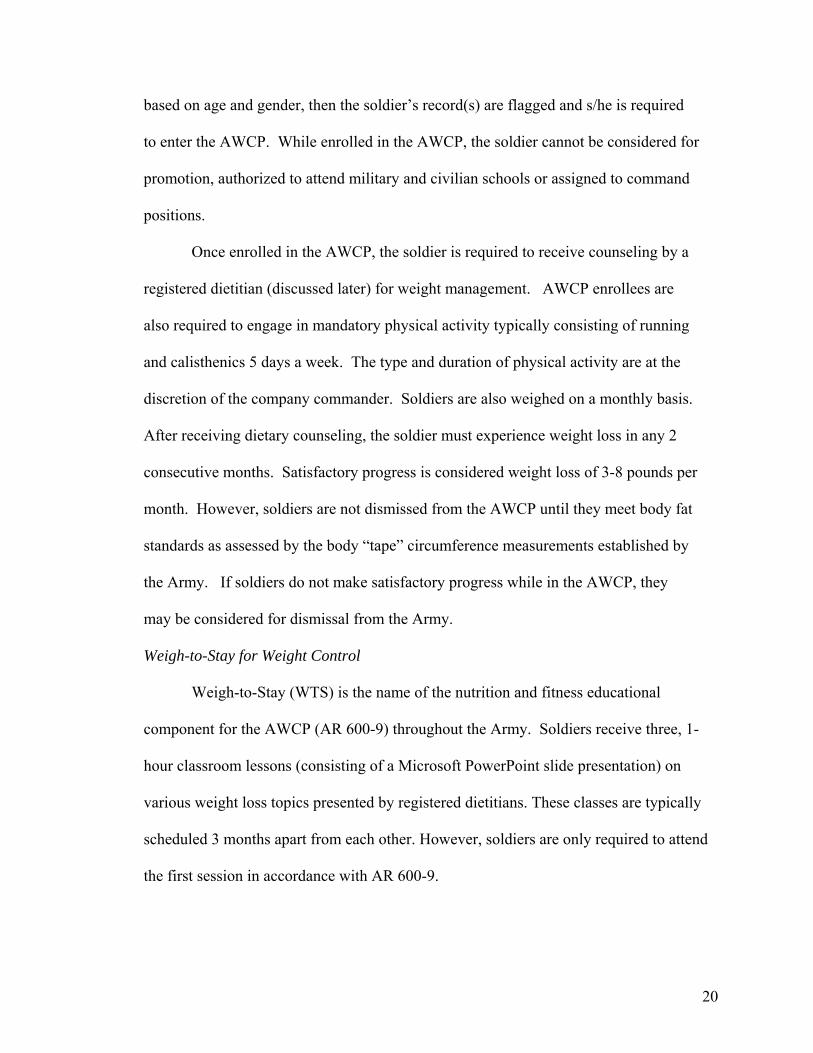
Once enrolled in the AWCP, the soldier is required to receive counseling by a
registered dietitian (discussed later) for weight management. AWCP enrollees are
also required to engage in mandatory physical activity typically consisting of running
and calisthenics 5 days a week. The type and duration of physical activity are at the
discretion of the company commander. Soldiers are also weighed on a monthly basis.
After receiving dietary counseling, the soldier must experience weight loss in any 2
consecutive months. Satisfactory progress is considered weight loss of 3-8 pounds per
month. However, soldiers are not dismissed from the AWCP until they meet body fat
standards as assessed by the body “tape” circumference measurements established by
the Army. If soldiers do not make satisfactory progress while in the AWCP, they
may be considered for dismissal from the Army.
Weigh-to-Stay for Weight Control
Weigh-to-Stay (WTS) is the name of the nutrition and fitness educational
component for the AWCP (AR 600-9) throughout the Army. Soldiers receive three, 1-
hour classroom lessons (consisting of a Microsoft PowerPoint slide presentation) on
various weight loss topics presented by registered dietitians. These classes are typically
scheduled 3 months apart from each other. However, soldiers are only required to attend
the first session in accordance with AR 600-9.

21
In the first session, soldiers receive information on topics such as causes of weight
gain, nutrition basics, fad diets hazards, nutrition myths, food labels, dining out, exercise,
and dietary supplement use. The second session covers topics such as meal planning,
weight loss strategies, behavior modification, hunger, and diet history. Finally, in the
third session, soldiers receive information regarding physical activity.
Previous military research
Although the TTM has not been utilized for the AWCP, weight control
interventions have been conducted among U.S. military personnel. In a study of 39 Air
Force men, SOC-matched health information was applied within an Internet program that
was designed to enhance fitness during a 6 month intervention (47). Although fitness
was not significantly improved in the treatment group, weight, body fat and BMI
improved as a result of the intervention.
A study conducted aboard a deployed U.S. Navy ship tested the impact of a
cognitive behavioral-based intervention that included exercise. A control group received
standard exercise information only. Although both groups of men experienced weight
and body fat losses, weight loss, body fat and triglycerides were significantly improved in
the cognitive-behavioral group when compared to the control group (48).
Studies conducted by James et al. and Davis focused on comprehensive weight-
loss programs in active duty service members (49, 50). Both programs resulted in weight
loss among the soldiers enrolled. However, both approaches included at least 12 months
of intervention (including some in-patient care) which is not feasible or realistic for the
AWCP because of cost and time constraints. The treatment approaches also were not

22
tailored according to each soldier’s SOC, assuming instead that each subject was “ready”
to change certain weight control behaviors.
As mentioned previously, WTS does not address psychosocial issues such as
individual weight control behaviors and readiness to change. It is similar to other weight
control programs in that it assumes that enrolled soldiers are ready to lose weight. In
addition, the impact of WTS has not been closely evaluated for its success and it lacks the
capability to properly track individuals enrolled in the program. In short, it uses an
approach that disseminates general nutrition information in a classroom setting to groups
of soldiers (up to 25 people). A major shortcoming of this approach is that it does not
address individual dietary and/or exercise issues. The trend of an increasing prevalence
of overweight military personnel and low attendance at follow-up appointments (Personal
Communication, Wellness Services) in WTS confirms the need to re-evaluate the
effectiveness of the current dietary component of the AWCP.

23
Chapter III: Development of a weight control stages of change instrument and interactive nutrition & fitness website for military weight management programs Overview
A “stages of change” (SOC) weight control instrument underwent a two-phase
test before being implemented in a weight loss study for active duty military service
members. In the first phase, the instrument was tested using cognitive interviews. The
second phase involved criterion validation of the instrument using 7 day food records
provided by a group of volunteer soldiers.
Once the SOC instrument was finalized, it was integrated into a weight
management website for use in a research study with overweight, active duty military
service members. This website, “Army Interactive Nutrition & Fitness On-line (A-
INFO)” was developed and tested in addition to the SOC instrument prior to the research
study.
Development of Stages of Change Instrument
A stages of change instrument was developed to assess multiple weight control
behaviors: 1) reducing “dietary fat”, 2) increasing “fruit & vegetable” intake, 3) reducing
portion sizes/ “portion control”, 4) limiting high kcal “beverages,” and 5) increasing
“exercise.” These behaviors are commonly used in weight control interventions and are
the main focus of the current Army Weight Control Program. In addition, previous
research has revealed that individuals tend to have a heterogeneous profile in regard to
stages of change profile for various weight control behaviors thus a single staging
algorithm would not be valid or appropriate in these instances (30). Where possible, the
survey questions and staging algorithms for addressing each of the five target weight

24
control behaviors and determining stages of change were adapted from previous studies
(30, 51-53).
Cognitive Interviewing for Stages of Change Instrument
It has been suggested that survey tools be tested and revised using cognitive
interviewing methods prior to being administered to a target population. Cognitive
interviewing is a relatively new technique that is intended to improve the quality of data
collected from questionnaires (54). This technique is commonly used to pre-test survey
instruments developed by the National Center for Health Statistics (NCHS) of the Centers
for Disease Control and Prevention (CDC), the Bureau of Labor Statistics and the Census
Bureau (54).
Cognitive interviews were conducted with active duty overweight and normal
weight volunteers (n=5) prior to study recruitment. Volunteers were interviewed while
they filled out the test instrument and after completing it to ascertain potential problems
encountered with terminology, ambiguous information, or question format. We used
both concurrent (participants verbalize thoughts as they answer questions) and
retrospective (participants describe how they arrived at their answers immediately after
they complete the instrument) “think aloud” interviews, as well as probes, to determine
how the participants arrived at their answers (Appendix A). The interviews were
conducted using previously published techniques (54).
Although only five active duty soldiers participated in the cognitive interviews,
this number was deemed adequate, as the comments and other information collected
provided invaluable insight for making needed corrections and improving the stages of
change instrument. Cognitive interview guidelines do not specify the number of
25
interviews that are needed for pre-testing, but recommend that no more than 12-15 be
conducted on one version of an instrument (55). Feedback may become redundant after
only about five interviews (Personal Communication with Dr. Paul Beatty, National
Center for Health Statistics, Fall 2004). Indeed, we found that comments made during
the fourth and fifth interviews were mostly repetitive of the earlier feedback and provided
little new information. More important than the number of subjects, our volunteers were
active duty soldiers of various ages, gender and ethnic backgrounds and reflected our
target population.
Key Findings from Cognitive Interviews
Only one set of cognitive interviews was conducted on the initial instrument due
to time and resource constraints. Comments and suggestions from the volunteers led to
changes in formatting, word order, rephrasing some questions, and deleting certain terms.
For example, instead of asking subjects a single question about such behaviors, as
“controlling portion sizes,” several questions were added to assess specific actions and
intentions. Drop down menus were also added to provide forced-choice answers for
some items.
The goal behavior for dietary fat (“low fat diet”) and fruits and vegetables (“5
fruits and vegetables”) was removed from the original list because subjects seemed more
inclined to provide the desired or expected response rather than their actual practice.
Instead, subjects were asked to estimate how many servings of fruits and vegetables they
ate per day and their intention about changing this behavior. They also were asked a
series of questions related to reducing fat in the diet rather than being asked if they were
eating a low fat diet.

26
The target frequency for a behavior was moved from the end of a sentence to the
beginning because subjects ignored this information when it came at the end. The word
“week” was defined as 7 days because subjects interpreted a “week” as being 5 days.
Confusion was experienced with the original terminology of “clean your plate,” “red
meat,” and “tracking what you eat” so questions were reworded to clarify the meaning of
these phrases. Text boxes were added to provide examples of fruit and vegetable serving
sizes and types of physical activities considered to be “moderate exercise.”
Furthermore, subjects who were required to exercise were asked about their
exercise habits prior to the exercise becoming mandatory. Individuals who are required
to exercise may automatically be placed into the “action” or “maintenance” stage even
though this might not necessarily reflect their true readiness to change. Therefore, such
individuals needed to be assessed twice to attempt to accurately assess their stage of
change for exercise.
Validation of Stages of Change Instrument
Although challenging, it is prudent to validate an instrument before using it to
ensure that the data collected reflect the original intent of the researchers. An
individual’s stage of change indicates readiness to change a behavior based on what one
is currently doing and intends to do in the future, although it may not necessarily reflect
their actual current behavior. Thus, the stages of change for diet (intention or current
behavior related to dietary fat, fruits and vegetables, and portion control) were compared
to current dietary intake as assessed by 7 day food records.
In short, criterion validity (concurrent) was determined by comparing the answers
from the weight control instrument (pre-action vs. action stages for dietary fat, fruit and

27
vegetable intake, portion control, and beverages) to the results of the 7 day diet records.
Seventeen active duty service members from Walter Reed Army Medical Center
volunteered to complete a seven day food record and the computerized stages of change
instrument. A food diary booklet was provided to each volunteer for their 7 day food
record. The returned dietary records were reviewed and the data were analyzed using the
Minnesota Nutrition Data System for Research (NDS-R). The 7 day average intake for
calories, macronutrients, and servings of the five food groups (as previously defined by
USDA Food Guide Pyramid, 1992) were derived from the food records.
However, only 8 subjects completed the food records and corresponding stages of
change surveys. Due to time and budget constraints related to the A-INFO website
development, the validation was completed using this small sample of volunteers.
To determine the association between instrument results and the 7 day diet record
results, each individual was classified into either “action” or “pre-action” based on the
average of 7 day dietary results and criteria in Table 3.1. They also were classified into
“action” or “pre-action” based on the results of the stages of change survey (Appendix
B). “Action” was defined as action or maintenance stages and “pre-action” was defined
as precontemplation, contemplation or preparation stages. The exercise section of the
stages of change questionnaire was not validated because it was not altered substantially
from another questionnaire that previously had been validated in adults (51, 53).
The results were analyzed as a series of 2x2 contingency tables for each weight
control behavior (dietary fat, fruit & vegetables, portion control and beverages) using
SAS System for Windows V8.2 (SAS Institute, Cary, NC). Because of small
frequencies in each cell, Fisher’s Exact Test was used instead of Chi-Square analysis to

28
test for significant associations (p<0.05) between the dietary analysis results and stages of
change instrument results.
Table 3.1 Weight Control Behavior Criteria for “Action” Weight Control Behavior
Action Criterion Rationale
Dietary Fat* ≤ 35 % of total kcal per day Maximum recommended level for % kcal from fat**
Fruit & Vegetables
5 combined servings per day Minimum number of combined servings recommended by USDA Food Pyramid***
Portion Control
Below all maximum recommended serving ranges according to Food Guide Pyramid [maximum grains= 11 servings, fruit =4 servings, vegetable= 5 servings, dairy =3 servings, meat =3 servings]
USDA Food Pyramid*** recommended ranges
Beverages ≤250 kcal from sweetened and/or alcoholic beverages per day
Within range for discretionary calories recommended by USDA for 2000 kcal diet; Liberal recommendation for beverage intake by some dietitian counselors
Exercise 30 minutes of moderate activity 5 times per week
Army Weight Control Program recommendation
*Original definition before validation= ≤30% of total kcal **Dietary Reference Intakes for Fat, Food and Nutrition Board/IOM 2005 ***USDA Food Guide Pyramid, 1992 (Revised 2005 MyPyramid was introduced after instrument development)
Key Findings from Validation
Responses derived from the stages of change instrument were significantly
associated with the dietary analysis stage results for portion control (p=0.02) and
beverages (p=0.03) but not for dietary fat (p=0.14) or fruit and vegetables (p=0.43). A
key finding that emerged from the validation study was that subjects sometimes
overestimated their consumption of fruits and vegetable intake and underestimated their
fat intake. Overestimation of fruits and vegetables by adults is consistent with previous

29
research (56). Therefore, we included a description of fruit and vegetable standard
serving sizes.
Percent kcal from fat was used to validate the dietary fat stage of change. A
cutoff point of <30% kcal from fat was the initial action criteria for the instrument, but
the current Dietary Reference Intakes (Institute of Medicine) and Dietary Guidelines for
Americans (USDA/DHHS) recommend limiting fat consumption to no more than 35% of
total daily kcal. When the cutoff was raised to 35% kcal from fat, more individuals were
classified into the action stage for dietary fat, resulting in an association approaching
significance (p=0.07) between that behavior and the stages of change instrument results.
Thus, the instrument questions were not changed, but with the understanding that the
current instrument would classify individuals as being in “action” when dietary fat
comprised up to 35% (rather than 30%) total kcal from fat. Other researchers studying
SOC and dietary fat intake also have classified individuals as being in the action stage for
fat with diets at or above 35% kcal from fat (32, 57-59).
It is common for people to believe they are following a low fat diet when in fact
they are not, so it appears that the SOC instrument may have miscategorized individuals
in the action/maintenance stages for eating a low fat diet. However, our instrument used
several behavioral questions related to fat intake, rather than a single question, which
minimized the possibility that subjects would be misclassified. This approach has been
used by other researchers (21, 30).
Several studies have discussed the complexities involved in staging individuals
based on self-reported dietary intake and/or validating stages of change with dietary
intake (9, 30, 51, 52). One approach to validate the SOC for dietary fat was to

30
investigate the relationship of dietary fat intake to stages of change. A few studies have
reported an inverse relationship between % kcal from fat and stage of change for dietary
fat (i.e. the higher the stage of change such as action or maintenance, then the lower the
% kcal from fat), although the difference in fat intake among the stages was small (57,
58). Thus, it can be challenging to stage individuals discretely into categories for dietary
fat using food record analyses.
The final SOC instrument contained 37 questions (Appendix B) and took
approximately 15 minutes to complete. The instrument was integrated into the Army
Interactive Nutrition & Fitness On-line (A-INFO) Web site (described later). It was also
available on compact disk for assessing SOC in soldiers who were not assigned a website
account.
Once the survey was completed, a final profile with stages of change for five
different weight control behaviors was generated. This profile had tailored weight control
messages contained in a “message library” that corresponded to each behavior. These
messages were developed by registered dietitians using the TTM’s processes of change
construct for specific weight control behaviors. Table 3.2 contains an example of how
these weight management interventions/messages were developed for exercise. A sample
“message library” can be found in Appendix C for weight control messages related to
dietary fat, fruits & vegetables, portion control and exercise. The messages were later
incorporated into tailored behavioral counseling sessions as part of a weight loss study
for active duty military personnel (described in Chapter IV).

31
Table 3.2 Sample Weight Control Intervention for Exercise Processes of Change Example of Weight Control Intervention for Exercise
Consciousness raising Learning the health/employment consequences of not exercising
Dramatic relief Identifying and addressing any negative emotions (anxiety, embarrassment, boredom) that accompany exercise
Environmental reevaluation
Realizing/identifying the positive impact that exercise may have on one’s social environment (family/friends) (e.g. increased energy, bonding with others)
Self-reevaluation Realizing/identifying how exercise is an important part of being a soldier
(e.g. assessing one’s image of being sedentary versus being active)
Self-liberation Making a commitment contract or promises, plans for a specific exercise
goal
Counterconditioning Substituting exercise/activity for snacking when bored
Helping relationships Seeking a friend/relative to partner with during exercise or who is
willing is able to provide support to them for being active Reinforcement management
Using non-food rewards (e.g. new clothes, music) when succeeding at exercise goal
Stimulus control Removing stimuli that encourage behaviors that may counteract exercise (e.g. unplugging television set) and replacing them with stimuli that encourage exercise (e.g. placing running shoes by door)
Development of Army Interactive Nutrition & Fitness On-line (A-INFO) Web site
An interactive nutrition and fitness website was created based on the ‘5A’s
(advise, assess, assist, anticipatory guidance, arrange follow up) for producing effective
health behavior changes using an interactive website (60). At least 4 of these 5 criteria
were addressed on the A-INFO website. The construction of A-INFO involved
collaboration with the United States Department of Agriculture’s (USDA) Center for
Nutrition Policy and Promotion, which provided the food composition database and

32
physical activity web codes. Specific components of the website are discussed in detail
below.
The HEALTH-e Forces (HeF) department at WRAMC developed the integrated
secure website and telephone support system account for active duty military personnel to
use during a weight loss study. HeF also provided support for the Internet with telephone
integration through the Internet/Intranet system at WRAMC. This website was used for
follow-up care and included monitoring, assessment, education, and dietary behavioral
therapy based on the stages and processes of change constructs of the TTM. Subjects
were provided with a random username and password to ensure the security of their
protected health information.
Specific features of the website included an on-line food record and physical
activity entry and analysis section (based on tools from the USDA’s Healthy Eating
Index) that generated personalized reports for goal setting and monitoring. Subjects also
had the opportunity to enter other data such as weight, waist circumference, and lab
values (blood glucose and lipids) for additional monitoring of goals by the soldier and/or
clinician. A goals section was available and was linked to a “tracking goals” section
which provided progress reports. A “calorie checkbook” section summarized the calorie
balance of all diet and exercise entries to provide feedback on positive and negative
energy balance. This section also allowed subjects to enter their goal weights and
calculate their estimated calorie needs per day. Appendix D contains a sample of the
website layout and components.

33
A message section of the website also allowed subjects to post messages for the
dietitian if they had questions, comments or concerns regarding their treatment. A “help”
screen was available for technical support.
A voice response (IVR) capability telephone system was integrated with each
subject’s website account and program data warehouse. When subjects called, they had
the opportunity to access any messages posted for them in their account.
Security and Confidentiality of the A-INFO Web site
The security of information traffic met the requirements of government and
private agencies in the U.S. High levels of security and confidentiality were assured for
users inputting, transmitting and retrieving sensitive data such as patient information. The
platform supported compliance with U.S. government data privacy standards both for
storage and transmission. The system was not visible on public networks.
The connection between user workstations and the HeF servers utilized a HTTPS
128-bit secure socket layer encryption. Users of the system received a secure and global
user ID and password. The HeF Patient Portal was used for authentication and access to
the application. The system provided the same security whether a user accessed the
system via the web or the telephone. Data were stored in an Oracle 9i database at the
National Naval Medical Center within its firewall. No data transferred to other systems.
Users only had access to data as authorized. Users were verified at all levels of the
system’s architecture. If a user was not active on the system for a predetermined period,
their login session expired and the user was required to log in again to regain access. The
security items previously mentioned passed a security accreditation process.

34
A-INFO Testing
Once the A-INFO website was complete, a “test” account of the website was
shared with numerous Army personnel (officers and enlisted), nutrition students and the
lay public for further testing. Once suggestions were compiled, adjustments such as the
website color scheme and certain components were made before A-INFO was
implemented as a follow-up treatment for a research study with overweight active duty
military service members.

35
Chapter IV: Comparison of the impact of four weight management interventions on body weight, risk factors associated with obesity and other parameters related to overweight and obesity in active duty military service members Abstract
The prevalence of overweight and obesity among American soldiers has been
increasing similar to the trend observed in the general population. The primary objective
of this study was to evaluate the interaction of two different weight management
interventions and two methods of follow up counseling on weight loss in overweight
active duty military service members after 3 months. Participants (n=172) were
randomized to one of four groups using a 2 x 2 factorial treatment structure: (1) Standard
nutrition ‘Class’ + ‘In-person’ follow up counseling every 3 months, (2) ‘Class’ +
weekly ‘Internet’ weight management follow up, (3) ‘Tailored’ counseling session based
on the Transtheoretical Model of Health Behavior + ‘In-person’ follow up every 3
months, or 4) ‘Tailored + Internet’. Measurements were taken at 0 (baseline), 3 and 6
months and included body weight, body composition (DEXA), waist circumference,
blood pressure, fasting blood glucose, lipid levels and dietary assessment. Analysis of
covariance (ANCOVA) with repeated measures was used to compare outcome
differences among groups at the different time points.
The results revealed that there were no significant differences in weight or other
outcomes among groups after 3 months. However, the ‘Tailored + Internet’ (-1.33 ± 0.66
kg, p<0.05) and ‘Class + In-person’ (-1.40 ± 0.63 kg, p<0.05) interventions lost modest,
but significant weight after 3 months compared to baseline. Specifically, the ‘Tailored +
Internet’ group lost significant total fat (-1.09 ± 0.50 kg, p<0.05), trunk fat (-0.76 ± 0.34
kg, p<0.05) and percent body fat (-0.71 ± 0.37 percent, p<0.05) and had reduced waist

36
circumference (-1.85 ± 0.94 cm, p<0.05) after 3 months while the ‘Class + In-person’
group significantly lost lean body mass (-0.73 ± 0.37 kg, p<0.05) but not fat compared to
baseline. These results suggest that the “Tailored + Internet’ group made healthier
changes, thus resulting in improvements in body composition. However, because no
treatment was superior, further research should explore what treatments are most
effective for weight loss in a military population. Several levels of intervention beyond
an individual level, such as those found in an ecological model of health behavior, may
be needed within a military weight management program because of the numerous
factors that can influence weight status.
Introduction
The U.S. Army is experiencing trends in overweight similar to the pattern among
the U.S. population. If soldiers exceed weight and body fat standards, they are required to
enroll in a mandatory weight control program. Soldiers enrolled in the Army Weight
Control face repercussions such as the inability to be promoted, attend schools, and
receive awards. Furthermore, they may eventually be discharged from military service.
The standard Army Weight Control Program is a general nutrition and fitness class that
does not take into account an individual’s readiness to change behaviors to lose weight.
In response to recent problems with overweight and obesity in the military, the Institute
of Medicine/National Academies of Science issued a call for the evaluation of military
weight management programs (3). This report included a recommendation to closely
evaluate the various components of the weight management programs and to explore the
capabilities of Internet use as a resource for weight management for military service
members.

37
Previous research has utilized the Transtheoretical Model of Health Behavior in
various diet related interventions (24-29, 32). Matching or tailoring interventions to an
individual has been shown to provide significant positive behavior changes (31, 32, 35-
38). The use of the Internet for weight loss has also shown promise in previous studies
especially when the intervention is behaviorally based (34, 39, 41, 42). Thus, the primary
objective of this study was to evaluate four different weight loss treatments in overweight
active duty military service members over 3 months. Participants (n=172) were
randomized to one of four groups: (1) Standard nutrition ‘Class’ + ‘In-person’ follow up
counseling every 3 months, (2) ‘Class’ + weekly ‘Internet’ weight management follow
up, (3) ‘Tailored’ counseling session based on the Transtheoretical Model of Health
Behavior + ‘In-person’ follow up every 3 months, or 4) ‘Tailored + Internet’ group.
The secondary outcomes included changes in body fat as well as improvements in other
weight related parameters (waist circumference, blood pressure, blood lipids, blood
glucose, and diet) in overweight active duty soldiers over a 3 month time period.
Materials and Methods
This project was approved by the Institutional Review Boards for Human
Subjects at Walter Reed Army Medical Center, Washington, D.C. and the University
of Maryland, College Park, MD (Appendix E).
Subjects
All male and female active duty military service members (ages 18+) newly
enrolled in the Army Weight Control Program and/or with a body mass index of ≥ 28
kg/m2 were eligible. Prospective participants were identified as they were referred to
Wellness Services for dietary counseling by company commanders (as part of the

38
AWCP) or in response to posted and e-mailed advertisements in facilities. Recruitment
was extended to other military units and services within the North Atlantic Regional
Medical Command and/or in the Capital Area Region.
Sample size estimation:
The minimal total sample size needed to show a significant difference in weight
loss (5 lb mean difference and 10 lb standard deviation) between groups was calculated to
be 128 (using a two-sided test with significance level equal to 0.05 and 80% power).
Assuming an attrition rate of 10%, a total of 140 subjects were initially recruited. As a
result of higher than expected attrition rates within the first year of the study, 32
additional subjects were recruited for a total of 172 subjects. At the end of study
enrollment, there were equal numbers of subjects in each of the four treatment groups
(n=43 per group) (Figure 4.1).
Figure 4.1 Study Design
N=128
n=64Standard AWCP
n=64Tailored AWCP
n=32Standard follow -up
n=32Internet/telephone
follow-up
n=32In-person follow -up
n=32Internet/telephone
follow-up
N=172
n=86Standard WTS
n=86TBI
n=43In-person follow-up “Group A”
-n=43
Internet follow-up “Group B”
n=43In-person follow
“Group C”-up
n=43Internet follow-up “Group D”
WTS=“Weigh to Stay” class TBI=Tailored Behavioral Intervention
39
Inclusion and exclusion criteria:
All potential participants were screened prior to consent for eligibility in the study
(Appendix F).
Inclusion criteria Criteria for inclusion in the study included: 1) Enrollment in
the AWCP and referral for initial dietary counseling and/or other active duty military
service members with a BMI > 28 kg/m2, 2) Assigned to a unit within North Atlantic
Regional Medical Command and/or in the Capital Area Region for at least 6 months
after enrollment into the study and 3) Able to visit WRAMC for outcome
measurements at baseline, 3 months, and 6 months.
Exclusion criteria Criteria for exclusion from the study included those military
service members with: 1) medical conditions or who were taking certain medications that
predispose them to be overweight and/or obese who were screened out, 2) medical
treatment and not permitted to enter the AWCP in accordance with Army Regulation
600-9, 3) known pregnancy or planning pregnancy 4) known medications that may alter
energy balance and, 5) no previous use of or current access to the Internet. A list of
exclusion medical conditions and medications can be located in Appendix G.
Consent process:
The principal investigator, project coordinator, and/or representatives obtained
written, informed consent from all subjects after screening for those who decided to
participate using the guidelines of the Department of Clinical Investigation at
WRAMC (Appendix H). The study was explained and time was allowed for soldiers
to read the consent form and ask questions. Subjects were also required to provide
authorization to collect their “Protected Health Information” according to the

40
guidelines of the Health Insurance Portability and Accountability Act (HIPAA)
(Appendix I). Soldiers/service members who were not willing to provide informed
consent, HIPAA authorization and/or participate did not have data collected for
research purposes and were referred for dietary counseling at Wellness Services in
WRAMC if interested in counseling on their own. Subjects did not receive any
compensation for participating in the study.
Once subjects provided written consent, they were randomly assigned to a
study group. Each subject was assigned a unique identifier (based on study group and
order of enrollment) for data collection and to protect their identity. The data
collection forms were secured in a locked file cabinet in room 7Z82 (Nutrition
Research Laboratory) at WRAMC between clinic visits. A master list of study codes
was also kept secured in the Nutrition Research Laboratory. The research source
documents and data file will be kept for at least 3 years after the completion of the
study.
Study Design and Treatment
The study was a longitudinal, randomized, clinical weight loss trial. The
experimental design consisted of one of two methods of follow-up counseling within one
of two types of dietary interventions (Figure 4.1). Thus, the treatment structure was a
2x2 factorial with diet and follow up method serving as the two main factors.
Participants in the Weigh to Stay (WTS) group received weight management
counseling by the standard classroom instruction by a weight management counselor
while the Tailored Behavioral Intervention (TBI) group received individual stages of
change-matched weight management counseling. Each group was further divided into

41
two weight management follow-up interventions: either face-to-face counseling every 3
months or weekly weight management counseling via their “Web/Telephone Weight
Control and Maintenance” account. Those assigned “Web/Telephone Weight Control
and Maintenance” accounts only received additional weight management counseling via
accounts through WRAMC Internet/Intranet services. A weight management counselor
(registered dietitian) reviewed the Web accounts once per week and provided feedback
within the account system.
The following outlines the interventions for the respective groups as shown in
Figure 4.1:
Group A: WTS (Class) + In-person Follow-up: Initial weight management counseling
consisted of a 1.5 hour class that is part of the Weigh to Stay program as previously
described. Follow-up consisted of a 1 hour general in-person session at 3 months.
Group B: WTS (Class) + Internet Follow-up: Initial weight management counseling
consisted of a 1.5 hour class that is part of the Weigh to Stay program as previously
described. Follow-up was provided via a “Web/Telephone Weight Control and
Maintenance” accounts (Web/telephone follow-up) as described previously and was
conducted weekly for a total of up to 24 sessions over 6 months.
Group C: TBI (Tailored) + In-person Follow-up: Initial weight management
counseling consisted of a 1-hour individual Tailored-behavioral intervention (TBI)
session based on the stages and processes of change for five different weight control
behaviors which were assessed prior to the session. Follow-up consisted of a 1 hour in-
person tailored session based on the stages and processes of change assessed prior to the
session at 3 months.

42
Group D: TBI (Tailored) + Internet Follow-up: Initial weight management counseling
consisted of a 1-hour individual Tailored-behavioral intervention (TBI) session based on
the stages and processes of Change for five different weight control behaviors. Follow-
up was provided via a “Web/Telephone Weight Control and Maintenance” accounts
(Web/telephone follow-up) as described previously and was conducted weekly for a total
of up to 24 sessions over 6 months.
Subjects in the groups with Internet follow-up received a personal A-INFO
account (described previously) with a secure and unique login name and password.
Personal instruction was provided to each subject by the study coordinator on how to use
their account. Account access was available via any Internet connection 24 hours a day/7
days a week. A message was e-mailed every two weeks to remind subjects to use their
account.
One primary registered dietitian (same dietitian who provided the classes and
counseling) reviewed the accounts weekly and posted feedback within each account
regarding dietary intake, physical activity, and/or behavior modification according to
their current profile. Each subject in the Internet follow-up group also had the option of
utilizing their account via a second system component, a voice response (IVR) capability
telephone system which was integrated with their A-INFO account. When subjects
called and entered a pin number, they had the opportunity to access any messages posted
for them in their account.
Website use was tracked using the total number of sessions that each subject
entered information into the food/beverage intake, physical activity and/or messages
section during the course of the study. Each day that a subject entered something into the

43
food/beverage section, activity section or posted a message for the nutritionist was
counted as one “user session” each. These sections of the website were selected for
tracking because they reflected actual interactive use by the subject. Thus, the maximum
number of sessions per day was three because A-INFO use could only be tracked once
per section per day and not by frequency within sections if more than once per day.
Furthermore, A-INFO use in minutes or hours was not available from website
programmers. Our method of tracking also seemed more appropriate than counting
“hits” of the website because hits do not reflect actual use.
Subjects were asked to complete a brief questionnaire about their use of the A-
INFO account and barriers to use at their 3 month follow up appointment. Common
barriers to use were identified by those who were seldom or never using their account.
This questionnaire can be located in Appendix J.
Data collection:
A timetable of study procedures and measurements are outlined in Table 4.1.
Table 4.1 Timetable of research project procedures and outcome measures Month
Measurements and/or Procedures
- 1 0 3 6
Screening X Describe and Obtain Informed Consent X Randomization X General Questionnaire (demographic & medical history) X X X
Height X Weight X X X Waist Circumference X X X DEXA (body composition) X X X Blood Pressure X X X 3 day food record X X X Physical Activity Assessment (via Accelerometer) X X X Stages of Change Assessment (only used in counseling for TBI group) X X X
Fasting Lipid Panel X X X Fasting Blood Glucose X X X

44
General Information (Demographic & Medical History)
A general questionnaire was administered to collect information including age,
gender, ethnicity, education level, marital status, medical history, family medical history,
medication use, smoking status & tobacco use, Internet usage, and dietary supplement
use (Appendix K). Some of the information was used for further screening and/or used
for covariance adjustments and/or post hoc analyses. The instrument was adapted from
previous instruments used in obesity assessment and is intended to collect demographic
information and a brief medical history (61).
Anthropometric Assessment
Anthropometric measurements including weight, height, and waist circumference
were taken at 0, 3 and 6 months using standard techniques and equipment in the Walter
Reed Nutrition Research Laboratory (62). Subjects were instructed to wear lightweight
clothing such as their physical training t-shirt and shorts for all measurements. Height
was measured in cm to the nearest 0.1 cm using a wall mounted digital stadiometer.
Subjects removed shoes prior to measurement and standard techniques of measurement
were used to position their head in the Frankfort plane and align their body along the
wall. Weight was measured twice without shoes using an electronic digital floor scale
(Seca 770, Seca Corporation, Hanover, MD) in lbs and the average of the two
measurements were recorded to the nearest 0.1 lb. Waist circumference was measured in
cm to the nearest 0.1 cm in a horizontal plane at the top of the right iliac crest using a
measuring tape (Myotape, QuickMedical brand).
45
Body Composition Assessment
Body composition (lean body mass and body fat) of the whole body was
measured using a linear fan beam dual energy X-ray densitometer (DEXA) (Windows XP
version software, Hologic Inc., DISCOVERY-Wi, Bedford, MA) in the WRAMC
Nutrition Research Laboratory. Quality control was ensured by daily calibration with an
anthropometric spine phantom of known density and weekly with a full body
composition step phantom. Lean body mass, whole body fat, trunk fat and percent body
fat measurements were recorded for each subject.
Clinical and Biochemical Assessment
Blood pressure (systolic/diastolic in mmHg) was measured twice using a digital
automatic sphygmomanometer (Omron IntelliSense Blood Pressure Monitor, Model
HEM-907XL, Vernon Hills, IL) during each visit (baseline, 3 and 6 month follow-ups)
after sitting at rest for at least 5 minutes. The average of the two measurements were
recorded and used for analysis.
Approximately 15 cc of blood were drawn from each participant at 0, 3 months,
and 6 months (45 cc total over 6 months) in the laboratory at WRAMC. On-site
technicians in laboratory services at WRAMC performed the biochemical analyses within
24 hours. Total cholesterol and triglycerides were determined enzymatically with the use
of commercial kits. HDL-cholesterol and LDL-cholesterol were analyzed after
precipitation of LDL in infranatant fluid with heparin and magnesium chloride. Blood
glucose was analyzed using an automated sequential multiple auto analyzer.

46
Dietary Assessment
Subjects completed a 3-day food record consisting of two weekdays and one
weekend day prior to each clinic visit (baseline, 3 and 6 months). Detailed instructions on
completing the food record were given to the participants prior to the baseline visit by a
Registered Dietitian. A food diary booklet was provided to each subject at each
appointment. The returned dietary records were reviewed and the data was analyzed
using the Minnesota Nutrition Data System for Research (NDS-R) (2005, Program
Number 051105). The 3 day average intake for calories, macronutrients, and servings of
the five food groups (as previously defined by USDA Food Guide Pyramid, 1992) were
derived from the food records. These dietary parameters were selected because they are a
focus of the current AWCP program and commonly indicated as primary targets in
weight loss interventions.
Physical Activity Assessment
Participants wore a water resistant, lightweight omnidirectional accelerometer
(Actical®, Mini Mitter Company, Inc, Bend, OR) on their hip during three separate
occasions in the study (baseline, 3 and 6 months) to assess changes in physical activity.
Accelerometers were activated using a serial port computer interface. A blue arrow on the
accelerometer indicated the direction of the most sensitive axis during wearing time.
Subjects were asked to wear the accelerometer all day (24 hours) for seven consecutive
days with the unit on their left side and blue arrow positioned upward at each visit
(baseline, 3 and 6 month follow-up).

47
Stages of Change Assessment
A stages of change weight control instrument (Appendix B) was developed and
tested in a small group of soldiers prior to the study to ensure unambiguous classification
of individuals into one of the five stage categories (precontemplation, contemplation,
preparation, action and maintenance) for 5 weight control behaviors (dietary fat, fruits &
vegetables, portion control, beverages, exercise) (see Chapter III).
Stage of change was assessed for multiple weight control behaviors (dietary fat,
fruit & vegetable intake, portion control, beverages, exercise) because they are the most
commonly targeted areas in interventions to help create a negative energy balance for
weight loss and are the main focuses of the current AWCP. In addition, previous
research has revealed that individuals tend to have a heterogeneous profile in regard to
stages of change for various weight control behaviors thus, a single staging algorithm is
not valid or appropriate in these instances (30).
A weight control behavioral profile was generated for each soldier once they
completed the instrument. This profile generated corresponding tailored weight control
messages from a “message library” for each behavior. A sample “message library” can
be found in Appendix C for weight control messages related to dietary fat, fruits &
vegetables, portion control and exercise. Only the participants in the TBI groups received
these tailored interventions.
Dietary counseling was conducted by one primary registered dietitian affiliated
with the study. Three other dietitians provided classes as an alternate if needed however;
this occurred less than 10% of the time when the WTS classes were taught. A standard

48
protocol for counseling sessions and classes was developed for the study to reduce the
possibility of inter-rater error.
Data analysis
Statistical calculations were performed using the SAS System for Windows V9.1
(SAS Institute, Cary, NC, 2003). All tests were considered significant at p < 0.05.
The assumptions for the Analysis of Variance (ANOVA) were verified prior to
data analysis by examining normality of plotted residuals and the homogeneity of
residual variances. One outlier was identified during the analysis of changes in lean body
mass and two outliers were identified during the analysis of changes in triglycerides.
These outliers were kept in the data set because they did not significantly affect the main
outcome(s) of the analysis when they were removed and the data reanalyzed.
PROC MEANS and PROC FREQ were used to summarize descriptive statistics
for each group and overall for all subjects at baseline. ANOVA and Chi-Square testing
were conducted as appropriate to determine if differences existed for the characteristics
among groups at baseline.
Data were analyzed using mixed model techniques which included sources of
random variation within and among subjects and fixed effects of diet, follow-up and visit.
Analysis of Covariance (ANCOVA) with repeated-measures was used to characterize
changes in anthropometric, biochemical and clinical measurements (i.e. weight loss,
waist circumference, body fat, lean body mass, dietary parameters, blood pressure, blood
lipids, blood glucose) for the groups at different time periods. Compound symmetry,
heterogeneous compound symmetry, first order autoregressive, heterogeneous first order
autoregressive and unstructured repeated measures covariance structures were examined

49
with each model. Goodness of fit statistics were used to determine which structure best
fit the data. Compound symmetry was the best fitting structure for the 3 month analysis
of all dependent variables while first order autoregressive was the best fitting structure
for the 6 month analysis of changes in body weight and body mass index.
ANCOVA with repeated measures was run two different ways on the weight loss
and body mass index dependent variables. One analysis was run using only the
individuals who completed the measurements (“completers”) at 3 and 6 months and a
second analysis was run with all subjects regardless if they dropped out before their
follow-up appointment (“intent-to-treat”) at 3 months. The “intent-to-treat” analysis
included baseline values in place of the missing 3 month values for those subjects that did
not return for their 3 month appointment. The rationale for the two different analyses on
the primary outcome is that many weight loss research studies conduct “intent-to-treat”
analyses using baseline or last observation data in their model to reduce any bias that may
occur from not including subjects that drop out. Subjects who drop out tend to do so
because they have not lost weight. Thus, including only subjects who complete the study
may potentially overestimate the positive impact of an intervention.
The full mixed model contained all of the covariates (age, gender, ethnicity,
education level, marital status, mandatory enrollment in the AWCP status, smoking
status) and their interactions with the 2 factors (diet, follow-up) identified that could
potentially influence the primary outcome of weight loss. Interactions between
covariates were not included. The full model was reduced using previously described
procedures (63). Specifically, nonsignificant (p>0.05) covariate*factor interactions were
removed one by one starting with the highest order interactions. The covariates and/or
50
their interactions were left in the model if they significantly affected the outcome
(p<0.05).
The full mixed models for the secondary outcomes (body fat, lean body mass,
waist circumference, blood pressure, blood lipids, blood glucose, dietary intake)
contained only the covariates of age, gender, ethnicity to keep the model small, preserve
degrees of freedom, and because they were deemed the 3 covariates that may most affect
the results of the other outcomes.
ANCOVA was also conducted to explore the relationship of frequency of A-
INFO use on weight loss. Weight loss was modeled as a dependent variable and A-INFO
use (total # ‘sessions’) was modeled as an observational factor. A-INFO use was
classified into three categories based on frequency of use: 1) ‘never’ (0 sessions), 2)
‘low’ (1-9 sessions) or 3) ‘high’ (10+ sessions). These categories were selected because
approximately 1/3 of subjects in the groups receiving Internet follow-up were classified
into each category. Age, gender and ethnicity were also included as covariates.
All continuous covariates (age, education level, AWCP) were centered by
subtracting the mean of the observed value to make interpretation of the results simpler.
Categorical/class covariates (gender, ethnicity, marital status, smoking status) were
interpreted at equal proportions to match an ideal experiment of equal replication.
Ethnicity/race was collapsed into three main categories (white, black, other) to increase
cell counts for analysis.
Test of hypotheses for planned (a priori) comparisons were done using estimate
statements. Six pairwise comparisons (A vs. B, A vs. C, A vs. D, B vs. C, B vs. D, C vs.
D)* and two main effect comparisons (AB vs. CD, AC vs. BD)* were conducted to

51
address the study objectives. In results, “Diet” refers to the treatment type of either the
standard class or tailored counseling while “followup” refers to in-person or Internet
followup counseling. “Visit” refers to the appointment at baseline, 3 or 6 months.
Results were reported with adjustments for significant covariate and covariate
interactions with the treatment factors of diet and followup.
Results
Baseline characteristics
Of the 172 active duty military service members who enrolled in the study, 164
were from the U.S. Army, 4 were from U.S. Navy, 3 from U.S. Air Force and 1 from the
U.S. Public Health Service. Baseline demographics, measurements, biochemical
parameters and dietary intake are presented in Tables 4.2, 4.3, 4.4, and 4.5 respectively.
Baseline demographic characteristics did not vary significantly among groups
(Table 4.2). Overall, the mean (SD) age of the 172 subjects was 33.1 (8.6) years and the
majority were male (63%). In addition, almost half of the subjects classified themselves
as White, non-Hispanic (49%) and more than one third classified themselves as Black,
non-Hispanic (35%). This is consistent with the military population which has a higher
proportion of males and Black, non Hispanic minorities than the general U.S. population
(3).
*Treatment group codes: A=Class+In-person, B=Class + Internet, C=Tailored + In-person, D=Tailored+Internet

52
Table 4.2 Baseline Demographics Baseline Characteristic⊗ Class +
In-person (n=43)
Class + Internet (n=43)
Tailored + In-person
(n=43)
Tailored + Internet (n=43)
Overall (n=172)
Age, mean years (SD) 32.3 (7.2) 33.5 (10.2) 33.4 (8.3) 33.1 (8.8) 33.1 (8.6) Gender, n (%) Female Male
13 (30) 30 (70)
16 (37) 27 (63)
18 (42) 25 (58)
16 (37) 27 (63)
63 (37)
109 (63) Race/Ethnicity, n (%) White, non Hispanic Black, non Hispanic Hispanic Asian Other
23 (54) 16 (37)
1 (2) 1 (2) 2 (5)
21 (49) 15 (35)
3 (7) 2 (5) 2 (5)
19 (44) 16 (37)
3 (7) 1 (2) 4 (9)
22 (51) 14 (33) 5 (11)
0 (0) 2 (5)
85 (49) 61 (35) 12 (7)
4 (2) 10 (6)
Education, n (%) High school degree or equivalent Some college Associate’s degree Bachelor’s degree Advanced degree
6 (14) 14 (32) 6 (14) 8 (19) 9 (21)
7 (16) 12 (28) 5 (12) 7 (16)
12 (28)
4 (9) 21(49)
3 (7) 7 (16) 8 (19)
4 (9) 16 (37) 7 (16)
11 (26) 5 (12)
21 (12) 63 (37) 21 (12) 33 (19) 34 (20)
Marital Status, n (%) Married Unmarried
29 (67) 14 (33)
26 (60) 17 (40)
29 (67) 14 (33)
23 (53) 20 (47)
107 (62) 65 (38)
Current Smoker, n (%) Yes No
9 (21) 34 (79)
8 (19)
35 (81)
4 (9)
39 (91)
7 (16)
36 (84)
28 (16)
144 (84) Dip Tobacco, n (%) Yes No
4 (9)
39 (91)
2 (5)
37 (95)
1 (2)
40 (98)
3 (7)
38 (93)
10 (6)
154 (94) Currently in AWCP, n (%) Yes No
29 (67) 14 (33)
24 (56) 19 (44)
24 (56) 19 (44)
20 (47) 23 (53)
102 (59) 70 (41)
Dietary supplement use, n (%) Yes No
16 (37) 27 (63)
17 (40) 26 (60)
21 (49) 22 (51)
20 (43) 23 (57)
74 (43) 98 (57)
Dieting history, n (%) Yes No
35 (81) 8 (19)
34 (81) 8 (19)
34 (79) 9 (21)
31 (74) 11 (26)
134 (79) 36 (21)
Because of missing values, the total n is not the same for all variables. ⊗There were no significant differences (P>0.05) among groups on any of the demographic characteristics using ANOVA or Chi-Square analysis as appropriate. “Smoker”, “Dip Tobacco” and “Dietary supplement use” = daily use of cigarettes, chewing tobacco and/or dietary supplements respectively. “Dieting history” = attempting to lose at least 10 lbs several times in the past.
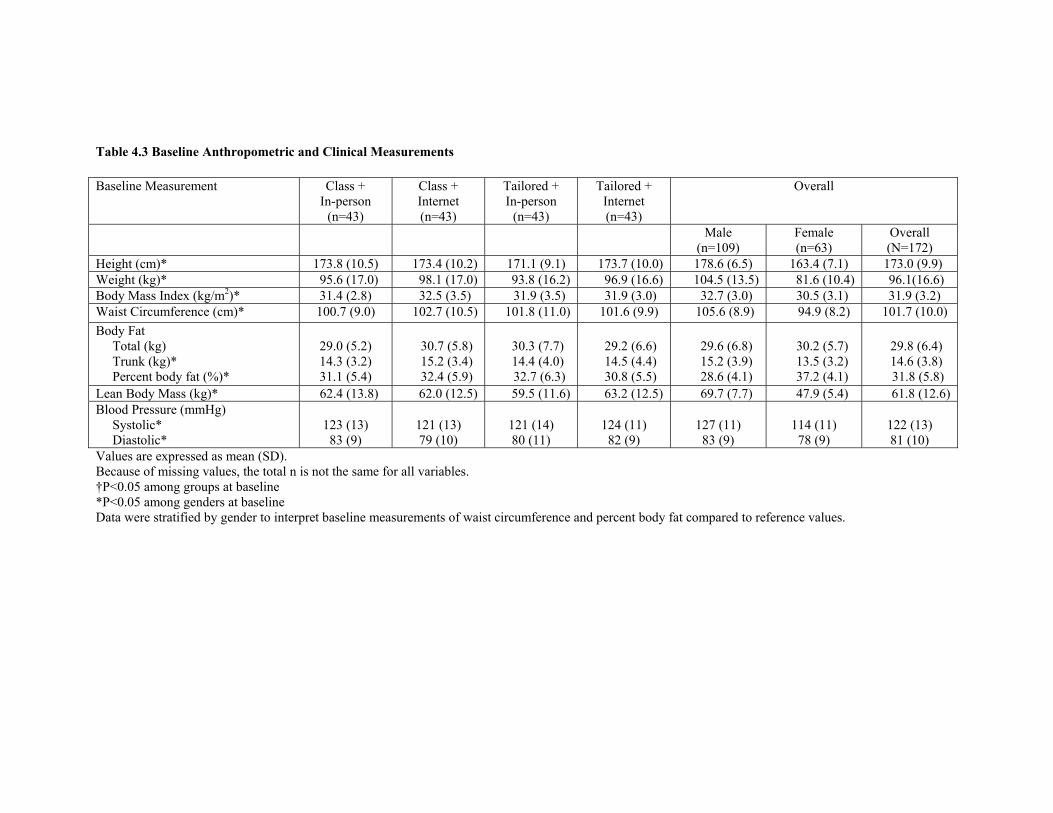
Table 4.3 Baseline Anthropometric and Clinical Measurements Baseline Measurement Class +
In-person (n=43)
Class + Internet (n=43)
Tailored + In-person
(n=43)
Tailored + Internet (n=43)
Overall
Male (n=109)
Female (n=63)
Overall (N=172)
Height (cm)* 173.8 (10.5) 173.4 (10.2) 171.1 (9.1) 173.7 (10.0) 178.6 (6.5) 163.4 (7.1) 173.0 (9.9) Weight (kg)* 95.6 (17.0) 98.1 (17.0) 93.8 (16.2) 96.9 (16.6) 104.5 (13.5) 81.6 (10.4) 96.1(16.6) Body Mass Index (kg/m2)* 31.4 (2.8) 32.5 (3.5) 31.9 (3.5) 31.9 (3.0) 32.7 (3.0) 30.5 (3.1) 31.9 (3.2) Waist Circumference (cm)* 100.7 (9.0) 102.7 (10.5) 101.8 (11.0) 101.6 (9.9) 105.6 (8.9) 94.9 (8.2) 101.7 (10.0) Body Fat Total (kg) Trunk (kg)* Percent body fat (%)*
29.0 (5.2) 14.3 (3.2) 31.1 (5.4)
30.7 (5.8) 15.2 (3.4) 32.4 (5.9)
30.3 (7.7) 14.4 (4.0) 32.7 (6.3)
29.2 (6.6) 14.5 (4.4) 30.8 (5.5)
29.6 (6.8) 15.2 (3.9) 28.6 (4.1)
30.2 (5.7) 13.5 (3.2) 37.2 (4.1)
29.8 (6.4) 14.6 (3.8) 31.8 (5.8)
Lean Body Mass (kg)* 62.4 (13.8) 62.0 (12.5) 59.5 (11.6) 63.2 (12.5) 69.7 (7.7) 47.9 (5.4) 61.8 (12.6) Blood Pressure (mmHg) Systolic* Diastolic*
123 (13) 83 (9)
121 (13) 79 (10)
121 (14) 80 (11)
124 (11) 82 (9)
127 (11) 83 (9)
114 (11) 78 (9)
122 (13) 81 (10)
Values are expressed as mean (SD). Because of missing values, the total n is not the same for all variables. †P<0.05 among groups at baseline *P<0.05 among genders at baseline Data were stratified by gender to interpret baseline measurements of waist circumference and percent body fat compared to reference values.

Table 4.4 Baseline Biochemical Parameters Baseline Biochemical Parameters Class +
In-person (n=37)
Class + Internet (n=35)
Tailored + In-person
(n=37)
Tailored + Internet (n=35)
Overall
Male (n=94)
Female (n=50)
Overall (N=144)
Cholesterol (mg/dL) Total Cholesterol† High Density Lipoprotein* Low Density Lipoprotein†* Triglycerides (mg/dL)*
196 (40) 48 (13) 129 (37) 135 (80)
195 (33) 52 (14) 122 (33) 129 (93)
172 (35) 50 (12) 106 (30) 95 (70)
187 (37) 53 (17) 118 (34) 102 (51)
192 (40) 45 (11) 124 (37) 134 (83)
180 (33) 61 (13) 109 (27) 78.6 (42)
188 (38) 51 (14) 119 (34) 115 (76)
Fasting Blood Glucose (mg/dL) 93 (9) 93 (9) 90 (10) 95 (10) 94 (10) 91 (9) 93 (10) Values are expressed as mean (SD). Because of missing values, the total n is not the same for all variables. †P<0.05 among groups at baseline *P<0.05 among genders at baseline Data were stratified by gender to interpret baseline high density lipoprotein cholesterol compared to reference values.

Table 4.5 Baseline Diet Baseline Dietary Assessment Class + In-person
Group (n=32)
Class + Internet Group (n=31)
Tailored + In-person Group (n=34)
Tailored + Internet Group (n=33)
Overall
(n=130) Total Calories (Kcal) 1800 (700) 1900 (830) 1940 (560) 2040 (840) 1930 (730) Macronutrients Carbohydrate Total grams % total kcal Fat Total grams % total kcal Protein Total grams % total kcal
197 (77) 44 (10)
75 (36) 36 (7)
77 (28) 17 (4)
233 (121) 48 (8)
69 (29) 33 (8)
82 (37) 18 (5)
223 (81) 45 (8)
81 (30) 37 (8)
81 (21) 17 (4)
237 (123) 46 (9)
83 (46) 36 (10)
80 (26) 16 (4)
223 (102) 46 (9)
77 (36) 36 (8)
80 (28) 17 (4)
Food Groups (# servings) Fruit Vegetables Grain Dairy Meat, meat substitutes
0.9 (0.9) 3.2 (2.0) 5.6 (2.3) 2.0 (1.6) 6.5 (3.4)
1.7 (2.5) 2.9 (1.4) 5.8 (2.9) 1.9 (1.7) 6.5 (2.8)
1.5 (1.4) 3.0 (1.9) 5.5 (2.3) 1.7 (1.0) 6.9 (3.0)
1.4 (1.7) 2.9 (1.6) 5.8 (3.0) 1.8 (1.6) 7.1 (2.9)
1.4 (1.7) 3.0 (1.7) 5.6 (2.6) 1.9 (1.5) 6.7 (3.0)
Values expressed as mean (SD) for subjects completing a 3 day food record at baseline. ⊗No significant difference found among groups for each dietary outcome at baseline.
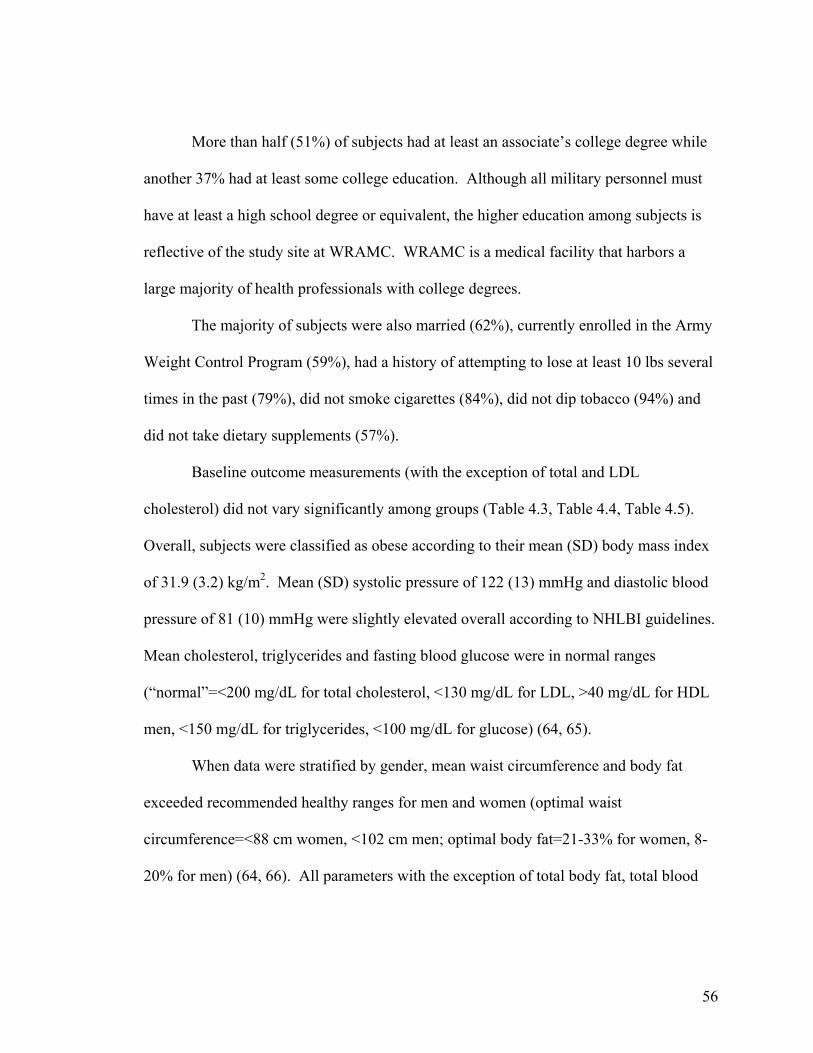
56
More than half (51%) of subjects had at least an associate’s college degree while
another 37% had at least some college education. Although all military personnel must
have at least a high school degree or equivalent, the higher education among subjects is
reflective of the study site at WRAMC. WRAMC is a medical facility that harbors a
large majority of health professionals with college degrees.
The majority of subjects were also married (62%), currently enrolled in the Army
Weight Control Program (59%), had a history of attempting to lose at least 10 lbs several
times in the past (79%), did not smoke cigarettes (84%), did not dip tobacco (94%) and
did not take dietary supplements (57%).
Baseline outcome measurements (with the exception of total and LDL
cholesterol) did not vary significantly among groups (Table 4.3, Table 4.4, Table 4.5).
Overall, subjects were classified as obese according to their mean (SD) body mass index
of 31.9 (3.2) kg/m2. Mean (SD) systolic pressure of 122 (13) mmHg and diastolic blood
pressure of 81 (10) mmHg were slightly elevated overall according to NHLBI guidelines.
Mean cholesterol, triglycerides and fasting blood glucose were in normal ranges
(“normal”=<200 mg/dL for total cholesterol, <130 mg/dL for LDL, >40 mg/dL for HDL
men, <150 mg/dL for triglycerides, <100 mg/dL for glucose) (64, 65).
When data were stratified by gender, mean waist circumference and body fat
exceeded recommended healthy ranges for men and women (optimal waist
circumference=<88 cm women, <102 cm men; optimal body fat=21-33% for women, 8-
20% for men) (64, 66). All parameters with the exception of total body fat, total blood

57
cholesterol and fasting blood glucose were significantly different when comparing men
and women at baseline.
Mean baseline dietary intake for total calories (kcal), macronutrients and food
group servings did not vary significantly among groups (Table 4.5). Mean (SD) overall
total kcal was 1924 (734.2) with approximately 46% from carbohydrates, 36% from fat
and 17% from protein. The Food and Nutrition Board of the Institute of Medicine set
Dietary Reference Intakes for macronutrients at: 45-65% kcal from carbohydrate, 20-
35% kcal from fat and 10-35% kcal from protein.
The mean (SD) overall food group servings were: fruit 1.4 (1.7), vegetables 3.0
(1.7), grains 5.6 (2.6), dairy 1.9 (1.5) and meat/meat substitutes 6.7 (3.0) servings (Table
4.4). At the time of the study development, the USDA food pyramid recommended 2-4
servings from fruit, 3-5 servings from vegetables, 6-11 servings from grain, 2-3 servings
from dairy and 2-3 servings from meat/meat substitutes.
Data used for analyses
The study is on-going, thus, 3 month follow-up data were primarily used for all
parameters on those subjects (n=123) who completed their 3 month visit. Preliminary
results at 6 months are presented for those subjects who completed a 3 and 6 month visit
(n=66) for the variables of body weight and body mass index at the time of data analysis.
Additional data analysis was performed for all subjects (n=172) regardless of 3 month
completion to mimic an “intent-to-treat” analysis for body weight and body mass index.
Physical activity data assessed via accelerometry was not presented or included in
the analysis due to questionable validity of the Actical© software default cutoff points for
moderate and vigorous activity in overweight and obese adults. It appears that the

58
accelerometers may be overestimating the amount of minutes spent in moderate and
vigorous intensity activities by overweight and obese adults. In addition, because wear
time of monitors varied by subject per day, estimates of % time engaged in the different
activity intensity categories cannot be made at this time. The physical activity data will
be examined at a later date when research is available on the validity of Actical©
accelerometers in overweight and obese adults.
Changes in weight and body mass index
Select baseline values were also compared among groups for subjects (n=123)
completing at least the 3 month appointment (Table 4.6). No significant differences were
detected among groups.
Overall, approximately 60% of the 123 subjects completing a 3 month
appointment lost weight. The remaining subjects either maintained or gained weight.
Weight change ranged from a loss of 9.59 kg (21.1 lbs) to a gain of 9.07 kg (19.9 lbs)
over the 3 months.
The interaction of diet*followup*visit approached statistical significance (p=0.06)
in the final ANCOVA model for weight for those completing the 3 month appointment
(n=123).
Results were adjusted for significant covariates and/or covariate*factor
interactions including: gender (p<0.001), ethnicity (p=0.004), education level*diet
(p=0.02), marital status (p=0.02), marital status*followup (p=0.03) and marital
status*diet*followup (p=0.0007). Tables 4.7, 4.8 and 4.9 provide further information
about the influence of the significant covariate interactions.

59
Table 4.6 Select Characteristics of Subjects Who Completed 3 Month Appointment Class +
In-person (n=32)
Class + Internet (n=29)
Tailored + In-person
(n=33)
Tailored + Internet (n=29)
Overall
(n=123) Age (yrs) 32.3 (6.8) 35.9 (11.0) 33.4 (7.9) 33.3 (9.2) 33.7 (8.8) Height (cm) 173.4 (11.1) 172.5 (10.1) 170.0 (8.7) 174.6 (9.9) 172.5 (10.0) Weight (kg) 95.3 (18.1) 97.2 (14.8) 91.0 (14.3) 98.6 (16.9) 95.4 (16.2) Body Mass Index (kg/m2)
31.2 (3.0) 32.6 (3.2) 31.4 (3.4) 32.1 (3.1) 31.2 (3.2)
Waist Circumference (cm)
39.6 (3.7) 40.0 (4.0) 39.7 (3.9) 40.2 (4.1) 39.9 (3.9)
Body Fat Total (kg) Percent body fat
29.0 (5.9) 31.2 (5.6)
31.4 (5.4) 33.2 (6.3)
30.1 (7.1) 33.5 (6.2)
29.0 (6.7) 30.0 (5.0)
29.9 (6.3) 32.0 (5.9)
Lean Body Mass (kg) 62.0 (14.1) 61.6 (13.1) 57.1 (10.4) 65.2 (12.5) 61.3 (12.8) Education Level (yrs) 14.6 (1.8) 14.9 (2.1) 14.4 (1.9) 14.7 (1.7) 14.6 (1.9) Gender, n (%) Female Male
10 (31) 22 (69)
13 (45) 16 (55)
16 (48) 17 (52)
9 (31)
20 (69)
48 (39) 75 (61)
Race/Ethnicity, n (%) White Black Other
17 (53) 11 (34) 4 (13)
13 (45) 14 (48)
2 (7)
16 (48) 10 (30 7 (21)
17 (59) 7 (24) 5 (17)
63 (51) 42 (34) 18 (15)
Married, n (%) 21 (66) 14 (48) 21 (64) 16 (55) 72 (59) Current Smoker, n (%) 7 (22) 2 (7) 2 (6) 5 (17) 16 (13) Enrolled in AWCP, n(%) 23 (72) 14 (48) 18 (55) 16 (55) 71 (58) ‡P<0.05 for difference among groups.
Table 4.7 reveals that education level had an impact on follow up. In-person
follow up was more effective regardless of education. Furthermore, Internet follow up
was more effective for those with less education.
Marital status also had an influence on the effect of follow up and diet*followup.
Subjects who were not married improved most when they had in-person follow-up.
Internet follow up was slightly more effective for subjects who were married (Table 4.8) .
Furthermore, Table 4.9 reveals that the ‘Class+ Internet’ treatment was most effective
for married subjects while the ‘Class + In-person’ treatment was most effective for
subjects who were not married.

60
Table 4.7 Impact of education level*follow up interaction on weight (n=123) 12 years of education 17 years of education
In-person follow up 88.3 ± 2.4 kg 90.1 ± 2.4 kg
Internet follow up 91.5 ± 2.6 kg 93.4 ± 2.5 kg
Values are expressed as mean body weight ± SE. Education levels were selected as comparison points based on the 10th and 90th percentile of the data Table 4.8 Impact of marital status*follow up interaction on weight (n=123) Married Not Married
In-person follow up 89.4 ± 2.2 kg 89.7 ± 2.4 kg
Internet follow up 88.0 ± 2.5 kg 97.2 ± 2.2 kg
Values are expressed as mean body weight ± SE. Table 4.9 Impact of marital status*diet*follow up interaction on weight (n=123)
Married Not Married Class Tailored Class Tailored In-person follow up
90.8±2.7 kg 87.9± 2.7 kg In-person follow up
85.6± 3.1 kg 93.8± 3.3 kg
Internet follow up
84.2± 3.3 kg 91.7± 3.0 kg
Internet follow up
101.9± 3.0 kg 92.6± 3.0 kg
Values are expressed as mean body weight ± SE.
The interaction of diet*followup*visit also approached statistical significance
(p=0.06) in the final ANCOVA model for weight in the “intent-to-treat” the analysis
(n=172). Results were adjusted for significant covariates and/or covariate*factor
interactions including: gender (p<0.0001), ethnicity (p<0.005), and marital
status*diet*followup (p=0.01). Table 4.10 provides further information about the
influence of the marital status*diet*followup interaction. The interaction reveals that the
‘Tailored + In-person’ treatment was most effective for married subjects while the ‘Class
+ In-person’ treatment was most effective for subjects who were not married.
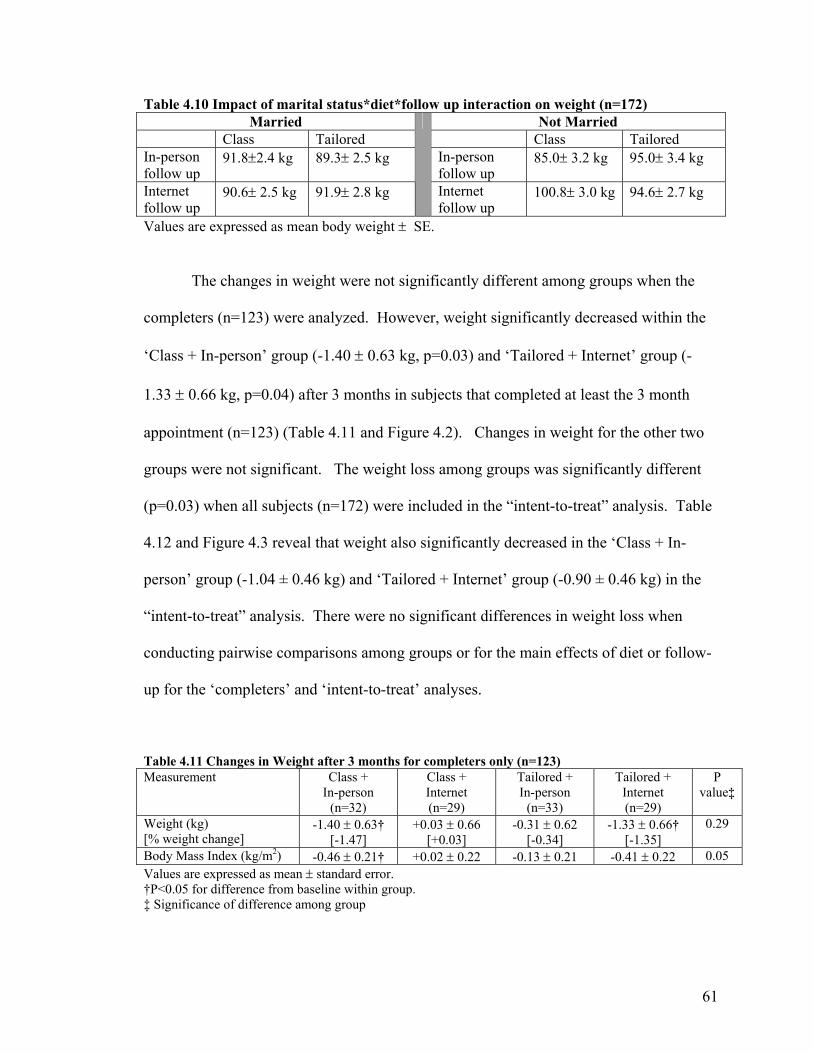
61
Table 4.10 Impact of marital status*diet*follow up interaction on weight (n=172) Married Not Married
Class Tailored Class Tailored In-person follow up
91.8±2.4 kg 89.3± 2.5 kg In-person follow up
85.0± 3.2 kg 95.0± 3.4 kg
Internet follow up
90.6± 2.5 kg 91.9± 2.8 kg
Internet follow up
100.8± 3.0 kg 94.6± 2.7 kg
Values are expressed as mean body weight ± SE.
The changes in weight were not significantly different among groups when the
completers (n=123) were analyzed. However, weight significantly decreased within the
‘Class + In-person’ group (-1.40 ± 0.63 kg, p=0.03) and ‘Tailored + Internet’ group (-
1.33 ± 0.66 kg, p=0.04) after 3 months in subjects that completed at least the 3 month
appointment (n=123) (Table 4.11 and Figure 4.2). Changes in weight for the other two
groups were not significant. The weight loss among groups was significantly different
(p=0.03) when all subjects (n=172) were included in the “intent-to-treat” analysis. Table
4.12 and Figure 4.3 reveal that weight also significantly decreased in the ‘Class + In-
person’ group (-1.04 ± 0.46 kg) and ‘Tailored + Internet’ group (-0.90 ± 0.46 kg) in the
“intent-to-treat” analysis. There were no significant differences in weight loss when
conducting pairwise comparisons among groups or for the main effects of diet or follow-
up for the ‘completers’ and ‘intent-to-treat’ analyses.
Table 4.11 Changes in Weight after 3 months for completers only (n=123) Measurement Class +
In-person (n=32)
Class + Internet (n=29)
Tailored + In-person
(n=33)
Tailored + Internet (n=29)
P value‡
Weight (kg) [% weight change]
-1.40 ± 0.63† [-1.47]
+0.03 ± 0.66 [+0.03]
-0.31 ± 0.62 [-0.34]
-1.33 ± 0.66† [-1.35]
0.29
Body Mass Index (kg/m2) -0.46 ± 0.21† +0.02 ± 0.22 -0.13 ± 0.21 -0.41 ± 0.22 0.05 Values are expressed as mean ± standard error. †P<0.05 for difference from baseline within group. ‡ Significance of difference among group

62
Table 4.12 Changes in Weight after 3 months, ‘Intent-to-Treat’ Analysis (n=172) Measurement Class +
In-person Group (n=43)
Class + Internet Group (n=43)
Tailored + In-person
Group (n=43)
Tailored + Internet Group (n=43)
P value‡
Weight (kg) -1.04 ± 0.46† +0.02 ± 0.46 -0.24 ± 0.46 -0.90 ± 0.46† 0.03 Body Mass Index (kg/m2) -0.34 ± 0.15† +0.01 ± 0.15 -0.09 ± 0.15 -0.30 ± 0.15 0.05 Values are expressed as mean ± standard error. †P<0.05 for difference from baseline within group. ‡ Significance of difference among groups
-2.5
-2
-1.5
-1
-0.5
0
0.5
1
Wei
ght c
hang
e (k
g)
Class + In-person (n=32) Class + Internet (n=29)Tailored + In-person (n=33) Tailored + Internet (n=29)
Figure 4.2 Weight change after 3 months for completers only (n=123)
Values are expressed as mean ± SE. No significant differences (p<0.05) detected among or between groups.

63
-2.5
-2
-1.5
-1
-0.5
0
0.5
1W
eigh
t cha
nge
(kg)
Class + In-person (n=43) Class + Internet (n=43)Tailored + In-person (n=43) Tailored + Internet (n=43)
The interaction of diet*followup*visit was not significant (p=0.08) in the BMI
ANCOVA model for those completing the 3 month appointment (n=123). The
interaction of diet*followup*visit was also not significant (p=0.08) in the BMI final
model in the “intent-to-treat” analysis (n=172).
Changes in body mass index (BMI) were borderline significantly different
(p=0.05) among groups in subjects completing a 3 month appointment (n=123). BMI
significantly decreased in the ‘Class + In-person’ group (-0.46 ± 0.21 kg/m2, p=0.03)
after 3 months (Table 4.11). BMI also decreased in the ‘Tailored + Internet’ group and
was approaching significance (p=0.06). Changes in BMI were also statistically
significant (p=.002) among groups for all subjects (n=172) in the “intent-to-treat”
analysis. BMI significantly decreased in the ‘Class + In-person’ group (-0.34 ± 0.15
Figure 4.3 Weight change after 3 months, “intent-to-treat” analysis (n=172)
Values are expressed as mean ± SE. P=0.03 among groups; no significance between groups

64
kg/m2, p=0.03) after 3 months (Table 4.12). BMI also decreased in the ‘Tailored +
Internet’ group and was approaching significance (p=0.07) (Table 4.12). There were no
significant differences in BMI when conducting pairwise comparisons among groups or
for the main effects of diet or follow-up for the ‘completers’ and ‘intent-to-treat’
analyses.
Changes in body composition
Reductions in percent body fat among groups was borderline significant (p=0.05)
after 3 months while reductions in total fat and trunk fat were not significant among
groups. Total fat (-1.09 ± 0.50 kg, p=0.03), trunk fat (-0.76 ± 0.34 kg, p=0.03) and
percent body fat (-0.71 ± 0.37 percent, p=0.05) were significantly decreased within the
‘Tailored + Internet’ group (Table 4.13) after 3 months.
There was a significant difference among the groups in relation to loss of lean
body mass after 3 months (p=0.03) (Table 4.13). However, the ‘Class + In-person’
treatment group had a significant loss of lean body mass within when compared to
baseline (-0.73 ± 0.37 kg, p<0.05). There were no significant differences in total body
fat, trunk fat or percent body fat when conducting pairwise comparisons between groups
or for the main effects of diet and follow-up.
Changes in risk factors associated with obesity
There was no significant difference among groups for changes in waist
circumference, however the ‘Tailored + In-person’ group (-2.46 ± 0.94 cm, p=0.01) and
the ‘Tailored + Internet’ group (-1.85 cm ± 0.94 cm, p<0.05) had significant decreases
within groups after 3 months (Table 4.13). There were no significant differences when
conducting pairwise comparisons or for main effects of diet and follow-up.

65
There were no significant changes in systolic blood pressure, diastolic blood
pressure, total cholesterol, low density lipoprotein cholesterol, high density lipoprotein
cholesterol, triglycerides or fasting blood glucose within or among groups after 3 months
(Table 4.13, Table 4.14). However, there was a significant difference (p=0.04) when
comparing the change in fasting blood glucose of the ‘Class + Internet’ group (-2.41 ±
1.68 mg/dL) to the ‘Tailored + In-person’ group (+2.61 ± 1.67 mg/dL). No other
significant pairwise comparisons or main effects of diet and follow-up were detected.
Table 4.13 Changes in Anthropometric and Clinical Measurements after 3 months Anthropometric and Clinical Measurements
Class + In-person (n=30)
Class + Internet (n=27)
Tailored + In-person (n=29)
Tailored + Internet (n=28)
P value‡
Waist Circumference (cm) -1.44 ± 0.89 -1.40 ± 0.96 -2.46 ± 0.94† -1.85 ± 0.94† 0.37 Body Fat Total (kg) Trunk (kg) Percent body fat (%)
-0.37 ± 0.49 -0.19 ± 0.34 -0.01 ± 0.36
-0.18 ± 0.50 -0.39 ± 0.34 -0.10 ± 0.37
-0.35 ± 0.49 -0.08 ± 0.34 -0.20 ± 0.36
-1.09 ± 0.50† -0.76 ± 0.34† -0.71 ± 0.37†
0.34 0.37 0.05
Lean Body Mass (kg) -0.73 ± 0.37† -0.05 ± 0.38 -0.07 ± 0.37 -0.24 ± 0.38 0.03 Blood Pressure (mmHg) Systolic Diastolic
-0.6 ± 1.9 -0.6 ± 1.5
+2.3 ± 2.0 +0.2 ± 1.6
-1.3 ± 1.8 +0.1 ± 1.5
-2.0 ± 1.9 -1.3 ± 1.5
0.70 0.41
Values are expressed as mean ± standard error. Because of missing values, the total n is not the same for all variables. †P<0.05 for difference from baseline within group. ‡ Significance of difference among groups Table 4.14 Changes in Biochemical Parameters after 3 months Biochemical Parameters Class +
In-person (n=22)
Class + Internet
(n=17)
Tailored + In-person (n=20)
Tailored + Internet (n=17)
P value‡
Cholesterol (mg/dL) Total HDL LDL Triglycerides (mg/dL)
-8.1 ± 5.4 +0.2 ± 1.5 -5.7 ± 5.1
-19.8 ± 13.3
-0.6 ± 6.1 -0.8 ± 1.7 +4.2 ± 5.7
-16.0 ±14.8
+9.1 ± 5.6 +1.1 ± 1.6 +9.3 ± 5.2 -4.2 ± 13.5
+1.1 ± 6.0 -0.0 ± 1.7 -1.5 ± 5.6
+10.5 ± 14.5
0.58 0.63 0.34 0.79
Fasting Blood Glucose (mg/dL)
-2.4 ± 1.7
-1.2 ± 1.9
+2.6 ± 1.7
-0.9 ± 1.8
0.63
Values are expressed as mean ± standard error. Because of missing values, the total n is not the same for all variables. †P<0.05 for difference from baseline within group. ‡ Significance of difference among groups

66
Changes in diet
There were no significant changes in diet among the four treatment groups after 3
months (Table 4.15). There was a significant reduction in percent kcal from fat in the
‘Tailored + In-person’ group from baseline (-8.8 ± 3.2 percent, p=0.01) (Table 4.15).
The ‘Class + In-person’ group had a significant increase in percent kcal from protein
compared to baseline (+3.6 ± 1.4 percent, p=0.01) (Table 4.15). There were no
significant pairwise comparisons or main effects of diet and follow-up. It should be
noted that the dietary results should be interpreted with caution because only 35% of the
food records (n=43/123) from subjects completing their 3 month appointment were
returned at follow up.
Table 4.15 Changes in Diet after 3 months Dietary Analysis Class +
In-person (n=13)
Class + Internet
(n=12)
Tailored + In-person
(n=8)
Tailored + Internet (n=10)
P value‡
Total Calories -160 ± 170 -100 ± 170 -30 ± 200 -170 ± 190 0.85 Macronutrients Carbohydrate Total grams % total kcal Fat Total grams % total kcal Protein Total grams % total kcal
-1.4 ± 22.9 +2.0 ± 2.7
-15.9 ± 8.6 -5.2 ± 2.7
+3.3 ± 6.9
+3.6 ± 1.4†
-2.1 ± 23.6 +3.3 ± 2.8
-5.2 ± 8.8 -2.4 ± 2.8
-3.6 ± 7.1 -0.2 ± 1.5
+26.4 ± 27.3 +5.7 ± 3.2
-16.2 ± 10.1 -8.8 ± 3.2†
+1.2 ± 8.3 +0.4 ± 1.7
-22.7 ± 25.8 -0.4 ± 3.1
-12.1 ± 9.6 -2.7 ± 3.0
-1.3 ± 7.8 +0.5 ± 1.6
0.49 0.23
0.99 0.66
0.86 0.38
Food Groups (#servings) Fruit Vegetables Grain Dairy Meat, meat substitutes
+0.6 ± 0.5 +0.3 ± 0.6 -0.6 ± 0.7 +0.2 ± 0.5 +1.2 ± 0.7
-0.6 ± 0.6 +0.5 ± 0.6 -0.0 ± 0.7 +0.3 ± 0.5 -0.6 ± 0.7
+0.2 ± 0.7 +0.6 ± 0.7 +0.3 ± 0.8 +0.8 ± 0.6 -1.4 ± 0.8
+0.2 ± 0.6 -0.3 ± 0.6 +0.6 ± 0.8 -0.2 ± 0.6 -0.6 ± 0.8
0.87 0.64 0.52 0.50 0.12
Values are expressed as mean ± standard error. Because of missing values, the total n is not the same for all variables. †P<0.05 for difference from baseline within group. ‡ Significance of difference among groups

67
Preliminary 6 months results for weight and body mass index
Approximately 56% of the 66 subjects completing a 6 month appointment lost
weight while the rest maintained or gained weight. Weight change ranged from a loss of
16.2 kg (35.7 lbs) to a gain of 6.79 kg (14.9 lbs) over the 6 months.
Select baseline values were compared among groups for those subjects (n=66)
completing a 6 month appointment. Significant differences were detected among groups
for body weight (p=0.02), percent body fat (p=0.02) and lean body mass (p=0.004)
(Table 4.16). Thus, body weight was adjusted using baseline weight as a covariate
during the analysis. The difference in baseline body weight among groups at 6 months is
most likely secondary to the high attrition rate at the time of analysis. Adjustments were
not made for percent body fat or lean body mass because they were not included in the
preliminary analysis.
Table 4.16 Select Characteristics of Subjects Who Completed 6 Month Appointment Class +
In-person (n=16)
Class + Internet (n=17)
Tailored + In-person
(n=18)
Tailored + Internet (n=15)
Overall
(n=66) Age (yrs) 32.5 (6.3) 36.3 (9.7) 34.1 (7.7) 36.2 (9.0) 34.8 (8.2) Height (cm) 172.3 (13.8) 175.0 (9.3) 168.2 (8.8) 177.1 (8.0) 172.9 (10.5) Weight (kg)‡ 92.2 (18.5) 99.3 (16.0) 88.1 (14.1) 103.8 (11.1) 95.6 (16.1) Body Mass Index (kg/m2)
30.7 (2.7) 32.4 (3.7) 30.9 (2.9) 33.1 (2.2) 31.7 (3.0)
Waist Circumference(cm) 39.1 (3.6) 40.3 (3.8) 38.8 (3.2) 40.7 (2.6) 39.7 (3.4) Body Fat Total (kg) Percent body fat‡
27.6 (5.8) 30.7 (5.1)
31.7 (5.9) 32.6 (5.4)
29.8 (7.3) 34.1 (6.1)
28.9 (5.0) 28.3 (4.8)
29.5 (6.2) 31.6 (5.7)
Lean Body Mass (kg)‡ 60.5 (14.1) 63.4 (12.8) 54.5 (9.8) 70.2 (9.6) 61.8 (12.8) Education Level (yrs) 14.7 (1.9) 15.3 (2.0) 14.7 (1.8) 15.0 (1.6) 14.9 (1.8) Gender, n (%) Female Male
5 (31)
11 (69)
7 (41)
10 (59)
10 (56) 8 (44)
3 (20)
12 (80)
25 (38) 41 (62)
Race/Ethnicity, n (%) White Black Other
10 (63) 4 (25) 2 (12)
8 (47) 8 (47)
1 (6)
9 (50) 4 (22) 5 (28)
9 (60) 4 (27) 2 (13)
36 (55) 20 (30) 10 (15)
Married, n (%) 11 (69) 9 (53) 13 (72) 10 (67) 43 (65) Current Smoker, n (%) 4 (25) 1 (6) 1 (6) 2 (13) 8 (12) Enrolled in AWCP, n(%) 12 (75) 10 (59) 10 (56) 6 (40) 38 (58) ‡P<0.05 for difference among groups.

68
The interaction of diet*followup*visit was not significant (p=0.63) in the final
ANCOVA model for weight loss after 6 months for subjects that completed their
appointment (n=66). Results were adjusted for significant covariates and/or
covariate*factor interactions including: baseline weight (p=0.0001), education
level*followup (p=0.04), and marital status*followup (p=0.02). Tables 4.17 and 4.18
provide further information about the influence of the significant covariate interactions.
According to Table 4.17, subjects that were married lost more weight when they
had Internet follow up. The opposite is true for those who were not married. They lost
weight when they received in-person follow up but gained weight when they had Internet
follow up. According to Table 4.18, subjects who had less education lost more weight
when they had Internet follow up. Subjects with more education lost weight when they
received in-person follow up but gained weight when they received Internet follow up.
These results suggest that Internet follow up is more effective for weight loss
when military service members are married and less educated. Furthermore, those
military service members that are more educated and single appear to lose more weight
when they have in-person weight management follow up.
Table 4.17 Impact of marital status*follow up interaction on weight (n=66) Married Not Married
In-person follow up 94.4 ± 0.96 kg 93.3± 1.25 kg
Internet follow up 92.0 ± 1.11 kg 96.1± 1.14 kg
Values are expressed as mean body weight ± SE. Reference weight is 95.6 kg.

69
Table 4.18 Impact of education level*follow up interaction on weight (n=66) 12 years of education 17 years of education
In-person follow up 94.9 ± 1.2 kg 93.1± 1.2 kg
Internet follow up 90.4 ± 1.5 kg 96.7 ± 1.2 kg
Values are expressed as mean body weight ± SE. Reference weight is 95.6 kg. Education levels were selected as comparison points based on the 10th and 90th percentile of the data
The trend in mean adjusted body weight over the 6 month time period for subjects
that completed their appointments (n=66) is presented in Figure 4.4. Preliminary data of
the subjects who completed the 6 month appointment (n=66) revealed that there was no
significant difference (p=0.78) in weight loss among the four treatment groups after 6
months (Table 4.19). However, the change in weight was significant within the
‘Tailored + Internet’ groups (-1.92 ± 0.93 kg, p=0.04) as presented in Figure 4.5 and
Table 4.19 for subjects completing all appointments (n=66). There were no significant
main effects or pairwise comparisons.
Body mass index was also adjusted (using baseline body mass index as a
covariate) because baseline weights were significantly different among groups at baseline
and body weight is a function of BMI. The interaction of diet*followup*visit was not
significant (p=0.62) in the final ANCOVA model for BMI for those completing the 6
month appointment (n=66).
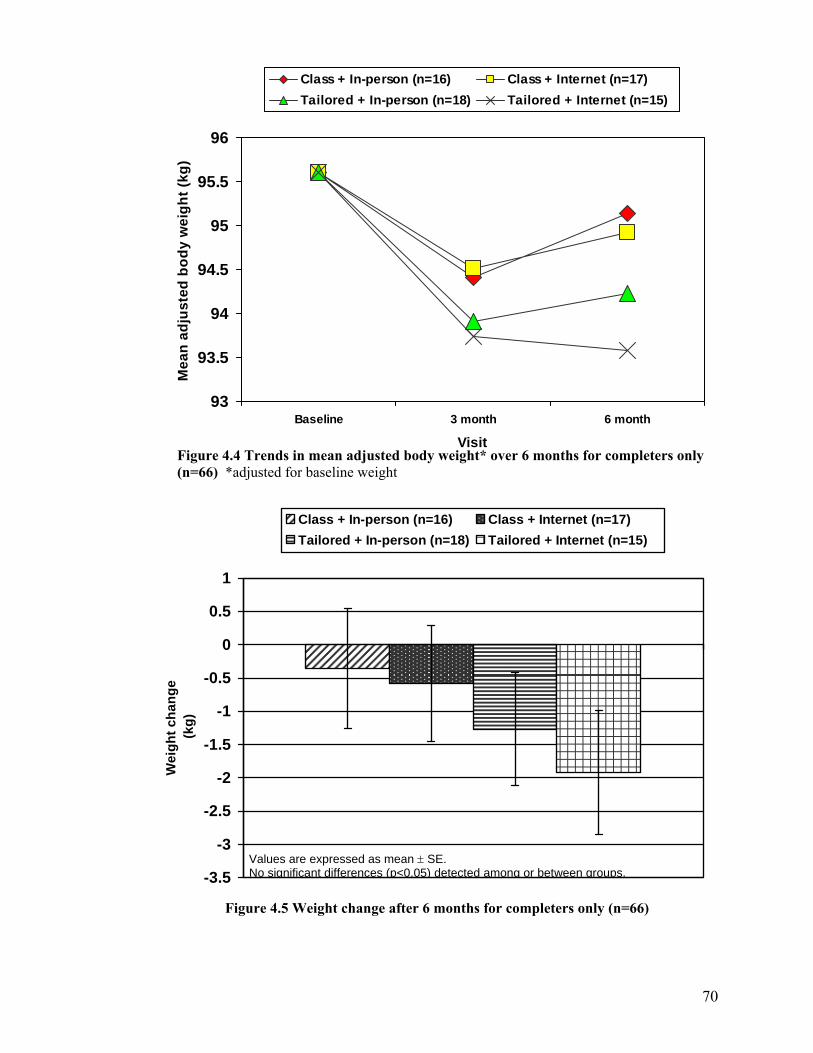
70
-3.5
-3
-2.5
-2
-1.5
-1
-0.5
0
0.5
1
Wei
ght c
hang
e (k
g)
Class + In-person (n=16) Class + Internet (n=17)Tailored + In-person (n=18) Tailored + Internet (n=15)
Figure 4.4 Trends in mean adjusted body weight* over 6 months for completers only (n=66) *adjusted for baseline weight
93
93.5
94
94.5
95
95.5
96
Baseline 3 month 6 month
Visit
Mea
n ad
just
ed b
ody
wei
ght (
kg)
Class + In-person (n=16) Class + Internet (n=17)Tailored + In-person (n=18) Tailored + Internet (n=15)
Figure 4.5 Weight change after 6 months for completers only (n=66)
Values are expressed as mean ± SE. No significant differences (p<0.05) detected among or between groups.
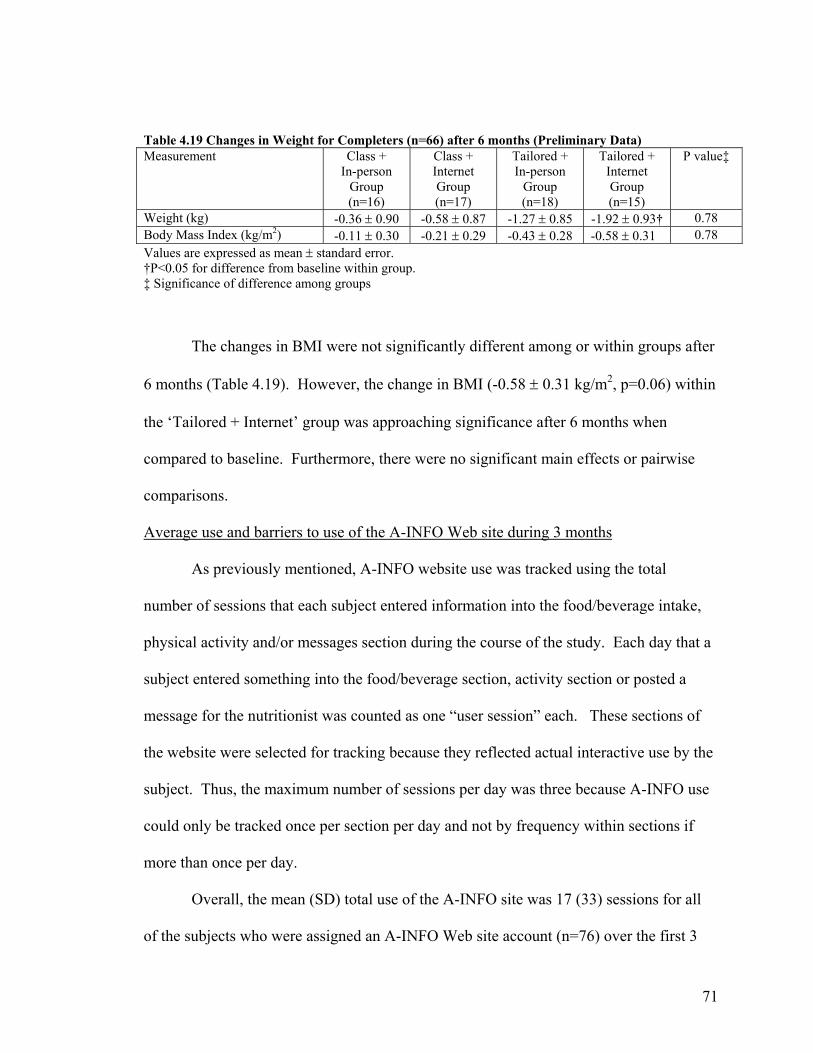
71
Table 4.19 Changes in Weight for Completers (n=66) after 6 months (Preliminary Data) Measurement Class +
In-person Group (n=16)
Class + Internet Group (n=17)
Tailored + In-person
Group (n=18)
Tailored + Internet Group (n=15)
P value‡
Weight (kg) -0.36 ± 0.90 -0.58 ± 0.87 -1.27 ± 0.85 -1.92 ± 0.93† 0.78 Body Mass Index (kg/m2) -0.11 ± 0.30 -0.21 ± 0.29 -0.43 ± 0.28 -0.58 ± 0.31 0.78 Values are expressed as mean ± standard error. †P<0.05 for difference from baseline within group. ‡ Significance of difference among groups
The changes in BMI were not significantly different among or within groups after
6 months (Table 4.19). However, the change in BMI (-0.58 ± 0.31 kg/m2, p=0.06) within
the ‘Tailored + Internet’ group was approaching significance after 6 months when
compared to baseline. Furthermore, there were no significant main effects or pairwise
comparisons.
Average use and barriers to use of the A-INFO Web site during 3 months
As previously mentioned, A-INFO website use was tracked using the total
number of sessions that each subject entered information into the food/beverage intake,
physical activity and/or messages section during the course of the study. Each day that a
subject entered something into the food/beverage section, activity section or posted a
message for the nutritionist was counted as one “user session” each. These sections of
the website were selected for tracking because they reflected actual interactive use by the
subject. Thus, the maximum number of sessions per day was three because A-INFO use
could only be tracked once per section per day and not by frequency within sections if
more than once per day.
Overall, the mean (SD) total use of the A-INFO site was 17 (33) sessions for all
of the subjects who were assigned an A-INFO Web site account (n=76) over the first 3

72
months of the study (Appendix L). The mean (SD) usage of the A-INFO site by group
was 17 (37) total sessions for the ‘Class + Internet’ group and 17 (30) total sessions for
the ‘Tailored + Internet’ group. The median usage of A-INFO was 1 in the Class +
Internet group and 5 in the Tailored + Internet group. More commonly, subjects did not
use their A-INFO account at all according to the mode result (0) for each group and
overall. Specifically, 35% of the subjects reported never using their A-INFO account. In
addition, participants did not ever use the phone component of the A-INFO accounts
most likely because the phone component only offered a computerized retrieval of
messages which could also be accessed via their A-INFO account.
Subjects were also surveyed on self-reported use of the A-INFO site. Of the 53
responses, 15 (28%) reported that they never used their account, 8 (15%) used it <1
time/month, 9 (17%) used it 1-3 times/month, 2 (4%) used it 1 time/week, 7 (13%) used
it several times/week and 12 (23%) used it 1 or more times/day (Appendix M). However,
of the 12 that used their account 1+ times/day, 11 of them reduced their usage to minimal
or stopped using the account after 3 or 4 weeks of initiation. The most common reasons
for not using the A-INFO account or using it less than once per week were 1) lack of time
(n=22), 2) forgot (n=12) or 3) ‘other reasons’ (n=19) such as difficulty finding exact
matches for food items and problems remembering login or password.
Further statistical analysis was conducted to determine if frequency of A-INFO
use (based on total number of sessions) was associated with weight change after 3
months. There was no significant correlation (r=0.16, p=0.23) between using the A-
INFO account and weight change after 3 months in both ‘Class + Internet’ and ‘Tailored
+ Internet’ groups using Spearman’s correlation.
73
Furthermore, A-INFO use was classified into 3 usage categories: 1) ‘never’ (0
times used over 3 months), 2) ‘low use’ (1-9 total times over 3 months) or 3) ‘high use’
(10 or more times over 3 months). These categories were selected because approximately
1/3 of subjects in the groups receiving Internet follow-up were classified into each
category. There was no significant influence (p=0.29) of A-INFO use on weight loss and
no significant difference (p=0.20) in weight change after 3 months among subjects in the
three A-INFO frequency of use categories.
Attrition
At the time of data analysis, 75 (44%) of the 172 subjects had dropped out of the
study before their 6 month appointment (Table 4.20). More than half (n=44, 59%) of the
75 subjects dropped out before their 3 month appointment. When examining 3 month
follow up data alone, 44 (26%) of the 172 subjects dropped out of the study before their 3
month appointment.
Approximately 37% (n=28/75) of the subjects dropped out secondary to military-
related reasons such as relocation, deployment, retirement or were discharged from
military during the study (Table 4.20). The discharges were unrelated to their weight
status as reported by the subjects. The second most common reason cited for dropout
(n=15, 20%) was ‘lack of time’.
Statistical tests of significance (t-test or chi-square as appropriate) were conducted
to determine if there were significant differences in select characteristics of subjects who
dropped out before their 3 month appointment and subjects who completed their 3 month
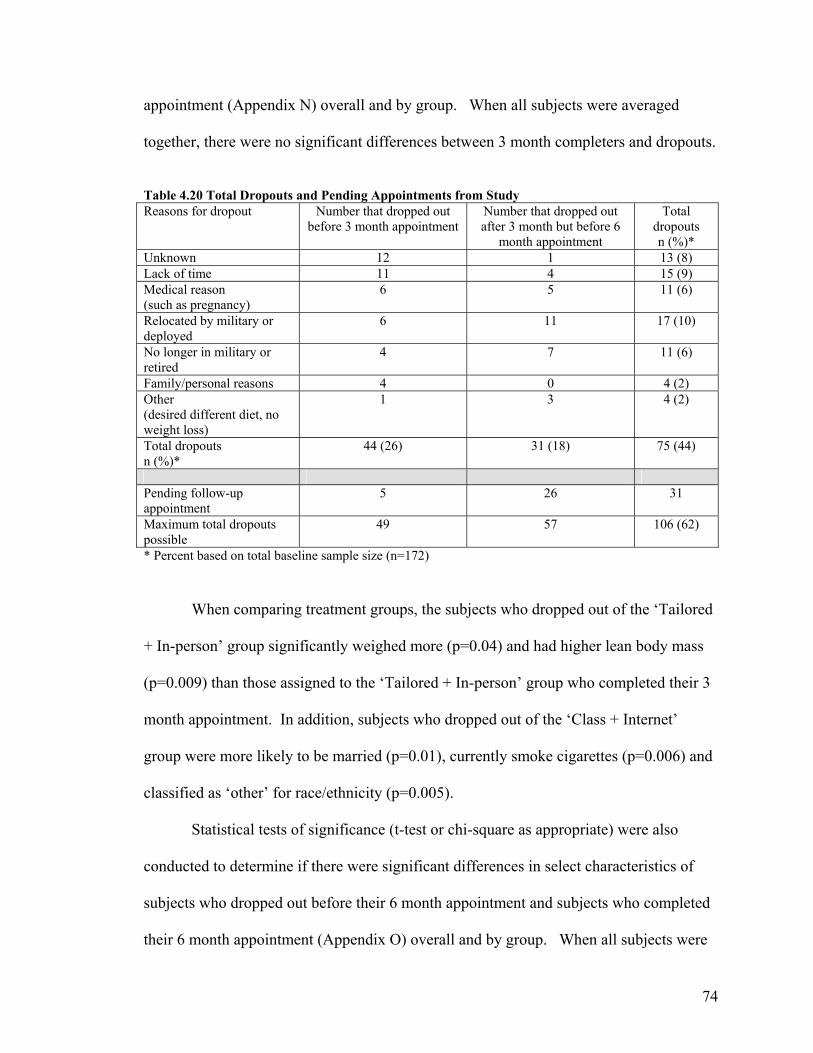
74
appointment (Appendix N) overall and by group. When all subjects were averaged
together, there were no significant differences between 3 month completers and dropouts.
Table 4.20 Total Dropouts and Pending Appointments from Study Reasons for dropout Number that dropped out
before 3 month appointment Number that dropped out after 3 month but before 6
month appointment
Total dropouts n (%)*
Unknown 12 1 13 (8) Lack of time 11 4 15 (9) Medical reason (such as pregnancy)
6 5 11 (6)
Relocated by military or deployed
6 11 17 (10)
No longer in military or retired
4 7 11 (6)
Family/personal reasons 4 0 4 (2) Other (desired different diet, no weight loss)
1 3 4 (2)
Total dropouts n (%)*
44 (26) 31 (18) 75 (44)
Pending follow-up appointment
5 26 31
Maximum total dropouts possible
49 57 106 (62)
* Percent based on total baseline sample size (n=172)
When comparing treatment groups, the subjects who dropped out of the ‘Tailored
+ In-person’ group significantly weighed more (p=0.04) and had higher lean body mass
(p=0.009) than those assigned to the ‘Tailored + In-person’ group who completed their 3
month appointment. In addition, subjects who dropped out of the ‘Class + Internet’
group were more likely to be married (p=0.01), currently smoke cigarettes (p=0.006) and
classified as ‘other’ for race/ethnicity (p=0.005).
Statistical tests of significance (t-test or chi-square as appropriate) were also
conducted to determine if there were significant differences in select characteristics of
subjects who dropped out before their 6 month appointment and subjects who completed
their 6 month appointment (Appendix O) overall and by group. When all subjects were

75
averaged together, subjects that dropped out were significantly younger in age (p=0.04)
than those that completed their 6 month appointment. When comparing treatment
groups, the subjects who dropped out of the ‘Tailored + In-person’ group significantly
weighed more (p=0.05) and had higher lean body mass (p=0.01) than those assigned to
the ‘Tailored + In-person’ group who completed their 3 month appointment. The
opposite was true for subjects that dropped out of the ‘Tailored + Internet’ group who
significantly weighed less (p=0.04) and had less lean body mass (p=0.01 than those
assigned to the ‘Tailored + Internet’ group completing their 6 month appointment.
Discussion:
The purpose of this study was to compare the impact of 4 different treatment
interventions (2 x 2 factorial treatment consisting of 2 types of weight management
intervention and 2 types of follow up counseling) on weight loss and other related
outcomes in active duty military service members. The overall finding was that there
was no significant difference in weight loss or other outcomes among treatment groups at
3 and 6 months.
Furthermore, the mean weight loss at 3 months was less than the weight loss goal
for the Army Weight Control Program (required 3-8 lbs/month) and less than the
recommended 5-10% weight loss over 6 months by NIH/NHLBI in all four treatment
groups (Table 4.11). In addition, the % weight lost (<2%) over 3 and 6 months was not
clinically significant according to other studies and guidelines (67-69). Total reductions
in BMI were less than 1.0 kg/m2, hence, not enough to reclassify an individual into a
lower BMI category. Similar results were reported in a weight loss study comparing a
self help program to a commercial program for overweight and obese men and women

76
(70). The self help intervention was similar to some components of our intervention
because it included minimal counseling sessions (2) with a nutritionist and referral to
resources such as health promotion websites. After 1 year, subjects in the self help group
only lost an average of 1.3 kg and had a 0.5 kg/m2 reduction in BMI (70). Furthermore,
some subjects experienced weight gain of up to 15 kg over 1 year during the study.
Other studies utilizing Internet programs and/or or behaviorally based
interventions also only detected modest weight loss of less than 2 kg in adults after study
periods of 3 to 6 months (34, 71, 72). Furthermore, Logue et al. compared the effect of a
tailored intervention (based on multiple stages of change for weight control) to a standard
intervention for weight loss in adults. No significant differences in weight loss were
detected between groups (72).
Although no treatment was superior in our study, the ‘Tailored + Internet’ and
‘Class + In-person’ group did have significant weight loss after 3 months and there was a
significant difference in weight loss among groups according to the “Intent-to-treat”
analysis. Furthermore, the ‘Tailored + Internet’ group had significant reductions in total,
trunk, percent body fat and waist circumference (Table 4.13). Although the ‘Class + In-
person’ group had significant weight loss after 3 months, they also had a significant
reduction in LBM. These trends indicate that individuals in the ‘Tailored + Internet’
group were making healthier changes in their weight loss attempts than the ‘Class + In-
person’ group. Although we do not have data to support the specific reasons why the
two groups lost weight with varying changes in body composition, it is possible that the
‘Class + In-person’ group was not eating enough calories and/or not exercising which
would help preserve lean body mass (73).

77
The preliminary 6 month data for our study revealed that differences in weight
loss were also not significant among groups. However, the ‘Tailored + Internet’ group
was the only group to experience significant weight loss after 6 months compared to
baseline. This suggests that the combination of a tailored intervention with Internet
follow up provides the most promise of the four interventions. It should be noted that the
6 month results should be interpreted with caution because they are preliminary.
Our findings were somewhat disappointing but they reinforce the fact that not all
methods of weight loss work for all individuals or in all populations. Schwartz and
Brownell surveyed 33 leading weight management experts to identify characteristics that
indicated or contraindicated the use of various weight loss approaches for overweight
adults (74). The variety of responses and lack of agreement by the experts for many of
the factors reveal that there is much to consider when matching an individual to a weight
loss program and that further research needs to be done.
Our study was developed to intervene on an individual level of behavior change.
However, more recently, experts have highlighted the importance of ecological models of
health behavior interventions for obesity (75-79). Ecological models consider the
interaction between people and their environments. There are several levels of influence
within an ecological model of health behavior including the following factors: 1)
intrapersonal/individual, 2) interpersonal, 3) institutional, 4) community and 5) policy
(80). Booth et al. identified several environmental factors that are key influences on
nutrition and physical activity such as local government, schools, community, employers,
family, and the food and restaurant industry (75) . Clearly, the current environment is
complex and contains many factors that can influence behaviors related to obesity. For

78
example, soldiers may have the desire to eat healthier but if there are no healthy food
choices available to them at their military base, they may opt for higher calorie choices.
Furthermore, if they had little or no support from family, friends or colleagues, they may
not have been able to succeed in their weight loss attempts. In addition, the AWCP itself
is a policy enforced by the military.
It was expected that all of the military service members participating in the study
would have lost some weight given the fact that their job is dependent on meeting
specific weight criteria. As previously described, enrollment in the Army Weight Control
Program means an individual is required to lose at least 3-8 lbs per month for at least two
consecutive months until they meet military standards. However, 40% of the subjects
completing their appointment(s) did not lose weight after 3 months and 44% did not lose
weight after 6 months. Another military study of the U.S. Navy’s weight control
program reported that 17% of subjects maintained or gained body fat during the course of
their intervention regardless of their enrollment in a weight control program (81).
Unfortunately, the underlying approach of a mandatory weight loss program, such
as the Army Weight Control Program, is essentially an opposing force in the motivation
to lose weight. Williams et al. concluded that autonomous motivation for weight loss is
of utmost importance in the ability to lose and maintain weight (82). Autonomous
behavior is a behavior that is chosen by oneself as opposed to a controlled behavior by an
external force. Participation in the AWCP is clearly a controlled behavior being enforced
by an outside entity. The use of stages of change within the study is consistent with the
self-determination theory which suggests that it is important to one’s self or choice to
change a behavior. However, the stages of change were not used as a deciding factor on

79
whether or not an individual was enrolled into the study. Thus, they may have not been
ready to change and/or not exhibited autonomous behavior to lose weight.
Furthermore, the NIH recommends that individuals with a BMI <30 kg/m2, <2
risk factors (comorbidities) and not ready to lose weight should strive to maintain their
body weight rather than attempt weight loss (69). Unfortunately, this is not an option for
military personnel thus there may be a disproportionate amount of failure due to the
mandatory approach to weight loss.
Frequency of intervention and/or human contact for the in-person follow up
groups may have also been a factor in why there was not more success with weight loss
after 3 months. Interventions providing a “high intensity” treatment (>once/month) have
resulted in more weight loss than less frequent intensity trials (83). However, although
this may be desirable, it was not feasible for the intervention or for future
implementation. One of the primary purposes of the study was to test an intervention that
could be implemented without frequent in-person contact because of proximity and travel
issues to medical facilities with trained personnel. If an intervention was proposed and
tested at a weekly frequency, it is likely it would not be implemented as policy because of
impracticalities. In addition, scheduling subjects for their follow up appointments present
challenges due to frequent duty related commitments and last minute assignments.
Therefore, imposing a more frequent intervention may not be a viable solution.
As previously mentioned, a 5-10% weight loss has been shown to significantly
reduce associated risk factors (comorbidities) of obesity including high blood pressure,
and elevated levels of blood lipids and blood glucose (67-69, 84). Thus, it is not
surprising that these risk factors associated with obesity did not change significantly in

80
any of the groups secondary to the modest weight loss (<2%) over 3 months and the fact
that the baseline levels were at or near normal at the onset of the study.
Approximately 76% of the 3 day food records were returned at baseline, however
only about 1/3 (35%) of the 3 day food records were returned by subjects completing
their 3 month appointment. This is most likely due to the lack of incentive for returning
the food records. The subjects did not receive personalized feedback on their food
records and were not provided with compensation for returning them. The records were
being used merely as an outcome measure. Thus, compliance to return food records was
low. This may provide some additional explanation on why some subjects did not lose
weight during the study. Self monitoring, such as recording food and beverage intake, is
a behavior that has been correlated to weight loss. Studies by Baker and Kirschenbaum
and Boutelle and Kirschenbaum provide convincing evidence of the relationship of
frequency of self monitoring and weight loss in adults (85, 86). Unfortunately, we were
unable to provide incentives to the military population for participating in any component
of the study. However, in retrospect, it may have been prudent to incorporate the results
of the food records into their treatment to help motivate them to complete the records or
to use a different method of dietary assessment such as a 24 hour recall. Although all
dietary assessment methods have limitations, a 24 hour recall may have been a better
choice because it can be conducted during a follow up appointment rather than relying on
a subject to return food records.
There were no significant changes in diet among groups after 3 months.
However, the ‘Class + In-person’ group had a significant increase in the % kcal from
protein compared to baseline. Although evidence is limited, previous research has

81
indicated that a high protein diet (25% kcal from protein) may promote weight loss (87).
Furthermore, the ‘Tailored + In-person’ group had a significant decrease in % kcal from
fat compared to baseline but not a significant reduction in total kcal possibly explaining
why weight loss was not significant after 3 months. The minimal changes detected in
diet could also be secondary to the limited number of food records returned at 3 months.
Tailoring nutrition education tends to be more effective than non-tailored
information but it may not be enough to change behavior. Other factors such as learning
style, media type, and cultural differences may need to be addressed in the development
of an intervention (88). Furthermore, some studies have found that a tailored intervention
based on SOC does not always promote significant differences in primary measurements
compared to a control group (47, 72, 89).
Despite the numerous studies using the SOC in dietary and physical activity
interventions, not all of them have reported positive results or associations of SOC with
outcomes (26, 72, 89, 90). Some experts have even criticized the use of the stages of
change for changing dietary and physical activity behaviors (91-94). Such criticisms
include that: 1) nutrition and exercise are not necessarily ‘addictive behaviors’ that can be
clearly defined, 2) there is no consistent method for staging individuals, 3) behavior is
complex and cannot be simplified into 5 stages, and 4) there are discrepancies between
perceived behavior and actual behavior (91-93). We attempted to alleviate some of these
issues by using components of previously validated SOC instruments and by assessing
five stages of change for weight control rather than one. However, our tailored
intervention based on SOC for weight loss was not superior to the nontailored, classroom
approach. Other researchers also evaluated the impact of a tailored intervention using

82
multiple weight control behaviors versus a standard intervention and found no significant
differences between groups (72).
Furthermore, not all of the constructs of the TTM were used in our study for the
purposes of simplifying the intervention. Self-efficacy and decisional balance are the two
other constructs of the TTM that may have potentially strengthened the intervention.
Greene et al. recommended utilizing all constructs of the TTM to increase effectiveness
of dietary interventions (11). However, only the stages and processes of change were
used to keep the intervention streamlined and to reduce potential burden on the subject
and/or dietitian in the assessment of other TTM constructs.
The failure of subjects to meet recommended weight loss goals could possibly be
attributed to the A-INFO Internet program itself. While some previous studies have
shown beneficial effects of using the Internet for weight loss, others have shown little or
no effect (71, 95, 96). Previous studies have reported a positive relationship between
computer usage for weight loss and actual weight loss (71, 97). Our study found no
significant relationship between weight change and the total number of A-INFO sessions.
In other words, using A-INFO frequently (based on sessions), did not result in
significantly more weight loss. Thus, even though 35% of our subjects never used their
A-INFO account, it was not related to their success or failure with weight loss. One
explanation may be due to the method of how we tracked A-INFO usage. We were only
able to track the days when items were entered into three main sections of A-INFO but
not actual total login time. Some researchers have used login time to evaluate their
findings (98). Unfortunately, this type of information was not available to us. It is

83
unclear if another method of evaluation of A-INFO use would have produced different
results.
Furthermore, the most common reason cited for not using the account was ‘lack
of time’ or they forgot. It may be necessary to have more human contact. Several
subjects reported that they appreciated having accountability to us about their weight loss
habits. They felt that even if they did not lose weight, they had at least learned useful
information from the appointment during the study. Thus, it may have been helpful to
have someone contact them via the phone weekly about their account. The phone
component of the study was not useful to the subjects, potentially because it was voice
automated. It may have been more effective to alter the phone component of the study by
having a dietitian or health professional call the subjects once each week which was
found to be effective in previous research (43).
Even though technology is convenient and information is available, it does not
necessarily indicate that individuals will use them for weight loss or that they will be
effective (71). Other researchers have recommended that computer/Internet based
programs should only be used by those interested in that type of communication and
motivated to change (99). In addition, other studies have also reported less than desirable
effects of an Internet based weight management program on weight loss in adults (71,
95). For instance, a study evaluating weight loss in adults after using a popular,
commercialized interactive weight management website revealed that participants only
lost 1.3 ± 3.3 percent of their initial weight after 16 weeks compared to 4.0 ± 3.7 percent
weight loss in participants using a behaviorally-based self help program (71).

84
Other technological aspects of the Internet may be more feasible in delivering
dietary interventions. E-mail was readily used in communicating with the majority of the
research subjects. Some subjects also reported that they preferred to receive and
communicate via e-mail rather than a website. A 12 week e-mail worksite program
described by Block et al. demonstrated improved stage of change for fat and fruits and
vegetables as well as increased estimated intake of fruits and vegetables assessed by a
food frequency questionnaire (38). Although the study was not a randomized, controlled
trial, it did reveal the feasibility of an e-mail intervention with little time commitment and
positive results. However, because personal health information was being discussed, e-
mail was not a secure venue for communicating protected health information in this
study.
Through observation, it was apparent that subjects who lost weight had specific
and strong motivating forces. The most commonly cited reasons to lose weight were
personal health/family reasons and that they wanted to be promoted in rank or attend
school. Stages of change and processes of change of the TTM are theoretically intended
to help motivate an individual into action for a given behavior however; it may not be
enough to result in weight change. Certain weight loss motivational categories have
been identified as potential factors in matching individuals to appropriate weight loss
treatments (74). These categories include: 1) medically motivated (e.g. diagnosis of
disease) 2) internally motivated (e.g. feel better about self) 3) externally motivated (e.g.
spouse influence) 4) temporally motivated (e.g. upcoming wedding) (74). Furthermore,
Klem et al. reported that weight loss motivators can even vary by gender (100). Men are
more motivated by medical reasons while women are more motivated by emotional

85
reasons to lose weight (100). Although we did not assess specific motivators or
categories of motivation, informal reports from our subjects warrant further investigation
in future military weight management programs. Information about the type of
motivation or lack of motivation would be helpful in tailoring a weight loss program to
an individual.
Other researchers have suggested the option of allowing individuals to prioritize
their own target behaviors for an intervention rather than having someone else tell them
what to change, thus relating more to their “intrinsic motivation” to change (101).
Allowing an individual to prioritize the behaviors they desire to change may provide
more of a sense of control and empowerment (102). This is currently not an option for
military service members in relation to the current weight management program.
A limitation of the study was the attrition rate of 26% at 3 months. Although
other studies have reported similar attrition rates in weight loss studies, our attrition rate
was more often due to military related obligations (103, 104). Hence, the dropouts were
unforeseen and unavoidable. The characteristics of subjects that dropped out were
similar to other studies such as they were younger and had higher BMIs than completers
(70, 103, 104).
In conclusion, based on the 3 month data for completers (n=123), there was no
significant difference in weight loss among treatment groups. There were no significant
overall main effects of tailored counseling compared to classroom, or Internet follow up
counseling compared to in-person follow up counseling. Subjects in the ‘Class + In-
person’ treatment and ‘Tailored + Internet’ treatment lost significant weight after 3
months when compared to baseline. However, the subjects in the ‘Tailored + Internet’

86
group had body composition and waist circumference improvements not observed in the
standard WTS group. Furthermore, although differences were not significant among
groups, the ‘Tailored + Internet’ group was the only group to lose significant weight after
6 months compared to baseline. Our results do not provide a specific explanation at this
time on why this group lost significant weight, body fat and had reduced waist
circumference after 3 months and significant weight after 6 months. It may have been
because this group had an initial tailored session based on their personal readiness to
change multiple behaviors coupled with the availability of a weight management website
offering weekly feedback. Our findings did not support the fact that increased Internet
session usage was related to weight loss however, there may have been other
characteristics of the website that we did not track that were useful to the subjects and
promoted weight loss. Their weight loss may have also been secondary to changes in
their physical activity but these results were not available for inclusion in this analysis.
These findings reinforce the fact that other mediators of weight loss may need to
be considered within a military weight management program. The stages of change may
not have been an appropriate tool for a military population because they are often
influenced by job demands rather than personal motivations to lose weight. Furthermore,
although Internet technology is touted as a novel and feasible option for weight
management counseling, it may not be effective for all individuals. An ecological model
may be a more appropriate approach in the military population because of the potential
influence of unique environmental factors on obesity. For instance, environmental factors
such as physical activity resources and healthy food selections are often controlled and
vary by military institution location. Furthermore, policies such as the mandatory AWCP

87
may produce negative connotations towards weight loss and potentially result in
unhealthy weight loss practices. Although the Institute of Medicine’s report, “Weight
Management: State of the Science and Opportunities for Military Programs,” did not
specify that ecological models be explored for military weight management, it did
highlight the importance of providing appropriate resources in the environment such as
fitness facilities and healthy food choices for military personnel (3). Thus, future
research utilizing an ecological based program that addresses different levels of
environmental factors influencing weight loss is needed in the military population.
Innovative strategies are still needed to reduce face-to-face time with a health
professional especially for the maintenance of weight loss. Future studies should
continue to explore the use of other types of technology for weight management in the
military because of the continued challenge to reach individuals in remote areas and
sustain follow up. Technology should not be limited to the Internet, but possibly explore
the use of electronic mail or cellular telephones which were popular with our study
subjects. Characteristics of frequent users of a weight management website should also
be identified and considered for future website development. Our study revealed that
education level and marital status may be related to success with Internet usage for
weight loss. For instance, Internet follow up was more effective for military personnel
who were married and less educated (12 years vs. 17 years of education). These
preliminary findings may be of interest for further research if the military continues to
explore the use of Internet technology weight management programs.
Furthermore, if an Internet program was to be continued or further implemented,
sufficient time and access to the Internet should be provided to the participants. Frequent

88
reminders, possibly made by a health professional via phone on weekly basis may also be
needed to prevent soldiers from forgetting about their Internet account.
Until successful methods are developed, researchers should continue to explore
the vast capabilities of various methods of technology and behaviorally-based methods
within comprehensive programs to treat overweight and obesity in the military
population.

89
Chapter V: Changes in weight control “stages of change” behaviors and corresponding weight loss in active duty military service members during participation in a weight loss study Abstract
The “stages of change” is a commonly used construct of the Transtheoretical
Model of Health Behavior in dietary and exercise interventions. Theoretically,
individuals who advance into the action stage for a behavior are actively engaging in a
goal criterion, thus improving their health. While not all quantitative outcomes such as
weight loss may change over time, assessment of stages of change may detect intentions
to change behaviors or “intermediate outcomes” related to weight loss. The objectives of
this study were to 1) assess changes in stages of change for five different weight control
behaviors after 3 months for subjects participating in a weight loss study and 2)
determine if there was a relationship between being in the action and/or maintenance
stages for each weight control behavior and actual weight loss during enrollment in a
research study.
A previously validated stages of change instrument for multiple weight control
behaviors was used to assess stages of change for dietary fat, fruits and vegetables,
portion control and exercise in overweight, active duty military service members
participating in a weight loss study. The results revealed that subjects significantly
advanced into the action stage for portion control (p<0.05) after 3 months. Furthermore,
being in the action or maintenance stages was not associated with more weight loss than
being in the pre-action stages. These results indicate that individual weight control
behaviors alone based on stages of change are not significantly associated with weight
loss after 3 months. However, portion control is a behavior that should be assessed when
90
developing weight loss programs for active duty military service members. Other
comprehensive approaches to obesity (e.g. ecological model) beyond an individual level
of intervention may be necessary for an effective military weight management program.
Introduction
Prochaska and DiClemente proposed the Transtheoretical Model (TTM) in the
early 1980’s to understand the underlying structure of behavior change in smokers (18,
19). The TTM is comprised of four major constructs: stages of change, self-efficacy,
decisional balance and processes of change. “Stages of change” is the most commonly
used construct of the model and is made up of five stages (precontemplation,
contemplation, preparation, action, maintenance). These stages were identified as the
central organizing construct or temporal dimension of the TTM to help determine when
individuals would change their attitudes, intentions and behavior in regard to smoking
(20). Since the early 1980’s, numerous studies have utilized the TTM and/or certain
constructs of the TTM for weight control, exercise/physical activity fruit and vegetable
consumption, fiber intake and dietary fat reduction (21, 105).
An effective weight control intervention should help an individual to progress
from their current stage of change to the action and maintenance stages (9). Evaluating
the movement or progression of the stages of change can be used as an indicator of an
intervention’s success (9). Most interventions either just provide information or assume
that an individual is ready to lose weight (10). However, the majority of individuals are
not ready to take action, with only 25% of them ready to change a health behavior (11).
The majority of individuals (50%) are categorized in the precontemplation stage,
suggesting that they may not even realize they have a problem with their weight (11).

91
Furthermore, the action and maintenance stages of the TTM are intended goals in
the stages of change paradigm. If an individual is categorized in these higher stages, it is
interpreted that she/he is currently achieving a target behavior. Previous research that
staged overweight participants in a weight loss study for multiple weight control
behaviors reported a positive relationship between time in action and maintenance stages
for weight control behavior and weight loss (106). Prochaska et al. reported that being in
the action stage for weight control was a strong predictor of weight loss for hospital staff
workers in a worksite wellness program (24). Other studies utilizing stages of change and
relating it to weight loss or weight control behaviors have reported mixed results (26, 90,
107).
Thus, the objectives of this study were to 1) assess stages of change for five
different weight control behaviors (reducing “dietary fat”, increasing “fruit and
vegetables” consumption, reducing portion sizes/”portion control”, limiting high kcal
“beverages” and increasing “exercise”) in subjects participating in a weight loss study
before and after 3 months of treatment and 2) determine if being in action and/or
maintenance stages for each weight control behavior was significantly associated with
actual weight loss during enrollment in a weight loss study.
Materials and Methods
This research was approved by the Institutional Review Boards for Human
Subjects of Walter Reed Army Medical Center, Washington, D.C. and the University
of Maryland, College Park, MD (Appendix E).

92
Subjects
Subjects were 172 male and female active duty military service members (ages
18+) enrolled in a 6 month weight loss study at Walter Reed Army Medical Center in
Washington, DC.
Data Collection
Anthropometric Assessment
Weight was measured at 0 (baseline), 3 and 6 months using standard techniques
and equipment in the Walter Reed Nutrition Research Laboratory (62). Subjects were
instructed to wear lightweight clothing such as their physical training t-shirt and shorts
for all measurements. Weight was measured twice without shoes using an electronic
digital floor scale (Seca 770, Seca Corporation, Hanover, MD) in lbs and the average of
the two measurements were recorded to the nearest 0.1 lb. The 6 month weights were
not used in this study because all follow up appointments were not yet completed.
Stages of Change Assessment
A stages of change weight control instrument (Appendix B) was developed using
a validated questionnaire and components of other questionnaires from previous studies
(30, 51-53). The final instrument was also tested in a small group of soldiers during a
pilot study prior to the study (see Chapter III). The instrument’s purpose was to assess
stages of change (precontemplation, contemplation, preparation, action and maintenance)
for each of five different weight control behaviors (dietary fat, fruits & vegetables,
portion control, exercise, beverages) and provide a profile of the stages for each person
enrolled in the study.

93
The instrument results were also used in weight management counseling of
research subjects in two of four treatment groups (‘Tailored + In-person’ and ‘Tailored +
Internet’ groups) during a weight loss study (previously described). It was hypothesized
that subjects receiving tailored counseling based on the SOC for weight control would
advance significantly into the action stage each of the weight control behaviors and lose
significantly more weight than subjects receiving general, non-tailored weight control
information (‘Class + In-person’ and ‘Class + Internet’ groups).
Data Analysis
Statistical calculations were performed using the SAS System for Windows V9.1
(SAS Institute, Cary, NC, 2003). Supplemental software containing the GLIMMIX
(Generalized Linear Mixed Model) procedure was downloaded from the SAS website
(http://www.sas.com) for use in some analyses. All tests were considered significant at p
< 0.05.
The assumptions for the Analysis of Variance (ANOVA) were verified prior to
data analysis by examining normality of plotted residuals and the homogeneity of
residual variances.
PROC FREQ was used to summarize the proportion of subjects (n=172) in
precontemplation, contemplation, preparation, action and maintenance stages for each of
the weight control behaviors by group and overall at baseline. Chi-square analysis was
used to determine if the stages of change proportions were significantly different
(p<0.05) among groups for each weight control behavior at baseline.
Logistic analysis of covariance was used in analyzing changes in the stages of
change for all five weight control behaviors (fruits and vegetables, dietary fat, portion

94
control, beverages and current exercise) after 3 months for subjects completing at least
the 3 month appointment (n=123). The five stages of change categories were
dichotomized into stages of “pre-action” (precontemplation, contemplation or
preparation) and “action” (action or maintenance). The rationale behind this was to 1)
allow for sufficient cell counts in the analysis and 2) determine differences in the forward
or backward movement of subjects in the “action” stages versus the “pre-action” stages
within the groups. Previous research has dichotomized stages of change categories in a
similar manner for dietary parameters (30, 108).
The full generalized linear mixed model contained three main covariates (age,
gender, ethnicity) and their interactions with the 2 factors (diet, follow-up) to adjust for
any significant influence on the dependent variables. Interactions between covariates
were not included because they were not of interest and to keep the model small to
preserve degrees of freedom. The full model was reduced using previously described
procedures (63). Nonsignificant (p>0.05) covariate*factor interactions were removed
one by one starting with the highest order interactions. The covariates and/or their
interactions were left in the model if they significantly affected the outcome (p<0.05).
Analysis of covariance was used to determine the impact of stages of change
(dichotomized as “action” or pre-action”) for each weight control behavior (dietary fat,
fruits & vegetables, portion control, beverages, exercise) on weight loss after 3 months.
Individuals that remained or advanced into action stages after 3 months were classified as
“action” and those that remained or reverted back into “pre-action” stages after 3 months
were classified as “pre-action”. Only those completing at least the 3 month measurement
of weight (n=123) were included in the analysis.

95
Age was centered by subtracting the mean of the observed value to make
interpretation results simpler. Categorical/class covariates (gender, ethnicity) were
interpreted at equal proportions to match an ideal experiment of equal replication.
Ethnicity/race was collapsed into three main categories (white, black, other) to increase
cell counts for analysis.
Results
Baseline ‘stages of change’
Overall at baseline (n=172), the majority of subjects were classified in the
maintenance stage for dietary fat (n=114, 77%), preparation stage for fruits and
vegetables (n=71, 48%), preparation for portion control (n=82, 55%), maintenance for
beverages (n=69, 47%) and preparation for current exercise (n=69, 46%) according to the
results of the stages of change instrument (Table 5.1). No significant differences were
detected among groups. Stages of change for ‘prior exercise’ were used exclusively for
study treatment purposes. ‘Prior exercise’ was defined as exercise habits when exercise
was not mandatory by the military. More subjects were classified in the action or
maintenance stages (47% vs. 35%) when comparing their ‘current’ versus their ‘prior’
exercise stage of change.
Changes in ‘stages of change’ at 3 months
To determine differences in the ‘stages of change’ for each of the 5 weight control
behaviors, the stages were dichotomized into ‘action’ and ‘pre-action’ stages.

96
Table 5.1 Baseline Weight Control Behaviors (Stages of Change) Baseline Weight Control Stages of Change⊗
Class + In-person
(n=43)
Class + Internet (n=43)
Tailored + In-person
(n=43)
Tailored + Internet (n=43)
Overall (n=172)
Dietary Fat, n (%) Precontemplation Contemplation Preparation Action Maintenance
0 (0) 1 (3) 1 (3)
4 (11) 30 (83)
0 (0) 0 (0) 2 (5) 11 (27) 27 (67)
0 (0) 0 (0) 2 (5) 11 (27) 27 (67)
1 (2) 0 (0) 0 (0)
9 (24) 28 (74)
1 (<1) 1 (<1)
4 (3) 28 (19)
114 (77) Fruits and Vegetables, n (%) Precontemplation Contemplation Preparation Action Maintenance
2 (6)
4 (11) 15 (42)
4 (11) 11 (31)
1 (3) 3 (9)
15 (44) 5 (15)
10 (29)
2 (5) 3 (7)
24 (60) 2 (5)
9 (22)
5 (13) 6 (16)
17 (45) 2 (5)
8 (21)
10 (7)
16 (11) 71 (48) 13 (9)
38 (26) Portion Control, n (%) Precontemplation Contemplation Preparation Action Maintenance
6 (16)
1 (3) 23 (64) 5 (14)
1 (3)
4 (12)
1 (3) 23 (68)
3 (9) 3 (9)
10 (25)
3 (7) 18 (45) 4 (10) 5 (12)
12 (32)
1 (3) 18 (47) 5 (13)
2 (5)
32 (22)
6 (4) 82 (55) 17 (11) 11 (7)
Beverages, n (%) Precontemplation Contemplation Preparation Action Maintenance
2 (6) 2 (6)
10 (28) 3 (8)
19 (53)
4 (12)
2 (6) 8 (23) 6 (18)
14 (41)
5 (12)
1 (2) 10 (25) 5 (12)
19 (47)
7 (18)
1 (3) 8 (21) 5 (13)
17 (45)
18 (12)
6 (4) 36 (24) 19 (13) 69 (47)
Exercise, n (%) Current habits Precontemplation Contemplation Preparation Action Maintenance Prior habits* Precontemplation Contemplation Preparation Action Maintenance
0 (0) 2 (6)
16 (44) 6 (17)
13 (36)
0 (0) 2 (6)
18 (51) 4 (11)
11 (31)
0 (0) 2 (6)
14 (41) 8 (23)
10 (29)
0 (0) 2 (6)
17 (50) 5 (15)
10 (29)
0 (0) 4 (10)
21 (52) 5 (12)
10 (25)
0 (0) 5 (13)
26 (67) 1 (2)
7 (18)
0 (0) 3 (8)
18 (47) 7 (18)
10 (26)
2 (5) 4 (10)
18 (47) 5 (13) 9 (24)
0 (0) 10 (7)
69 (46) 26 (18) 43 (29)
2 (1) 13 (9)
79 (54) 15 (10) 37 (25)
Because of missing values, the total n is not the same for all variables. Total percent may not add up to 100 due to rounding. *”Prior habits” represents exercise “stage of change” when exercising was not mandatory. ⊗No significant difference found among groups for each weight control behavior at baseline.

97
‘Action’ was defined as being in the action or maintenance stage for a behavior and ‘pre-
action’ was defined as being in the precontemplation, contemplation or preparation stages
for a behavior.
When dichotomized, there were no significant changes in stages of change for
dietary fat within or among groups at 3 months (Table 5.2). There was a significant
increase (p=0.02) in the proportion of subjects in the ‘action’ stage for fruits and
vegetables in the ‘Class + In-person’ group at 3 months (Table 5.2). However, baseline
proportions of action versus pre-action stages for fruits and vegetables were significantly
different among groups. Specifically, the ‘Class + In-person’ group had a lower
proportion of subjects in action at baseline.
All four treatment groups had significant increases (p<0.05) in the proportion of
subjects classified in the action stage for portion control at 3 months (Table 5.2).
However, the differences among groups were not significant. The changes in SOC for
beverages and exercise were not statistically significant within or among groups (Table
5.2).
Relationship of ‘stages of change’ to weight loss after 3 months
Because the overwhelming majority of subjects were classified in the “action”
stage for dietary fat, it was not possible to determine significant differences between the 3
month weight changes of those in ‘pre-action’ versus those in ‘action’ (Table 5.3).
There were no significant differences in weight change after 3 months for subjects
classified in action versus pre-action for fruits and vegetables, portion control, beverages
or exercise within the four treatment groups (Table 5.3).

Table 5.2 Weight Control Behaviors (Stages of Change) before and after 3 months
“Pre-action” = precontemplation, contemplation or preparation stages “Action” = action or maintenance stages ‡P<0.05 for difference among groups at baseline. †P<0.05 for difference after 3 months within group.
Weight Control Stages of Change
Class + In-person (n=26)
Class + Internet (n=22)
Tailored + In-person (n=27)
Tailored + Internet (n=24)
P value Across groups
Base n (%)
3 mo n (%)
Base n (%)
3 mo n (%)
Base n (%)
3 mo n (%)
Base n (%)
3 mo n (%)
After 3 mo
Dietary Fat “Pre-action” “Action”
2 (8)
24 (92)
1 (4)
25 (96)
1 (5)
21 (95)
0 (0)
22 (100)
2 (7)
25 (93)
0 (0)
27 (100)
0 (0)
24 (100)
0 (0)
24 (100)
0.99
Fruits and Vegetables “Pre-action” “Action”‡
20 (77) 6 (23)
11(42)
15 (68)†
9 (41)
13 (59)
13 (59) 9 (41)
18 (67) 9 (33)
16 (59) 11 (41)
18 (75) 6 (25)
16 (67) 8 (33)
0.32
Portion Control “Pre-action” “Action”
21 (81) 5 (19)
10 (39) 16 (61)†
18 (82) 4 (18)
7 (32)
15 (68)†
20 (74) 7 (36)
10 (37) 17 (63)†
17 (71) 7 (29)
9 (37.5)
15 (62.5)†
0.90
Beverages “Pre-action” “Action”
9 (35) 17 (65)
7 (27)
19 (73)
7 (32)
15 (68)
2 (9)
20 (91)
9 (33) 18 (67)
4 (15)
23 (85)
8 (33)
16 (67)
3 (12.5) 21 (87.5)
0.35
Current Exercise habits “Pre-action” “Action”
15 (58) 11 (42)
12 (46) 14 (54)
9 (41)
13 (59)
9 (41)
13 (59)
16 (59) 11 (41)
15 (56) 12 (44)
12 (50) 12 (50)
10 (42) 14 (58)
0.86

Table 5.3 Relationship of Stages of Change to Weight Change
Weight change expressed as mean ± SE. “Pre-action” = precontemplation, contemplation or preparation stages at 3 months “Action” = action or maintenance stages at 3 months *Significance of difference of “pre-action” versus “action” weight change NA=Not available because all subjects within group classified into action.
Weight Control Stages of Change
Class + In-person Group (n=26)
Class + Internet Group (n=22)
Tailored + In-person Group (n=27)
Tailored + Internet Group (n=24)
Weight Change after 3 months (kg)
P-value* Weight Change after 3 months (kg)
P-value* Weight Change after 3 months (kg)
P-value* Weight Change after 3 months (kg)
P-value*
Dietary Fat “Pre-action” “Action”
+0.32 ± 3.60 -1.17 ± 0.74
0.68
NA
-0.12 ± 0.82
NA
NA
-0.28 ± 0.70
NA
NA
-1.28 ± 0.75
NA
Fruits and Vegetables “Pre-action” “Action”
-1.31 ± 1.11 -1.04 ± 0.94
0.85
-0.49 ± 1.05 +0.59 ± 1.24
0.49
-0.41 ± 0.92 -0.15 ± 1.09
0.86
-0.89 ± 0.91 -2.12 ± 1.30
0.43
Portion Control “Pre-action” “Action”
-1.28 ± 1.12 -0.97 ± 0.94
0.82
-0.72 ± 1.39 +0.41 ± 0.99
0.50
+1.13 ± 1.13 -1.08 ± 0.88
0.12
-0.41 ± 1.22 -1.74 ± 0.92
0.38
Beverages “Pre-action” “Action”
-0.40 ± 1.37 -1.48 ± 0.81
0.49
+2.67 ± 2.52 -0.40 ± 0.84
0.25
+1.48 ± 1.76 -0.65 ± 0.75
0.27
-0.83 ± 0.78 -4.65 ± 2.03
0.08
Current Exercise habits “Pre-action” “Action”
-1.29 ± 1.03 -1.03 ± 1.04
0.86
-0.63 ± 1.27 +0.35 ± 1.14
0.58
+0.45 ± 0.92 -1.23 ± 1.08
0.24
-1.71 ± 1.15 -0.98 ± 0.98
0.62

100
Discussion
The purpose of this study was to evaluate changes in SOC for five weight control
behaviors after 3 months in overweight and obese military service personnel participating
in a weight loss study and to determine if there was a significant relationship between
each SOC and weight loss. The primary finding was that SOC for five weight control
behaviors were not associated with weight loss. Furthermore, SOC for portion control
was the only behavior where subjects advanced significantly into the action stage after 3
months. This was the first study, to our knowledge, to assess multiple stages of change
for weight control in military service members. Furthermore, it was the first study to
assess stages of change for beverage choices.
Overall, the majority of all subjects at baseline (>50%) were at least in the
preparation stage for all five weight control behaviors (Table 5.1). This is important
because it is recommended that individuals should be in at least preparation if not the
action stage for a behavior before a weight control intervention is implemented (30).
However, there were several individuals in each group who were classified in the
precontemplation and contemplation stages especially for portion control (n=38), fruits
and vegetables (n=26), and beverages (n=24) (Table 5.1). Thus, changing their weight
control behaviors may not have been appropriate for them at this time.
Furthermore, higher proportions of action and maintenance for SOC may have
been falsely inflated because the majority of subjects in the study were also in a
mandatory military program to lose weight. Overall, 47% of the subjects were classified
in the action or maintenance stage for exercise. However, since many of the subjects
were mandated to exercise in accordance to the military weight management program, we

101
decided to also assess their exercise habits prior to mandatory exercise. As expected,
only 35% compared to 47% were in the action or maintenance stage prior to the
mandated exercise.
The results for dietary fat stage of change revealed that the majority of individuals
were classified in action and maintenance. Dietary fat classification had the least
heterogeneity among individuals and groups of the five behaviors assessed for stages of
change. One possibility is that individuals may be answering the questions with a belief
that they are truly engaging in fat reducing behaviors but may not actually be executing
these behaviors. Another possibility is that the message to eat less fat has been exploited
in the past and it may have become a negative connotation with individuals and thus they
may be less likely to report their true intake of fat. It is not uncommon for overweight or
obese individuals to underestimate their food intake (109, 110). In particular, individuals
tend to underestimate their fat intake (111). Although the exact cause is unknown,
previous research has revealed that the majority of individuals tend to be staged in action
and maintenance when assessing stages of change for dietary fat (57, 59).
Assessing stages of change progression or relapse is important for program
evaluation as well. The changes in SOC may reflect intermediate outcomes. Previous
research has suggested the assessment of “partial behavior change” using stages of
change in cost-effectiveness analyses of behavioral interventions (112). Stages of
change may offer a more sensitive detection of behavior change than other types of
objective measurements. However, an individual may advance into a higher stage of
change for a behavior but not have this change equate into an objective change such as
weight loss (26).

102
Significant progression into action was observed in all groups for portion control
possibly because it was a major focus of both the tailored counseling sessions and in the
standard, classroom sessions. The standard weight loss class provided by the Army
contains a large focus on how to control portion sizes. Furthermore, portion control was
the most problematic behavior when assessed by the stages of change instrument and had
the most individuals classified in the ‘pre-action’ stages at baseline (Table 5.1, Table
5.2). Thus, portion control was emphasized by the dietitian during the tailored
counseling sessions. However, there were no significant differences detected for forward
progression into the action stage among groups.
Regardless of weight loss treatment type, theoretically, those individuals in the
action SOC should be engaging in behaviors that may eventually result in change and
weight loss. Yet, other studies utilizing SOC for weight control detected advances in
SOC over time but no significant relationship between SOC and weight loss (26, 90).
For example, Jeffery et al. assessed weight change and SOC for weight control yearly in
adult women over a 3 year period (26). The results revealed that there was no significant
association between SOC and weight change. Furthermore, women in the contemplation
stage lost weight while those in the action stage gained weight after 1 year. Macqueen et
al. assessed SOC for weight control in overweight and obese men and women to
determine its association with weight loss (90). There was no significant correlation
between the SOC score and weight loss in subjects after 4-6 weeks.
Despite the numerous studies using the SOC in dietary and physical activity
interventions, not all of them have reported positive results or associations of SOC with
outcomes (26, 72, 89, 90). Some experts have even criticized the use of the stages of

103
change for changing dietary and physical activity behaviors (91-94). Such criticisms
include that: 1) nutrition and exercise are not necessarily ‘addictive behaviors’ that can be
clearly defined, 2) there is no consistent method for staging individuals, 3) behavior is
complex and cannot be simplified into 5 stages, and 4) there are discrepancies between
perceived behavior and actual behavior (91-93). We attempted to alleviate some of these
issues by using components of previous validated SOC instruments and by assessing five
stages of change for weight control rather than one. However, our tailored intervention
based on SOC for weight loss was not superior to the nontailored, classroom approach for
advancing individuals into the action SOC for any of the weight control behaviors.
One major reason for not detecting significant advances into the action SOC or
being able to associate the action SOC to weight loss may be due to the complex nature
of obesity and the potential influence of the environment on behavior. The SOC are
intended for an individual level of behavior change. However, more recently, experts
have highlighted the importance of ecological models of health behavior interventions for
obesity (75-79). Ecological models consider the interaction between people and their
environments. Booth et al. identified several environmental factors that are key
influences on nutrition and physical activity such as local government, schools,
community, employers, family, and the food and restaurant industry (75) . For example,
soldiers may have the desire to eat healthier but if there are no healthy food choices
available to them at their military base, they may opt for higher calorie choices.
Furthermore, if they had little or no support from family, friends or colleagues, they may
not have been able to succeed in their weight loss attempts. In addition, Army policy

104
mandates a weight control program if weight standards are not met. Hence, there are
numerous other factors that may have been influencing the outcomes of this study.
Another explanation for the lack of significant difference between action and pre-
action associated weight change is that SOC may not have been assessed frequently
enough. We only assessed SOC at 3 month intervals and may have missed changes in
SOC that occurred between intervals. For instance, individuals in the preparation stage
could have advanced into action after 1 month and lost weight but then relapsed into a
lower stage before we assessed them at 3 months. Thus, their 3 month SOC would have
been assessed as “pre-action” but, they also would have lost weight. To the contrary, an
individual may have just recently advanced into the action stage for one or more weight
control behaviors but it may not have been for a long enough period of time to detect
changes in body weight or other measures at their 3 month appointment. Thus, they may
have been assessed in the “action” stage, but were not in it long enough yet to actually
experience weight loss. Some studies have assessed SOC at earlier time intervals such as
5 weeks or 2 months (24, 72). Furthermore, the majority of previous studies have been
cross-sectional rather than longitudinal, thus little evidence is available to determine the
impact of SOC on quantitative outcomes over time (91).
Although previous studies have collapsed the SOC into two categories similar to
our study, our results may have varied if stages were collapsed differently (30, 108). For
instance, many individuals who were exercising regularly may have been staged in
preparation because they were not meeting a goal of 30 minutes of exercise each day for
at least 5 days per week. Specifically, if they were exercising for 3 or 4 days a week,
then they were classified in the preparation stage. The results when relating weight loss

105
to SOC for exercise indicate that those in pre-action for three of the four treatment groups
faired better, but not significantly, in regards to weight loss (Table 5.3). Thus, the
magnitude of weight loss according to SOC for exercise may have been different if
preparation was included as “action” rather than “pre-action”. In addition, only the 3
month weight change data were used in the analysis of SOC association with weight
change. Different results may materialize once the final 6 month data become available
for analysis.
Forward progression of individuals into the action stage was observed, but not
significant, in most cases for the five weight control behaviors over time. This was
promising because this may equate to dietary and/or weight loss over time. However,
because weight loss is the result of multiple factors and changes, attempting to associate
one single behavioral stage of change with weight loss may not have been powerful
enough to detect a significant association. Specifically, some behaviors may not promote
weight loss alone but rather in combination with other behaviors. Previous research has
indicated that time spent in action or maintenance for five total weight control behaviors
is associated with weight loss (106). Thus, it may have been more prudent to develop a
model utilizing all five of the behaviors and associating them to weight loss as a cluster
over a longer period of time.
In conclusion, portion control was the only weight control behavior where
subjects advanced significantly into the ‘action’ stages after a 3 month weight loss
intervention. There was no significant relationship between SOC and weight loss after 3
months for any of the weight control behaviors. Although further evidence should be
assessed at 6 month, these results indicate that SOC for weight control may not be

106
enough to assist military service members in losing weight and/or that SOC are not strong
predictors of weight loss. These are both valid arguments. Motivations by military
service members to lose weight may sometimes be related to other environmental forces
including the food choices in their environment, social support and/or policies within the
Army such as the mandatory Army Weight Control Program. Thus, the complex
interaction of a military service member’s weight control behaviors and their
environment warrants further exploration. Furthermore, some experts have argued that
SOC may be more useful for understanding behavior rather than predicting behavior
change. Less longitudinal and quantitative evidence is available relative to the vast
amount of cross sectional and qualitative research conducted on SOC for dietary and
physical activity interventions to determine these relationships (94).
At minimum, the relationship of SOC for portion control habits and weight loss
should be further explored because it was the only behavior to significantly change in
military service members after 3 months. Furthermore, an effective weight control
program for military service members may need to go beyond the individual level of
intervention and consider environmental influences in the quest to improve military
weight management programs.

107
Chapter VI. Conclusions
Major findings
It was expected that the ‘Tailored + Internet’ group would lose significantly
more weight and body fat and concurrently have the most improvement in waist
circumference, blood lipids, blood glucose, blood pressure, SOC and diet over 3
months when compared to the other groups. There were no significant differences
among the four treatment groups on any of the outcomes after 3 months for those
completing the study (n=123). However, there were notable and positive changes
within the ‘Tailored + Internet’ group. Subjects lost an average of 1.33 kg over 3
months (p<0.05). Body mass index was reduced by 0.41 kg/m2. Body composition
was improved with respect to weight loss. Specifically, there were statistically
significant reductions in total, trunk and percent body fat after 3 months indicating a
healthy approach to weight loss. Furthermore, the ‘Tailored + Internet’ group had a
significant reduction in waist circumference.
While the ‘Class + In-person’ group (current nutrition and exercise educational
component of the AWCP) also experienced comparable weight losses and reductions
in BMI at 3 and 6 months to the ‘Tailored + Internet’ group, they also had significant
loss in lean body mass after 3 months. Thus, their weight change may be partially
attributed to loss of lean body mass rather than body fat. Accordingly, they did not
have significant reductions in body fat measurements or waist circumference. This
may indicate that they were not making healthy changes (e.g. exercising, not fasting,
eating at least 1200 kcal/day) as recommended to preserve lean body mass.
It is most likely that changes in the risk factors associated with obesity

108
(comorbidities) were not observed in any of the groups secondary to the modest
weight loss of <2% over the 3 months. Furthermore, when main effects of dietary
treatment and follow up counseling method were examined, no significant differences
existed.
Although not statistically significant between groups, subjects significantly
progressed forward into the action stage for portion control in all groups after 3
months but not for the other weight control behaviors. Being in the action stage for
each weight control behavior was not significantly associated with more weight loss
than being in the pre-action stages after 3 months.
In conclusion, although not statistically different from the other treatment
approaches, the ‘Tailored + Internet’ group had positive changes in weight loss, body
mass index and body composition after 3 months. Further research is warranted to
determine what factors or treatments are most effective for weight loss in a military
population. Several levels of intervention beyond an individual level, such as those
found in an ecological model of health behavior, may be needed within a military
weight management program because of the numerous environmental factors that may
affect weight loss. Other methods of weight loss follow up counseling should
continue to be explored in light of the perpetual challenge to provide follow up with
active duty military service members.
Strengths
The strengths of the study were that it was a longitudinal study with multiple
clinical outcomes that were measured by standard equipment and techniques.
Anthropometric, body composition, clinical, dietary and behavioral measures were
109
collected during analysis to provide insight into the various changes over 6 months.
Furthermore, the study was successful in developing an interactive, secure
website and an innovative, interactive behavioral-based instrument with a
corresponding treatment scheme for use in the management of weight loss in the
military. It is the first study to our knowledge to closely evaluate the standard dietary
intervention of the Army Weight Control Program and to assess stages of change for
beverages along with four other weight control behaviors.
Limitations
Limitations of the study include that subjects were free living and could be
exposed to outside information. The final attrition rate was higher than anticipated
although the rate was not uncommon for a weight loss study. However, 40% of
participants dropped out due to military related reasons. There was also potential error
introduced from using self-reported dietary data. Inter-rater error could have also
existed because of the involvement of three other registered dietitians in providing the
intervention. However, one primary dietitian provided more than 90% of the
treatment over 6 months.
Caution should be used in extrapolating the data not only to the U.S.
population but to the Army itself. Walter Reed Army Medical Center (WRAMC) is
not necessarily representative of all Army bases because of its high concentration of
health and administrative professions, thus further research should be conducted at
other installations.
The study was not designed to offer frequent treatment which may be
warranted. It was also not developed to evaluate weight loss and weight maintenance
110
over a longer period of time which is a huge gap in obesity research.
Future Directions
During the study, we observed that there were some strong and specific
reasons that motivated the subjects to lose weight. Surveys conducted with individuals
in the National Weight Control Registry (a group of over 700 men and women able to
sustain at least 30 lbs of weight loss for at least 1 year) reveal that there are common
triggers among individuals that instigate successful weight loss. The most common
trigger among women was related to emotions while the most common among men
was related to medical reasons (100). Our subjects did informally report various
motivations for weight loss such as job promotion, schooling, marriage, family etc.
however we cannot link these triggers to long term success because they were not
assessed. Furthermore, it was not the primary objective to investigate motivation to
lose weight although it appears to be an important trigger and predictor of success. If
motivation is a key predictor of success for weight loss, it would seem prudent to
further explore methods to trigger and increase internal and/or external motivators.
The military is a unique population with respect to weight control. Not only do
soldiers have specific job related pressures to maintain weight but they have a unique
set of stressors influencing their behaviors. Individuals in the military are at constant
alert especially in war time. Job duties can change instantly thus inducing stress
related to moving, family and life in general. Further research should explore the
different types and impact of stressors unique to the military population and how these
stressors can be managed for weight management.
Several of the subjects (% unknown) in the study were enrolled because of

111
recent weight gain secondary to physical injury. It seems that a preventive
intervention should be considered to educate soldiers on how to prevent weight gain
when they are injured and cannot exercise as usual.
Other methods of technology such as the use of cellular telephones and
electronic mail should be further explored in delivering weight management
interventions. An overwhelming majority of our research subjects used cell phones
and electronic mail in daily communication. This may be a more feasible option than
an Internet based program.
Although Internet use for weight loss is highly touted as a novel option for
weight control in civilian and more recently military populations, further
characteristics (such as marital status and education level) should be determined about
successful users of these programs. It was clear from our results that an Internet
account is not desirable or useful to all individuals. Furthermore, the subjects reported
lack of time, forgetfulness and lack of Internet access at work as barriers to using the
weight management website. These barriers need to be addressed before
implementing an Internet based weight management program for military personnel.
Finally, it cannot be denied that obesity is a multifaceted disease that can be
affected by numerous factors. Our study was developed to intervene on an individual
level of behavior change. However, more recently, experts have highlighted the
importance of ecological models of health behavior interventions for obesity (75-79).
Ecological models consider the interaction between people and their environments.
There are several levels of influence within an ecological model of health behavior
including the following factors: 1) intrapersonal/individual, 2) interpersonal, 3)

112
institutional, 4) community and 5) policy (80). One specific example was indicated by
the food environment’s influence on subjects’ eating habits as indicated by their food
records. Subjects working at WRAMC most often ate 1-2 of their meals at WRAMC.
Thus, their diet could be easily influenced by the food choices offered at work.
Unfortunately, fast food restaurants were readily available and highly desirable to
many of the research subjects making it more difficult for them to lose weight. It is
important that the environment be altered to offer healthier choices and/or that
individuals should be educated and provided with nutrition information about the food
choices available to them so that they can make healthier choices. Furthermore, if
subjects had little or no support from family, friends or colleagues, they may not have
been able to succeed in their weight loss attempts. In addition, the AWCP is an Army
wide policy that mandates military personnel to take action if they exceed certain
weight standards. Thus, it is essential that the military considers the multiple levels of
environmental impact when developing weight management interventions.

113
APPENDIX A Cognitive Interviewing Questions
Overview for cognitive interview: This interview will take approximately 1 hour of your time. I will be asking you to complete a questionnaire on a computer screen. It contains ~30 questions. I will be asking you to stop at certain points to ask you questions about how you have responded to the questions. There are no right or wrong answers to the questions. We are primarily interested in how you determine your answers rather than your answers themselves. Your responses are very important, even if they are just small details, because they will help provide us with feedback on how to better construct our questionnaire.

114
Standard Probing Questions
FAT *Most is equal to 4 out of seven days of a week. 1. Do you avoid high fat meats such as red meat, regular hot dogs, bacon and regular lunch meats most* days of the week? How did you determine your answer? What does “high fat meat” mean to you? What does “red meat” mean to you? Are the answer choices sufficient? When you answered the question, did you consider “Most” days of the week? 2. Do you avoid fried foods such as fried chicken, fish and French fries most days of the week? What does “fried food” mean to you? How did you arrive at your answer/determine how much fried food you ate? 3. Do you avoid fast foods most* days of the week? What does “fast food” mean to you? How did you arrive at your answer? 4. Do you remove the skin from chicken and turkey most* times during of the week when you eat them? How did you arrive at your answer? 5. Do you trim the fat off of meat most* times during the week when you eat it? What does “meat” mean to you? How about “trim the fat off”? 6. Do you avoid snacks such as regular potato chips, corn chips and nuts most* days of the week? What does the word “snacks” mean to you? Did any other snacks come to mind? How did you arrive at your answer?

115
7. Do you avoid baked goods such as cake, cookies, pies, donuts and pastry most* days of the week? What does “baked goods” mean to you? Did any other baked goods come to mind? Brownies, muffins? 8. Do you avoid using butter and margarine on bread, rolls, muffins or bagels most* days of the week? How did you arrive at your answer? Are there any other foods that you add butter and margarine to besides bread, rolls etc.? such as vegetables? 9. Do you avoid chocolate candy or chocolate dessert most* days of the week? What does “chocolate candy” mean to you? How about “chocolate dessert”? How did you arrive at your answer? 10. Do you replace regular dairy products with low fat or nondairy products such as skim or 1% milk, low fat or nonfat ice cream, yogurt and cheese even if making a milkshake or other recipes with dairy most* days of the week? Was this question easy or hard to answer? How did you arrive at your answer? Is this question too long? What does “nonfat” and “low fat” mean to you? 11. Do you replace regular salad dressing, gravy and mayonnaise with low fat or nonfat versions most* days of the week? Was this question easy or hard to answer? How did you arrive at your answer? Were there too many foods grouped together in this question? FR/VEG Think about your breakfast, lunch, dinner and snacks. On average, how many servings do you eat per day of: Fruit: Vegetable: What does the word “serving” mean to you? How did you arrive at this many servings? Do the serving size examples help you to answer this question? How sure are you of your answer?

116
EXERCISE Exercise includes activities such as physical training (PT), calisthenics, full court basketball, flag football, road marching, brisk walking, jogging, swimming, aerobic dancing, biking, rowing, etc. Activities that are primarily sedentary such as police call, softball, rifle range, bowling or playing golf with a golf cart would not be considered exercise. Do you currently exercise for at least 5 days a week for at least 30 minutes total each day? Is this question easy or difficult to answer? What does the word “exercise” mean to you? How did you determine how often you exercise? How sure are you of your answer? Are you currently required to do PT with your unit? Prior to mandatory exercise/PT enforced by your unit, did you exercise for at least 5 days a week for at least 30 minutes each day? What does “PT” and “your unit” mean to you? PORTION CONTROL Think about your eating habits and how you control your portion sizes. 1. Do you control the amount of food you eat by taking at least 20 minutes to eat each meal most days of the week? How did you answer in regard to “Most” days of the week? What does “control the amount of food that you eat” mean to you? What does the word “meal” mean to you? How did you arrive at your answer? 2. Do you control the amount of food you eat by stopping eating when you feel full each time you eat most days of the week? Was this question easy or difficult to answer? What does “feel full” mean to you? 3. Do you control the amount of food you eat by avoiding eating when you are feeling nervous, stressed, depressed or upset most days of the week? What does “avoiding eating” mean to you? What do the terms “nervous, stressed, depressed or upset” mean to you?

117
4. Do you control the amount of food you eat by resisting the urge to clean your plate when you are full at each meal most days of the week? What does “clean your plate” mean to you? How did you arrive at your answer? 5. Do you control the amount of food you eat by drinking a glass of water before each meal most days of the week? Was this question easy or difficult to answer? What does “glass of water” mean to you? How did you arrive at your answer? 6. Do you control the amount of food you eat by saying "no" to second helpings at each meal most days of the week? What does “second helping” mean to you? 7. Do you control the amount of food you eat by tracking how much you eat during the day each day of the week? What does “track how much you eat” mean to you? (by memory or paper) 8. Do you control the amount of food you eat by avoiding buffet style eating most days of the week? What does “Buffet style eating” mean to you? How did you arrive at your answer? 9. Do you control the amount of food you eat by buying smaller portions of foods at restaurants or the grocery store most days of the week? What does “smaller portions” mean to you? What about “restaurant” or “grocery store”? 10. Do you control the amount of food you eat by using smaller plates or bowls at each meal most days of the week? Was this question easy or difficult to answer? How did you arrive at your answer?

118
BEVERAGES
Think about your daily intake of the following beverages and check the types that you drink on a daily basis. -Alcohol (beer, wine, wine cooler, mixed drink, liquor, etc.) -Regular soft drinks (such as Pepsi, Coke, Mountain Dew, Sprite, etc.) -Regular sweetened iced tea -Sports drinks (such as Gatorade, PowerAde, etc.) -Fruit flavored drinks (such as lemonade, fruit punch, Kool-Aid, regular Snapple, Sobe, etc.) -Fruit juice (such as orange, apple, grape, etc.) -Coffee drinks (such as regular latte, mocha, etc), Note: Coffee without sugar does not count. -Other sweetened drinks (such as Red Bull energy drink, non-alcoholic mixed drinks, etc)
Do you drink less than or equal to 24 fl oz (two cans) of these a day? Is this question easy or difficult to answer? How did you determine how many fl oz you drink in a day? How sure are you of your answer? Do you drink any beverages that are not listed? Should we list beverages that would not count in this answer? GENERAL Web site Questions: Navigation Problems: Color scheme of site:
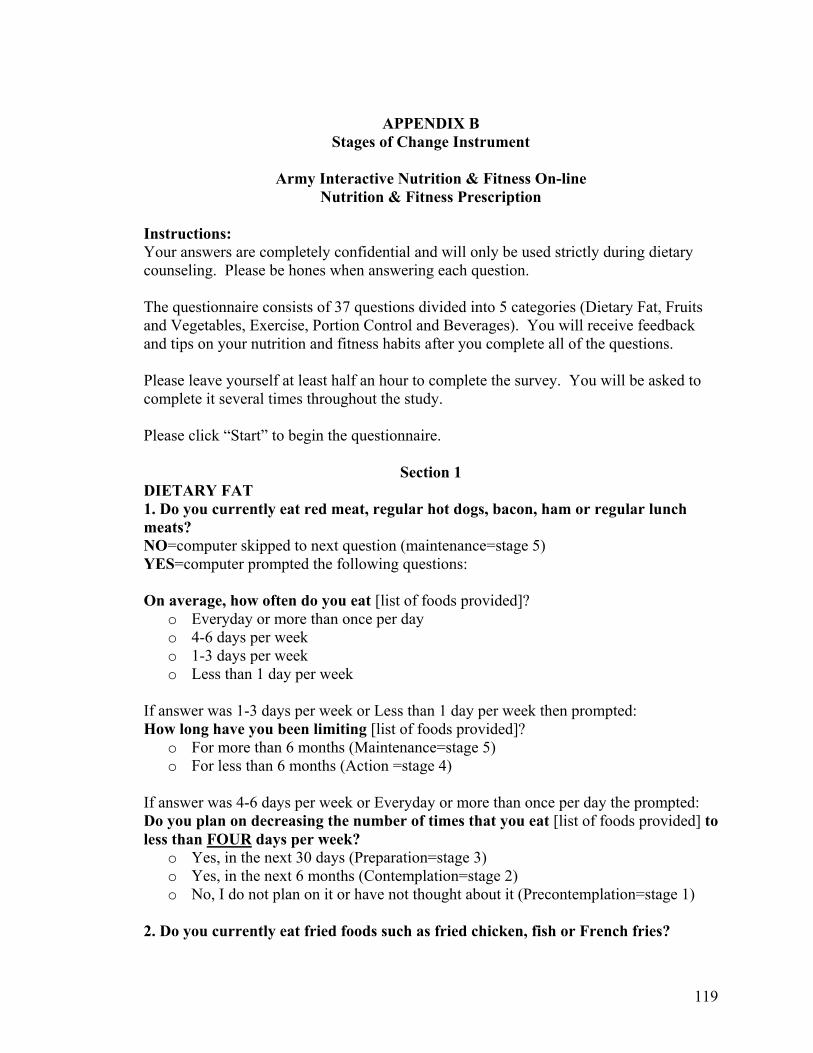
119
APPENDIX B
Stages of Change Instrument
Army Interactive Nutrition & Fitness On-line Nutrition & Fitness Prescription
Instructions: Your answers are completely confidential and will only be used strictly during dietary counseling. Please be hones when answering each question. The questionnaire consists of 37 questions divided into 5 categories (Dietary Fat, Fruits and Vegetables, Exercise, Portion Control and Beverages). You will receive feedback and tips on your nutrition and fitness habits after you complete all of the questions. Please leave yourself at least half an hour to complete the survey. You will be asked to complete it several times throughout the study. Please click “Start” to begin the questionnaire.
Section 1 DIETARY FAT 1. Do you currently eat red meat, regular hot dogs, bacon, ham or regular lunch meats? NO=computer skipped to next question (maintenance=stage 5) YES=computer prompted the following questions: On average, how often do you eat [list of foods provided]?
o Everyday or more than once per day o 4-6 days per week o 1-3 days per week o Less than 1 day per week
If answer was 1-3 days per week or Less than 1 day per week then prompted: How long have you been limiting [list of foods provided]?
o For more than 6 months (Maintenance=stage 5) o For less than 6 months (Action =stage 4)
If answer was 4-6 days per week or Everyday or more than once per day the prompted: Do you plan on decreasing the number of times that you eat [list of foods provided] to less than FOUR days per week?
o Yes, in the next 30 days (Preparation=stage 3) o Yes, in the next 6 months (Contemplation=stage 2) o No, I do not plan on it or have not thought about it (Precontemplation=stage 1)
2. Do you currently eat fried foods such as fried chicken, fish or French fries?
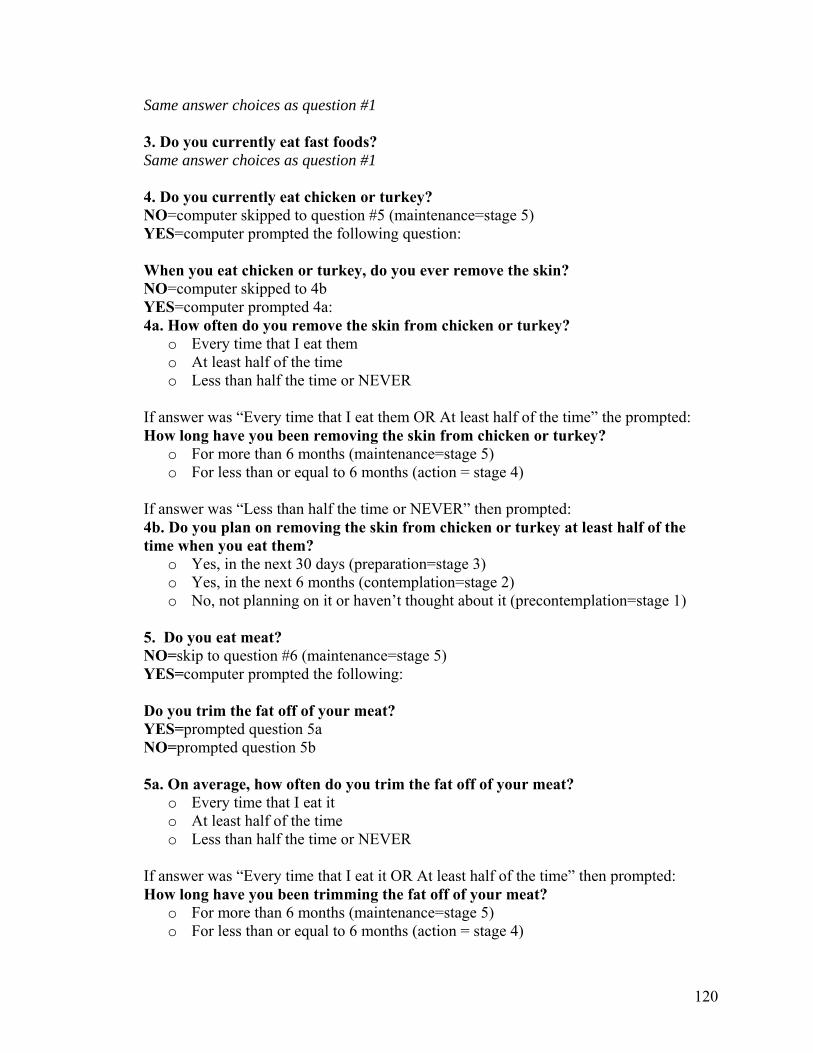
120
Same answer choices as question #1 3. Do you currently eat fast foods? Same answer choices as question #1 4. Do you currently eat chicken or turkey? NO=computer skipped to question #5 (maintenance=stage 5) YES=computer prompted the following question: When you eat chicken or turkey, do you ever remove the skin? NO=computer skipped to 4b YES=computer prompted 4a: 4a. How often do you remove the skin from chicken or turkey?
o Every time that I eat them o At least half of the time o Less than half the time or NEVER
If answer was “Every time that I eat them OR At least half of the time” the prompted: How long have you been removing the skin from chicken or turkey?
o For more than 6 months (maintenance=stage 5) o For less than or equal to 6 months (action = stage 4)
If answer was “Less than half the time or NEVER” then prompted: 4b. Do you plan on removing the skin from chicken or turkey at least half of the time when you eat them?
o Yes, in the next 30 days (preparation=stage 3) o Yes, in the next 6 months (contemplation=stage 2) o No, not planning on it or haven’t thought about it (precontemplation=stage 1)
5. Do you eat meat? NO=skip to question #6 (maintenance=stage 5) YES=computer prompted the following: Do you trim the fat off of your meat? YES=prompted question 5a NO=prompted question 5b 5a. On average, how often do you trim the fat off of your meat?
o Every time that I eat it o At least half of the time o Less than half the time or NEVER
If answer was “Every time that I eat it OR At least half of the time” then prompted: How long have you been trimming the fat off of your meat?
o For more than 6 months (maintenance=stage 5) o For less than or equal to 6 months (action = stage 4)
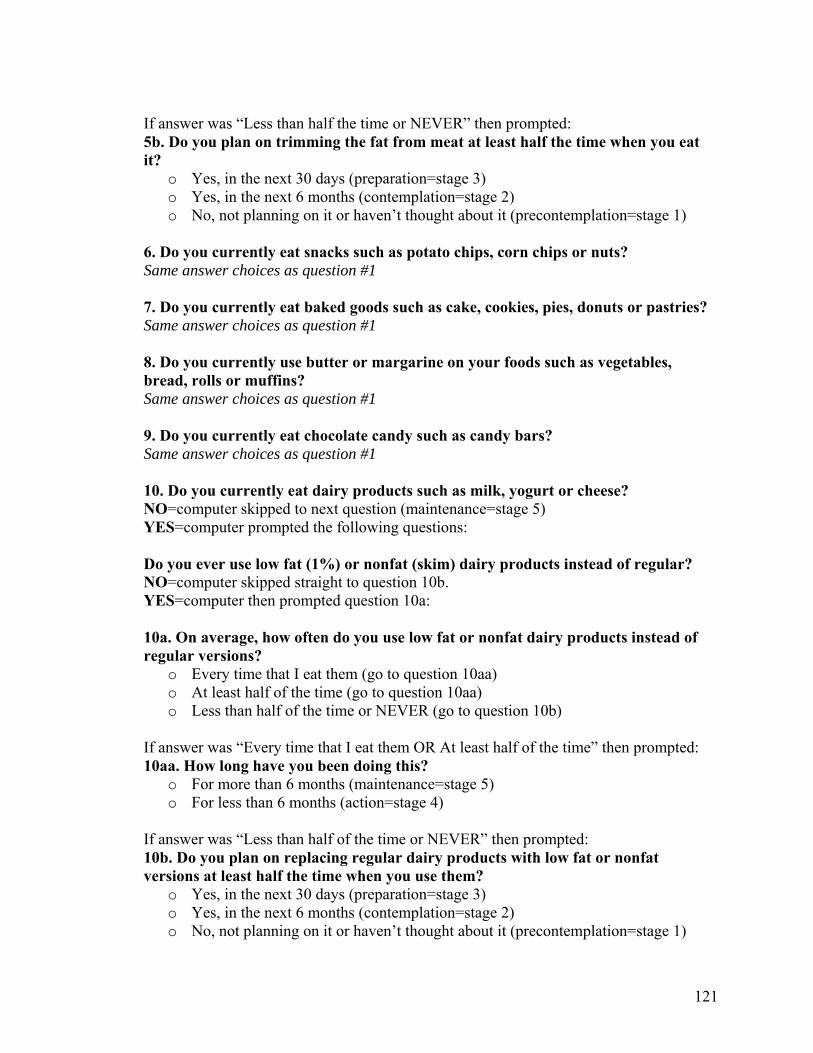
121
If answer was “Less than half the time or NEVER” then prompted: 5b. Do you plan on trimming the fat from meat at least half the time when you eat it?
o Yes, in the next 30 days (preparation=stage 3) o Yes, in the next 6 months (contemplation=stage 2) o No, not planning on it or haven’t thought about it (precontemplation=stage 1)
6. Do you currently eat snacks such as potato chips, corn chips or nuts? Same answer choices as question #1 7. Do you currently eat baked goods such as cake, cookies, pies, donuts or pastries? Same answer choices as question #1 8. Do you currently use butter or margarine on your foods such as vegetables, bread, rolls or muffins? Same answer choices as question #1 9. Do you currently eat chocolate candy such as candy bars? Same answer choices as question #1 10. Do you currently eat dairy products such as milk, yogurt or cheese? NO=computer skipped to next question (maintenance=stage 5) YES=computer prompted the following questions: Do you ever use low fat (1%) or nonfat (skim) dairy products instead of regular? NO=computer skipped straight to question 10b. YES=computer then prompted question 10a: 10a. On average, how often do you use low fat or nonfat dairy products instead of regular versions?
o Every time that I eat them (go to question 10aa) o At least half of the time (go to question 10aa) o Less than half of the time or NEVER (go to question 10b)
If answer was “Every time that I eat them OR At least half of the time” then prompted: 10aa. How long have you been doing this?
o For more than 6 months (maintenance=stage 5) o For less than 6 months (action=stage 4)
If answer was “Less than half of the time or NEVER” then prompted: 10b. Do you plan on replacing regular dairy products with low fat or nonfat versions at least half the time when you use them?
o Yes, in the next 30 days (preparation=stage 3) o Yes, in the next 6 months (contemplation=stage 2) o No, not planning on it or haven’t thought about it (precontemplation=stage 1)

122
11. Do you use regular salad dressing, gravy or mayonnaise? Same answer choices as question #1 12. Do you currently eat ice cream or other frozen desserts? Same answer choices as question #1 FINAL STAGE for Dietary Fat = sixth lowest stage of 12 stages when they are put in rank order
Section 2 FRUITS AND VEGETABLES A serving of fruit or vegetable equals:
• ½ cup of cooked, canned or raw fruit or vegetables (the size of ½ of a baseball) OR
• 1 cup of raw, leafy greens such as lettuce OR • 1 medium piece of fruit or vegetable (the size of a tennis ball) OR • ¼ cup of dried fruit such as raisins (the size of a golf ball) OR • ¾ cup (6 fl oz) of 100% fruit or vegetable juice
Think about your breakfast, lunch, dinner and snacks. On average, how many servings do you eat per day of: Fruit: [drop down menu with choices of 0-10+ servings/day] Vegetables: [drop down menu with choices of 0-10+ servings/day] If total ≥ 5 servings per day then computer prompted: How long have you been eating this many fruits and vegetables? Answer options: More than 6 months (maintenance=stage 5) Less than 6 months (action=stage 4) If total < 5 servings per day then computer prompted: Do you plan on increasing your fruits and vegetables to at least 5 servings per day? Yes, in the next 30 days (preparation=stage 3) Yes, in the next 6 months (contemplation=stage 2) No (precontemplation=stage 1)
Section 3 EXERCISE Exercise includes activities such as physical training (PT), calisthenics, full court basketball, flag football, road marching, brisk walking, jogging, swimming, aerobic dancing, biking, rowing etc.

123
Activities that would NOT be considered exercise include police call, softball, rifle range, bowling or playing golf with a golf cart. 1. Do you currently exercise for at least 5 days a week for at least 30 minutes total each day?
o Yes, I have been for more than 6 months (maintenance= “current” stage 5) o Yes, I have been for less than or equal to 6 months (action= “current” stage 4) o No, but I do exercise some, but not 5 days a week for at least 30 minutes each
time (preparation= “current” stage 3) o No, but I am planning on starting in the next 6 months (contemplation= “current”
stage 2) o No, I am not intending to or had not thought about it (precontemplation=
“current” stage 1) 2. Are you currently required to do PT with your unit?
o No=computer skipped to PORTION CONTROL section and no “prior”stage was determined
o Yes, 1-3 times per week=computer skipped to PORTION CONTROL section and no “prior”stage was determined
o Yes, 4-5 times per week= go to question #3 to determine prior stage o Yes, more than 5 times per week=go to question #3 to determine prior stage
3. Prior to mandatory exercise/PT enforced by your unit, did you exercise for at least 5 days a week for at least 30 minutes each day? Yes, I was doing this for more than 6 months (maintenance= “prior” stage 5) Yes, I was doing this for less than or equal to 6 months (action = “prior” stage 4) No, but I did exercise some but not 5 days a week for at least 30 minutes each time (preparation = “prior” stage 3) No, but I was planning on starting in the next 6 months (contemplation = “prior” stage 2) No, I was not thinking to or have not thought about it (precontemplation = “prior” stage 1)
Section 4 PORTION CONTROL Think about your eating habits and how you control your portion sizes. Note: “MOST” = 4 of the 7 days of the week 1. During most days of the week, do you control the amount of food that you eat by taking at least 20 minutes to eat each meal?
o Yes, I have been doing this for more than 6 months (maintenance=stage 5) o Yes, I have been doing this for less than 6 months (action=stage 4) o No, but I am planning on starting in the next 30 days (preparation=stage 3) o No, but I am planning on starting in the next 6 months (contemplation=stage 2) o No, I am not planning on it or have not thought about it (precontemplation=stage
1)

124
2. During most days of the week, do you control the amount of food that you eat by stopping eating when you feel full each time you eat? Same answer choices as question #1 3. During most days of the week, do you control the amount of food that you eat by avoiding eating when you are feeling nervous, stressed, depressed or upset? Same answer choices as question #1 4. During most days of the week, do you control the amount of food that you eat by saying “no” to second helpings at each meal? Same answer choices as question #1 5. During most days of the week, do you control the amount of food that you eat by drinking a glass of water before each meal? Same answer choices as question #1 6. During most days of the week, do you control the amount of food that you eat by saying “no” to second helpings at each meal? Same answer choices as question #1 7. During most days of the week, do you control the amount of food that you eat by writing down everything you eat during the day? Same answer choices as question #1 8. During most days of the week, do you control the amount of food that you eat by avoiding buffet style eating? Same answer choices as question #1 9. During most days of the week, do you control the amount of food that you eat by buying smaller portions of foods at the grocery store? Same answer choices as question #1 FINAL STAGE for Portion Control = Median stage (or 5th lowest stage) calculated from of all stages from above questions
Section 5 BEVERAGES Think about your daily intake of the following beverages.
• Alcohol (beer, wine, wine cooler, mixed drink, liquor etc.) • Regular soft drinks (such as Pepsi, Coke, Mountain Dew, Sprite etc.) • Regular sweetened iced tea • Sports drinks (such as Gatorade, PowerAde etc.) • Fruit flavored drinks (such as lemonade, fruit punch, Kool-Aid, regular Snapple,
Sobe etc.)

125
• Fruit juice (such as orange, apple, grape, etc.) • Coffee drinks (such as regular latte, mocha etc.) • Other sweetened drinks (such as Red Bull energy drink, non-alcoholic mixed
drinks etc.) 1. Do you currently drink alcohol? NO=computer skipped to next question in section YES=computer prompted question: On average, how often do you usually drink [beverage name]? Drop down menu provided options:
o 2+ times per day 1 time per day o 4-6 times per week o 1-3 times per week o Less than 1 time per week
(Corresponding calories for selection were calculated based on each frequency and table below) 2. Do you currently drink regular soft drinks? Same answer options as #1 but corresponding calories may differ 3. Do you currently drink regular sweetened iced tea? Same answer options as #1 but corresponding calories may differ 4. Do you currently drink sports drinks (NOT counting sports waters such as Propel)? Same answer options as #1 but corresponding calories may differ 5. Do you currently drink fruit flavored drinks? Same answer options as #1 but corresponding calories may differ 6. Do you currently drink fruit juice? Same answer options as #1 but corresponding calories may differ 7. Do you currently drink coffee drinks? Note: Coffee without sugar does not count. Same answer options as #1 but corresponding calories may differ 8. Do you currently drink other sweetened drinks? Same answer options as #1 but corresponding calories may differ Computer calculated calories based on answers above and table below: Beverage (Average calories per serving)
2+ times per day
1 time per day
4-6 times per week
1-3 times per week
Less than 1 time per week
Alcohol (150 kcal) 300 kcal 150 kcal 107 kcal 43 kcal 0 Regular Soft Drinks (150 kcal) 300 kcal 150 kcal 107 kcal 43 kcal 0 Regular Sweetened Tea (100 kcal) 200 kcal 100 kcal 71 kcal 29 kcal 0 Sports Drinks (120 kcal) 240 kcal 120 kcal 85 kcal 34 kcal 0

126
Fruit Flavored Drinks (120 kcal) 240 kcal 120 kcal 85 kcal 34 kcal 0 Fruit Juice (120 kcal) 240 kcal 120 kcal 85 kcal 34 kcal 0 Coffee Drinks (250 kcal) 500 kcal 250 kcal 178 kcal 71 kcal 0 Other Specialty Drinks (110 kcal) 220 kcal 110 kcal 79 kcal 31 kcal 0 FINAL STAGE for Beverages = If average daily calories <250 calories/day then computer prompted: How long have you been limiting these beverages in your diet?
o For more than 6 months (maintenance=stage 5) o For less than 6 months (action=stage 4)
If average daily calories ≥ 250 calories/day then computer prompted: Do you plan on decreasing the amount of these beverages to less than 24 fl oz total per day?
o Yes, in the next 30 days (preparation=stage 3) o Yes, in the next 6 months (contemplation=stage 2) o No, do not plan on it or haven’t thought about it (precontemplation=stage 1)
END OF SURVEY “You have completed all of the questions for your Nutrition and Fitness Prescription. Press the “Previous” button to review your questions, or Press “Finish” to proceed to the results. Overall Final Stages Provided to Dietitian and Study Coordinator Only: Stages of Change Profile for Weight Control Behaviors
Portion Control
Beverages Dietary Fat Fruits and Vegetables
Exercise
Stage # Stage # Stage # Stage # Current-stage # Previous-stage #
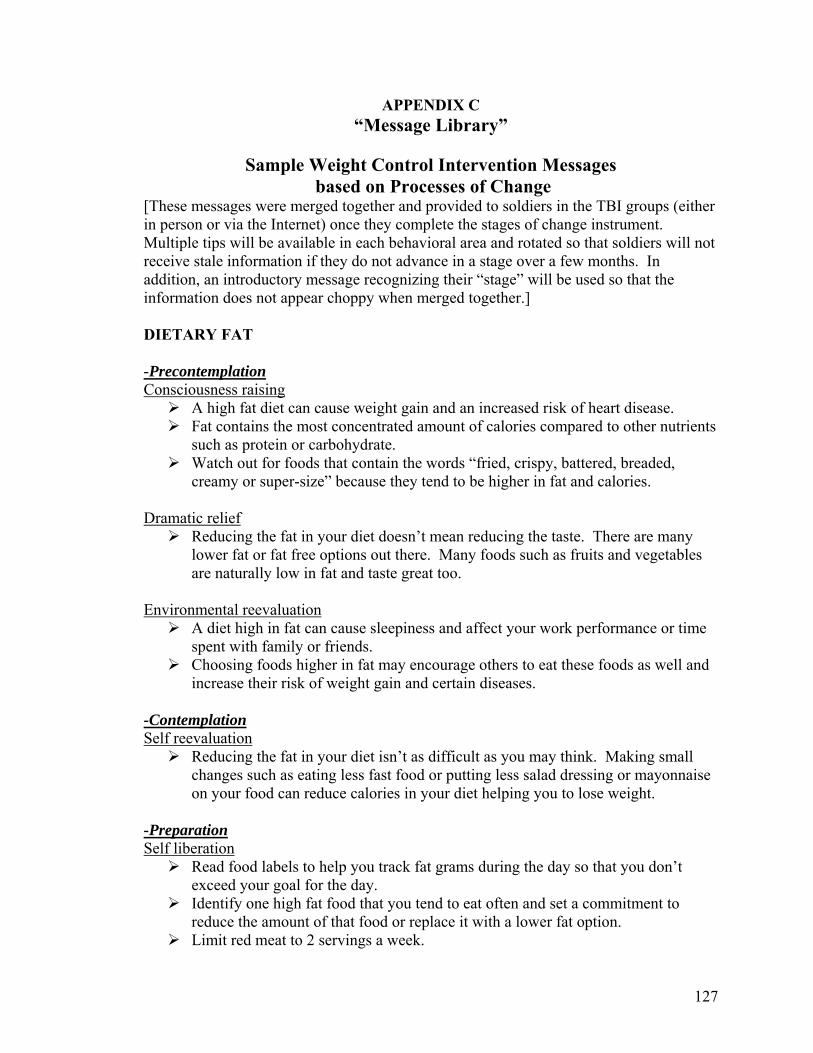
127
APPENDIX C “Message Library”
Sample Weight Control Intervention Messages
based on Processes of Change [These messages were merged together and provided to soldiers in the TBI groups (either in person or via the Internet) once they complete the stages of change instrument. Multiple tips will be available in each behavioral area and rotated so that soldiers will not receive stale information if they do not advance in a stage over a few months. In addition, an introductory message recognizing their “stage” will be used so that the information does not appear choppy when merged together.] DIETARY FAT -Precontemplation Consciousness raising
A high fat diet can cause weight gain and an increased risk of heart disease. Fat contains the most concentrated amount of calories compared to other nutrients
such as protein or carbohydrate. Watch out for foods that contain the words “fried, crispy, battered, breaded,
creamy or super-size” because they tend to be higher in fat and calories.
Dramatic relief Reducing the fat in your diet doesn’t mean reducing the taste. There are many
lower fat or fat free options out there. Many foods such as fruits and vegetables are naturally low in fat and taste great too.
Environmental reevaluation
A diet high in fat can cause sleepiness and affect your work performance or time spent with family or friends.
Choosing foods higher in fat may encourage others to eat these foods as well and increase their risk of weight gain and certain diseases.
-Contemplation Self reevaluation
Reducing the fat in your diet isn’t as difficult as you may think. Making small changes such as eating less fast food or putting less salad dressing or mayonnaise on your food can reduce calories in your diet helping you to lose weight.
-Preparation Self liberation
Read food labels to help you track fat grams during the day so that you don’t exceed your goal for the day.
Identify one high fat food that you tend to eat often and set a commitment to reduce the amount of that food or replace it with a lower fat option.
Limit red meat to 2 servings a week.

128
-Action Counterconditioning
Include an “Instead of” lists with substitute suggestions Try substituting lower fat dairy products, salad dressing, mayonnaise, sour cream
for regular versions. Use lemon, a small amount of vinegar and oil or low fat salad dressing instead of
regular salad dressing. Choose a side salad or a grilled chicken sandwich instead of higher fat items such
as French fries, hamburger or fried chicken if you eat fast food. Helping relationships
Encourage other family members and friends to eat lower fat foods and meals with you. It will provide you with support and help everyone eat healthy.
Purchase a low fat cookbook for the cook in your family or yourself to help make
small changes during meal preparation. Reinforcement management
Reward yourself with new clothes, music or something you enjoy (non food related) when meeting your goal of eating lower fat. You deserve it!
Stimulus control
Keep higher fat snacks (such as potato chips and corn chips) and foods (such as ice cream, doughnuts, cookies other desserts) out of sight and only purchase them in small amounts or packages if at all. Instead, be sure to stock up on lower fat foods such as fruits or vegetables and make them easy to access.
If you are craving a favorite high fat food or snack, eat just a small portion to satisfy your taste and then put the food out of site.
-Maintenance (will use some Action tips to prevent relapse): FRUITS & VEGETABLES -Precontemplation Consciousness raising
A diet high in fruits and vegetables can help with weight loss and reduce your risk of high blood pressure and cancer.
Fruits and vegetables are rich sources of vitamins and minerals and are naturally low in fat and calories.
Fruits and vegetables are high in fiber and can help you feel full faster. Produce for better health information on why to eat 5 A day
http://www.5aday.com/html/colorway/colorway_home.php

129
Dramatic relief There is a wide variety of fruits and vegetables available for a variety of tastes.
Fruits and vegetables don’t have to be boring or bland—try a low fat yogurt based dip on the side.
A diet with plenty of fruits and vegetables can help boost your immune system and possibly prevent you from becoming sick.
Environmental reevaluation
Not keeping your home or work stocked with fruits and vegetables will prevent others from enjoying the benefits of a diet high in fruits and vegetables as well.
-Contemplation Self reevaluation
Eating five fruits and vegetables each day is easier than you think. Choosing a fruit for breakfast and a snack and a vegetable during lunch and dinner can help you achieve this goal without much effort.
-Preparation Self liberation
Set a weekly goal to gradually increase the number of fruits and/or vegetables that you eat. Your ultimate goal should be to eat at least 5 fruits and vegetables each day. Start slowly with adding a fruit and vegetable to one of your meals or snacks.
Try eating one vegetarian (no meat) meal each day. Reconstruct your plate when eating so that at least half of it contains vegetables or
fruit. -Action Counterconditioning
Cut up or keep cut-up fruits and vegetables in your refrigerator for quick and easy snacks instead of other high fat snacks such as potato or corn chips.
Some fruits are easy to take with you on the run such as bananas, apples and grapes for quick snacks instead of fast food or snacks from a vending machine.
Include an “Instead of” lists with substitute suggestions Try eating a sliced apple instead of apple pie. Add fresh or frozen berries to frozen yogurt instead of eating ice cream. Sneak vegetables into recipes (soup, chili, pasta) or on sandwiches or salad.
Helping relationships
Involve your family and friends in your goal to eating fruits and vegetables during the day. If you have children, have them help you prepare fruits and vegetables snacks. Encourage your friends to eat more fruits and vegetables as well so they can enjoy the benefits too.

130
Stimulus control Pack your lunch every day or a few days a week instead of eating out at work to
ensure that you include at least one fruit and/or vegetable. Do your own grocery shopping to ensure that you purchase plenty of fruits and
vegetables for the week so that they are readily available for you to eat.
-Maintenance (use some Action tips) PORTION CONTROL -Precontemplation Consciousness raising
Foods purchased at restaurants tend to contain more than one serving and can contribute excess calories to your diet.
Eating too fast can cause you to eat more food than you typically would if you took 20 minutes to eat your meal. This can add calories to your diet and make it difficult to lose weight.
Eating second helpings or always cleaning your plate can make you feel bloated and uncomfortable and can cause additional weight gain.
Dramatic relief
Losing weight doesn’t mean eliminating all of your favorite foods. All foods can fit in your diet, some may need to be in moderation.
Learn to identify the difference between true hunger (needing to eat) and appetite (wanting to eat). If you have a craving or “appetite” for something, you can still eat that food but just a taste or a small amount.
Environmental reevaluation
Eating larger portions could cause others to eat more too and possibly contribute to weight gain.
Eating on the run or in a hurry takes away quality time from enjoying a meal with friends and family. Instead, plan at least 20 minutes to eat a meal.
-Contemplation Self reevaluation
Binge eating or eating large amounts of food at one time or too fast can not only make you feel uncomfortable and disappointed in yourself but can also cause weight gain. Learning to eat slowly and plan your meals ahead of time can help you from overeating.
-Preparation Self liberation
Set a goal to take at least 20 minutes to eat a meal. Drink a glass of water before meals to help you feel full faster.

131
Eat a snack before you go grocery shopping so that you’re not hungry and purchase more food or foods that are higher in calories.
Purchase a kitchen scale and start weighing your food to help track your portions.
-Action Counterconditioning
Get up a few minutes earlier to provide time to eat a small breakfast rather than eating on the run or not eating breakfast at all. Eating breakfast can help prevent you from overeating later in the day.
Be sure to eat at least 3 meals a day so that you do not become too hungry and overeat. Frequent, smaller meals with snacks are better than eating 2-3 large meals.
Helping relationships
Split an entrée with a friend when eating out to help cut back on portion sizes. Learn to politely refuse high calorie foods and beverages at parties or special
events. Let you friends and family know about you new lifestyle changes so they can help you achieve your goals.
Stimulus control
Turn the TV off during dinner time to give yourself quiet time to eat and prevent overeating.
Turn off your phone or schedule a lunch break to prevent interruptions during lunchtime and the possibility of rushing through lunch and eating too much food.
Use the smallest plates and bowls that you have when eating to help control portion sizes.
-Maintenance (use some Action tips) EXERCISE -Precontemplation Consciousness raising
Regular exercise can help reduce blood pressure. Regular exercise can help control appetite. Exercise increases your metabolism. Exercise can protect against heart disease and stroke. Exercise strengthens bones and tones muscles. Exercise can reduce stress and depression. Exercise increases your resistance to stress and illness. Regular exercise can help lower your “bad” (LDL) cholesterol and increase your
“good” (HDL) cholesterol.
Dramatic relief Find fun activities like canoeing, hiking or volksmarching to do with family and
friends to increase your activity level and prevent boredom.

132
Choose fitness activities you like, and that are convenient to you. Environmental reevaluation
Joining a team or exercise group, such as a softball team or a bicycling group, is a great way to have fun and encourage others to become more physically active.
-Contemplation Self reevaluation
Staying active year round can make preparing for your PT test easier. Scoring highly on your APFT can earn promotion points, and is a great bullet for
an OER or NCOER. -Preparation Self liberation
Set weekly workout goals (e.g. I will run for 30 minutes five times this week) to help you achieve your overall objective.
Sign up for a 5 or 10k race or a bicycle ride and train for the event. List ways at work to move more, such as using “smoke breaks” to walk or climb
stairs, and set a goal of doing these activities at least once each day. -Action Counterconditioning
Try going for a walk or playing your favorite sport when bored or stressed out. Incorporate exercise into your vacations by playing volleyball at the beach,
snorkeling, or hiking. Try taking the stairs instead of the elevator or escalator.
Helping relationships
Working out with a friend can help keep your motivation level up. Joining an exercise class, such as an aerobics, spinning or kickboxing, can help
motivate you to exercise regularly. Find a workout partner and set goals together. Take classes to learn a new sport like tennis, racquetball
Reinforcement management
Plan rewards for yourself after achieving fitness goals, such as buying a new CD, DVD, or clothing.
Stimulus control
Place your gym bag or running shoes by the door or in the passenger seat of your car to help encourage you to workout.
Change into your workout clothes immediately after coming home from work and don’t take them off until you have worked out.

133
-Maintenance (use some Action tips) If you find your self getting bored with your workout routine, try a new sport such
as racquetball or golf (without the cart). Join a workout class like spinning or water aerobics to decrease workout burnout

134
APPENDIX D Sample Screen Shots of A-INFO
Screen 1. Login Screen
Screen 2. Diet/Beverage Entry Screen
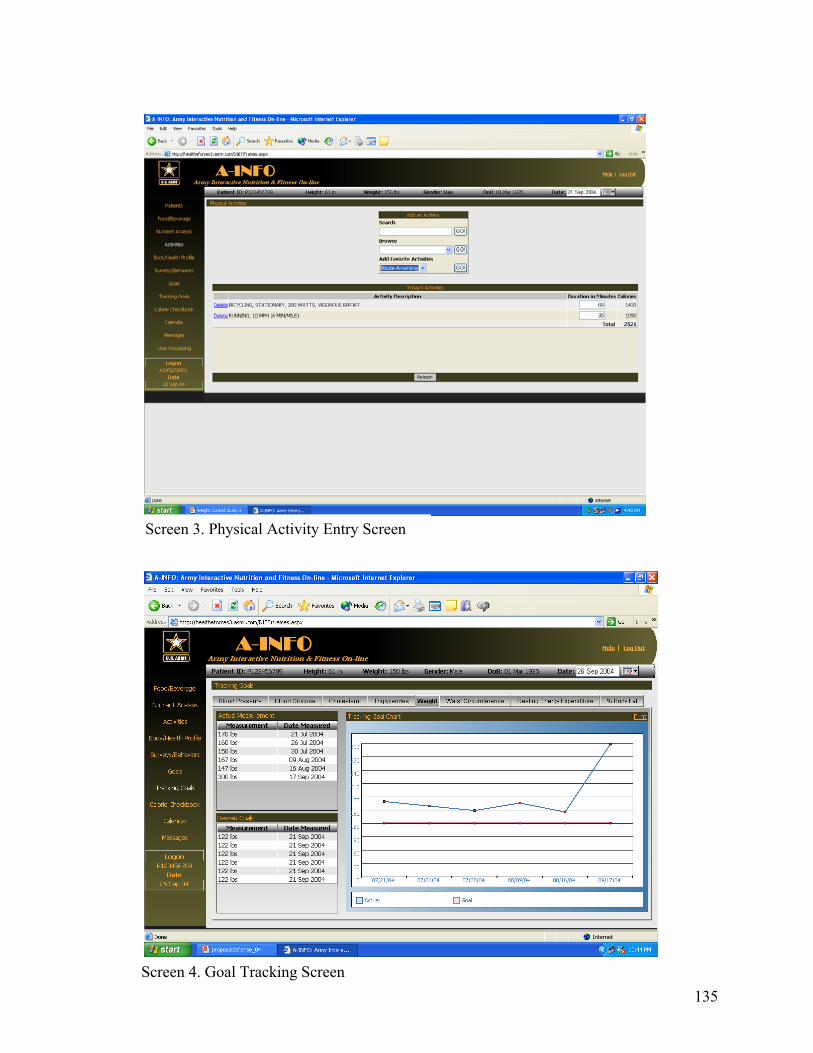
135
Screen 3. Physical Activity Entry Screen
Screen 4. Goal Tracking Screen
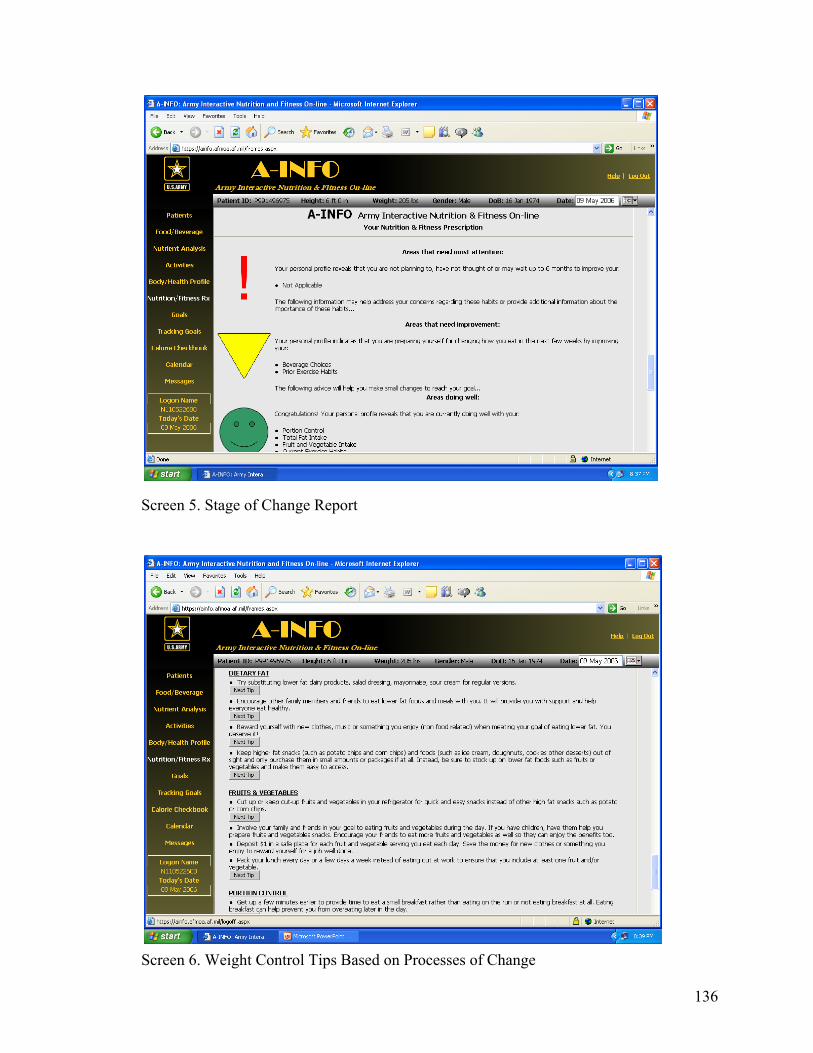
136
Screen 5. Stage of Change Report
Screen 6. Weight Control Tips Based on Processes of Change

137
Screen 7. Message Screen Between Patient and Research Dietitian

138
APPENDIX E

139

140

141
APPENDIX F SCREENING FOR ELIGIBILITY
Subject Number:____________________ Date: ___
INCLUSIONS YES NO 1. Will the subject be in the Washington D.C. Capital Area over the next 6 months?..........( ) ( )
2. Is the subject an active duty service member?......................................................................( ) ( ) 3. Does the subject have a BMI > 28?.........................................................................................( ) ( ) 4. Is the subject free of chronic diseases that may influence energy balance?........................( ) ( ) 5. Has the subject agreed to give written informed consent?....................................................( ) ( )
6. Is the subject at least 18 years of age?.....................................................................................( ) ( )
IF ANY OF THE ABOVE ARE ANSWERED NO THE SUBJECT CAN NOT ENTER THE STUDY UNLESS APPROVED BY THE PRINCIPAL INVESTIGATOR.
EXCLUSIONS
1. Does the subject have a medical condition preventing him/her from being eligible for the AWCP?.........................................................................................................................................( ) ( )
2. Is the subject taking medications and/or supplements that may affect energy balance?............................................................................................................................( ) ( ) IF ANY OF THE ABOVE ARE ANSWERED YES THE SUBJECT CAN NOT ENTER THE STUDY UNLESS APPROVED BY THE PRINCIPAL INVESTIGATOR
Comments:

142
APPENDIX G Exclusion Criteria List
List of Factors that May Affect Energy Balance
A. Herbal Supplements that may promote weight loss:
- Ephedra (stimulant) - Garcinia Cambogia (appetite suppressant) - Green tea extract (increase metabolism) - Guarana (appetite suppressant) - Bitter orange extract (CNS stimulant) - Glucomannan (Impairs fat absorption) - Starch blockers (Starch Away, Starch Buster, Carbo Grabbers) - Chitosan (impairs fat absorption) - Conjugated Linoleic Acid (alters fat metabolism) - Carnitine (alters fat metabolism) - Chromium - Pyruvate (appetite suppressant)
B. Medications that may promote weight loss - Orlistat (Xenical) - Sibutramine(Meridia) - CNS stimulants - Levothyroxine (Synthroid)
C. Medications that may promote weight gain - Antipsychotics (Phenothiazines, Butyrophenones) - Antidepressants (Elavil) - Lithium - Neuroleptics - Antiepileptics (Lithium, Valproate) - Corticosteroids (Prednisone) - Megestrol Acetate (Megace) - Insulin - Sulfonylureas
D. Medical conditions that may predispose individuals to be obese: - Hypothalamic Obesity - Cushing’s Syndrome (97%) - Hypothyroidism - Polycystic Ovary Syndrome (10-80%) - Growth Hormone Deficiency - Drug-Induced Weight Gain - Binge-Eating Disorders - Genetic Disorders (Bardet-Biedl Syndrome, Prader Willi Syndrome, Alstrom
Syndrome, Cohens Syndrome

143
APPENDIX H

144

145

146

147

148
APPENDIX I Authorization for Research Use of Protected Health Information
Protocol Title: EVALUATION OF BEHAVIORAL THEORY AND INTEGRATED INTERNET/TELEPHONE TECHNOLOGIES TO SUPPORT MILITARY OBESITY AND WEIGHT MANAGEMENT PROGRAMS Principal Investigator: LTC Veronica Thurmond, AN, PhD Work Unit #: 04-93002 The Federal Health Insurance Portability and Accountability Act (HIPAA) includes a Privacy Rule that gives special safeguards to Protected Health Information (PHI) that is identifiable, in other words, can be directly linked to you (for example, by your name, Social Security Number, birth date, etc.). We are required to advise you how your PHI will be used. 1. What information will be collected? For this research study, we will be collecting information about your diet, physical activity, weight control behaviors, personal and medical background, height, weight, waist size, body fat and lean body mass as well laboratory measurements related to weight loss. Your name, e-mail address, telephone number, and date of birth will also be collected. 2. Who may use my PHI within the Military Healthcare System? The members of the WRAMC research team will have access to your health information in order to find out if you qualify to participate in this study, to administer research treatments, to monitor your progress, and to analyze the research data. Additionally, your PHI may be made available to health oversight groups such as the WRAMC Department of Clinical Investigation and Human Use Committee. 3. What persons outside of the Military Healthcare System who are under the HIPAA requirements will receive my PHI? The Principal Investigator or designee will send your research data that is collected to the University of Maryland for analysis by a statistician; however, all personal identifiers will be removed and the identity of the data will be unknown
4. What is the purpose for using or disclosing my Protected Health Information (PHI)? The members of the WRAMC research team need to use your PHI in order to analyze the information to find out whether the weight loss therapy is effective and to relate weight loss to improvements in your blood lipids and glucose. 5. How long will the researchers keep my Protected Health Information? The WRAMC research team in the Nutrition Care Directorate will keep the research data for up to three years after the end of the study. Then all the

149
information will be destroyed. The master code will be destroyed as soon as all data collection is completed. 6. Can I review my own research information? You may look at your personal research information at any time.
7. Can I cancel this Authorization? Yes. If you cancel this Authorization, you will no longer be included in the research study. However, the information that has already been collected will be kept by the research team to assure patient safety. If you want to cancel your Authorization, please contact the Principal Investigator at (202) 782-9887. 8. What will happen if I decide not to sign this Authorization? If you decide not to sign this Authorization, you will not be able to participate in this research study. Refusal to sign this Authorization will not result in any loss of medical benefits to which you are otherwise entitled. 9. Can my Protected Health Information be disclosed to parties not included in this Authorization who are not under the HIPAA requirements? There is a potential that your research information will be shared with another party not listed in this Authorization in order to meet legal or regulatory requirements. Examples of persons who may access your PHI include representatives of the Army Clinical Investigation Regulatory Office, the Food and Drug Administration, the DHHS Office for Human Research Protections, and the DHHS Office for Civil Rights. This disclosure is unlikely to occur, but in that case, your health information would no longer be protected by the HIPAA Privacy Rule. 10. Who should I contact if I have any complaints? If you believe your privacy rights have been violated, you may file a written complaint with the WRAMC Privacy Officer, 6900 Georgia Ave., NW, Washington, DC 20307. Telephone: (202) 782-3501. The signature below acknowledges receipt of this Authorization: Signature: _____________________________ Date: ________________ If you are a parent, court-appointed representative, or acting as power of attorney, indicate your authority to act for the participant: _____________________ Print Name: _____________________________ A copy of this signed Authorization will be provided to you. 7/21/03

150
APPENDIX J A-INFO Usage Survey
You are being asked to complete this questionnaire because you have been assigned an Army Interactive Nutrition & Fitness On-line account (A-INFO).
Your answers are confidential and will remain anonymous. This information will be used to determine if Internet accounts are useful
to soldiers for weight loss. 1. On average, how often have you used your A-INFO Web site account? (please check one)
Never Less than 1 time per month 1-3 times a month 1 time per week Several times a week 1 or more times a day
2. If you have never used your account OR have used it less than once per week, what are some of the reasons why? Check all that apply.
Lack of time Forgot Problem with logging into Web site No current access to Internet A-INFO Website is difficult to use A-INFO Website is not helpful for weight loss Need more contact or feedback from nutritionist Prefer in-person feedback Other (please explain)___________________________________________________________
3. Please list any additional comments you would like to share about your A-INFO account.

151
APPENDIX K General Information (Demographic & Medical History)
Participant ID#:______________ Date:__________________ 1] Gender
Male Female
2] Date of birth
Month Day Year
3] Enter your military grade (e.g. E 2) in the boxes: 4] Which one category best describes your ethnic background?
Asian or Pacific Islander Black, not Hispanic Chicano, Latino, Hispanic Native American, Native Alaskan, Indian White, not Hispanic Other (Describe):____________________________
5] What is the highest educational level you have completed? Check one.
High school diploma, GED, or equivalent Some college but no degree Associate’s degree Bachelor’s degree Graduate or professional degree beyond a Bachelor’s degree
6] What is your current marital status? Check one.
Not married Married
7] a) What is your approximate monthly household income after taxes? Check one.
$700-$1000 $1001-$2000 $2001-$4000 $4001 or more
b) How many people are supported by this income?

152
9] Have you ever been diagnosed with any of the following health problems? NO YES
Heart disease Diabetes High blood pressure High blood cholesterol Stroke Cancer Hypo or hyperthyroidism Arthritis Other, Please Describe:______________________________________________
10] Do (did) any of your relatives have any of the health conditions listed below? YES NO→Skip to question #11 Please check all that apply. Mother Father Grandparent Sister or Brother
Heart Disease
Diabetes
High blood pressure
High blood cholesterol
Stroke
Cancer
Hypo or hyperthyroidism 11] If you are female, please answer the following questions, if not please skip to QUESTION #12 a) Are you pregnant?

153
NO YES→You have completed the survey, thank you for your time. b) Have you delivered a baby in the past 12 months? YES NO How many months ago?
c) Are you breastfeeding? YES NO 12] Are you currently taking any prescription medication(s) or drugs on a regular basis?
YES NO→Please skip to question #13 List all medicines/drugs you are currently taking, the daily dose (if known) and reason for taking. Name of medication/drug Daily dose Reason for taking 13] Are you currently taking any vitamin, mineral, herbal or other dietary supplements? YES NO→Please skip to question #14 Name or type of supplement
Brand name
Dose per tablet
# tablets taken per week
Reason for taking
14] a) Do you smoke cigarettes now?
YES NO→Please skip to #14c b) On average, how many cigarettes do you smoke per day now?
5 or fewer 6-14 15-24 25-34 35 or more

154
c) Do you consider yourself a past smoker (smoked more than 100 cigarettes in your lifetime)? YES NO→Please skip to question #14e d) When did you stop smoking?
Less than 1 year ago 1-5 years ago 6-10 years ago More than 10 years ago Not sure
e) Do you chew (dip) tobacco? YES NO→Please skip to question #15 f) How often do you chew (dip) tobacco per day?
(please enter total in boxes)
15] a) Are you currently enrolled in the Army Weight Control Program? YES NO→skip to question #16
b) Please enter the number of times you have been enrolled previously: 16] a) Have you ever tried to lose 10 pounds or more at one time? YES NO→skip to question #17 b] How would you describe the frequency of your attempts to lose 10 pounds or more at one time? Check one answer.
I am almost always trying to at 1east 10 pounds of weight I have attempted to lose 10 pounds approximately times in my life
17] a) Have you ever used the Internet?
YES NO→you have now completed the survey, thank you for your time b) On average, how many hours do you spend on the Internet per week? Enter
number of hours in boxes: Thank you for your time! You have completed the survey.

155
APPENDIX L Measured Use of A-INFO Web Account Over 3 Months (Total Usage)
Session Use Statistic*
Class + Internet Group (n=37)
Tailored + Internet Group (n=39)
All subjects assigned A-INFO account (n=76)
Mean (SD) 17 (37) 17 (30) 17 (33) Median 1 5 3 Mode 0 0 0 Range 0-173 0-161 0-173 *One session is defined as entering information into the food/beverage, activity or message section of the A-INFO site per day

156
APPENDIX M
Responses to A-INFO Web Usage Survey
Survey Question Response Option Number of Subjects
Responding* n (%)
Never 15 (28) <1 time/month 8 (15) 1-3 time/month 9 (17) 1 time/week 2 (4) Several times/week 7 (13)
On average, how often have you used your A-INFO Web site account?
1+ times/day 12 (23)
Lack of time 22 Forgot 12 Problems with login 2 No current access to Internet 3 Site was difficult to use 6 Site was not helpful 0 Needed more feedback from dietitian
3
Preferred in-person feedback 2
If you have never used your account OR have used it less than once per week, what are some of the reasons why†?
“Other” reasons: -difficulty finding exact matches for foods eaten -unable to remember assigned login/password -lost password -not learning new information
19
*Total responses on survey=53 †More than one response could be chosen per subject

157
APPENDIX N
Select Characteristics of Subjects Who Completed 3 Month Appointment Class +
In-person (n=32)
Class + Internet (n=29)
Tailored + In-person
(n=33)
Tailored + Internet (n=29)
Overall
(n=123) Age (yrs) 32.3 (6.8) 35.9 (11.0) 33.4 (7.9) 33.3 (9.2) 33.7 (8.8) Height (cm) 173.4 (11.1) 172.5 (10.1) 170.0 (8.7) 174.6 (9.9) 172.5 (10.0) Weight (kg) 95.3 (18.1) 97.2 (14.8) 91.0 (14.3) 98.6 (16.9) 95.4 (16.2) Body Mass Index (kg/m2) 31.2 (3.0) 32.6 (3.2) 31.4 (3.4) 32.1 (3.1) 31.2 (3.2) Waist Circumference (cm) 39.6 (3.7) 40.0 (4.0) 39.7 (3.9) 40.2 (4.1) 39.9 (3.9) Body Fat Total (kg) Percent body fat (%)
29.0 (5.9) 31.2 (5.6)
31.4 (5.4) 33.2 (6.3)
30.1 (7.1) 33.5 (6.2)
29.0 (6.7) 30.0 (5.0)
29.9 (6.3) 32.0 (5.9)
Lean Body Mass (kg) 62.0 (14.1) 61.6 (13.1) 57.1 (10.4) 65.2 (12.5) 61.3 (12.8) Education Level (yrs) 14.6 (1.8) 14.9 (2.1) 14.4 (1.9) 14.7 (1.7) 14.6 (1.9) Gender, n (%) Female Male
10 (31) 22 (69)
13 (45) 16 (55)
16 (48) 17 (52)
9 (31)
20 (69)
48 (39) 75 (61)
Race/Ethnicity, n (%) White Black Other
17 (53) 11 (34) 4 (13)
13 (45) 14 (48)
2 (7)
16 (48) 10 (30 7 (21)
17 (59) 7 (24) 5 (17)
63 (51) 42 (34) 18 (15)
Married, n (%) 21 (66) 14 (48) 21 (64) 16 (55) 72 (59) Current Smoker, n (%) 7 (22) 2 (7) 2 (6) 5 (17) 16 (13) Enrolled in AWCP, n (%) 23 (72) 14 (48) 18 (55) 16 (55) 71 (58) Select Characteristics of Subjects Who Dropped Out Before 3 Month Appointment Class +
In-person (n=11)
Class + Internet (n=14)
Tailored + In-person
(n=10)
Tailored + Internet (n=14)
Overall
(n=49) Age (yrs) 32.2 (8.7) 28.9 (6.1) 33.4 (9.9) 32.7 (8.3) 31.6 (8.2) Height (cm) 175.1 (8.8) 175.3 (10.3) 175.3 (9.6) 171.8 (10.3) 174.3 (9.7) Weight (kg) 96.5 (13.8) 100.0 (21.3) 103.1 (19.1) 93.2 (15.8) 97.9 (17.7) Body Mass Index (kg/m2) 31.4 (2.5) 32.2 (4.1) 33.3 (3.7) 31.4 (2.7) 32.0 (3.3) Waist Circumference (cm) 39.8 (2.7) 41.4 (4.5) 41.3 (5.7) 39.5 (3.6) 40.5 (4.2) Body Fat Total (kg) Percent body fat (%)
28.9 (2.4) 30.9 (5.3)
29.2 (6.7) 30.7 (4.8)
30.7 (10.0) 30.0 (6.1)
29.8 (6.7) 32.8 (6.4)
29.6 (6.6) 31.2 (5.6)
Lean Body Mass (kg) 63.5 (13.5) 62.9 (11.4) 67.7 (12.1) 58.9 (12.0) 62.9 (12.2) Education Level (yrs) 13.9 (1.9) 13.9 (1.6) 13.7 (1.6) 13.4 (1.2) 13.7 (1.5) Gender, n (%) Female Male
3 (27) 8 (73)
3 (21)
11 (79)
2 (20) 8 (80)
7 (50) 7 (50)
15 (31) 34 (69)
Race/Ethnicity, n (%) White Black Other
5 (45.5) 5 (45.5)
1 (9)
8 (57)
1 (7) 5 (36)
3 (30) 6 (60) 1 (10)
5 (36) 7 (50) 2 (14)
21 (43) 19 (39) 9 (18)
Married, n (%) 8 (73) 12 (86) 8 (80) 7 (50) 35 (71) Current Smoker, n (%) 2 (18) 6 (43) 2 (20) 2 (14) 12 (25) Enrolled in AWCP, n (%) 6 (55) 10 (71) 6 (60) 9 (64) 31 (63) Numerical values are expressed as mean (SD). Because of rounding, categorical percentages may not add to 100.

158
APPENDIX O Select Characteristics of Subjects Who Completed 6 Month Appointment Class +
In-person (n=16)
Class + Internet (n=17)
Tailored + In-person
(n=18)
Tailored + Internet (n=15)
Overall
(n=66) Age (yrs) 32.5 (6.3) 36.3 (9.7) 34.1 (7.7) 36.2 (9.0) 34.8 (8.2) Height (cm) 172.3 (13.8) 175.0 (9.3) 168.2 (8.8) 177.1 (8.0) 172.9 (10.5) Weight (kg) 92.2 (18.5) 99.3 (16.0) 88.1 (14.1) 103.8 (11.1) 95.6 (16.1) Body Mass Index (kg/m2) 30.7 (2.7) 32.4 (3.7) 30.9 (2.9) 33.1 (2.2) 31.7 (3.0) Waist Circumference (cm) 39.1 (3.6) 40.3 (3.8) 38.8 (3.2) 40.7 (2.6) 39.7 (3.4) Body Fat Total (kg) Percent body fat (%)
27.6 (5.8) 30.7 (5.1)
31.7 (5.9) 32.6 (5.4)
29.8 (7.3) 34.1 (6.1)
28.9 (5.0) 28.3 (4.8)
29.5 (6.2) 31.6 (5.7)
Lean Body Mass (kg) 60.5 (14.1) 63.4 (12.8) 54.5 (9.8) 70.2 (9.6) 61.8 (12.8) Education Level (yrs) 14.7 (1.9) 15.3 (2.0) 14.7 (1.8) 15.0 (1.6) 14.9 (1.8) Gender, n (%) Female Male
5 (31)
11 (69)
7 (41)
10 (59)
10 (56) 8 (44)
3 (20)
12 (80)
25 (38) 41 (62)
Race/Ethnicity, n (%) White Black Other
10 (63) 4 (25) 2 (12)
8 (47) 8 (47)
1 (6)
9 (50) 4 (22) 5 (28)
9 (60) 4 (27) 2 (13)
36 (55) 20 (30) 10 (15)
Married, n (%) 11 (69) 9 (53) 13 (72) 10 (67) 43 (65) Current Smoker, n (%) 4 (25) 1 (6) 1 (6) 2 (13) 8 (12) Enrolled in AWCP, n (%) 12 (75) 10 (59) 10 (56) 6 (40) 38 (58) Select Characteristics of Subjects Who Dropped Out Before 6 Month Appointment Class +
In-person (n=27)
Class + Internet (n=26)
Tailored + In-person
(n=25)
Tailored + Internet (n=28)
Overall
(n=106) Age (yrs) 32.1 (7.9) 31.7 (10.3) 32.9 (8.9) 31.5 (8.3) 32.0 (8.7) Height (cm) 174.7 (8.1) 172.5 (10.8) 173.1 (9.0) 171.9 (10.6) 173.0 (9.6) Weight (kg) 97.7 (16.0) 97.3 (17.9) 97.9 (16.5) 93.1 (18.0) 96.4 (17.0) Body Mass Index (kg/m2) 31.8 (2.9) 32.5 (3.5) 32.5 (3.8) 31.2 (3.2) 32.0 (3.3) Waist Circumference (cm) 40.0 (3.4) 40.5 (4.5) 41.0 (4.8) 39.6 (4.5) 40.2 (4.3) Body Fat Total (kg) Percent body fat (%)
29.8 (4.6) 31.4 (5.7)
30.1 (5.8) 32.4 (6.3)
30.6 (8.2) 31.6 (6.4)
29.4 (7.4) 32.2 (5.5)
30.0 (6.6) 31.9 (5.9)
Lean Body Mass (kg) 63.5 (13.7) 61.0 (12.4) 63.2 (11.6) 59.3 (12.4) 61.7 (12.5) Education Level (yrs) 14.2 (1.8) 14.0 (1.8) 13.8 (1.7) 13.9 (1.6) 14.0 (1.7) Gender, n (%) Female Male
8 (30)
19 (70)
9 (35)
17 (65)
8 (32)
17 (68)
13 (46) 15 (54)
38 (36) 68 (64)
Race/Ethnicity, n (%) White Black Other
12 (44) 12 (44) 3 (11)
13 (50) 7 (27) 6 (23)
10 (40) 12 (48) 3 (12)
13 (46) 10 (36) 5 (18)
48 (45) 41 (39) 17 (16)
Married, n (%) 18 (67) 17 (65) 16 (64) 13 (46) 64 (60) Current Smoker, n (%) 5 (18) 7 (27) 3 (12) 5 (18) 20 (19) Enrolled in AWCP, n (%) 17 (63) 14 (54) 14 (56) 19 (68) 64 (60) Numerical values are expressed as mean (SD). Because of rounding, categorical percentages may not add to 100.

APPENDIX P
ID Group Visit Gender Age Ethnicity EdLevel Married Smoker Tobacco DietHx Height Weight D001 4 1 F 24 Black 16 no no 0 1 162.77 70.55D002 4 1 F 20 Black 12 no no 0 0 161.29 85.2D003 4 1 M 23 Black 13 no no 0 0 188.11 128.35B004 2 1 M 32 Black 12 yes no 0 0 175.6 102A005 1 1 F 24 White 14 no yes 0 1 164.53 77.85C006 3 1 M 44 Other 17 yes no 0 1 177.49 100.95D007 4 1 M 24 White 13 yes no 1 1 192.02 120.9D008 4 1 F 24 Black 13 no no 0 1 161.03 78.95D009 4 1 M 24 White 13 yes yes 0 1 186.3 123.59D010 4 1 M 41 White 14 yes no 0 1 179.34 112.65B011 2 1 M 31 Other 14 yes no 0 1 185.02 110.5A012 1 1 M 38 Black 13 no no 0 1 167.68 90.8A013 1 1 M 21 White 12 yes yes 0 1 171.3 81.1B014 2 1 F 28 Black 17 yes no 0 1 171.39 82.55A015 1 1 M 39 White 17 yes no 0 1 182.73 105.5C016 3 1 M 39 White 16 yes no 0 0 173.02 89.93B017 2 1 F 32 White 16 no no 0 0 172.52 93.47C018 3 1 M 36 White 12 yes no 0 1 176.94 90.87C019 3 1 M 28 White 13 yes no 1 1 173.25 84.15C020 3 1 F 25 Black 13 no no 0 1 159.91 74.34D021 4 1 M 46 White 16 yes no 0 1 170.99 90.8C022 3 1 F 28 White 14 yes yes 0 0 155.19 63.65B023 2 1 M 41 White 14 yes no 0 1 180.47 125.7B024 2 1 F 38 White 16 no no 0 1 166.49 81.57B025 2 1 F 41 Black 14 no no 0 1 158.77 100.32D026 4 1 M 24 White 13 no no 0 0 181.3 108D027 4 1 F 29 White 17 yes no 0 1 167.67 84.3C028 3 1 M 23 Other 13 yes no 0 1 175.87 100C029 3 1 M 37 White 16 yes no 0 1 176.55 96.5B030 2 1 F 21 White 12 no yes 0 1 161.27 74.1A031 1 1 M 44 White 17 yes no 1 1 183.24 110.9

ID Group Visit Gender Age Ethnicity EdLevel Married Smoker Tobacco DietHx Height Weight C032 3 1 M 51 Black 13 yes no 0 1 184.05 138.36A033 1 1 M 40 White 17 yes no 0 1 183.31 121.8C034 3 1 F 37 White 13 yes no 0 1 167.39 77.68A035 1 1 M 28 Black 13 yes yes 0 1 185.93 118B036 2 1 M 37 White 13 yes no 0 1 167.32 80.2A037 1 1 M 34 White 16 yes no 0 0 172.71 91.59A038 1 1 F 20 Other 12 no yes 0 1 149 57.43B039 2 1 M 25 Other 13 yes no 0 1 183.55 106.47A040 1 1 M 35 Black 13 yes no 0 1 178.3 92.27D041 4 1 M 28 Black 16 yes no 0 1 170.1 99.43B042 2 1 F 27 Other 13 yes yes 0 1 152.27 67.15A043 1 1 M 24 White 13 no no 0 1 176.2 93.9C044 3 1 M 34 White 13 yes no 0 0 186 118.1C045 3 1 F 45 Black 13 no no 0 1 166.62 97D046 4 1 F 50 White 17 yes no 0 1 159.15 72.2A047 1 1 M 25 Black 12 yes no 0 0 172.8 96.75C048 3 1 F 32 Black 16 yes no 0 1 162.56 82.15B049 2 1 F 35 Other 14 no no 0 1 156.7 87.7A050 1 1 M 36 White 12 yes no 0 0 176.27 91.54B051 2 1 M 26 White 12 yes no 0 1 181.1 102.45C052 3 1 M 30 Black 13 yes no 0 0 183.04 113.13C053 3 1 M 38 White 17 yes no 0 1 189.98 112.15D054 4 1 M 43 White 16 yes no 0 1 175.6 102.13C055 3 1 F 46 Black 13 no no 0 0 167.43 86.5D056 4 1 M 58 White 16 no no 0 1 182.47 103.35D057 4 1 M 27 White 17 yes no 0 0 188.93 109.5B058 2 1 M 21 White 13 yes no 0 . 179.3 106.5D059 4 1 M 40 White 13 yes no 1 1 185.42 106.5B060 2 1 M 21 White 12 no no 0 1 178.63 110.32B061 2 1 M 39 Black 17 yes no . 0 193.17 127.32B062 2 1 F 57 White 17 no no 0 0 161.67 79A063 1 1 M 29 White 17 yes no 0 0 182.9 100.5

ID Group Visit Gender Age Ethnicity EdLevel Married Smoker Tobacco DietHx Height Weight B064 2 1 F 26 Black 16 no no 0 1 173.48 90.18A065 1 1 M 34 Black 13 yes no 0 0 182.41 111.8C066 3 1 F 32 Other 13 yes no 0 1 158.55 91.95A067 1 1 F 36 Black 16 no no 0 1 163.71 82.45A068 1 1 M 32 White 13 yes yes 3 1 182.66 114.68C069 3 1 M 26 White 13 yes yes 0 1 179.54 99.54D070 4 1 M 26 White 14 yes no . . 176.26 83.07A071 1 1 M 28 Black 12 yes yes 0 1 178.11 99.34B072 2 1 F 53 White 17 yes no . 1 166.3 79.23A073 1 1 M 34 Black 14 no no 0 1 176.27 112.57D074 4 1 F 44 Black 17 yes no 0 0 162.49 88.5D075 4 1 M 41 White 14 yes no 0 1 174.45 98B076 2 1 M 34 Black 16 yes no 0 0 183.87 99.11C077 3 1 M 24 Black 13 yes no 0 1 179.84 121.84D078 4 1 M 31 White 16 yes no 0 1 184.67 105.55A079 1 1 M 21 White 13 yes yes 0 1 177.68 97.27C080 3 1 F 50 White 17 yes no 0 1 165.58 77.02B081 2 1 M 27 Black 16 yes no 0 1 180.33 106.86B082 2 1 M 43 Black 16 yes no . 1 177.9 108.75D083 4 1 F 24 White 12 no yes 0 0 169.1 78.3A084 1 1 F 32 Black 13 yes no 0 1 174.2 81C085 3 1 F 28 Black 13 no no 0 1 154.3 68.64D086 4 1 M 25 Other 13 no no 0 1 175.42 97.32D087 4 1 M 22 Other 13 no no 0 0 175.48 89.45C088 3 1 F 26 Black 13 no no 0 1 171 102.77A089 1 1 M 36 White 14 yes no 5 1 187.73 128.95D090 4 1 F 33 Black 16 yes no 0 1 165.94 86.91A091 1 1 M 27 Black 13 yes no 0 1 185.83 130.95A092 1 1 M 29 White 13 yes no 0 1 171.68 105.68B093 2 1 M 22 White 12 no yes 1 183.07 109.64D094 4 1 F 40 Other 13 yes no 0 1 158.75 78.03B095 2 1 M 39 White 13 yes no 0 1 168.07 92.73
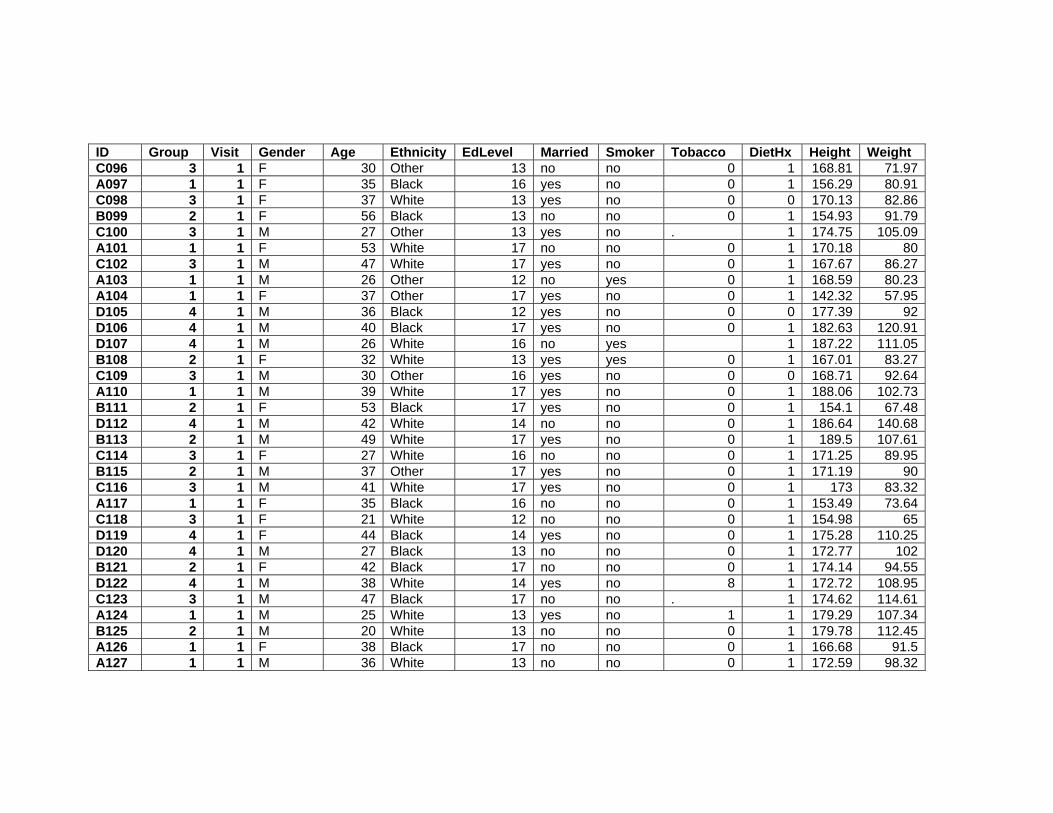
ID Group Visit Gender Age Ethnicity EdLevel Married Smoker Tobacco DietHx Height Weight C096 3 1 F 30 Other 13 no no 0 1 168.81 71.97A097 1 1 F 35 Black 16 yes no 0 1 156.29 80.91C098 3 1 F 37 White 13 yes no 0 0 170.13 82.86B099 2 1 F 56 Black 13 no no 0 1 154.93 91.79C100 3 1 M 27 Other 13 yes no . 1 174.75 105.09A101 1 1 F 53 White 17 no no 0 1 170.18 80C102 3 1 M 47 White 17 yes no 0 1 167.67 86.27A103 1 1 M 26 Other 12 no yes 0 1 168.59 80.23A104 1 1 F 37 Other 17 yes no 0 1 142.32 57.95D105 4 1 M 36 Black 12 yes no 0 0 177.39 92D106 4 1 M 40 Black 17 yes no 0 1 182.63 120.91D107 4 1 M 26 White 16 no yes 1 187.22 111.05B108 2 1 F 32 White 13 yes yes 0 1 167.01 83.27C109 3 1 M 30 Other 16 yes no 0 0 168.71 92.64A110 1 1 M 39 White 17 yes no 0 1 188.06 102.73B111 2 1 F 53 Black 17 yes no 0 1 154.1 67.48D112 4 1 M 42 White 14 no no 0 1 186.64 140.68B113 2 1 M 49 White 17 yes no 0 1 189.5 107.61C114 3 1 F 27 White 16 no no 0 1 171.25 89.95B115 2 1 M 37 Other 17 yes no 0 1 171.19 90C116 3 1 M 41 White 17 yes no 0 1 173 83.32A117 1 1 F 35 Black 16 no no 0 1 153.49 73.64C118 3 1 F 21 White 12 no no 0 1 154.98 65D119 4 1 F 44 Black 14 yes no 0 1 175.28 110.25D120 4 1 M 27 Black 13 no no 0 1 172.77 102B121 2 1 F 42 Black 17 no no 0 1 174.14 94.55D122 4 1 M 38 White 14 yes no 8 1 172.72 108.95C123 3 1 M 47 Black 17 no no . 1 174.62 114.61A124 1 1 M 25 White 13 yes no 1 1 179.29 107.34B125 2 1 M 20 White 13 no no 0 1 179.78 112.45A126 1 1 F 38 Black 17 no no 0 1 166.68 91.5A127 1 1 M 36 White 13 no no 0 1 172.59 98.32

ID Group Visit Gender Age Ethnicity EdLevel Married Smoker Tobacco DietHx Height Weight C128 3 1 F 33 Black 17 no no 0 1 164.64 96.5B129 2 1 F 33 Black 16 no no 0 1 162.56 89.09B130 2 1 F 47 Black 17 yes no 0 1 161.74 74.75D131 4 1 F 29 Other 13 no no 0 1 168.88 90.59D132 4 1 M 34 Other 13 no no 0 1 170.79 98.77C133 3 1 F 40 Other 16 yes no 0 0 164.89 77.55B134 2 1 M 23 White 13 yes yes 1 0 173.1 99.14D135 4 1 F 39 Black 13 no no 0 0 169.77 84.86C136 3 1 M 37 Black 13 yes no 0 1 164.57 99.55A137 1 1 F 27 Black 13 yes no 0 1 169.83 80.66A138 1 1 F 28 White 16 yes no 0 1 169.65 78.3B139 2 1 M 43 White 17 yes no 0 1 179.04 92.86C140 3 1 F 37 Black 17 no no 0 1 168.1 87.73D141 4 1 M 27 White 16 no yes 0 0 184.73 101.64B142 2 1 M 25 White 13 no no 1 1 169.19 104.32B143 2 1 M 25 Other 13 yes yes 0 0 188.25 149.55A144 1 1 M 30 Other 14 yes no 0 0 185.24 114.68C145 3 1 F 29 Black 16 no no 0 1 149.58 78.52D146 4 1 F 40 Black 13 no no 0 1 169.56 94.95A147 1 1 F 29 White 17 yes no 0 1 171.81 89.73C148 3 1 M 26 Black 13 yes no 0 1 171.44 109D149 4 1 F 29 White 13 no no 0 1 157.58 71.41A150 1 1 M 32 White 14 yes no 0 1 182.12 105.18D151 4 1 M 33 White 16 yes no 0 1 169.45 88.11C152 3 1 M 25 Other 13 no yes 0 1 184.73 109.48B153 2 1 M 23 White 12 no yes 0 1 183.99 112.05B154 2 1 M 30 Black 13 yes no 0 1 174.02 96.55C155 3 1 M 25 White 13 no no 0 1 178.91 111.95A156 1 1 M 22 White 14 no no 0 1 173.18 88.37C157 3 1 M 23 White 12 yes yes 0 0 166.62 80.68D158 4 1 M 24 Other 12 yes yes 0 0 182.88 92.64B159 2 1 M 27 Black 12 no no 0 1 181.74 130.64

ID Group Visit Gender Age Ethnicity EdLevel Married Smoker Tobacco DietHx Height Weight A160 1 1 M 22 White 13 no no 0 0 165.1 83.41B161 2 1 M 32 Other 14 yes yes 0 0 171.25 95.27A162 1 1 M 38 Black 16 no yes 0 1 186.89 111.73C163 3 1 M 35 White 14 yes no 0 1 182.72 104.61D164 4 1 F 40 White 16 yes no 0 1 160.13 73.57A165 1 1 M 40 Other 16 yes no 0 0 182.78 111.66A166 1 1 F 46 Black 16 yes no 0 1 163.12 81.77B167 2 1 M 27 White 17 yes no 0 1 182.67 92.84C168 3 1 M 43 Black 14 yes no 0 1 174.73 101.23D169 4 1 M 32 Other 14 no yes 0 1 175.31 110.28B170 2 1 M 24 White 17 no no 0 1 178.92 110.78D171 4 1 F 33 Black 13 no yes 0 1 151.23 70.77C172 3 1 M 21 White 12 yes no 0 1 176.63 96.5

ID Visit WC BMI TCHL HDL LDL TG FBG BPS BPD LBM WBF TrFM BF D001 1 30.7 26.63 202 97 94 56 87 120 89 44396.3 23163.2 8603.6 32.9D002 1 36.4 32.75 . . . . . 121 70 54264.3 27637.1 12067.1 32.7D003 1 45.9 36.27 130 49 72 58 92 139 87 80361.9 42083.4 22439.2 33.4B004 1 40.2 33.08 193 47 137 59 85 123 87 71289.7 26305.7 12376.9 26A005 1 38.2 28.76 190 60 119 103 88 116 79 45736.2 29351.3 13563.6 38C006 1 44.3 32.04 177 60 95 106 108 139 82 61863.6 35447.9 17981 35.3D007 1 44.1 32.79 138 23 98 100 96 136 88 76832.2 38232.4 19587.9 32.1D008 1 32.1 30.45 208 52 149 58 99 127 83 46529.6 28927.6 12636 37D009 1 42.5 35.61 206 66 134 79 96 145 84 81111.9 37680.4 16364.6 30.8D010 1 44.9 35.02 171 51 112 74 95 115 76 73946.7 33774.6 18224.9 30.4B011 1 42 32.28 182 39 89 266 97 142 98 74119.1 32269.3 18231.1 29.4A012 1 39.4 32.29 173 41 102 150 89 126 88 61054 25949.4 13370.5 28.8A013 1 35.4 27.64 152 . . . 121 130 83 59181.8 17868.7 9278.2 22.4B014 1 36.6 28.10 195 67 131 51 70 94 64 50556.2 28170.8 9711.5 34.7A015 1 41.7 31.60 232 26 168 233 101 126 86 68963 32718 19373.8 31.3C016 1 41.5 30.04 237 51 160 174 90 112 77 59917 25798 13017.7 29.2B017 1 39.6 31.40 187 71 103 55 93 112 83 52139 37768.7 15938.8 40.9C018 1 41.5 29.02 256 31 157 417 92 124 78 60965.4 26701.3 15120.6 29.5C019 1 34 28.04 141 34 96 61 89 125 85 61985.4 17485.4 8689.9 21.2C020 1 32.5 29.07 134 84 56 32 91 105 74 44863.5 26281 9664.6 35.8D021 1 40.6 31.06 212 70 129 136 100 147 92 64156.9 22966.1 8600.3 25.4C022 1 33.54 26.43 184 35 134 76 85 105 69 42454.7 18448.5 8304.8 29.2B023 1 48.25 38.59 145 39 83 205 99 133 62 75227 44874.5 22521.5 36.3B024 1 35 29.43 165 66 84 105 84 107 80 43696.8 34977 20906.9 43.3B025 1 42.5 39.80 245 50 159 277 96 123 84 55911.2 41281 17824.4 41.4D026 1 41.1 32.86 . . . . . 127 72 72652.4 30676.7 15323.3 28.8D027 1 40.9 29.99 193 71 116 57 92 115 70 48847.1 32370.3 11769.5 38.6C028 1 41.5 32.33 130 31 93 53 95 117 65 69822.6 26393 12100 26.4C029 1 41.4 30.96 227 56 162 72 82 114 80 63044.6 29414.9 15091 30.8B030 1 42 28.49 133 49 68 71 110 106 72 42317.9 28717 14168.6 39.3A031 1 43.25 33.03 202 31 122 345 89 129 90 76093.1 29426.6 18102.2 27

ID Visit WC BMI TCHL HDL LDL TG FBG BPS BPD LBM WBF TrFM BF C032 1 53.94 40.85 174 52 92 182 91 136 92 76083.3 55322 26554 40.9A033 1 44 36.25 187 36 119 141 112 130 83 78134.6 37899.3 17579.4 31.8C034 1 38.25 27.72 162 72 77 63 86 96 60 44965.3 29712.4 13672 38.7A035 1 40.55 34.13 283 73 200 80 90 111 78 77624.6 35313.9 15805.7 30.1B036 1 37.4 28.65 . . . . . 125 69 60075.5 16441.7 9253.8 20.8A037 1 40.1 30.71 178 25 105 239 91 112 87 64413.5 23442.8 13261 25.9A038 1 36 25.87 189 53 125 105 84 93 65 36024.5 19009.9 10110.4 33.6B039 1 40.5 31.60 211 26 144 204 88 131 90 71864 29939.3 14151.8 28.5A040 1 33 29.02 180 67 111 53 80 119 75 69616.9 18739 6258.7 20.4D041 1 38.5 34.36 121 79 34 67 88 105 64 72400.8 21026.9 8854.9 21.6B042 1 38.2 28.96 . . . . . 92 63 43491.4 20517.6 8607.8 30.9A043 1 38.5 30.25 159 43 104 73 83 114 68 63828.5 26320.9 11187.8 28.4C044 1 43.07 34.14 157 58 99 51 88 124 76 72297 40285 17599.3 34.6C045 1 38.58 34.94 193 52 128 110 108 122 88 57450.7 37562.5 18704.4 38.6D046 1 40.55 28.51 213 67 123 113 95 120 92 42625.3 26702.8 13723.7 37.4A047 1 41.88 32.40 . . . . 93 127 83 66825.1 26620.4 11975.9 27.7C048 1 36.9 31.09 158 70 86 52 92 109 71 51066.8 27618.1 11654.3 33.9B049 1 40 35.72 152 44 93 110 91 121 86 45622.2 38785.5 18010.4 44.6A050 1 38.25 29.46 236 54 151 274 85 114 79 63531.5 24373.1 14643 26.9B051 1 42.67 31.24 234 50 173 89 102 123 79 70706.7 27615.7 15090.3 27.2C052 1 45.27 33.77 152 50 93 38 102 108 73 74410.5 32904.5 17056.1 29.6C053 1 41.7 31.07 . . . . . 135 83 76613.3 30147.1 13921.4 27.2D054 1 40.4 33.12 174 36 112 231 113 126 90 71208.3 26593.4 13466.4 26.3C055 1 38.3 30.86 156 50 93 65 91 106 70 53132.2 29658.9 12362 34.5D056 1 43.58 31.04 162 42 109 62 108 122 83 68792.5 30478.1 19061.8 29.8D057 1 40.7 30.68 197 53 124 136 95 135 91 82062.7 22489.4 11029.4 20.7B058 1 42.9 33.13 . . . . 95 121 86 70907.3 31664 16864.8 29.9D059 1 46 30.98 226 60 138 121 90 126 87 67426.2 35489.2 19815.3 33.7B060 1 41.5 34.57 177 36 122 128 87 130 73 73742.5 31697.4 15618.9 29.2B061 1 44 34.12 234 37 174 117 112 147 95 88406.8 33153.6 18370.5 26.4B062 1 32.5 30.23 216 64 144 80 93 104 73 41325 34411 15422.1 44.3A063 1 41.5 30.04 170 47 107 104 102 121 83 62245.8 33872.7 14859.3 34.2
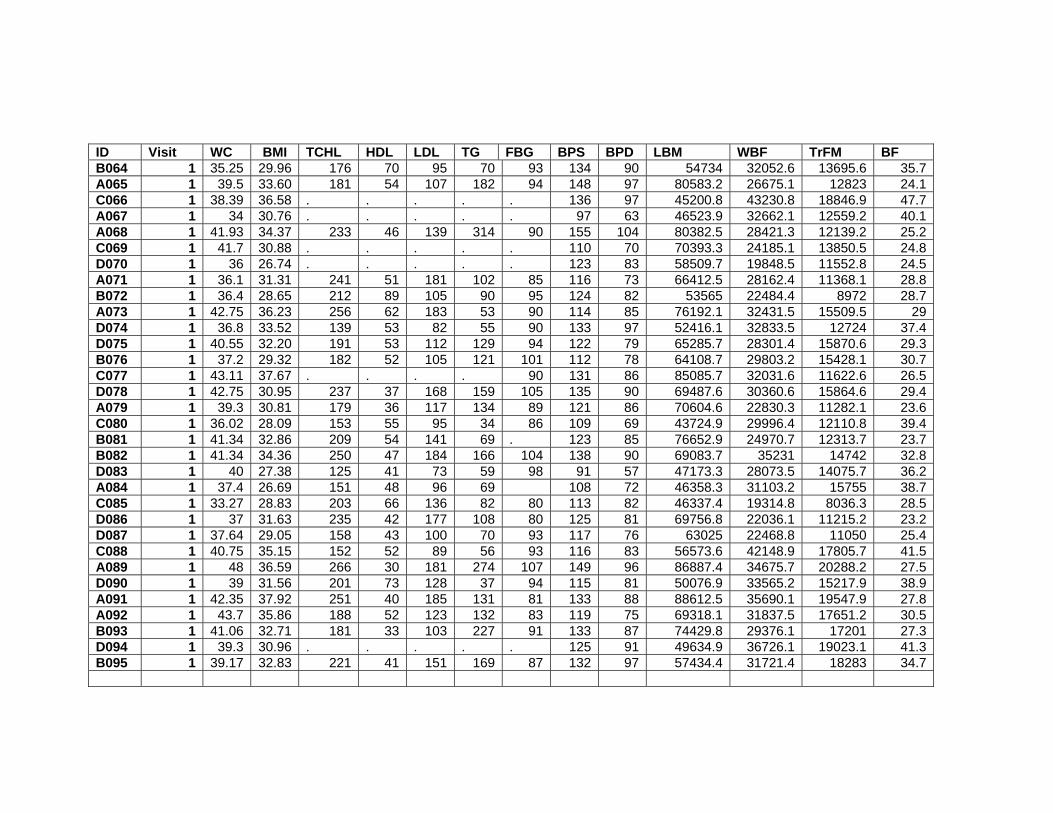
ID Visit WC BMI TCHL HDL LDL TG FBG BPS BPD LBM WBF TrFM BF B064 1 35.25 29.96 176 70 95 70 93 134 90 54734 32052.6 13695.6 35.7A065 1 39.5 33.60 181 54 107 182 94 148 97 80583.2 26675.1 12823 24.1C066 1 38.39 36.58 . . . . . 136 97 45200.8 43230.8 18846.9 47.7A067 1 34 30.76 . . . . . 97 63 46523.9 32662.1 12559.2 40.1A068 1 41.93 34.37 233 46 139 314 90 155 104 80382.5 28421.3 12139.2 25.2C069 1 41.7 30.88 . . . . . 110 70 70393.3 24185.1 13850.5 24.8D070 1 36 26.74 . . . . . 123 83 58509.7 19848.5 11552.8 24.5A071 1 36.1 31.31 241 51 181 102 85 116 73 66412.5 28162.4 11368.1 28.8B072 1 36.4 28.65 212 89 105 90 95 124 82 53565 22484.4 8972 28.7A073 1 42.75 36.23 256 62 183 53 90 114 85 76192.1 32431.5 15509.5 29D074 1 36.8 33.52 139 53 82 55 90 133 97 52416.1 32833.5 12724 37.4D075 1 40.55 32.20 191 53 112 129 94 122 79 65285.7 28301.4 15870.6 29.3B076 1 37.2 29.32 182 52 105 121 101 112 78 64108.7 29803.2 15428.1 30.7C077 1 43.11 37.67 . . . . 90 131 86 85085.7 32031.6 11622.6 26.5D078 1 42.75 30.95 237 37 168 159 105 135 90 69487.6 30360.6 15864.6 29.4A079 1 39.3 30.81 179 36 117 134 89 121 86 70604.6 22830.3 11282.1 23.6C080 1 36.02 28.09 153 55 95 34 86 109 69 43724.9 29996.4 12110.8 39.4B081 1 41.34 32.86 209 54 141 69 . 123 85 76652.9 24970.7 12313.7 23.7B082 1 41.34 34.36 250 47 184 166 104 138 90 69083.7 35231 14742 32.8D083 1 40 27.38 125 41 73 59 98 91 57 47173.3 28073.5 14075.7 36.2A084 1 37.4 26.69 151 48 96 69 108 72 46358.3 31103.2 15755 38.7C085 1 33.27 28.83 203 66 136 82 80 113 82 46337.4 19314.8 8036.3 28.5D086 1 37 31.63 235 42 177 108 80 125 81 69756.8 22036.1 11215.2 23.2D087 1 37.64 29.05 158 43 100 70 93 117 76 63025 22468.8 11050 25.4C088 1 40.75 35.15 152 52 89 56 93 116 83 56573.6 42148.9 17805.7 41.5A089 1 48 36.59 266 30 181 274 107 149 96 86887.4 34675.7 20288.2 27.5D090 1 39 31.56 201 73 128 37 94 115 81 50076.9 33565.2 15217.9 38.9A091 1 42.35 37.92 251 40 185 131 81 133 88 88612.5 35690.1 19547.9 27.8A092 1 43.7 35.86 188 52 123 132 83 119 75 69318.1 31837.5 17651.2 30.5B093 1 41.06 32.71 181 33 103 227 91 133 87 74429.8 29376.1 17201 27.3D094 1 39.3 30.96 . . . . . 125 91 49634.9 36726.1 19023.1 41.3B095 1 39.17 32.83 221 41 151 169 87 132 97 57434.4 31721.4 18283 34.7

ID Visit WC BMI TCHL HDL LDL TG FBG BPS BPD LBM WBF TrFM BF C096 1 37 25.26 . . . . . 112 84 49529 29842.6 11026.1 36.4A097 1 36.34 33.12 . . . . . 117 84 49297.8 28317.6 13462.1 35.4C098 1 34.45 28.63 229 58 133 188 94 118 85 48462.5 31019.8 14513.3 37.8B099 1 45.83 38.24 195 51 132 65 88 130 91 48961.7 39427.7 20676.4 43.5C100 1 41.34 34.41 140 44 78 103 89 115 75 62918 37955.1 19008.4 36.6A101 1 43.5 27.62 214 70 116 131 97 113 80 44480.3 31869.9 14486.4 40.3C102 1 39.75 30.69 201 46 129 90 103 134 90 55100.3 26805.1 15188.9 31.5A103 1 36.29 28.23 295 37 232 125 . 122 84 54301.5 22282.1 11513.9 28.2A104 1 32.28 28.61 144 58 73 115 93 131 85 37414.1 17505.9 8354.8 30.7D105 1 38.98 29.24 . . . . 115 118 83 63997 23447.4 13452.5 25.9D106 1 43 36.25 190 49 129 60 98 138 86 81866.7 33274.3 17757.1 27.9D107 1 42 31.68 198 37 137 108 91 134 89 76704.9 29909.6 17305.9 27.2B108 1 35 29.85 . . . . . 117 74 48847.6 30620.8 14145.6 37.3C109 1 38.58 32.55 205 47 144 62 69 124 75 64611.8 23473.9 12480 25.8A110 1 39.65 29.05 209 46 145 102 82 138 91 72912.7 25232.1 13813.8 24.9B111 1 31.25 28.42 169 58 104 60 107 114 76 40391.7 24554.1 12037.9 36.6D112 1 53.23 40.39 162 28 95 195 111 114 84 82786 51696.7 31158.1 37.6B113 1 41.73 29.97 247 39 111 452 94 111 73 75241.3 27126.6 15423.6 25.6C114 1 38.58 30.67 159 60 91 79 . 121 83 52295.4 33193.9 15287.1 37.5B115 1 40.43 30.71 216 47 155 85 92 102 63 62180.3 23992.5 12001.3 27.1C116 1 38 27.84 184 45 124 66 92 137 92 62286.7 17988.4 9974.2 21.6A117 1 35 31.26 173 54 107 54 108 114 80 43674.5 26926.3 13732.2 37C118 1 35.43 27.06 135 61 63 88 102 107 76 36473.2 25873.7 11888.5 40.3D119 1 39.17 35.89 . . . . . 127 71 . . . . D120 1 40 34.17 265 46 190 145 90 121 89 70103 25168.1 13096.7 25.5B121 1 38 31.18 244 79 149 134 . 102 62 60499.4 29924.8 12593.3 31.9D122 1 42 36.52 182 36 114 126 108 125 82 74294 30018.1 16453.9 27.9C123 1 51.73 37.59 130 41 61 116 115 123 88 64375.8 44557.1 26380.1 39.6A124 1 42.8 33.39 204 36 141 132 93 126 79 68440.1 33862.3 18831.6 32.1B125 1 42.5 34.79 . . . . . 112 65 73031.1 35202.1 16872.2 31.6A126 1 38.46 32.93 . . . . . 126 91 55785.5 31196 15408.7 34.6A127 1 40 33.01 170 52 86 237 92 145 88 66046.2 27083.6 11794 28

ID Visit WC BMI TCHL HDL LDL TG FBG BPS BPD LBM WBF TrFM BF C128 1 41.5 35.60 103 32 61 38 82 111 75 54450.5 37756.3 18013.2 39.7B129 1 42.5 33.71 . . . . . 111 76 52596.6 32551.5 14666 37B130 1 33.27 28.57 233 56 163 95 94 99 61 44590.5 26386.3 9784.3 35.7D131 1 37 31.76 194 69 106 104 81 124 82 54714.2 32126.3 13597.4 35.9D132 1 39 33.86 . . . . 93 136 93 73407.9 20083.3 10388.1 20.8C133 1 37.8 28.52 206 55 138 63 85 103 70 44417.6 29812.1 14186.8 38.8B134 1 43 33.09 . . . . . 137 63 67899.3 26942.3 14607.1 27.5D135 1 36.5 29.44 190 59 120 58 103 111 70 55247.1 25326 11709.6 30.2C136 1 40.83 36.76 181 31 125 126 96 131 76 71549.6 20876.9 11280.6 21.8A137 1 39.17 27.97 138 . . . 93 114 80 46919 30324 13026.1 37.9A138 1 37.25 27.21 204 61 131 55 . 100 68 43985.9 30819.3 13972.7 39.7B139 1 39.65 28.97 150 67 69 88 . 113 73 60091.8 28927.4 15280.6 31.4C140 1 38 31.05 137 61 65 55 80 122 72 52737.1 30361.6 13726.9 35.3D141 1 40.75 29.78 110 42 49 185 84 142 87 74134.9 22852.3 12189.4 22.8B142 1 42.13 36.44 152 51 85 63 76 132 85 74226.4 25298.6 13761.4 24.7B143 1 52.17 42.20 220 55 149 82 86 140 89 . . . . A144 1 43 33.42 165 26 110 153 87 123 70 78273.1 31138.9 16352.4 27.4C145 1 41.61 35.09 204 58 136 43 75 117 84 45136.5 30020.5 13696.6 38.8D146 1 40 33.03 . . . . . 128 95 55056.8 35740.8 16966.7 38.1A147 1 42.13 30.40 188 65 113 66 88 123 84 51234.5 34873.7 18835.5 39.4C148 1 42 37.09 160 46 104 72 84 124 84 67918.2 36544.5 17395.9 33.9D149 1 32.28 28.76 216 87 116 67 73 122 75 44972.6 22805.6 8992.9 32.5A150 1 40.43 31.71 152 48 94 49 107 120 86 65777.9 35232.8 18082.9 33.9D151 1 40.71 30.69 254 36 183 189 90 121 91 58207 26285.5 14642.3 30.2C152 1 47.73 32.08 186 42 131 120 104 124 78 72741.3 31087.1 16933.4 28.8B153 1 42 33.10 166 51 110 53 92 116 76 70125 36737.1 17869.1 33.3B154 1 41.75 31.88 241 55 179 77 100 125 70 62329.9 29847.6 14896.4 31.4C155 1 40.83 34.97 123 50 66 63 64 134 80 71665.3 35135.3 15435.4 31.7A156 1 41.5 29.47 202 56 138 43 93 132 83 57303.3 26876.8 12884.4 30.8C157 1 37.2 29.06 184 39 113 158 89 132 89 55501.8 21429.3 11065.4 26.9D158 1 40.75 27.70 194 37 150 68 92 115 73 61753.9 26920.4 13770.1 29.4B159 1 49.21 39.55 . . . . . 131 87 82573.9 42058 22968.5 32.9

ID Visit WC BMI TCHL HDL LDL TG FBG BPS BPD LBM WBF TrFM BF A160 1 37.4 30.60 . . . . . 128 90 53054 26653.7 12490.6 32.5B161 1 41.25 32.49 172 31 80 369 90 122 89 64400.9 26381.3 15814.1 28.1A162 1 43.5 31.99 . . . . 95 132 101 71785 34743.2 19898.8 31.5C163 1 42.4 31.33 . . . . . 131 73 71701.6 27569 15476.5 26.8D164 1 36.73 28.69 158 64 90 34 88 125 83 47169.9 23248 8097.4 31.9A165 1 44.41 33.42 133 44 65 108 97 139 80 75183 31629 16045 28.8A166 1 34.65 30.73 190 55 120 73 92 129 84 42466.1 35233.7 14519.3 43.9B167 1 37.79 27.82 171 50 105 87 85 121 76 60996 27712.3 13060.2 30.3C168 1 40.25 33.16 211 38 138 174 84 178 127 72371.9 23829.5 13508.3 23.8D169 1 41.73 35.88 223 46 141 180 107 122 80 68355.9 37179 19914.8 34.2B170 1 41.73 34.61 163 56 95 58 87 143 82 73038 33420.7 16401 30.5D171 1 37.79 30.94 179 55 119 76 74 101 78 39864.2 27956.1 11892.4 40C172 1 39.57 30.93 153 42 96 75 93 128 76 66062.9 25869.9 10859.6 27.4

ID Visit SOC Port
SOCC Exer
SOCP Exer
SOC Fat
SOC Bev
SOC F_V kcal Fat CHO Pro
Per Fat
D001 1 1 5 5 5 5 3 1049 19 131 37 16D002 1 4 4 4 5 5 5 1495 74 151 56 44D003 1 3 5 3 4 3 3 2488 101 283 113 36B004 1 3 3 3 5 5 3 1731 71 206 67 37A005 1 1 5 5 5 5 1 1983 70 215 62 33C006 1 1 3 3 5 5 3 1385 62 151 56 40D007 1 3 3 3 5 5 4 2788 102 365 107 33D008 1 3 3 3 4 3 4 1350 58 142 62 39D009 1 4 4 5 5 1 3 1886 107 140 88 51D010 1 1 5 5 4 2 2 2080 74 228 93 32B011 1 3 3 3 5 2 2 2117 83 256 96 35A012 1 3 3 3 5 2 2 1774 80 160 78 40A013 1 4 5 3 5 3 5 2116 64 274 93 27B014 1 1 4 4 5 5 3 1821 75 233 64 37A015 1 . . . . . . C016 1 3 2 2 3 3 4 2352 133 193 108 51B017 1 3 3 3 5 5 5 1857 94 168 92 45C018 1 5 5 3 5 3 3 1517 52 203 62 31C019 1 2 3 3 5 1 5 2744 102 363 103 33C020 1 3 3 3 4 3 5 2026 95 179 101 42D021 1 1 3 3 5 1 1 2059 85 262 63 37C022 1 5 4 3 5 5 3 1653 80 183 60 43B023 1 1 2 2 5 3 3 B024 1 3 5 5 5 4 3 1750 73 212 74 37B025 1 3 2 2 5 5 3 2056 85 245 85 37D026 1 . . . . . . D027 1 3 3 3 5 5 5 1713 42 276 73 22C028 1 4 5 3 4 3 3 C029 1 3 2 2 5 5 3 2688 118 284 126 39B030 1 3 5 3 5 1 2 A031 1 3 3 3 5 5 3 1844 86 194 77 42C032 1 5 3 3 5 3 5 2151 91 253 89 38

ID Visit SOC Port
SOCC Exer
SOCP Exer
SOC Fat
SOC Bev
SOC F_V kcal Fat CHO Pro
Per Fat
A033 1 1 3 3 5 5 5 1657 83 127 104 45C034 1 5 5 5 5 5 5 2145 84 272 78 35A035 1 . . . . . . 1042 59 73 45 51B036 1 3 4 4 5 1 5 1984 97 189 82 44A037 1 3 5 5 4 5 3 2808 126 290 131 40A038 1 3 3 2 4 3 3 1766 59 220 56 30B039 1 5 5 5 5 5 3 1783 59 223 88 30A040 1 4 5 5 5 2 2 1454 56 152 88 35D041 1 3 5 5 5 5 5 1565 54 156 88 31B042 1 . . . . . . A043 1 3 4 4 5 5 5 2241 91 253 105 36C044 1 1 5 5 5 1 3 2033 97 176 98 43C045 1 3 3 4 5 3 2219 96 259 85 38D046 1 3 5 5 5 5 5 1234 41 108 53 30A047 1 1 5 5 5 5 5 1063 46 108 52 39C048 1 3 3 3 5 5 3 1769 79 204 62 40B049 1 1 5 5 5 5 1 1137 43 133 56 34A050 1 1 3 3 5 5 3 1634 56 230 57 30B051 1 4 3 3 5 5 3 C052 1 1 4 2 4 1 3 2642 135 238 114 46C053 1 . . . . . . D054 1 1 3 1 4 5 2 1664 56 217 71 30C055 1 4 4 3 4 4 2 1876 119 129 91 57D056 1 3 3 3 5 5 2 3786 239 276 118 56D057 1 3 3 3 5 4 3 3903 206 380 133 47B058 1 . . . . . . D059 1 1 4 2 5 3 1 B060 1 1 4 3 5 3 3 1366 31 211 66 20B061 1 3 4 5 3 1 5 2988 99 438 75 30B062 1 3 3 3 5 5 5 1750 90 170 69 46A063 1 3 3 3 3 5 3 2936 126 304 111 38

ID Visit SOC Port
SOCC Exer
SOCP Exer
SOC Fat
SOC Bev
SOC F_V kcal Fat CHO Pro
Per Fat
B064 1 3 3 3 4 4 2 1602 58 226 50 32A065 1 . . . . . . C066 1 4 3 3 5 5 3 935 38 86 62 37A067 1 3 3 3 5 5 3 A068 1 1 5 3 5 5 5 C069 1 . . . . . . D070 1 . . . . . . A071 1 . . . . . . B072 1 3 3 3 5 5 3 1796 68 177 87 34A073 1 3 4 4 5 4 5 2056 100 221 69 44D074 1 4 3 3 5 3 5 1754 74 207 68 38D075 1 3 3 3 5 5 2 1314 57 144 55 39B076 1 3 3 3 4 1 3 C077 1 1 3 3 4 3 3 3682 153 471 108 37D078 1 1 3 3 5 5 2 2480 95 257 147 34A079 1 3 5 5 5 4 4 1245 47 138 66 34C080 1 2 2 2 5 3 3 1206 51 130 58 38B081 1 3 5 5 4 3 5 1761 89 167 82 45B082 1 3 3 3 5 5 5 3215 110 494 79 31D083 1 3 2 2 4 3 3 2562 103 345 73 36A084 1 . . . . . . C085 1 1 3 5 5 1 1 1840 80 216 68 39D086 1 3 4 4 5 3 3 1987 92 184 101 41D087 1 2 3 3 4 5 2 1370 41 160 61 27C088 1 3 3 3 5 3 3 A089 1 3 4 3 5 3 3 2177 114 141 116 47D090 1 1 3 3 5 1 3 2197 113 230 64 46A091 1 3 5 5 5 3 3 883 33 100 45 33A092 1 3 4 4 5 5 2 1585 62 191 67 35B093 1 3 4 3 5 4 4 1110 25 150 45 20D094 1 . . . . . . B095 1 3 5 5 5 3 3 3331 97 249 111 37

ID Visit SOC Port
SOCC Exer
SOCP Exer
SOC Fat
SOC Bev
SOC F_V kcal Fat CHO Pro
Per Fat
C096 1 1 5 5 5 5 3 1562 54 215 56 31A097 1 . . . . . . C098 1 5 5 5 3 3 3 1781 91 182 64 46B099 1 . . . . . . C100 1 4 5 5 5 3 3 1701 69 205 73 36A101 1 1 4 4 5 1 5 1660 64 203 73 34C102 1 3 3 3 5 5 3 1514 46 226 53 27A103 1 4 3 3 5 3 4 1210 29 196 45 21A104 1 3 3 3 5 4 4 1739 72 210 65 37D105 1 1 2 2 1 1 3 4481 132 732 107 27D106 1 3 5 5 5 5 3 2117 110 196 86 47D107 1 3 3 3 5 4 3 1433 54 175 62 34B108 1 . . . . . . 1696 78 173 74 41C109 1 1 5 5 5 5 3 2612 113 269 131 39A110 1 3 5 5 2 5 3 3310 162 366 106 44B111 1 . . . . . . 948 25 133 50 23D112 1 1 4 4 5 5 3 2574 134 284 76 46B113 1 3 5 5 5 5 3 1702 45 268 66 23C114 1 3 3 3 5 5 5 2107 100 224 87 42B115 1 3 3 3 4 5 5 1315 37 163 84 25C116 1 3 2 2 5 5 5 2273 83 272 96 33A117 1 4 3 3 5 5 3 C118 1 1 3 3 5 4 2 1908 82 224 70 39D119 1 . . . . . . D120 1 4 4 4 5 4 3 2787 74 466 74 24B121 1 . . . . . . 1500 76 137 74 45D122 1 3 4 4 4 4 5 2126 71 268 103 30C123 1 3 3 3 5 5 3 1388 51 180 59 33A124 1 3 5 3 5 3 5 1366 63 141 57 42B125 1 4 4 4 5 4 4 1090 30 166 43 25A126 1 2 2 2 5 5 2 947 32 130 43 29

ID Visit SOC Port
SOCC Exer
SOCP Exer
SOC Fat
SOC Bev
SOC F_V kcal Fat CHO Pro
Per Fat
A127 1 3 3 5 5 3 3 1721 69 191 86 36C128 1 2 3 3 4 1 5 2213 42 394 69 17B129 1 . . . . . . B130 1 5 3 3 5 5 5 1691 68 208 66 36D131 1 5 5 5 5 3 3 D132 1 4 5 3 5 1 3 C133 1 . . . . . . B134 1 . . . . . . D135 1 3 3 3 4 3 3 1288 44 165 61 30C136 1 3 3 3 4 4 3 1304 55 128 74 38A137 1 . . . . . . A138 1 5 3 3 5 5 3 1418 53 153 69 33B139 1 3 3 3 5 5 3 1748 65 209 85 33C140 1 3 3 3 5 5 4 1396 48 156 92 31D141 1 3 5 5 5 1 3 2406 67 256 85 25B142 1 5 5 5 5 2 5 2092 58 312 93 25B143 1 4 4 4 5 4 4 A144 1 3 5 5 5 3 5 3534 152 420 124 38C145 1 3 3 3 4 4 3 D146 1 1 3 3 5 5 1 2162 84 267 89 35A147 1 3 5 5 5 5 5 1423 50 195 64 31C148 1 3 4 3 5 5 5 1279 38 156 83 27D149 1 3 3 3 5 5 3 1117 32 147 68 26A150 1 3 4 3 5 5 3 3160 155 230 133 44D151 1 1 2 2 5 1 5 844 42 77 39 45C152 1 1 3 3 5 5 5 1674 42 210 91 22B153 1 3 5 5 5 3 4 B154 1 3 5 3 5 3 5 1239 44 145 64 32C155 1 3 5 4 5 5 3 A156 1 4 5 5 5 1 4 C157 1 3 5 3 4 2 2

ID Visit SOC Port
SOCC Exer
SOCP Exer
SOC Fat
SOC Bev
SOC F_V kcal Fat CHO Pro
Per Fat
D158 1 5 5 5 5 5 5 B159 1 2 4 4 5 4 4 870 26 68 83 27A160 1 3 3 3 5 3 5 B161 1 3 3 5 5 3 3 A162 1 3 3 3 4 3 3 1770 69 196 87 35C163 1 3 3 3 5 5 3 D164 1 1 3 3 5 5 1 1322 50 160 53 64A165 1 3 3 3 4 5 1 1145 57 82 79 45A166 1 3 3 3 5 5 3 1021 24 192 19 21B167 1 . . . . . . 4758 134 638 256 25C168 1 3 4 3 4 4 3 2660 103 362 79 35D169 1 3 3 1 4 4 1 B170 1 3 3 3 5 3 3 3333 119 454 125 32D171 1 . . . . . . C172 1 1 3 3 5 5 1 1791 81 189 56 41
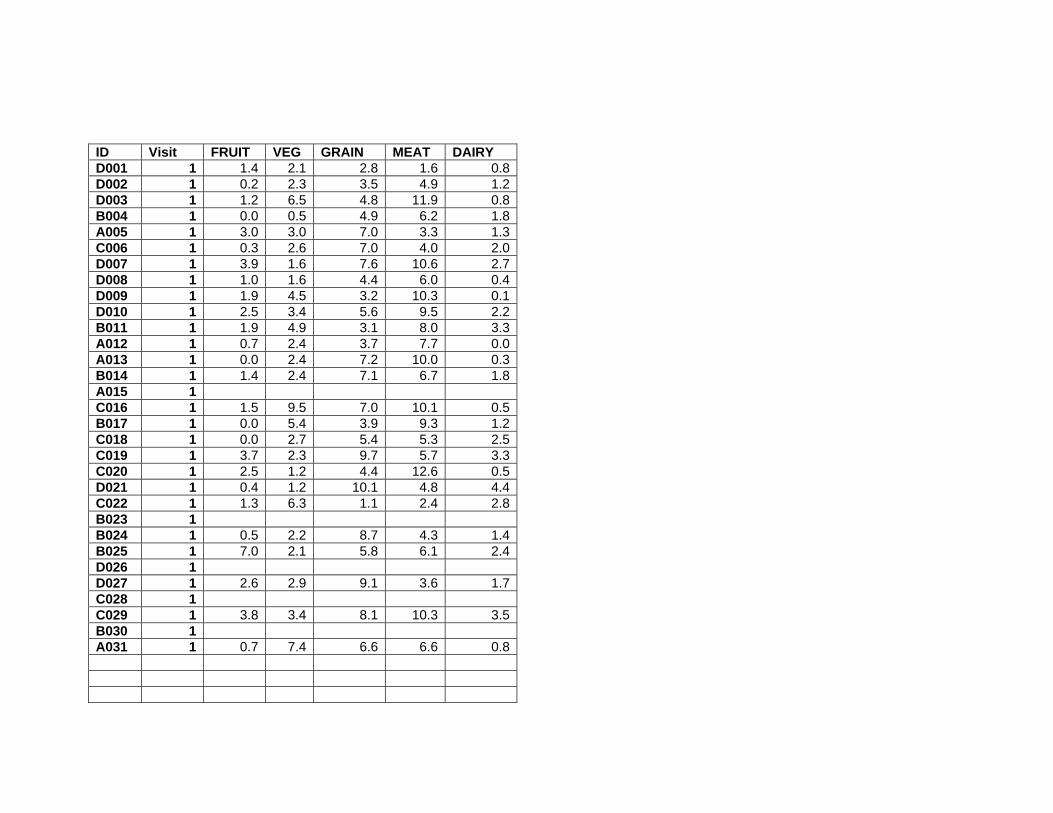
ID Visit FRUIT VEG GRAIN MEAT DAIRY D001 1 1.4 2.1 2.8 1.6 0.8D002 1 0.2 2.3 3.5 4.9 1.2D003 1 1.2 6.5 4.8 11.9 0.8B004 1 0.0 0.5 4.9 6.2 1.8A005 1 3.0 3.0 7.0 3.3 1.3C006 1 0.3 2.6 7.0 4.0 2.0D007 1 3.9 1.6 7.6 10.6 2.7D008 1 1.0 1.6 4.4 6.0 0.4D009 1 1.9 4.5 3.2 10.3 0.1D010 1 2.5 3.4 5.6 9.5 2.2B011 1 1.9 4.9 3.1 8.0 3.3A012 1 0.7 2.4 3.7 7.7 0.0A013 1 0.0 2.4 7.2 10.0 0.3B014 1 1.4 2.4 7.1 6.7 1.8A015 1 C016 1 1.5 9.5 7.0 10.1 0.5B017 1 0.0 5.4 3.9 9.3 1.2C018 1 0.0 2.7 5.4 5.3 2.5C019 1 3.7 2.3 9.7 5.7 3.3C020 1 2.5 1.2 4.4 12.6 0.5D021 1 0.4 1.2 10.1 4.8 4.4C022 1 1.3 6.3 1.1 2.4 2.8B023 1 B024 1 0.5 2.2 8.7 4.3 1.4B025 1 7.0 2.1 5.8 6.1 2.4D026 1 D027 1 2.6 2.9 9.1 3.6 1.7C028 1 C029 1 3.8 3.4 8.1 10.3 3.5B030 1 A031 1 0.7 7.4 6.6 6.6 0.8

ID Visit FRUIT VEG GRAIN MEAT DAIRY C032 1 1.2 1.7 6.5 11.6 0.3A033 1 1.6 4.2 6.0 7.4 2.8C034 1 0.7 2.1 8.5 7.4 1.5A035 1 0.0 1.0 2.9 5.0 0.3B036 1 0.7 2.0 4.6 7.4 3.1A037 1 1.0 5.5 6.1 13.7 2.5A038 1 2.8 2.1 3.4 3.5 1.8B039 1 0.5 2.6 6.0 7.8 0.4A040 1 0.7 4.5 2.9 10.1 1.2D041 1 3.0 2.9 2.8 9.8 1.4B042 1 A043 1 1.4 2.7 10.1 9.2 1.4C044 1 1.9 2.0 4.8 9.1 2.2C045 1 2.8 5.8 3.5 8.5 0.6D046 1 1.8 5.1 1.3 5.1 1.2A047 1 0.0 0.9 4.5 4.5 0.9C048 1 0.6 3.6 4.6 5.6 1.4B049 1 0.0 1.7 4.8 5.7 0.2A050 1 2.2 0.2 6.9 3.3 1.7B051 1 C052 1 0.0 2.4 5.8 9.0 3.0C053 1 D054 1 1.3 1.2 6.9 6.7 2.0C055 1 2.5 2.6 2.3 12.2 1.8D056 1 0.3 2.4 7.6 10.9 0.5D057 1 0.0 1.9 13.6 8.9 3.9B058 1 D059 1 B060 1 1.0 3.0 6.2 4.1 1.6B061 1 3.4 5.4 8.1 6.1 0.9B062 1 2.2 3.1 4.1 6.5 2.1A063 1 0.0 5.9 5.6 10.7 2.8

ID Visit FRUIT VEG GRAIN MEAT DAIRY B064 1 1.4 1.1 6.0 2.1 3.5A065 1 C066 1 0.0 3.1 2.2 8.3 0.9A067 1 A068 1 C069 1 D070 1 A071 1 B072 1 0.3 2.5 5.5 8.3 1.6A073 1 1.0 4.2 4.6 5.6 0.7D074 1 3.2 3.7 4.1 7.1 0.4D075 1 0.0 0.0 5.1 3.3 1.4B076 1 C077 1 0.7 2.1 10.9 7.4 1.4D078 1 0.0 7.3 8.4 13.3 2.6A079 1 0.8 3.3 2.9 2.9 0.8C080 1 0.3 2.4 5.1 4.1 2.1B081 1 0.0 3.2 3.7 11.3 1.2B082 1 9.7 3.2 4.6 10.2 1.3D083 1 1.1 2.3 6.8 5.1 2.1A084 1 C085 1 0.1 1.5 4.9 5.3 2.6D086 1 2.1 2.9 6.5 10.9 1.2D087 1 0.0 2.7 0.5 6.3 0.6C088 1 A089 1 0.0 3.8 5.7 13.3 1.3D090 1 1.0 3.4 7.3 5.2 5.7A091 1 0.0 1.4 3.6 4.5 0.7A092 1 1.0 1.8 4.3 4.0 3.9B093 1 1.0 3.3 3.3 3.4 0.6D094 1 B095 1 0.0 3.5 6.1 10.3 1.3
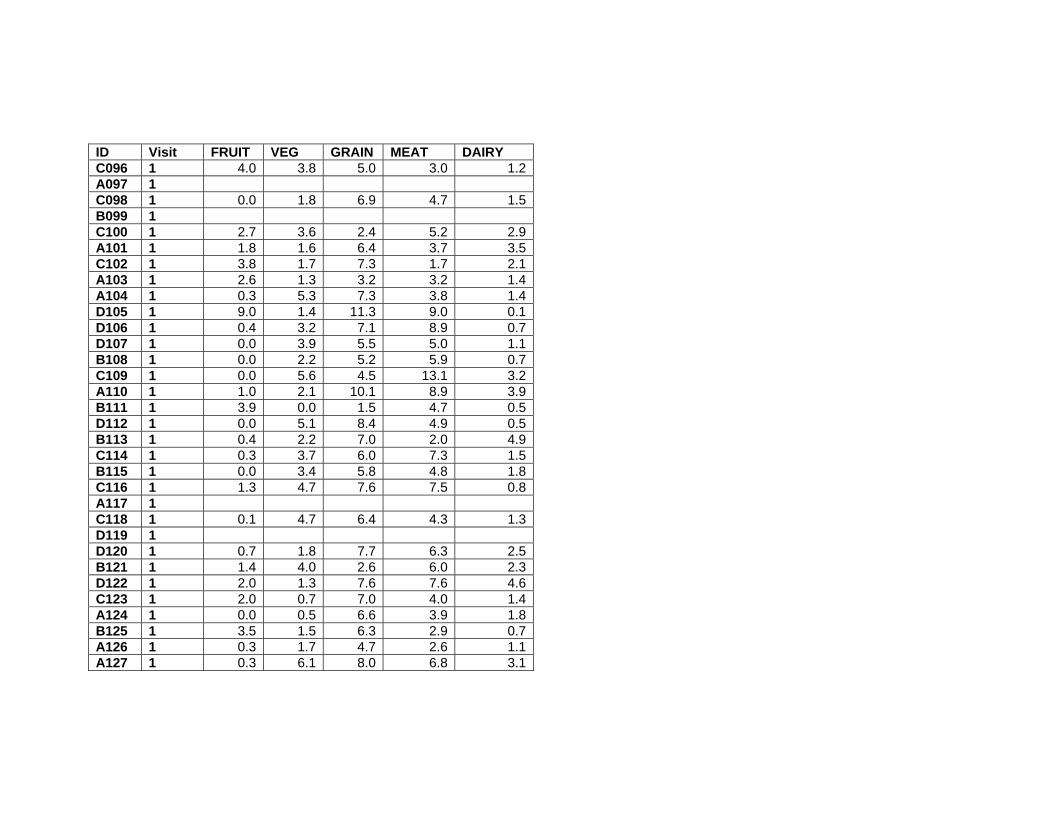
ID Visit FRUIT VEG GRAIN MEAT DAIRY C096 1 4.0 3.8 5.0 3.0 1.2A097 1 C098 1 0.0 1.8 6.9 4.7 1.5B099 1 C100 1 2.7 3.6 2.4 5.2 2.9A101 1 1.8 1.6 6.4 3.7 3.5C102 1 3.8 1.7 7.3 1.7 2.1A103 1 2.6 1.3 3.2 3.2 1.4A104 1 0.3 5.3 7.3 3.8 1.4D105 1 9.0 1.4 11.3 9.0 0.1D106 1 0.4 3.2 7.1 8.9 0.7D107 1 0.0 3.9 5.5 5.0 1.1B108 1 0.0 2.2 5.2 5.9 0.7C109 1 0.0 5.6 4.5 13.1 3.2A110 1 1.0 2.1 10.1 8.9 3.9B111 1 3.9 0.0 1.5 4.7 0.5D112 1 0.0 5.1 8.4 4.9 0.5B113 1 0.4 2.2 7.0 2.0 4.9C114 1 0.3 3.7 6.0 7.3 1.5B115 1 0.0 3.4 5.8 4.8 1.8C116 1 1.3 4.7 7.6 7.5 0.8A117 1 C118 1 0.1 4.7 6.4 4.3 1.3D119 1 D120 1 0.7 1.8 7.7 6.3 2.5B121 1 1.4 4.0 2.6 6.0 2.3D122 1 2.0 1.3 7.6 7.6 4.6C123 1 2.0 0.7 7.0 4.0 1.4A124 1 0.0 0.5 6.6 3.9 1.8B125 1 3.5 1.5 6.3 2.9 0.7A126 1 0.3 1.7 4.7 2.6 1.1A127 1 0.3 6.1 8.0 6.8 3.1

ID Visit FRUIT VEG GRAIN MEAT DAIRY C128 1 4.3 1.8 4.5 4.0 2.9B129 1 B130 1 0.0 2.5 5.5 5.0 1.7D131 1 D132 1 C133 1 B134 1 D135 1 0.6 4.1 2.4 6.4 0.0C136 1 0.7 1.2 5.3 6.7 0.4A137 1 A138 1 1.2 3.2 4.5 5.8 3.1B139 1 1.0 4.2 5.0 6.9 1.2C140 1 2.8 5.3 0.9 8.3 0.7D141 1 0.0 4.3 6.0 7.2 1.2B142 1 8.7 4.6 5.2 4.7 3.5B143 1 A144 1 0.0 4.9 10.1 10.3 7.3C145 1 D146 1 0.7 1.4 5.2 9.9 0.7A147 1 1.7 2.4 5.3 3.3 3.1C148 1 2.5 1.1 3.2 7.9 1.4D149 1 1.9 4.0 2.0 4.9 4.0A150 1 0.0 6.7 7.1 11.2 3.9D151 1 0.0 2.1 3.4 3.2 1.2C152 1 1.7 4.9 4.5 8.1 2.0B153 1 B154 1 1.2 1.3 6.0 4.7 0.7C155 1 A156 1 C157 1 D158 1 B159 1 0.0 2.2 2.7 9.3 0.0

ID Visit FRUIT VEG GRAIN MEAT DAIRY A160 1 B161 1 A162 1 1.7 1.5 7.7 10.3 5.3C163 1 D164 1 0.9 3.0 2.1 3.9 6.2A165 1 1.6 1.3 2.1 8.4 1.1A166 1 1.3 6.4 0.6 1.4 0.6B167 1 0.9 3.6 16.0 15.1 8.4C168 1 0.0 2.1 8.4 6.3 0.0D169 1 B170 1 2.1 6.2 13.7 5.7 4.1D171 1 C172 1 0.0 0.1 4.2 3.7 2.3

ID Visit Visit type Gender Weight BMI WC TCHL HDL LDL TG FBG BPS BPD LBM
D001 2 R F 74.72 28.20 37.4 118 89 46739.7D002 2 R F 83.52 32.11 37.5 186 65 118 79 80 107 67 51925.1D003 2 D M . . . . . . B004 2 D M 102.73 33.32 . . . . A005 2 R F 76.93 28.42 39.37 173 52 110 116 93 97 68 45367.9C006 2 R M 98.63 31.31 42.91 167 62 91 97 118 130 85 63414.2D007 2 R M 117.9 31.98 41.73 120 81 76427.2D008 2 D F . . . . . . D009 2 R M 114 32.85 42.5 192 46 122 146 96 123 84 76990.4D010 2 R M 107.22 33.34 42.79 171 51 112 74 95 103 67 72497.2B011 2 D M . . . . . . A012 2 R M 90.41 32.16 38.5 186 44 110 159 94 138 97 61826.3A013 2 S M 75 25.56 . . . . B014 2 R F 80.68 27.47 35.24 235 63 169 53 82 107 72 49493.3A015 2 D M . . . . . . C016 2 R M 90.55 30.25 41.34 259 36 196 167 97 117 82 60818.5B017 2 R F 92.98 31.24 37.5 87 108 75 49663.2C018 2 R M 94.64 30.23 42.75 259 36 196 167 97 123 84 61421.5C019 2 R M 87.86 29.27 35.63 223 46 172 82 94 126 85 63269.3C020 2 D F . . . . . . D021 2 D M . . . . . . C022 2 R F 59.48 24.70 33 177 32 120 158 84 110 71 40728.6B023 2 D M . . . . . . B024 2 R F 84.09 30.33 35.2 207 76 128 79 92 114 84 45751.9B025 2 R F 101.95 40.44 41.5 238 43 163 227 101 117 85 57317.6D026 2 D M . . . . . . D027 2 S F 80 28.46 . 179 69 100 53 88 . . . C028 2 R M 99.36 32.12 41.25 114 73 68801.7C028 2 R M 99.36 32.12 41.25 114 73 68801.7C029 2 R M 92.84 29.79 38.39 195 46 131 91 80 109 65 64305.9B030 2 D F . . . . . . A031 2 R M 111.39 33.17 42.5 187 31 115 298 88 132 90 79195.4
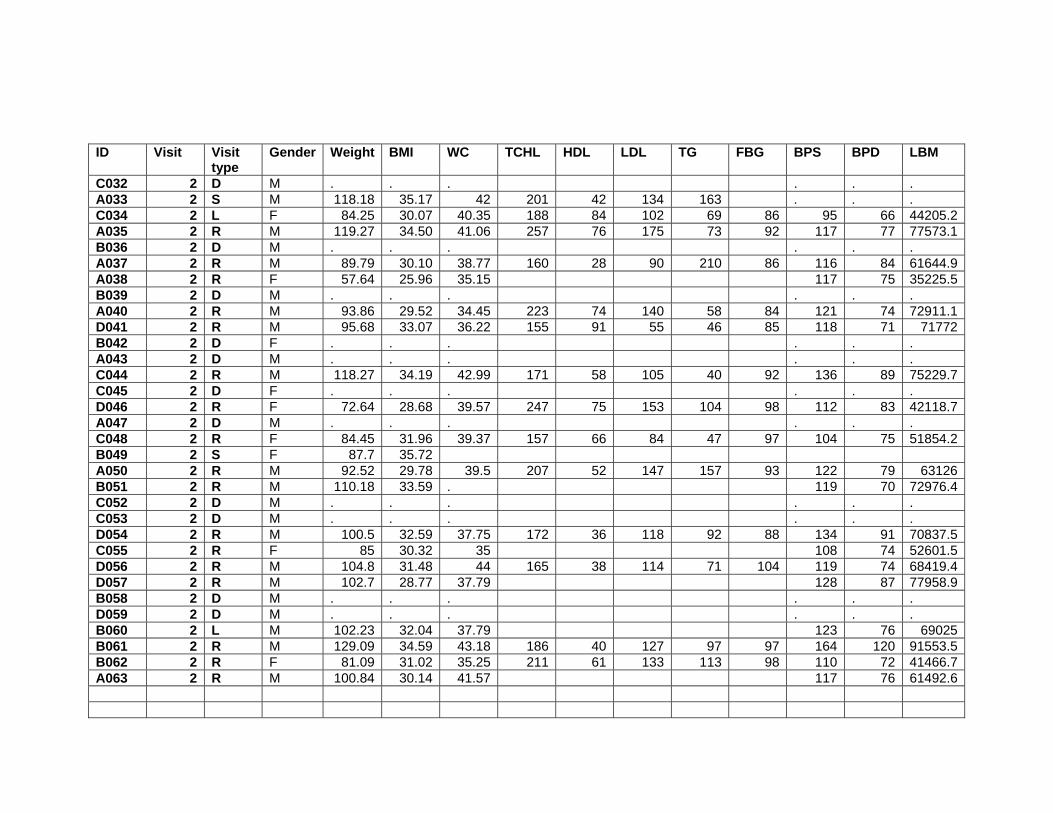
ID Visit Visit type
Gender Weight BMI WC TCHL HDL LDL TG FBG BPS BPD LBM
C032 2 D M . . . . . . A033 2 S M 118.18 35.17 42 201 42 134 163 . . . C034 2 L F 84.25 30.07 40.35 188 84 102 69 86 95 66 44205.2A035 2 R M 119.27 34.50 41.06 257 76 175 73 92 117 77 77573.1B036 2 D M . . . . . . A037 2 R M 89.79 30.10 38.77 160 28 90 210 86 116 84 61644.9A038 2 R F 57.64 25.96 35.15 117 75 35225.5B039 2 D M . . . . . . A040 2 R M 93.86 29.52 34.45 223 74 140 58 84 121 74 72911.1D041 2 R M 95.68 33.07 36.22 155 91 55 46 85 118 71 71772B042 2 D F . . . . . . A043 2 D M . . . . . . C044 2 R M 118.27 34.19 42.99 171 58 105 40 92 136 89 75229.7C045 2 D F . . . . . . D046 2 R F 72.64 28.68 39.57 247 75 153 104 98 112 83 42118.7A047 2 D M . . . . . . C048 2 R F 84.45 31.96 39.37 157 66 84 47 97 104 75 51854.2B049 2 S F 87.7 35.72 A050 2 R M 92.52 29.78 39.5 207 52 147 157 93 122 79 63126B051 2 R M 110.18 33.59 . 119 70 72976.4C052 2 D M . . . . . . C053 2 D M . . . . . . D054 2 R M 100.5 32.59 37.75 172 36 118 92 88 134 91 70837.5C055 2 R F 85 30.32 35 108 74 52601.5D056 2 R M 104.8 31.48 44 165 38 114 71 104 119 74 68419.4D057 2 R M 102.7 28.77 37.79 128 87 77958.9B058 2 D M . . . . . . D059 2 D M . . . . . . B060 2 L M 102.23 32.04 37.79 123 76 69025B061 2 R M 129.09 34.59 43.18 186 40 127 97 97 164 120 91553.5B062 2 R F 81.09 31.02 35.25 211 61 133 113 98 110 72 41466.7A063 2 R M 100.84 30.14 41.57 117 76 61492.6
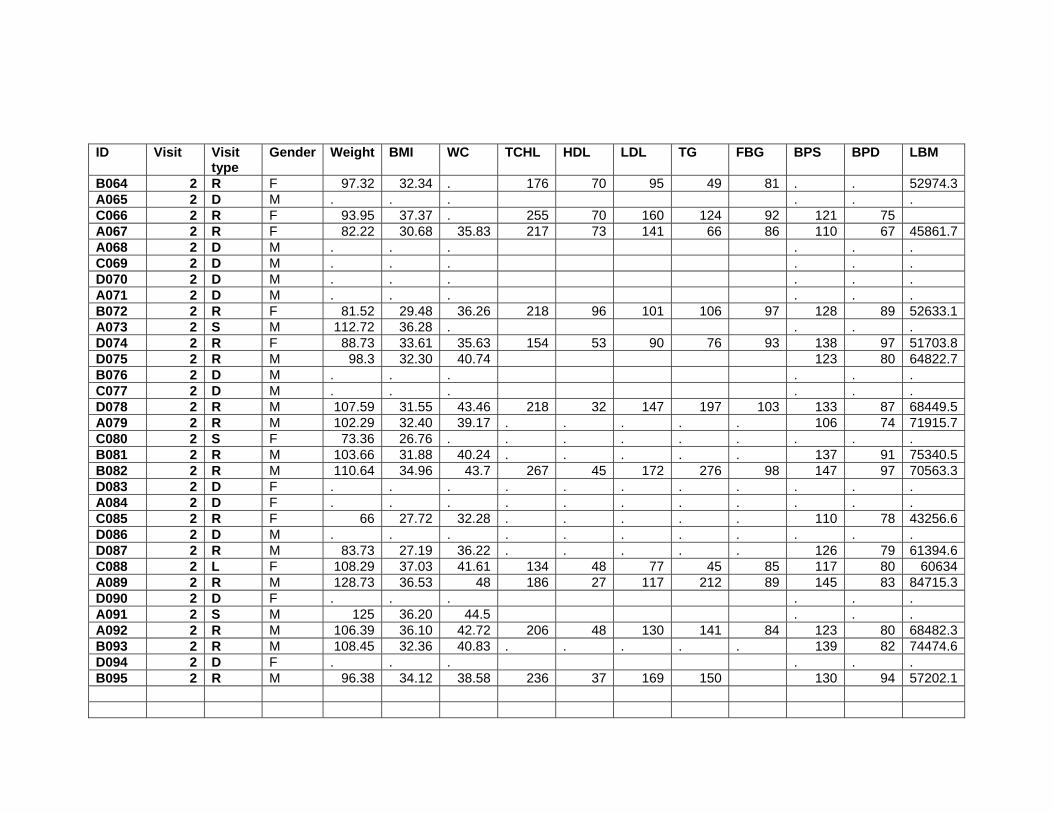
ID Visit Visit type
Gender Weight BMI WC TCHL HDL LDL TG FBG BPS BPD LBM
B064 2 R F 97.32 32.34 . 176 70 95 49 81 . . 52974.3A065 2 D M . . . . . . C066 2 R F 93.95 37.37 . 255 70 160 124 92 121 75 A067 2 R F 82.22 30.68 35.83 217 73 141 66 86 110 67 45861.7A068 2 D M . . . . . . C069 2 D M . . . . . . D070 2 D M . . . . . . A071 2 D M . . . . . . B072 2 R F 81.52 29.48 36.26 218 96 101 106 97 128 89 52633.1A073 2 S M 112.72 36.28 . . . . D074 2 R F 88.73 33.61 35.63 154 53 90 76 93 138 97 51703.8D075 2 R M 98.3 32.30 40.74 123 80 64822.7B076 2 D M . . . . . . C077 2 D M . . . . . . D078 2 R M 107.59 31.55 43.46 218 32 147 197 103 133 87 68449.5A079 2 R M 102.29 32.40 39.17 . . . . . 106 74 71915.7C080 2 S F 73.36 26.76 . . . . . . . . . B081 2 R M 103.66 31.88 40.24 . . . . . 137 91 75340.5B082 2 R M 110.64 34.96 43.7 267 45 172 276 98 147 97 70563.3D083 2 D F . . . . . . . . . . . A084 2 D F . . . . . . . . . . . C085 2 R F 66 27.72 32.28 . . . . . 110 78 43256.6D086 2 D M . . . . . . . . . . . D087 2 R M 83.73 27.19 36.22 . . . . . 126 79 61394.6C088 2 L F 108.29 37.03 41.61 134 48 77 45 85 117 80 60634A089 2 R M 128.73 36.53 48 186 27 117 212 89 145 83 84715.3D090 2 D F . . . . . . A091 2 S M 125 36.20 44.5 . . . A092 2 R M 106.39 36.10 42.72 206 48 130 141 84 123 80 68482.3B093 2 R M 108.45 32.36 40.83 . . . . . 139 82 74474.6D094 2 D F . . . . . . B095 2 R M 96.38 34.12 38.58 236 37 169 150 130 94 57202.1

ID Visit Visit type
Gender Weight BMI WC TCHL HDL LDL TG FBG BPS BPD LBM
C096 2 R F 80.14 28.12 36.22 171 75 92 65 117 76 47106.8A097 2 D F . . . . . . C098 2 R F 85.14 29.42 34.5 257 67 170 98 93 123 89 47332B099 2 R F 90.73 37.80 46.69 . . . . . 143 93 46916.9C100 2 R M 100.11 32.78 39.72 152 53 84 89 94 119 65 60507.3A101 2 D F . . . . . . C102 2 R M 85.05 30.25 38 . . . . . 116 67 53848A103 2 R M 78.2 27.51 34 . . . . . 117 74 52262.9A104 2 R F 57.23 28.25 31.89 135 54 69 78 90 130 94 37799.5D105 2 D M . . D106 2 R M 118.36 35.49 41.34 198 49 136 117 99 133 78 84225.3D107 2 R M 115.77 33.03 39.5 . . . . . 135 83 79245B108 2 D F . . C109 2 D M . . A110 2 R M 97.73 27.63 38.58 178 49 127 42 86 119 82 69395.3B111 2 R F 67.36 28.37 32 180 67 109 82 93 115 78 41307.3D112 2 R M 142.45 40.89 53.54 185 33 110 217 112 130 93 . B113 2 R M 107.95 30.06 41.54 231 39 169 169 92 123 68 75769.6C114 2 R F 90 30.69 40.25 179 66 100 108 82 116 93 51622.2B115 2 R M 88.41 30.17 39.25 . . . . . 128 69 59430.1C116 2 R M 79.5 26.56 35.43 166 41 111 105 98 122 80 61335.3A117 2 R F 72.36 30.71 35 168 55 112 58 100 123 83 41620.8C118 2 R F 69.77 29.05 38.43 . . . . . 109 74 37301.8D119 2 D F . . . . . . D120 2 R M 98.64 33.05 38.98 . . . . . 125 89 70413.7B121 2 R F 92 30.34 40 222 77 134 51 71 109 68 58938.4D122 2 R M 103.2 34.59 40.55 162 37 91 257 102 127 89 73110.9C123 2 R M 113.34 37.17 49.61 144 39 78 140 110 127 89 64392.8A124 2 R M 106.64 33.17 41.54 . . . . . 126 93 66552.2B125 2 R M 121.52 37.60 45.9 189 43 136 77 94 115 58 81646.6A126 2 L F 86.45 31.12 35.6 136 99 53502.9A127 2 R M 93.66 31.44 36.38 127 50 70 83 90 133 79 63436.9

ID Visit Visit type
Gender Weight BMI WC TCHL HDL LDL TG FBG BPS BPD LBM
C128 2 R F 94.34 34.80 39.53 119 40 68 47 82 130 85 54917.6B129 2 R F 89.295 33.79 40.75 . . 52745.8B130 2 R F 73.32 28.03 30.71 220 51 167 59 94 96 58 44097.9D131 2 R F 92.11 32.30 37.79 . . . . . 119 77 57857.8D132 2 R M 93.48 32.05 36 . . . . . 140 99 73150.5C133 2 R F 74.91 27.55 . . . . B134 2 D M . . . . . . D135 2 R F 83.52 28.98 35 . . . . . 109 71 54237.2C136 2 S M 95 35.08 . . . . . . . . . A137 2 R F 79.23 27.47 38.58 132 47 81 33 90 113 80 46010.6A138 2 R F 78.95 27.43 37.56 198 66 130 54 85 105 79 43622.6B139 2 R M 87.79 27.39 38.42 143 57 82 61 87 99 70 57573.8C140 2 R F 90.64 32.08 . 133 61 61 57 79 121 86 54094.6D141 2 R M 102.64 30.08 40.5 109 41 49 197 80 125 73 74628.4B142 2 R M 103.5 36.16 41.73 . . . . . 115 71 73447.4B143 2 M . . A144 2 M . . C145 2 R F 71.11 31.78 33.46 88 100 70 43199.5D146 2 D F . . . . . . A147 2 R F 87.82 29.75 41.25 174 56 98 98 93 116 76 49082.3C148 2 R M 104.27 35.48 40.94 83 124 86 68320.1D149 2 R F 76.89 30.96 34.00 185 73 95 83 87 119 74 46557.7A150 2 R M 103.32 31.15 39.17 160 55 93 62 94 122 93 65142.9D151 2 R M 89.84 31.29 40.55 . . . . . 131 92 59130.8C152 2 R M 112.27 32.90 42 141 97 74123.7B153 2 R M 111.89 33.05 41 . . . . . 109 69 71750.3B154 2 R M 89.77 29.64 38.86 206 48 145 62 99 121 75 61450.5C155 2 R M 109.91 34.34 39 123 42 67 57 89 121 76 71364.2A156 2 R M 87.27 29.10 40.15 208 52 146 59 90 118 79 56658.2C157 2 M . . D158 2 R M 93.7 28.02 39.76 219 43 155 70 100 106 66 64254.5B159 2 R M 124.86 37.80 45.27 165 48 105 137 100 129 87 82307.8
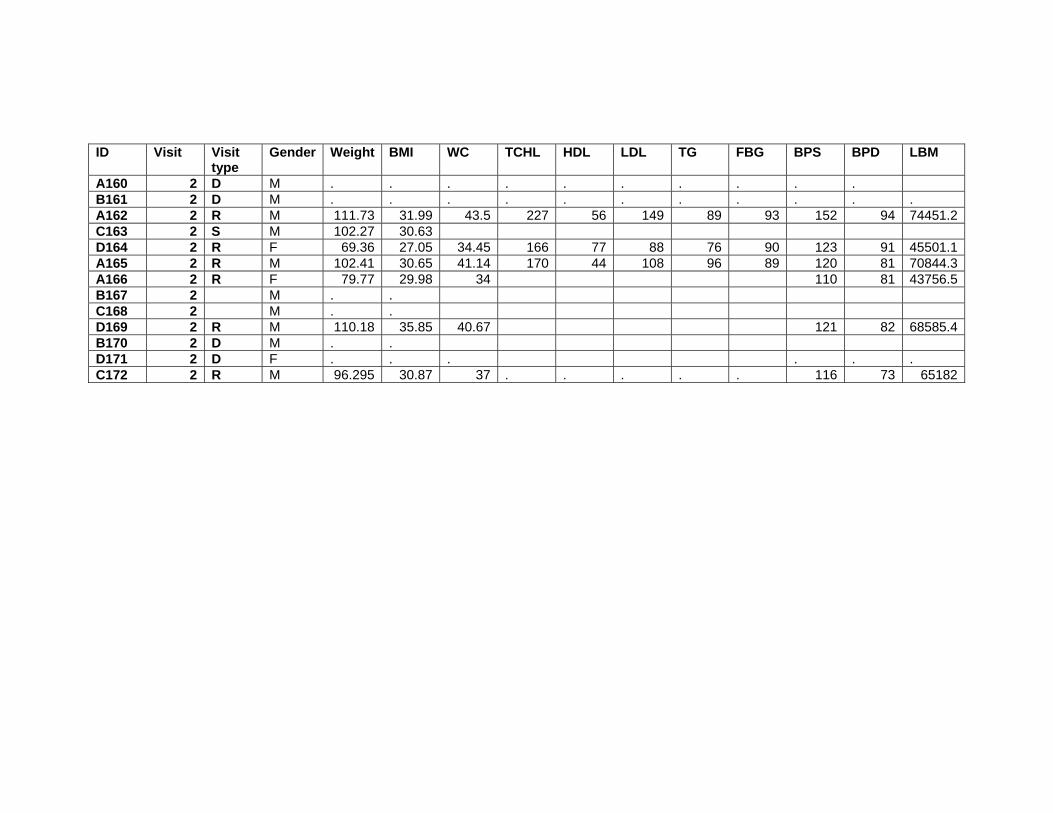
ID Visit Visit type
Gender Weight BMI WC TCHL HDL LDL TG FBG BPS BPD LBM
A160 2 D M . . . . . . . . . . B161 2 D M . . . . . . . . . . . A162 2 R M 111.73 31.99 43.5 227 56 149 89 93 152 94 74451.2C163 2 S M 102.27 30.63 D164 2 R F 69.36 27.05 34.45 166 77 88 76 90 123 91 45501.1A165 2 R M 102.41 30.65 41.14 170 44 108 96 89 120 81 70844.3A166 2 R F 79.77 29.98 34 110 81 43756.5B167 2 M . . C168 2 M . . D169 2 R M 110.18 35.85 40.67 121 82 68585.4B170 2 D M . . D171 2 D F . . . . . . C172 2 R M 96.295 30.87 37 . . . . . 116 73 65182
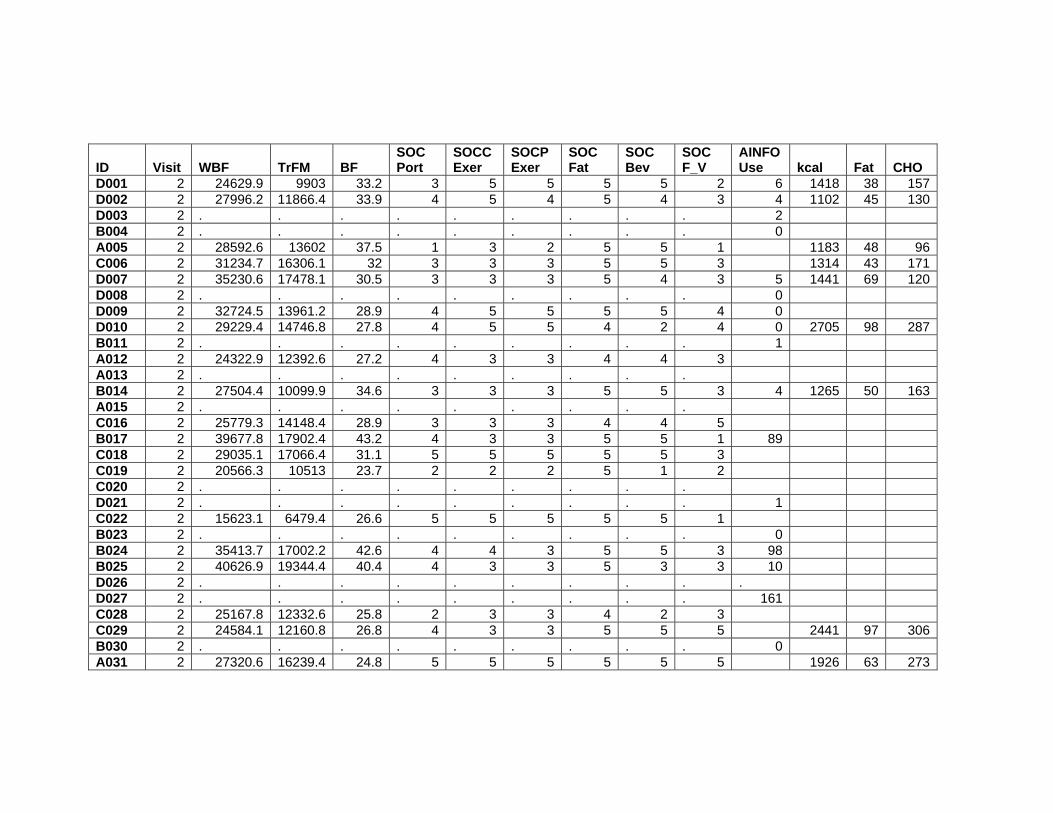
ID Visit WBF TrFM BF
SOC Port
SOCC Exer
SOCP Exer
SOC Fat
SOC Bev
SOC F_V
AINFO Use kcal Fat CHO
D001 2 24629.9 9903 33.2 3 5 5 5 5 2 6 1418 38 157D002 2 27996.2 11866.4 33.9 4 5 4 5 4 3 4 1102 45 130D003 2 . . . . . . . . . 2 B004 2 . . . . . . . . . 0 A005 2 28592.6 13602 37.5 1 3 2 5 5 1 1183 48 96C006 2 31234.7 16306.1 32 3 3 3 5 5 3 1314 43 171D007 2 35230.6 17478.1 30.5 3 3 3 5 4 3 5 1441 69 120D008 2 . . . . . . . . . 0 D009 2 32724.5 13961.2 28.9 4 5 5 5 5 4 0 D010 2 29229.4 14746.8 27.8 4 5 5 4 2 4 0 2705 98 287B011 2 . . . . . . . . . 1 A012 2 24322.9 12392.6 27.2 4 3 3 4 4 3 A013 2 . . . . . . . . . B014 2 27504.4 10099.9 34.6 3 3 3 5 5 3 4 1265 50 163A015 2 . . . . . . . . . C016 2 25779.3 14148.4 28.9 3 3 3 4 4 5 B017 2 39677.8 17902.4 43.2 4 3 3 5 5 1 89 C018 2 29035.1 17066.4 31.1 5 5 5 5 5 3 C019 2 20566.3 10513 23.7 2 2 2 5 1 2 C020 2 . . . . . . . . . D021 2 . . . . . . . . . 1 C022 2 15623.1 6479.4 26.6 5 5 5 5 5 1 B023 2 . . . . . . . . . 0 B024 2 35413.7 17002.2 42.6 4 4 3 5 5 3 98 B025 2 40626.9 19344.4 40.4 4 3 3 5 3 3 10 D026 2 . . . . . . . . . . D027 2 . . . . . . . . . 161 C028 2 25167.8 12332.6 25.8 2 3 3 4 2 3 C029 2 24584.1 12160.8 26.8 4 3 3 5 5 5 2441 97 306B030 2 . . . . . . . . . 0 A031 2 27320.6 16239.4 24.8 5 5 5 5 5 5 1926 63 273

ID Visit WBF TrFM BF
SOC Port
SOCC Exer
SOCP Exer
SOC Fat
SOC Bev
SOC F_V
AINFO Use kcal Fat CHO
C032 2 . . . . . . . . . A033 2 . . . . . . . . . C034 2 36872.6 18894.3 44.3 3 5 5 5 5 2 A035 2 36176 16467.4 30.6 1 4 4 4 5 5 B036 2 . . . . . . . . . 10 A037 2 24203.1 14267.5 27.3 4 5 5 5 5 3 2405 92 240A038 2 19810.6 11185.1 35 3 3 3 5 5 4 B039 2 . . . . . . . . . . A040 2 19605.3 7493 20.4 3 5 5 5 4 5 D041 2 18698.3 7811.7 19.8 3 5 5 5 5 5 3 B042 2 . . . . . . . . . . A043 2 . . . . . . . . . C044 2 37805.6 16774.5 32.4 1 5 5 5 5 3 1723 44 217C045 2 . . . . . . . . . D046 2 27537.3 14003.4 38.4 . . . . . . 8 A047 2 . . . . . . . . . C048 2 28746.9 12404.7 34.4 3 2 3 5 5 3 B049 2 13 A050 2 25409.4 15325.5 27.8 4 4 3 5 4 3 713 17 92B051 2 32718.4 19019.3 30.1 4 4 3 5 5 3 8 C052 2 . . . . . . . . . C053 2 . . . . . . . . . D054 2 25066.6 13718.5 25.3 4 4 2 5 5 2 59 C055 2 27909.2 11569.2 33.4 3 3 3 4 4 2 D056 2 32266.7 19137.6 31.1 32 D057 2 19304.6 9823.7 19.1 4 3 3 5 2 2 65 1705 83 172B058 2 . . . . . . . . . . D059 2 . . . . . . . . . 8 B060 2 29050.5 15728.9 28.7 3 5 3 5 4 1 7 B061 2 31151.5 18313.5 24.6 5 5 5 4 3 4 0 B062 2 36166.7 16744.2 45.4 3 3 3 5 5 5 3

ID Visit
WBF TrFM BF SOC Port
SOCC Exer
SOCP Exer
SOC Fat
SOC Bev
SOC F_V
AINFO Use
kcal Fat CHO
A063 2 34861 15916.9 35.1 3 3 3 3 5 3 B064 2 39948.4 18244.6 41.6 . . . . . . 19 1746 73 200A065 2 . . . . . . . . . C066 2 A067 2 32443.4 12437.6 40.2 2 3 4 5 5 3 A068 2 . . . . . . . . . C069 2 . . . . . . . . . D070 2 . . . . . . . . . . A071 2 . . . . . . . . . B072 2 25113.1 12088.6 31.3 3 3 3 5 5 3 35 A073 2 . . . . . . . . . D074 2 33937.4 13960.7 38.5 4 3 3 5 4 2 0 D075 2 28845.6 16593.6 29.8 3 3 3 5 5 2 45 B076 2 . . . . . . . . . . C077 2 . . . . . . . . . D078 2 34370 18769.6 32.4 1 3 3 5 5 1 1 A079 2 25330.4 13371.1 25.2 4 3 5 5 2 2 C080 2 . . . . . . . . . B081 2 23294.2 11290.9 22.8 4 5 5 5 5 4 0 B082 2 35683.5 15127.7 32.6 3 4 4 5 5 3 7 3986 167 514D083 2 . . . . . . . . . 42 A084 2 . . . . . . . . . C085 2 19472.2 9872.2 29.9 5 2 2 5 5 1 D086 2 . . . . . . . . . 5 D087 2 18339.6 8605.1 22.2 3 2 2 4 5 3 1 C088 2 43114 17286 40 A089 2 36555 21450.8 29 3 4 3 5 5 5 D090 2 . . . . . . . . . 43 A091 2 . . . . . . . . . A092 2 33497.8 18523.1 31.8 4 5 3 4 4 4 1887 60 227B093 2 28745.7 16362.1 26.9 4 5 4 5 4 1 0 D094 2 . . . . . . . . . 0

ID Visit
WBF TrFM BF SOC Port
SOCC Exer
SOCP Exer
SOC Fat
SOC Bev
SOC F_V
AINFO Use
kcal Fat CHO
B095 2 35431 20474.1 37.3 4 3 5 5 5 3 173 C096 2 29176.1 10315.3 37 4 3 3 5 4 4 A097 2 . . . . . . . . . C098 2 34401 16086.7 40.8 5 3 3 5 5 2 B099 2 40438.9 20981.1 45.1 . . . . . . 0 C100 2 34903.4 17130.9 35.5 4 5 5 5 4 4 A101 2 . . . . . . . . . C102 2 26784.7 14462.5 31.9 3 3 3 5 5 3 A103 2 21507.9 11475.3 28.2 4 4 4 5 4 4 A104 2 16651.7 7812.6 29.5 3 3 3 5 4 4 1902 84 230D105 2 0 D106 2 28878.1 14526.7 24.6 5 5 5 5 5 3 24 2104 84 206D107 2 30932.1 16974.3 27.2 0 1921 82 220B108 2 0 C109 2 A110 2 23442.9 11860.7 24.3 4 4 4 4 4 4 2376 112 263B111 2 22913 11427.7 34.5 3 5 5 5 5 3 0 D112 2 . . . 3 4 3 5 5 5 19 B113 2 26870.1 14643.7 25.3 3 5 5 5 5 4 46 1349 31 201C114 2 34029.1 15474.4 38.3 5 3 3 5 5 3 2058 77 268B115 2 22942.7 11794.9 27 3 3 3 5 5 5 96 1445 42 206C116 2 15590.9 8574 19.5 4 5 5 4 5 5 1381 53 148A117 2 27660.7 13707.5 38.8 4 3 3 5 3 5 1498 63 176C118 2 29769.1 14018.7 43.1 4 4 3 4 4 3 D119 2 . . . . . . . . . . D120 2 23745.4 13006.1 24.4 1 4 3 4 5 3 29 B121 2 28634.8 11978.5 31.5 4 4 4 5 4 4 0 1614 70 182D122 2 25682.5 13585.4 25.2 . . . . . . 0 C123 2 43709.9 24987 39.2 4 4 4 4 5 5 2539 70 373A124 2 35493.8 19519.2 33.7 4 3 3 4 3 4 B125 2 35204 16592.4 29.4 4 4 3 5 4 5 14 1390 30 205

ID Visit
WBF TrFM BF SOC Port
SOCC Exer
SOCP Exer
SOC Fat
SOC Bev
SOC F_V
AINFO Use
kcal Fat CHO
A126 2 28856.6 13397 33.8 1 2 2 5 5 3 A127 2 25544.1 11309.6 27.7 4 4 4 5 3 4 C128 2 34953.1 16817.5 37.6 4 2 2 4 2 4 2102 61 313B129 2 32660.1 15354.9 37.1 5 3 3 5 1 5 7 2099 54 344B130 2 25424.5 9156.1 35.1 5 3 3 5 5 5 1 1012 20 185D131 2 30411.7 11366.6 33.4 4 5 5 5 5 3 12 1821 58 183D132 2 17092.1 7892.6 18.3 4 4 5 5 4 3 5 C133 2 . . . . . . . . . B134 2 . . . . . . . . . . D135 2 25127.8 12005 30.4 3 3 3 5 3 3 21 C136 2 . . . . . . . . . A137 2 29643.8 12697 37.8 4 3 3 5 5 5 1485 48 208A138 2 31554.8 14140.5 40.4 4 3 3 5 1 5 1640 56 215B139 2 26449.2 12453.8 30.4 4 3 3 5 5 3 1 1520 59 162C140 2 33631.4 16319.9 37.1 3 3 3 4 5 5 D141 2 23264.7 12198.7 23 4 5 5 5 5 3 0 B142 2 24574.9 12893.2 24.3 4 5 5 5 5 5 0 B143 2 0 A144 2 C145 2 24633.8 10079.6 35.2 4 4 3 4 4 3 D146 2 . . . . . . . . . 0 A147 2 35296.5 18690.4 40.7 3 5 5 5 5 5 C148 2 31377.5 14144.8 30.5 4 4 3 5 4 5 D149 2 27048.8 10654.8 35.6 4 4 4 5 5 3 2 A150 2 34025.7 18186.5 33.3 3 4 3 5 5 3 2716 124 252D151 2 26873.5 15030.9 30.4 4 3 3 5 5 4 0 C152 2 32530.1 18135.9 29.4 4 3 3 5 1 5 1433 15 183B153 2 35308.1 16875.1 32 4 4 3 5 4 3 0 853 45 91B154 2 23971.4 11781.6 27.1 4 5 4 5 5 2 0 913 23 123C155 2 33698.5 14316.7 30.9 5 5 3 5 5 3 A156 2 26227.9 12836.5 30.5 4 4 3 4 3 5 1265 15 251

ID Visit
WBF TrFM BF SOC Port
SOCC Exer
SOCP Exer
SOC Fat
SOC Bev
SOC F_V
AINFO Use
kcal Fat CHO
C157 2 D158 2 25340.5 12915.3 27.4 5 5 5 5 5 5 12 B159 2 36424.6 18330 29.8 4 4 3 5 4 5 3 A160 2 . . . . . . . . . B161 2 . . . . . . . . . . A162 2 32065.7 17415.5 29.1 4 4 4 5 3 5 C163 2 D164 2 20485 6767.3 30 4 2 2 5 5 4 35 1338 29 219A165 2 27096.8 13190.3 26.8 4 3 3 5 4 3 875 29 38A166 2 32464.4 12570.3 41.2 5 5 5 5 4 2 B167 2 0 C168 2 D169 2 36478.7 18220.3 33.7 4 3 3 5 4 4 2 1511 47 204B170 2 0 D171 2 . . . . . . . . . . C172 2 27437.2 11809.7 28.8 5 4 3 5 5 4

ID Visit
Pro Per Fat
Per CHO
Per Pro Per ETOH FRUIT VEG GRAIN MEAT DAIRY
D001 2 36 24 44 10 22 0.2 1.6 2.9 3.2 1.1D002 2 49 36 47 17 4.5 1.6 0.8 5.9 0.1D003 2 B004 2 A005 2 45 36 32 15 15 0.2 1.2 4.1 3.8 1.3C006 2 63 29 52 19 1.4 2.6 6.7 4.7 1.0D007 2 69 43 34 19 4 0.0 1.5 5.8 5.8 1.5D008 2 D009 2 D010 2 102 32 42 15 10 4.2 1.9 9.3 9.1 1.3B011 2 A012 2 A013 2 B014 2 50 35 51 15 2.9 4.6 3.9 5.6 1.0A015 2 C016 2 B017 2 C018 2 C019 2 C020 2 D021 2 C022 2 B023 2 B024 2 B025 2 D026 2 D027 2 C028 2 C029 2 86 36 50 14 1.6 4.0 7.6 5.7 2.8B030 2 A031 2 71 29 56 14 1 2.9 5.4 7.0 6.4 0.4

ID Visit
Pro Per Fat
Per CHO
Per Pro Per ETOH FRUIT VEG GRAIN MEAT DAIRY
C032 2 A033 2 C034 2 A035 2 B036 2 A037 2 156 34 40 26 0.7 7.3 5.2 14.0 4.7A038 2 B039 2 A040 2 D041 2 B042 2 A043 2 C044 2 97 23 50 22 4 1.1 2.1 5.6 5.8 4.3C045 2 D046 2 A047 2 C048 2 B049 2 A050 2 47 22 51 26 1.3 8.3 1.4 4.8 0.8B051 2 C052 2 C053 2 D054 2 C055 2 D056 2 D057 2 69 44 40 16 0.3 2.5 6.9 5.5 1.2B058 2 D059 2 B060 2 B061 2 B062 2

ID Visit
Pro Per Fat
Per CHO
Per Pro Per ETOH FRUIT VEG GRAIN MEAT DAIRY
A063 2 B064 2 75 37 45 17 0.1 3.5 6.0 5.8 1.7A065 2 C066 2 A067 2 A068 2 C069 2 D070 2 A071 2 B072 2 A073 2 D074 2 D075 2 B076 2 C077 2 D078 2 A079 2 C080 2 B081 2 B082 2 118 37 51 11 3.4 3.2 9.4 8.5 5.1D083 2 A084 2 C085 2 D086 2 D087 2 C088 2 A089 2 D090 2 A091 2 A092 2 94 30 49 20 0.2 1.9 5.6 4.4 1.3B093 2

ID Visit
Pro Per Fat
Per CHO
Per Pro Per ETOH FRUIT VEG GRAIN MEAT DAIRY
D094 2 B095 2 C096 2 A097 2 C098 2 B099 2 C100 2 A101 2 C102 2 A103 2 A104 2 64 39 48 13 2.0 2.2 3.4 6.7 10.6D105 2 D106 2 97 36 39 18 6 0.0 3.7 8.0 8.2 1.3D107 2 77 38 45 16 0.0 3.8 6.8 6.7 1.0B108 2 C109 2 A110 2 102 42 44 17 4.4 3.3 4.9 15.1 0.5B111 2 D112 2 B113 2 75 20 59 22 0.3 5.8 6.3 3.0 3.3C114 2 83 34 52 16 1.2 2.8 7.5 4.7 4.5B115 2 75 26 57 20 2.2 4.5 5.1 5.4 3.1C116 2 68 34 43 19 6 2.4 5.4 3.1 7.1 1.3A117 2 60 37 47 16 0.6 1.1 5.2 5.7 1.8C118 2 D119 2 D120 2 B121 2 74 39 45 18 1.0 5.7 4.8 8.0 1.4D122 2 C123 2 118 25 58 18 4.4 3.0 7.7 4.3 2.0A124 2
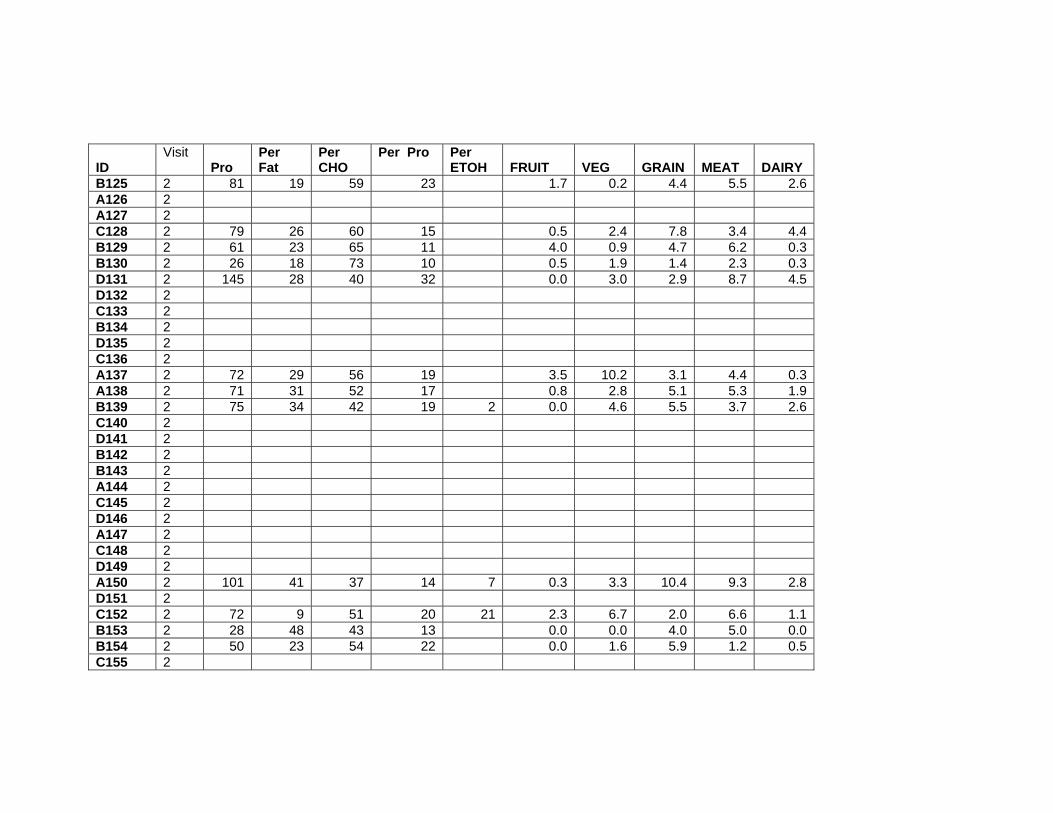
ID Visit
Pro Per Fat
Per CHO
Per Pro Per ETOH FRUIT VEG GRAIN MEAT DAIRY
B125 2 81 19 59 23 1.7 0.2 4.4 5.5 2.6A126 2 A127 2 C128 2 79 26 60 15 0.5 2.4 7.8 3.4 4.4B129 2 61 23 65 11 4.0 0.9 4.7 6.2 0.3B130 2 26 18 73 10 0.5 1.9 1.4 2.3 0.3D131 2 145 28 40 32 0.0 3.0 2.9 8.7 4.5D132 2 C133 2 B134 2 D135 2 C136 2 A137 2 72 29 56 19 3.5 10.2 3.1 4.4 0.3A138 2 71 31 52 17 0.8 2.8 5.1 5.3 1.9B139 2 75 34 42 19 2 0.0 4.6 5.5 3.7 2.6C140 2 D141 2 B142 2 B143 2 A144 2 C145 2 D146 2 A147 2 C148 2 D149 2 A150 2 101 41 37 14 7 0.3 3.3 10.4 9.3 2.8D151 2 C152 2 72 9 51 20 21 2.3 6.7 2.0 6.6 1.1B153 2 28 48 43 13 0.0 0.0 4.0 5.0 0.0B154 2 50 23 54 22 0.0 1.6 5.9 1.2 0.5C155 2

ID Visit
Pro Per Fat
Per CHO
Per Pro Per ETOH FRUIT VEG GRAIN MEAT DAIRY
A156 2 42 11 79 14 3.0 0.0 6.2 0.7 2.0C157 2 D158 2 B159 2 A160 2 B161 2 A162 2 C163 2 D164 2 44 19 65 13 4 3.7 4.8 2.6 2.5 0.7A165 2 107 30 17 49 0.0 2.1 0.7 14.1 0.0A166 2 B167 2 C168 2 D169 2 71 28 54 19 0.0 1.1 10.6 4.4 2.6B170 2 D171 2 C172 2

ID Visit Visit type Weight BMI WC TCHL HDL LDL TG FBG BPS BPD D001 3 D D002 3 D D003 3 D B004 3 D A005 3 R 78.66 29.06 37.40 203 61 122 77 93 111 69C006 3 R 99.36 31.54 44.00 181 61 101 157 115 131 85D007 3 D D008 3 D D009 3 R 107.38 30.94 40.60 172 49 109 76 84 133 80D010 3 R 108.77 33.82 43.25 123 87B011 3 D A012 3 D A013 3 D B014 3 R 80.16 27.29 34.45 88 103 64A015 3 D C016 3 R 91.72 30.64 40.43 106 71B017 3 R 94.41 31.72 36.81 178 82 81 75 105 104 78C018 3 D C019 3 D C020 3 D D021 3 D C022 3 R 59.00 24.50 32.00 109 68B023 3 D B024 3 R 88.36 31.87 35.00 91 114 88B025 3 R 92.77 36.80 38.58 221 48 154 187 97 118 86D026 3 D D027 3 D C028 3 R 68C029 3 R 91.90 29.48 38.58 120 74B030 3 D A031 3 R 109.77 32.69 42.52 152 31 97 150 86
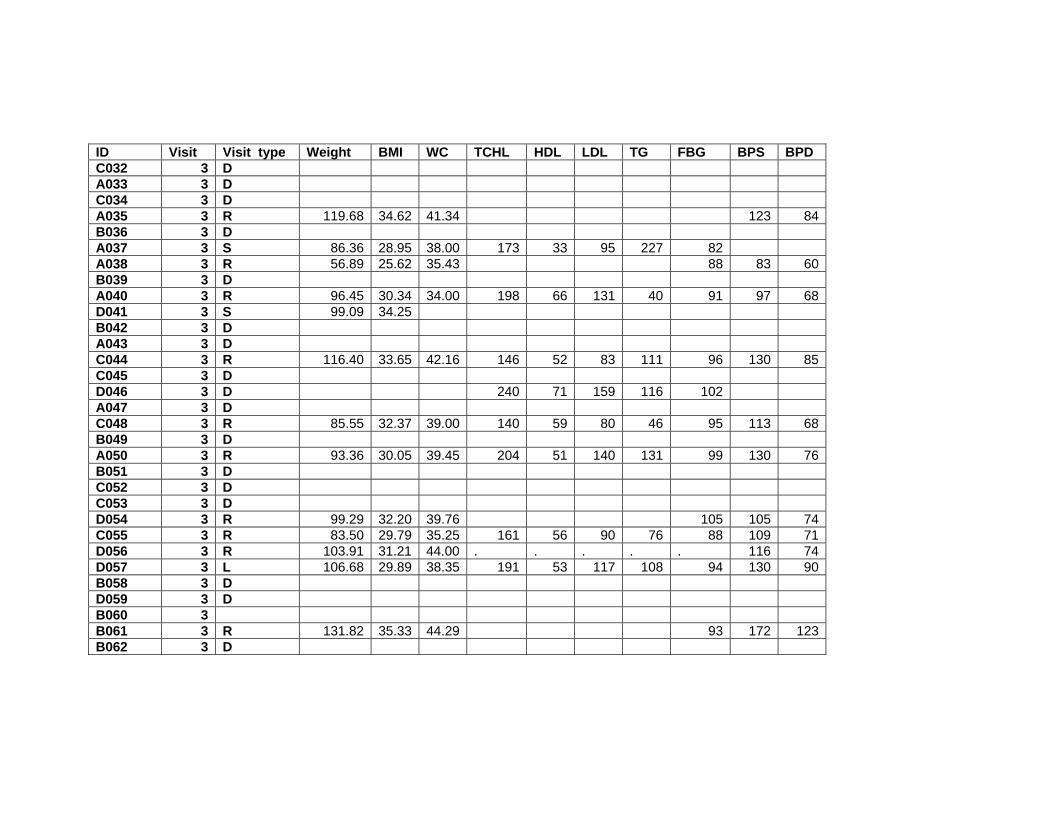
ID Visit Visit type Weight BMI WC TCHL HDL LDL TG FBG BPS BPD C032 3 D A033 3 D C034 3 D A035 3 R 119.68 34.62 41.34 123 84B036 3 D A037 3 S 86.36 28.95 38.00 173 33 95 227 82 A038 3 R 56.89 25.62 35.43 88 83 60B039 3 D A040 3 R 96.45 30.34 34.00 198 66 131 40 91 97 68D041 3 S 99.09 34.25 B042 3 D A043 3 D C044 3 R 116.40 33.65 42.16 146 52 83 111 96 130 85C045 3 D D046 3 D 240 71 159 116 102 A047 3 D C048 3 R 85.55 32.37 39.00 140 59 80 46 95 113 68B049 3 D A050 3 R 93.36 30.05 39.45 204 51 140 131 99 130 76B051 3 D C052 3 D C053 3 D D054 3 R 99.29 32.20 39.76 105 105 74C055 3 R 83.50 29.79 35.25 161 56 90 76 88 109 71D056 3 R 103.91 31.21 44.00 . . . . . 116 74D057 3 L 106.68 29.89 38.35 191 53 117 108 94 130 90B058 3 D D059 3 D B060 3 B061 3 R 131.82 35.33 44.29 93 172 123B062 3 D

ID Visit Visit type Weight BMI WC TCHL HDL LDL TG FBG BPS BPD A063 3 D B064 3 D A065 3 R 90.05 35.82 37.79 251 73 161 164 92 124 95C066 3 A067 3 D A068 3 D C069 3 D D070 3 D A071 3 R 82.82 29.95 35.74 208 67 112 143 92 151 97B072 3 D A073 3 R 89.86 34.03 36.61 150 52 96 58 89 143 99D074 3 R 99.84 32.81 39.17 . . . . . 123 87D075 3 D B076 3 D C077 3 R 102.25 29.98 42.13 101 126 81D078 3 A079 3 D C080 3 D B081 3 R 111.23 35.15 41.73 325 61 247 84 96 148 96B082 3 D D083 3 D A084 3 R 66.48 27.92 30.71 229 69 160 93 81 108 71C085 3 D D086 3 D087 3 D C088 3 D A089 3 D D090 3 D A091 3 R 107.57 36.50 44.69 188 46 118 118 93 121 84A092 3 B093 3 D

ID Visit Visit type Weight BMI WC TCHL HDL LDL TG FBG BPS BPD D094 3 B095 3 C096 3 D A097 3 R 85.91 29.68 34.30 214 62 121 155 86 123 74C098 3 B099 3 R 100.00 32.75 41.34 149 45 86 111 90 117 74C100 3 D A101 3 R 87.61 31.16 40.00 198 44 132 216 91 141 90C102 3 A103 3 R 57.32 28.30 31.10 137 60 67 83 88 116 75A104 3 D D105 3 R 121.14 36.32 40.75 199 51 135 106 109 140 98D106 3 R 115.64 32.99 42.32 202 36 138 211 99 137 92D107 3 D B108 3 D C109 3 R 93.84 26.53 37.44 175 50 112 59 82 118 79A110 3 B111 3 D112 3 R 107.36 29.90 41.73 237 39 138 328 100 123 74B113 3 R 85.54 29.17 39.76 132 91C114 3 R 88.04 30.04 39.25 216 44 151 64 92 116 67B115 3 R 80.00 26.73 34.25 181 46 121 125 95 112 77C116 3 R 74.52 31.63 36.61 155 48 107 54 116 107 78A117 3 R 71.59 29.81 38.50 . . . . . 104 79C118 3 D D119 3 D120 3 R 95.86 31.61 38.50 115 68B121 3 R 106.91 35.84 41.00 101 109 72D122 3 C123 3 R 106.32 33.08 42.52 241 37 172 125 87 116 87A124 3 S 116.98 36.19

ID Visit Visit type Weight BMI WC TCHL HDL LDL TG FBG BPS BPD B125 3 D A126 3 R 89.23 29.96 36.25 137 58 73 78 85 133 74A127 3 R 94.18 34.74 39.61 93 33 55 35 86 113 86C128 3 B129 3 R 74.77 28.58 31.29 221 63 158 71 97 116 64B130 3 R 91.27 32.00 36.61 182 72 99 113 90 118 77D131 3 R 94.98 32.56 37.00 144 97D132 3 R 71.91 26.45 35.16 113 73C133 3 D B134 3 R 82.04 28.46 35.10 106 66D135 3 C136 3 D A137 3 R 82.18 28.55 37.50 237 76 148 64 94 96 70A138 3 R 91.07 28.41 41.73 95 108 78B139 3 C140 3 D141 3 R 101.20 35.35 40.55 185 52 117 141 92 121 84B142 3 B143 3 A144 3 C145 3 D D146 3 A147 3 C148 3 D149 3 A150 3 D D151 3 C152 3 109.40 32.32 41.20 116 72B153 3 88.77 29.31 37.25 123 85B154 3 C155 3

ID Visit Visit type Weight BMI WC TCHL HDL LDL TG FBG BPS BPD A156 3 C157 3 D158 3 124.10 37.57 45.60 127 93B159 3 D A160 3 D B161 3 113.10 32.38 43.50 101 64A162 3 C163 3 D164 3 D A165 3 A166 3 B167 3 C168 3 D169 3 D B170 3 D D171 3 C172 3

ID Visit LBM WBF TrFM BF SOC Port
SOCC Exer
SOCP Exer
SOC Fat
SOC Bev
SOC F_V
D001 3 D002 3 D003 3 B004 3 A005 3 47808.8 27427.5 12731.0 35.4 1 5 5 5 5 1C006 3 63184.2 31646.2 16997.5 32.4 2 3 3 5 5 2D007 3 D008 3 D009 3 77112.8 25344.2 10536.3 23.9 4 5 5 5 5 4D010 3 72800 30723.4 16565.2 28.7 1 5 5 5 1 2B011 3 A012 3 A013 3 B014 3 48723.5 28189.6 11147.4 35.5 A015 3 . . . C016 3 61203.3 26461.0 14024.8 29.3 3 3 3 4 3 5B017 3 49080.8 41600.5 20125.0 44.6 C018 3 . . . C019 3 C020 3 . . . D021 3 . . . C022 3 41730.6 14545.7 6064.9 24.8 5 5 5 5 5 1B023 3 . . . B024 3 45562.6 39540.2 20072.0 45.3 B025 3 54311.4 34992.2 16967.5 38.1 4 3 3 5 5 5D026 3 . . . D027 3 . . . C028 3 24436.5 11219.3 24.5 4 3 3 5 3 4 24436.5C029 3 26276.7 13901.6 28.9 4 3 3 5 5 3 26276.7B030 3 . . .

ID Visit LBM WBF TrFM BF SOC Port
SOCC Exer
SOCP Exer
SOC Fat
SOC Bev
SOC F_V
A031 3 76120.7 28922.8 17051.4 26.6 4 5 5 5 5 76120.7C032 3 . . . . A033 3 . . . . C034 3 . . . . A035 3 76548.6 37237.2 17736.3 31.5 1 3 2 5 5 76548.6B036 3 . . . . A037 3 . . . . A038 3 34140.7 20129.2 11150.9 36.0 3 3 3 4 4 34140.7B039 3 . . . . A040 3 70463.5 21131.0 8271.0 22.2 4 5 2 4 5 70463.5D041 3 B042 3 . . . . A043 3 . . . . C044 3 71616.7 39716.4 17566.1 34.5 5 5 5 5 5 71616.7C045 3 . . . . D046 3 . . . . A047 3 . . . . C048 3 51858.2 30339.7 12410.2 35.7 3 3 3 5 5 51858.2B049 3 . . . . A050 3 65010.6 24315.4 14261.7 26.4 5 5 3 5 5 65010.6B051 3 . . . . C052 3 . . . . C053 3 . . . . D054 3 68970.6 25733.0 14591.8 26.2 3 3 2 5 5 68970.6C055 3 51046.5 28240.1 12976.2 34.1 51046.5D056 3 67411.7 31816.0 18590.7 31.1 67411.7D057 3 79236 21881.5 11142.8 20.8 2 3 3 5 5 79236B058 3 . . . . D059 3 . . . . B060 3

ID Visit LBM WBF TrFM BF SOC Port
SOCC Exer
SOCP Exer
SOC Fat
SOC Bev
SOC F_V
B061 3 89438.9 35627.6 20306.9 27.6 B062 3 . . . A063 3 65014.4 35499.9 15681.4 34.3 3 3 3 5 5 3B064 3 . . . A065 3 . . . C066 3 44383.9 41926.9 19014.9 47.3 3 3 3 5 4 4A067 3 A068 3 . . . C069 3 . . . D070 3 . . . A071 3 . . . B072 3 51611.9 27723.6 13655.9 33.9 3 3 3 5 5 3A073 3 . . . D074 3 52308.3 33926.5 13628.4 38.3 4 3 3 5 5 5D075 3 65456.1 29759.9 16658.6 30.3 3 3 3 5 5 2B076 3 . . . C077 3 . . . D078 3 66449.6 31125.1 16343.2 30.8 4 3 3 5 5 3A079 3 C080 3 B081 3 . . . B082 3 71833.7 34876.0 15009.7 31.8 3 4 4 5 5 3D083 3 . . . A084 3 . . . C085 3 44367.5 19008.0 8092.5 28.9 5 2 2 5 5 2D086 3 D087 3 C088 3 A089 3 D090 3 . . .

ID Visit LBM WBF TrFM BF SOC Port
SOCC Exer
SOCP Exer
SOC Fat
SOC Bev
SOC F_V
A091 3 A092 3 69048.6 33765.8 18520.6 31.9 3 5 5 5 5 4B093 3 D094 3 . . . B095 3 C096 3 A097 3 . . . C098 3 47447 35160.8 16843.9 41.2 4 3 3 5 5 3B099 3 C100 3 60905.5 34192.5 16513.8 35.0 5 5 5 5 5 5A101 3 . . . C102 3 56718.8 26602.3 14508.9 30.7 3 3 3 5 5 5A103 3 A104 3 36836.1 17701.1 7754.3 31.3 3 3 3 5 5 3D105 3 D106 3 85990.8 29425.3 15397.5 24.6 5 5 5 5 5 3D107 3 78388.4 32270.0 17926.0 28.3 3 3 3 5 3 3B108 3 C109 3 A110 3 67540.2 21637.8 10970.3 23.4 4 5 5 4 5 4B111 3 D112 3 B113 3 73690.3 28386.5 15410.0 26.9 4 5 5 5 5 3C114 3 50865 34333.8 16162.2 38.9 4 3 3 5 5 3B115 3 62410 22015.1 10460.7 25.3 3 4 4 4 4 3C116 3 60974.4 15154.1 8052.2 19.2 4 5 5 5 5 5A117 3 43467 27816.0 12968.5 37.9 5 3 3 5 5 5C118 3 38332.2 30465.1 14257.0 43.1 5 5 3 5 4 5D119 3 . . . D120 3

ID Visit LBM WBF TrFM BF SOC Port
SOCC Exer
SOCP Exer
SOC Fat
SOC Bev
SOC F_V
B121 3 64021.6 27091.0 11175.4 28.7 3 3 3 5 5 5D122 3 75593.4 26810.5 14134.9 25.4 3 5 1 3 3 3C123 3 A124 3 65292.5 35997.0 19387.0 34.5 5 3 3 5 2 5B125 3 A126 3 . . . A127 3 65148.2 19463.3 7402.8 22.1 4 4 4 5 3 2C128 3 55881.6 34003.0 16207.0 36.7 4 4 4 5 3 3B129 3 B130 3 45112.9 26196.2 9176.7 35.3 5 3 3 5 5 5D131 3 56143.7 31520.1 11374.6 34.9 4 5 5 5 5 3D132 3 73813.4 16587.0 7702.8 17.7 4 5 5 4 4 3C133 3 42300.5 25843.0 11438.2 36.5 4 4 4 5 5 2B134 3 D135 3 55593.4 22518.2 9761.5 27.7 4 3 3 5 4 5C136 3 A137 3 A138 3 45392.9 32459.6 14391.6 40.3 4 3 3 5 5 5B139 3 57990.8 28827.0 14503.7 32.1 3 3 3 5 5 3C140 3 D141 3 B142 3 72052.6 24616.6 13142.1 24.7 5 5 5 5 5 5B143 3 A144 3 C145 3 D146 3 . . . A147 3 C148 3 D149 3 A150 3

ID Visit LBM WBF TrFM BF SOC Port
SOCC Exer
SOCP Exer
SOC Fat
SOC Bev
SOC F_V
D151 3 C152 3 B153 3 70867.8 33385.4 15517.0 31.0 4 4 3 5 4 3B154 3 61941.5 23020.0 10639.6 26.2 4 4 3 5 5 2C155 3 A156 3 C157 3 D158 3 B159 3 81907 34775.5 17661.0 29.0 5 5 5 5 5 4A160 3 . . . B161 3 . . . A162 3 76614.2 31657.8 17686.3 28.3 3 5 3 5 3 3C163 3 D164 3 A165 3 A166 3 B167 3 C168 3 D169 3 B170 3 . . . D171 3 C172 3

213
REFERENCES
1. Flegal K, Carroll M, Ogden C, Johnson C. Prevalence and trends in obesity
among US adults, 1999-2000. JAMA 2002;288:1723-1727.
2. Lindquist C, Bray R. Trends in overweight and physical activity among U.S.
Military Personnel, 1995-1998. Prev Med 2001;32:57-65.
3. Institute of Medicine, The National Academies. Weight Management: State of the
Science and Opportunities for Military Programs. Washington, DC: The National
Academies Press, 2003.
4. Bradham D, South B, Saunders H, Heuser M, Pane K, Dennis K. Obesity-related
hospitalization costs to the U.S. Navy, 1993 to 1998. Mil Med 2001;166:1-10.
5. Kress A, Hartzel M, Peterson M. Burden of disease associated with overweight
and obesity among U.S. military retirees and their dependents, aged 38-64, 2003.
Prev Med 2005;41:63-69.
6. Spake A. Fat, but soldiering on. U.S. News & World Report 2003 October 27:70-
71.
7. Brownell K. The LEARN Program for Weight Control. 6th ed. Dallas, TX:
American Health Publishing Company, 1994.
8. Brownell K, Cohen L. Adherence to dietary regimens 2: Components of effective
interventions. Behavioral Medicine 1995;20:155-169.
9. Kristal A, Glanz K, Curry S, Patterson R. How can stages of change be best used
in dietary interventions? J Am Diet Assoc 1999;99:679-684.
10. Molaison E. Stages of change in clinical nutrition practice. Nutr Clin Care
2002;5:251-157.

214
11. Greene G, Rossi S, Rossi J, Velicer W, Fava J, Prochaska J. Dietary applications
of the stages of change model. J Am Diet Assoc 1999;99:673-678.
12. NIH, NHLBI, NAASO. The Practical Guide: Identification, Evaluation and
Treatment of Overweight and Obesity in Adults. NIH Publication 00-4084.
Bethesda, MD, 2000:1-42.
13. Brownell K. The central role of lifestyle change in long-term weight management.
Clin Cornerstone 1999;2:43-51.
14. NHLBI. Executive summary of the clinical guidelines on the identification,
evaluation, and treatment of overweight and obesity in adults. Archives of
Internal Medicine 1998;158:1855-1867.
15. Foreyt J, Poston W. The role of the behavioral counselor in obesity treatment. J
Am Diet Assn 1998;98 (suppl 2):S27-S30.
16. Dattilo A, Kris-Etherton P. Effects of weight reduction on blood lipids and
lipoproteins: a meta-analysis. Am J Clin Nutr 1992;56:320-328.
17. Poobalan A, Aucott L, Smith W, et al. Effects of weight loss in overweight/obese
individuals and long-term lipid outcomes - a systematic review. Obesity Reviews
2004;5:43-50.
18. Prochaska J, DiClemente C. Transtheoretical therapy: Toward a more integrative
model of change. Psychotherapy: Theory, Research and Practice 1982;20:161-
173.
19. Prochaska J, DiClemente C. Stages and processes of self-change in smoking:
Toward an integrative model of change. Journal of Consulting and Clinical
Psychology 1983;5:390-395.

215
20. Prochaska J, Redding C, Evers K. The Transtheoretical Model and Stages of
Change. In: Glanz K, Rimer B, Lewis F, eds. Health Behavior and Health
Education. 3rd ed. San Francisco, CA: Jossey-Bass, 2002:99-120.
21. Ni Mhurchu C, Margetts B, Speller V. Applying the stages of change model to
dietary change. Nutr Rev 1997;55:10-16.
22. Adams J, White M. Are activity promotion interventions based on the
transtheoretical model effective? A critical review. British Journal of Sports
Medicine 2003;37:106-114.
23. Marshall S, SJH B. The transtheoretical model of behavior change: a meta-
analysis of applications to physical activity and exercise. Ann Behav Med
2001;23:229-246.
24. Prochaska J, Norcross J, Fowler J, Follick M, Abrams D. Attendance and
outcome in a work site weight control program: Processes and stages of change as
process and predictor variables. Addictive Behaviors 1992;17:35-45.
25. Macqueen C, Brynes A, Frost G. Treating obesity: A follow-up study. Can the
stages of change model be used as a postal screening tool? J Hum Nutr Dietet
2002;15:3-7.
26. Jeffery R, French S, Rothman A. Stage of change as a predictor of success in
weight control in adult women. Health Psy 1999;18:543-546.
27. Logue E, Sutton K, Jarjoura D, Smucker W. Obesity management in primary
care: Assessment of readiness to change among 284 family practice patients. J
Am Board Fam Pract 2000;13:164-171.

216
28. O'Connell D, Velicer W. A decisional balance measure and the stages of change
model for weight loss. The International Journal of Addictions 1988;23:729-750.
29. Rossi S, Rossi J, Rossi-DelPrete L, Prochaska J, Banspach S, Carleton R. A
processes of change model for weight control for participants in community-based
weight loss programs. The International Journal of Addictions 1994;29:161-177.
30. Sutton K, Logue E, Jarjoura D, Baughman K, Smucker W, Capers C. Assessing
dietary and exercise stage of change to optimize weight loss interventions. Obes
Res 2003;11:641-652.
31. Kreuter M, Bull F, Clark E, Oswald D. Understanding how people process health
information: A comparison of tailored and nontailored weight-loss materials.
Health Psy 1999;18:487-494.
32. Campbell M, DeVellis B, Strecher M, Ammerman A, DeVellis R, Sandler R.
Improving dietary behavior: The effectiveness of tailored messages in primary
care settings. Am J Public Health 1994;84:783-787.
33. Prochaska J. Working in harmony with how people change naturally. Weight
Control Digest 1993;3:249-255.
34. Tate D, Wing R, Winett R. Using Internet technology to deliver a behavioral
weight loss program. JAMA 2001;285:1172-1177.
35. Brug J, Campbell M, van Assema P. The application and impact of computer-
generated personalized nutrition education: A review of the literature. Patient
Education and Counseling 1999;36:145-156.
36. Brug J, Oenema A, Campbell M. Past, present, and future of computer-tailored
nutrition education. Am J Clin Nutr 2003;77(suppl):1028S-1034S.

217
37. Oenema A, Brug J, Lechner L. Web-based tailored nutrition education: results of
a randomized controlled trial. Health Ed Res 2001;16:647-660.
38. Block G, Block T, Wakimoto P, Block C. Demonstration of an e-mailed worksite
nutrition intervention program. Preventing Chronic Disease 2004;1:1-13.
39. Harvey-Berino J, Pintauro S, Gold E. The feasibility of using Internet support for
the maintenance of weight loss. Behavior Modification 2002;26:103-116.
40. Serdula M, Khan L, Dietz W. Weight loss counseling revisited. JAMA
2003;289:1747-1750.
41. Tate D, Jackvony E, Wing R. Effects of Internet behavioral counseling on weight
loss in adults at risk for type 2 diabetes. JAMA 2003;289:1833-1836.
42. Harvey-Berino J, Pintauro S, Buzzell P, Gold E. Effect of Internet support on the
long-term maintenance of weight loss. Obes Res 2004;12:320-329.
43. Robinson J, Conroy C, Wickemeyer W. A novel telephone-based system for
management of secondary prevention to a low-density lipoprotein cholesterol
<100 mg/dL. Am J Cardiol 2000;85:305-308.
44. McNulty P. Prevalence and contributing factors of eating disorder behaviors in
active duty service women in the Army, Navy, Air Force and Marines. Mil Med
2001;166:53-58.
45. Sweeney S, Bonnabeau R. Positive and negative health behaviors used to ensure
compliance with the U.S. Army's control standards by a reserve component unit.
Mil Med 1990;155:255-260.

218
46. Rinke W, Herzberger J, Erdtmann F. The Army Weight Control Program: A
comprehensive mandated approach to weight control. J Am Diet Assoc
1985;85:1429-1436.
47. Veverka D, Anderson J, Auld G, Coulter G, Kennedy C, Chapman P. Use of
stages of change model in improving nutrition and exercise habits in enlisted Air
Force men. Mil Med 2003;168:373-379.
48. Dennis K, Pane K, Adams B, Qi B. The impact of a shipboard weight control
program. Obes Res 1999;7:60-67.
49. James L, Folen R, Page H, Noce M, Brown J, Britton C. The Tripler LEAN
program: A two-year follow-up report. Mil Med 1999;164:389-395.
50. Davis M. A comprehensive weight-loss program for soldiers. Mil Med
1996;161:84-88.
51. Reed G, Velicer W, Prochaska J, Rossi J, Marcus B. What makes a good staging
algorithm: Examples from regular exercise. Am J Health Promotion 1997;12:57-
66.
52. Ma J, Betts N, Georgiou C, White A. Assessing stages of change for fruit and
vegetable intake in young adults: a combination of traditional staging algorithms
and food-frequency questionnaires. Health Ed Res 2003;18:224-236.
53. Schumann A, Estabrooks P, Nigg C, Hill J. Validation of stages of change with
mild, moderate, and strenuous physical activity behavior, intentions, and self-
efficacy. Int J Sports Med 2003;24:363-365.

219
54. Willis G. Cognitive Interviewing and Questionnaire Design: A Training Manual.
In: Cognitive Methods Staff, ed. Working Paper Series, No. 7. Hyattsville, MD:
National Center for Health Statistics, 1994:49.
55. Willis G. Cognitive Interviewing: A "How To" Guide. Research Triangle
Institute, 1999:http://appliedresearch.cancer.gov/areas/cognitive/interview.pdf.
56. Lechner L, Brug J, De Vries H. Misconceptions of fruit and vegetable
consumption: Differences between objective and subjective estimation of intake.
JNEB 1997;29:313-320.
57. Curry S, Kristal A, Bowen D. An application of the stage model of behavior
change to dietary fat reduction. Health Ed Res 1992;7:97-105.
58. Glanz K, Patterson R, Kristal A, et al. Stages of change in adopting healthy diets:
Fat, fiber, and correlates of nutrient intake. Health Ed Quarterly 1994;21:499-519.
59. Greene G, Rossi S, Reed G, Willey C, Prochaska J. Stages of change for reducing
dietary fat to 30% of energy or less. J Am Diet Assoc 1994;94:1105-1110.
60. Evers K, Prochaska J, Prochaska J, Driskell M, Cummins C, Velicer W. Strengths
and weaknesses of health behavior change programs on the Internet. Journal of
Health Psychology 2003;8:63-70.
61. RENO Diet-Heart Study Staff. Baseline Questionnaires. In: St. Jeor S, ed. Obesity
Assessment: Tools, Methods, Interpretations. New York, NY: Chapman & Hall,
1997:654-716.
62. Lohman T, Roche A, Martorell R. Anthropometric standardization reference
manual. Champaign, IL: Human Kinetics Books, 1988.

220
63. Hendrix L, Carter M, Scott D. Covariance Analyses with Heterogeneity of Slopes
in Fixed Models. Biometrics 1982;38:641-650.
64. Grundy S, Cleeman J, Daniels S, et al. Diagnosis and management of the
metabolic syndrome: An American Heart Association/National Heart, Lung and
Blood Institute Scientific Statement. Circulation 2005;112:2735-2752.
65. NIH, NHLBI, NCEP. Third report of the National Cholesterol Education Program
(NCEP) Expert Panel on: Detection, evaluation, and treatment of high blood
cholesterol in Adults (Adult Treatment Panel III). NIH Publication No. 02-5215,
2002:1-284.
66. Gallagher D, Heymsfield S, Heo M, Jebb S, Murgatroyd P, Sakamoto Y. Healthy
percentage body fat ranges: an approach for developing guidelines based on body
mass index. Am J Clin Nutr 2000;72:694-701.
67. Blackburn G. Effect of degree of weight loss on health benefits. Obes Res
1995;3:211s-216s.
68. Goldstein D. Beneficial effects of modest weight loss. Int J Obes 1992;16:397-
415.
69. National Institutes of Health, National Heart Lung and Blood Institute Obesity
Education Initiative Expert Panel, North American Association for the Study of
Obesity. Identification Evaluation and Treatment of Overweight and Obesity in
Adults. Bethesda, MD, 1998:1-77.
70. Heshka S, Anderson J, Atkinson R, et al. Weight loss with self-help compared
with structured commerical program. JAMA 2003;289:1792-1798.

221
71. Womble L, Wadden T, McGuckin B, Sargent S, Rothman R, Krauthamer-Ewing
E. A randomized controlled trial of a commercial Internet weight loss program.
Obes Res 2004;12:1011-1018.
72. Logue E, Sutton K, Jarjoura D, Smucker W, Baughman K, Capers C.
Transtheoretical model-chronic disease care for obesity in primary care: A
randomized trial. Obes Res 2005;13:917-927.
73. Stefanick M. Exercise and weight control. Exer Sport Sci Rev 1993;21:363-396.
74. Schwartz M, Brownell K. Matching individuals to weight loss treatments: A
survey of obesity experts. Journal of Consulting and Clinical Psychology
1995;63:149-153.
75. Booth S, Sallis J, Ritenbaugh C, et al. Environmental and societal factors affect
food choice and physical activity: Rationale, influences, and leverage points. Nutr
Rev 2001;59:S21-S39.
76. Egger G, Swinburn B. An "ecological" approach to the obesity pandemic. BMJ
1997;315:477-480.
77. French S, Story M, Jeffery R. Environmental influences on eating and physical
activity. Ann Rev Public Health 2001;22:309-335.
78. Hill J, Peters J. Environmental contributions to the obesity epidemic. Science
1998;280:1371-1374.
79. Swinburn B, Egger G, Raza F. Dissecting obesogenic environments: The
development and application of a framework for identifying and prioritizing
environmental interventions for obesity. Prev Med 1999;29:563-570.

222
80. Sallis J, Owen N. Ecological Models of Health Behavior. In: Glanz K, Rimer B,
Lewis F, eds. Health Behavior and Health Education. 3rd ed. San Francisco:
Jossey-Bass, 2002:462-484.
81. Trent L, Stevens L. Evaluation of the Navy's obesity treatment program. Mil Med
1995;160:326-330.
82. Williams G, Grow V, Freedman Z, Ryan R, Deci E. Motivational predictors of
weight loss and weight-loss maintenance. Journal of Personality and Social
Psychology 1996;70:115-126.
83. McTigue K, Harris R, Hemphill B, et al. Screening and interventions for obesity
in adults: Summary of the evidence for the U.S. Preventive Services Task Force.
Ann Intern Med 2003;139:933-949.
84. Lean M. Obesity-what are the current treatment options? Exp Clin Endocrinol
Diabetes 1998;106 Suppl 2:22-26.
85. Boutelle K, Kirschenbaum D. Further support for consistent self-monitoring as a
vital component of successful weight control. Obes Res 1998;6:219-224.
86. Baker R, Kirschenbaum D. Self-monitoring may be necessary for successful
weight control. Behav Ther 1993;24:377-394.
87. Skov A, Toubro S, Ronn B, Holm L, Astrup A. Randomized trial on protein vs.
carbohydrate in ad libitum fat reduced diet for the treatment of obesity. Int J Obes
Relat Metab Disord 1999;23:528-536.
88. Kreuter M, Oswald D, Bull F, Clark E. Are tailored health education materials
always more effective than non-tailored materials? Health Ed Res 2000;15:305-
315.

223
89. Nasser R, Cook S, Dorsch K, Haennel R. Comparison of two nutrition education
approaches to reduce dietary fat intake and serum lipids reveals registered
dietitians are effective at disseminating information regardless of the educational
approach. J Am Diet Assn 2006;106:850-859.
90. Macqueen C, Byrnes A, Frost G. Treating obesity: can stages of change model
help predict outcome measures? J Hum Nutr Diet 1999;12:229-236.
91. Brug J, Conner M, Harre N, Kremers S, McKeller S, Whitelaw S. The
Transtheoretical Model and stages of change: a critique. Health Ed Res
2005;20:244-258.
92. Adams J, White M. Why don't stage-based activity promotion interventions
work? Health Ed Res 2005;20:237-243.
93. Povey R, Conner M, Sparks P, James R, Shepherd R. A critical examination of
the application of the Transtheoretical Model's stages of change to dietary
behaviours. Health Ed Res 1999;14:641-651.
94. Whitelaw S, Baldwin S, Bunton R, Flynn D. The status of evidence and outcomes
in Stages of Change research. Health Ed Res 2000;15:707-718.
95. Harvey-Berino J, Pintauro S, Buzzell P, et al. Does using the Internet facilitate the
maintenance of weight loss? International Journal of Obesity 2002;26:1254-1260.
96. Brug J, Oenema A, Kroeze W, Raat H. The Internet and nutrition education:
challenges and opportunities. Eur J Clin Nutr 2005;59, Suppl 1:S130-S139.
97. Wylie-Rosett J, Swencionis C, Ginsberg M, et al. Computerized weight loss
intervention optimizes staff time: the clinical and cost results of a controlled

224
clinical trial conducted in a managed care setting. J Am Diet Assn
2001;101:1155-1162.
98. Wantland D, Portillo C, Holzemer W, Slaughter R, McGhee E. The effectiveness
of web-based vs. non-web-based interventions: A meta-analysis of behavioral
change outcomes. Journal of Medical Internet Research www.jmir.org
2004;6:e40.
99. Tate D, Zabinski M. Computer and Internet applications for psychological
treatment: Update for clinicians. J Clin Psychol 2004;60:209-220.
100. Klem M, Wing R, McGuire M, Seagle H, Hill J. A descriptive study of
individuals successful at long-term maintenance of substantial weight loss. Am J
Clin Nutr 1997;66:239-246.
101. Strecher V, Wang C, Derry H, Wildenhaus K, Johnson C. Tailored interventions
for multiple risk behaviors. Health Ed Res 2002;17:619-626.
102. Campbell M, Tessaro I, DeVellis B, et al. Tailoring and targeting a worksite
health promotion program to address multiple health behaviors among blue-collar
women. Am J Health Promotion 2000;14:306-313.
103. Honas J, Early J, Frederickson D, O'Brian M. Predictors of attrition in a large
clinic-based weight-loss program. Obes Res 2003;11:888-894.
104. Grave R, Calugi S, Molinari E, et al. Weight loss expectations in obese patients
and treatment attrition: An observational multicenter study. Obes Res
2005;13:1961-1969.
105. Marcus B, Simkin L. The stages of exercise behavior. J Sports Med Phys Fitness
1993;33:83-88.
225
106. Logue E, Jarjoura D, Sutton K, Smucker W, Baughman K, Capers C.
Longitudinal relationship between elapsed time in the action stages of change and
weight loss. Obes Res 2004;12:1499-1508.
107. Greene G, Rossi S. Stages of change for reducing dietary fat intake over 18
months. J Am Diet Assn 1998;98:529-534.
108. Jones H, Edwards L, Vallis T, et al. Changes in diabetes self-care behaviors make
a difference in glycemic control. Diabetes Care 2003;26:732-737.
109. Lichtman S, Pisarska K, Berman E, et al. Discrepancy between self-reported and
actual caloric intake and exercise in obese subjects. N Engl J Med
1992;327:1893-1898.
110. Tooze J, Subar A, Thompson F, Troiano R, Schatzkin A, Kipnis V. Psychosocial
predictors of energy underreporting in a large doubly labeled water study. Am J
Clin Nutr 2004;79:795-804.
111. Brug J, van Assema P, Kok G, Lenderink T, Glanz K. Self-rated dietary fat
intake: Association with objective assessment of fat, psychosocial factors, and
intention to change. JNEB 1994;26:218-223.
112. Wagner T, Goldstein M. Behavioral interventions and cost-effectiveness analysis.
Prev Med 2004;39:1208-1214.