acoustic emission in diesel engines a time series … emission in diesel engines – towards a time...
TRANSCRIPT
Acoustic emission in diesel engines – towards a time series model for the
injection process
Wael ABDOU, Nikolaos BALODIMOS, Bob REUBEN
1 Mechanical Engineering, School of Engineering and Physical Sciences, Heriot-Watt University; Edinburgh,
UK
Phone: +44 131 451 3615, e-mail: [email protected]
Abstract
Acoustic emission is a very useful tool for monitoring diesel engines as it is sensitive to a number of the
phenomena going on inside the engine, and one which can provide useful diagnostic information. Many authors
have commented on the monitoring of combustion processes, valve actions, cylinder-liner interactions and fuel
injection using AE.
One of the main problems in monitoring engines is the multiplicity of sources, only partly alleviated in very
large engines where the cylinders are physically separated from each other. Another significant problem is that
the structure of a given source (say combustion) may itself be quite complex, necessitating a sub-analysis of
windowed-out parts of the time series.
In this work, we focus on the AE generated during diesel injection. A set of experiments have been devised
whereby a standard injector pump is used to open an injector which vents into a cylinder at ambient pressure,
with and without a pressure sensor attached to the injector feed pipe. This approach was taken with a view to
developing a physical model of the AE generated during fuel injection as a function of engine (i.e. injector
pump) speed. The simulated signals from this model are then compared with signals recorded on a running
engine using the same injectors and pump.
.
Keywords: Acoustic Emission, Diesel engine, injectors
1. Introduction
Fuel injection is central to the efficient operation of diesel engines, and developments in the
control of air and fuel delivery are essential to meet more and more stringent requirements on
emissions and fuel efficiency [1]. In addition, the potential for diesel engines to use
alternative fuels to standard diesel, requires more effective and flexible monitoring of fuel
injection. The hydraulic behaviour of the injector pump, tubing and injectors is quite complex,
involving pressure waves which travel at the speed of sound between the pump and the
injector [2], and whose interaction with the injectors constitutes a dynamical system which
influences the duration, timing and pressure of the injection process. The pressure waves may
be reflected at the nozzle in a form which depends upon whether it is open or closed, further
complicating the process [3]. Many modern engines have electronic management of the
injectors to introduce active control and dynamic models already exist for the analysis and
vibration monitoring of the injection process [4, 5].
Many authors have commented on the usefulness of acoustic emission (AE) in condition
monitoring of diesel engines due to its sensitivity to a wide range of the mechanical and fluid-
mechanical phenomena which occur during the engine cycle [6]. For example, it has been
shown [7, 8] that individual events and processes (such as valve opening and closure and the
30th European Conference on Acoustic Emission Testing & 7th International Conference on Acoustic Emission University of Granada, 12-15 September 2012
www.ndt.net/EWGAE-ICAE2012/

injection and combustion processes) can be located successfully in space and time using AE
due to its high temporal resolution and capacity for source location.
Gill et al. [9] were probably the first to demonstrate that AE could be used for the detection of
irregularities in fuel supply in diesel engines all the way to complete fuel starvation. Later,
Gill et al. [10] showed that injector discharge pressure can be monitored effectively by using
AE and that both the point of increase in fuel pressure and the opening of the injector nozzle
can be detected. Working with large marine diesel engines, Douglas et al. [11] successfully
correlated the peak amplitude of the AE recorded on the cylinder head during the
injection/combustion period with the standard deviation of the instantaneous crankshaft
angular velocity waveform, an indication of power output of the engine.
Apart from the early work of Gill et al. [9], part of which used hand-pumped injectors, most
researchers have used running engines in which it is difficult to separate the AE associated
with injection, from that resulting from other sources, most notably combustion. This is made
even more difficult in smaller engines where the potential sources are very close to each
other, in both time and space. The purpose of the current work is therefore to supplement the
existing understanding of the sources of AE in injectors by carrying out measurements on an
injector rig, where the conditions of injection and the system configuration can more easily be
varied and where other AE sources are avoided.
2. Experimental set-up
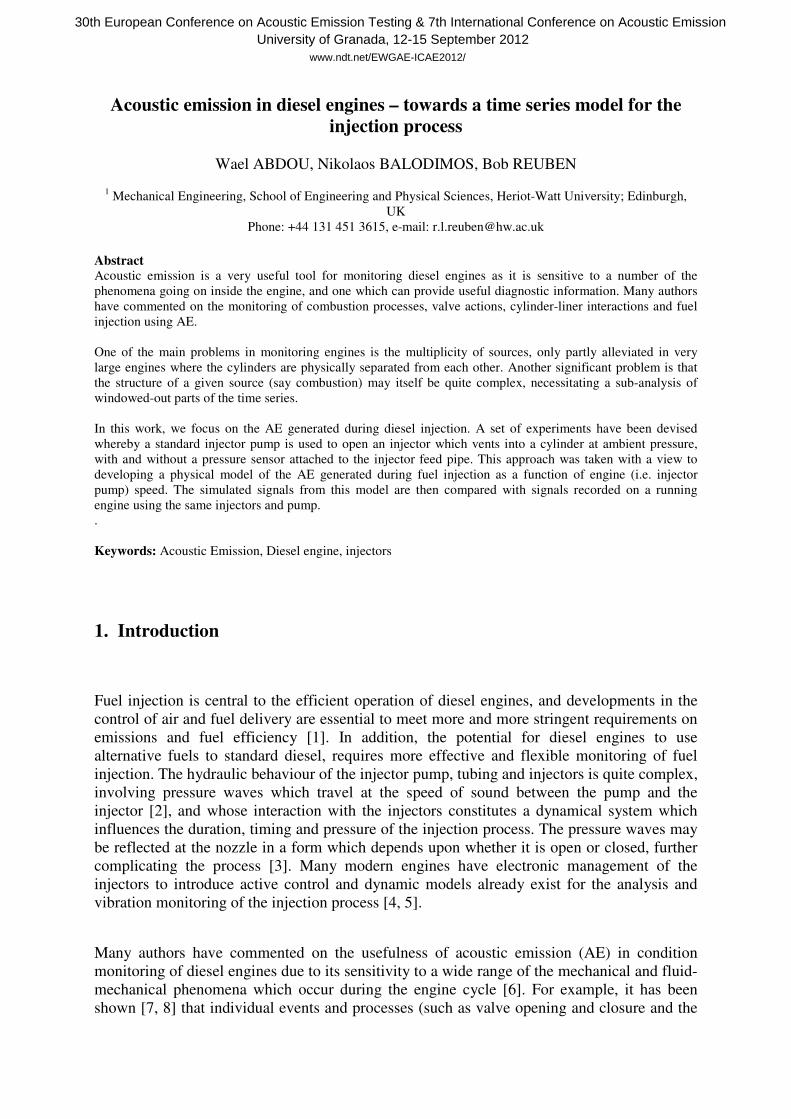
The main set of experiments involved an experimental rig (Figure 1), designed to simulate the
diesel injection process. A Bosch VE diesel injection pump directly driven by an electric
motor with a speed controller was used to deliver fuel to four, multi-hole, long stem Lucas
injectors. One of the injectors was mounted to a cylindrical chamber with glass viewports and
one AE sensor (Sensor 1) was attached to the shank of the injector while a second sensor
(Sensor 2) was attached to the pump outlet port. The other three injectors were mounted to a
return tank. The monitored injector was connected to the pump using a 105 cm long feed line,
the same length as used for the engine for which it was designed (a four stroke, four cylinder
engine) so that its rotational speed was half the engine rotational speed. In a parallel set of
experiments, a pressure transducer mounted into a solid block was introduced half way along
the fuel line. In total, five different motor speeds were used, ranging from 1500 rpm to 2500
rpm with increments of 250 rpm, under two different fuel throttle positions (minimum and
maximum). A 360-segment shaft encoder was used to record the motor speed and to provide a
measure of instantaneous speed of the motor shaft.
The results were compared with an earlier set of experiments, carried out on a 46 kW, 4.42
litre, four-cylinder, wet-lined Perkins A4.270 diesel engine which uses the same injectors,
pump and fuel lines. These experiments were performed with no load and for five different
crankshaft speeds; 900, 1200, 1500, 1800, and 2100 rpm (equivalent to 450, 600, 750, 900,
and 1050 rpm of the fuel injection pump). Two AE sensors were mounted on the cylinder
head, Sensor 1 being adjacent to Injector 1 and Sensor 2 adjacent to Injector 4 (Figure 2) and,
again, a 360-segment shaft encoder was used to record the motor speed and to provide a
measure of instantaneous crankshaft angular velocity.
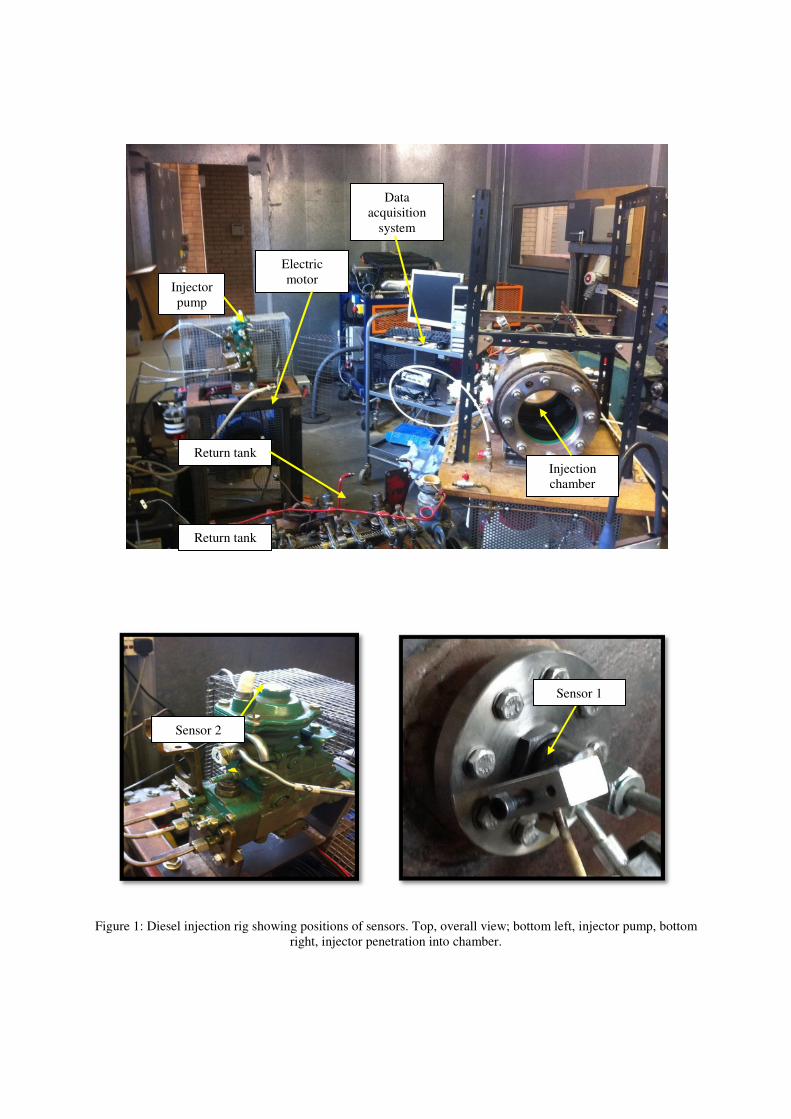
Figure 1: Diesel injection rig showing positions of sensors. Top, overall view; bottom left, injector pump, bottom
right, injector penetration into chamber.
Injection
chamber
Return tank
Electric
motor Injector
pump
Data
acquisition
system
Sensor 2
Return tank
Sensor 1
Figure 2: Schematic diagram of the cylinder head showing sensor positions.
The same AE system set-up was used for both sets of experiments. Two Physical Acoustics
Corporation (PAC) Micro-80D AE sensors were used, having an operating frequency range of
0.1-1MHz and resonances at 325 kHz and 650 kHz. Each sensor was connected to a PAC-
1120A preamplifier set at a gain of 40 dB and incorporating a band pass filter from 0.1-1
MHz. Data were acquired using a 12-Bit, 10 MS/s/ch, Simultaneous-Sampling Multifunction
DAQ card (NI PCI-6115) at a sampling rate of 2.5 MS/s giving a record length of 1 second. A
total of five records were acquired at each speed for each of the engine and injector
experiments.
3. Results and discussion
The focus of the analysis at this stage was to use the crankshaft angle, pressure and motor
speed data in the injector rig to understand the structure of the AE signal and the diagnostic
information it contains. Then, this knowledge could be used to assess how AE might be able
to provide diagnostic information on injection in a running engine.
3.1 Diesel injection rig Figure 3 shows a typical AE time series recorded at Sensor 1, showing multiple pulses whose
frequency corresponds to the expected injection events at the motor running speed. As can be
seen, the main pulses are variable in height from pulse to pulse and there are a number of
secondary events, probably associated with the operation of the pump and delivery to the
other injectors. The magnified time series shows the injection pulse to be quite complex in
nature.
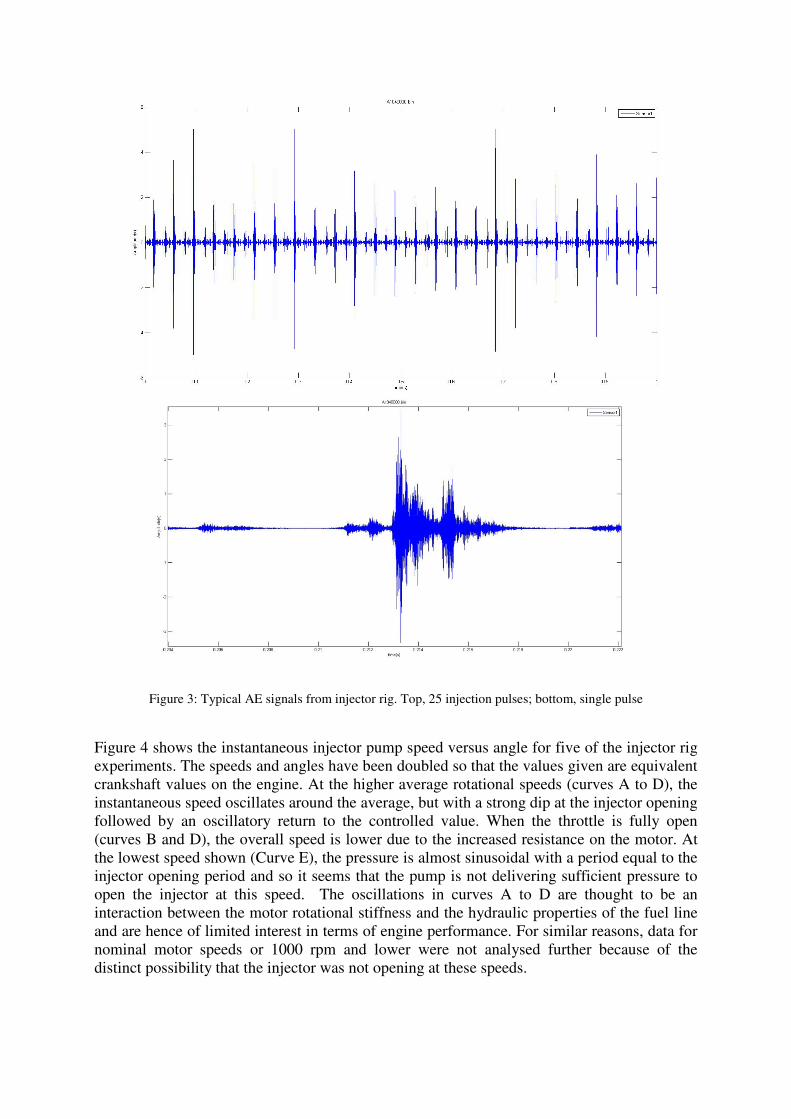
Figure 3: Typical AE signals from injector rig. Top, 25 injection pulses; bottom, single pulse
Figure 4 shows the instantaneous injector pump speed versus angle for five of the injector rig
experiments. The speeds and angles have been doubled so that the values given are equivalent
crankshaft values on the engine. At the higher average rotational speeds (curves A to D), the
instantaneous speed oscillates around the average, but with a strong dip at the injector opening
followed by an oscillatory return to the controlled value. When the throttle is fully open
(curves B and D), the overall speed is lower due to the increased resistance on the motor. At
the lowest speed shown (Curve E), the pressure is almost sinusoidal with a period equal to the
injector opening period and so it seems that the pump is not delivering sufficient pressure to
open the injector at this speed. The oscillations in curves A to D are thought to be an
interaction between the motor rotational stiffness and the hydraulic properties of the fuel line
and are hence of limited interest in terms of engine performance. For similar reasons, data for
nominal motor speeds or 1000 rpm and lower were not analysed further because of the
distinct possibility that the injector was not opening at these speeds.
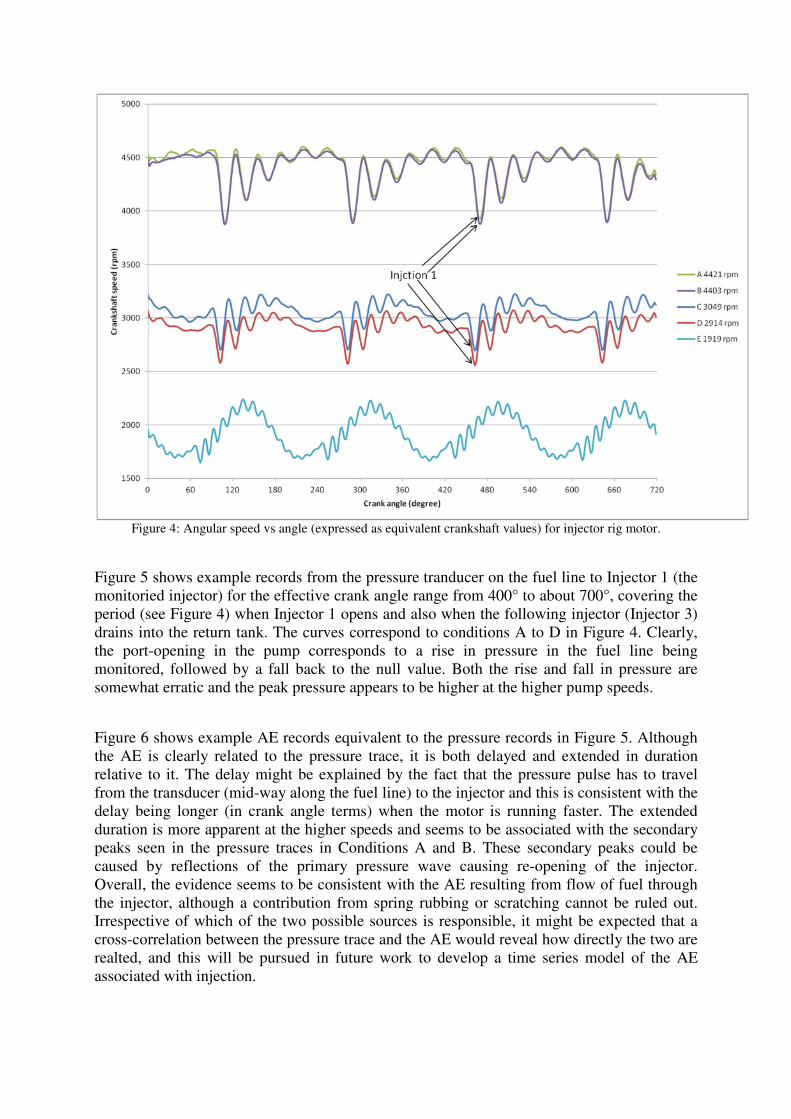
Figure 4: Angular speed vs angle (expressed as equivalent crankshaft values) for injector rig motor.
Figure 5 shows example records from the pressure tranducer on the fuel line to Injector 1 (the
monitoried injector) for the effective crank angle range from 400° to about 700°, covering the
period (see Figure 4) when Injector 1 opens and also when the following injector (Injector 3)
drains into the return tank. The curves correspond to conditions A to D in Figure 4. Clearly,
the port-opening in the pump corresponds to a rise in pressure in the fuel line being
monitored, followed by a fall back to the null value. Both the rise and fall in pressure are
somewhat erratic and the peak pressure appears to be higher at the higher pump speeds.
Figure 6 shows example AE records equivalent to the pressure records in Figure 5. Although
the AE is clearly related to the pressure trace, it is both delayed and extended in duration
relative to it. The delay might be explained by the fact that the pressure pulse has to travel
from the transducer (mid-way along the fuel line) to the injector and this is consistent with the
delay being longer (in crank angle terms) when the motor is running faster. The extended
duration is more apparent at the higher speeds and seems to be associated with the secondary
peaks seen in the pressure traces in Conditions A and B. These secondary peaks could be
caused by reflections of the primary pressure wave causing re-opening of the injector.
Overall, the evidence seems to be consistent with the AE resulting from flow of fuel through
the injector, although a contribution from spring rubbing or scratching cannot be ruled out.
Irrespective of which of the two possible sources is responsible, it might be expected that a
cross-correlation between the pressure trace and the AE would reveal how directly the two are
realted, and this will be pursued in future work to develop a time series model of the AE
associated with injection.
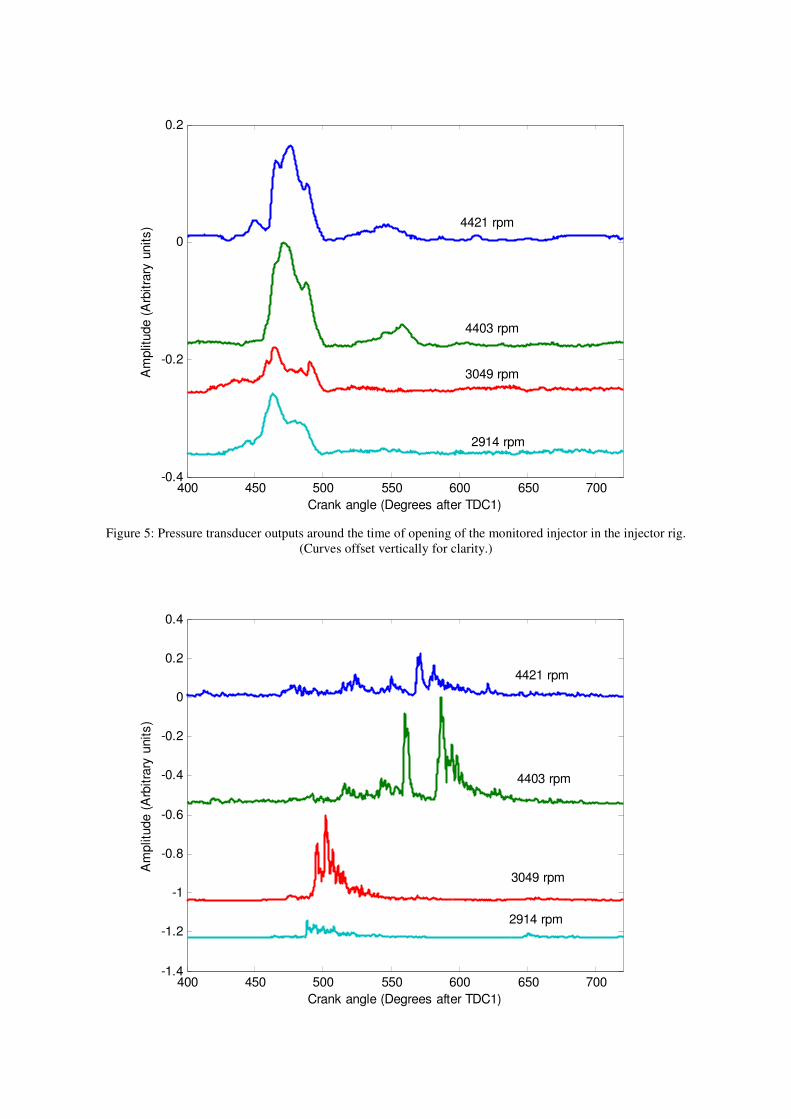
Figure 5: Pressure transducer outputs around the time of opening of the monitored injector in the injector rig.
(Curves offset vertically for clarity.)
400 450 500 550 600 650 700-0.4
-0.2
0
0.2
Crank angle (Degrees after TDC1)
Am
plit
ude (
Arb
itra
ry u
nits)
4421 rpm
4403 rpm
3049 rpm
2914 rpm
400 450 500 550 600 650 700-1.4
-1.2
-1
-0.8
-0.6
-0.4
-0.2
0
0.2
0.4
Crank angle (Degrees after TDC1)
Am
plit
ude (
Arb
itra
ry u
nits)
4421 rpm
4403 rpm
3049 rpm
2914 rpm
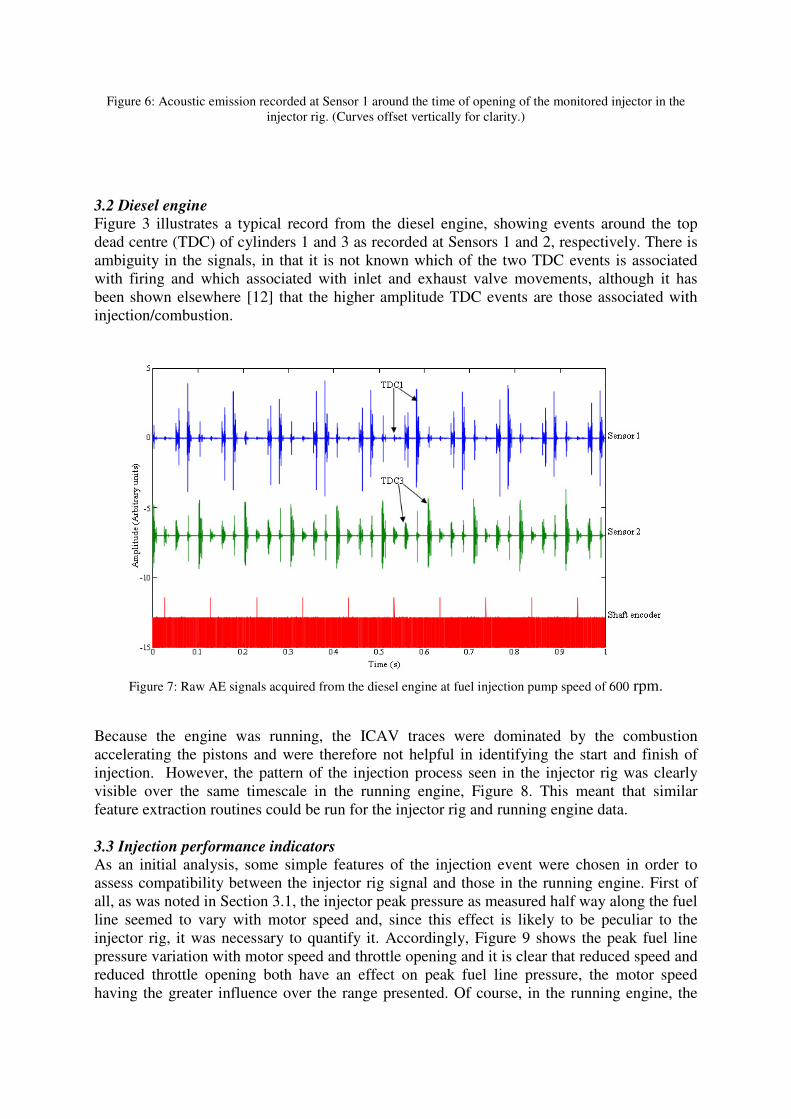
Figure 6: Acoustic emission recorded at Sensor 1 around the time of opening of the monitored injector in the
injector rig. (Curves offset vertically for clarity.)
3.2 Diesel engine Figure 3 illustrates a typical record from the diesel engine, showing events around the top
dead centre (TDC) of cylinders 1 and 3 as recorded at Sensors 1 and 2, respectively. There is
ambiguity in the signals, in that it is not known which of the two TDC events is associated
with firing and which associated with inlet and exhaust valve movements, although it has
been shown elsewhere [12] that the higher amplitude TDC events are those associated with
injection/combustion.
Figure 7: Raw AE signals acquired from the diesel engine at fuel injection pump speed of 600 rpm.
Because the engine was running, the ICAV traces were dominated by the combustion
accelerating the pistons and were therefore not helpful in identifying the start and finish of
injection. However, the pattern of the injection process seen in the injector rig was clearly
visible over the same timescale in the running engine, Figure 8. This meant that similar
feature extraction routines could be run for the injector rig and running engine data.
3.3 Injection performance indicators As an initial analysis, some simple features of the injection event were chosen in order to
assess compatibility between the injector rig signal and those in the running engine. First of
all, as was noted in Section 3.1, the injector peak pressure as measured half way along the fuel
line seemed to vary with motor speed and, since this effect is likely to be peculiar to the
injector rig, it was necessary to quantify it. Accordingly, Figure 9 shows the peak fuel line
pressure variation with motor speed and throttle opening and it is clear that reduced speed and
reduced throttle opening both have an effect on peak fuel line pressure, the motor speed
having the greater influence over the range presented. Of course, in the running engine, the

throttle position has a direct effect on pump speed and so the two variables cannot be
separated simply in the practical case.
(a)
(b)
Figure 8: RMS signal of injection event, (a): in Diesel engine at 2262 rpm, (b): in injector rig at 3031 rpm
0.118 0.119 0.12 0.121 0.122 0.123 0.1240
0.05
0.1
0.15
0.2
0.25
0.3
0.35
time(s)
Am
plit
ude (
Arb
itra
ry u
nits)
0.077 0.078 0.079 0.08 0.081 0.082 0.083 0.084 0.0850
0.02
0.04
0.06
0.08
0.1
0.12
time(s)
Am
plit
ude (
Arb
itra
ry u
nits)
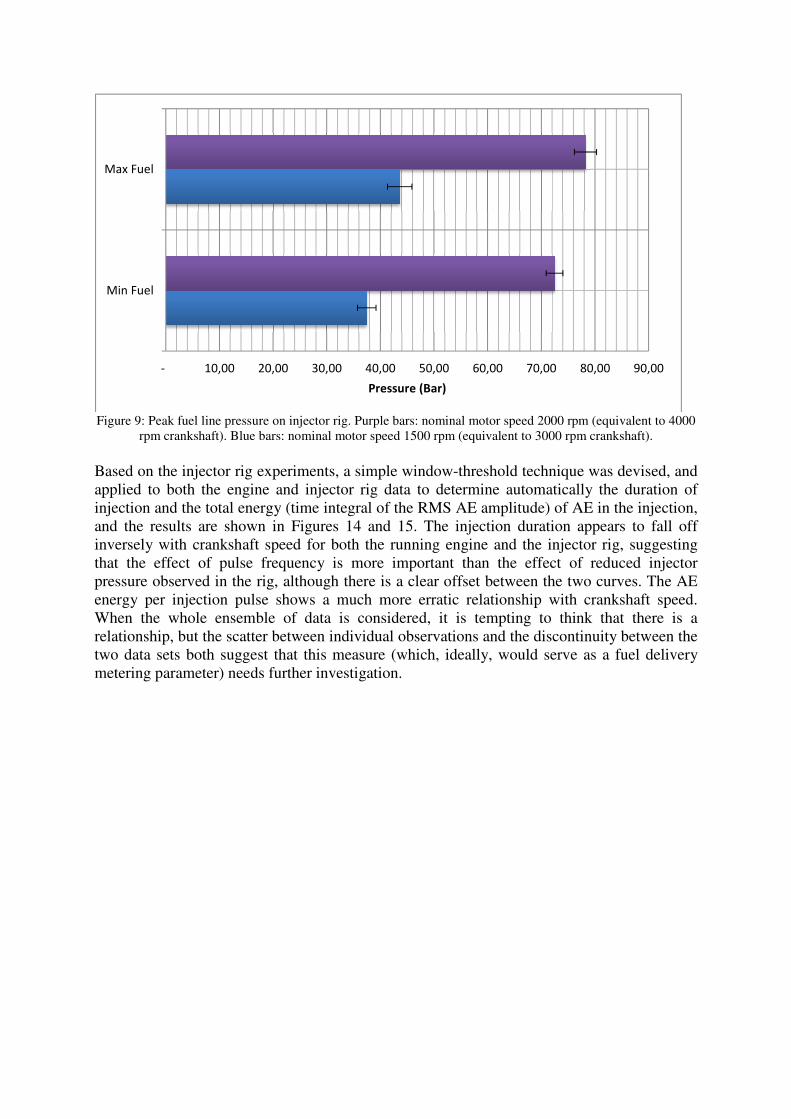
Figure 9: Peak fuel line pressure on injector rig. Purple bars: nominal motor speed 2000 rpm (equivalent to 4000
rpm crankshaft). Blue bars: nominal motor speed 1500 rpm (equivalent to 3000 rpm crankshaft).
Based on the injector rig experiments, a simple window-threshold technique was devised, and
applied to both the engine and injector rig data to determine automatically the duration of
injection and the total energy (time integral of the RMS AE amplitude) of AE in the injection,
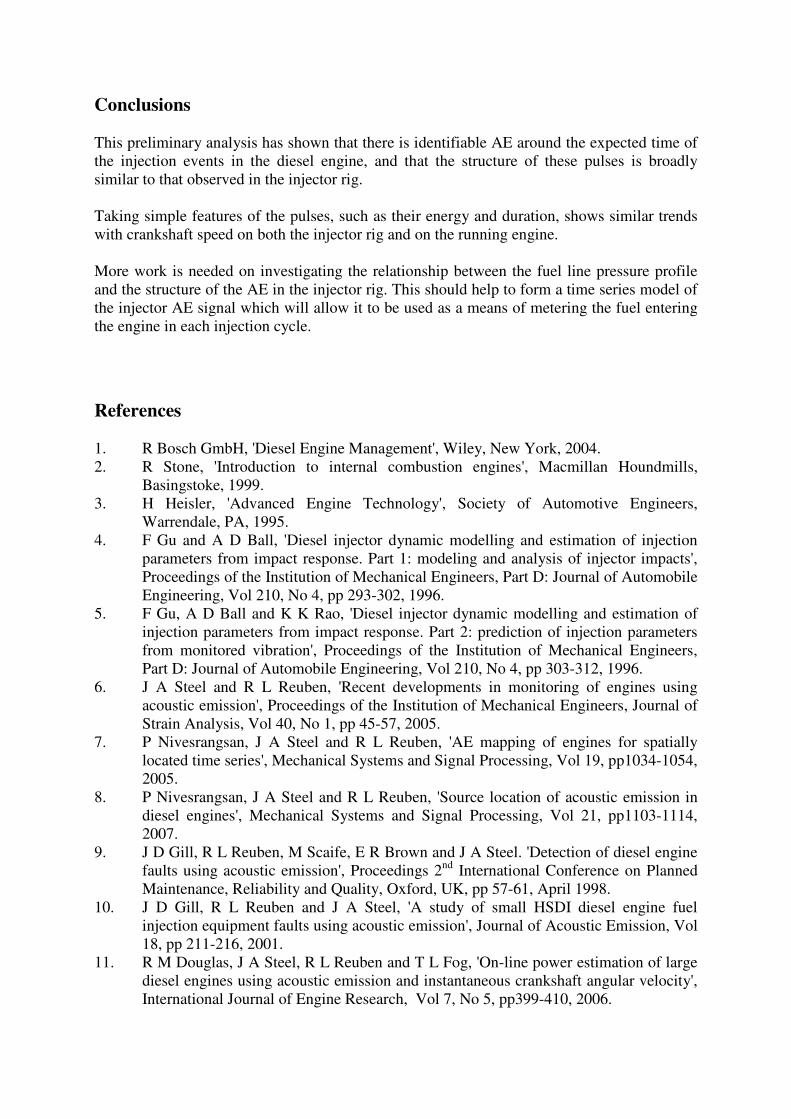
and the results are shown in Figures 14 and 15. The injection duration appears to fall off
inversely with crankshaft speed for both the running engine and the injector rig, suggesting
that the effect of pulse frequency is more important than the effect of reduced injector
pressure observed in the rig, although there is a clear offset between the two curves. The AE
energy per injection pulse shows a much more erratic relationship with crankshaft speed.
When the whole ensemble of data is considered, it is tempting to think that there is a
relationship, but the scatter between individual observations and the discontinuity between the
two data sets both suggest that this measure (which, ideally, would serve as a fuel delivery
metering parameter) needs further investigation.
- 10,00 20,00 30,00 40,00 50,00 60,00 70,00 80,00 90,00
Min Fuel
Max Fuel
Pressure (Bar)
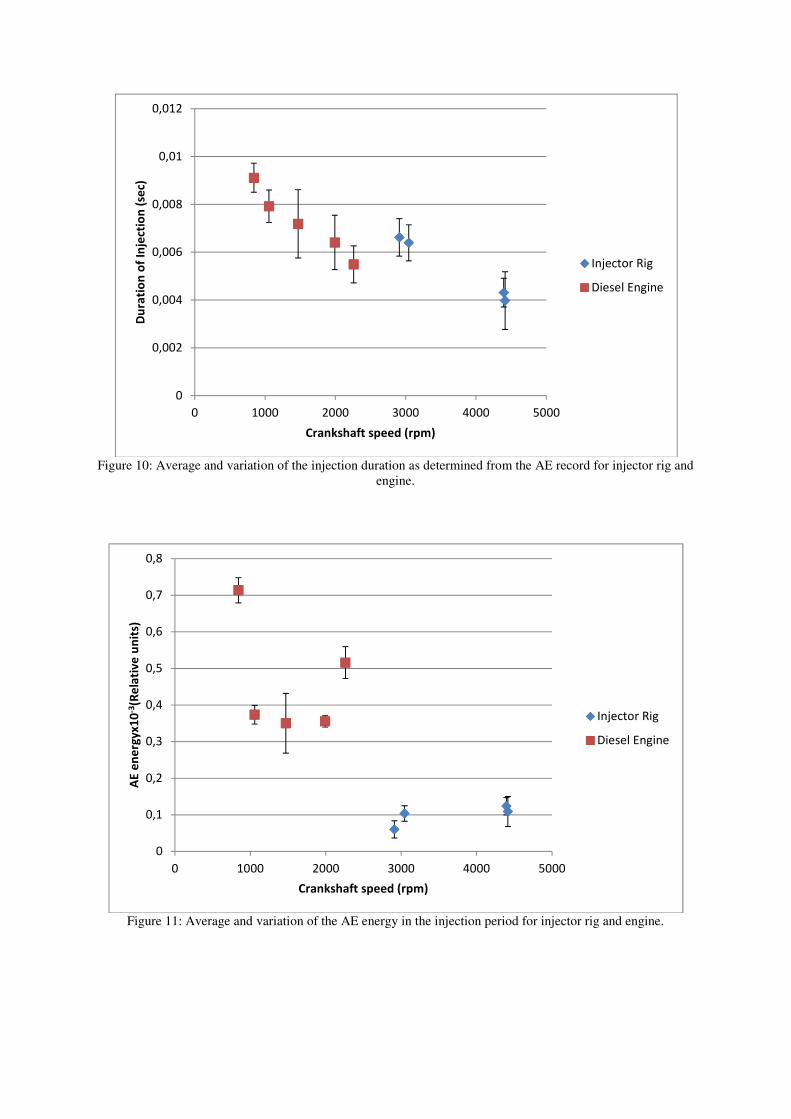
Figure 10: Average and variation of the injection duration as determined from the AE record for injector rig and
engine.
Figure 11: Average and variation of the AE energy in the injection period for injector rig and engine.
0
0,002
0,004
0,006
0,008
0,01
0,012
0 1000 2000 3000 4000 5000
Du
rati
on
of
Inje
ctio
n (
sec)
Crankshaft speed (rpm)
Injector Rig
Diesel Engine
0
0,1
0,2
0,3
0,4
0,5
0,6
0,7
0,8
0 1000 2000 3000 4000 5000
AE
en
erg
yx
10
-3(R
ela
tiv
e u
nit
s)
Crankshaft speed (rpm)
Injector Rig
Diesel Engine
Conclusions
This preliminary analysis has shown that there is identifiable AE around the expected time of
the injection events in the diesel engine, and that the structure of these pulses is broadly
similar to that observed in the injector rig.
Taking simple features of the pulses, such as their energy and duration, shows similar trends
with crankshaft speed on both the injector rig and on the running engine.
More work is needed on investigating the relationship between the fuel line pressure profile
and the structure of the AE in the injector rig. This should help to form a time series model of
the injector AE signal which will allow it to be used as a means of metering the fuel entering
the engine in each injection cycle.
References
1. R Bosch GmbH, 'Diesel Engine Management', Wiley, New York, 2004.
2. R Stone, 'Introduction to internal combustion engines', Macmillan Houndmills,
Basingstoke, 1999.
3. H Heisler, 'Advanced Engine Technology', Society of Automotive Engineers,
Warrendale, PA, 1995.
4. F Gu and A D Ball, 'Diesel injector dynamic modelling and estimation of injection
parameters from impact response. Part 1: modeling and analysis of injector impacts',
Proceedings of the Institution of Mechanical Engineers, Part D: Journal of Automobile
Engineering, Vol 210, No 4, pp 293-302, 1996.
5. F Gu, A D Ball and K K Rao, 'Diesel injector dynamic modelling and estimation of
injection parameters from impact response. Part 2: prediction of injection parameters
from monitored vibration', Proceedings of the Institution of Mechanical Engineers,
Part D: Journal of Automobile Engineering, Vol 210, No 4, pp 303-312, 1996.
6. J A Steel and R L Reuben, 'Recent developments in monitoring of engines using
acoustic emission', Proceedings of the Institution of Mechanical Engineers, Journal of
Strain Analysis, Vol 40, No 1, pp 45-57, 2005.
7. P Nivesrangsan, J A Steel and R L Reuben, 'AE mapping of engines for spatially
located time series', Mechanical Systems and Signal Processing, Vol 19, pp1034-1054,
2005.
8. P Nivesrangsan, J A Steel and R L Reuben, 'Source location of acoustic emission in
diesel engines', Mechanical Systems and Signal Processing, Vol 21, pp1103-1114,
2007.
9. J D Gill, R L Reuben, M Scaife, E R Brown and J A Steel. 'Detection of diesel engine
faults using acoustic emission', Proceedings 2nd
International Conference on Planned
Maintenance, Reliability and Quality, Oxford, UK, pp 57-61, April 1998.
10. J D Gill, R L Reuben and J A Steel, 'A study of small HSDI diesel engine fuel
injection equipment faults using acoustic emission', Journal of Acoustic Emission, Vol
18, pp 211-216, 2001.
11. R M Douglas, J A Steel, R L Reuben and T L Fog, 'On-line power estimation of large
diesel engines using acoustic emission and instantaneous crankshaft angular velocity',
International Journal of Engine Research, Vol 7, No 5, pp399-410, 2006.

12. W Abdou, C Hunter, M Shehadeh, J Steel and R L Reuben. 'Monitoring of diesel fuel
injection using acoustic emission', 5th
International Conference on Condition
Monitoring and Machinery Failure Prevention Technologies, Edinburgh, pp 1-11, July
2008