allocating data center energy costs and carbon to it users
TRANSCRIPT

Allocating Data Center Energy Costs and Carbon to IT Users Revision 1
by Neil Rasmussen
Introduction 2
What is the goal? 2
Measuring vs. modeling 4
How many points do we need to measure?
6
Allocating energy to IT users 10
Translating energy into carbon 12
Providing guidance to IT users 13
Conclusion 15
Resources 16
Appendix 17
Click on a section to jump to it Contents
White Paper 161
Are complicated software and instrumentation needed to measure and allocate energy costs and carbon to IT users? Or can we get by with simple, low cost methods for energy cost and carbon allocation? How precise do we need to be? This paper provides an overview of energy cost and carbon allocation strategies and their precision. We show that it is both easy and inexpensive for any data center, large or small, new or old, to get started allocating costs and carbon, but the expense and complexity escalate and ROI declines when excessive precision is specified.
Executive summary>
white papers are now part of the Schneider Electric white paper libraryproduced by Schneider Electric’s Data Center Science Center [email protected]

Allocating Data Center Energy Costs and Carbon to IT Users
Schneider Electric – Data Center Science Center White Paper 161 Rev 1 2
The data indicates that typical data centers are using much more energy that they need to. It is widely recognized that there are short term cost-effective opportunities to reduce the energy use of existing data centers and major opportunities to influence the designs of new data centers. This has made data centers an interesting target for both government regula-tors and business executives, who are both looking for those opportunities to reduce energy consumption that have minimal adverse societal or economic costs. Historically, data center design and operations have been focused on reliability and capacity. This has led to the unfortunate situation where data centers have not been optimized for efficiency. In fact, it is difficult to identify any one place where a data center is engineered for efficiency, because independent decisions of equipment designers, system integrators, control programmers, installers, contractors, IT managers, and operators all contribute substantially to overall energy performance. Recently, studies have shown that energy use is a substantial cost of IT operations, in some cases exceeding the cost of the IT hardware itself. This cost pressure, combined with the realization that data centers can be much more efficient in their use of energy, has caused many data center operators to make energy management a priority. How simple can an energy management process be, and how few measurements are needed, in order to provide the information necessary to successfully manage infrastructure energy use and allocate energy costs and carbon to IT users? We will show that the answer is this: An extremely simple process with very few measurements, which anyone can implement immediately, will provide accuracy that is good enough for an effective energy management program. There are generally three different goals of a system for assessment of energy efficiency or carbon impacts of a data center: • One-time or periodic benchmarking of performance
• Pass-through allocation of energy or carbon to others
• Use of information to reduce infrastructure energy use or carbon impacts
For a specific data center, it is important to recognize which of these goals (or combination of goals) is intended, because a correct understanding dramatically affects the technical implementation. Goal 1: One-time of periodic benchmarking of performance One-time or periodic benchmarking of energy efficiency or carbon impact can be useful to determine if an ongoing energy management program should be investigated or started. The concept here is that if benchmarking reveals performance that is comparable or better than other similar data centers, then perhaps the whole issue can be ignored. Conversely, if benchmarking reveals performance that is worse than comparable data centers, then an ongoing energy management program is likely to have a good return. It must be noted that achieving this goal, by itself, does not provide actionable information that informs or drives reductions in energy use or carbon impacts. Unfortunately, many data
Introduction
What is the goal?

Allocating Data Center Energy Costs and Carbon to IT Users
Schneider Electric – Data Center Science Center White Paper 161 Rev 1 3
center operators begin with this goal and are disappointed with the results. To obtain impact reduction benefits, one or both of the two goals described next must be implemented. Goal 2: Pass-through allocation of energy of carbon to others Some data centers act like a data center utility provider to other organizations, supplying either physical data center infrastructure or providing IT infrastructure on a per-compute or per-server basis. It may be a requirement that the data center customers be allocated, or even billed, for energy or carbon. This may be an internal organization requirement, or it may be a compliance requirement, or it may be contractually obligated. The objective is to provide a financial or other incentive for the data center customers to make behavioral changes that reduce their energy use or carbon impact, such as turning off unused servers, enabling power management functions, managing unnecessary storage, or virtualizing servers. The opportunity to save energy and reduce carbon impacts in a typical data center by managing IT for energy efficiency is enormous, ranging from 10% to 80% reductions depending on the existing level of maturity and virtualization in the data center. Since many of the possible improvements are virtually free, or inexpensively phased in during IT refreshes, pass-through of energy costs or carbon impacts can a major contributor to a successful and cost-effective energy management program.
Goal 3: Use of information to reduce infrastructure energy or carbon impacts In every data center, the physical infrastructure (power, cooling, lighting, controls, etc.) is a major consumer of energy and generator of carbon impacts. The metric used to benchmark data center infrastructure energy use is Power Usage Effectiveness, or PUE (the reciprocal of PUE is called DCiE and is also used as a metric). In many data centers, the power con-sumed by the physical infrastructure is greater than the power used by the IT loads (PUE > 2). Therefore, the reduction of energy use in physical infrastructure, on a percentage basis, is nearly as important as reducing the IT load. The objective is to provide the data necessary to identify and quantify opportunities to make changes to equipment, configuration, or settings that would reduce energy consumption without an adverse impact on the IT load. The opportunity to save energy and carbon impacts in a typical data center by managing the physical infrastructure for energy efficiency is large, ranging from 10% to 40% reductions based on the condition, settings, configuration, and loading of the data center.
Allocate electric cost and carbon impact
to IT planners and users
Smarter, greener IT decisions that comprehend true costs
Reduced total costs and environmental impacts
Figure 1 Cascading effect of allocating energy costs

Allocating Data Center Energy Costs and Carbon to IT Users
Schneider Electric – Data Center Science Center White Paper 161 Rev 1 4
Two of the goals described in the previous section – the allocation of energy costs to IT, and the management of physical infrastructure energy consumption – both offer substantial energy and carbon reduction opportunities in the typical data center. When considering the overall objective of reducing energy use and carbon impacts for a particular data center it is first necessary to decide which of these two goals (or both) will be chosen. Choosing the goal The preceding discussion of the three goals for energy efficiency and carbon impact mea-surements for data centers suggests the following key observations:
• There are huge opportunities to reduce the energy consumption of typical data centers, on the order of 20% to 90% savings in energy and carbon, when both IT behaviors and physical infrastructure are managed together.
• Benchmarking, by itself, improves nothing. It cannot be considered to be a central part of an energy and carbon reduction plan. Its use is primarily to help determine the amount of resources to be deployed on energy management.
• Allocation of energy and carbon to IT users gives them the tools to make rational energy saving decisions about IT deployments.
• Both (a) allocation of energy costs to IT, and (b) managing physical infrastructure ener-gy use, offer substantial savings opportunities, but the opportunity exceeds the sum of the parts when the two goals are combined.
If the objective is an overall reduction in energy use and carbon impact, a combination of the above goals, with a reduced focus on benchmarking, is the best strategy. Would targeting all of these goals together be a large, complex, and expensive undertaking? Would such an effort have an acceptable ROI? The answer is that, when the problem is viewed the right way, it is remarkably simple and cost-effective to achieve all of the goals. Not only that, but data center operators can start driving results immediately. The remainder of this paper explains how this is possible. Most discussions of information for energy management focus on measurement, or metering, of energy. Yet any rational approach to energy management requires some interpretation, or meaning, of the measured energy use. In order to make improvements or take any action, there must be some understanding of how various changes will impact energy consumption. There must be a model of how the data center works before we can understand how we can use measurements to identify and quantify improvement opportunities. A measurement of the electrical power drawn by a chilled water pump, by itself, provides no insight as to whether the pump is operating within expected performance parameters, whether it was sized correctly to begin with, whether any valve or programming changes could reduce its energy use, or whether a different pump might provide the same function with lower energy use. To under-stand energy improvement opportunities, we must have either implicit models (knowledge of experienced experts) or explicit models (software tools). Even the goal of allocating energy costs to IT users requires models. While the power consumption of servers could be measured directly and conceivably associated to IT users, the majority of the power in a data center is used by loads other than servers, and a model is needed in order to associate these energy uses to IT users. A generic data center energy management process is shown in Figure 2:
Measuring vs. modeling

Allocating Data Center Energy Costs and Carbon to IT Users
Schneider Electric – Data Center Science Center White Paper 161 Rev 1 5
In the energy management process of Figure 1, there are two main improvement paths. At the top of the diagram, IT changes are made in response to energy and carbon data from the data center model. At the bottom of the diagram, physical infrastructure changes are implemented in response to energy guidance from the model. In both cases measurement is used, but it is the model that provides the interpretation and guidance to achieve the im-provements. Note that the system described by the diagram above incorporates all three of the data center energy management goals described in the previous section: It provides data for benchmark-ing, it allocates energy and carbon to IT, and it provides guidance regarding improvements to the physical infrastructure. Measurements, without a model and process, are of little value. Models, however, even simple models, may have considerable value even with incomplete measurements. In summary, a key purpose of measurement of data center efficiency is to obtain information that contributes to the creation of an accurate model for that data center. It is the model that provides actionable information about data center efficiency, not the measurement. A more complete discussion of this subject is contained in White Paper 154, Electrical Efficiency Measurement for Data Centers. Measurement-assisted modeling If a perfect model of a data center could be created, there would be no need for any mea-surements. The model would have complete information about the nature, quantify, and operating conditions of the IT load, it would contain the characteristics and operating conditions of all of the infrastructure equipment, and it would accept as inputs historical weather data. It could simply compute all energy flows. In a practical world, such a perfect model cannot be achieved, because of the difficulty in obtaining exact data about IT device configurations and operating conditions, infrastructure interfaces and operating conditions, and unexpected operating conditions such as malfunctions, clogged filters, or air conditioners that are interacting with each other.
Figure 2 Information flow diagram of a data center energy management process, showing how the model and analysis functions integrate into existing IT and infrastructure planning activities, resulting in changes that reduce energy consumption
Electrical Efficiency Measurement for Data Centers
Related resource White Paper 154

Allocating Data Center Energy Costs and Carbon to IT Users
Schneider Electric – Data Center Science Center White Paper 161 Rev 1 6
While a perfect model of a data center might require a huge amount of custom programming and data maintenance, a surprisingly good model can be created using only an rough inventory of the infrastructure and IT devices deployed, information about their configuration (N+1, 2N, etc) and some basic knowledge of the electrical characteristics of the IT and infrastructure devices. An example of the software implementation of a simplified model for the physical infrastructure of a typical data center is shown in Figure 3.
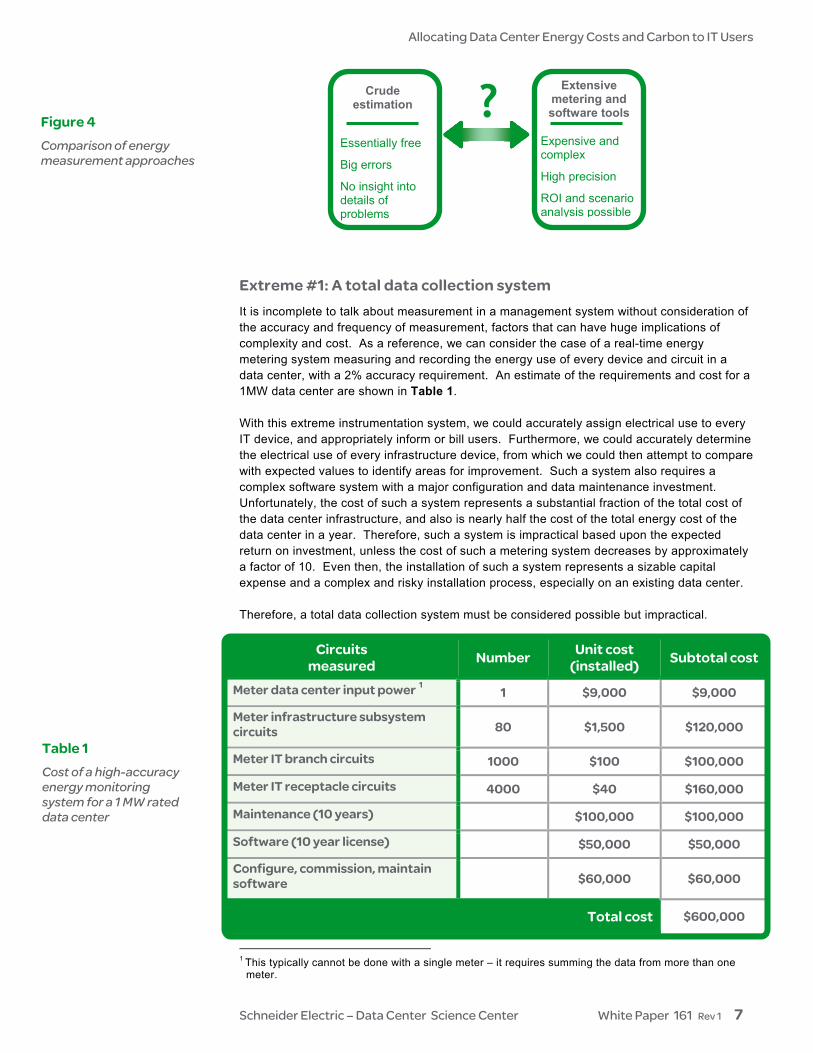
It is clear that some kind of model of the data center is needed in order to manage and reduce energy consumption. Can such a model actually eliminate the need for measurement, or simplify the measurement task? How simple can a model be, and how few measurements are needed, in order to provide the information necessary to successfully manage infrastruc-ture energy use and allocate energy costs and carbon to IT users? The answer is that an extremely simple model, with very few measurements, can provide acceptable accuracy for an energy management program. It is a basic principle of measurements that you should not start measuring something unless you understand the use that will be made of the data. A measurement taken at the wrong time, or with insufficient accuracy, or without detail regarding the conditions, can later turn out to be inadequate or useless. Conversely, excessive measurement at extreme precision may be extremely costly and burdensome but provide little additional benefit when compared with a simple measurement. All of these problems are emerging as data center operators attempt to develop their own energy management systems. The objective of a measurement system is to use the simplest, least expensive measurement protocol that can achieve the objective of the management system. How complex a system is required to provide complete information about data center energy use? How simple can a measurement system be? To understand the problem, we can contrast the capabilities of two extreme cases: a comprehensive energy measurement system vs. a crude estimation system.
Figure 3 Example of a data center infrastructure modeling tool for typical data center configurations (free web-based tool)
How many points do we need to measure?
Allocating Data Center Energy Costs and Carbon to IT Users
Schneider Electric – Data Center Science Center White Paper 161 Rev 1 7
Extreme #1: A total data collection system It is incomplete to talk about measurement in a management system without consideration of the accuracy and frequency of measurement, factors that can have huge implications of complexity and cost. As a reference, we can consider the case of a real-time energy metering system measuring and recording the energy use of every device and circuit in a data center, with a 2% accuracy requirement. An estimate of the requirements and cost for a 1MW data center are shown in Table 1. With this extreme instrumentation system, we could accurately assign electrical use to every IT device, and appropriately inform or bill users. Furthermore, we could accurately determine the electrical use of every infrastructure device, from which we could then attempt to compare with expected values to identify areas for improvement. Such a system also requires a complex software system with a major configuration and data maintenance investment. Unfortunately, the cost of such a system represents a substantial fraction of the total cost of the data center infrastructure, and also is nearly half the cost of the total energy cost of the data center in a year. Therefore, such a system is impractical based upon the expected return on investment, unless the cost of such a metering system decreases by approximately a factor of 10. Even then, the installation of such a system represents a sizable capital expense and a complex and risky installation process, especially on an existing data center. Therefore, a total data collection system must be considered possible but impractical.
Circuits measured Number Unit cost
(installed) Subtotal cost
Meter data center input power 1 1 $9,000 $9,000
Meter infrastructure subsystem circuits 80 $1,500 $120,000
Meter IT branch circuits 1000 $100 $100,000
Meter IT receptacle circuits 4000 $40 $160,000
Maintenance (10 years) $100,000 $100,000
Software (10 year license) $50,000 $50,000
Configure, commission, maintain software $60,000 $60,000
Total cost $600,000
1 This typically cannot be done with a single meter – it requires summing the data from more than one
meter.
Crudeestimation
Extensive metering and software tools
Essentially free
Big errors
No insight into details of problems
? Expensive and complex
High precision
ROI and scenario analysis possible
Figure 4 Comparison of energy measurement approaches
Table 1 Cost of a high-accuracy energy monitoring system for a 1 MW rated data center

Allocating Data Center Energy Costs and Carbon to IT Users
Schneider Electric – Data Center Science Center White Paper 161 Rev 1 8
Extreme #2: A no-cost data collection system Next consider the other extreme case where we make no measurements at all. Such a system is essentially free. The only input we will use is the number of servers in the data center. We won’t even assume the existence of a monthly electrical bill from the utility company, because often there is not a dedicated meter for the data center. Given only the server count, we can attempt to crudely estimate the data center energy use per server. The per-server data center energy use includes energy consumed by the servers themselves, but also includes energy used by networking, storage, power equipment, cooling equipment, lights, and auxiliary devices. With no measurements at all, we could use statistical average data from the installed base of data centers to get a crude estimate of how much cooling power, lighting power, etc are typically used per server. We could assume the typical configuration of physical infrastructure used for a data center supplying typical average servers, with a typical mix of storage and networking equipment. These “educated guesses” could be provided by an expert consultant or they could be provided by a software tool such as the free tool illustrated in the previous Figure 3. The combined “educated guesses” become our crude model for the data center. The accuracy of this system is summarized in Table 2. With this no-measurement system, we could assign energy and carbon costs to users on a per-average-server basis, but the accuracy would be only around +/- 36%. While not ideal, this is still quite useful guidance to IT users in making behavioral changes, and most IT behavioral changes would not be affected if the energy and carbon costs were provided with additional accuracy. However, while such a system provides useful information to IT users, the system provides no information to help guide data center power or cooling infrastructure improvements, since all the data was estimated from industry averages. Nevertheless, a remarkable benefit can be obtained for no cost, and this no-measurement system should be considered by any data center operator who wants to start controlling energy costs imme-diately but has little time and no resources. A practical guide on how to get started with this approach is provided in the appendix at the end of this paper.
Energy use Fraction of total use
Accuracy of estimate
Effect on overall accuracy2
Server 36% +/- 50% +/- 18%
Storage 10% +/- 70% +/- 7%
Networking 4% +/- 50% +/- 2%
Power 8% +/- 50% +/- 4%
Cooling 38% +/- 80% +/- 30%
Lighting 2% +/- 60% +/- 1%
Auxiliary 2% +/- 80% +/- 2%
Combined total energy accuracy +/- 36%
2 The errors in the subsystem energy estimates are mathematically orthogonal, so the combined error is
the square root of the sum of the squares of the subsystem errors
Table 2 Accuracy of a low-cost energy monitoring system for a 1 MW rated data center

Allocating Data Center Energy Costs and Carbon to IT Users
Schneider Electric – Data Center Science Center White Paper 161 Rev 1 9
A “good enough” energy data collection system Naturally, the two previous extreme examples of energy data collection strategies lead us to the question of whether there are other intermediate data collection strategies that provide “good enough” data accuracy to achieve the energy management goals, but are low cost and high ROI. To help answer this question, Table 3 shows how adding cost and complexity to an energy management system increases accuracy and cost. Each line in the table represents the addition of a modeling or measurement capability to the management system, starting with a no-cost system based on server counts only, as described in the previous section. As capabilities are added, the error decreases, and the system cost increases. The IT allocation error is defined as the error in assigning energy and carbon to a defined unit of IT capacity, such as a standard server. The error in assigning energy to a specific server can be much larger than the errors defined in the table. Some capabilities listed in the table, such as classifying servers and metering all IT devices, considerably improve the accuracy in assigning energy and carbon to specific servers. This will be discussed in more detail later in this paper.
Modeling and metering capability added
PUE error
IT allocation error3,4
System cost (per MW)
Server counts 61% 39% 0
+ UPS power 55% 33% 0
+ Crude inventory5 23% 20% 0
+ Detailed inventory 14% 12% $2,000
+ Classify servers 14% 12% $4,000
+ Audit subsystems 8% 7% $10,000
+ Meter key subsystems 6% 4% $50,000
+ Meter all subsystems 3% 2% $130,000
+ Meter all IT devices 2% 2% $600,000
To get a better sense of the tradeoff between measurement accuracy and cost as we add functionality to an energy management system, the data from the Table 3 is plotted in Figure 5.
3 The IT allocation error can be smaller than the PUE error, because the energy and carbon use
associated with PUE are only a fraction of the total energy use. 4 The IT allocation error in this table is the allocation for a defined “standard average server”, not for a
specific server. Errors for specific servers are larger and are dramatically reduced when the “classify servers” capability is added, as described later in this paper.
5 The crude inventory is an inventory of the capacity and type of the main power, cooling, and IT devices in the data center, which, when combined with data about those devices, allows considerable refine-ment of energy use estimates. This function can be provided as part of an energy assessment by experts, or it can be attempted by an industrious data center operator. Additional guidance regarding this method is provided in other white papers listed at the end of this paper.
Table 3 Adding modeling and measurement capabilities affects management system accuracy and cost for a 1 MW rated data center

Allocating Data Center Energy Costs and Carbon to IT Users
Schneider Electric – Data Center Science Center White Paper 161 Rev 1 10
0.0%
10.0%
20.0%
30.0%
40.0%
50.0%
60.0%
serve
r coun
ts
UPS power
crude
inve
ntory
detai
led in
vento
ry
class
ify se
rvers
audit
subsy
stems
meter k
ey su
bsys
tems
meter a
ll sub
syste
ms
meter a
ll IT dev
ices
Mea
sure
men
t Err
or (%
)
$0 K
$100 K
$200 K
$300 K
$400 K
$500 K
$600 K
Mea
sure
men
t Cos
t ($)PUE error
IT allocation error
System cost
0%
10%
20%
30%
40%
50%
60%
Lowest error achievable at no cost
Increasing modeling and metering capabilities
Figure 5 shows that the accuracy of a data center energy measuring system initially im-proves rapidly for little cost as simple modeling and measurement capabilities are added. However, as errors of less than about 10% are achieved, the cost escalates dramatically. This analysis suggests the following recommended measurement and modeling strategy for a data center energy management program: • A no-cost system of energy modeling based on server counts, UPS power readings, and
crude inventory is good enough to allow meaningful energy allocation to IT users
• Additional low cost capabilities can be added over time to improve the energy manage-ment system, including model improvements from detailed inventory and server classifi-cation, as well and measurement improvements from energy audits and metering of key subsystems
• Extensive metering of all infrastructure subsystems and IT devices adds little value to an energy management system, with poor ROI
IT capacity can be measured and allocated in a variety of ways, including compute cycles, servers, cores, terabytes, rack cabinets, square feet, virtual servers, etc. An ideal model of IT use might include all of these factors in assigning costs, energy, or carbon. However, we will start with a simple model, measuring IT capacity in number of servers, which is one popular way to measure capacity that many of the other measures can be mapped to. If an IT user can be allocated a number of servers, then to assign energy and carbon to that user all we need to do is assign energy to a server, in which case the total energy use of an IT user is simply the number of servers assigned times the energy use allocated per server. This requires that we identify all energy uses in the data center and allocate them on a per-server basis. The total energy allocation of a server becomes a sum of the server’s own energy use, plus allocations of energy use for storage, networking, power, cooling, lighting, and auxiliary loads. Such an allocation for a typical data center is shown in Figure 6:
Figure 5 The error of a data center energy measurement system decreases while the cost increases as additional modeling and metering capabilities are added
Allocating energy to IT users

Allocating Data Center Energy Costs and Carbon to IT Users
Schneider Electric – Data Center Science Center White Paper 161 Rev 1 11
The server itself340 W
Auxiliary15 W
Lighting15 W
Cooling360 W
Power75 W Network
35 W
Storage90 W
In this case, even though the actual power drawn by the typical server is 340 W, the total power allocated to the server is a much larger 930 W. Average vs. specific IT device The method of assigning energy to an IT user based on “server units” of an average server has a number of inaccuracies, because it assumes uniform per-server utilization of allocated resources and it assumes all servers themselves are the same. The actual total power associated to a specific server will vary depending on the type of server, its power manage-ment characteristics, and its utilization of other IT resources. For those data centers that have a relatively uniform server population, assigning a standard energy cost per server is an effective approximation. However, for data centers that have a wide range of server types, the use of a standard “server unit” for allocating energy is not effective. For example, consider the case where one IT user has eight server blades as simple application servers, while another IT user has eight mainframe systems with many terabytes of online storage. Clearly the mainframe user is consuming much more power, yet an allocation of energy based on a standard server would allocate the same energy and carbon to both users. While the total energy allocated under such a method would be accurate, some energy used by the mainframe IT user would be unfairly assigned to the blade server user. This problem could, in principle, be corrected by measuring all IT devices and assigning energy based on those measurements to IT users. We have already shown this to be impractical because: • Much of the energy use comes from power equipment, cooling equipment, network
devices, and other loads that cannot always be directly associated to an IT user
• The cost of the measurement system to meter all IT devices, along with the cost and complexity of the software system, is extreme
To solve this problem in a simple, cost effective way, servers can be classified into a short list of standard types, each with its own energy use profile. Instead of treating all servers as a single standard “server unit”, a list of server classifications can be created as shown in Table 4:
Figure 6 A server with a 930 W energy allocation, showing a breakdown of the data center energy consumption that has been assigned to the server. The actual power of the server itself is only 340 W.

Allocating Data Center Energy Costs and Carbon to IT Users
Schneider Electric – Data Center Science Center White Paper 161 Rev 1 12
Server class
Server power
Network allocation
Storage allocation
1U app server
250W 0.2 0.1
Virtual server6 90W 0.4 0.2
Web blade 200W 0.3 0.1
ERP blade 200W 0.1 0.4
Mainframe 4000W 0.1 0.5
3U-10U server
2000W 0.1 0.1
The above list can be used as is (with appropriate power values), or the list can be expanded or refined to better match the profile of users in a specific data center. Each server has a base standard power level assigned, along with allocations representing the fraction of the base power associated with networking and storage. The power, cooling, and lighting costs are allocated equally on a per IT Watt basis and do not vary by server class. The method to use the classification system is as follows: • Assign all servers to a class
• Assign to each IT user a number of standard servers from each class
• Sum the computed power from all server classes, then normalize to match the actual IT load power (determined from model or measurement)
• Apply the PUE data to each server class
In this way, the total energy use of a data center can be allocated across a number of server classes, which can then be assigned to IT users. This process can be carried out in a software tool, such as those provided by vendors like Schneider Electric, or it could be carried out on a spreadsheet. Once we have determined the energy use of IT loads or infrastructure systems in the data center, we can allocate carbon to them. The carbon impacts of data centers are indirect, and come from three primary sources: • Carbon emissions created during the fabrication of the data center and its IT and infra-
structure equipment (so-called “embedded carbon”)
6 If virtual servers are a class, then the allocated server count will exceed the physical server count. In
this case, the physical servers that host the virtual servers are not assigned to an IT user.
Translating energy into carbon
Table 4 Example of a server classification table

Allocating Data Center Energy Costs and Carbon to IT Users
Schneider Electric – Data Center Science Center White Paper 161 Rev 1 13
• Local carbon emissions from heating systems, emergency generators, or co-generation systems
• Carbon emissions created during the creation of electrical power necessary to power the data center
In general, most discussions, benchmarking, or reporting of carbon are limited to those due to emissions caused by operations. Embedded carbon is a significant contribution to total carbon impacts, but the methods and standards for assessment of embedded carbon impacts are still under development. Data centers do not directly generate significant amounts of carbon dioxide or other gasses with CO2 equivalency. The operation of emergency generators typically represents less than .01% of the total carbon impact and can be ignored. Data centers operate at a high power density and almost never require supplementary heat, so heating related carbon can also be ignored. Very few data centers have co-located electrical generation plants so this is not a factor in most cases. In this paper, we will limit carbon metrics to those associated with electrical energy supply, which represents well over 99% of the carbon impact associated with operations. Carbon equivalence of energy Given the electrical energy used at the data center, it is possible to estimate the carbon emissions created by that energy use. A utility supplier can provide information on the carbon emissions for each kilowatt-hour of energy generation, based on their energy source mix. (Note: An alternative analysis of avoided carbon emissions, based on the last-dispatched source of energy, will typically yield higher carbon impacts. This is because incremental energy saved in an existing utility does not reduce the load on all generators equally – rather, reductions are directed to the higher-cost generation such as natural gas.) If this information is not available from the utility provider, then regional data is widely available. This data is expressed in tons of CO2 per kW-hr and typically falls in the range of 0.1 to 1 ton per kW-hr at the generator. To determine the load the data center creates at the generator, the distribution losses (typically around 10%) between the generator and the data center are added to the data center power use. The following formula gives the annual carbon emis-sions caused by a facility load:
)()()(
DistLossyearhr
kwhrCarbonkwLoadtonsAnnualCO
−×××=
1187602
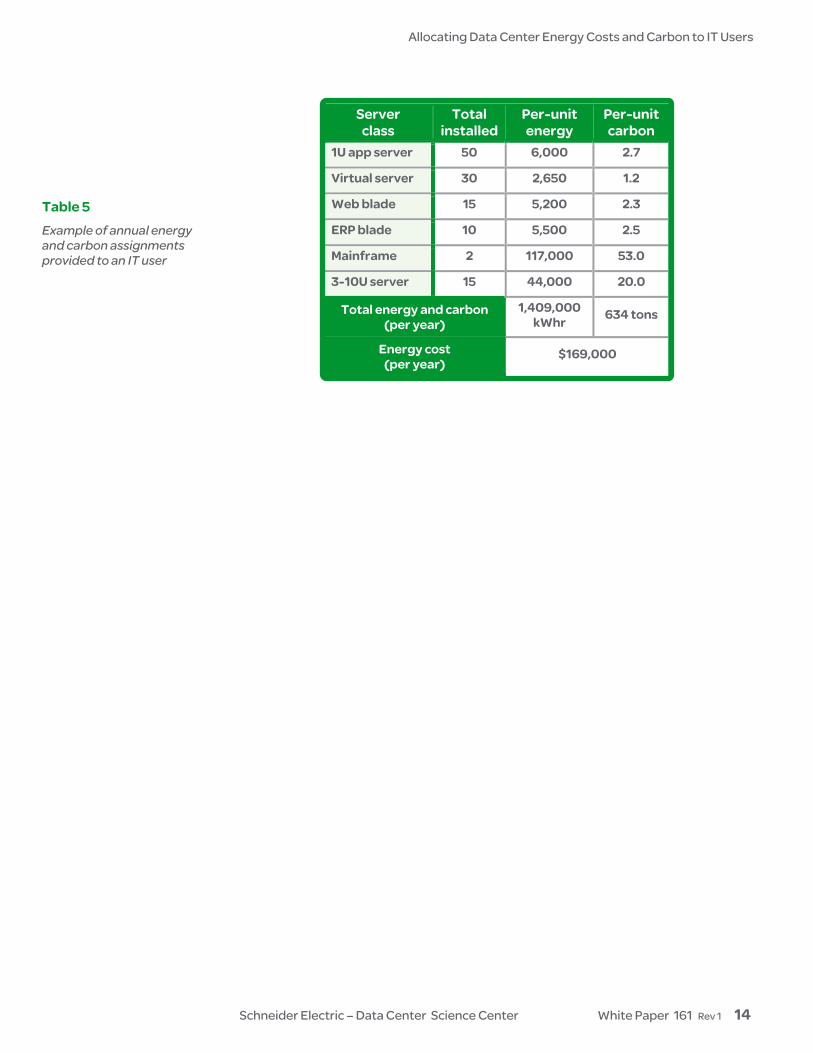
An IT user does not need to understand the principles and techniques described in this paper in order to integrate energy into IT planning and deployment decisions. All the IT user needs is a simple summary of the energy use and carbon impacts of the IT resources they use. Such a report to an IT user is provided in Table 5:
Providing guidance to IT users
Allocating Data Center Energy Costs and Carbon to IT Users
Schneider Electric – Data Center Science Center White Paper 161 Rev 1 14
Server class
Total installed
Per-unit energy
Per-unit carbon
1U app server 50 6,000 2.7
Virtual server 30 2,650 1.2
Web blade 15 5,200 2.3
ERP blade 10 5,500 2.5
Mainframe 2 117,000 53.0
3-10U server 15 44,000 20.0
Total energy and carbon (per year)
1,409,000 kWhr 634 tons
Energy cost (per year)
$169,000
Table 5 Example of annual energy and carbon assignments provided to an IT user

Allocating Data Center Energy Costs and Carbon to IT Users
Schneider Electric – Data Center Science Center White Paper 161 Rev 1 15
This paper has described a logical strategy for allocation of data center energy and carbon to IT users. Simple, no-cost models of energy use can be used to allocate energy and carbon based on standard, average units of IT capacity, such as a standard “server unit”. Such models are not precise, but have sufficient accuracy to be useful in a data center energy management system. A simple system can be enhanced over time by adding additional measurement and modeling capabilities, providing additional precision and insight into energy use. This paper outlines a rational sequence of implementing these capabilities. A surprisingly effective and low-cost system can be implemented with only a small number of energy meters combined with a specialized data center energy audit and simple software. Data center operators should not assume that complex and extensive metering systems are needed in order to implement an effective energy management system, or to assign energy and carbon to IT users. In fact, extreme instrumentation systems have a poor return on investment. This paper outlines a starting approach that any data center operator, large or small, can implement immediately at no cost. Every unnecessary watt of power drawn by a data center represents an unrecoverable loss. A crude but simple energy management system implemented today is much more effective than an ideal system implemented later, because no matter how effective an energy management system is, it can’t recover energy already lost.
Conclusion
Neil Rasmussen is a Senior VP of Innovation for Schneider Electric. He establishes the technology direction for the world’s largest R&D budget devoted to power, cooling, and rack infrastructure for critical networks. Neil holds 19 patents related to high-efficiency and high-density data center power and cooling infrastructure, and has published over 50 white papers related to power and cooling systems, many published in more than 10 languages, most recently with a focus on the improvement of energy efficiency. He is an internationally recognized keynote speaker on the subject of high-efficiency data centers. Neil is currently working to advance the science of high-efficiency, high-density, scalable data center infrastructure solutions and is a principal architect of the APC InfraStruXure system. Prior to founding APC in 1981, Neil received his bachelors and masters degrees from MIT in electrical engineering, where he did his thesis on the analysis of a 200MW power supply for a tokamak fusion reactor. From 1979 to 1981 he worked at MIT Lincoln Laboratories on flywheel energy storage systems and solar electric power systems.
About the author

Allocating Data Center Energy Costs and Carbon to IT Users
Schneider Electric – Data Center Science Center White Paper 161 Rev 1 16
Electrical Efficiency Measurement for Data Centers White Paper 154
Guidance for Calculation of Efficiency (PUE) in Real Data Centers White Paper 158
Electrical Efficiency Modeling for Data Centers White Paper 113 Implementing Energy Efficient Data Centers White Paper 114
Resources Click on icon to link to resource
Browse all white papers whitepapers.apc.com
tools.apc.com
Browse all TradeOff Tools™
For feedback and comments about the content of this white paper: Data Center Science Center [email protected] If you are a customer and have questions specific to your data center project: Contact your Schneider Electric representative
Contact us

Allocating Data Center Energy Costs and Carbon to IT Users
Schneider Electric – Data Center Science Center White Paper 161 Rev 1 17
This paper has described a simple approach for allocation of energy costs and carbon impacts to IT loads in data centers, including a number of measurements and modeling capabilities that can be used to provide increasing accuracy at increasing costs. The simplest methods have nearly no cost but can nevertheless provide surprisingly good accuracy and can are effective in supporting and energy management program. This appendix shows how any data center can immediately implement a system of energy and carbon allocation to IT loads, with an accuracy on the order of +/- 20%. The method described here corresponds with the “crude inventory” capability level as referenced in the paper. This is the maximum level that a typical data center operator can achieve without some form of expert support. This method uses free software tools developed by APC, but other tools could be developed to achieve the same function. The flow of the process is described in Figure A1 below:
The user provides basic information about the configuration of the data center and the server count, along with current readings of UPS load power taken from the UPS (this is one of the only power readings that is available in almost any data center). The software tools prompt for the relevant information, information which any data center or IT professional should be able to obtain, or determine by a simple walk-through. The first tool estimates the PUE for the data center. The second tool accepts the PUE determined by the first tool and computes energy and carbon allocations to IT on a per-server basis, based on an “average” server. These units of “average” server are then apportioned to IT users using a method of choice depending on the business model. Help documentation is provided in the software tools. Figure A2 shows a screen from the allocation tool. In this example, each server unit has been assigned $1,482 of electricity and 15.4 tons of CO2 per year. For an IT user with 100 servers, this would mean an annual allocation of $148,200 and 1,540 tons per year.
Appendix: Simple determination of energy and carbon allocation for a data center
Figure A1 An overview of the process used to establish allocations of data center energy carbon impacts to IT loads
UPSpower out
Basic system configuration
information
Server count
PUE
Energy and carbon allocations to IT
Data CenterEfficiency Calculator IT Carbon & Energy
Allocation Calculator

Allocating Data Center Energy Costs and Carbon to IT Users
Schneider Electric – Data Center Science Center White Paper 161 Rev 1 18
This example was provided because of its simplicity to implement. It is quite useful and can help create awareness and drive improvements in IT behavior. However, it has important limitations, including: • It is only about +/- 20% accurate, so it should probably not be used for actually billing
customers; some of the higher capabilities described in the paper are recommended.
• It assigns costs and carbon to an “average server” and does not accurately assign costs when some IT users use blades and others use mainframes; the server classification capability described in this paper is needed to address this issue.
• It provides no accurate breakdown of losses in the infrastructure system, so it provides little guidance regarding possible infrastructure improvements; the infrastructure audit and metering of key infrastructure systems, as described in the paper, are needed to provide these capabilities.
Figure A2 A sample output screen from the IT Carbon & Energy Allocation Calculator