american association of physicists in medicine … tg18 preprint draft (version 10.0) 2 august 26,...
TRANSCRIPT

AAPM TG18 Preprint DRAFT (version 10.0)
1 August 26, 2004
American Association of Physicists in Medicine (AAPM), Task Group 18
Assessment of Display Performance for Medical Imaging Systems
Preprint Draft (version 10.0), August 26, 2004 Chairman:
Ehsan Samei Duke University Medical Center Main Contributors:
Aldo Badano FDA, CDRH Dev Chakraborty University of Pennsylvania
(now with University of Pittsburgh) Ken Compton Clinton Electronics
(now with National Display Systems) Craig Cornelius Eastman Kodak Company
(now a consultant) Kevin Corrigan Loyola University Michael Flynn Henry Ford Health system Brad Hemminger University of North Carolina, Chapel Hill Nick Hangiandreou Mayo Clinic, Rochester Jeff Johnson Sarnoff Corp, NIDL
(now with Siemens Corporate Research, USA) Donna M. Moxley-Stevens University of Texas, Houston, M.D. Anderson
William Pavlicek Mayo Clinic, Scottsdale Hans Roehrig University of Arizona
Lois Rutz Gammex/RMI Ehsan Samei Duke University Medical Center
Jeff Shepard University of Texas, Houston, M.D. Anderson Robert A. Uzenoff Fujifilm Medical Systems USA
Jihong Wang University of Texas, Southwestern Medical Center Chuck Willis Baylor University, Houston, Texas Children’s Hospital (now with University of Texas, Houston, M.D. Anderson) Acknowledgements: Jay Baker (Duke University Medical Center), Michael Brill (Sarnoff Corp, NIDL), Geert Carrein (Barco), Mary Couwenhoven (Eastman Kodak Company), William Eyler (Henry Ford Hospital), Miha Fuderer (Philips), Nikolaos Gkanatsios (Lorad), Joel Gray (Lorad), Michael Grote (Sarnoff Corp, NIDL), Mikio Hasegawa (Totoku), Jerzy Kanicki (University of Michigan), Andrew Karellas (University of Massachusetts), Kevin Kohm (Eastman Kodak Company), Walter Kupper (Siemens), Peter Scharl (Siemens, DIN), George Scott (Siemens), Rich Van Metter (Eastman Kodak Company), Marta Volbrecht (Imaging Systems)
Important Note: This document is the pre-publication version of the TG18 report. The document is subject to change until it is published in its final form.

AAPM TG18 Preprint DRAFT (version 10.0)
2 August 26, 2004
American Association of Physicists in Medicine (AAPM), Task Group 18
Assessment of Display Performance for Medical Imaging Systems
Table of Contents
PREFACE ................................................................................................................................. 8
HOW TO USE THIS REPORT.................................................................................................... 9
1 INTRODUCTION..............................................................................................................10 1.1 Background .......................................................................................................................10 1.2 Existing Display Performance Evaluation Standards ...................................................... 11
1.2.1 SMPTE RP 133-1991 .........................................................................................................................11 1.2.2 NEMA-DICOM Standard (PS 3) .....................................................................................................11 1.2.3 DIN V 6868-57 ...................................................................................................................................13 1.2.4 ISO 9241 and 13406 Series................................................................................................................13 1.2.5 VESA Flat Panel Display Measurements (FPDM) Standard .......................................................14
2 OVERVIEW OF ELECTRONIC DISPLAY TECHNOLOGY ...................................................16
2.1 Electronic Display System Components ..........................................................................16 2.1.1 General Purpose Computer...............................................................................................................16 2.1.2 Operating System Software ...............................................................................................................16 2.1.3 Display Processing Software .............................................................................................................17 2.1.4 Display Controller...............................................................................................................................17 2.1.5 Display Device.....................................................................................................................................18 2.1.6 Workstation Application Software ...................................................................................................18
2.2 Photometric Quantities Pertaining Display Devices........................................................19 2.2.1 Luminance............................................................................................................................................19 2.2.2 Illuminance...........................................................................................................................................19
2.3 Display Device Technologies .......................................................................................... 20 2.3.1 Cathode-Ray Tubes.............................................................................................................................20
2.3.1.1 CRT Structure and Principles of Operation...........................................................................20 2.3.1.2 Video Signal, Brightness, and Contrast...................................................................................23 2.3.1.3 Pixel Characteristics and Resolution .......................................................................................23
2.3.2 Emerging Display Technologies .......................................................................................................28 2.3.2.1 Liquid Crystal Displays..............................................................................................................29 2.3.2.2 Emissive Flat Panel Displays....................................................................................................31
2.4 Engineering Specifications for Display Devices ............................................................. 33 2.4.1 Physical Dimensions...........................................................................................................................34 2.4.2 Power Supply .......................................................................................................................................34 2.4.3 Input and Output Signals...................................................................................................................34 2.4.4 Bandwidth (CRT) ................................................................................................................................34 2.4.5 Environmental Specifications............................................................................................................35 2.4.6 Matrix Size............................................................................................................................................35 2.4.7 Display Area.........................................................................................................................................35

AAPM TG18 Preprint DRAFT (version 10.0)
3 August 26, 2004
2.4.8 Phosphor Type (CRT)........................................................................................................................35 2.4.9 Refresh Rate.........................................................................................................................................36 2.4.10 Pixel size...........................................................................................................................................36 2.4.11 Luminance .......................................................................................................................................36 2.4.12 Luminance Uniformity...................................................................................................................37 2.4.13 Surface Treatments.........................................................................................................................37 2.4.14 Bit Depth .........................................................................................................................................38 2.4.15 Viewing Angle (LCD) ....................................................................................................................38 2.4.16 Aperture Ratio (LCD)....................................................................................................................38
2.5 Classification of Display Devices..................................................................................... 38
3 GENERAL PREREQUISITES FOR DISPLAY ASSESSMENTS............................................... 40
3.1 Assessment Instruments .................................................................................................. 40 3.1.1 Photometric Equipment.....................................................................................................................40
3.1.1.1 Luminance-meter (Photometer) ..............................................................................................40 3.1.1.2 Illuminance-meter ......................................................................................................................42 3.1.1.3 Colorimeter .................................................................................................................................42
3.1.2 Imaging Equipment ............................................................................................................................43 3.1.2.1 Scientific-grade CCD Camera ..................................................................................................43 3.1.2.2 Photographic-grade CCD Camera...........................................................................................44
3.1.3 Light Source and Blocking Devices..................................................................................................44 3.1.4 Miscellaneous Accessory Devices.....................................................................................................47
3.2 Test Patterns .................................................................................................................... 47 3.2.1 Multi-purpose Test Patterns ..............................................................................................................48
3.2.1.1 TG18-QC Pattern ......................................................................................................................48 3.2.1.2 TG18-PQC Pattern....................................................................................................................50 3.2.1.3 TG18-BR Pattern.......................................................................................................................51
3.2.2 Luminance Test Patterns ...................................................................................................................52 3.2.2.1 TG18-CT Pattern.......................................................................................................................52 3.2.2.2 TG18-LN Patterns.....................................................................................................................53 3.2.2.3 TG18-UN Pattern......................................................................................................................54 3.2.2.4 TG18-AD Pattern ......................................................................................................................55 3.2.2.5 TG18-MP Pattern ......................................................................................................................56
3.2.3 Resolution Test Patterns ....................................................................................................................56 3.2.3.1 TG18-RH and TG18-RV Patterns ..........................................................................................56 3.2.3.2 TG18-PX and TG18-CX Patterns ..........................................................................................57 3.2.3.3 TG18-LP Patterns......................................................................................................................59
3.2.4 Noise Test Patterns.............................................................................................................................60 3.2.4.1 TG18-AFC Pattern ....................................................................................................................60 3.2.4.2 TG18-NS Pattern.......................................................................................................................61
3.2.5 Glare Test Patterns .............................................................................................................................61 3.2.5.1 TG18-GV and TG18-GVN Patterns .....................................................................................61 3.2.5.2 TG18-GQ and TG18-GA Patterns.........................................................................................63
3.2.6 Anatomical Test Images.....................................................................................................................63 3.2.6.1 TG18-CH Image ........................................................................................................................64 3.2.6.2 TG18-KN Image........................................................................................................................65 3.2.6.3 TG18-MM1 and TG18-MM2 Images.....................................................................................65
3.3 Software ............................................................................................................................ 67 3.3.1 Pattern-generator Software................................................................................................................67 3.3.2 Processing Software............................................................................................................................68

AAPM TG18 Preprint DRAFT (version 10.0)
4 August 26, 2004
3.3.3 Spreadsheets.........................................................................................................................................68 3.4 Initial Steps for Display Assessment................................................................................ 68
3.4.1 Availability of Tools............................................................................................................................68 3.4.2 Display Placement...............................................................................................................................69 3.4.3 Start-up Procedures ............................................................................................................................69 3.4.4 Ambient Lighting Level .....................................................................................................................69 3.4.5 Minimum and Maximum Luminance Settings................................................................................70 3.4.6 DICOM Grayscale Calibration .........................................................................................................71
4 ASSESSMENT OF DISPLAY PERFORMANCE .................................................................... 72
4.1 Geometric Distortions...................................................................................................... 72 4.1.1 Description of Geometric Distortions.............................................................................................72 4.1.2 Quantification of Geometric Distortions........................................................................................73 4.1.3 Visual Evaluation of Geometric Distortions ..................................................................................73
4.1.3.1 Assessment Method...................................................................................................................73 4.1.3.2 Expected Response....................................................................................................................73
4.1.4 Quantitative Evaluation of Geometric Distortions .......................................................................73 4.1.4.1 Assessment Method...................................................................................................................73 4.1.4.2 Expected Response....................................................................................................................73
4.1.5 Advanced Evaluation of Geometric Distortions ...........................................................................74 4.1.5.1 Assessment Method...................................................................................................................74 4.1.5.2 Expected Response....................................................................................................................75
4.2 Display Reflection ............................................................................................................ 75 4.2.1 Description of Display Reflection ....................................................................................................75
4.2.1.1 Specular Reflection Characteristics..........................................................................................76 4.2.1.2 Diffuse Reflection Characteristics ...........................................................................................76
4.2.2 Quantification of Display Reflection ...............................................................................................77 4.2.2.1 Specular Reflection Characteristics..........................................................................................77 4.2.2.2 Diffuse Reflection Characteristics ...........................................................................................78
4.2.3 Visual Evaluation of Display Reflection..........................................................................................78 4.2.3.1 Assessment Method...................................................................................................................78 4.2.3.2 Expected Response....................................................................................................................78
4.2.4 Quantitative Evaluation of Display Reflection...............................................................................79 4.2.4.1 Assessment Method...................................................................................................................79 4.2.4.2 Expected Response....................................................................................................................80
4.2.5 Advanced Evaluation of Display Reflection ...................................................................................81 4.2.5.1 Assessment Method...................................................................................................................81 4.2.5.2 Expected Response....................................................................................................................82
4.3 Luminance Response....................................................................................................... 82 4.3.1 Description of Luminance Response...............................................................................................82 4.3.2 Quantification of Luminance Response ..........................................................................................86 4.3.3 Visual Evaluation of Luminance Response.....................................................................................87
4.3.3.1 Assessment Method...................................................................................................................87 4.3.3.2 Expected Response....................................................................................................................87
4.3.4 Quantitative Evaluation of Luminance Response..........................................................................88 4.3.4.1 Assessment Method...................................................................................................................88 4.3.4.2 Expected Response....................................................................................................................88
4.3.5 Advanced Evaluation of Luminance Response..............................................................................90 4.3.5.1 Assessment Method...................................................................................................................90 4.3.5.2 Expected Response....................................................................................................................91

AAPM TG18 Preprint DRAFT (version 10.0)
5 August 26, 2004
4.4 Luminance Spatial and Angular Dependencies .............................................................. 92 4.4.1 Description of Luminance Dependencies.......................................................................................93
4.4.1.1 Non-uniformity ..........................................................................................................................93 4.4.1.2 Angular Dependence .................................................................................................................93
4.4.2 Quantification of Luminance Dependencies ..................................................................................94 4.4.3 Visual Evaluation of Luminance Dependencies.............................................................................95
4.4.3.1 Assessment Method...................................................................................................................95 4.4.3.2 Expected Response....................................................................................................................95
4.4.4 Quantitative Evaluation of Luminance Dependencies..................................................................95 4.4.4.1 Assessment Method...................................................................................................................95 4.4.4.2 Expected Response....................................................................................................................96
4.4.5 Advanced Evaluation of Luminance Dependencies......................................................................97 4.4.5.1 Assessment Method...................................................................................................................97 4.4.5.2 Expected Response....................................................................................................................97
4.5 Display Resolution ........................................................................................................... 98 4.5.1 Description of Display Resolution ...................................................................................................98 4.5.2 Quantification of Display Resolution...............................................................................................99 4.5.3 Visual Evaluation of Display Resolution.........................................................................................99
4.5.3.1 Assessment Method...................................................................................................................99 4.5.3.2 Expected Response..................................................................................................................100
4.5.4 Quantitative Evaluation of Display Resolution............................................................................101 4.5.4.1 Assessment Method.................................................................................................................101 4.5.4.2 Expected Response..................................................................................................................102
4.5.5 Advanced Evaluation of Display Resolution ................................................................................103 4.5.5.1 Assessment Method.................................................................................................................103 4.5.5.2 Expected Response..................................................................................................................104
4.6 Display Noise.................................................................................................................. 104 4.6.1 Description of Display Noise..........................................................................................................104 4.6.2 Quantification of Display Noise .....................................................................................................105 4.6.3 Visual Evaluation of Display Noise................................................................................................105
4.6.3.1 Assessment Method.................................................................................................................105 4.6.3.2 Expected Response..................................................................................................................105
4.6.4 Quantitative Evaluation of Display Noise.....................................................................................106 4.6.4.1 Assessment Method.................................................................................................................106 4.6.4.2 Expected Response..................................................................................................................107
4.6.5 Advanced Evaluation of Display Noise.........................................................................................107 4.6.5.1 Assessment Method.................................................................................................................107 4.6.5.2 Expected Response..................................................................................................................108
4.7 Veiling Glare....................................................................................................................108 4.7.1 Description of Veiling Glare ...........................................................................................................108 4.7.2 Quantification of Veiling Glare.......................................................................................................110 4.7.3 Visual Evaluation of Veiling Glare .................................................................................................110
4.7.3.1 Assessment Method.................................................................................................................110 4.7.3.2 Expected Response..................................................................................................................110
4.7.4 Quantitative Evaluation of Veiling Glare ......................................................................................111 4.7.4.1 Assessment Method.................................................................................................................111 4.7.4.2 Expected Response..................................................................................................................111
4.7.5 Advanced Evaluation of Veiling Glare ..........................................................................................111 4.7.5.1 Assessment Method.................................................................................................................111 4.7.5.2 Expected Response..................................................................................................................112

AAPM TG18 Preprint DRAFT (version 10.0)
6 August 26, 2004
4.8 Display Chromaticity ...................................................................................................... 112 4.8.1 Description of Display Chromaticity .............................................................................................112 4.8.2 Quantification of Display Chromaticity.........................................................................................112 4.8.3 Visual Evaluation of Display Chromaticity ...................................................................................113
4.8.3.1 Assessment Method.................................................................................................................113 4.8.3.2 Expected Response..................................................................................................................113
4.8.4 Quantitative Evaluation of Display Chromaticity ........................................................................113 4.8.4.1 Assessment Method.................................................................................................................113 4.8.4.2 Expected Response..................................................................................................................114
4.8.5 Advanced Evaluation of Display Chromaticity ............................................................................114 4.8.5.1 Assessment Method.................................................................................................................114 4.8.5.2 Expected Response..................................................................................................................114
4.9 Miscellaneous Tests ........................................................................................................ 114 4.9.1 CRT Displays.....................................................................................................................................114
4.9.1.1 Artifacts .....................................................................................................................................114 4.9.1.2 Moiré Patterns ..........................................................................................................................115 4.9.1.3 Color Artifacts ..........................................................................................................................116 4.9.1.4 Physical Defects .......................................................................................................................116 4.9.1.5 Flicker ........................................................................................................................................117
4.9.2 LCD Displays ....................................................................................................................................117 4.9.2.1 Electronic Cross-talk ...............................................................................................................118 4.9.2.2 Pixel defects ..............................................................................................................................118
4.10 Overall Evaluations ......................................................................................................... 119 4.10.1 Evaluations using TG18-QC Pattern ........................................................................................119 4.10.2 Evaluations using TG18-BR Pattern .........................................................................................119 4.10.3 Evaluations using TG18-PQC Pattern......................................................................................120 4.10.4 Evaluations using TG18-LP Patterns ........................................................................................120 4.10.5 Evaluations using Anatomical Images.......................................................................................120
5 ACCEPTANCE TESTING OF A DISPLAY SYSTEM ............................................................122
5.1 Prerequisites for Acceptance Testing .............................................................................122 5.1.1 Personnel ............................................................................................................................................122 5.1.2 Preliminary Communications ..........................................................................................................122 5.1.3 Component Inventory......................................................................................................................122 5.1.4 Initial Steps.........................................................................................................................................122
5.2 Tests and Criteria ............................................................................................................123
6 QUALITY CONTROL OF A DISPLAY SYSTEM .................................................................125
6.1 Prerequisites for Quality Control ....................................................................................125 6.1.1 Personnel ............................................................................................................................................125 6.1.2 Availability of Prior Evaluations .....................................................................................................125 6.1.3 Initial Steps.........................................................................................................................................125
6.2 Tests and Criteria ............................................................................................................126
REFERENCES .......................................................................................................................128
APPX I EVALUATION OF “CLOSED” DISPLAY SYSTEMS ....................................................134
I.1 General Considerations...................................................................................................134 I.1.1 Preliminary communications ...........................................................................................................134 I.1.2 Component inventory ......................................................................................................................134

AAPM TG18 Preprint DRAFT (version 10.0)
7 August 26, 2004
I.2 Preparation for evaluation ...............................................................................................................135 I.2.1 Instrumentation needed...............................................................................................................135
I.2.2 Initial Steps.........................................................................................................................................135 I.2.2.1 Special Considerations for Operator Console Displays ...........................................................135
I.2 Display Evaluation Procedures.......................................................................................136
APPX II EQUIVALENT APPEARANCE IN MONOCHROME IMAGE DISPLAY........................137
APPX III DESCRIPTION OF TG18 TEST PATTERNS...........................................................139
APPX IV SELECTED BIBLIOGRAPHY..................................................................................149
AAPM TG18 Preprint DRAFT (version 10.0)
8 August 26, 2004
Preface The adoption of digital detector technology and Picture Archiving and Communication Systems (PACS) have provided healthcare institutions an effective means to electronically archive and retrieve radiological images. Medical display workstations, an integral part of PACS, are used to display these images for clinical diagnostic interpretation. Considering the fundamental importance of display image quality to the overall effectiveness of a diagnostic imaging practice, it is vitally important to assure that electronic display devices (also termed softcopy displays) do not compromise image quality as a number of studies have suggested (Ackerman 1993, Scott 1993, Scott 1995). According to the AAPM professional guidelines (AAPM 1994), the performance assessment of electronic display devices falls within the professional responsibilities of medical physicists in healthcare institutions. However, there are currently no guidelines available to perform this function in a clinical setting. Prior literature has focused mostly on design aspects or on the fundamental physics of the display technology (Muka 1995, Senol 1995, Kelley 1995, Muka 1997). A number of investigations have begun to address the quality control aspects of electronic displays (Roehrig 1990a, Gray 1992, Nawfel 1992, Reimann 1995, Eckert 1995, Kato 1995), and the DICOM, through its Grayscale Standard Display Function (GSDF) working group 3.14, has recently provided recommendations for grayscale standardization of softcopy displays (NEMA PS3.14). However, prior efforts have fallen short of providing a systematic approach for testing the performance of display devices. In order to be useful, the approach should cover all aspects of display performance, be specific to medical displays, and be relatively easy to implement in a clinical setting. The intent of this report is to provide standard guidelines to practicing medical physicists, engineers, researchers, and radiologists for the performance evaluation of electronic display devices intended for medical use. Radiology administrative staff as well as manufacturers of medical displays may find this reference helpful. The scope of this report is limited to display devices that are used to display monochromatic medical images. Since cathode-ray tubes (CRTs) and liquid crystal displays (LCDs) are currently the dominant display technologies in medical imaging, significant attention is paid to CRTs and LCDs. However, many of the tests and concepts could be adapted to other display technologies, which might find their place in medical imaging in the future. It is hoped that this report will help educate medical physicists and other health care professionals on this subject, will facilitate inter- and intra-institutional comparisons, and will facilitate communication between industry and medical physicists.

AAPM TG18 Preprint DRAFT (version 10.0)
9 August 26, 2004
How to Use this Report This report is divided into six sections as outlined below:
• Section one summarizes prior standardization efforts in the performance evaluation of medical display devices.
• Section two is a tutorial on the current and emerging medical display technologies. The section focuses on CRT and flat-panel LCD display devices. The section also defines photometric quantities pertaining to displays and outlines current engineering specifications of display devices. Finally, the section offers a definition for the two classes of display devices, primary and secondary devices, used in medicine and addressed in this report.
• Section three sets forth prerequisites for the assessment of the display performance and includes a description of required instrumentation and TG18 test patterns. In addition, the initial prerequisite steps for testing a display device are described.
• Section four is the main body of this report. The section includes the description and the general quantification methods for each key display characteristic. The section provides detailed methodology for testing each characteristic at three different levels: visual, quantitative, and advanced. The two former levels are more applicable to clinical display devices, while the latter provides some guidelines and general direction for individuals interested in more advanced characterization. The section further provides guidelines and criteria for acceptable performance of the device at each of the three levels of evaluation for both the primary and secondary display devices.
• Sections five and six outline procedures for acceptance testing and quality control of display devices. The sections include two detailed tables (Tables 7 and 8) that summarize the tests that should be performed as a part of acceptance testing or quality control, the details of which are fully described in the preceding Sections 3 and 4. Sections 5 and 6 can be used as the starting point for evaluating the performance of a medical display device for medical physicists who must learn in a short time the tests that need to be performed.
• Appendix I provides guidelines for evaluating the performance of “closed” display systems, the systems on which the TG18 test pattern cannot be easily displayed.
• Appendix II is a tutorial on the requirements for equivalent appearance of images on monochrome image displays.
• Appendix III provides a full tabular description of TG18 test patterns. • Appendix IV provides a selected bibliography of display evaluation.
The report is largely organized as a detailed tutorial on the evaluation of medical display devices. However, it does not need to be read or utilized in the order in which it is presented. Individuals unfamiliar with the subject might want to go through the report sequentially. However, those who are familiar with the subject or have limited time, may start from Sections 5 and 6 and identify the exact tests that they want to perform and the required instrumentation and patterns. The details of the tests and the tools can then be sought in Sections 3 and 4.

AAPM TG18 Preprint DRAFT (version 10.0)
10 August 26, 2004
1 Introduction 1.1 Background The medical image display is typically the last stage of a medical imaging chain. Medical images are initially created by imaging modalities such as x-ray, ultrasound (US), magnetic resonance imaging (MRI), computed tomography (CT), or nuclear medicine scans that measure physical or functional attributes of the patient in the form of multi-dimensional data sets. Images vary widely in their characteristics such as size, spatial resolution, and data depth. Data from different modalities also vary in the way that they are meant to be viewed and comprehended. Historically, most medical imaging instruments recorded images directly on films that were viewed by trans-illumination on a light box. The response of the film defined the relationship between the physical attribute being imaged (such as x-ray absorption) and the image characteristics (film density). The advent of digital modalities led to the generation of intrinsically electronic images. In the early implementations, these images were sent to digital printers. Many of these connections were initially direct with a printer serving only one image source, or several image sources with similar characteristics. The appearance of the printed image was controlled by calibrating each image source together with the printer to give acceptable results. It was not necessary to standardize either the source or the output device, since they were adjusted together. Later, network capabilities were added to digital printers so that several imaging devices could access a single printer. Printers were designed to accept a command code from the modality that would select the appropriate modality specific response of the imager to the incoming data. In this case, it was necessary only for the printer to respond appropriately to the proper code, and no standardization was required. As display workstations were introduced, medical images could be viewed on a video display device with the ability to alter the appearance of the image. These devices were used primarily for receiving and displaying digital images from a few similar imaging instruments, and the image appearance was adjusted using the “Brightness” and “Contrast” controls of the display device. The “fluidity” of softcopy presentation raised concerns about the consistency of image appearance. The cross-utilization of both softcopy and hardcopy images brought new challenges in that respect to diagnosticians, raising the need for acceptance testing and quality control of electronic medical displays. Before roughly 1970, few electronic medical imaging users gave thought to acceptance testing and quality control, relying instead on the modality manufacturer for quality control and set up of the electronics, and the CRT manufacturer to provide uniform CRT performance. In the 1970’s, medical CRT progressively implemented more advanced designs to enhance performance via adding variations in signal characteristics using interlaced and progressive scanning methods to achieve increased matrix sizes and different display aspect ratios. In addition, phosphors with characteristics (e.g., spectral composition, persistence) optimized for human observers started to be employed in medical CRTs. The advent of liquid crystal displays (LCDs) for radiological applications in the last few years has further raised the need for uniformity of image quality across different display technologies. With these new advancements and variables, users became increasingly aware of the need for, and benefits of, quality control. In a modern PACS environment, images from a number of instruments of varying type may be viewed or printed in a variety of locations by different individuals. Various clinicians at different locations may read an examination on different display workstations, referring physicians may review an examination as a part of a clinic visit, and a surgeon may print images for use in the operating room. In such cases, standards are essential to successful integration of these components. Standardization must include not only the

AAPM TG18 Preprint DRAFT (version 10.0)
11 August 26, 2004
communications protocols and data formats but also capabilities for ensuring the consistency of image display and presentation among the modalities, printers, and workstations where images will be displayed. 1.2 Existing Display Performance Evaluation Standards In this section, we summarize some prior efforts to standardize the evaluation of softcopy electronic medical display devices. This summary is not meant to be comprehensive and is limited to those initiatives that were directly related to the objectives of this Task Group. For a more comprehensive description, readers are encouraged to consult the references (Nier 1991, Nier 1996). 1.2.1 SMPTE RP 133-1991 The need for user evaluation was addressed by the Society of Motion Picture and Television Engineers (SMPTE) in the early 1980’s and resulted in the approval and publication in 1986 of a recommended practice, SMPTE RP 133-1991, Specifications for Medical Diagnostic Imaging Test Pattern for Television Monitors and Hardcopy Recording Cameras (SMPTE RP133). SMPTE RP 133 describes the format, dimensions, and contrast required of a pattern to make measurements of the resolution of such systems for both analog and digital signal sources. The recommended practice provided users with a single comprehensive test pattern for initial set-up, and day-to-day operational checks and adjustments for display focus, luminance, contrast, spatial resolution, mid-band streaking, uniformity, and linearity for both soft-copy displays and hard-copy film recordings. However, while the recommended practice specified both a test pattern and methodology, no performance specification standards were proposed. One feature of the recommended practice was a popular test pattern that has become known as simply “the SMPTE pattern” (pronounced SIMP-tee) (see Section 3.2.1). One the most valuable and frequent uses of the pattern has been for rough luminance adjustment of display systems, via its 5% and 95% inset patches. This ensured that inappropriate adjustment of display Brightness and Contrast controls or printer settings was not rendering the extremes of signal amplitudes undetectable (see Section 3.4.5 and 4.3 for details). It should be noted that even though the SMPTE pattern provided a means to visualize the entire range of gray scale values in an image, it did not guarantee that all gray scale values were distinctly presented. Furthermore, the pattern did not ensure equivalent presentation of an image with different display systems, which could vary in their maximum and minimum luminance capabilities and/or in their luminance transfer characteristics. 1.2.2 NEMA-DICOM Standard (PS 3) In 1984, the American College of Radiology (ACR) and the National Electrical Manufacturers Association (NEMA) formed a committee that produced and currently maintains the Digital Imaging and Communications in Medicine (DICOM) standard. The committee produced a document, Grayscale Display Standard Function (NEMA PS3.14), which specified a standardized display function known as the Grayscale Display Standard Function (GSDF) the for grayscale images that takes into account the non-linear nature of the human visual system. The intent of the standard was to allow images transferred using the DICOM standard to be displayed on any DICOM compatible display device and have the gray scale appearance of the image be consistent. The consistent appearance of images was approached through perceptual linearization, where equal changes in digital values cause equal changes in perceived brightness (Hemminger 1994). See Section 4.3 and Appendix II for further discussion of consistency of image appearance. The standard distinguished the standardization of display devices from the optimization of image display. Optimization occurs during image processing of the image, and support for optimization

AAPM TG18 Preprint DRAFT (version 10.0)
12 August 26, 2004
via look-up table functions is possible in DICOM (in the Modality LUT, Value Of Interest LUT, and Presentation LUT, defined in next paragraph), see Fig. 1. To understand this standard it is necessary to clearly distinguish between pixel values, gray-scale values, p-values, digital driving levels, and the monitor characteristic function. After image acquisition and certain corrections (e.g., flat field and gain corrections) the application saves the image to disk – the digital image is basically an array of pixel values (also termed gray scale values), often with 12 – 16 bits per pixel. When requested to display the image the application may apply additional image processing (e.g., edge-enhancement) and software or hardware implemented window/level adjustments, and eventually the application is ready to display the image. The pixel-dependent digital values it sends to the display hardware are termed p-values, for presentation values. The display hardware (specifically the display adapter) provides a digital look-up table (LUT, see Fig. 2) that converts the p-values to digital driving levels (DDLs), which are converted to luminance values by the display hardware. A digital to analog converter, DAC, and analog electronics are generally involved in the conversion from DDLs to luminance levels, although all-digital monitors are now available in LCD technology. Note that the DDL to luminance transformation, termed the monitor characteristic function, is generally not adjustable. The DICOM standard allows the calculation of a function that maps the p-values to DDLs such that the displayed luminance levels have the desirable property that equal changes in perceived brightness occur for equal changes in p-values. In practice, the characteristic function is determined by initially applying a unit transformation at the LUT, which allows software manipulation of the DDLs and direct measurement of the monitor characteristic function. This function is used to calculate the necessary LUT entries such that the net transformation from p-values to luminance follows the DICOM standard. Note that DICOM specifies the exchange and presentation of images, but it leaves the implementation considerations to the vendors. Thus, image processing or standardization may occur on the computer, in the graphics/video card, or on the display itself. The interested user should consult the original DICOM document for valuable information on methodology necessary to correctly implement the DICOM standard. Support for the DICOM standard, including the grayscale display standard function, is available from all major medical imaging vendors.
Modality Values
of Interest
Polarity Presentation
Image Presentation DICOM
StandardizedDisplay System
Note: The Presentation LUT may be an identity function if, for example, the Polarity is unchanged and the Values of Interest transformation outputs p-values.
Fig. 1: The Grayscale Display Standard Function is an element of the image presentation after several modifications to the image have been completed by other elements of the image acquisition and presentation chain. Adapted, with permission, from NEMA PS 3.14-2000.

AAPM TG18 Preprint DRAFT (version 10.0)
13 August 26, 2004
P-values to DDLs Display System Luminance
P-values DDLs
Standardized Display System
P-values to DDLs Display System Luminance
P-values DDLs
Standardized Display System
Fig. 2: The conceptual model of a Standardized Display System maps p-values to Luminance via an intermediate transformation to Digital Driving Levels of an unstandardized Display System. Adapted, with permission, from NEMA PS 3.14-2000. 1.2.3 DIN V 6868-57 Acceptance testing and quality control was mandated in Germany as of 1987. The German Standards Institution, Deutsches Institut für Normung e.V. (DIN), standard 6868 part 57, Image quality assurance in x-ray diagnostics, Acceptance testing for image display devices (DIN 6868), was developed as an acceptance testing standard addressing the requirements for display systems. The standard specifies the requirements for acceptance testing of display devices, and the resulting reference values are then used for quality control or constancy checks. The aspects of the display performance covered included: 1) viewing conditions and the effects of ambient illuminance, 2) gray scale reproduction, 3) spatial resolution, 4) contrast resolution, 5) line structure, 6) color aspects, 7) artifacts, and 8) image instabilities. Appropriate test images were specified including the SMPTE test pattern. As with the SMPTE recommended practice, the DIN standard allows the test patterns to be supplied either by an analog video pattern generator or by a computer via a digital file. In addition to geometric test patterns, at least one clinical reference image is also mandated for a visual assessment of the gray scale value display and for checking the absence of artifacts (especially pseudo-contours). DIN V 6868-57 called for joint assessment of both the imaging device (acquisition modality) and display device. The standard defined three application categories of display devices: category A for digital radiographic images, category B for all other types of images, and category C for alphanumeric/graphic or control monitors. Recommendations were provided for each of the QC controls or constancy checks according to the devices intended use, including environmental viewing conditions. It included a requirement for the ratio of the maximum to minimum luminance. The standard required that for category A devices this ratio must be greater than 100, and greater than 40 for category B devices. Spatial luminance uniformity, expressed as the fractional deviation between corner and center luminance, must not exceed 30% for cathode ray tubes, and be within ± 15% for flat-panel displays. Flicker must be unobservable for 90% of observers. As for the luminance function, the DIN standard recognized two functions for uniform display presentation, the DICOM function described above and a function specified by the International Commission on Illumination, Commission Internationale de l’Eclairage (CIE). Incorporating IEC 61223-2-5: 1994 (Evaluation and routine testing in medical imaging departments - Part 2-5: Constancy tests - Image display devices) (IEC 61223), the standard requires that luminance measurements be made with a meter with an absolute measuring uncertainty (2σ) of 10% within a measuring range of 0.05 cd/m2 to ≥ 500 cd/m2, an angular acceptance between one and five degrees, and photopic spectral sensitivity. 1.2.4 ISO 9241 and 13406 Series

AAPM TG18 Preprint DRAFT (version 10.0)
14 August 26, 2004
The ISO standard, ISO 9241-3:1992 Ergonomic requirements for office work with visual display terminals (VDTs) -- Part 3: Visual display requirements (ISO 9241-3), aimed to establish image quality requirements for the design and evaluation of video display terminals for text applications such as data entry, text processing, and interactive querying. The standard provides test methods and conformance requirements for geometric linearity, orthogonality, minimum display luminance, minimum contrast, luminance ratios between hard and soft images, glare, luminance spatial uniformity, temporal instability (flicker), spatial instability (jitter), and screen image color. While in practice ISO 9241-3 is most useful to the user as a purchase specification, Annex B provides an empirical method for assessing flicker and jitter. An alternative comparative user performance test method for testing compliance is included in Annex C. The ISO 9241 standard does not address flat panel display devices. Those devices are addressed by a newer ISO standard, ISO 13406-2:2001 Ergonomic requirements for work with visual displays based on flat panels -- Part 2: Ergonomic requirements for flat panel displays (ISO 13406-2). The key display issues covered by this standard are display luminance, contrast, reflection, color, luminance uniformity, color uniformity, font analysis, pixel defaults, and flicker. Under ISO 9241, ergonomic requirements for display devices are specified under parts 3, 7, and 8, while ISO 13406-2 is equivalent to those parts combined. 1.2.5 VESA Flat Panel Display Measurements (FPDM) Standard In May 1998 the Video Electronics Standards Association (VESA) released Version 1.0 of the Flat Panel Display Measurements Standard (FPDM) (VESA 1998). The purpose of this document was to specify reproducible, unambiguous, and meaningful electronic display metrology. The FPDM standard is strictly not a compliance standard, but rather it is a manual of procedures by which a display’s conformance to a compliance standard may be verified. Accordingly, the FPDM Standard complements the requirements set forth by compliance standards bodies. It is intended to extend the standard so that it can be used for all display types. However, the current version focuses on emissive or transmissive color displays that are used in the workplace, in laptop computers, or equivalent. Particular attention is paid to the measurements that would characterize the performance of flat-panel displays. The format of the FPDM Standard offers easy access to the procedures through short sections that enumerate the basic measurements. Each of these sections contains a description, setup protocol, description of the measurement procedure, analysis, reporting, and comments. The procedures have all been tested before inclusion, and many (identified as being in the “suite of basic measurements”) are considered essential in the industry. The measurements described in the FPDM standard are divided into the following categories: center measurements of full screen; detail, resolution, and artifacts; box-pattern measurements; temporal performance; uniformity; viewing-angle performance; reflection; electrical performance; and mechanical and physical characteristics. Following all the procedures is a set of explanations of methodologies including pattern generators, light-measurement devices, diagnostics for spatial, temporal, and chromatic problems, array detector measurements, error analysis, and harsh environment testing. These specific metrology explanations are followed by textbook tutorials ranging in subject matter from photometry and colorimetry to the optical principles underlying all display measurements. Soon after Version 1.0 of VESA FPDM was published in May 1998, the need became clear for good metrology standards for all kinds of displays, not just for flat-panel displays. Accordingly, the Display Metrology Committee (DMC) was formed to apply the concept of the FPDM standard to many other display areas served by VESA. The DMC inherited the working membership of the FPDM Working Group in the VESA Display Committee. The FPDM Version 2.0, published in June 2001 (VESA 2001), contains measurements unique to CRT and projection displays including contributions from the National

AAPM TG18 Preprint DRAFT (version 10.0)
15 August 26, 2004
Information Display Laboratory (NIDL) such as raster pincushion and linearity, convergence, and stereo extinction ratio. The FPDM and DMC aim to detail display measurement methods, and do not provide recommendations for performance criteria, compliance criteria, or ergonomic requirements for specific applications.

AAPM TG18 Preprint DRAFT (version 10.0)
16 August 26, 2004
2 Overview of Electronic Display Technology In the following, we review the components of electronic display systems and the engineering concepts that are important for understanding how the performance of devices can be assessed and standardized. 2.1 Electronic Display System Components Medical imaging workstations consist of several physical and functional components. These include the computer, operating system software, application display software, display driver, and the display device. Displaying digital images in a softcopy display workstation is only possible by a series of manipulations of digital data in each of these components. The functions and characteristics of each affect the process of displaying, viewing, and interpreting the images. In this report, display device refers to the physical display component of a display system or workstation, sometimes referred to as display monitor. 2.1.1 General Purpose Computer The computer is the foundational component of a display workstation. Most display workstations use a general-purpose computer, which includes a central processing unit (CPU), mathematical computation modules, input/output (I/O) controllers, and network communication hardware. The computer also includes devices for user interaction such as keyboard, mouse, trackball or wheel, joystick, barcode scanner, or microphone; devices for storage or recording such as a hard disk, DVD, CD, or tape units; and output devices such as display monitors, printers, and speakers. Computers rely on several other hardware and software components for displaying images. These include the display controller hardware that converts digital information into analog signals or as appropriate for the display device, and software modules that allow programs to access the controller hardware. Finally, a user application program is needed to access image data and send it to a display controller in the proper form. One primary difference between a standard computer system and a medical workstation is its associated display interface. The special needs of medical imaging necessitate the use of special display software, high-resolution display devices, and high performance display controllers, which are not normally needed for general consumers. 2.1.2 Operating System Software Basic computer hardware such as hard disks, central processing units, input/output devices, and printers require complex software to perform their functions properly and efficiently. In addition, many functions that are necessary or useful are usually not implemented in computer hardware, due to cost or inflexibility of hardware solutions. Instead, software is used to give the hardware the complex, detailed, but definite instructions to perform their functions. The operating system (OS) is a low level specialized program that controls the resources of the computer. It provides services such as network communications, security, display management, file management, and execution of application programs. The OS also provides time-sharing resources and interrupt processing to permit multiple programs to be simultaneously active, each receiving a portion of the processing power of the central processor(s). The OS also monitors events that originate from hardware devices such as the keyboard, mouse, the network, and other devices running autonomous tasks. The OS provides interfaces for users as well as services that can be used by application programs. Operating systems differ in the interaction modes supported, in the types and degree of user access

AAPM TG18 Preprint DRAFT (version 10.0)
17 August 26, 2004
controls, in the type of protection provided between applications, and in the services provided by the OS to application programs. Also, operating systems provide different methods for supporting multiple applications running together such as cooperative versus preemptive multi-tasking. Since the operating system effectively creates the robustness of the computer, different computer hardware may use the same operating system, and interface to a user. The OS therefore creates an operating environment for the user and for applications programs. Hence, an operating system may be implemented on many types of computer hardware and will have the same look and feel. Alternatively, a given hardware configuration may support one or more operating systems and provide multiple looks, depending upon how it is “booted.” However, typically a particular operating system runs on a narrow class of central processors, and most computers are set up to run only one OS. Operating systems used in medical imaging workstations include UNIX, LINUX, Macintosh, and various Microsoft Windows systems. Functionally any operating system can support a medical imaging system. Practically, the choice of operating system is driven by several technical and non-technical needs: the degree of performance required for the entire system, the operating systems support for particular applications or hardware, and the ability of the medical facility to support multiple computer operating systems. The choice of operating system will limit what kinds of software can be run on the computer, and the interface and provided tools will determine how the user interacts with the machine. 2.1.3 Display Processing Software All digital images consist of an array of digital gray scale values that are transformed to image luminance values by the display device. Devices that acquire medical images will frequently store images with values specific to the modality, such as the CT numbers for computed tomography (CT) scanners. For some acquisition devices, the values used by different devices may be different, for example the image values generated and stored by digital radiography (DR) imaging devices of different manufacturers. To be viewable, these image values must first be converted to digital driving levels and finally converted to analog or digital voltages for presentation on a display device. The conversion of image values to digital driving levels involves transformations at the OS level, using OS’s image processing software modules, or at the application display software level. For example, DR images are commonly processed using non-linear transformations for data scaling, spatial transformations for equalization, and edge enhancement for resolution restoration. In CT, display software is used to provide simple linear value transformations associated with display window and level adjustments. The processing might also include colorizing the image, such as in nuclear medicine and ultrasound imaging. The software support for color is more complex, commonly needing greater efficacy that comes with processing at the operating system level. 2.1.4 Display Controller A display controller, sometimes referred to as the video card or graphics card, is a combination of hardware and software to transform digital driving levels to appropriate signals for the display device. The controller includes a special purpose memory (i.e. video memory for analog displays) that accepts the output of the application program in “screen-ready” form. The digital values in this memory are transformed to signals ready for the display device. Repeated scans of the memory refresh the picture. A computer system also has driver software that provides an interface for the application to control the contents of the video memory. For example, in response to window or level adjustments, the software application program changes the display screen seen by the viewer by calling driver software that appropriately updates the image memory in response to the adjustments.

AAPM TG18 Preprint DRAFT (version 10.0)
18 August 26, 2004
Most current display devices accept only analog video signals (VESA 2001). For these systems, the display controller performs a digital to analog (D-A) conversion as the memory is scanned. By driving the display device directly from this D-A converter, 2n different voltages can be generated, where n is the number of bits per pixel in the video memory. For color displays, 3 parallel D-A converters for each pixel create the red, green, and blue signals. The number of bits per pixel in the D-A converter physically limits what is available to the display application and determines the maximum number of shades of gray, or colors, that can be provided to the display. The video memory typically has 8 or more bits per pixel. In the case of 8-bit grayscale controllers, up to 256 (0-255) digital values can be generated. When 3 bytes of storage are used for each pixel (true-color RGB), 8 bits can be used for each of the red, green, and blue components of the pixel, resulting in potential for 224 colors. In color displays, 24-bit color controllers are prerequisites for 8-bit gray-scale presentations. Since individual displays respond differently to the same voltages, in order to control the appearance of an image, the display voltages should not be evenly spaced. The control of the display’s light output is dependent on changing the digital values, a feature that is offered (and necessary) in high-quality display controllers manufactured specifically for medical imaging. These controllers, which are typically for monochrome displays, may have 10 or even 12 bit image memories, and have an ability to store a lookup table (LUT) to change the digital driving levels stored in the memory for D-A conversion. By installing the proper LUT in the controller, the grayscale response of the display device can be made to follow a specified standard. These advanced controllers often include integrated luminance probes and calibration software to be used to compute the proper LUT. Consumer grade graphics cards, generally limited to 8-bit memory, are not suitable for most medical display applications in that the LUT process may results in a loss of distinct luminance levels to the display. Typically 20 luminance steps are sacrificed when correcting CRT and LCD monitors to the DICOM GSDF function. The methods used to convert digital driving levels to monitor luminance are changing with new systems. For flat panel devices, the controller sends a digital signal to the display device and the device converts this to the appropriate signals to control luminance. As standards mature, manufacturers of computer displays are pursuing designs that accept direct digital signals from a display controller. The new product offerings provide improved performance at lower cost for several aspects of display performance. However the basic requirement to standardize the relationship between digital driving level and luminance remains the same. 2.1.5 Display Device The final hardware element of a medical imaging display workstation is the display device. The display device is the actual physical unit that generates a visible image from analog (or digital) video signals. In addition to hardware, the display device has internal software to be able to respond to commands by the controller. A workstation can have four or more display devices, but the most common configurations have only one or two. The cathode-ray tube (CRT) is currently the most common type of display device, but newer flat-panel technologies are becoming available. Section 2.3 provides descriptions of display device technologies in detail. 2.1.6 Workstation Application Software The workstation application software program controls the application-level operation of the workstation to display a medical image. A wide variety of programs are available in the market. Basic programs permit images to be sent to the workstation for review by a referring physician or a consulting radiologist. More advanced programs include tools for image manipulation, database access, archive query/retrieve, and support for multiple high-resolution displays. Tools are provided to measure characteristics of the

AAPM TG18 Preprint DRAFT (version 10.0)
19 August 26, 2004
images such as distances, digital values, areas, histograms, and other metrics. A powerful feature of advanced programs is the ability to select (in some cases automatically) relevant images from prior examinations and present them in appropriate relation to more recent data. Often part of larger PACS installations, these advanced programs provide capabilities for logging user access, controlling workflow, load balancing among multiple systems, and setting preferences that can be set for users, groups, and departments. The operation of display workstations in a PACS environment is greatly facilitated by complying with the DICOM standards (see Section 1.2.2). Current standards address data structures, object and service types, communication protocols, grayscale display, print management, and work-list management to name but a few. Work in progress is addressing advanced methods to control the presentation of multiple images and methods to associate interpretive reports with image content. The aspects of the approved DICOM standard that relate to display image quality have been considered in this report (see Section 4.3). 2.2 Photometric Quantities Pertaining Display Devices Two photometric quantities are of great importance in discussion of display performance or specifications: luminance and illuminance. 2.2.1 Luminance Luminance is the photometric term used to describe the rate at which visible light is emitted from a surface, display surface in the case of displays. It refers to the energy of visible light emitted per second from a unit area on the surface into a unit solid angle (Ryer 1998, Keller 1997). The energy of visible light reflects the visibility of light quanta as a function of wavelength through a standard photometric weighting function. The SI unit for the energy of visible light is the lumen-second,1 and therefore, the unit for luminance is 1 lumen per steradian per meter squared, commonly referred to as candela per meter squared (cd/m2).2 An important characteristic of light emitted from a surface is its spatial distribution. When luminous intensity from a surface varies as the cosine of the viewing angle, the appearance of the surface brightness is constant irrespective of the viewing angle. Such surfaces are characterized as having a Lambertian distribution. 2.2.2 Illuminance Illuminance is the photometric term used to describe the rate at which visible light strikes a surface. It is often used to describe the amount of ambient lighting or the light striking a display surface. The unit of illuminance is lumen per meter squared (lm/m2) or lux (lx), a unit identical to luminance except for the absence of the solid-angle dimension. Illuminance and luminance can be related for ideal reflective objects (Lambertian surfaces): an illuminance of 1 lux striking a perfectly reflective white surface will cause the emission of 1/π observed luminance in cd/m2 (Ryer 1998).
1 The lumen (lm) is the psychophysical equivalent of watt, or joule/second of the radiant energy, but weighted with the visibility equivalence function. 2 The unit cd/m2 is sometimes referred to as “nit.” The nit is a deprecated unit and its use is no longer encouraged. Luminance is also sometimes expressed in the traditional units of foot-Lambert (1 fL = 3.426 cd/m2). Foot-Lambert is a non SI unit and thus its use is not encouraged by the AAPM Task Group 18.

AAPM TG18 Preprint DRAFT (version 10.0)
20 August 26, 2004
2.3 Display Device Technologies 2.3.1 Cathode-Ray Tubes The Cathode Ray Tube (CRT) is a common and mature display technology that has undergone numerous evolutionary changes. In 1878 Sir William Crookes, experimenting with variations on the Geisler discharge tube, developed the progenitor of the modern electron gun. But it wasn’t until 1920 that Vladimir Zworykin developed the other components needed for the first camera and picture tubes (respectively called the iconoscope and kinescope). All the basics elements of original CRT devices are still present in modern CRT devices. An understanding of these elements and their interactions is essential to better appreciate the factors affecting image quality and how to best implement softcopy electronic display solutions (Keller 1997, Lippincott 1988). 2.3.1.1 CRT Structure and Principles of Operation The basic components in a monochrome CRT are illustrated in Fig. 3. A stream of electrons is produced by thermionic emission from the cathode, which is operated near ground potential and heated by a filament (F). The electrons are drawn from the cathode and through the control “grid” aperture G1, by a positive potential (~1000 V), on to the first anode or accelerating electrode, G2, typically at about +25 kV. Depending on the design of the electrodes, the beam comes to a focus inside G2 and then diverges. The anode consists of a layer of aluminum which extends back to the position of the deflection yoke. A graphite compound is applied into the neck to make the electrical connection with the gun structure. Three prongs, called snubbers, form the mechanical connection.
(a) (b)
Fig. 3: Two views of the CRT components. Although electromagnetic beam–focus coils around the tube neck are used in some CRT devices, more commonly the beam is brought back to a focus electrostatically at the position of the phosphor screen by the action of the electronic lens system (G3, G4, and G5). Upon impact on the phosphor screen, the focused electron beam produces a light spot of roughly 0.1-0.2 mm in diameter. The light distribution of the spot is commonly characterized by a 2-dimensional Gaussian function. Another important characteristic of this generated light is its Lambertian distribution. As the cross-sectional area of the

AAPM TG18 Preprint DRAFT (version 10.0)
21 August 26, 2004
display’s faceplate also varies with the cosine of the viewing angle, in display devices with Lambertian light emission the apparent luminance of the display does not vary with viewing angle, to a first approximation.
In monochrome CRT displays, the visible image is formed one line at a time as the single narrow electron beam is moved in rectilinear scan fashion across the face of the phosphor screen. Because of the need to deflect the beam through relatively large angles, electromagnetic (as opposed to electrostatic) deflection is normally employed. The horizontal deflection coils in the yoke assembly produce a vertically oriented magnetic field which sweeps the beam from left to right as each line is scanned. A ramp or sawtooth-like current waveform is applied to these coils at the line rate (e.g., 140 kHz for 2000 line-70 frame/sec display operation). In like manner, vertical deflection coils move the beam downward as the frame is painted, then reposition the beam for the start of the next frame. The frame rate (e.g., 70 Hz) determines the frequency of the vertical deflection control voltage. The values of horizontal and vertical control voltage determine the beam location, i.e., the coordinates of the pixel being rendered at any instant. This information is employed in high quality display devices to accomplish a position dependent (dynamic) focus correction, which is necessitated by the longer source-to-screen beam travel distance associated with peripheral vs. central areas of the display. Phosphor materials used in screens are identified by a P-Number system maintained by the U. S. Electronics Industry Association. The type of phosphor (P4, P45, P104, etc.) employed will determine the color displayed on the CRT, and will also influence the luminance capability of a display device, since some phosphors are more efficient than others in converting electron beam energy into visible light. For example, P104 has a higher luminance efficiency than P45, requiring less current for a given output luminance level. Monochrome display devices capable of producing maximum luminance of up to 500 cd/m2 are currently available, with 300 cd/m2 more common. These levels are to be compared to the luminance level of typical radiographic film illuminators, 1,000-2,000 cd/m2, or mammography illuminators, 3000 cd/m2. Use of larger beam current will lead to greater display luminance, but this will tend to enlarge the beam spot size and thus reduce image resolution. Larger beam current and image luminance also reduce the useful life of the display device by hastening the normal fall-off of phosphor efficiency and cathode depletion with time. In addition to luminance efficiency and aging characteristics, various phosphors used in screen construction differ from each other in their persistence or decay times and phosphor noise. The persistence characterizes the rapidity of fall-off of luminescence with time after a given area of the screen is momentarily activated by the electron beam. Use of phosphors with long decay will tend to reduce the perception of flicker (also known as ripple ratio) in the display, but this comes at the expense of a greater image lag or smearing, which might be unacceptable in a display device used for viewing dynamic processes. Use of a higher display frame rate also reduces flicker. Phosphor noise is attributed to its granular structure and is observed as spatial noise. P45 as a single crystal phosphor has considerably less phosphor noise than the other phosphor types. Comparatively, the P4 and P104 phosphors exhibit more phosphor noise due to blending of multiple phosphor components with slightly different color tints. Fig. 4 illustrates the differences in luminance output distribution of a single pixel using P45 and P104 phosphors. Note the distorted edge transition at the FWHM level for P104 caused by phosphor noise. The operation and design of color CRT display devices is similar to that for monochrome CRTs, but color devices contain three electron guns in the neck of the tube, instead of one, for the production of three scanning beams (Spekowius 1999). Each of these beams is made to strike one of three screen phosphor elements in each pixel producing red, green, and blue (i.e., RGB) light. Each beam is modulated by its own video signal, and the relative strength of the three beams determines the perceived color of the pixel being created at a given time during the image rendition process. Color CRTs also contain a shadow mask (or aperture mask) consisting of a thin plate located somewhat in front of and parallel to the phosphor

AAPM TG18 Preprint DRAFT (version 10.0)
22 August 26, 2004
screen. For a color display device capable of displaying 800 pixels per line, the mask will have 800 openings from left to right through which the three beams must pass. These openings are positioned precisely in front of the display pixels so that any part of a color-specific beam that might be directed toward the “wrong” phosphor element will be intercepted or, “shadowed,” by the mask and thus prevented from striking the wrong phosphor. Similar to monochrome CRTs, color CRTs have a graphite type coating inside the tube glass surface, extending into the neck of the tube.
(a) (b) (c) Fig. 4: Pixel profiles in CRTs with P104 (a) and P45 (b) phosphors. The contour lines depict the full-width-at-half-maximum (FWHM) and full-width-at-twentieth-maximum lines (c). The positioning of the three electron guns determines the appearance of the three colors in each pixel. In the dot-triad design, the axes of the three guns are positioned symmetrically around the axis of the tube neck and separated by 120 degrees. The mask contains a matrix of round apertures in front of the pixels. Examination of the screen in this type CRT with a hand microscope demonstrates that each pixel consists of a triad of R, G, and B dots located at the corners of a small triangle. Other designs employ three in-line guns used with a mask that consists of a grille of vertically oriented slit apertures. For this design, each pixel is made of three vertical bars, one for each primary color. Although a mask is important to the operation of the color CRT, its presence contributes to increased veiling glare due to electrons which scatter off of the mask and eventually strike the screen in unintended areas. This effect becomes more pronounced as the number of pixels per line is increased, which tends to limit the maximum pixel matrix sizes for color display devices. It is also more pronounced in shadow masks than in aperture grills. The mask-initiated veiling glare in color CRTs is one of the major quality issues in using color CRTs for viewing monochromatic medical images. In principle, workstation-level CRT display devices are similar to commercial televisions, but there are important performance differences. A TV displays one frame consisting of 480 active horizontal lines (in the form of two interlaced fields of 240 lines each) every 1/30 of a second (i.e., one frame every 1/60 of a second). By contrast, displays employed for diagnostic imaging may address as many as 2000 horizontal lines on the screen in non-interlaced (i.e., progressive) mode, and the image refresh rate may exceed 70 images per second. In commercial television, each line is painted during a period of about 53 microseconds, and modulation of beam intensity sufficient to represent all needed image details as luminance variations must take place in that time period. In a high line rate medical imaging display, time per scan line can be as low as five microseconds, necessitating much faster modulation of the electron beam current and a much higher bandwidth requirement.
P104 Phosphor P45 Phosphor

AAPM TG18 Preprint DRAFT (version 10.0)
23 August 26, 2004
2.3.1.2 Video Signal, Brightness, and Contrast In CRTs, the intensity of the electron beam, and hence the luminance produced at points on the screen, is controlled by varying the voltage differential between the cathode (K) and the control aperture (G1) which is sometimes referred to as the control grid due to the analogy with older vacuum tube designs. A more positive voltage applied to G1 allows greater beam current, whereas a sufficiently negative potential on G1 will cut off the beam, as needed during horizontal and vertical retrace. Alternatively, and more commonly, G1 may be set to a fixed value while K would be driven between different positive potential values. The beam control voltage applied to K-G1 typically consists of two components, as suggested in Fig. 3, which are adjusted by the “Contrast” and “Brightness” controls of the CRT. The first of these is the output of circuit C, namely an amplified video signal, which is related to the numerical intensity value of the pixel being displayed. The effect of increasing the amplification of C - i.e., increasing the “Contrast” control - is shown in Fig. 5; luminance differences between various areas of the image are enhanced. The second component of K-G1 control voltage is a bias applied by the bias circuit, B. By making this bias more positive (or less negative) via the “Brightness” control of the CRT, all areas of an image are given an equal upward shift in luminance without a change in contrast. Brightness control is usually used to set the black level (i.e., cut-off threshold), while the Contrast control adjusts the dynamic range. Although Brightness and Contrast controls are ideally independent of one another (i.e., a change in one control should not affect the other parameter), these controls are often correlated, and iterative “tweaking” of both of these controls is necessary to attain a desired maximum and minimum luminance.
Fig. 5: Effect of Contrast and Brightness control adjustment on image. Control grid-to-cathode voltage (which determines beam intensity and image luminance) and time (i.e., horizontal position of beam) are represented along vertical and horizontal axes, respectively. 2.3.1.3 Pixel Characteristics and Resolution As described above, CRT image pixels are generated on a phosphor screen by a scanning electron beam which “writes” the pixels on the phosphor screen in a precisely-controlled continuous manner. Since the electron beam cannot be moved in discrete steps and the sweep movement is not completely stable, as indicated by the schematic of the video signal in Fig. 6, the resulting spot size is not distinct and does not correspond to exactly one nominal pixel size. The CRT pixels usually have a pseudo-Gaussian profile that extends beyond the nominal pixel size. In contrast, in flat-panel displays such as liquid crystal displays, a
Input Signal
Lum
inan
ce
Increased Contrast
Decreased Contrast
Increased Brightness
Decreased Brightness

AAPM TG18 Preprint DRAFT (version 10.0)
24 August 26, 2004
matrix of discrete pixels are used to display the image. Thus, the nominal area of the display that is used in addressing a single pixel, is reliably reproduced in image representation provided the flat panel is operated in its “native resolution.” In reality, in an active-matrix LCD (AMLCD) the actual pixel size is smaller than the nominal size due to the finite size of the electronic elements controlling each pixel. The ratio of active pixel area to the nominal area is known as the “aperture ratio” (so-called “fill factor” in flat-panel detector terminology). The more complex resolution characteristics in a CRT compared with an LCD warrants a more detailed discussion of image/pixel formation in medical CRTs.
Fig. 6: Schematic illustrating (1) the video signal as output of an ideal digital-to-analog- converter (DAC) of the display controller, (2) the horizontal and vertical synchronization signals necessary to “write” the raster which carries the video signal, (3) the sawtooth waveform for the deflection circuits and (4) the raster scan. Note that the video signal consists of discrete steps corresponding to the different digital input values. The inability to reproduce these as described above is the basis for the non-discrete nature of resolution metrics with CRTs. The video signal is generated by the CRT’s interface to the computer, the display controller. It converts digital data into analog “display signals,” and coordinates the display of the data. The scanning of the electron beam and its intensity modulation is achieved with the aid of synchronization pulses. There are usually three signal lines connecting the display controller to the CRT: the video signal, the horizontal sync signal, and the vertical sync signal. Characteristic features of these three signals are shown schematically in Fig. 6 together with the actual waveforms (saw-tooth) of the circuits providing the beam deflection. The video signal is applied to the display device's beam modulation circuits within the timing framework created by the sync pulses. The video signal is shown for two adjacent video lines (line N and line N + 1), separated by the horizontal blanking interval. During the blanking interval, the electron beam is turned

AAPM TG18 Preprint DRAFT (version 10.0)
25 August 26, 2004
off in order to move it from the end of line N to the beginning of line N + 1 without writing a visible trace on the CRT screen. Such a blanking interval is also necessary at the end of a video frame in order for the electron beam to return from the end of frame M to the beginning of frame M + 1. The typical time for a horizontal retrace is in the order of 0.33 µs, the time between two video lines is 1.3 µs, and the blanking time for a vertical retrace is about 5.4 µs. For proper frame synchronization, a time interval of about 330 µs is inserted between the beginning of the vertical retrace and the start of the first video line. The video signal consists ideally of discrete steps, which are the analog signals created by the display controller’s DACs. The time duration of a step depends on the total number of pixels and the speed with which the image is “written.” The sync signals are voltage pulses at TTL level (Transistor-Transistor Logic level, where “on”-levels are between 3.5V and 5V and “off”-levels are between 0V and 0.05V) and affect only the timing of the raster-scan process (Horowitz 1980). Self-oscillating circuits within the display device will, in fact, deflect the CRT electron beam to form a raster like pattern on the phosphor screen, whether or not sync information is being received. The smallest detail that a CRT can display is determined by a number of factors as shown in the schematics of Fig. 7 and Fig. 8. They include the following:
1. The response function Hvideo (f) of the display controller and CRT video circuits, i.e., the waveform of the incoming video signal as determined by rise- and fall- times of the display controller as well as by the rise and fall times of the CRT’s video amplifier, defining how fast the electron beam intensity can follow the voltage of the video signal while the beam moves across a pixel. The rise/fall time is defined as the time it takes for the video voltage to change from 10% (“almost black”) to 90% (“almost white”) or vice versa.
2. The non-linearity of the relation between luminance and video signal voltage. 3. The motion of the electron beam as affected by the beam deflection circuits; the deflection unit
performs the transformation of the temporal input signal into the spatial domain. 4. The response function Hspot(f) of the beam spot size formed by the electron optics on the
phosphor screen, which is affected by the magnitude of the beam current as well as by the phosphor layer thickness and scatter effects within it.
Fig. 9 illustrates the effects of these components on a simulated spot profile in horizontal direction for a nominal pixel width of 2 ns. We start with an ideal stationary spot profile (Spot Fixed, response function Hspot(f)). Due to the scanning motion of the electron beam, the spot is broadened while the integral under spot curve remains equal to that of the stationary spot. This would be the spot size and profile if the electronics were infinitely fast. Finally, the moving spot profile is convolved with the amplifier response function, Hvideo(f), having a rise- and fall-time of 1.4 ns. The resultant spot profile extends over more than three nominal pixel widths. Due to bandwidth limitations, the peak luminance does not reach the equilibrium value. Insufficient bandwidth is the main reason for failure of the peak luminance to reach the equilibrium value when only a single pixel is addressed. Equilibrium luminance can be reached for a single pixel only, when the rise time, τrise, and the fall time, τfall, are small compared to the pixel time, τpix (sometimes incorrectly called dwell time), or τrise + τfall << τpix. The electronic bandwidth, ∆f, is inversely related to the rise and fall times as ∆f = 1/(4τrise), assuming that rise and fall time are practically equal.

AAPM TG18 Preprint DRAFT (version 10.0)
26 August 26, 2004
White Level
Black Level
90 %
10 %
ττττ pix ττττ rise ττττ fall
Pixel on Pixel off Pixel on
Fig. 7: Schematic illustrating the relation between a video-amplifier’s rise- and fall- times. .
H video (f) H spot (f)
Spot Profile
L= aV γ ∆ x= v def ∆τ pix
ττττ pix ττττ rise ττττ fall
(a) (b) (c) (d)
Fig 8: Model of a CRT display device, illustrating components affecting its spatial resolution: (a) response function of video circuits of display controller and CRT display device, (b) the non-linear relationship between the luminance and the input voltage, (c) the scanning speed of the deflection unit and (d) the finite size and shape of the focal spot.
2 4 6 8 10 12 TIME (ns)
0
20
40
60
80
100
SPOT FIXED
SPOT BROADENED DUE TO MOTION
SPOT BROADENED DUE TO LIMITED ELECTRONICS BANDWIDTH
AM
PLIT
UD
E (r
elat
ive
units
)
Fig. 9: Schematic illustrating width of a single pixel as given by a Gaussian spot, which moves during the “video-on time” for a single pixel (approx. 2 ns) and which is convolved with the time response function of the electronics (rise time and fall time of about 1.4 ns each).
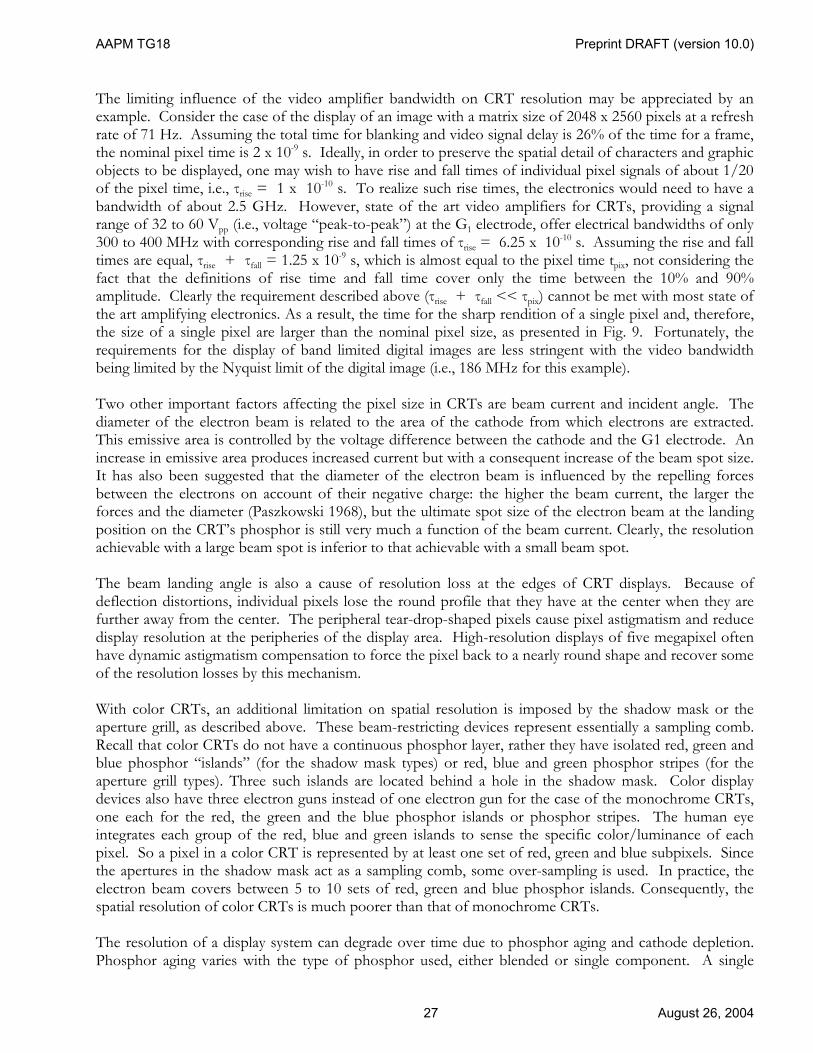
AAPM TG18 Preprint DRAFT (version 10.0)
27 August 26, 2004
The limiting influence of the video amplifier bandwidth on CRT resolution may be appreciated by an example. Consider the case of the display of an image with a matrix size of 2048 x 2560 pixels at a refresh rate of 71 Hz. Assuming the total time for blanking and video signal delay is 26% of the time for a frame, the nominal pixel time is 2 x 10⁻⁹ s. Ideally, in order to preserve the spatial detail of characters and graphic objects to be displayed, one may wish to have rise and fall times of individual pixel signals of about 1/20 of the pixel time, i.e., τrise = 1 x 10⁻¹⁰ s. To realize such rise times, the electronics would need to have a bandwidth of about 2.5 GHz. However, state of the art video amplifiers for CRTs, providing a signal range of 32 to 60 Vpp (i.e., voltage “peak-to-peak”) at the G1 electrode, offer electrical bandwidths of only 300 to 400 MHz with corresponding rise and fall times of τrise = 6.25 x 10⁻¹⁰ s. Assuming the rise and fall times are equal, τrise + τfall = 1.25 x 10⁻⁹ s, which is almost equal to the pixel time tpix, not considering the fact that the definitions of rise time and fall time cover only the time between the 10% and 90% amplitude. Clearly the requirement described above (τrise + τfall << τpix) cannot be met with most state of the art amplifying electronics. As a result, the time for the sharp rendition of a single pixel and, therefore, the size of a single pixel are larger than the nominal pixel size, as presented in Fig. 9. Fortunately, the requirements for the display of band limited digital images are less stringent with the video bandwidth being limited by the Nyquist limit of the digital image (i.e., 186 MHz for this example). Two other important factors affecting the pixel size in CRTs are beam current and incident angle. The diameter of the electron beam is related to the area of the cathode from which electrons are extracted. This emissive area is controlled by the voltage difference between the cathode and the G1 electrode. An increase in emissive area produces increased current but with a consequent increase of the beam spot size. It has also been suggested that the diameter of the electron beam is influenced by the repelling forces between the electrons on account of their negative charge: the higher the beam current, the larger the forces and the diameter (Paszkowski 1968), but the ultimate spot size of the electron beam at the landing position on the CRT’s phosphor is still very much a function of the beam current. Clearly, the resolution achievable with a large beam spot is inferior to that achievable with a small beam spot. The beam landing angle is also a cause of resolution loss at the edges of CRT displays. Because of deflection distortions, individual pixels lose the round profile that they have at the center when they are further away from the center. The peripheral tear-drop-shaped pixels cause pixel astigmatism and reduce display resolution at the peripheries of the display area. High-resolution displays of five megapixel often have dynamic astigmatism compensation to force the pixel back to a nearly round shape and recover some of the resolution losses by this mechanism. With color CRTs, an additional limitation on spatial resolution is imposed by the shadow mask or the aperture grill, as described above. These beam-restricting devices represent essentially a sampling comb. Recall that color CRTs do not have a continuous phosphor layer, rather they have isolated red, green and blue phosphor “islands” (for the shadow mask types) or red, blue and green phosphor stripes (for the aperture grill types). Three such islands are located behind a hole in the shadow mask. Color display devices also have three electron guns instead of one electron gun for the case of the monochrome CRTs, one each for the red, the green and the blue phosphor islands or phosphor stripes. The human eye integrates each group of the red, blue and green islands to sense the specific color/luminance of each pixel. So a pixel in a color CRT is represented by at least one set of red, green and blue subpixels. Since the apertures in the shadow mask act as a sampling comb, some over-sampling is used. In practice, the electron beam covers between 5 to 10 sets of red, green and blue phosphor islands. Consequently, the spatial resolution of color CRTs is much poorer than that of monochrome CRTs. The resolution of a display system can degrade over time due to phosphor aging and cathode depletion. Phosphor aging varies with the type of phosphor used, either blended or single component. A single

AAPM TG18 Preprint DRAFT (version 10.0)
28 August 26, 2004
component P45 phosphor ages less rapidly and exhibits less of a color shift over time. Blended phosphors, such as P104, are generally more efficient than P45, but age considerably faster. This loss of efficacy requires additional beam current to maintain the luminance. This in turn requires higher drive levels to the cathode and a larger electron beam current. The net result is a gradual increase in the electron spot size over time and degradation in the display resolution. Likewise, the loss of efficacy of the cathode over time due to the depletion of cathode material requires added drive to achieve as new luminance. Tests are necessary to monitor and assure consistent display performance over time. 2.3.2 Emerging Display Technologies Most of the electronic devices used to display medical images are currently CRTs. However, it is expected that new display technologies will gradually replace the heavy and bulky CRT with a thin, light-weight display device with potentially better image quality, lower power consumption, better durability, and reduced cost. The flat-panel Active Matrix Liquid Crystal Displays (AMLCDs) have started to find their way into the medical marketplace. In addition there are a number of other new technologies that have potential in medical imaging. They include organic light emitting displays, micro-mirror displays, plasma displays, electronic projection displays, and head-mounted displays. These display devices currently do not meet the resolution, contrast, and display size requirements of medical diagnostic displays, even though they might prove useful for some limited medical imaging applications. However, with the current rapid progress in display technologies, they might be able to meet the specific requirement of diagnostic medical applications in the future. There are a multitude of technologies that are being developed for different applications (see Fig. 10). This subsection focuses on those display technologies that have demonstrated potential to achieve high display quality for medical imaging applications and for which extensive research and development efforts are underway. This subsection also summarizes the basic elements of three technologies: the active-matrix liquid crystal display (AMLCDs), the field-emitter display (FED), and the organic light-emitting display (OLED). Liquid crystal displays with high brightness and large pixel array sizes are now available for use in radiology workstations and have become serious candidates to replace CRTs. The FED technology is based on the luminescence of phosphors generated by electron bombardment. Although claiming rapid development into products, this vacuum technology has not achieved the display quality that was predicted in the mid-nineties. Finally, we will review the current state of development of active-matrix OLEDs. These devices are being developed for a variety of applications and have the potential for excellent image quality. An LCD may be classified as a “transmissive” display device, as its pixel array alter the transmission of a backlight to the faceplate, while FEDs and OLEDs may be classified as emissive flat panel displays, as their pixel elements themselves emit light. In this subsection, the fundamentals of these technologies are presented, and current engineering challenges are outlined.

AAPM TG18 Preprint DRAFT (version 10.0)
29 August 26, 2004
SHADOW MASK
APERTURE GRILLE
COLOR
MONOCHROME
CRT
FIELD EMITTER
VACUUM FLUORESCENT
THIN CRT
ORGANIC
INORGANIC
LIGHT-EMITTING DIODES
ELECTROLUMINESCENT
PLASMA
LIGHT-EMITTING
TWISTED NEMATIC
S-TWISTED NEMATIC
FERROELECTRIC
PASSIVE-MATRIX
PLASMA ADDRESSED
THIN FILM TRANSISTOR
MIM
OTHERS
ACTIVE-MATRIX
LIQUID CRYSTAL
LIGHT-MODULATING
FLAT PANEL
DIRECT-VIEW
HOLOGRAMS
HEADS-UP
OFF-SCREEN
CRT
LIGHT-VALVE
MICRO MIRRORS
PROJECTION
ELECTRONIC DISPLAY DEVICES
Fig. 10: A classification of electronic display devices. Note that displays that are not direct-view CRTs can also be monochrome or color, but the difference does not create a dichotomy in the design of these displays as it does with the direct-view CRTs. This is why color is not listed as an attribute of displays other than direct-view CRTs. 2.3.2.1 Liquid Crystal Displays Liquid crystal displays rely on the fundamental electro-optical characteristics of liquid crystals (LCs) to form an image. When the molecular orientation within a LC is altered by the application of an external electric field, the optical characteristics of the material changes. This electro-optical effect is used in LCDs to modulate light transmission. An LCD is composed of a large array of LC cells (each representing a pixel of the image), polarizer filters, and a backlight. The height and volume of the LC cells are controlled by spacers (see Fig. 11). Light is generated by the backlight and directed to the front through a first polarizing filter, the LC cell, and an exit polarizing filter. The amount of the transmitted light intensity is primarily controlled by the change in polarization induced by the voltage applied to the LC cell in relation to the polarization orientation of the first and second polarizer. The maximum amount of transmitted light (i.e., the maximum luminance of the display) is determined by the intensity of the back-light, the nature of the polarizers, the transmission of the LC cell in its full ON state, the transmission characteristics of additional color filters (for color displays), and the aperture ratio (the fraction of the pixel area that is transparent). The minimum luminance of the display is primarily determined by the opaqueness of the LC cell in its full OFF state. In an AMLCD, the switch between ON and OFF states is controlled through voltage changes produced by a thin-film transistor (TFT) array.

AAPM TG18 Preprint DRAFT (version 10.0)
30 August 26, 2004
Displays can be characterized as being normally white or normally black depending upon the relation of the pair of polarizers relative to the intrinsic ‘twist’ in the LC material. For example, if a pair of crossed polarizers are used, with LC material having no intrinsic ‘twist,’ all light is linearly polarized after passing through the first of the polarizing filters. When no voltage is applied, all light will be fully blocked by striking the second (crossed) polarizer, and this display is characterized as normally black. Alternatively, the pair of polarizers may be co-linear, so that light that passes through the first polarizer is transmitted through the second polarizer in the absence of voltages. This display is characterized as normally white. It is somewhat more straightforward for normally white displays to provide a higher maximum luminance Lmax, since the ‘twist’ is not needed to achieve the maximum luminance. However, for a normally white display it is difficult to achieve a low Lmin value, since the opaqueness of the display depends upon the efficiency of the LC material in providing the ‘twist.’
Polarizer
Polarizer
Faceplate
Color filtersElectrode
ElectrodeCapacitor
Glass substrate
Diffuser
Reflector
Alignment layer
Alignment layer
Edge light
SpacerTFT
Black matrix
Liquid crystal
Sealant
Fig. 11: Typical cross-section of an AMLCD. A unique aspect of LCD devices is that the light emission is non-Lambertian. This is due to two major reasons: the optical anisotropy of the LC cell which depends upon the manufacturing design and the applied voltage, and secondly, due to the effect of polarized light being transmitted and viewed in a direction co-linear with the polarizing filter (termed a sine-squared effect since it varies as sin2θ, where θ is the viewing angle). These two effects result in a potentially severe angular dependence of the luminance. The angular dependency affects the contrast as well as luminance of the presented image as a function of the viewing angle. More advanced LCD designs have aimed to minimize this angular dependence by (1) varying molecular alignments in sub-regions (“domains”) within individual pixels (Nam 1997), (2) modifying the orientation of the liquid crystal molecules to remain in the plane of the display (in-plane switching) (Wakemoto 1997), or (3) adding a negative birefringence plate to compensate for the optical anisotropy (Hoke 1997). It is common for methods one and two to also include method three. Using hydrogenated amorphous silicon (a-Si:H) thin-film transistor technology, AMLCDs have achieved the very high information content and color pixel resolution. To date, monochrome 2560 x 2048 (5 magapixels) workstation quality and color 3840 x 2400 (9.22 magapixels) AMLCDs have recently been introduced commercially.
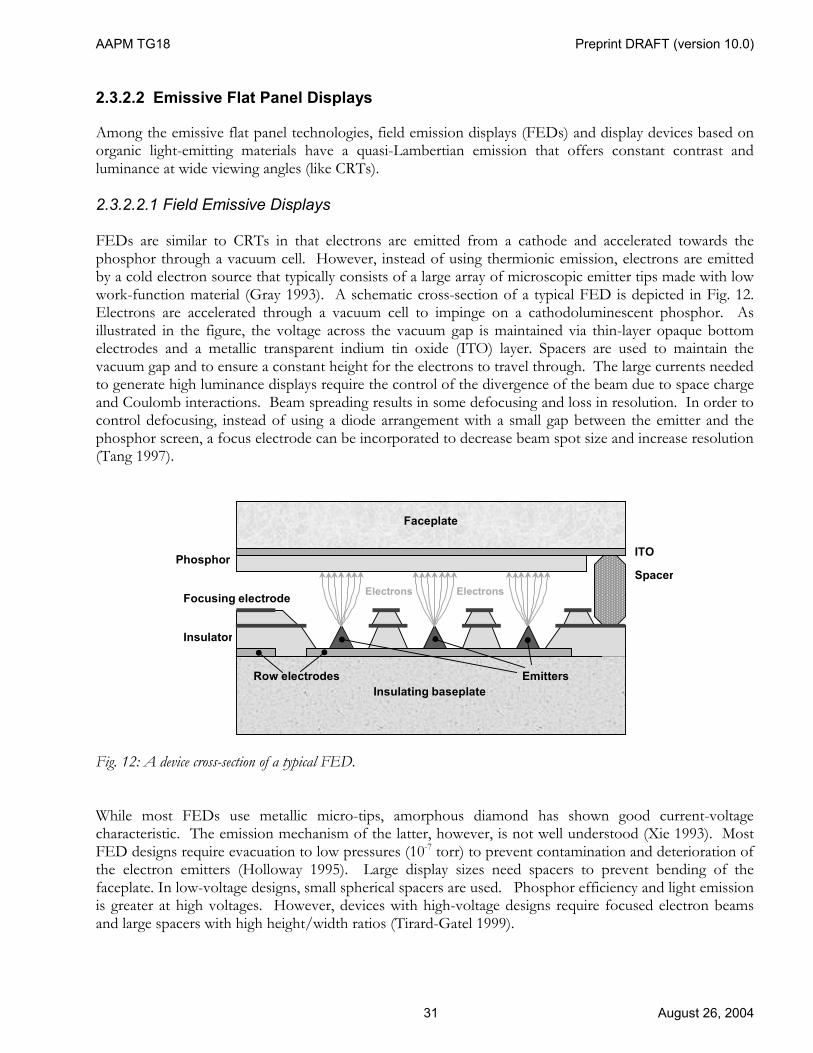
AAPM TG18 Preprint DRAFT (version 10.0)
31 August 26, 2004
2.3.2.2 Emissive Flat Panel Displays
Among the emissive flat panel technologies, field emission displays (FEDs) and display devices based on organic light-emitting materials have a quasi-Lambertian emission that offers constant contrast and luminance at wide viewing angles (like CRTs). 2.3.2.2.1 Field Emissive Displays FEDs are similar to CRTs in that electrons are emitted from a cathode and accelerated towards the phosphor through a vacuum cell. However, instead of using thermionic emission, electrons are emitted by a cold electron source that typically consists of a large array of microscopic emitter tips made with low work-function material (Gray 1993). A schematic cross-section of a typical FED is depicted in Fig. 12. Electrons are accelerated through a vacuum cell to impinge on a cathodoluminescent phosphor. As illustrated in the figure, the voltage across the vacuum gap is maintained via thin-layer opaque bottom electrodes and a metallic transparent indium tin oxide (ITO) layer. Spacers are used to maintain the vacuum gap and to ensure a constant height for the electrons to travel through. The large currents needed to generate high luminance displays require the control of the divergence of the beam due to space charge and Coulomb interactions. Beam spreading results in some defocusing and loss in resolution. In order to control defocusing, instead of using a diode arrangement with a small gap between the emitter and the phosphor screen, a focus electrode can be incorporated to decrease beam spot size and increase resolution (Tang 1997).
Faceplate
ITOPhosphor
Insulating baseplate
Spacer
Insulator
Row electrodes Emitters
Electrons ElectronsFocusing electrode
Fig. 12: A device cross-section of a typical FED. While most FEDs use metallic micro-tips, amorphous diamond has shown good current-voltage characteristic. The emission mechanism of the latter, however, is not well understood (Xie 1993). Most FED designs require evacuation to low pressures (10-7 torr) to prevent contamination and deterioration of the electron emitters (Holloway 1995). Large display sizes need spacers to prevent bending of the faceplate. In low-voltage designs, small spherical spacers are used. Phosphor efficiency and light emission is greater at high voltages. However, devices with high-voltage designs require focused electron beams and large spacers with high height/width ratios (Tirard-Gatel 1999).
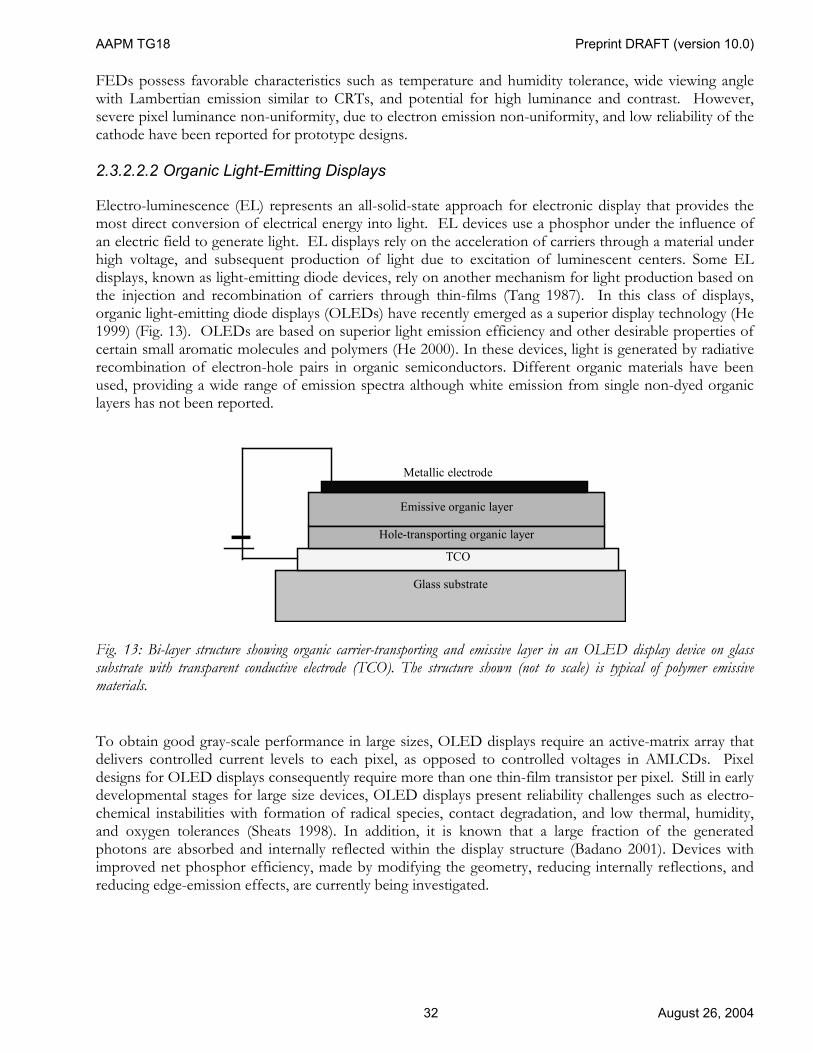
AAPM TG18 Preprint DRAFT (version 10.0)
32 August 26, 2004
FEDs possess favorable characteristics such as temperature and humidity tolerance, wide viewing angle with Lambertian emission similar to CRTs, and potential for high luminance and contrast. However, severe pixel luminance non-uniformity, due to electron emission non-uniformity, and low reliability of the cathode have been reported for prototype designs. 2.3.2.2.2 Organic Light-Emitting Displays Electro-luminescence (EL) represents an all-solid-state approach for electronic display that provides the most direct conversion of electrical energy into light. EL devices use a phosphor under the influence of an electric field to generate light. EL displays rely on the acceleration of carriers through a material under high voltage, and subsequent production of light due to excitation of luminescent centers. Some EL displays, known as light-emitting diode devices, rely on another mechanism for light production based on the injection and recombination of carriers through thin-films (Tang 1987). In this class of displays, organic light-emitting diode displays (OLEDs) have recently emerged as a superior display technology (He 1999) (Fig. 13). OLEDs are based on superior light emission efficiency and other desirable properties of certain small aromatic molecules and polymers (He 2000). In these devices, light is generated by radiative recombination of electron-hole pairs in organic semiconductors. Different organic materials have been used, providing a wide range of emission spectra although white emission from single non-dyed organic layers has not been reported.
Emissive organic layer
Glass substrate
TCO
Hole-transporting organic layer
Metallic electrode
Fig. 13: Bi-layer structure showing organic carrier-transporting and emissive layer in an OLED display device on glass substrate with transparent conductive electrode (TCO). The structure shown (not to scale) is typical of polymer emissive materials. To obtain good gray-scale performance in large sizes, OLED displays require an active-matrix array that delivers controlled current levels to each pixel, as opposed to controlled voltages in AMLCDs. Pixel designs for OLED displays consequently require more than one thin-film transistor per pixel. Still in early developmental stages for large size devices, OLED displays present reliability challenges such as electro-chemical instabilities with formation of radical species, contact degradation, and low thermal, humidity, and oxygen tolerances (Sheats 1998). In addition, it is known that a large fraction of the generated photons are absorbed and internally reflected within the display structure (Badano 2001). Devices with improved net phosphor efficiency, made by modifying the geometry, reducing internally reflections, and reducing edge-emission effects, are currently being investigated.

AAPM TG18 Preprint DRAFT (version 10.0)
33 August 26, 2004
2.4 Engineering Specifications for Display Devices Display specifications are critical to the ultimate quality of the images displayed by the device. Some of the important engineering specifications of display devices are described below, and tabulated in Table 1. When acquiring a display system, the user should carefully evaluate the specifications of the device to assure that the display characteristics meet or exceed the needs of the desired function. The following specifications apply mostly to monochrome displays, unless otherwise noted. Table 1: Examples of typical medical display specifications. Important note: The listed specifications are not intended to be used as guidelines or acceptance criteria. They are only examples to show what is commonly available and in use at the time of this writing. The actual performance requirements and procedures for medical displays are provided later in Sections 4, 5, and 6.
Specification Line Item Secondary/Office
1/2 Megapixel Primary/Secondary
1/2 Megapixel Primary
3/4 Megapixel Primary
5 Megapixel CommentsMatrix size (Pixel Format) 1024x1280) 1200x1600 1728x2304 2048x2560 1 Active Pixel size, mm 0.28-0.3 0.28-0.3 0.17-0.23 0.15 Luminance Ratios ~50-100 ~100-250 250 250 2 Luminance Non-uniformity <30% <30% <25% <25% 3 Anti-Reflection Treatments Optional Recommended Recommended Recommended 4
Miscellaneous (see comments) (see comments) (see comments) (see comments) 5 For CRTs: Amplifier Bandwidth @ volts p-p 160-200MHz @ 45v 160-200MHz @ 45v 250-290MHz @ 45v >330MHz @ 50v 6 Phosphor Type P104 P104 or P45 P45 P45 7 Maximum Luminance, cd/m2 100 100-300 200-300 200-300 8 RAR @ Specified Pixel Format 0.9 to 1.1 0.9 to 1.1 0.9 to 1.1 0.9 to 1.1 9 Pixel Size at 5% point <3.5:1 ratio to 50% <3.0:1 ratio to 50% <2.5:1 ratio to 50% ~2:1 ratio to 50% 10 For LCDs: Maximum Luminance, cd/m2 150 150 700 700 Viewing angle (40:1 lum. ratio) Per Model > 80o hor, 50o ver > 80o hor, 50o ver > 80o hor, 50o ver 11 Defective Pixels <30 <10 <10 <10 1 This represents the addressable pixels the unit will accept, not what it will resolve. (L) = Landscape / (P) = Portrait 2 This represents the end points (factory settings) of black level and peak white, i.e., DAC values of zero and 255. 3 Glass Formula & Bulb Type Dependent. Compensation for uniformity that uses video amplifier compensation decreases the resolution from center to
the edge. 4 Anti-reflective coatings reduce Specular Reflectance and Veiling Glare in CRTs. It is strongly recommended for all medical displays. Most effective
method is multi-layer coating. 5 Miscellaneous specifications might include Non-Linearity of Image (≤ 10%, 0.05 mm maximum), Raster Stability (Jitter/Swim), High Voltage Regulation
(0.5% Max Size Change), Operating Range Temperature (0 to +40 C), Operating Range Humidity (10 to 90% non-condensing), Storage Range Temperature (-40 to +65 C), and Storage Range Humidity (5 to 95% non-condensing).
6 Alternate term is 3db point @ volts p-p. Bandwidth should match pixel format requirements in 1k line displays of fixed frequency. Multi-sync should favor the higher end of the range. Higher Bandwidth within range noted yields better resolution.
7 P45 provides long-term stability and low spatial noise compared to other phosphors. 8 Specified at a specific pixel format or multiple formats for multi-frequency displays. 9 RAR=Resolution-Addressability-Ratio. Measured Pixel @ 50% point of luminance at peak or nominal rating expressed as a percentage of addressable
space available. Medical displays are recommended to have 0.9 to 1.1 RAR values (Muka 1997). 10 Values are expressed in terms of the diameter of the pixel profile at 5% luminance intensity relative to that at 50% intensity (described by RAR above). 11 Note that within the specified viewing angle, there can still be significant changes in luminance and contrast.

AAPM TG18 Preprint DRAFT (version 10.0)
34 August 26, 2004
2.4.1 Physical Dimensions Physical dimensions refer to the height, width, depth and weight of the display device. These characteristics need to be known for proper space planning and installation. 2.4.2 Power Supply Power supply requirements of a display device specify the maximum power consumption in watts, as well as the voltage, and power frequency range of the input. Power requirements are specified for global operation in either a continuous range (85-264 VAC) or two separate subsets. Wattage is commonly expressed as maximum power at a specific horizontal line (raster) frequency. The amount of heat generated by the display is a direct function of the system’s power usage. An excessive rise in the ambient temperature may result in the display shutting down in some situations. Due to improved efficiency and heat management, a switching power supply is preferable to a continuous (linear) power supply. The VESA display power management standards specify logic states, controlled via the sync signals, to put the display in standby or suspend mode. Suspend mode drops the power consumption to as low as 5 watts, saves energy and reduces heat generation but also requires the display to go through a warm-up cycle when restarted. 2.4.3 Input and Output Signals Display systems (including controllers) have particular specifications for their input and output connections. They include the video connector type (usually BNC or VGA), voltage, and termination impedance (usually 50 Ω or 75 Ω). The industry standard terminations are 75 Ω and 50 Ω, which are applicable to either BNC connectors or 15 pin high-density VGA connectors for 1k line displays. Displays with high pixel densities above two megapixels usually use single or double-shielded cables with BNC connectors. The impedance of system components should be matched. A mismatched impedance termination and/or inferior quality video cable can cause video artifacts such as ringing (ghost images). This is especially true in high-resolution 2k displays. Video artifacts in 1k displays are less pronounced because of the lower resolution and the use of slower video amplifiers. Digital input signal capabilities, such as those provided by Digital Video Interface (DVI) (VESA 2000), have promising advantages over analog modes and are becoming available for newer display devices, including flat panel displays. 2.4.4 Bandwidth (CRT) Bandwidth of a display device specifies its video amplifier’s performance over a frequency range. Bandwidth is the frequency range over which the peak to peak (p-p) volts output (dynamic range) of the amplifier can be sustained. It is usually specified at the 3 dB down point, the industry standard measure of amplifier roll off characteristics. In CRTs video bandwidth is a critical specification that defines the ability to resolve CRT pixels in the horizontal direction. The size of the pixel, the pixel profile, and the extent of pixel overlap in the horizontal direction are controlled by the video amplifier. (Vertical image fidelity is controlled by the electron optics and line spacing.) Larger matrix size displays require higher bandwidths to deliver the desired pixel densities. In general, the bandwidth of the video amplifier has to be larger than half the pixel rate (Mertelmeier 1996). For color displays, the same video amplifier is used for each individual video channel (i.e., R, G, B). The bandwidth needs to support the maximum pixel array of the display.

AAPM TG18 Preprint DRAFT (version 10.0)
35 August 26, 2004
2.4.5 Environmental Specifications Environmental specifications include the temperature, humidity, vibration, and shock ranges for operation or storage of the display unit. Typical operating range is 10-40oC temperature and 10-90% relative humidity (non-condensing). Vibration and shock ranges vary among different systems. 2.4.6 Matrix Size Matrix size or pixel array specifies the number of addressable pixels in the horizontal and vertical directions of the display provided by the video graphics controller that can be accepted by the display device. Current medical display devices are able to provide matrix sizes up to 2048x2560, referred to as 2k or five megapixel displays. Displays with one-fourth of that number of pixels, referred to as 1k displays, are less costly and more common. Matrix size, combined with the active display area, specifies the display device’s nominal pixel size. It should be noted that contrary to commonly held beliefs, nominal pixel size is not the only factor defining the display resolution. The display resolution is a function of the actual size and luminance profile of the pixels displaying the image. In CRTs, the nominal and actual sizes of the pixels can be notably different because of the spatial spread of the pixels, as described in Section 2.3.1.3. 2.4.7 Display Area Display area specifies the physical size of the active image display area. Traditionally, the display area of a display device is measured as the diagonal length of the active display area. By convention, for CRT displays, the diagonal measure is specified by the glass manufacturer as the outside dimension of the faceplate. The useful display area is less than the specified dimension. For instance, a quoted 17” display device may only have 15” active display area. In flat-panel displays, there is no difference between the specified and actual display areas. Since modern display devices come in various sizes and aspect ratios, it is now more common to specify the horizontal width and vertical height of the display area along with the diagonal dimension. 2.4.8 Phosphor Type (CRT) The phosphor type is an important specification for phosphor-based display devices such as CRTs. It determines not only the maximum output luminance of the display, but also its spatial noise, output color tone (hue), and aging characteristics (see also Section 2.3.1.1). The common types of display phosphors for monochrome displays are P45, P4, and P104. P45 is a single crystal phosphor with a blue tint, while P104 and P4 are blended phosphors with blue and greenish-yellow components producing a combined color close to white. Note that there are multiple kinds of P45 phosphors which have slightly different luminance and hue characteristics. P104 and P4 phosphors are more efficient than P45 in converting the electron energy to light, and thus require less electron bombardment for a given luminance. However, they age more rapidly both in terms of loss of luminance and color shift over time caused by different aging characteristics of the two phosphor components. The multi-component nature of these phosphors also generates a fixed spatial noise pattern in the displayed images that can be recognized on close examination of the image with a magnifier. In comparison, P45 is more stable at high beam currents, shows less color shift with aging, exhibits slower efficacy loss from aging, and does not exhibit the spatial noise associated with blended phosphors. Presently, P4, P104 and P45 CRTs have all been successfully used in high-resolution diagnostic medical imaging applications. However P45 is the preferred phosphor for primary class CRTs.

AAPM TG18 Preprint DRAFT (version 10.0)
36 August 26, 2004
2.4.9 Refresh Rate The refresh rate specifies the frequency at which the display frame is being updated. Usually it is given by the frequencies of the vertical and horizontal scans. The vertical scan frequency is often quoted as refresh or frame rate, which is usually between 55 Hz and 150 Hz. A refresh rate that is too low will generate a flickering effect detectable by the eyes that may result in lower user performance and fatigue. A minimum refresh rate of 70 Hz is recommended for primary class CRTs. In a CRT, the appearance of flicker is reduced with the use of phosphors having longer decay times (longer persistence). Flat panel displays such as LCDs exhibit persistence (e.g, in LCDs, switching speed from one polarization state to another) that is longer than that of CRTs. Consequently, flat-panel devices exhibit fewer flickers, thereby allowing refresh rates as low as 20 Hz compared to CRTs with relatively short phosphor decay. 2.4.10 Pixel size Display pixel size refers to the nominal physical dimension of the smallest addressable light-emitting element of the display device. Usually displays with smaller pixel sizes have potential for better resolution characteristics as expressed in contrast modulation. However, the actual pixel size should be taken into consideration, which, as pointed out in Section 2.2.1, is not necessarily equal to the nominal pixel size. In CRTs, the actual pixel size is defined by the area of light emission of the phosphor upon excitation by the (single) electron beam within a finite time period. The industry standard is to measure the pixel size at the 50% point of luminance energy of its luminance profile (Fig. 4). The ratio of this value and the nominal pixel size is known as the resolution-addressability ratio (RAR). An RAR value of 0.9 to 1.1 is recommended for medical use (Muka 1997). As an example, in a standard 21" display with 300x400 mm of display area and 2048x2560 matrix size, the (portrait) horizontal and vertical addressable pixel spaces are 0.1465 mm and 0.1563 mm, respectively; almost a square pixel. The physical pixel, produced by the electron optics and video amplifier must create an actual FWHM pixel size that is between 0.9 and 1.1 of nominal pixel size. The size of the CRT pixel in the horizontal and the vertical directions may differ, as they are dependent on two different functions. The vertical height of a pixel is controlled by electron optics, while the horizontal width is controlled by the video amplifier. The optics are generally more stable over the entire screen area and therefore, the resolution uniformity (i.e., the consistency of resolution response within the entire active display area) is generally better in the vertical direction compared to that in the horizontal direction. The electron optics of a CRT cause distortion and spot growth at larger deflections of the beam from the center of the CRT. The pixel size is, therefore, usually larger in the corners and edges of the screen than in the center. Furthermore, in addition to directionality and location dependency, the pixel size changes with the beam current, and thus it has to be specified at particular luminance levels. 2.4.11 Luminance In electronic displays, luminance usually refers to the maximum brightness of the display. A regular desktop color display device has a maximum luminance of approximately 100 cd/m2, while a high luminance display device can have a maximum luminance up to 300 to 600 cd/m2. Usually, display systems with higher maximum luminance are preferred for medical images. However, this preference should be balanced with the desired life and resolution capability of the display as well as its the ability to render all luminance values applicable to the display of a medical image, particularly the low luminance values.

AAPM TG18 Preprint DRAFT (version 10.0)
37 August 26, 2004
The minimum luminance is also an important parameter in medical display devices. Minimum luminance is subject to change during the lifetime of the display. High-quality medical displays have specific electronic circuitry to stabilize minimum luminance. Typical PC grade display devices lack reliable stabilizing circuitry, and can mask low-luminance image details. The ratio of the maximum and minimum luminance of a display device, so-called luminance ratio in the presence of ambient lighting and contrast ratio in the absence of ambient lighting, is an indicator of the luminance response capability of a display device. For medical diagnostic applications, a system automatically measuring and stabilizing the minimum and maximum luminance is indispensable for reliable diagnosis over long periods of use. At the same time, these systems substantially prolong required calibration intervals. 2.4.12 Luminance Uniformity Luminance uniformity refers to the maximum variation in luminance across the display area while displaying a uniform pattern. Most CRT displays have a certain degree of non-uniformity due to differences in the path length and beam-landing angle of the electron beam, the non-uniformity in the application of the phosphor layer, the non-uniformity in the thickness of the thin aluminum backing, and the increase in the thickness of the glass of the faceplate from the center to the edge. The latter is the largest contributor to luminance non-uniformity. Glasses for color CRTs with a typical 55% central transmittance exhibit a 7% decrease in transmission from the center to the edge, while monochrome CRTs at 34% central transmittance exhibit up to a 15% change. Luminance non-uniformity is more significantly noted for CRTs that have faceplates with flat profiles compared to smaller radius or “curved” CRTs, since the faceplate must be even thicker at the edges. Advanced CRT displays have uniformity correction circuits that equalize the luminance over the total screen area. These circuits apply a dynamic (synchronized in real time with the spot movement) modulation of either the video amplifier gain or the G1 bias (brightness) to compensate the intrinsic luminance non-uniformity of the CRT. Such corrections, however, can impact the resolution response of the devices at the periphery of the display area. In flat panel displays, non-uniformity is due to non-uniform luminance output of individual pixels. In AMLCDs, luminance non-uniformity is often caused by non-uniformity of the backlight and the variations in the thickness of the LC layer. As this thickness can vary locally within the active display area, luminance non-uniformity in AMLCDs can have a markedly different pattern with spatial frequency content higher than CRTs. 2.4.13 Surface Treatments Most medical CRT manufacturers utilize some anti-glare and anti-reflection (AR) methods to reduce the undesirable effects of veiling glare and ambient light reflection. Anti-glare approaches are usually in the form of absorbing substances in the faceplate of the CRT.3 Anti-reflection approaches usually involve the application of an anti-reflective coating layer, with a thickness equal to ¼ of the light wavelength, on the surface of the faceplate. Commonly, multi-layer vacuum coatings are first applied to a thin glass substrate (1/8-inch-thick), which is bonded to the CRT faceplate in a subsequent step. The transmissivity of the anti-reflective coating, ranging from 60 to 90%, specifies the portion of light transmitted through the coating. In non-medical displays, the reflection is sometimes reduced by anti-reflective/glare treatments that make the glass surface rough through the processes of chemical or mechanical etching or spray-on coatings. Such treatments diffuse incident light but also degrade the displayed image, and thus, are not recommended in displays for medical applications using CRTs.
3 Note that anti-glare is also sometimes used to refer to a front diffusing layer that produces a haze component.
AAPM TG18 Preprint DRAFT (version 10.0)
38 August 26, 2004
In flat panel displays, multi-layer thin-film anti-reflective coatings are also used to reduce specular reflections. In addition, transmissive displays like AMLCDs permit designs that can block light reflection further by introducing absorbers in the structure. An approach that is being used currently is the use of spacers that are light-absorptive and made of black glass. LCDs also often use a form of anti-glare faceplate treatment that eliminates distinct specular reflection but produces a haze component. 2.4.14 Bit Depth The bit depth of a display device specifies the maximum theoretical number of simultaneously displayable gray levels, or color levels, that one can attempt to display. For example, in an 8-bit display one can attempt to simultaneously display 256 distinct gray levels. The display controller (i.e., the video card) usually determines the bit-depth of a display device. Current medical display controllers have bit depths ranging from 8-10. However, similar to the difference between nominal and actual pixel sizes, the theoretical number of shades of gray, or color, may be less than the actual numbers due to limitations in the capability of the display system. Since bit depth is the means by which tonal values from black to peak luminance are defined for a pixel, the ability or inability of the video amplifier of the display device to respond across the full dynamic range will determine whether the tonal transitions commanded are actually rendered. Insufficient bandwidth will progressively mask the tonal values represented by the least significant bits. The use of look-up-tables (LUTs) can significantly reduce the actual number of distinct luminance levels commanded by an 8-bit graphic card. 2.4.15 Viewing Angle (LCD) LCD devices have an angular-dependent luminance and contrast response and chromaticity. Viewing angle measured from the normal to the display faceplate indicates the angular range within which the contrast ratio of the device is maintained within a certain range. It is usually separately specified in the horizontal and vertical directions. It should be pointed out that even within the specified viewing angle, an LCD can exhibit marked changes in luminance and contrast and chromaticity as the viewing angle is changed. 2.4.16 Aperture Ratio (LCD) In flat-panel displays, a pixel might utilize only a portion of the nominal pixel size. The ratio between the actual pixel size and the nominal pixel size is called aperture ratio. With higher aperture ratios, less pixel structure will be visible on the display, and the display may also be brighter. 2.5 Classification of Display Devices In recognition of the currently accepted practice and in accordance with the guidelines set forth by the American College of Radiology (ACR 1999) and the Food and Drug Administration (FDA), display devices for medical imaging are characterized in this report as either primary or secondary. Primary display systems are those used for the interpretation of medical images. They are typically used in radiology and in certain medical specialties such as Orthopedics. Secondary systems are those used for viewing medical images for purposes other than for providing a medical interpretation. They are usually used for viewing images by general medical staff and medical specialists other than radiologists, and utilized after an interpretive report is provided for the images. In this class of displays, there are also operator’s console monitors and QC workstations, display devices that are commonly used to “adjust” the images before they are sent to PACS or hard-copy printers. As the performance of these systems (especially their luminance response) directly impacts image presentation at other display devices, their

AAPM TG18 Preprint DRAFT (version 10.0)
39 August 26, 2004
performance needs to maintain a minimum level of acceptability, and thus they are treated as Secondary class displays. In prior literature, primary devices have sometimes been referred to as “diagnostic” and secondary devices as “clinical.” Both display classes must meet specified display performance functionality requirements for the imaging modality for which they will be used. The performance requirements for a given imaging modality are dependent on the modality itself. For example, fully diagnostic information for an MRI examination is obtainable at a matrix size far less than that required for chest imaging. However, this report adopts a conservative general classification independent of the imaging modality. It is possible to have less stringent performance requirements for certain modalities or diagnostic tasks. If so, however, it should be taken into consideration that a display that is originally intended for a certain modality might be used to view images from another modality in the future, so it should meet the more stringent set of requirements. Differences between primary and secondary displays are evident in the sample engineering specifications listed in Table 1, and in the performance requirements delineated in Sections 4, 5, and 6. In acquiring a display system of a certain class, the physicist must understand and establish the desired specification and performance requirements. The requirements must be specified prior to purchase and clearly communicated between the user and the manufacturer. These requirements will also be a basis for performance assessment of the device in the form of acceptance testing and the routine quality control procedures as described in the following sections of this report. Ideally, the performance of any medical display device that is used in any diagnostic or clinical capacity should be evaluated and monitored accordingly. However, a number of primary class medical displays, including those in fluoroscopic examination suites, digital angiography, or digital subtraction angiography, and secondary displays, including operator console monitors are “closed,” in that the TG18 test patterns (detailed in Section 3.2) cannot be easily loaded on them. That severely limits the execution of the performance evaluation steps recommended in this report. It is ultimately the responsibility of the manufacturer to make the TG18 test patterns available on the system. However, if these patterns cannot be loaded and displayed, a minimum level of display evaluation should be undertaken as described in the Appendix I of this report.

AAPM TG18 Preprint DRAFT (version 10.0)
40 August 26, 2004
3 General Prerequisites for Display Assessments 3.1 Assessment Instruments Although many display tests can be performed visually, a more objective and quantitative evaluation of display performance requires special test tools. The required instruments vary in their complexity and cost depending on the context of the evaluation (research, acceptance testing, or quality control) and how thorough the evaluation needs to be. Objective and reliable assessment of many display characteristics can be performed with relatively inexpensive equipment. However, if a complete assessment of display performance is desired, more sophisticated equipment is required. This section provides a description of all the tools referenced in this report. The users are advised to consult Sections 4-6 to determine the subset of these tools needed for the particular tests being performed. 3.1.1 Photometric Equipment 3.1.1.1 Luminance-meter (Photometer) The luminance response and the luminance uniformity quantitative tests recommended in this report (Sections 4.3 and 4.4) require a calibrated photometer to measure the luminance of the display device. There are two types of such devices available in the market (Fig. 14). For the near-range type of device, the photometer is held at a close distance from the faceplate of the display. In the telescopic type of photometer, the photometer is aimed toward the display from a distance of about a meter. The measured luminance values vary slightly depending on the type of photometer used, primarily due to the contributions of stray light to the measurements. Otherwise, either type will be acceptable for display assessment as long as the measurements are performed in a consistent manner, which is particularly important for repeated quality control measurements. To maintain consistency, particular attention should be paid to the ambient light level and the use of light blocking devices. For near-range photometers, a stopper ring should be used to block the ambient lighting. For telescopic photometers, a baffled cone (frustum) or funnel covered with a black light-absorbing coating may be used. The photometer should have a calibration traceable to NIST, be able to measure the luminance in the range of 0.05-1000 cd/m2 with better than 5% accuracy and a precision of at least 10-2 and ideally 10-3. The photometer should also comply with the CIE standard photopic spectral response within 3%. Telescopic photometers should have an acceptance angle equal to or smaller than 1 degree for infinity focus. If the photometer is used for advanced luminance measurements (Section 4.3.5), it needs to have a precision of at least 10-4 and ideally 10-5. It should be pointed out that many of the near-range pocket photometers used in today’s medical calibration packages use photopic filters that do not meet the 3% compliance with the CIE standard photopic spectral response. However, it has been shown that the absolute accuracy of these devices can be improved by making certain assumptions about the chromaticity of the display. Such photometers, if calibrated according to a NIST traceable calibration procedure to the specified display device, meet the spectral response requirement of this report. However, such photometers may not meet this requirement for other display devices. In particular, in LCD displays, the variation in backlights introduces a broader range of chromaticities that may result in measured values that are no longer within the specified tolerances. When a near range photometer is used to measure the absolute luminance of a display device with non-Lambertian light distribution, such as a LCD, the aperture angle of the photometer should be taken into account. As the luminous intensity can change substantially as a function of angle, luminance-meters with

AAPM TG18 Preprint DRAFT (version 10.0)
41 August 26, 2004
different aperture angles will measure substantially different values. The differences are further impacted by luminance and temperature. Therefore it is strongly recommended that for all measurements on LCD displays, near-range photometers with an aperture range smaller than 5 degrees be used. Otherwise certain correction factors should be applied (Blume 2001). A complete assessment of luminance response for display systems requires luminance measurements at a large number of signal levels. To automate this process, some display device and controller manufacturers offer photometers with direct interface to the device or the controller. The luminance values at multiple signal levels are automatically recorded and subsequently used to calibrate the display. The minimum requirements stated above are also applicable to these types of photometer devices. The reflection, veiling glare, and angular emission quantitative tests (Sections 4.2, 4.7, and 4.9) require a telescopic photometer. Low-flare and wide luminance range characteristics are two important requirements for the veiling glare test. Commercial telescopic photometers are acceptable for such assessments as long as they are used along with a light-blocking hood (Section 3.1.3), which blocks stray light from the display (Fig. 15). The photometer should have the same minimum specifications stated above with a 1/3 to 1 degree acceptance angle. In addition, the photometer should be equipped with an lens with focusing capabilities to an area smaller than 6 mm in diameter. In some systems, this requirement can be achieved by the use of an add-on close-up lens. Alternatively, precise assessments of the veiling glare characteristics of the display can be performed by a special purpose collimated photometer (Badano 2000) (Fig. 16).
(a) (b) Fig. 14: Examples of near-focus (a) and telescopic (b) photometric and colorimetric equipment.

AAPM TG18 Preprint DRAFT (version 10.0)
42 August 26, 2004
SPO
TP
HO
TOM
ETE
R
Dark PVC tube withblack paper lining
~24" by ~3"
Plasticfunnel
Aperture plate withopening smaller than
funnel openingMacro Lens for
1/3 degree spot
Fig. 15: A baffled tube with funnel tip can be used to measure the dark spot in the center of the bright glare pattern. For visual measurements, the same device can be used to view the low contrast pattern in the dark field. The aperture plate facing the funnel and the funnel exterior and interior should be painted with a non-reflecting black paint. 3.1.1.2 Illuminance-meter For the quantitative assessment of display reflection and for monitoring ambient conditions, an illuminance-meter is required. The device should be able to measure illuminance within 1-1000 lm/m2 (lux, lx) range with better than 5% accuracy, comply to within 3% of the CIE standard photopic spectral response, have a calibration traceable to NIST standards, and have a 180 degree cosine response (Lambertian response) to better than 5% out to 50° angulation.
Fig. 16: A photometer with collimated probe is positioned to record the luminance in a black region surrounded by a bright field. 3.1.1.3 Colorimeter The quantitative assessment of chromaticity (Section 4.8) necessitates the use of a colorimeter (or spectrometer) capable of assessing the CIE-specified color coordinates of the display device (IEC 1976). Colorimeters, similar to photometers, come in two different kinds: near-focus and telescopic (Fig. 14). Either kind will be acceptable for display assessment as long as the measurements are performed in a consistent fashion with particular attention to maintaining a low ambient light level. The meter should have a calibration traceable to NIST standards and should be able to evaluate the CIE color coordinates

AAPM TG18 Preprint DRAFT (version 10.0)
43 August 26, 2004
with better than 0.004 accuracy in the u’,v’ space (0.007 in the x,y space) within a 1-1000 cd/m2 luminance range. 3.1.2 Imaging Equipment Quantitative assessment of the resolution and noise characteristics of display systems (Sections 4.5 and 4.6) requires equipment to capture magnified images of the display (Fig. 17). Charged-coupled device (CCD) digital cameras are well suited for the task. Two types of devices can be utilized in display quality assessments: scientific-grade CCD cameras for high precision assessments and high-quality photographic-grade cameras for more routine evaluations. For each type, a number of performance characteristics are desired which are described below. 3.1.2.1 Scientific-grade CCD Camera For high-precision resolution and noise evaluation of display systems, the camera should be capable of acquiring low noise and wide dynamic range images at luminance levels ranging from 1-500 cd/m2. The camera noise should be small compared to the signal variations (e.g., the fixed pattern noise of the CRT screen) that need to be measured, while the dynamic range should be large compared to the maximum-to-minimum luminance ratio to provide adequate luminance resolution. The images should be at least 1024x1024 in matrix size (512 x 512 if only small field of views are used) and have 10-12 bit pixel values. To achieve low noise and wide dynamic range, cooled CCD sensors with a relatively large pixel size are often employed. The camera should be equipped with a focusable macro lens, preferably a finite-conjugate (fixed focus) macro-photography lens, and be capable of operating at different frame rates and/or integration times (up to 1 second). The camera should have a digital interface to a computer for capturing and displaying the images. For portability, a notebook computer might be desired in which case the camera might need to be able to transfer the image data via a high-speed connection. The digital interface should also allow control over the operational parameters of the camera. It is recommended that the luminance, flat-field response, noise, and modulation transfer function (MTF) response of the camera be determined for the luminance levels and integration times employed in the display measurements. The luminance and flat-field responses are determined by capturing the images of light sources at known luminance values. This task can be accomplished by capturing images of luminance patterns, such as TG18-LN patterns (see Section 3.2.2), displayed on a display device for which luminance values have been measured with a calibrated luminance-meter previously. A plot of the mean pixel values in the central area of the image versus the luminance is a depiction of the camera’s luminance response function. The response should be linear or transferred into a linear form. The noise of the camera is determined by acquiring dark-exposure frames (with the camera lens cover on) with shutter times equivalent to those employed in the display measurement. The noise is represented by the standard deviation in a region of interest of approximate size 200 x 200 Camera pixels. The MTF of the CCD camera is found from the edge or the line response in the same way, as described for the MTF measurement in Section 4.4.4. An edge pattern or a narrow line, back illuminated by a uniform light source, is imaged with the CCD camera and the resultant image is analyzed with Fourier transform techniques. The luminance of the light source, the f-number of the lens and the exposure time should be that same as those employed in the measurement technique. The characteristics of the camera should be taken into account when assessing the performance of a display device. The use of a CCD camera as described above requires a firm stand for the camera. In laboratory settings, a positioning device with fine adjustments for moving the camera in x, y, or z directions and changing its orientation will be preferable. However, such devices are often bulky and difficult to work with for in-field clinical evaluations. In those situations, a sturdy tripod, either floor type or table-top, or a stand with

AAPM TG18 Preprint DRAFT (version 10.0)
44 August 26, 2004
a desk mount will work sufficiently well. If the stand is connected to the table, care should be exercised to prevent any mechanical instabilities or vibrations during the measurements.
monitor luminance meter /
CCD camera collimating
cone
ray trace
Fig. 17: The schematic of a CCD camera setup for quantification of resolution and noise in display devices. 3.1.2.2 Photographic-grade CCD Camera Scientific CCD cameras of the type described above are expensive. Recent developments in the consumer market have resulted in high quality photographic CCD cameras with modest cost. Recent studies have demonstrated that non-scientific cameras can be used for quantitative assessment of display resolution in clinical settings (Samei 2001, Roehrig 1999) with certain precautions. Such cameras, however, should not be used for advanced measurements, for noise power spectra measurements, or for luminance measurements at low luminance levels. Otherwise, the camera needs to meet a number of minimum performance characteristics if to be used for display assessment. It needs to have a matrix size of at least 600 x 480, be equipped with a high-quality macro lens, have auto-focusing capabilities, and be able to export image data in an uncompressed and non-proprietary format to a computer. The luminance, noise, and resolution response of the camera should be ascertained as described above. The camera should also be used in conjunction with a stable positioning device as described above. 3.1.3 Light Source and Blocking Devices The quantitative assessment of specular reflection (see Section 4.2.4) requires a small diameter source of diffuse white light. Suitable light sources include conventional halogen spot lamps with a glass diffuser placed on the exit surface or a small illuminator sold for use with student microscopes (Fig. 18). The light source should ideally be brighter than 200 cd/m2. Ideally, the light source should subtend 15° from the center of the display (Kelley 2002). Larger light sources will excessively illuminate the display surface and add diffusely reflected light to the specular reflection. For advanced evaluations (see Section 4.2.5), optical band-pass filters will also be required. Thin film glass filters placed in from of a broadband illuminator can provide various colors with about 20-40 nm bandwidth. A set of filters with six or more colors is adequate to characterize the wavelength dependence of reflective devices.

AAPM TG18 Preprint DRAFT (version 10.0)
45 August 26, 2004
(a) (b) Fig. 18: A light source to measure specular reflection coefficients may be assembled from a halogen spot lamp with a diffuser added to the end (a). Another alternative is to utilize a small illuminator of the type used with microscopes (b). The quantitative assessment of diffuse reflection (see Section 4.2.4) requires an illuminator device. A typical device is illustrated in Fig. 19a. The device consists of two compact fluorescent lights with a daylight spectrum of about 10 watts each in standard lamp adapters. To eliminate variations in illuminance from the surface materials in the room, a small containment should surround the region in front of the display device including the light sources. A suitable containment can be assembled from flat white poster, styrofoam boards, or white cloth placed over a cubic frame (Flynn 1999a). The lamps should ideally be baffled from directly illuminating the display surface or otherwise be placed behind the plane of the display illuminating the interior of a semi-hemispherical illumination containment (Fig. 19b-c). The back wall of the containment facing the display’s faceplate should have two small apertures for luminance measurements, as illustrated in Fig. 19. The openings should be about 10° away from the normal to the display faceplate to avoid measuring the specular reflection of the photometer. One of the openings is covered with a light absorptive patch the luminance at the reflection of which is measured through the other opening. Advanced measurements of the diffuse reflection of the display in laboratory settings (see Section 4.2.5) requires a more standardized illumination. The illumination method based on an integrating sphere advocated by NIST may be used (Kelley 2001). Each source is fabricated using an integrating sphere with a standardized design. The reader is referred to the NIST standard for details on the illuminator and illumination geometry. Light-blocking devices in the form of hoods or light-absorbing cloth are used during the evaluations of reflection and veiling glare characteristics of the display, and when the display cannot be tested in controlled ambient light conditions. The light-absorbing material should be black, non-transparent, and made of non-reflective material. The funnel to be used for the veiling glare assessment should be made of materials with similar light-absorbing characteristics. It should have an opening of 5 mm in diameter at the base and an angular divergence of smaller than 60 degrees. It should also be long enough to block any stray light from the display reaching the photometer. The desired length of the funnel, l, can be calculated as
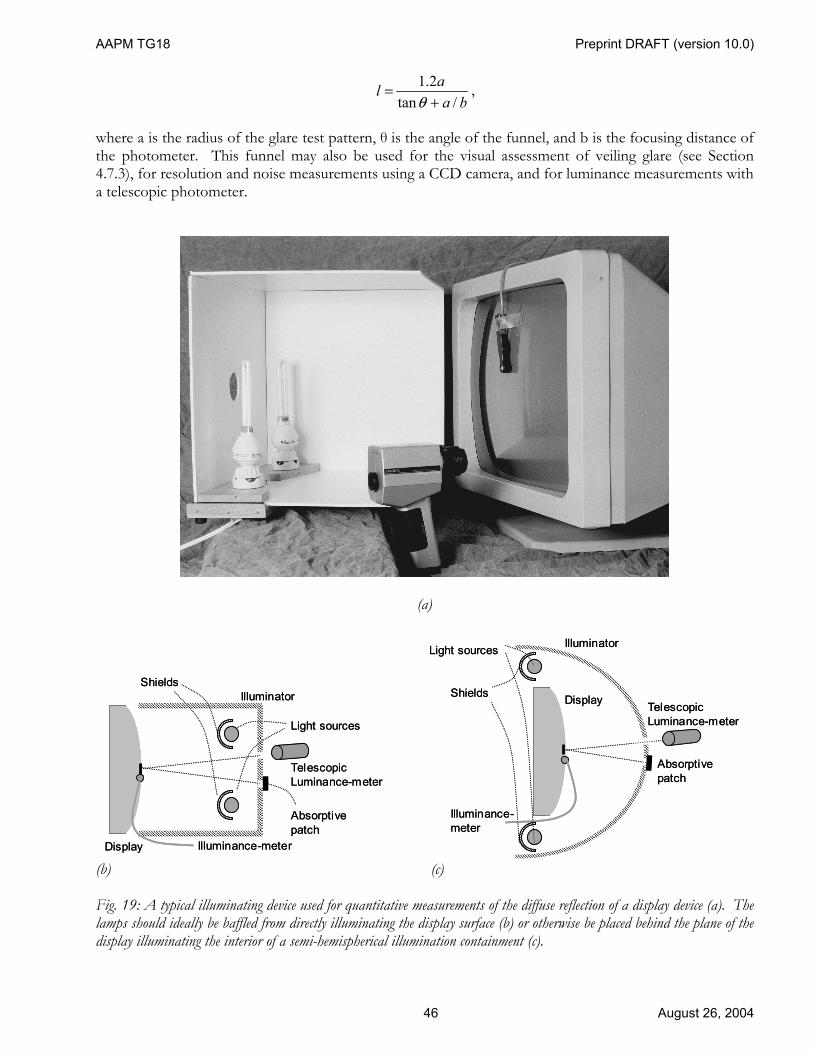
AAPM TG18 Preprint DRAFT (version 10.0)
46 August 26, 2004
baal
/tan2.1+
=θ
,
where a is the radius of the glare test pattern, θ is the angle of the funnel, and b is the focusing distance of the photometer. This funnel may also be used for the visual assessment of veiling glare (see Section 4.7.3), for resolution and noise measurements using a CCD camera, and for luminance measurements with a telescopic photometer.
(a)
TelescopicLuminance-meter
Display
Light sources
Illuminance-meter
IlluminatorShields
Absorptivepatch
TelescopicLuminance-meter
Display
Light sources
Illuminance-meter
IlluminatorShields
Absorptivepatch
TelescopicLuminance-meter
Display
Light sources
Illuminance-meter
Illuminator
Shields
Absorptivepatch
TelescopicLuminance-meter
Display
Light sources
Illuminance-meter
Illuminator
Shields
Absorptivepatch
(b) (c)
Fig. 19: A typical illuminating device used for quantitative measurements of the diffuse reflection of a display device (a). The lamps should ideally be baffled from directly illuminating the display surface (b) or otherwise be placed behind the plane of the display illuminating the interior of a semi-hemispherical illumination containment (c).

AAPM TG18 Preprint DRAFT (version 10.0)
47 August 26, 2004
3.1.4 Miscellaneous Accessory Devices For a semi-quantitative assessment of resolution, a measuring microscope or magnifier should be used. There are several such devices available in the market. The device should have a magnification of about 25-50x, be equipped with a metric reticle having divisions smaller than 0.05 mm, and focusing capabilities, and allow a working distance of at least 12.5 mm. Microscopes with smaller working distances cannot be used for large size CRTs because of their inability to focus through the thick glass faceplate of the display device. For angular response measurements, a conoscopic device or a gonioscopic probe may be utilized. A conoscopic device measured a cone of light coming from the display with special transform lenses (Fourier optics) and two-dimensional array detectors. This method provides a fast and complete description of the angular variations of the luminance and chromaticity levels. If such a device is used, its luminance response characteristics should comply with the luminance measure requirement noted above. In the gonioscopic approach, a focused luminance probe with a small acceptance angle is oriented toward the display to reproduce a given viewing direction. A low-flare telescopic luminance-meter of the kind described in 3.1.1.1 may be used for this method. In testing display devices under low ambient light conditions, it is sometimes necessary to read a serial number or check an adjustment on the back of the device. A normal flashlight is useful in these situations. In addition, for routine quality control tests, it is important to assure that the display’s faceplate is clean. Lint-free cloth or cleaning tissue as well as manufacturer’s approved glass-cleaning solution should be available during the QC tests for this purpose. Other necessary tools include, two 1-m rulers and a device to measure angles for the assessment of the specular reflection, and a flexible tape measure for geometric distortion measurementsgeometric. 3.2 Test Patterns A number of test patterns are required to evaluate the performance of display devices. The patterns recommended in this report are listed in Table 2 and explained below. The full specific descriptions of the patterns can be found in Appendix III. While many of the tests described can be performed with different patterns than those recommended, the use of these specific patterns are encouraged in order to allow comparisons of measurements. All of the patterns recommended in this report are designated with a nomenclature of the form TG18-xyz, where x, y, and z describe the type and derived variants of a pattern. The patterns are provided along with the electronic version of this report. (Alternatively, the patterns may be generated with the aid of the information provided in this report in adherence with the rules and restriction outlined in Appendix III). All patterns are provided in three formats: DICOM, 16-bit TIFF, and 8-bit TIFF. The DICOM and 16-bit TIFF patterns contain 12 bits of pixel values, while the 8-bit TIFF patterns only contain an 8-bit range of pixel values. The patterns may be generated by graphic software using the detailed specifications provided in Appendix III. However, in testing a display device, it is preferred that the patterns be viewed using the display application that is used clinically. When displaying these patterns, no special processing functions should be applied. Furthermore, for most patterns, it is essential to have a one-on-one relationship between the image pixels and the display pixels. Images in DICOM and 16-bit TIFF formats should be displayed with a window width and level set to cover the range from 0 to 4095 (Window Width, WW = 4096, Window Level, WL =2048), except for the TG18-PQC, TG18-LN, and TG18-AFC patterns, where

AAPM TG18 Preprint DRAFT (version 10.0)
48 August 26, 2004
a WW of 4080 and WL of 2040 should be used. For 8-bit patterns, the displayed range should be from 0 to 255 (WW = 256, WL = 128). Table 2: Test patterns recommended for display quality evaluation. The patterns are divided into six sets. Most patterns are available in 1024 x 1024 size and in either DICOM or tiff format. Some patterns are available in 2048x2048 size.
Set Series Type Images Description Multi Purpose TG18-QC Vis./Qnt 1 Resolution, luminance, distortion, artifacts (1k & 2k) TG18-BR Visual 1 Briggs pattern, low contrast detail vs. luminance TG18-PQC Vis./Qnt. 1 Resolution, luminance, contrast transfer for prints Luminance TG18-CT Visual 1 Luminance response (1k only) TG18-LN Quant. 18 DICOM grayscale calibration series
TG18-UN Visual 2 Luminance and color uniformity, and angular response TG18-UNL Quant. 2 Same as above with defining lines TG18-AD Visual 1 Contrast threshold at low luminance for evaluating display reflection TG18-MP Visual 1 Luminance response (bit depth resolution) Resolution TG18-RH Quant. 3 5 Horizontal lines at 3 luminance levels for LSF evaluation
(1k and 2k) TG18-RV Quant. 3 5 Vertical lines at 3 luminance levels for LSF evaluation TG18-PX Quant. 1 Array of single pixels for spot size TG18-CX Visual 1 Array of Cx patterns and a scoring reference for resolution uniformity TG18-LPH Visual 3 Horizontal bars at 1 pixel width, 1/16 modulation, 3 luminance levels TG18-LPV Visual 3 Vertical bars at 1 pixel width, 1/16 modulation, 3 luminance levels Noise TG18-AFC Visual 1 4AFC contrast-detail pattern, 4 CD values
(1k only) TG18-NS Quant. 3 Similar to RV/RH, 5 uniform regions for noise evaluation Glare TG18-GV Visual 2 Dark spot pattern with low contrast object
(1k only) TG18-GQ Quant. 3 Dark spot pattern for glare ratio measurement TG18-GA Quant. 8 Variable size dark spot patterns Anatomical TG18-CH Visual 1 Reference anatomical PA chest pattern (2k only) TG18-KN Visual 1 Reference anatomical knee pattern TG18-MM Visual 2 Reference anatomical mammogram pattern
3.2.1 Multi-purpose Test Patterns Routine visual evaluations of performance are conveniently done using a single comprehensive test pattern. A new pattern designed by the AAPM Task Group 18 committee, referred in this report as the TG18-QC pattern is recommended for overall display quality assessment. Additionally, TG18-PQC contains elements useful for the evaluation of printed film displays and the TG18-BR, Briggs pattern, is useful for evaluating the display of low contrast, fine detail structures. 3.2.1.1 TG18-QC Pattern The TG18-QC test pattern is shown in Fig. 20. The pattern consists of multiple inserts embedded in a mid-pixel value background. The inserts include the following:

AAPM TG18 Preprint DRAFT (version 10.0)
49 August 26, 2004
1) Grid lines (one pixel) with thicker lines (three pixels) along periphery and around central region, for the evaluation of geometric distortions.
2) Sixteen 102x102 (1k version) luminance patches with pixel values varying from 8 to 248 (in 8-bit version) [128 to 3968 in 12-bit version]4 for luminance response evaluation. Each patch contains four small 10x10 corner patches (1k version) at ±4 [±64] of pixel value difference from the background, +4 [+64] in upper-left and lower-right, -4 [-64] in lower-left and upper-right. The small patches are used for visual assessment of luminance response. Additionally, two patches with minimum and maximum pixel value are embedded containing 13 [205], and 242 [3890] pixel value internal patches, similar to 5% and 95% areas in the SMPTE test pattern.
3) Line-pair patterns at the center and four corners at Nyquist and half-Nyquist frequencies for resolution evaluation, having pixel values at 0-255 [0-4095] and 128-130 [2048-2088].
4) "Cx" patterns at the center and four corners with pixel values of 100, 75, 50, and 25% of maximum pixel values against a zero pixel value background, for resolution evaluation in reference to a set of 12 embedded scoring reference with various amounts of Gaussian blurring applied as tabulated in Table AIII.9.5
5) Contrast-detail “QUALITY CONTROL” letters with various contrasts at minimum, mid-point, and maximum pixel values for user-friendly low-contrast detectability at three luminance levels.
6) Two vertical bars with continuous pixel value variation for evaluating bit-depth and contouring artifacts.
7) White and black bars for evaluating video signal artifacts, similar to those in the SMPTE pattern. 8) A horizontal area at the top-center of the pattern for visual characterization of crosstalk in flat-
panel displays. 9) A border around the outside of the pattern, similar to SMPTE’s.
4 Unless specified otherwise, the “[]” symbol used in this section refer to the pixel values in the 12-bit version of the test patterns. 5 The development of the reference set is based on research conducted at Eastman Kodak Company reported in a recent publication (Kohm 2001).

AAPM TG18 Preprint DRAFT (version 10.0)
50 August 26, 2004
Fig. 20: The TG18-QC comprehensive test pattern. 3.2.1.2 TG18-PQC Pattern The TG18-PQC test pattern (Fig. 21) contains bars of varying digital driving level with regions having various low contrast horizontal and vertical patterns. The pattern was developed primarily for evaluating the characteristics of a film printer so that printed films can be adjusted to match the luminance response of electronic display devices. Marked regions are provided from which film density measurements can be made. At each density step, low-contrast patterns of varying contrast and frequency are included. Fine detail test pattern regions are also included to evaluate the resolution of a printer. Continuous ramps are provided at the right and left sides of the pattern to evaluate the film density continuity (see Appendix III for a detailed description).

AAPM TG18 Preprint DRAFT (version 10.0)
51 August 26, 2004
Fig. 21: The TG18-PQC developed for the evaluation of printed films. 3.2.1.3 TG18-BR Pattern Briggs patterns are widely-used for visually inspecting whether the contrast and resolution of a display system is properly adjusted (Briggs 1979, Briggs 1987). This pattern was originally developed by Stewart Briggs for satellite imaging but has since been adapted for other display systems. Currently several varieties of the Briggs patterns are in common use. The Briggs test pattern #4 is useful for the visual inspection of medical imaging displays (Fig. 22). In this report, this pattern is referred to as the TG18-BR pattern to avoid possible confusions with other Briggs patterns.

AAPM TG18 Preprint DRAFT (version 10.0)
52 August 26, 2004
(a) (b) Fig. 22: The TG18-BR pattern for the evaluation of the display of low contrast, fine detail image structures (a). The designation of the checkerboards in each of the 32 panels (b). The 1k version of the pattern consists of 4 quadrants, each containing eight panels. The panels are evenly spaced to cover a pixel value range from 0 to maximum, providing a full range of background luminance for the target’s checkerboards. Within each quadrant, the panels are also paired so that adjacent panels have background brightness values on either side of the mean brightness of the pattern. Each panel contains 16 checkerboards ranging from a 3x3-checker pattern with 25 pixels per each checker square edge (B-10), down to 2x2 checker with one pixel per checker square edge (B-90). The contrasts of the checkerboards in terms of pixel-value difference in the four quadrants are 1 [16], 3 [348], 7 [112], and 15 [240], corresponding to the four least significant bits. 3.2.2 Luminance Test Patterns 3.2.2.1 TG18-CT Pattern For visual assessments of the contrast transfer characteristics associated with the luminance response of a device, a low-contrast pattern can be used (Fig. 23). The pattern includes 16 adjacent regions varying in luminance from 8 [128] to 248 [3968], embedded in a uniform background. Each region differs in pixel value by the same amount. Each patch contains four small 10x10 corner patches (1k version) at ±4 [±64] pixel value difference from the background, identical to those in the TG18-QC test pattern. In addition, at the center of each patch there exists a half-moon target with the two sides of the target at ±2 [±32] pixel value difference from the background.

AAPM TG18 Preprint DRAFT (version 10.0)
53 August 26, 2004
Fig. 23: TG18-CT low-contrast test pattern for the evaluation of the luminance response of display systems. 3.2.2.2 TG18-LN Patterns Two sets of 18 luminance patterns are provided to assess the luminance response of a display system. The patterns are designated as TG18-LNx-y, where x is the bit-depth range of the displayed values in the sets, and y is the image number in the set. The geometry of these patterns conforms to that recommended in DICOM 3.14. Each pattern consists of a central test region with certain pixel value, occupying about 10% of the full image area. The rest of the pattern has a uniform background with a luminance equal to 20% of the maximum luminance. To achieve this luminance level, assuming that the display device is properly calibrated to the DICOM display function (see Section 4.3.1) and has a luminance range of 1 to 250 cd/m2, the background pixel value is 153 for 8-bit patterns [2448 for 12-bit patterns]. Within a set of patterns the pixel values in the central regions are equally spaced. For example, there are eighteen 8-bit patterns, (TG18-LN8-01 through TG18-LN8-18), with central pixel values of 0, 15, 30, …, and 255. Likewise, there are eighteen 12-bit patterns (TG18-LN12-01 through TG18-LN12-18), with

AAPM TG18 Preprint DRAFT (version 10.0)
54 August 26, 2004
central pixel values of 0, 240, 480, …, 4080. Separate test pattern sets corresponding to these two examples are provided with this report (Fig. 24). These test patterns may be magnified to fit the full display area.
(a) (b) (c) Fig. 24: Examples of TG18-LN luminance patterns for luminance measurements. The patterns cover equal increments of pixel value to cover the entire range of pixel values. Shown here are TG18-LN8-01 (a), TG18-LN8-09(b), and TG18-LN8-18 (c).
(a) (b) (c)
Fig. 25: The TG18-UN80 (a), TG18-UNL80 (b), and TG18-UNL10 (c) patterns for luminance uniformity, color uniformity, and angular response evaluations. 3.2.2.3 TG18-UN Pattern For the assessment of luminance uniformity, color uniformity, and angular response, uniform test patterns are used. Two patterns are specified at 10% (26 [410] pixel value) and at 80% (204 [3278] pixel value) of maximum pixel value (TG18-UN10 and TG18-UN80). Two other corresponding patterns are also defined that are identical to the UN patterns except for the presence of low-contrast lines at identifying

AAPM TG18 Preprint DRAFT (version 10.0)
55 August 26, 2004
the central and four 10% corner measurement areas of the pattern (TG18-UNL10 and TG18-UNL80). Fig. 25 shows the schematic of three UN patterns. 3.2.2.4 TG18-AD Pattern TG18-AD is a low-luminance, low-contrast test pattern developed to visually evaluate the diffuse reflection of a display device (Fig. 26). The pattern consists of 49 horizontal line-pair pattern inserts at half Nyquist frequency with the black lines at zero pixel value and the bright lines with incrementally increasing contrast levels. The inserts are identified with rows and column numbers. The value of the bright line of each pattern in terms of pixel value is equal to b(C + 7R), where C is the column number, R is the row number, and b is a multiplying factor equal to 1 for the 8-bit version and 4 for the 12-bit version of the pattern. The background pixel value is zero.
Fig. 26: The TG18-AD test pattern for visual evaluation of display’s diffuse reflection response to ambient light. The pattern has been brightened and contrast-enhanced to illustrate its features.

AAPM TG18 Preprint DRAFT (version 10.0)
56 August 26, 2004
3.2.2.5 TG18-MP Pattern TG18-MP is designed for visual assessment of display bit-depth (Fig. 27). This pattern exists only in the 12-bit version. With a background of 256, the pattern contains 16 ramps, each covering 1/16 of a 12-bit pixel value range from 0 to 4095. Small markers indicate the 8-bit and 10-bit pixel value transitions. For the details of this pattern, see Appendix III.
Fig. 27: The TG18-MP test pattern for visual evaluation of display bit-depth resolution. 3.2.3 Resolution Test Patterns 3.2.3.1 TG18-RH and TG18-RV Patterns For the quantitative assessment of display resolution, two sets of test patterns, each containing three patterns, are recommended. The backgrounds for all patterns are at 51 [819] pixel value with five squares

AAPM TG18 Preprint DRAFT (version 10.0)
57 August 26, 2004
overlaid at one central and four corner measurement locations, each occupying 10% of the full image area, in which the pixel value is set at 10% (26 [410] pixel values), 50% (128 [2048] pixel values), and 89% (228 [3656] pixel values) of the maximum value in all five areas. The TG18-RH10, TG18-RH50, and TG18-RH89 test patterns exhibit a central single pixel-wide horizontal line with 12% positive pixel value difference at each measurement location. The TG18-RV10, TG18-RV50, and TG18-RV89 patterns exhibit a central single pixel-wide vertical line with 12% positive pixel value difference at each measurement location. Thus the patterns enable the assessment of the display line spread function and MTF in the horizontal and vertical directions at a small modulation at three luminance levels and five locations across the faceplate of the display. In addition, single pixel markers are inserted in each measurement location to allow spatial calibration of the digital camera. The markers in each location are the corners of a 60 x 60 central square area (120 x 120 for the 2k version) with values equal to 50%, 10% and 50% of the maximum pixel value, for R10, R50, and R89 patterns, respectively. Two examples of these patterns are shown in Fig. 28.
(a) (b) Fig. 28: The TG18-RH89 (a) and TG18-RV50 (b) patterns for the assessment of display resolution. The TG18-NS test patterns are identical to the RH and RV patterns except for the presence of the lines in the five measurement areas. 3.2.3.2 TG18-PX and TG18-CX Patterns A quantitative assessment of display resolution may be undertaken by characterizing the luminance profile of single pixels across the faceplate of the display. For this purpose, a pattern can be used with a 0 pixel value background and single non-zero pixels at 100%, 75%, 50%, and 25% of the maximum pixel value (255, 191, 128, and 64 [4095, 3071, 2048, and 1024] pixel values, respectively) (TG18-PX, Fig. 29). A quantitative assessment of display resolution and particularly resolution uniformity may also be undertaken by visually assessing the appearance of Cx targets similar to those used in the TG18-QC pattern. The TG18-CX pattern consists of an array of Cx targets at 100%, 75%, 50%, and 25% of the maximum pixel value (255, 191, 128, and 64 [4095, 3071, 2048, and 1024] pixel values, respectively)

AAPM TG18 Preprint DRAFT (version 10.0)
58 August 26, 2004
against a zero pixel value background, covering the entire display area (Fig. 30). In addition, the pattern has embedded a scoring reference similar to that in the TG18-QC pattern for evaluating the targets (see 3.2.1.1 and Table AIII.9).
Fig. 29: The TG18-PX test pattern for the assessment of display resolution.
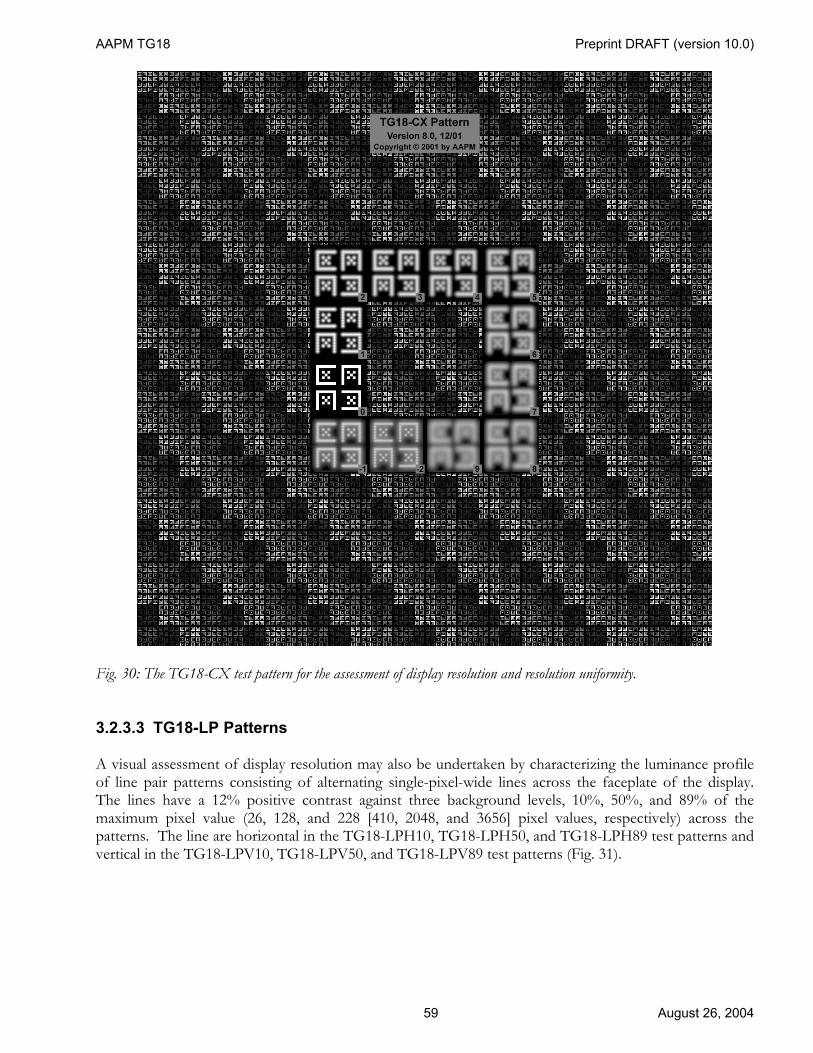
AAPM TG18 Preprint DRAFT (version 10.0)
59 August 26, 2004
Fig. 30: The TG18-CX test pattern for the assessment of display resolution and resolution uniformity. 3.2.3.3 TG18-LP Patterns A visual assessment of display resolution may also be undertaken by characterizing the luminance profile of line pair patterns consisting of alternating single-pixel-wide lines across the faceplate of the display. The lines have a 12% positive contrast against three background levels, 10%, 50%, and 89% of the maximum pixel value (26, 128, and 228 [410, 2048, and 3656] pixel values, respectively) across the patterns. The line are horizontal in the TG18-LPH10, TG18-LPH50, and TG18-LPH89 test patterns and vertical in the TG18-LPV10, TG18-LPV50, and TG18-LPV89 test patterns (Fig. 31).

AAPM TG18 Preprint DRAFT (version 10.0)
60 August 26, 2004
Fig. 31: The TG18-LPV50 test pattern (magnified and contrast-enhanced) as an example of TG18-LP patterns. 3.2.4 Noise Test Patterns 3.2.4.1 TG18-AFC Pattern A test pattern consisting of a series of small boxes containing a small, low contrast feature in one quadrant of each box provides a useful test of the signal-to-noise characteristics of a system. A test pattern of this type has previously been employed for display evaluation (Hangiandreou 1999). While the sensitivity of this test pattern to changes in electronic display performance variables was found to be limited, it is a useful pattern to evaluate the fixed pattern noise associated with mixed phosphors in CRT systems. The TG18-AFC is divided into four quadrants containing multiple square target areas. Each target area contains a square target near one of the corners. For a 12-bit, 1024 x 1024 pattern, the quadrants have targets with contrast values of +32, 48, 64, and 96 digital driving levels and corresponding target sizes of 2, 3, 4, and 6 pixels (Fig. 32). The contrast and size are scaled accordingly for 2048 x 2048 and 8-bit versions of the pattern. Five larger areas with varying target sizes and contrasts are also included.

AAPM TG18 Preprint DRAFT (version 10.0)
61 August 26, 2004
Fig. 32: The TG18-AFC test pattern for the visual assessment of display noise. The pattern is contrast-enhanced to illustrate its features. 3.2.4.2 TG18-NS Pattern For the quantitative assessment of display noise, three patterns will be utilized: TG18-NS10, TG18-NS50, and TG18-NS89. The patterns are identical to the RH and RV patterns described above with the only difference being the absence of the single line at the center of the measurement areas (Fig. 28) (see Section 3.2.3.1). 3.2.5 Glare Test Patterns 3.2.5.1 TG18-GV and TG18-GVN Patterns For the visual assessment of display veiling glare, a combination of two test patterns is used. The TG18-GV pattern consists of a black background (zero pixel value) and a central white (maximum pixel value)

AAPM TG18 Preprint DRAFT (version 10.0)
62 August 26, 2004
region of 300 pixel radius. At the center of the white region, there exists a dark, 15-pixel radius circle with a zero pixel value background and five low-contrast circles, each 4.5 pixel in radius. The low-contrast objects have pixel values equal to 2, 4, 6, 8, and 10 [32, 64, 96, 128, and 160] (Fig. 33). The test pattern TG18-GVN is identical to TG18-GV except that the large-diameter white circle is replaced with a black circle creating a completely back pattern except for the presence of low-contrast targets. To use these test patterns, a mask device must be used to block the bright portion of the image from view so as not to alter the visual adaptation of the observer. In the use of these patterns, the pattern should not fill the display area, rather the display size must be adjusted so that the diameter of the 300-pixel white region is 20 cm.
Fig. 33: TG18-GV test pattern with a 15 pixel radius central black region containing five low contrast objects. To make the target visible in this illustration, the central target area is magnified and contrast enhanced in the lower-right corner of the figure.

AAPM TG18 Preprint DRAFT (version 10.0)
63 August 26, 2004
3.2.5.2 TG18-GQ and TG18-GA Patterns These patterns are used for quantitative assessment of veiling glare. The TG18-GQ pattern is identical to the TG18-GV except in that it lacks the central low-contrast objects. Two variants of this pattern are TG18-GQN and TG18-GQB. In the former, the white circle is eliminated creating a completely back pattern. In the latter, the central black circle is eliminated. Similarly, the TG18-GAr are a set of eight test patterns that are identical to TG18-GQ except in that the radius of the central black circle is varied as r = 3, 5, 8, 10, 15, 20, 25, and 30 pixels, thus TG18-GA03 to TG18-GA30 (Fig. 34). Note that TG18-GA15 is identical to TG18-GQ. The patterns should be displayed such that the white region has a diameter of 20 cm.
(a) (b)
Fig. 34: The TG18-GA30 (a) and TG18-GQB (b) test patterns. 3.2.6 Anatomical Test Images In addition to geometric test patterns described above, a number of reference anatomical images are recommended for overall evaluation of display quality. Four specific images are recommended corresponding to a PA chest radiograph (TG18-CH), a knee radiograph (TG18-KN), and two digital mammograms (TG18-MM1 and TG18-MM2).

AAPM TG18 Preprint DRAFT (version 10.0)
64 August 26, 2004
Fig. 35: The TG18-CH anatomical image. 3.2.6.1 TG18-CH Image TG18-CH is a PA chest radiograph acquired with a computed radiography system (CR-400, Eastman Kodak Company) at an exposure index of 1740 (the original image is the courtesy of Eastman Kodak Company) (Fig. 35). The image has been processed for gray-scale rendition and equalization according to an optimum processing scheme for chest radiographs (Flynn 2001). The following are the comments of an experienced chest radiologist on the image: “There is moderate hyperinflation. Projected just above the left diaphragmatic leaf there is a 4 mm opacity that appears to be partially calcified. This could be a part of costal cartilage or more likely a pulmonary nodule. There are small apical caps on each side. There is a fine curved linear fissure in the left mid chest. Pulmonary vessels, heart and aorta are unremarkable. There is minor degenerative change in the spine and minimal scoliosis convex to the right.”

AAPM TG18 Preprint DRAFT (version 10.0)
65 August 26, 2004
3.2.6.2 TG18-KN Image TG18-KN (Fig. 36) is a lateral knee radiograph acquired with a selenium-based direct digital radiography system (DR-1000, Direct Ray Corp., the original image is the courtesy of K Kohm, Eastman Kodak Company). The image has been processed according to the manufacturer’s default processing for knee radiographs. The fine trabecular patterns in the femur, proximal tibia, and the cortical shell of the patella require good display resolution for proper visualization.
Fig. 36: The TG18-KN anatomical image. 3.2.6.3 TG18-MM1 and TG18-MM2 Images For the purpose of TG18, two digital mammograms were selected to represent the wide variation in the mammographic presentations. TG18-MM1 and TG18-MM2 (Fig. 37) are 2k regions selected from two cranial caudal (CC) view digital mammograms acquired with a full-field digital mammography system

AAPM TG18 Preprint DRAFT (version 10.0)
66 August 26, 2004
(Selenia, Lorad, the original images are the courtesy of the Lorad Division of Hologic, Inc.). The images were processed according to the manufacturer’s default processing for such exams. The following are the comments of an qualified mammographer on the images:
TG18-MM1: “The breast parenchyma is heterogeneously dense. In the caudal and slightly medial breast, there is a cluster of pleomorphic calcifications extending linearly into the subareolar region indicative of invasive ductal carcinoma and DCIS. There are also subtle architectural distortions. A biopsy marking clip is present in the central breast.” TG18-MM2: “The mammograms is a predominantly fatty-replaced breast tissue with an approximately 10 mm highly suspicious, irregularly-shaped mass with spiculated margins in the medial left breast in the middle depth, indicative of invasive ductal carcinoma.”
(a)

AAPM TG18 Preprint DRAFT (version 10.0)
67 August 26, 2004
(b)
Fig. 37: The TG18-MM1(a) and TG18-MM2 (b) anatomical images. 3.3 Software Though not essential, software tools can facilitate the performance assessment of display devices. They include software for semi-automated generation of test patterns, processing software for assessment of resolution and noise, and spreadsheets for recording and manipulating the evaluation results. Some tools are provided along with the electronic copy of this report. 3.3.1 Pattern-generator Software Using the pattern descriptions given in Appendix III, graphics software can be used to generate the desired test patterns. An advantage of this approach is that a large number of variable patterns can be
AAPM TG18 Preprint DRAFT (version 10.0)
68 August 26, 2004
easily generated. However, it is recommended that the patterns be viewed with the clinical software that is used to display actual medical images. The assistance of the PACS vendor (or hospital information systems personnel) will be needed to permanently transfer these images into the PACS database, where they may be viewed by the clinical application. Otherwise, care must be exercised to assure that both the graphics software and the clinical software access the digital driving level buffer in the same way. In some instances, the medical display application might apply luminance transformations that are different than those used for the graphic display application. An advantage of the test patterns in DICOM format is that they can be viewed by medical display software directly. A number of public domain programs are available for display performance assessment, some of which are able to dynamically generate and display TG18 test pattern on a display device. DisplayTools6 is a program for Windows that provides separate graphic routines to present test patterns for evaluating luminance response, resolution, noise, veiling glare, and the contrast transfer characteristics associated with various target objects. SofTrack7 is a Unix-based public domain program that can be used to quantify and track the performance of a softcopy display system over time. There are also a number of public domain software packages for general display of test patterns (e.g., ImageJ,8 Osiris,9 and eFilm10). 3.3.2 Processing Software Software tools are needed to process images captured by the CCD camera for the modulation transfer function and noise power spectrum (NPS) measurements. Programs can be developed based on the processing descriptions given in the assessment sections of this report. Otherwise, some commercial programs for image quality assessment can be adapted for these tasks (e.g., RIT11). 3.3.3 Spreadsheets Spreadsheets can be used for recording the results of the evaluation of a display device. In addition to recording, formatting and reporting, the spreadsheets can contain macros for computation of luminance response, luminance uniformity, color uniformity, and spatial accuracy. 3.4 Initial Steps for Display Assessment 3.4.1 Availability of Tools Before starting the tests, the availability of the applicable tools and test patterns should be verified. Lists of desired tools for acceptance testing and quality control purposes are provided in Sections 5 and 6. The TG18 test patterns should be stored on the display workstation during installation or otherwise be accessible from a network archive. This approach ensures that the same pattern will be utilized for all future testing. Network access to test patterns is especially useful in this regard. For any medical display system, it would be the responsibility of the manufacturer to make the TG18 test patterns available on the system. If unable to locate these patterns, the user should consult with the manufacturer’s representative, as they are sometimes stored in service directories. If the patterns cannot be loaded and displayed, the user may utilize other quality control test patterns that might be available on the system. Alternatively, digital test patterns supplied via a laptop computer or a video test pattern generator may be utilized, with 6 Henry Ford Health System, Detroit, MI 7 National Information Display Laboratory, Sarnoff Corp, Princeton, NJ 8 http://rsbweb.nih.gov/ij/ 9 http://www.expasy.ch/UIN/ 10 http://www.efilm.ca 11 RIT, Radiological Imaging Technology, Colorado Springs, CO, www.radimage.com

AAPM TG18 Preprint DRAFT (version 10.0)
69 August 26, 2004
an understanding that the tests will not be evaluating the full display system, rather only its display device compartment. In the case of a “closed” or legacy system, depending on the kind of patterns available on the system, some of the tests recommended in this report might not be possible or might need major modifications. Therefore, it would be essential that the vendors of such “closed” display systems permanently install the TG18 test patterns on their systems. Appendix I provides some guidelines for evaluation of a “closed” display system. 3.4.2 Display Placement Prior to testing, the proper placement of a display device should be verified and adjustments made as appropriate. In the placement of a display device, the following should be considered:
1. Display devices should always be positioned to minimize specular reflection from direct light sources such as ceiling lights, film illuminators, or surgical lamps. The reflection of such light sources should not be observed on the faceplate of the display in the commonly used viewing orientations.
2. Many display devices, such as CRTs, are affected by magnetic fields; they should not be placed in an area with strong magnetic fields (i.e., vicinity of MRI scanners), unless properly shielded.
3. Displays should be placed ergonomically to avoid neck and back strain at reading level with the center of the display slightly below eye level.
3.4.3 Start-up Procedures Before testing a display device, the device should be warmed up for approximately 30 minutes prior to evaluation so that the electronics can stabilize. In addition, the general system functionality should be verified by a quick review of the TG18-QC test pattern. The pattern should be evaluated for distinct visibility of the 16 luminance steps, the continuity of the continuous luminance bars at the right and left of the pattern, the absence of gross artifacts (such as tearing or smearing of edges, excessive blur, or flickering), and the proper size and positioning of the active display area. The pattern should be of proper size and centered in the active area of the device, and all borders of the pattern should be visible. Any adjustments to vertical and horizontal size must be made prior to performing the luminance measurements. Dust and smudges on the face of the display will absorb, reflect, or refract emitted light possibly resulting in erroneous test results. In addition, newly installed displays are sometimes covered with a protective plastic layer, which upon removal can leave residual marks on the faceplate. Before testing a display device, the cleanliness of the faceplate should be verified. If the faceplate is not clean, it should be cleaned following the manufacturer’s recommendations. In the absence of such recommendations, specialized display cleaning products and lint-free cloth can be used for this purpose. To avoid introducing cleaning solution into the display case, the cleaning solution should be sprayed on the towel instead of directly onto the face of the display device. 3.4.4 Ambient Lighting Level The artifacts and loss of image quality associated with reflections from the display surface depend on the level of ambient lighting. As shown in Table 3, illumination of display device surfaces in various locations of a medical facility varies by over two orders of magnitude.
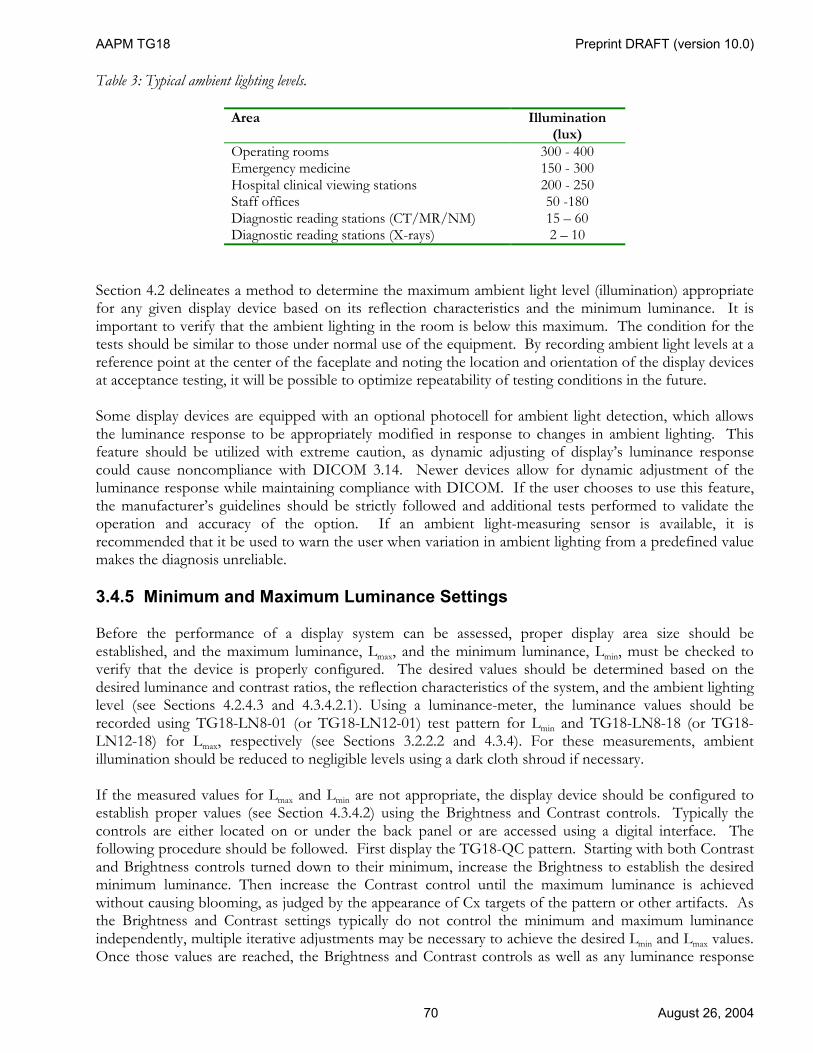
AAPM TG18 Preprint DRAFT (version 10.0)
70 August 26, 2004
Table 3: Typical ambient lighting levels.
Area Illumination (lux)
Operating rooms 300 - 400 Emergency medicine 150 - 300 Hospital clinical viewing stations 200 - 250 Staff offices 50 -180 Diagnostic reading stations (CT/MR/NM) 15 – 60 Diagnostic reading stations (X-rays) 2 – 10
Section 4.2 delineates a method to determine the maximum ambient light level (illumination) appropriate for any given display device based on its reflection characteristics and the minimum luminance. It is important to verify that the ambient lighting in the room is below this maximum. The condition for the tests should be similar to those under normal use of the equipment. By recording ambient light levels at a reference point at the center of the faceplate and noting the location and orientation of the display devices at acceptance testing, it will be possible to optimize repeatability of testing conditions in the future. Some display devices are equipped with an optional photocell for ambient light detection, which allows the luminance response to be appropriately modified in response to changes in ambient lighting. This feature should be utilized with extreme caution, as dynamic adjusting of display’s luminance response could cause noncompliance with DICOM 3.14. Newer devices allow for dynamic adjustment of the luminance response while maintaining compliance with DICOM. If the user chooses to use this feature, the manufacturer’s guidelines should be strictly followed and additional tests performed to validate the operation and accuracy of the option. If an ambient light-measuring sensor is available, it is recommended that it be used to warn the user when variation in ambient lighting from a predefined value makes the diagnosis unreliable. 3.4.5 Minimum and Maximum Luminance Settings Before the performance of a display system can be assessed, proper display area size should be established, and the maximum luminance, Lmax, and the minimum luminance, Lmin, must be checked to verify that the device is properly configured. The desired values should be determined based on the desired luminance and contrast ratios, the reflection characteristics of the system, and the ambient lighting level (see Sections 4.2.4.3 and 4.3.4.2.1). Using a luminance-meter, the luminance values should be recorded using TG18-LN8-01 (or TG18-LN12-01) test pattern for Lmin and TG18-LN8-18 (or TG18-LN12-18) for Lmax, respectively (see Sections 3.2.2.2 and 4.3.4). For these measurements, ambient illumination should be reduced to negligible levels using a dark cloth shroud if necessary. If the measured values for Lmax and Lmin are not appropriate, the display device should be configured to establish proper values (see Section 4.3.4.2) using the Brightness and Contrast controls. Typically the controls are either located on or under the back panel or are accessed using a digital interface. The following procedure should be followed. First display the TG18-QC pattern. Starting with both Contrast and Brightness controls turned down to their minimum, increase the Brightness to establish the desired minimum luminance. Then increase the Contrast control until the maximum luminance is achieved without causing blooming, as judged by the appearance of Cx targets of the pattern or other artifacts. As the Brightness and Contrast settings typically do not control the minimum and maximum luminance independently, multiple iterative adjustments may be necessary to achieve the desired Lmin and Lmax values. Once those values are reached, the Brightness and Contrast controls as well as any luminance response

AAPM TG18 Preprint DRAFT (version 10.0)
71 August 26, 2004
settings should be fixed, and those calibration controls should be made inaccessible to the general user. If the measured values for Lmax and/or Lmin cannot be established within recommended limits, the display device should be serviced before testing its performance. 3.4.6 DICOM Grayscale Calibration This report recommends compliance of medical display systems with the DICOM grayscale display standard function (NEMA PS 3.14, see section 4.3 for details). Some medical imaging systems allow calibration of the luminance response of the display unit. Such systems typically allow a luminance probe to be attached to the host computer and can automatically record the measured luminance when test patterns similar to TG18-LN are displayed by the available software. The recorded data is then used to compute a lookup table for the display controller that will provide the desired (calibrated) luminance response. For such systems, the response should be calibrated at installation and at intervals recommended by the manufacturer and this report (see Section 6.2). Before testing a display device as described in the following sections, the date of the last calibration should be checked, and if it is not current, a new calibration should be performed or requested. If a new calibration is required, Lmax and Lmin should always be verified first as described above. An example calibration setup is shown in Fig. 38.
Target (10% of screen area)
Background (20% of maximum luminance)
Photometer
Fig. 38: This figure shows an example calibration using a common type of calibration system where the photometer is attached to the display card, and the software automatically performs the calibration. All that is required is to place the photometer against the display screen and run the automated program.

AAPM TG18 Preprint DRAFT (version 10.0)
72 August 26, 2004
4 Assessment of Display Performance This section describes the assessment methods for the major performance characteristics of an electronic display device. It is generally ideal to perform the tests in order in which they are discussed as some of the later tests may be influenced by parameters that are addressed in earlier tests. The methods are organized depending on their complexity as visual, quantitative, and advanced methods. Based on the extent of the display evaluation, the purpose of the evaluation, and the availability of assessment tools, a combination of the recommended methods should be considered when testing a display device. For acceptance testing and quality control evaluation, a combination of visual and quantitative tests can be used, as outlined in Sections 5 and 6. The advanced tests described here are generally not for implementation in clinical settings, rather they are meant to provide general guidelines for individuals that are interested to more comprehensively evaluate the performance of a display system. The recommendations for the expected response are based on our current state of knowledge. Clinical experience is expected to refine these recommendations in the future. 4.1 Geometric Distortions 4.1.1 Description of Geometric Distortions Geometric distortions originate from aberrations that cause the displayed image to be geometricly dissimilar to the original image (Dwyer 1993). The practical consequences of such distortions affect the relative sizes and shapes of image features, particularly for larger displays or large deflection angles. Three kinds of distortions are commonly seen in CRT displays: Departures from linearity in the form of pincushion (concave distortion), barrel (convex distortion), and skew distortions; angulation and improper aspect ratio; and non-linearity. The first two types of distortions can be observed at the horizontal and vertical edges of the active display area and are compensated by magnetic or electronic adjustments. The non-linearity distortions are distortions within the active display area, which cause local variation of image geometry, and are directly related to the quality of the deflection coils and their driving electronics. Commercial CRT displays intended for office use do not utilize the highest quality coils, while higher quality medical displays for primary interpretation have more precise windings and built-in correction circuits to control deflection to a higher degree of accuracy. Some geometric distortions can be traced to improper set up of the display controller and/or a mismatch between the aspect ratio of the display device and the controller. Display controllers have settings for pixel formats that can be either factory-installed or user-defined under software control. However, display devices often can only accommodate certain aspect ratios. For example, five-megapixel display devices often have a 5:4 aspect ratio while four-megapixel ones have a 4:3 ratio. An improper aspect ratio setting at the controller causes distortions, as squares become rectangles or vice versa. In a digitally controlled display, a return to factory settings will usually correct the basic error. Image scaling is often an option if the user wishes to re-map the video image format to cover all or as large of an area of the screen as possible. Proper aspect ratio is nearly guaranteed when one to one pixel-mapping is chosen. Image scaling in fixed pixel displays (e.g., LCDs) can result in improper aspect ratio. Magnetic fields may also cause geometric distortions in CRT devices. These are often encountered in display devices that are used in the vicinity of unshielded magnetic fields (e.g., MRI scanners). In addition to geometric distortions, magnetic fields can degrade the resolution of monochrome CRTs, and color purity in color CRTs. Electrical distribution conduits running in close proximity to the workstation or steel columns used in the building structure can produce large magnetic fields. A simple test to identify

AAPM TG18 Preprint DRAFT (version 10.0)
73 August 26, 2004
magnetic distortions is to rotate the display by ninety degrees (e.g., from facing east to facing south) and see if the distortions change. 4.1.2 Quantification of Geometric Distortions Geometric distortion can be quantified in terms of the amount of spatial angulation or two-dimensional displacement in a geometric test pattern, and be expressed in terms of pixels, spatial dimensions (i.e., mm), or percent differences in various directions or areas. Some of the quantification methods are detailed in the following section. 4.1.3 Visual Evaluation of Geometric Distortions 4.1.3.1 Assessment Method The geometric distortion of a display system can be visually ascertained using either the TG18-QC or the TG18-LPV/LPH test pattern. The patterns should be maximized to fill the entire usable display area. For displays with rectangular display areas, the patterns should cover at least the narrower dimension of the display area and be placed at the center of the area used for image viewing. The pattern(s) should be examined from a viewing distance of 30 cm. The linearity of the pattern should be checked visually across the display area and at the edges. Some bezels, in conjunction with the curvature of the CRT faceplate, can create an illusion of non-linearity and should not be used as a visual reference for a straight edge. 4.1.3.2 Expected Response The patterns should appear straight without significant geometric distortions and should be properly scaled to the aspect ratio of the video source pixel format so that grid structure of the TG18-QC test pattern appears square. The lines should appear straight indicative of proper linearity without any curvature or waviness. Some small barrel and pincushion distortions are normal for CRT devices but should not be excessive. For the TG18-LPV and TG18-LPH patterns, in addition to straightness, the lines should appear equally spaced. 4.1.4 Quantitative Evaluation of Geometric Distortions 4.1.4.1 Assessment Method Spatial accuracy for geometric distortions can be quantified using the TG18-QC test pattern. The pattern should be maximized to fill the entire display area. For displays with rectangular display areas, the pattern should cover at least the narrower dimension of the display area and be placed at the center of the area used for image viewing. Using a straight edge as a guide for a best fit and with the aid of a flexible plastic ruler, distances should be measured in square areas in the horizontal and vertical directions in each of the four quadrants of the pattern and within the whole pattern (Fig. 39). It is important to assure the locations of the cross hatches be viewed perpendicular to the display’s faceplate. In each quadrant, between quadrants, and within the whole pattern, the maximum percent deviations between the measurements in each direction, and between the measurements in the horizontal and vertical directions should be determined. The percentages should be calculated in relation to the smallest of the values being compared. For facilities that use a large number of displays of the same model, a transparent template is useful and can be marked to delineate the maximum acceptable distortion. 4.1.4.2 Expected Response

AAPM TG18 Preprint DRAFT (version 10.0)
74 August 26, 2004
For primary class devices, the maximum spatial deviations between orthogonal measurements should not exceed 2% within either direction and between directions, within each quadrant and within the whole pattern. The percent deviation across quadrants should also not exceed 2%. The corresponding criterion for secondary class devices is 5%. In evaluating the performance of CRT display, it should be considered that the control of horizontal deflection via phase and linearity adjustments is different in the left and right side of the display. Therefore, it is possible for the distortion to be different on the two sides of the display. If a display device does not meet the above criteria, adjustments should be made to the distortion control of the device. Often, as the area of the display is increased or decreased, the luminance will also increase or decrease in a non-linear fashion. Therefore, it is important to make and finalize such adjustment prior to testing and adjustments of the display luminance characteristics. In addition, if a display workstation contains more than one display device, it is important to have the vertical and horizontal sizes of the active areas carefully matched within 2%. This facilitates the subsequent matching of their luminance response characteristics.
Fig. 39: The spatial measurements for the quantitative evaluation of geometric distortions using the TG18-QC test pattern. The small squares with dashed lines (- - -) define the four quadrants of the pattern and the large square at the center encompassing the luminance patches is the one to be used for geometric distortion characterization within the whole image. 4.1.5 Advanced Evaluation of Geometric Distortions 4.1.5.1 Assessment Method Advanced measurements of a display’s response can be obtained with a precision digital camera using the methods for curvature and linearity distortion characterizations described in a recent VESA standard report (VESA 2001). These measurements are simple in principle but require a complex laboratory setting.

AAPM TG18 Preprint DRAFT (version 10.0)
75 August 26, 2004
Vertical and horizontal lines are displayed along the edges of the addressable screen and along both the vertical and horizontal centerlines (major and minor axes). A digital camera is used to measure the position of the centroid of each line luminance profile at 20 equally-spaced points along each displayed line. A precise x-y positioner is needed to accurately center the camera on the display. Linear regression is applied to numerically fit a straight line through the measured coordinates of each displayed line. If large-area pincushion distortions are being quantified, a 2nd-order polynomial curve is also fitted to each line. The curvature of each line is computed as the peak-to-peak deviation of the measured coordinates from the corresponding points along the fitted line. For vertical lines, the curvature error is expressed as a percentage of the total width of the screen. Similarly, for horizontal lines, the curvature error is expressed as a percentage of the total height of the screen. For non-linearity distortions, the line-pair patterns of single-pixel horizontal lines and single-pixel vertical lines are used. Lines are equally spaced and the spacing must be constant and equal to 5% of screen width or height, to the nearest addressable pixel. The digital camera is used to measure screen (x, y) coordinates of points where the vertical lines of the pattern intersect the horizontal centerline of the screen and where the horizontal lines intersect the vertical centerline. The difference between the greatest and the least spacing measured between the lines is calculated as an indicator of non-linearity. The vertical non-linearity is quantified as a percentage of total screen height, while that for the horizontal is quantified as a percentage of total screen width. 4.1.5.2 Expected Response No standards are available at this time for advanced geometric distortion characteristics of medical display devices. 4.2 Display Reflection 4.2.1 Description of Display Reflection Ideally, the luminance distribution on a display surface would only be associated with light generated by the device, i.e., the image information. In practice, ambient room light reflects off the surface of a device and adds luminance to the displayed image. The performance of a display device is highly dependent on the reflection characteristics of the device. Therefore, it is important to evaluate this response at the outset and, based on that, to determine the maximum level of ambient illumination that can be used in the reading area without compromising the display presentation. Control of ambient light conditions also allows more effective visual adaptation by the observer while interpreting medical images. Broadly characterized, the reflections can have two general forms: specular and diffuse. Specular reflection is said to occur when the angle of the incident light rays equals that of the emerging rays as dictated by geometric optics. Such a reflection produces a virtual image of the source as would a mirror. In diffuse reflection, the light is randomly scattered out of the specular direction and no virtual image of the source is produced. There are two types of diffuse reflection. One occurs when the scattering angles of the emergent light are broadly distributed and poorly correlated with the angle of the incident light, such as with a Lambertian reflector where the direction of the incident light has little affect on the observed reflected luminance (e.g., matte wall paint). The other type of diffuse reflection occurs when light is randomly scattered into a narrow distribution of angles in the vicinity of the specular direction. Some have called this type of reflection haze. Haze requires evaluation of the emerging light distribution as a function of the incident light angle. Haze reflections are particularly notable in AMLCD flat panel

AAPM TG18 Preprint DRAFT (version 10.0)
76 August 26, 2004
displays, especially those used for laptop computers. For further information and measurement methods for haze, consult the VESA standards (VESA 2001). 4.2.1.1 Specular Reflection Characteristics Specular reflection produces a mirror image of the light source, although surface roughness of the display that produces haze may blur the reflected image. Specular reflection of brightly lit objects or light sources adds structured, position-dependent patterns to the image, which can interfere with the interpretation of features. Illuminated objects in a room will appear as a reflection having a luminance proportional to the illumination of the object for purely specular reflections. Anti-glare (AG) treatments that produce random microstructure on the surfaces (e.g., a slight etching of the faceplate glass for CRTs) produce haze that can manifest itself as a fuzzy ball of light surrounding the specular images of sources. For some applications the haze-blurring of the specular image assists in reducing the confusion produced from a specular reflection (the mirror-like image is no longer distinct). Anti-reflective (AR) glass coatings, darkening of the faceplate glass, and the reduction of ambient light levels can also reduce the visibility of these reflections (Fig. 40).
Phosphor
Faceplateglass
Rasin
Glass Substrate
AR Multicoating
Electron beam
Emerging light ~27% of original
Reflection specular and diffuse
~7% of original
Ambient lighting
Fig. 40: Longitudinal cut through a high contrast CRT with absorptive glass illustrating light absorption in the faceplate of a CRT. 4.2.1.2 Diffuse Reflection Characteristics Diffuse Lambertian reflection (to distinguish from diffuse haze reflection) produces a uniform luminance on the display device with no visually detectable structured patterns. The added luminance reduces contrast in the displayed image by altering the relative luminance change associated with specific features in the image. The contrast reduction is predominantly in the dark areas of an image since those areas are more prone to relative changes in luminance. Display devices that generate light within an emissive structure, such as CRTs, are designed to promote transport of light out of the structure. As a consequence, they typically have higher Lambertian-like diffuse reflectance than transmissive displays,

AAPM TG18 Preprint DRAFT (version 10.0)
77 August 26, 2004
including film and LCDs. CRT display devices extensively diffuse incident light in the phosphor layer and may have excessive diffuse reflection unless these are damped by light absorption in the glass faceplate or the phosphor material (Fig. 40), which, in turn, reduces the luminance of the device. The white phosphor in a monochrome CRT device produces higher diffuse reflectance than color phosphors or black matrix material used in color CRT devices (Fig. 41).
Fig. 41: Diffuse and specular reflections are illustrated for a color (left) and a monochrome (right) display device with the power off. Reduced diffuse reflections are seen in the color display device due to the black matrix emissive structure. Reduced specular reflections are seen in the monochrome display device due to an improved anti-reflective coating. 4.2.2 Quantification of Display Reflection 4.2.2.1 Specular Reflection Characteristics Specular reflections can be described by a dimensionless specular reflection coefficient Rs which is the ratio of the apparent luminance of a reflected light source to the actual luminance of the source.12 Evaluation of Rs is done using an external light source shining on a display device. A telescopic photometer is then directed at the display device. The display should be in the power-save mode or turned off. Since medical images are observed with the viewer most often directly in front of the device, Rs is appropriately measured with the light source at about 15 degrees from the surface normal. The light source should be relatively small in diameter to minimize the illumination of the display device and consequent diffuse reflection yet large enough to produce an image area larger than the response region of the telescopic photometer. Ideally, the light source should subtend 15° from the center of the display and be placed at 15° from the normal (Kelley 2002).
12 Note that in CIE terminology, the specular reflection coefficient referred to as the reflectance with a symbol of ρ (or ρs).

AAPM TG18 Preprint DRAFT (version 10.0)
78 August 26, 2004
4.2.2.2 Diffuse Reflection Characteristics Diffuse reflections are described by the diffuse reflection coefficient Rd, which relates the induced luminance to the ambient illumination of the display surface.13 The units of Rd are thus those of luminance per illuminance (cd/m2 per lux) or sr-1. A telescopic photometer and an illuminance-meter are used in conjunction with a display illuminator. For comparable measurements, the illumination conditions need to be standardized. Both the wavelength spectrum of the illumination source and the incident angular distribution need to be comparable to the clinical situation. Fluorescent lamps provide a spectrum similar to room lighting, and small fluorescent lamps may be placed in a box covering the display surface (Flynn 1999a) (see Fig. 19). Note that this type of measurement may not be robust in the general case of a FPD with a strongly diffusing front surface. To the extent that some diffuse luminance from ambient lighting is always present in reading areas, it is important that the luminance calibration of the display device boost the contrast in dark regions to account for the effects of diffuse reflection. When properly calibrated, the contrast of an object seen in a dark region should be the same as for an equivalent object seen in a bright region when typical ambient illumination is present. 4.2.3 Visual Evaluation of Display Reflection 4.2.3.1 Assessment Method 4.2.3.1.1 Specular Reflection Characteristics An effective and simple visual test is to observe a display device, with the display in the power-save mode or turned off, from a position typical of that for interpreting images. The ambient lighting in the room should be maintained at levels normally used. The display’s faceplate should be examined at a distance of about 30-60 cm within an angular view of ±15 degrees for the presence of specularly reflected light sources or illuminated objects. Patterns of high contrast on the viewer’s clothing are common sources of reflected features. 4.2.3.1.2 Diffuse Reflection Characteristics The effect of diffusely reflected light on image contrast may be observed by alternately viewing the low-contrast patterns in the TG18-AD test pattern in near total darkness and in normal ambient lighting, determining the threshold of visibility in each case. A dark cloth placed over both the display device and the viewer may be helpful for establishing near total darkness. The pattern should be examined from a viewing distance of 30 cm. 4.2.3.2 Expected Response 4.2.3.2.1 Specular Reflection Characteristics In examining the display’s faceplate under normal ambient light conditions, no specularly reflected patterns of high contrast objects should be seen. If light sources such as that from a film illuminator or window are seen, the position of the display device in the room is not appropriate. If high contrast patterns such as an identification badge on a white shirt or a picture frame on a light wall are seen, the ambient illumination in the room should be reduced.
13 Note that in CIE terminology, the diffuse reflection coefficient referred to as the luminance coefficient with a symbol of q.

AAPM TG18 Preprint DRAFT (version 10.0)
79 August 26, 2004
4.2.3.2.2 Diffuse Reflection Characteristics The threshold of visibility for low-contrast patterns in the TG18-AD test pattern should not be different when viewed in total darkness and when viewed in ambient lighting conditions. If the ambient lighting renders the “dark-threshold” not observable, the ambient illuminance on the display surface is causing excess contrast reduction, and the room ambient lighting needs to be reduced. 4.2.4 Quantitative Evaluation of Display Reflection 4.2.4.1 Assessment Method 4.2.4.1.1 Specular Reflection Characteristics The specular reflection coefficient for a display device can be measured with a small diameter source of diffuse white light as described in Section 3.1.3. The display should be in the power-save mode or turned off. The light source, subtending 15° from the center of the display, should be positioned d1 centimeters from the center of the display and be pointed toward the center at an angle of 15° from the surface normal. The reflected luminance of the light source should then be measured with a telescopic photometer from a distance of d2 centimeters from the center of the display and similarly angled at 15° to the normal. Finally, the directly viewed luminance of the light source should be measured with the same photometer from a distance of d1+d2 centimeters. The specular reflection coefficient Rs is the ratio of the reflected spot luminance to the directly viewed spot luminance. All measurements should be made in a dark room. It should be noted that due to curvature of the display surface the Rs values measured for a display device may be different from that expected for the surface coating material, which is normally quoted for a flat surface measurement. This can magnify the apparent size of the reflected test illuminator and reduce the observed luminance. Since the effects of the curvature are relevant to the final image quality, it is recommended that no correction of measurement results be made to account for surface curvature. 4.2.4.1.2 Diffuse Reflection Characteristics The diffuse reflection coefficient may be measured using standardized illumination of the display with the illuminator device described in Section 3.1.3 (Fig. 19). The display should be in the power-save mode or turned off. The lamps should only indirectly illuminate the faceplate, ideally by placing them on the sides behind the faceplate plane in a semi-hemispherical illumination geometry (Fig. 19b-c). The illuminance should then be measured in the center of the display device using a probe placed on the center of the display surface. The sensitive area of the meter should be held vertically to measure the illuminance incident on the display faceplate. The induced luminance at the center of the display surface should then be measured with a telescopic photometer. The luminance measurement should be made through the small aperture at the back of the containment device so as to not perturb the reflective characteristics of the containment structure. The viewing aperture must be located from 8° to 12° off to the side from the normal so as to not interfere with the measurement result. The diffuse reflection coefficient, Rd, is computed as the ratio of the luminance to the illuminance in units of sr-1.
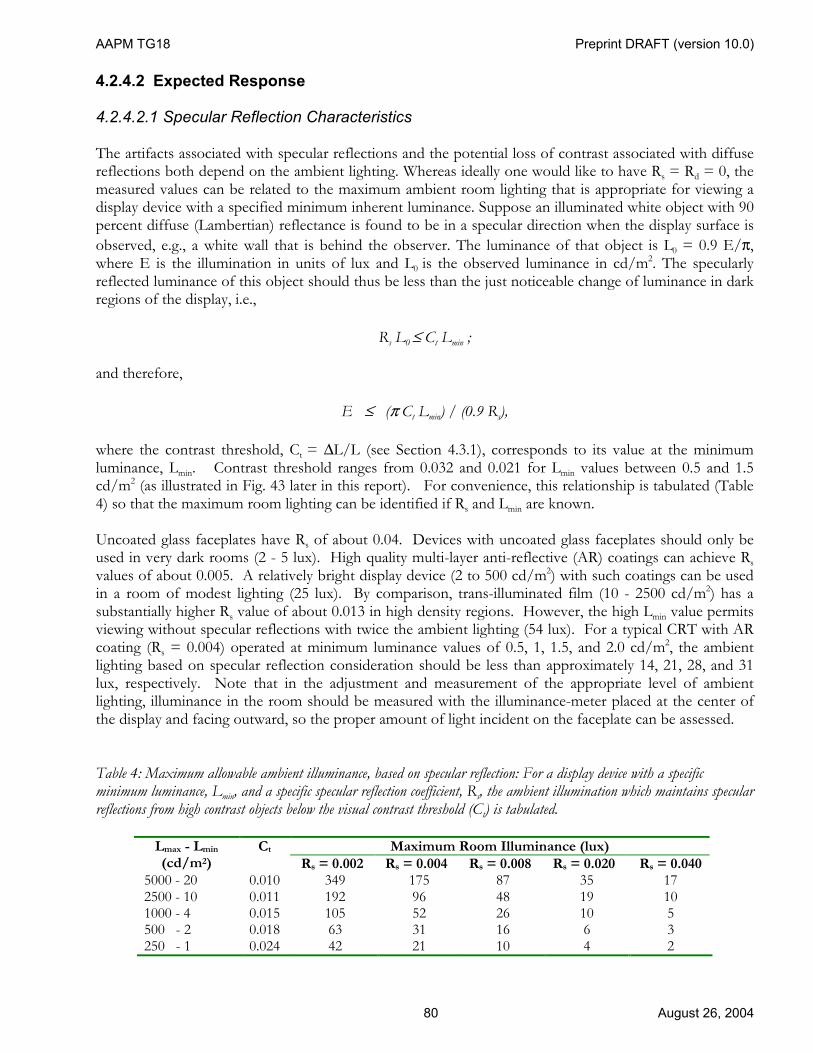
AAPM TG18 Preprint DRAFT (version 10.0)
80 August 26, 2004
4.2.4.2 Expected Response 4.2.4.2.1 Specular Reflection Characteristics The artifacts associated with specular reflections and the potential loss of contrast associated with diffuse reflections both depend on the ambient lighting. Whereas ideally one would like to have Rs = Rd = 0, the measured values can be related to the maximum ambient room lighting that is appropriate for viewing a display device with a specified minimum inherent luminance. Suppose an illuminated white object with 90 percent diffuse (Lambertian) reflectance is found to be in a specular direction when the display surface is observed, e.g., a white wall that is behind the observer. The luminance of that object is L0 = 0.9 E/π, where E is the illumination in units of lux and L0 is the observed luminance in cd/m2. The specularly reflected luminance of this object should thus be less than the just noticeable change of luminance in dark regions of the display, i.e.,
Rs L0 ≤ Ct Lmin ; and therefore,
E ≤ (π Ct Lmin) / (0.9 Rs), where the contrast threshold, Ct = ∆L/L (see Section 4.3.1), corresponds to its value at the minimum luminance, Lmin. Contrast threshold ranges from 0.032 and 0.021 for Lmin values between 0.5 and 1.5 cd/m2 (as illustrated in Fig. 43 later in this report). For convenience, this relationship is tabulated (Table 4) so that the maximum room lighting can be identified if Rs and Lmin are known. Uncoated glass faceplates have Rs of about 0.04. Devices with uncoated glass faceplates should only be used in very dark rooms (2 - 5 lux). High quality multi-layer anti-reflective (AR) coatings can achieve Rs values of about 0.005. A relatively bright display device (2 to 500 cd/m2) with such coatings can be used in a room of modest lighting (25 lux). By comparison, trans-illuminated film (10 - 2500 cd/m2) has a substantially higher Rs value of about 0.013 in high density regions. However, the high Lmin value permits viewing without specular reflections with twice the ambient lighting (54 lux). For a typical CRT with AR coating (Rs = 0.004) operated at minimum luminance values of 0.5, 1, 1.5, and 2.0 cd/m2, the ambient lighting based on specular reflection consideration should be less than approximately 14, 21, 28, and 31 lux, respectively. Note that in the adjustment and measurement of the appropriate level of ambient lighting, illuminance in the room should be measured with the illuminance-meter placed at the center of the display and facing outward, so the proper amount of light incident on the faceplate can be assessed. Table 4: Maximum allowable ambient illuminance, based on specular reflection: For a display device with a specific minimum luminance, Lmin, and a specific specular reflection coefficient, Rs, the ambient illumination which maintains specular reflections from high contrast objects below the visual contrast threshold (Ct) is tabulated.
Maximum Room Illuminance (lux) Lmax - Lmin (cd/m2)
Ct Rs = 0.002 Rs = 0.004 Rs = 0.008 Rs = 0.020 Rs = 0.040
5000 - 20 0.010 349 175 87 35 17 2500 - 10 0.011 192 96 48 19 10 1000 - 4 0.015 105 52 26 10 5 500 - 2 0.018 63 31 16 6 3 250 - 1 0.024 42 21 10 4 2

AAPM TG18 Preprint DRAFT (version 10.0)
81 August 26, 2004
4.2.4.2.2 Diffuse Reflection Characteristics The luminance from diffuse reflections adds to that produced by the display device. The ambient illumination produces a luminance of Lamb = Rd E, where E is ambient illuminance on the display surface, and Rd is the diffuse reflection coefficient in units of cd/m2 per lux or 1/sr. In the dark areas of a low-contrast image, the change in luminance, ∆Lt, will produce a relative contrast of ∆Lt/(Lmin + Lamb). For some devices, the luminance response can be calibrated to account for the presence of a known amount of luminance from ambient lighting, Lamb, and produce equivalent contrast transfer in both dark and bright regions. However, if Lamb is sufficiently large in relation to Lmin, even if the device has a high contrast ratio, the overall luminance ratio of the device is compromised. For primary class display devices, it is recommended that Lamb be maintained at less than 0.25 of Lmin, Lamb < 0.25 Lmin, or that the illuminance E be restricted to:
E ≤ (0.25 Lmin) / Rd . This insures that the contrast in dark regions observed with ambient illumination will be at least 80% of the contrast observed in near total darkness. Table 5 identifies the ambient lighting for which Lamb is 0.25 of Lmin as a function of Rd and Lmin. For a typical CRT with AR coating (Rd = 0.02 sr-1) operated at minimum luminance values of 0.5, 1, 1.5, and 2.0 cd/m2, the ambient lighting based on diffuse reflection consideration should be less than approximately 7, 12, 19, and 25 lux, respectively. Note that in situations in which the level of ambient lighting can be strictly controlled and taken into account in the luminance calibration of the display device, a larger Lamb can be tolerated (Lamb < Lmin/1.5) as noted in section 4.1xxx. Note than in the adjustment and measurement of the appropriate level of ambient lighting, illuminance in the room should be measured with the illuminance-meter placed at the center of the display facing outward, so the proper amount of light incident on the faceplate can be assessed. Table 5: Maximum room lighting based on diffuse reflection: For a display device with a specific minimum luminance, Lmin, and a specific diffuse reflection coefficient, Rd, in units of cd/m2 per lux or 1/sr, the ambient illumination which maintains 80% contrast in dark regions is tabulated. The maximum room illuminance is calculated as 0.25Lmin / Rd.
Maximum Room Illuminance (lux) Lmax - Lmin (cd/m2) Rd = 0.005 Rd = 0.010 Rd = 0.020 Rd = 0.040 Rd = 0.060 5000 - 20 1000 500 250 125 83 2500 - 10 500 250 125 62 42 1000 - 4 200 100 50 25 17 500 - 2 100 50 25 12 8 250 - 1 50 25 12 6 4
4.2.5 Advanced Evaluation of Display Reflection 4.2.5.1 Assessment Method 4.2.5.1.1 Specular Reflection Characteristics The specular reflection coefficient of a display device with anti-reflective coatings will often vary significantly with wavelength, and specular reflection of white light will have a characteristic color

AAPM TG18 Preprint DRAFT (version 10.0)
82 August 26, 2004
determined by this filtering effect. To best describe the specular reflection characteristics of a display device, Rs should be measured as a function of wavelength over the full visible range. Measurement of Rs at six wavelengths in the visible range is adequate to report the wavelength dependence. The same light source and telescopic photometer as described above can be used for these measurements. The specific wavelength band for a measurement can be established by using thin-film, optical bandpass filters. Since these filters are designed for filtering light that is perpendicularly incident on the filter surface, they should be placed near the photometer and not in front of the light source. If the photopic filter on the telescopic photometer can be removed, some increase in sensitivity can be achieved with no impact on the value of measured Rs. Alternatively, advanced measurements can be performed using a spectrometer. 4.2.5.1.2 Diffuse Reflection Characteristics While the test method described above under Quantitative Tests is adequate for most field measurements, inter-comparison of different devices requires more standardized illumination. The angular distribution of the incident light can affect the diffuse reflection coefficient, particularly for flat panel devices. For advanced measurements, which can probably only be performed in laboratory settings, the illumination method advocated by NIST is recommended (Kelley 2001). For devices having complex angular distributions for diffusely reflected light, measurement of the bi-directional reflectance distribution function provides a more complete description of diffuse reflection. Methods to measure this function are described by VESA (VESA 2001, Section A217). 4.2.5.2 Expected Response The criteria for the quantitative evaluations described above with respect to the relations between reflection coefficients and luminance apply also to the advanced measurement methods. In the case of specular reflections, the advanced methods provide an understanding of possible wavelength dependence, which is seen as a color shift in the reflected patterns. Good multi-layer AR coatings will achieve Rs values of less than 0.005 for wavelengths from 450 to 680 nm and substantially lower values from 500 to 600 nm. In the case of diffuse reflections, the advanced methods provide a more accurate measure of Rd, which permits valid inter-comparison of results obtained at different centers. 4.3 Luminance Response 4.3.1 Description of Luminance Response The luminance response of a display device refers to the relationship between displayed luminance and the input values of a standardized display system (section 1.2.2). The displayed luminance consists of light produced by the display device that varies between Lmin and Lmax along with a fixed contribution from diffusely reflected ambient light (section 4.2), Lamb. (Specular contribution is neglected here as it varies significantly as a function of geometry.) In this report, Lmin, Lmax, and the intermediate luminance values, L(p), refer only to light produced by the display device as measured with negligible ambient illumination. Actual luminance values associated with specific ambient lighting are denoted using a primed variable name:
L’min = Lmin + Lamb
L’max = Lmax + Lamb

AAPM TG18 Preprint DRAFT (version 10.0)
83 August 26, 2004
L’(p) = L(p) + Lamb
The function L’(p) is the display function that relates luminance to input values over the range from L’min to L’max. The term luminance ratio specifically refers to the ratio of the maximum luminance to the minimum luminance in the presence of an ambient luminance component, L’max/L’min. The term contrast ratio is used to characterize a display device and refers to Lmax/Lmin as measured with low ambient lighting. In order to have similar image appearance with respect to contrast, all display devices should have the same luminance ratio and the same display function. Appendix II further discusses how image presentation may be adjusted to achieve equivalent appearance when the luminance ratio is not the same. Because the human visual system adapts to overall brightness, two display devices can have similar appearance with different Lmax values as long as L’max/L’min and L’(p) are the same. L’(p) is typically set to a display function. DICOM working group 11 considered a variety of alternatives for a standard display function. The final recommendation for the DICOM Grayscale Standard Display Function (GSDF) was based on the Barten model for the contrast threshold of the human visual system (Barten 1992, Barten 1993, Barten 1999) when measured using specific experimental conditions. For a small test target with sinusoidal luminance modulation, (∆L/2)sin(ω), placed on a uniform background, the Barten model predicts the threshold contrast, ∆L/2L, that is just visible. The threshold contrast is defined as the Michelson contrast, (Lhigh – Llow)/ (Lhigh + Llow) or ∆L/2L for sinusoidal modulation between +∆L/2 and -∆L/2. The GSDF is specifically based on a target size of 2 degrees relative to the observer’s eyes with a modulation of ω = 4 cycles/degree. The GSDF is defined as a table of luminance values such that the luminance change between any two sequential values corresponds to the peak-to-peak relative luminance difference, ∆L/L, predicted by the Barten model. The index values to the series of luminance values are known as JND indices since a unit change of the table index corresponds to a just noticeable difference in luminance. The DICOM standard also provides a continuous fit for the GSDF as
( ) ( ) ( ) ( )( ) ( ) ( ) ( ) ( )5432
432
10 1 jLogkjLoghjLogfjLogdjLogbjLogmjLoggjLogejLogca
LLogeeeee
eeeej +++++
++++=
which can be used to compute luminance values at any index level. In this equation, j is the index (1 to 1023) of the luminance levels Lj of the JNDs, and
a = -1.3011877, b = -2.584019 x 10⁻², c = 8.0242636 x 10⁻², d = -1.0320229 x 10⁻¹, e = 1.3646699 x 10⁻¹, f = 2.8745620 x 10⁻², g = -2.5468404 x 10⁻², h = -3.1978977 x 10⁻³, k = 1.2992634 x 10⁻⁴, and m = 1.3635334 x 10⁻³.
In Europe, the CIELAB function suggested by the International Illumination Commission has been used in some centers. The CIELAB proposes a modified cube root between the luminance L’ and a perceived brightness variable, L*, as

AAPM TG18 Preprint DRAFT (version 10.0)
84 August 26, 2004
L* = 116 (L’/L’max)1/3 –16 for L’/L’max > 0.008856, L* = 903.3 L’/L’max otherwise. In this scale L* varies between 0 and 100. A perceptually linear display curve L’(p) will be obtained if the above function is inverted and L* is identified with the digital driving level p-values (0 ≤ p ≤ pmax), where p is the presntation value. As an example, for pmax = 255, L’(p) = ((100 p/pmax + 16)/116)3 L’max for p/pmax > 0.08, L’(p) = 1/903.3 (100 p/pmax) L’max otherwise. As shown in Fig. 42, the CIELAB function has more contrast in low luminance regions than the DICOM GSDF. For consistency amongst all centers, TG18 specifically recommend that the DICOM GSDF be used to define L’(p) for all display devices.
0.1
1
10
100
1000
0 200 400 600JND index (Dicom 3.14)
Lum
inan
ce, c
d/m
2
Dicom 3.14CIE
Fig. 42: DICOM 3.14 Grayscale Standard Display Function: DICOM standard part 3.14 tabulates the desired luminance in relation to an index which corresponds to a Just Noticeable Difference (JND) in brightness. For comparison, the CIELAB display function is shown for the case where Lmax equals 300 cd/m2. In the DICOM conceptual model of a standard display device (see Section 1.2.2, Figs. 1 and 2), image values produced by an acquisition device are transformed to a range of presentation values, p. The p-values are then scaled to match the input range of the display controller (e.g., 256, 1024, etc.) and mapped to digital driving levels (DDL) based on a previously established look up table (LUT). While DDL values are typically scalar numbers, some devices may use red, green, and blue color values that are converted in the monitor to gray. DICOM calibration of a device is done by measuring luminance versus DDL and computing a LUT that makes L’(p) follow the DICOM GSDF between L’min and L’max. Within this range of luminance, p-values are linearly proportional to the JND indices with a constant number of JND

AAPM TG18 Preprint DRAFT (version 10.0)
85 August 26, 2004
indices for each p-value change. Devices that store the calibration LUT in the display controller or its device driver are advantageous in that the desired luminance response can be obtained by any application. It is important to recognize certain limitations of the DICOM standard response. When viewing the varied brightness of a medical image, the human visual system adapts to the average quantity of light falling on the retina. This is referred to as fixed adaptation. However, the DICOM 3.14 luminance response is based on contrast threshold data that is derived from experiments where the background luminance is changed to equal the luminance of the target pattern, and the observer fully adapts to the new background. The contrast threshold associated with the GSDF thus reflects variable adaptation. When the eye is adapted to the mixed bright and dark regions of a medical image, the contrast threshold as a function of luminance differs significantly from that associated with variable adaptation (Samei 2004a). The difference is illustrated in Fig. 43, where visual contrast response under fixed adaptation conditions is seen to be worse in the bright and dark regions of an image (Flynn 1999b). Additionally, the GSDF reflects visual performance for a specific spatial frequency under threshold detection conditions. The performance of the human visual system for features of interest in a medical image will be different if the features have different size, spatial frequencies, and (noisy) background, or have supra-threshold contrast. For these reasons, the GSDF does not represent the luminance response that would be optimal for observing the features of a particular image. Rather, the GSDF allows an application to render an image with a specific grayscale transformation (modality LUT) with the expectation that the resulting p-values will produce similar appearance on all display systems that are both GSDF-calibrated and have the same luminance ratio.
0.001
0.010
0.100
0 100 200 300 400 500 600 700 800 900 1000JND index
dL/L
for a
JN
D
B
A
500cd/m2
2cd/m2
50cd/m2
Fig. 43: Contrast threshold for varied visual adaptation (A) and fixed (B, Flynn 1999b) visual adaptation. The contrast threshold, ∆L/L, for a just noticeable difference (JND) depends on whether the observer has fixed (B) or varied (A) adaptation to the light and dark regions of an overall scene. ∆L/L is the peak-to-peak modulation of a small sinusoidal test pattern. It is worth noting that the characteristic curve of a display device (i.e., the DDL to luminance transformation) is technology and monitor dependent. Flat panel display systems can have a complex
AAPM TG18 Preprint DRAFT (version 10.0)
86 August 26, 2004
luminance response with discontinuous changes. CRT display devices have a continuous response with luminance proportional to the input drive signal raised to a fractional power,
(L-Lmin)/(Lmax-Lmin) = [(v-vmin)/(vmax-vmin)] γ ,
where L is luminance, v is the video signal voltage, and γ is the dimensionless “display gamma” (Muka 1995). The subscripts “max” and “min” refer to the maximum and minimum luminance or video voltage states, respectively. This intrinsic power response is primarily due to the drive response of the electron gun in the CRT (Moss 1968). The gamma value, γ, associated with CRT devices is typically about 2.2 but can range from 1.5 to 3.0. For a particular device, care must be taken to ensure that appropriate calibration methods are used. Flat panel systems may require that calibration data be measured for all DDL states. CRT systems with extreme gamma values may be difficult to calibrate particularly if the number of DDL states is low (e.g., 256). 4.3.2 Quantification of Luminance Response Visual assessment of the luminance response is done using a test pattern that has a sequence of regions with systematically varied luminance. The perceived contrast associated with the luminance change for each adjacent region will vary due to the contrast transfer characteristics of both the display device and the adapted human visual system. Test patterns that include low contrast features within each region in the sequence can be used to provide a more sensitive indication of contrast transfer. Luminance response is evaluated by confirming the expected perceived contrast in regions of varying luminance. Quantitative assessment of the luminance response is done using defined test patterns and luminance-meters to measure the luminance response of the display device at a limited number of values. The protocol for making measurements, described in the following sections, is similar to that described in the DICOM standard (NEMA PS3.14, Annex C). The results are then evaluated to determine the average contrast transfer characteristics based on the luminance difference between two measurements. Complete characterization of the luminance response can be accomplished by measuring the display luminance for all possible values associated with the display controller. ∆L/L is then evaluated in relation to the desired values of DICOM 3.14. For a system supporting 1024 or 4096 digital driving levels, complete characterization requires that a large amount of data be acquired with very small luminance differences between each sequential data point. This is generally done automatically using a specialized software application and a luminance-meter having a computer interface. If only a subset of the available levels (32-64 values) are acquired, local anomalies in the luminance response may not be revealed. The veiling glare characteristics of a display significantly affect the assessment of minimum luminance. This complicates the evaluation of luminance response at low luminance and of the contrast ratios. In Fig. 44, the display device was first adjusted to Lmin = 1 cd/m² using a full black image. The minimum luminance was then measured as a function of the percent area of the black region within which the luminance was measured, and as a function of the pixel value in the remainder of the display area. All measurements were made in a darkened room using a luminance probe (Fig. 16). The figure illustrates the dependence of Lmin on veiling glare for both a CRT device and an LCD device. For the methods recommended in this report, luminance is measured using DICOM standard test patterns that have specified target size and background luminance (i.e., TG18-LN test patterns, 10% central area, surround at ~0.2Lmax). This provides reproducible measurements of minimum luminance and contrast ratio that have similar conditions for veiling glare.

AAPM TG18 Preprint DRAFT (version 10.0)
87 August 26, 2004
0.0
1.0
2.0
3.0
4.0
5.0
6.0
7.0
0 10 20 30 40 50 60 70 80 90 100
Percent area of the black square
Min
imum
lum
inan
ce (c
d/m
2)
Bkgd = 0 PV
Bkgd = 50% PV
Bkgd = Max PV
CRT
0.99
1.00
1.01
1.02
1.03
1.04
1.05
1.06
0 10 20 30 40 50 60 70 80 90 100
Percent area of the black square
Min
imum
lum
inan
ce (c
d/m
2)
Bkgd = 0 PV
Bkgd = 50% PV
Bkgd = Max PV
LCD
Fig. 44: The dependence of minimum luminance on the size of the area within which the luminance is measured and the surround pixel value (PV) in a monochrome CRT (left) and an AMLCD (right). 4.3.3 Visual Evaluation of Luminance Response Visual evaluation methods can be used if a luminance-meter is not available. However, it is highly recommended that the luminance response be verified using the quantitative evaluation method described in Section 4.3.4. 4.3.3.1 Assessment Method The luminance response of a display device is visually inspected using the TG18-CT test pattern (see Section 3.2.2.1). The TG18-CT pattern should be evaluated for visibility of the central half-moon targets and the four low-contrast objects at the corners of each of the 16 different luminance regions. In addition, the bit-depth resolution of the display should be evaluated using the TG18-MP test pattern. The evaluation includes ascertaining the horizontal contouring bands, their relative locations, and grayscale reversals. Both patterns should be examined from a viewing distance of 30 cm. 4.3.3.2 Expected Response The appearance of the TG18-CT test pattern should clearly demonstrate the low contrast target in each of the 16 regions. Since this pattern is viewed in one state of visual adaptation, it is expected that the contrast transfer will be better at the overall brightness for which the visual system is adapted as opposed to the darkest or the brightest regions. Nevertheless, the low contrast targets should be seen in all regions. With experience, the visual characteristics of this test pattern can be recognized for a system with quantitatively correct luminance response. A common failure is not to be able to see the targets in one or two of the dark regions. In the evaluation of the TG18-MP pattern, the relative location of contouring bands and any luminance levels should not be farther than the distance between the 8-bit markers (long markers). No contrast reversal should be visible.
AAPM TG18 Preprint DRAFT (version 10.0)
88 August 26, 2004
4.3.4 Quantitative Evaluation of Luminance Response 4.3.4.1 Assessment Method Using a calibrated luminance-meter and the TG18-LN test patterns, the luminance in the test region should be recorded for the 18 digital driving levels as described in Section 3.2.2.2. The measurement of L(p) using patterns other than the TG18-LN patterns may result in different values due to the influence of veiling glare. The effect of ambient illumination should be reduced to negligible levels by using a dark cloth, if necessary. To enable the evaluation of luminance differences, measurements should be made with a precision of at least 10-2 and ideally 10-3. If a telescopic luminance-meter is used, in order to minimize the influence of meter’s flare on the low-luminance measurements, the measurements should be made through a cone or baffle to shield the instrument from the surrounding light, as described in Sections 3.1.1.1 and 3.1.3. For display devices with non-Lambertian light distribution, such as a LCD, if the measurements are made with a near range luminance-meter, the meter should either have an aperture angle smaller then 5 degrees or display-specific correction factors should be applied (Blume 2001) (see Sections 3.1.1.1). After all luminance values have been recorded, the display device should be put in the power-save or blank screen-save mode (otherwise turned off), and the ambient luminance on the display face plate (Lamb) either measured directly or estimated from the measured Rd values as Lamb = ERd. In the case of direct measurement, a telescopic luminance-meter normal to the display surface is used with a light-absorbing mask placed behind the meter to minimize specular reflection from the display. Otherwise the room lighting should be set to the conditions established for the normal use of the equipment (see Section 4.3.4.2 below). The values for L’max and L’min should be computed by the addition of Lamb to the measured Lmax and Lmin values. 4.3.4.2 Expected Response Acceptable responses are delineated for different aspects of the luminance response. The failure of the display device to meet these criteria should prompt repair, replacement, or recalibration of the device. 4.3.4.2.1 L’max, L’min and Lamb The recommended value for L’max is typically specified by the vendor as the highest value that can be used without compromising other performance characteristics, such as lifetime or resolution. For primary displays, that value should be greater than 171 cd/m2 (ACR 1999). In cases where this criterion is not achievable (e.g. color CRTs used for ultrasound or nuclear medicine primary diagnosis), the primary class requirements for luminance ratio and ambient luminance (i.e., LR’ = L’max/L’min ≥ 250 and Lmin ≥1.5Lamb or L’min ≥2.5Lamb, as described below) should be maintained. The secondary class devices should have a maximum luminance of at least 100 cd/m2. L’max should be within 10 percent of the desired value for both classes of display. For workstations with multiple monitors, L’max should not differ by more than 10 percent amongst monitors. L’min should be such that the desired luminance ratio, LR’ = L’max/L’min, is obtained. If the manufacturer’s recommendations are not available, it is recommended that the luminance ratio of a display device be set equal to or greater than 250 for all primary class devices. As a comparison, this corresponds to a film density range between 0.1 and 2.5, which is a typical range of film densities that are interpretable without the aid of a high brightness illuminator. This ratio maintains all contrast information in an image within a luminance ratio where the eye has reasonably good response (Flynn 1999b). For secondary class devices,

AAPM TG18 Preprint DRAFT (version 10.0)
89 August 26, 2004
LR’ should be no less than 100. In general L’min should be within 10 percent of the nominally desired values for both classes of display. As discussed in Section 4.2, ambient lighting can impact the low luminance response of a display device and reduce the device’s effective luminance ratio. A limit on the measured Lamb is, therefore, necessary to prevent fluctuations in room lighting from altering the contrast in dark regions of a displayed image. For primary class display devices, Lamb should ideally be less than 0.25Lmin (or 0.2L’min). In situations where the level of ambient lighting can be strictly controlled and taken into account in the luminance calibration of the display device, a larger Lamb can be tolerated, but Lamb should always be less than Lmin/1.5 (or L’min/2.5). The same will apply to secondary class devices. If necessary, arrangements should be made to reduce the room lighting in order to achieve a sufficiently small Lamb. 4.3.4.2.2 Luminance Response In order to relate measured luminance values to the DICOM 3.14 standard luminance response, the gray levels (p-values) used in the 18 measurements of luminance should be transformed to JND indices. Using the DICOM’s table of JND indices versus luminance, the JND indices for the measured L’min and L’max, Jmin and Jmax, should first be identified. The JND indices for the intermediate values should then be evenly spaced within the JND range and linearly related to the actual p-values used, P, as
PJP
JJ ii ∆
+= maxmin
where J indicates the JND indices. Note that in this methodology, Ji values are not those directly related to the measured luminance values per Barten model. Fig. 45 illustrates the measured luminance response for a display system that was calibrated using 256 p-values. The p-values have been converted to JND indices and the results are plotted in relation to the DICOM 3.14 standard luminance response. As described above, the luminance response is measured in near total darkness and does not include the effects of ambient luminance. Therefore, Lamb should be added to all measured luminance values before comparing to the DICOM 3.14 standard. The expected response of quantitative measurements should be evaluated in terms of the contrast response rather than the luminance response; i.e., the slope of the measured response should agree with the slope of the standard response. Thus, the luminance difference between each measured value should agree with the expected difference associated with the DICOM 3.14 standard luminance response. The measured data should be expressed as the observed contrast, δi, at each luminance step, L’n, as a function of mean JND index value associated with that step.
( )( )( ) ( )1
11
1 5.0@''
''2−
−−
− +−+
−= iiiiii
iii JJ
JJLLLLδ
The expected response DICOM 3.14 luminance values, δd
i, should be similarly computed as the following
( )( )( ) ( )1
11
1 5.0@2−
−−
− +−+
−= iiii
di
di
di
did
i JJJJLL
LLδ
Fig. 46 shows the contrast response associated with the data shown in Fig. 45. As a quantitative criterion for primary class devices, the measured contrast response at any given point should fall within ±10% of the standard. This criterion applies specifically to contrast evaluated from the 18 measurements of

AAPM TG18 Preprint DRAFT (version 10.0)
90 August 26, 2004
luminance made at uniformly spaced p-value intervals. In Fig. 46, the measured contrast response is slightly high at JND = 138. This is related to high luminance values seen in Fig. 45 in the lower portion of the luminance response. Secondary class devices may not have a mechanism for calibrating the luminance response and thus may exhibit more deviation from the standard response. It is recommended that secondary class devices be used that can be adjusted to have a contrast response (i.e., slope) that agrees with the standard to within ±20%.
1
10
100
1000
0 200 400 600JND index (Dicom 3.14)
Lum
inan
ce, c
d/m
2
280cd/m2
1.5cd/m2
Mesaured values
Barten model
TG18-LN12-1
TG18-LN12-9
TG18-LN12-18
Fig. 45: An example of the measured luminance for 18 display levels is plotted in relation to the DICOM 3.14 standard luminance response function. The p-values used to measure luminance have been linearly scaled to JND indices with the values at L’max and L’min set to be equal to the JND corresponding indices.
4.3.5 Advanced Evaluation of Luminance Response 4.3.5.1 Assessment Method A complete evaluation of the luminance response requires that the luminance be recorded for all possible luminance values that a system can use. Measurements should be made using displayed patterns similar to the TG18-LN patterns in conditions that minimize the effect of ambient illumination. The central region of the pattern should be systematically set to all possible p-values of the display controller and the displayed luminance values measured. Since the number of values can be large, these measurements will typically be performed using graphic software that can change the test region’s p-value and automatically record luminance from a meter with a computer interface. Because of the need to evaluate the change in luminance for each p-value change, a photometer with a precision of at least 10-4 and ideally 10-5 should be used. To further improve measurement precision, some signal averaging may be used for each recorded value.

AAPM TG18 Preprint DRAFT (version 10.0)
91 August 26, 2004
0.001
0.010
0.100
0 200 400 600JND index (Dicom 3.14)
dL/L
for a
JN
D
Measured values
10% limit 20% limit
Barten model
Fig. 46: An example of the contrast response computed from 18 gray levels is related to the expected contrast response associated with the DICOM 3.14 standard luminance response with 10 percent tolerance limits indicated. 4.3.5.2 Expected Response The expected response for advanced evaluations should be considered in terms of the contrast response using methods similar to those described for quantitative evaluations. The measured contrast associated with the luminance difference between each sequential gray level available from the display controller, dL’p/L’p, should be compared to the expected contrast per JND associated with the DICOM GSDF. The average JND indices per p-value, Jp, should first be computed by dividing the JND index difference between L’max and L’min by the total number of displayed luminance steps as
minmax
minmax
PPJJ
J p −−
=
The observed contrast per p-value increment should then be normalized by dividing dL’p/L’p by Jp. The result is the observed contrast per JND, dL’j/L’j. This can then be compared directly to the contrast per JND defined by the DICOM standard, dLd
i/Ldi. Fig. 47 illustrates the measured and expected contrast
per JND for a calibrated device with 256 input gray levels (i.e., p-values). Because the contrast per p-value is generally very small, significant noise can be associated with the accuracy of digital to analog conversion (DAC), the digital precision of the controller DAC, and other sources of electronic noise. This can be evaluated by considering the ratio of the measured contrast per JND to the GSDF contrast per JND, (dL’j/L’j)/(dLd
i/Ldi). The product of this ratio and Jp is referred to as
the JNDs per luminance interval. The JNDs per luminance interval should be computed for each p-value and a linear regression performed as described in DICOM 3.14 annex C. The data should be fitted well by a line of constant JNDs per luminance interval equal to Jp. The contrast noise can then be described by the maximum deviation and the root mean squared error of the observed JNDs per luminance interval values. It should be noted that systems with few luminance values (e.g., 256) tend to have a higher

AAPM TG18 Preprint DRAFT (version 10.0)
92 August 26, 2004
contrast per p-value than systems with more luminance values (e.g., 1024 or 4096) and therefore tend to have lower noise for (dL’j/L’j)/(dLd
i/Ldi). The visual performance is not better but the noise in the
relative contrast is less because it is evaluated for a larger luminance change. Evaluating the contrast noise in terms of the error associated with the JNDs per luminance value removes this bias and more accurately reflects display quality.
0.001
0.010
0.100
0 100 200
p-value
dL/L
per
JN
D
Dicom 3.14
Measured
+ tolerance
Fig. 47: An example of the measured contrast, dL/L, associated with the luminance difference between each of 256 gray levels is illustrated. The measured contrast has been reduced by the mean number of JND indices per gray level (p-value) and compared to the contrast per JND associated with the DICOM gray scale display function. The results characterize a monochrome LCD display having a luminance calibration derived from a set of 766 possible luminance values. All the criteria recommended for quantitative method above are also applicable for the advanced test. For primary class display devices, Jp should not be greater than 3.0 to prevent visible discontinuities in luminance from appearing in regions with slowly varying image values. The maximum deviation of the observed JNDs per luminance interval should not differ from Jp by more than 2.0. The root mean square deviation relative to Jp should not be larger than 1.0. No advanced criteria are specified for secondary class display devices. 4.4 Luminance Spatial and Angular Dependencies The luminance response evaluations described in Section 4.3 only relate to the luminance characteristics of a display device at one location on the display faceplate viewed perpendicularly. However, display devices often exhibit spatial luminance non-uniformities and variation in contrast as a function of viewing angle.

AAPM TG18 Preprint DRAFT (version 10.0)
93 August 26, 2004
4.4.1 Description of Luminance Dependencies 4.4.1.1 Non-uniformity Luminance non-uniformity refers to the maximum variation in luminance across the display area when a uniform pattern is displayed. Luminance non-uniformity is a common characteristic of CRT displays, with the luminance typically decreasing from the center to the edges and corners of the display. Various factors cause this behavior including electron beam path length and landing angle as well as the faceplate glass transmission characteristics. In LCDs, contributions to luminance non-uniformity include backlight non-uniformity, mura (visible non-uniformity due to imperfections in the display pixel matrix surface), latent image (i.e., image retention from previous frames), spatial constancy of color coordinates, and the thickness of the liquid crystal elements. However, luminance non-uniformities in LCDs may be less pronounced than in CRTs. The human visual system is generally not sensitive to very low spatial frequencies. Therefore, gradual non-uniformity extending over the full display surface is not a problem, unless the variation is very pronounced. Smaller scale non-uniformities that have dimensions on the order of 1 cm are of more significance and should not be visible when viewing a uniform test pattern. Non-uniformities of smaller dimension are classified as noise and are considered in Section 4.6. 4.4.1.2 Angular Dependence The light emission from a display is ideally Lambertian for which the luminance is independent of viewing angle. AMLCD devices are attractive as bright trans-illuminated devices but can suffer from severe variations in luminance as a function of viewing angle, including contrast reversal. The viewing angle problem with conventional LCD devices results from the perturbation of the orientation of the LC molecules by the electric field in the surface normal direction. At intermediate gray levels, the direction of the LC molecules (director) is tilted obliquely in the display plane and the intensity of light transmitted becomes a function of the incident angle relative to the director orientation. For higher electric fields, the director becomes predominantly normal to the surface and the light deflection is reduced. Fig. 48 illustrates the contrast ratio associated with a conventional AMLCD measured at off-axis horizontal and vertical orientations. In addition to reduction of contrast ratio with viewing angle, note that in some cases, the black luminance level for certain viewing angles can also be at a higher luminance level than the maximum luminance level due to luminance-inversion artifacts. Three notable approaches have recently been introduced to reduce the viewing angle artifact:
1. Retardation films: negative birefringence films may be placed at the entrance or at the exit (or both) of the LC structure. These films tend to compensate for the asymmetries in molecular orientation within the LC layer responsible for the angular dependencies (Hoke 1997).
2. Multi-domain LCDs: for each pixel, 2, 4 or more sub-pixels each with a different orientation may be used in the alignment layers. A multi-domain design with 2 or 4 cells provides averaging of the artifact and is being widely used in the current generation of wide viewing angle AMLCD devices (Nam 1997).
3. In-plane switching (IPS): electrode pairs can be used on one side of the LC structure such that the electric field rotates the director in the plane of the display. IPS is particularly attractive in that it resolves the artifact problem at its source by maintaining the director orientations in the display plane. Electric fields are commonly provided by inter-digitized electrodes formed on the entrance side of the structure (Wakemoto 1997).

AAPM TG18 Preprint DRAFT (version 10.0)
94 August 26, 2004
-80 -60 -40 -20 0 20 40 60 80ANGLE OFF AXIS
0
100
200
300
400
500
600
700
800
CO
NTR
AST
RA
TIO
HOR. DIRECTION
VERT. DIRECTION
Fig. 48: Maximum-to-minimum-luminance contrast ratio of the AMLCD in horizontal and vertical direction. The dashed vertical lines indicate a 900 viewing range (±450 off-axis) within which the contrast ratio average of the horizontal and vertical directions is always greater than 200 (Blume 2001) (used with permission). A multitude of combinations or variations of these approaches is now being considered and implemented into products. While the IPS method is relatively old, it is now recognized to provide excellent viewing angle performance. However, a reduced transmission of about 70% is encountered with this approach which is problematic for portable display applications. 4.4.2 Quantification of Luminance Dependencies 4.4.2.1.1 Non-uniformity Luminance uniformity is determined by measuring luminance at various locations over the face of the display device while displaying a uniform pattern. Non-uniformity is quantified as the maximum relative luminance deviation between any pair of luminance measurements. An index of spatial non-uniformity may also be calculated as the standard deviation of luminance measurements within 1 x 1 cm regions across the faceplate divided by the mean. This regional size approximates the foveal area at a typical viewing distance. Non-uniformities in CRTs and LCDs may vary significantly with luminance level, so a sampling of several luminance levels is usually necessary to characterize luminance uniformity. 4.4.2.1.2 Angular Dependence The angular response of a display is usually quantified in terms of variation in the luminance response of the display as a functional polar and azimuthal viewing angles. The values may be used to determine the

AAPM TG18 Preprint DRAFT (version 10.0)
95 August 26, 2004
variation in luminance ratio as a function of viewing angle as well as the deviation of the luminance response from the desired on-axis response as a function of viewing orientation. The viewing angle limitation for medical use of the device should be clearly labeled on the device for optimum viewing. If multiple devices of the same design are used, it is sufficient to assess the viewing angle limits on one device. For such systems, the acceptable viewing angle cone should be used to arrange the monitors for minimum contrast reduction due to the angular dependencies of luminance. 4.4.3 Visual Evaluation of Luminance Dependencies 4.4.3.1 Assessment Method 4.4.3.1.1 Non-uniformity The visual method for assessing display luminance uniformity involves the TG18-UN10 and TG18-UN80 test patterns. The patterns are displayed and the uniformity across the displayed pattern is visually assessed. The patterns should be examined from a viewing distance of 30 cm. 4.4.3.1.2 Angular Dependence Angular response may be evaluated visually using the TG18-CT test pattern. The pattern should first be viewed on-axis to determine the visibility of all half-moon targets. The viewing angle at which any of the on-axis contrast thresholds are rendered invisible should then be determined by changing the viewing orientation in polar and azimuthal changes. Alternatively, a uniform test pattern with uniformly embedded test targets may be used. The viewer distance at which all targets along the axial or diagonal axes are visible may be used as an indication of the angular response performance of the display. 4.4.3.2 Expected Response 4.4.3.2.1 Non-uniformity The patterns should be free of gross non-uniformities from center to the edges. CRTs typically exhibit symmetrical non-uniformities while LCD displays exhibit non-symmetrical non-uniformities. No luminance variations with dimensions on the order of 1 cm or more should be observed. 4.4.3.2.2 Angular Dependence The viewing angle cone within which the TG18-AD test pattern threshold remains visible is the cone within which the device may be used clinically. The established viewing angle limits should be clearly labeled on the front of the display device. For multiple-monitor workstations, the LCDs should be adjusted such that the displays optimally face the user. 4.4.4 Quantitative Evaluation of Luminance Dependencies 4.4.4.1 Assessment Method 4.4.4.1.1 Non-uniformity Using the TG18-UNL10 and TG18-UNL80 test patterns, measure luminance at five locations over the faceplate of the display device (center and four corners) using a calibrated photometer. If a telescopic luminance-meter is used, it should be supplemented with a cone or baffle as described in Sections 3.1.1.1

AAPM TG18 Preprint DRAFT (version 10.0)
96 August 26, 2004
and 3.1.3. For display devices with non-Lambertian light distribution, such as a LCD, if the measurements are made with a near range luminance-meter, the meter should have a narrow aperture angle, otherwise certain correction factors should be applied (Blume 2001) (see Sections 3.1.1.1). The maximum luminance deviation for each display pattern is calculated as the percent difference between the maximum and minimum luminance values relative to their average value, 200*(Lmax – Lmin)/(Lmax + Lmin). 4.4.4.1.2 Angular Dependence The luminance of a LCD display may be quantitatively evaluated as a function of viewing angle. This can be done with two basic approaches: the conoscopic and the gonioscopic methods. In the conoscopic method, a cone of light coming from the display is analyzed with special transform lenses (Fourier optics) and two-dimensional array detectors. This method provides a fast and complete description of the angular variations of the luminance and chromaticity levels, but the measuring equipment is usually expensive and more useful in development laboratories. In the gonioscopic approach, a focused luminance probe with a small acceptance angle is oriented toward the display to reproduce a given viewing direction. The method is flexible and versatile, and can be easily implemented in a clinical environment. A basic test should include the evaluation of luminance ratio as a function of viewing angle using the TG18-LN test patterns. For this measurements, it is useful to have a subjective understanding of the viewing angle dependence as illustrated in Fig. 48 to determine the specific horizontal and vertical angles at which quantitative measurements should be made. If the needed instrumentation for angular measurements are readily available, it is best to determine the angular luminance variations of a display at 18 luminance levels using a conoscopic device or equivalent and TG18-LN test patterns. 4.4.4.2 Expected Response 4.4.4.2.1 Non-uniformity The maximum luminance deviation for an individual display device should be less than 30%. This large tolerance limit is recommended based on the current state of display technology. For CRTs, imposing a restricted criterion necessitates an increased beam current at off center locations, which further increases the spot size and consequently degrades the resolution toward the edges of the display. For LCDs, non-uniformities arise from non-uniformity of the backlight as well as that associated with the liquid crystal array. However, it should be recognized that in a display device with up to 30% luminance non-uniformity, the luminance response over some areas of the image might not comply with DICOM 3.14. Measured responses outside the acceptable range should prompt corrective actions, repair, replacement, or readjustment of the display device. 4.4.4.2.2 Angular Dependence Ideally, the angular response of a display should not reduce the luminance ratio by more than 30%. Thus, an acceptable viewing angle cone can be defined within which LR’ is greater than 175 (250 x 0.7) for primary displays and 70 (100 x 0.7) for secondary displays (Samei 2004b). If the luminance in mid-luminance values is measured, the angular luminance results should be evaluated the same way they are processed for on-axis measurements described in Section 4.3 to evaluate conformance to the GSDF. Fig. 49 shows examples of luminance plots and corresponding contrast response for typical CRT and AMLCD displays as a function of viewing angle. The contrast response for any viewing angles should not be greater than three times the expected limits on axis (κδ ≤ 3 x 10% = 30% for primary displays, κδ ≤ 3 x 20% = 60% for secondary displays) (Section 4.3.4.2). For a display device, both LR’ and κδ requirements should be met. The established viewing angle limits (ascertained either visually or quantitatively) within

AAPM TG18 Preprint DRAFT (version 10.0)
97 August 26, 2004
which the contrast response is acceptable should be clearly labeled on the front of the display device. For multiple-monitor workstations, the LCDs should be adjusted such that the displays optimally face the user. 4.4.5 Advanced Evaluation of Luminance Dependencies 4.4.5.1 Assessment Method 4.4.5.1.1 Non-uniformity In the advanced method, the index of spatial non-uniformity is determined from a digital image of the faceplate captured using a digital camera. The image is divided into 1 x 1 cm regions. The mean of the luminance value within each block is computed and the maximum luminance deviation computed as described above using the maximum and minimum values. Secondly, a low order two-dimensional fit is applied to the 1 x 1 cm luminance values to estimate the broad trend within the data. The deviation of the luminance values from this trend is then computed. The intermediate scale non-uniformities are described as the maximum deviation from the broad trend. The measured data should be corrected for the non-uniformity associated with the camera itself and angular luminance characteristics of the display, notably for LCD devices. 4.4.5.1.2 Angular Dependence If the needed instrumentation for angular measuetrments are readily available, it is best to analyze the angular luminance variations of displays to determine the available contrast at all luminance levels. To achieve this, one approach is to measure the luminance emission from the displays using a rotating arm with the rotation axis lying in the plane of the display surface. The luminance probe used must have a small acceptance angle and must be shielded from light coming from other angular directions, since as the probe rotates it comes closer to the display and can be sensitive to light coming from outside the desired spot. Alternatively, the measurements may be made using a conoscopic device. 4.4.5.2 Expected Response 4.4.5.2.1 Non-uniformity The contrast threshold of the human visual system is about 0.03 for frequencies of 0.5 cycles per cm at a close viewing distance of 30 cm (~0.3 cycles/degree) at typical display luminance levels. The requirements for the maximum deviation of the intermediate scale non-uniformities are derived by requiring that the index to be less than half of this contrast. Thus, the maximum relative deviation should be less than 0.015. 4.4.5.2.2 Angular Dependence No advanced requirements have been established for angular dependencies of medical displays.

AAPM TG18 Preprint DRAFT (version 10.0)
98 August 26, 2004
0.001
0.010
0.100
0 100 200 300 400 500 600 700
JND index
dL/L
for a
JN
D
03050
CRT Horizontal
0.001
0.010
0.100
0 100 200 300 400 500 600 700
JND index
dL/L
for a
JN
D
03050
CRT Horizontal
0.001
0.010
0.100
0 100 200 300 400 500 600 700
JND index
dL/L
for a
JN
D
03050
CRT Horizontal
(a) (b)
0.001
0.010
0.100
dL/L
for a
JN
D
AMLCD Horizontal
0 100 200 300 400 500 600 700 800
03075
JND index
AMLCD Vertical
0.001
0.010
0.100
0 100 200 300 400 500 600 700 800
JND index
dL/L
for a
JN
D
03075
0.001
0.010
0.100
dL/L
for a
JN
D
AMLCD Horizontal
0 100 200 300 400 500 600 700 800
03075
JND index
0.001
0.010
0.100
dL/L
for a
JN
D
AMLCD Horizontal
0 100 200 300 400 500 600 700 800
03075
JND index
AMLCD Vertical
0.001
0.010
0.100
0 100 200 300 400 500 600 700 800
JND index
dL/L
for a
JN
D
03075
AMLCD Vertical
0.001
0.010
0.100
0 100 200 300 400 500 600 700 800
JND index
dL/L
for a
JN
D
03075
(c) (d)
Fig. 49: Measurement setup for assessing angular dependency (a). An example of luminance plots and corresponding contrast (expressed as dL/L per JND) response along the horizontal direction for a medical imaging 5-megapixels CRT monitor at three different angles (0, 30, and 50 degrees) (b), and for a monochrome high-resolution AMLCD monitor along the horizontal (c) and vertical (d) direction. Thin lines indicating the 10% tolerance based on the DICOM GSDF limits (thick lines) specified for normal viewing have been added for comparison. For the CRT, the results for negative angles along the horizontal, and for all vertical angles are essentially similar due to the rotational symmetry of the CRT phosphor emission. That is not the case for the AMLCD. 4.5 Display Resolution 4.5.1 Description of Display Resolution Spatial resolution is the quantitative measure of the ability of a display system to produce separable images of different points of an object with high fidelity. Systems designed with adequate spatial resolution characteristics are necessary to assure that spatial details of interest are preserved when a medical image is displayed. Portraying image data on a display with insufficient resolution will compromise the accuracy of the radiological interpretation.

AAPM TG18 Preprint DRAFT (version 10.0)
99 August 26, 2004
The resolution limitation imposed by the limited bandwidth of the video amplifiers in CRTs is primarily evident in the horizontal direction; in the vertical direction, the resolution is primarily governed by electron optics. The described mechanisms significantly contribute to the anisotropic resolution properties of CRT display devices: The magnitude of the MTF in the horizontal direction is typically lower than in the vertical direction. Consequently, a vertical line is often rendered with lower luminance compared to the respective horizontal line. The more the signal magnitude after the video amplifier is reduced, the higher becomes the energy reduction and, thus, display luminance. Even in properly designed high-resolution display systems, the directional dependence of resolution is noticeable. Because of the typically large difference in modulation transfer function between vertical and horizontal directions, some CRTs utilize resolution restorations using anisotropic filtering. In testing a CRT display, it is useful to know the resolution restoration methodology of the device before hand. 4.5.2 Quantification of Display Resolution Limiting resolution and maximum perceivable contrast at the limiting resolution are two ways that the spatial resolution response of a display system can be characterized. Resolution is more formally quantified by the Modulation Transfer Function (MTF) of the display. The MTF is defined as
MTF(fx,fy) = |P(fx,fy)|/P(0,0)
where |P(fx,fy)| is the modulus of the Fourier Transform of the imaging system’s Point Spread Function, P(x,y) (Gaskill 1978, Barrett 1981). Note that MTF(fx,fy) is normalized to unity at the spatial frequencies of fx = fy = 0 lp/mm. Most commonly the user quotes the MTF response at the Nyquist Frequency. For a CRT with a pixel size of dx in x-direction and dy in y-direction, the respective Nyquist frequencies are fNy,x=1/(2*dx) and fNy,y=1/(2*dy). MTF is only applicable to linear or quasi-linear imaging systems. Most display devices, including CRT displays, have a non-linear luminance response and a non-linear relationship between resolution and luminance. To correctly apply the use of MTF in testing, the display system response must be made linear, or the measurements must be made using small-signal modulations such that a linear assumption is reasonable for the range being used. The former is difficult, since the luminance response of a display system is often dependent on the spatial frequency content of the image being displayed. Thus, the MTF measurement should rely on the latter approach. The MTF of a display system can be obtained using different methods based on the ability of the system to display square wave patterns, a line, an edge, a single pixel, or white noise input (broad-band response) (Weibrecht 1997). The methods vary in their level of difficulty to implement and generate slightly different results. The method of broadband response is perhaps the most labor intensive one in which the Noise Power Spectra (NPS) of a displayed white noise pattern are measured and averaged many times. The line response is perhaps the easiest and most intuitive method. Research on the advantages of any one method over others is still in progress. The line method provides a simple and fairly accepted method for the assessment of the MTF of display systems and, thus, is recommended in this report. However, other methods can be considered in advanced evaluations. 4.5.3 Visual Evaluation of Display Resolution 4.5.3.1 Assessment Method
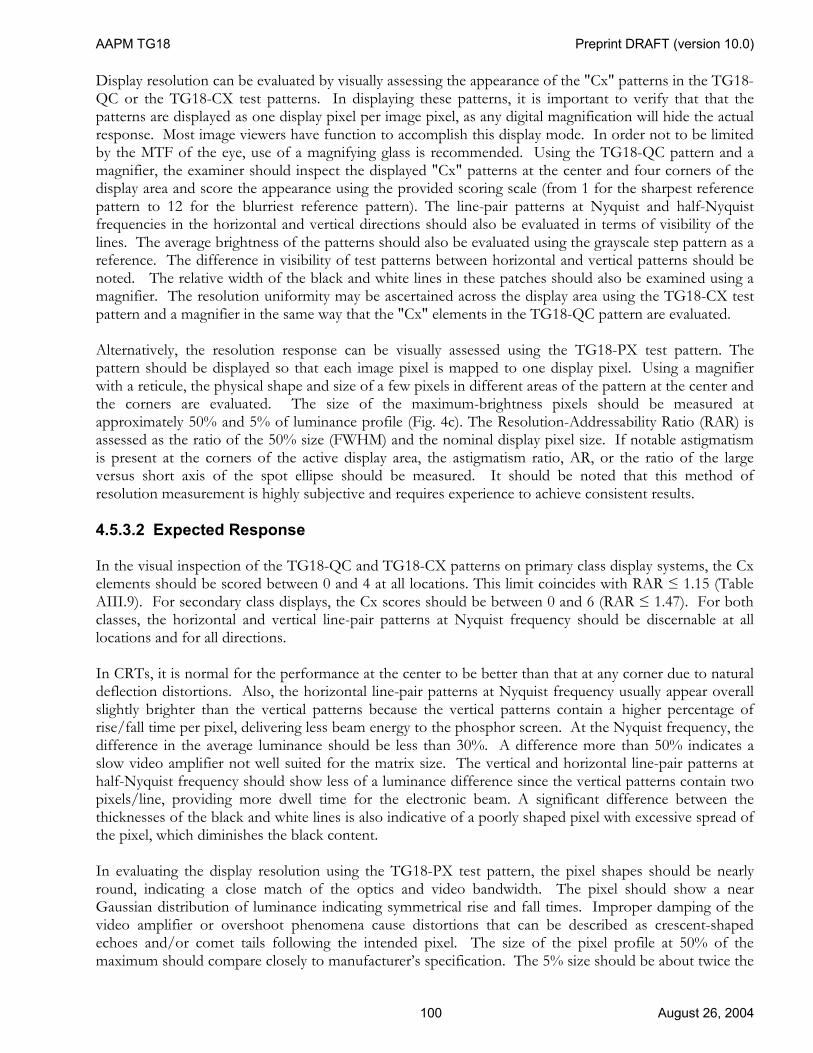
AAPM TG18 Preprint DRAFT (version 10.0)
100 August 26, 2004
Display resolution can be evaluated by visually assessing the appearance of the "Cx" patterns in the TG18-QC or the TG18-CX test patterns. In displaying these patterns, it is important to verify that that the patterns are displayed as one display pixel per image pixel, as any digital magnification will hide the actual response. Most image viewers have function to accomplish this display mode. In order not to be limited by the MTF of the eye, use of a magnifying glass is recommended. Using the TG18-QC pattern and a magnifier, the examiner should inspect the displayed "Cx" patterns at the center and four corners of the display area and score the appearance using the provided scoring scale (from 1 for the sharpest reference pattern to 12 for the blurriest reference pattern). The line-pair patterns at Nyquist and half-Nyquist frequencies in the horizontal and vertical directions should also be evaluated in terms of visibility of the lines. The average brightness of the patterns should also be evaluated using the grayscale step pattern as a reference. The difference in visibility of test patterns between horizontal and vertical patterns should be noted. The relative width of the black and white lines in these patches should also be examined using a magnifier. The resolution uniformity may be ascertained across the display area using the TG18-CX test pattern and a magnifier in the same way that the "Cx" elements in the TG18-QC pattern are evaluated. Alternatively, the resolution response can be visually assessed using the TG18-PX test pattern. The pattern should be displayed so that each image pixel is mapped to one display pixel. Using a magnifier with a reticule, the physical shape and size of a few pixels in different areas of the pattern at the center and the corners are evaluated. The size of the maximum-brightness pixels should be measured at approximately 50% and 5% of luminance profile (Fig. 4c). The Resolution-Addressability Ratio (RAR) is assessed as the ratio of the 50% size (FWHM) and the nominal display pixel size. If notable astigmatism is present at the corners of the active display area, the astigmatism ratio, AR, or the ratio of the large versus short axis of the spot ellipse should be measured. It should be noted that this method of resolution measurement is highly subjective and requires experience to achieve consistent results. 4.5.3.2 Expected Response In the visual inspection of the TG18-QC and TG18-CX patterns on primary class display systems, the Cx elements should be scored between 0 and 4 at all locations. This limit coincides with RAR ≤ 1.15 (Table AIII.9). For secondary class displays, the Cx scores should be between 0 and 6 (RAR ≤ 1.47). For both classes, the horizontal and vertical line-pair patterns at Nyquist frequency should be discernable at all locations and for all directions. In CRTs, it is normal for the performance at the center to be better than that at any corner due to natural deflection distortions. Also, the horizontal line-pair patterns at Nyquist frequency usually appear overall slightly brighter than the vertical patterns because the vertical patterns contain a higher percentage of rise/fall time per pixel, delivering less beam energy to the phosphor screen. At the Nyquist frequency, the difference in the average luminance should be less than 30%. A difference more than 50% indicates a slow video amplifier not well suited for the matrix size. The vertical and horizontal line-pair patterns at half-Nyquist frequency should show less of a luminance difference since the vertical patterns contain two pixels/line, providing more dwell time for the electronic beam. A significant difference between the thicknesses of the black and white lines is also indicative of a poorly shaped pixel with excessive spread of the pixel, which diminishes the black content. In evaluating the display resolution using the TG18-PX test pattern, the pixel shapes should be nearly round, indicating a close match of the optics and video bandwidth. The pixel should show a near Gaussian distribution of luminance indicating symmetrical rise and fall times. Improper damping of the video amplifier or overshoot phenomena cause distortions that can be described as crescent-shaped echoes and/or comet tails following the intended pixel. The size of the pixel profile at 50% of the maximum should compare closely to manufacturer’s specification. The 5% size should be about twice the

AAPM TG18 Preprint DRAFT (version 10.0)
101 August 26, 2004
50% size (Fig. 4). Larger 5% sizes cause notable display resolution loss due to the increase in pixel overlap. The RAR should be between 0.9 and 1.1 for primary class displays (Muka 1997). This range provides a balance between a structured appearance (e.g., raster lines visible) and an excessive resolution loss. The maximum astigmatism ratio (AR) should be less than 1.5 over the display area for primary class displays. 4.5.4 Quantitative Evaluation of Display Resolution 4.5.4.1 Assessment Method 4.5.4.1.1 MTF Method Quantification of the MTF requires the use of a displayed-image digitizing system, such as a digital camera, to digitally capture a portion of the display and to analyze the resulting images, as described in Section 3.1.2. The lens of the camera should be set to a high f-number in order to reduce the flare of the camera lens. The flare should also be further reduced with the aid of a cone or funnel device. The magnification of the lens should result in over-sampling of the display. At least 64 CCD pixels should cover one display pixel (i.e., 8 x 8 recorded pixels per displayed pixel). The camera needs to be well focused on the screen of the CRT under test. This is best done when the lens aperture is opened to its maximum level. In this position, the depth of focus is small and the line width is very sensitive to the focus control. Afterwards, the lens aperture is set to its smallest level in order to achieve a large depth of focus and minimum flare. Large depth of focus is important in view of the thickness non-uniformities of the CRT’s faceplate. The TG18-RV and TG18-RH patterns, which provide line inputs, can be used as the target patterns for the MTF measurements. These six patterns allow the assessment of MTF in the horizontal and vertical directions at three luminance levels and five locations on the display area. At each location, the camera should be securely positioned in the normal direction in front of the target area of the display and focused on the line. The magnification should be determined in accordance with the display pixel size, CCD matrix size, and the desired over-sampling. The camera field of view should include the pixel markers in the pattern. While the camera should be placed in normal direction with respect to the face-plate, it needs to be rotated parallel to the faceplate such that the CCD pixel array should be angled at 2-5 degrees with respect to that of the displayed image, in order to provide appropriate over-sampling. After the camera is properly positioned and focused, images from all six patterns should be captured before moving the camera to the next location. The exposure time should be selected such that the digital signal of the camera exceeds the dark signal by a factor of 100. Furthermore, the exposure time should be long enough to permit integration over multiple CRT frames, but short enough with respect to instabilities of the scanning and deflection circuits. Ultimately the integration time should be appropriate with respect to the integration time of the human eye, for which the experiments are conducted. Integration times between 0.2 s and 1 s are appropriate to use. The measurements should be made in a darkened room. The 30 images should be acquired without any image compression. The data should be transferred to a computer for data processing. The captured line patterns should be reduced to orthogonal MTFs using Fourier analysis. There are several processing steps in the calculations and the results are expected to vary slightly with the methods. For standardization and simplicity the following steps are suggested:
1. Acquire a magnified image of the TG18-RV or TG18-RH test pattern and its associated TG18-NS test pattern at the same magnification.

AAPM TG18 Preprint DRAFT (version 10.0)
102 August 26, 2004
2. Determine the size that the image pixels represent in terms of the spatial dimension on the display using the known physical distance of the pixel markers on the patterns and the measured pixel distance of the markers in the captured images.
3. Linearize the image data with respect to display luminance using the luminance response of the display (characterized in Section 4.3).
4. Add the mean value of the image from the TG18-NS to that of the TG18-RV (or TG18-RH) pattern, and subtract the TG18-NS image pixel by pixel from the TG18-RV (or TG18-RH) image in order to remove display pixel structure. The subtracted image is used for further processing.
5. Identify a rectangular square ROI extending along the image of the line. 6. Determine the angle of the line. 7. Reproject the 2D data within the ROI along the direction of the line into sub-pixel bins to obtain
the composite line spread function (LSF) 8. Smooth the LSF if it expresses excessive noise. 9. Find the Fourier transform of the LSF, and normalize the resulting MTF. 10. Divide the MTF by the sinc function associated with the width of the LSF sub-pixel bins, and
correct for the previously-characterized MTF of the camera system (see Section 3.1.2). Note that in some cases the LSF might be asymmetric. In those cases, each side of the LSF is used to form two symmetric LSFs. The resultant MTFs are reported along with their average as representative of the display resolution. 4.5.4.1.2 Luminance Method Another more limited but simpler method to quantitatively characterize the resolution of a display system is based on luminance measurements performed on the line-pair patterns of the TG18-QC test pattern. The method does not provide absolute measures of luminance; rather it provides the resolution differences in the orthogonal directions. Using a telescopic photometer focusing on the entire central patch with the 100% modulation horizontal line-pair pattern, measure the average luminance of the patch. Repeat the measurement on the adjacent vertical line-pair patch, and calculate the percent difference between the two luminance values relative to the maximum measured luminance value. Repeat the procedure for all four corners. The values are indicative of the CRT’s resolution characteristics, i.e., inadequacy of the rise and fall times which define the pixels in the horizontal direction. 4.5.4.2 Expected Response Acceptable responses are delineated for each one of the quantitative methods described above. Measured responses outside the acceptable range should prompt corrective actions in the form of focus adjustments, repair, or replacement of the device. 4.5.4.2.1 MTF Method Values of the measured MTF at the Nyquist frequency should be at least 35% for primary display devices and 25% for secondary devices. More comprehensive quantitative criteria for the MTF are expected to be determined from future clinical experience. 4.5.4.2.2 Luminance Method In assessing the resolution of a display device using the luminance method, the percent luminance difference at the center should be less than 30% for primary class display systems and 50% for secondary

AAPM TG18 Preprint DRAFT (version 10.0)
103 August 26, 2004
class systems. The corners will always yield lower values than the center as the extent of the corner pixels are influenced by the spread in the electron energy due to a non-perpendicular beam-landing angle. 4.5.5 Advanced Evaluation of Display Resolution 4.5.5.1 Assessment Method As an advanced method, the MTF of a display system can be assessed using the other measurement methods mentioned in Section 4.5.2. The following is a brief summary of these methods. The interested readers should consult the stated references. In the square-wave response method, small-amplitude square waves of different spatial frequencies are displayed in horizontal and vertical direction and their response are recorded. The MTF or sine-wave response is found from the square-wave response by Fourier Series analysis. Finding the MTF from the square-wave is practically like finding it point-by-point, frequency-by-frequency from the ratio of the output modulation (“peak-to-peak amplitude”) to the input modulation. The advantage of using square-waves comes from the fact that (1) it is difficult to make good sine-waves digitally, and (2) square-waves are composed of a multitude of sine-waves, so one can take advantage of the multitude of harmonics. The line response method is described above for positive single-line profiles, where a single line is displayed on an otherwise darker background. The same method can be applied to negative single-line profiles where a single line is displayed at a low luminance value on an otherwise uniformly bright background (Weibrecht 1997). The small signal requirement should still be met. The profiles of single lines are determined and the MTF is found from the one-dimensional Fourier transform of the line profiles. The MTF can also be determined from the edge spread function (ESF) of the system. The ESF is not spatial limited and truncation errors occur if the discrete Fourier transform (DFT) is directly applied to it. To make the ESF spatial limited, it is typically differentiated to obtain the LSF and the MTF deduced by Fourier transform methods. Unlike the line response method, which provides the average MTF of the system, edge response method can quantify the MTFs for asymmetrical LSF. However, the edge response method requires a spatial-derivative operation, which accentuates noise in the analysis. This noise may be reduced if the MTF is obtained using multiple edge images. The small signal requirement should still be met. In the single-pixel response method, images of single positive (or negative) pixel profiles against otherwise dark (or bright) backgrounds are captured via a CCD camera (Weibrecht 1997). The MTF is found from the two-dimensional Fourier transform of captured pixel profiles. Note that for the case of single-line and single-pixel profiles, the results are different depending on the polarity of the signal contrast applied because of the differing relative contribution of multiple pixels as well as the display’s veiling glare. In the broadband response method, the display system’s response to white stochastic signals is assessed. This method can only be implemented under conditions of a linear approximation, i.e., small signal amplitudes, since the energy of the stochastic signals can be spread over large measurement areas. Furthermore, stochastic signals may be a convenient close representation of real medical images. The basic idea of the stochastic approach makes use of the fact that the signal power spectrum (SPS) found at the output of a linear, noise-free system, Φout(f), is the signal power spectrum of the input signal, Φin(f), weighted by the squared magnitude of the transfer function, |H(f)2| (Gaskill 1978) as
Φout(f) = |H(f)|2 Φin(f).

AAPM TG18 Preprint DRAFT (version 10.0)
104 August 26, 2004
Thus, the MTF is given by the normalized square-root of the ratio of the output SPS and the input SPS. This ratio is also called the broadband response. The broadband response technique is perhaps the most cumbersome, yet precise method for measuring the spatial resolution of a display system. 4.5.5.2 Expected Response The expected requirements for the advanced measurements of display resolution characteristics have not yet been established. 4.6 Display Noise 4.6.1 Description of Display Noise The detectability of small objects and objects of low contrast in medical images depends not only on their size and contrast but also on the superimposed noise and noise in the immediate surroundings. Noise in the context of this report is defined as any high-frequency fluctuations/patterns (< 1 cm) that interfere with the detection of the true signal. Note that not only do the frequency components of the noise that occur below the display’s Nyquist frequency deteriorate the image quality, but higher frequency components up to the human visual system resolution limit also contribute to the noise impression. In this definition of noise, very-low-frequency fluctuations (> 1cm) are excluded as they are usually perceived as non-uniformity rather than as noise and are classified under luminance non-uniformity discussed above in Section 4.4. CRT displays have several noise sources such as electronic noise, stochastic noise in the conversion of the video signal to photons, and structured noise. Thus, CRT display system noise has both temporal and spatial components. The temporal component behaves similar to quantum noise and appears to be determined by random fluctuations in the number of luminescence photons detected by the human eye (Roehrig 1990b). Spatial noise is a fixed-pattern noise that stems from the granular structure of the CRT phosphor screen. Typically, temporal noise is small compared to spatial noise, except at the lowest luminance levels. The signal-to-noise ratio of spatial noise is usually independent of the luminance level. P45 screens usually add less noise to a displayed image than P4 or P104 screens as discussed in Sections 2.3.1.1 and 2.4.8. Noise also exists in flat-panel displays. Noise in flat panel AMLCDs, both temporal and spatial, can arise from variations in luminance within the active area of the pixel. Such variations can be from non-uniformities in the applied electrical field due to electrode fabrication methodology and physical placement and from unwanted variations in the input signal due to voltage fluctuations and electronic noise. They can also be caused by the intentional specification of sub-pixels driven at slightly different luminance levels to achieve a greater number of gray values. Three sub-pixels are commonly used and individually addressable, so three regions of luminance differences may exist within one full pixel’s active area. Furthermore, in order to achieve a uniform thickness of LC material with AMLCD (needed in order to insure consistent optical properties) inert glass beads are often, but not always, placed between the front and back glass panels. These beads normally transmit light and will generate small spots of light in a dark screen for normally black displays. Their impact is small and may be generally discounted. Noise can also be caused by variations in uniformity of luminance taking into account the pixel structure. Each AMLCD pixel has a surrounding inactive area, which causes a structured pattern in the active display. The pattern can take many forms depending on the size, shape, and architecture of the pixels.

AAPM TG18 Preprint DRAFT (version 10.0)
105 August 26, 2004
Regardless of the source of noise in flat panels, the specification of its presence and assessments of its impact are similar to those for CRT devices. 4.6.2 Quantification of Display Noise Spatial noise of a display system can be described by the normalized Noise Power Spectrum (NPS) of the system. The noise power is derived from the discrete Fourier transform of displayed uniform images, I(i,k),
∑∑−
=
−
=
⋅⋅=1
0
1
0
/2/2),(),(m
j
n
k
nkvimjui eekjIvun ππ,
where j and k are pixel indices, m and n are the number of samples representing the image in horizontal and vertical directions, and n(u,v) is the noise amplitude for the frequency components u and v. The noise power spectrum is defined as
),(1),( 2vunEmn
vuNPS =
where E|n(u,v)|2 is the expectation value of the function |n(u,v)|2, determined by averaging the noise spectra from different areas of the screen image (Gaskill 1978, Dainty 1974). The noise power spectrum is normalized by the respective signal power. Noise power is presented by a two-dimensional graph or a plot of one-dimensional slices of the two-dimensional data along a particular direction. Noise power is often expressed in mm2 by multiplying the normalized NPS by the area of individual samples. While temporal noise can be characterized with the aid of a photomultiplier or a detector with a time response relevant to the human visual system (i.e., 8 Hz) (Roehrig 1990b, Roehrig 1993), it has not been shown to be of great concern in medical display devices and, thus, is not addressed in this report. 4.6.3 Visual Evaluation of Display Noise 4.6.3.1 Assessment Method The visual method to quantify the spatial noise of a display system is based on the method to determine just noticeable luminance differences as a function of size using the TG18-AFC test pattern. Each quadrant of the test pattern contains a large number of regions with varying target position. In each quadrant, the contrast and size of the target are constant. The contrast-size values for the four quadrants are 20-2, 30-3, 40-4, and 60-6. The observer views the patterns from a viewing distance of 30 cm. The quadrants can be subjectively evaluated to establish the contrast-size relationships for which the observer can confidently place the position of all targets. The target visibility in each of the target regions may also be quantified by counting the number of targets readily visible in each of the quadrants and computing the percent correct. 4.6.3.2 Expected Response The visual evaluation should render all the targets except the smallest one visible for primary class displays and the two largest sizes visible for secondary class displays. Since the mean value and the standard deviation of the background are each linearly dependent on the luminance, their ratio, i.e., signal-to-noise, remains independent of luminance (Roehrig 1990b, Roehrig 1993). Therefore, the results of the noise

AAPM TG18 Preprint DRAFT (version 10.0)
106 August 26, 2004
evaluation are independent of the absolute luminance value of the pattern’s background. However, the failure of a device in this test can also be an indication of an improper luminance response, the possibility of which can be eliminated by first verifying the proper luminance response of the device. 4.6.4 Quantitative Evaluation of Display Noise 4.6.4.1 Assessment Method Spatial noise of a display system can be quantified by either single-pixel signal-to-noise ratios or by the normalized Noise Power Spectrum (NPS). Both methods require the use of a scientific-grade digital camera (see Section 3.1.2.1) to capture an image of a uniform pattern displayed on the device. The CCD camera lens should be set to a high f-number in order to reduce veiling glare in the camera. Also, the magnification of the lens should result in over-sampling of the display in a way that allows sampling of spatial frequencies up to 40 cycles per degree, which is the resolution limit of the human visual system at the maximum luminance of most electronic displays (Rose 1974). As an example, when evaluating a 21-inch CRT display with a matrix size of 1726 x 2304 at 250 mm distance, the Nyquist frequency corresponds to about 12.4 cycles/deg. Evaluation of noise up to this limit requires sampling frequencies to at least 40/12.4 = 3.2-times the Nyquist frequency of the display. To achieve this, at least 16 CCD pixels should cover one display pixel. The camera images should also be flat-field-corrected, compensated for gain variations, and restored for the degradation of the MTF of the camera optics based on the prior performance evaluation of the camera system, noted earlier. The central region of the TG18-NS test patterns can be used as the target uniform pattern for both measurements at three luminance levels. The camera should be securely positioned in front of the target area of the display and focused on the raster lines. The field of view should include the pixel markers in the pattern. The magnification should be determined in accordance with the display pixel size, CCD matrix size, and the desired over-sampling. After the camera is properly positioned and focused, images from all three TG18-NS patterns will be captured. To eliminate the effects of temporal fluctuations in the luminance output, images should be captured with an integration time of about one second. The measurements should be performed in a darkened room. The images should be transferred uncompressed to a computer for data processing. 4.6.4.1.1 Single-pixel SNR The quantification of the CRT noise by the single-pixel signal-to-noise ratio follows the concepts of information theory (Roehrig 1990b). The quantity is determined by processing each captured image using the following steps:
1. Determine the size that the image pixels represent in terms of the spatial dimension on the display using the known physical distance of the pixel markers on the pattern and the measured pixel distance of the markers in the captured image.
2. Linearize the image data with respect to display luminance. 3. Utilizing only the central ½ area of the image, apply a sampling aperture of n x n CCD pixels,
where n is the number of CCD pixels representing one display pixel. 4. Calculate the signal-to-noise ratio as the ratio of the mean to standard deviation in the sampled
image. 5. Correct for the CCD noise. Based on the assumption that the CCD camera noise and the display
spatial noise are uncorrelated, the SNR based on the mean and standard deviation of sampled CCD images without exposure using the same integration time may be subtracted from the SNR value computed in step 4 to determine the SNR independent of the camera.

AAPM TG18 Preprint DRAFT (version 10.0)
107 August 26, 2004
4.6.4.1.2 Noise Power Spectrum The captured uniform patterns are processed to acquire the NPS at three luminance levels using Fourier analysis. There are multiple processing steps for such deductions and the methods can vary the results slightly. For standardization and simplicity, the following steps are suggested for processing each captured image:
1. Determine the size that the image pixels represent in terms of the spatial dimension on the display using the known physical distance of the pixel markers on the pattern and the measured pixel distance of the markers in the captured image.
2. Linearize the image data with respect to display luminance. 3. Divide the central ¾ region of the captured image into multiple, non-overlapping regions, 128 x
128 or 256 x 256 in size. The size of these regions determine the sampling interval of the resulting NPS. Depending on the exact level of magnification (oversampling) and the matrix size of the CCD camera, between nine to 64 regions may be identified. It is recommended that at least 20 regions be used for the assessment of the NPS. To achieve this, it might be necessary to acquire multiple images from the central patch of the TG18-NS pattern by orienting the camera toward another, non-overlapping area of the central area of the displayed pattern.
4. Apply a two-dimensional fast Fourier transform on each region to yield the 2D NPS. 5. Average the 2D NPS from all regions. 6. Correct for the CCD noise. Based on the assumption that the CCD camera noise and the display
spatial noise are uncorrelated, the NPS based on sampled CCD images without exposure using the same integration time may be subtracted from the results.
7. Derive the orthogonal NPS from the calculated 2D NPS by band averaging, excluding the data on the orthogonal axes.
It should be pointed out that the NPS measurements could also be performed first by defocusing of the electron beams, thus removing the raster lines. This method is not recommended, as it will measure system performance in a condition that is not used clinically. The two approaches generate different results. Depending on whether the raster lines are visible or have been defocused and are not visible, the measured noise is different by almost a factor of 2 (Fig. 50). 4.6.4.2 Expected Response Since there are only a few examples of actual SNR and NPS measurements at this point, and since no correlation of the measurements and diagnostic accuracy is ascertained, no fixed criteria are considered at this time. However, noise values associated with the display device should not exceed those of typical radiological images that are viewed with the system. 4.6.5 Advanced Evaluation of Display Noise 4.6.5.1 Assessment Method As an advanced evaluation, the spatial noise characteristics of display, SNR and NPS, can be ascertained at five locations on the display using the center and corner areas of the TG18-NS test patterns. Additionally, the temporal noise characteristics of the display can be ascertained. The measurements can be performed by assessing the noise characteristics across an ensemble of images acquired at 8 Hz corresponding to the integration time of the human eye.

AAPM TG18 Preprint DRAFT (version 10.0)
108 August 26, 2004
4.6.5.2 Expected Response The expected requirements for the advanced measurements of display noise characteristics have not yet been established.
1.E-10
1.E-09
1.E-08
1.E-07
1.E-06
1.E-05
1.E-04
1.E-03
1.E-02
1.E-01
0 2 4 6 8 10
Spatial frequency (cycles/mm)
NP
S (m
m^2
)
NPS w/ raster linesNPS w/o raster linesCCD camera NPS
Nyquist frequency of CRT: 3.4 mm^-1
Frequency of CRT raster lines
Fig. 50: Examples of noise power spectra in the vertical direction due to phosphor noise for a luminance value resulting from an 8-bit command level (pixel value) of 127 for the two situations in which the raster lines are visible, and the other in which they have been defocused and are not visible. 4.7 Veiling Glare 4.7.1 Description of Veiling Glare Light scattering in display devices induces a diffuse luminance that veils the intended image. In this report, the term flare is used to describe diffuse scattering of light in a photographic lens, while the term glare is used for display devices. Veiling glare is also different from reflection covered in Section 4.2, in that reflection refers to the response of a display device to incident ambient lighting conditions, while glare is an internal display property. In monochrome CRT display devices, three physical attributes contribute to veiling glare. They are internal reflections of the electrons from the aluminum layer inside the CRT (Fig. 51), generation of secondary electrons in the phosphor and aluminum layer of the CRT, and light scattering in the glass faceplate. The last attribute, which is dominant, is due to scattering of the light in the thick glass plate of the emissive structure by specular reflections from the exit surface and diffuse reflections from the phosphor layer (Badano 2000). The amount of veiling glare can be reduced by using darkened glass. In color CRT devices, the veiling glare has a substantial electronic component caused by back-scattering of the electrons from the edges of the shadow mask or aperture grill openings. These backscattered
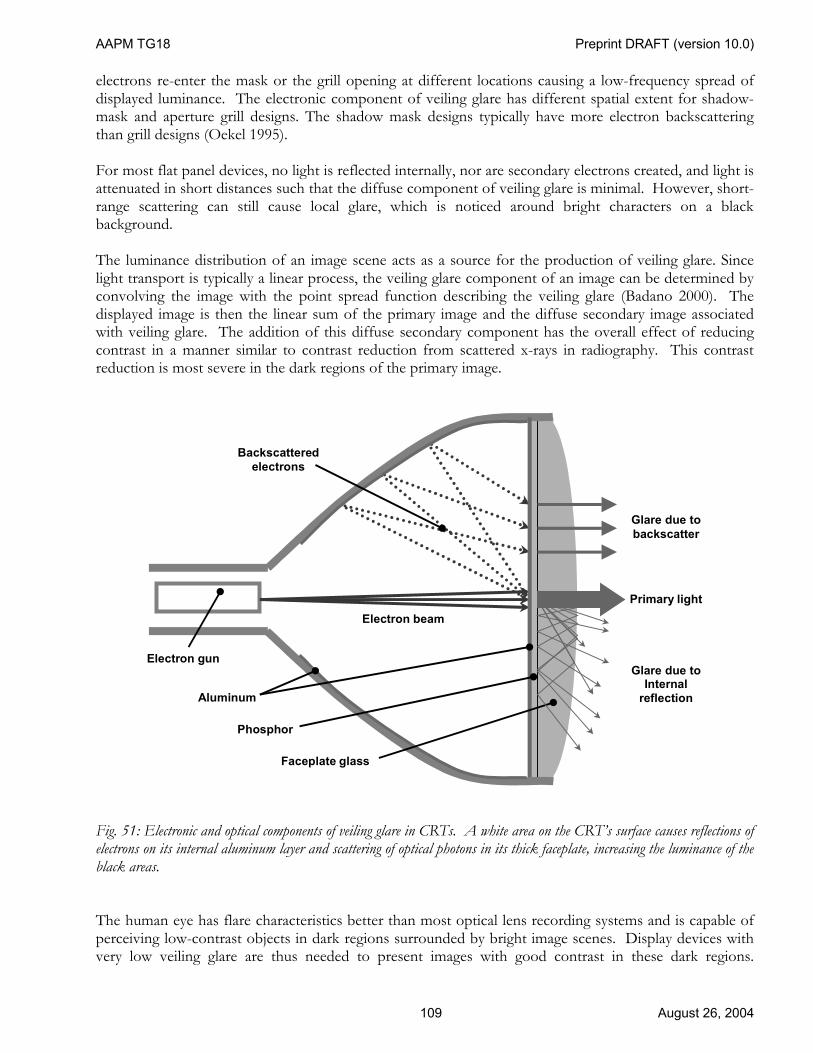
AAPM TG18 Preprint DRAFT (version 10.0)
109 August 26, 2004
electrons re-enter the mask or the grill opening at different locations causing a low-frequency spread of displayed luminance. The electronic component of veiling glare has different spatial extent for shadow-mask and aperture grill designs. The shadow mask designs typically have more electron backscattering than grill designs (Oekel 1995). For most flat panel devices, no light is reflected internally, nor are secondary electrons created, and light is attenuated in short distances such that the diffuse component of veiling glare is minimal. However, short-range scattering can still cause local glare, which is noticed around bright characters on a black background. The luminance distribution of an image scene acts as a source for the production of veiling glare. Since light transport is typically a linear process, the veiling glare component of an image can be determined by convolving the image with the point spread function describing the veiling glare (Badano 2000). The displayed image is then the linear sum of the primary image and the diffuse secondary image associated with veiling glare. The addition of this diffuse secondary component has the overall effect of reducing contrast in a manner similar to contrast reduction from scattered x-rays in radiography. This contrast reduction is most severe in the dark regions of the primary image.
Electron beam
Backscatteredelectrons
Phosphor
Aluminum
Electron gun
Faceplate glass
Primary light
Glare due to backscatter
Glare due to Internal
reflection
Fig. 51: Electronic and optical components of veiling glare in CRTs. A white area on the CRT’s surface causes reflections of electrons on its internal aluminum layer and scattering of optical photons in its thick faceplate, increasing the luminance of the black areas. The human eye has flare characteristics better than most optical lens recording systems and is capable of perceiving low-contrast objects in dark regions surrounded by bright image scenes. Display devices with very low veiling glare are thus needed to present images with good contrast in these dark regions.

AAPM TG18 Preprint DRAFT (version 10.0)
110 August 26, 2004
Conventional trans-illuminated film has essentially no veiling glare. Conventional color CRTs have substantial veiling glare which make them unsuitable as primary class medical display devices. 4.7.2 Quantification of Veiling Glare Veiling glare is measured using a test pattern with a dark region surrounded by a bright field. For image intensifiers, a central dark circle with a diameter equal to 10% of the diameter of the recorded field is specified by NEMA. There have been only a few published standards for the test pattern and method to be used for the measurement of veiling glare in display devices. The National Institute of Standards and Technology has reported results using black squares of varying size on a white background (Boynton 1992). However, a radially-symmetric pattern consisting of a circular dark spot surrounded by a circular bright area can provide experimental results that can be related to ring response functions and point response functions (Badano 2000, Badano 1999). For a particular test pattern, the veiling glare can be quantified by the ratio of the maximum luminance to the minimum luminance, referred to as the glare ratio. The glare luminance measurements require the observation of a dark region surrounded by a very bright field. Thus, a low-flare photometer device which shields the observation from the bright region is required. The measurements can be performed using either a custom-made or a telescopic photometer with a baffled funnel at one end as described in Sections 3.1.1.1 and 3.1.3. It is recommended that veiling glare be assessed using a test pattern with a black background and a central white region of 20 cm diameter. In the center of the bright circle should be a black region of 1 cm diameter. A set of glare test patterns in a standard image format can be used to establish a variety of conditions needed to complete a glare test. Alternatively, graphic software for generating test patterns can be used to generate the patterns on demand (see Section 3.1.3). 4.7.3 Visual Evaluation of Veiling Glare 4.7.3.1 Assessment Method The visual assessment of veiling glare can be accomplished using the TG18-GV and TG18-GVN test patterns. The display size must be adjusted so that the diameter of the white region is 20 cm. The observer should discern the visibility of the low-contrast objects in sequential viewing of the TG18-GVN and TG18-GV patterns with the bright region masked from view. Alternatively, a test pattern generator of the type described in Section 3.3.1 may be used. This gives one the ability to adjust the contrast (via pattern modification) of a single target at the center of a 1 cm diameter dark circle until the target is just visible under the conditions of presence and absence of a 20 cm diameter 100% bright surround. Because the human visual systems will change adaptation if it views the bright field, it is imperative that the bright field is fully blocked from view and that no reflected light from the bright field be observable. This may be accomplished by the use of a mask or cone, which shields the human eye from the surround luminance of the pattern. Furthermore, it is important to assure that the patterns are displayed with one display pixel representing each image pixel. 4.7.3.2 Expected Response No significant reduction in the contrast of the target objects should be observed between the two patterns, one with and one without the bright field. This test is sensitive to the perceived contrast of the target with a black surrounding region. If this is exactly at the just noticeable threshold, then any reduction in contrast due to the presence of the bright field will render the targets not visible. A target

AAPM TG18 Preprint DRAFT (version 10.0)
111 August 26, 2004
contrast of about 4 times the just noticeable ∆L/L is appropriate for this test in primary class display devices. For a system with 1024 digital driving levels and a calibrated display device with a luminance range of 1 to 250 cd/m2, this target contrast corresponds to a change of 4 digital driving levels which produces a ∆L/L of 0.03. Thus the 3rd object should be visible in either pattern for primary class display devices. The corresponding object for secondary class display devices is the 5th target. An unacceptable system may render these objects not visible. 4.7.4 Quantitative Evaluation of Veiling Glare 4.7.4.1 Assessment Method The quantitative evaluation of veiling glare is accomplished using a highly collimated photometer and the TG18-GQ, TG18-GQB, and TG18-GQN test patterns. It is important to assure that the patterns are displayed at the specified size. The display size must be adjusted so that the diameter of the white region is 20 cm. Furthermore, as described in Section 3.1.3, the photometer should be fully blocked from the bright luminance surrounding the central measurement point at the center of the test patterns using either a baffled photometer or a telescopic photometer with a light-blocking baffled funnel or cone. Using either of these devices, record the luminance in the center of the central dark region of the TG18-GQ pattern, L, the white luminance in the center of the white region of the TG18-GQB pattern, LB, and the background luminance value in the center of the TG18-GQN pattern, LN. The glare ratio for the display is computed as
GR = (LB – LN) / (L – LN). 4.7.4.2 Expected Response The veiling glare for a high fidelity display system should not change the contrast of a target pattern by more than 20% with and without a bright surrounding. Thus, the luminance from veiling glare should not be more than 25% of the minimum luminance for the normal operating settings of the display. Since the ratio of the maximum luminance to the minimum luminance should be about 250 (Flynn 1999a), this implies a glare ratio of 1000, which is typical of measurements made for trans-illuminated film. However, the recommended test pattern presents a scene with significantly more veiling glare in the target region than is encountered in medical imaging scenes. Though not as strict criteria which may not be achievable by certain display technologies, this report recommends that the secondary class displays have a glare ratio of greater than 150 and primary class displays have a glare ratio greater than 400 (Flynn 1999b). Glare ratio results for specific medical imaging systems are reported in the literature (Badano 2002). 4.7.5 Advanced Evaluation of Veiling Glare 4.7.5.1 Assessment Method Using the quantitative test method described above, a more complete characterization of veiling glare can be made by measuring the glare ratio as a function of the black region diameter. It is important to assure that the patterns are displayed at the specified size. The display size must be adjusted so that the diameter of the white region is 20 cm. If the veiling glare point response function is shift invariant and radially symmetric, the glare ratio data, Gi, at various radii, ri, can be reduced as an estimate of the veiling glare ring response function, R(r) (Badano 2000, Badano 1999) using

AAPM TG18 Preprint DRAFT (version 10.0)
112 August 26, 2004
rGrR
drrRGG
ii
r
riii
i
∆∆=
=− ∫+
+
/)/1()(
)(/1/1 1
1
Typically, measurements are made from 5 to 30 mm radii with finer spacing at smaller radii using the TG18-GA test patterns. 4.7.5.2 Expected Response Measurement of the veiling glare ring response function provides information regarding the spatial extent of the luminance spread. The shape of this curve is different for monochrome CRT devices, color CRT devices, and flat panel devices (Badano 1999). Anti-reflective (AR) coatings will alter the shape of the ring response function. The ring response function is particularly useful for comparing and understanding differences amongst display devices. However, this information would typically not be used to establish display requirements. 4.8 Display Chromaticity 4.8.1 Description of Display Chromaticity Measurement of display color tint is important as it pertains to matching the color of multiple gray-scale displays that might be used in a single workstation. In inherently color displays, the color tint is affected by the balance of the three primary colors forming a gray-scale image. In monochrome displays, the color tint is either affected by the phosphor type, in the case of CRTs, or the spectrum of the backlight, for the case on AMLCDs. In LCDs, color tint is further affected by the viewing angle. Display color matching has been found to be an important factor in PACS workstation acceptability, and the ability to measure color has proven beneficial during acceptance testing of new multi-head display systems (Fetterly 1998). To date, no significant clinical impacts of color mismatching have been observed. 4.8.2 Quantification of Display Chromaticity The recommended color measurement system is the 1976 CIE (Commission Internationale de l’Eclairage), CIELUV, uniform chromaticity scale. The 1976 CIELUV system was developed to address limitations in a CIE chromaticity system that was initially published in 1931 (IEC 1986, Keller 1997). The 1931 system allowed any color visible to a human observer to be specified by a pair of coordinates in a 2-dimensional color space. The coordinates were dubbed x and y. All visible colors occupy a horseshoe-shaped region in the x-y plane. The 1931 color space could be used, for example, to determine what color would result from mixing different proportions of two colors by drawing a line between the source colors and moving proportionally along the line. Because of the nonlinear nature of the HVS, equal distances in the 1931 color space did not represent equally perceivable color changes. This was a principal drawback addressed in the 1976 CIELUV color system. In the CIELUV system, the 1931 color space was linearly warped so that equal distances anywhere in the new color space represented equal perceived color differences. This modification did, however, introduce a limitation for color mixture analysis, such as mentioned above. The CIELUV system is based on two new coordinates, u’ and v’, that can be related back to the original 1931 coordinates x and y via fractional linear transformation.

AAPM TG18 Preprint DRAFT (version 10.0)
113 August 26, 2004
To quantify color uniformity, a colorimeter is used to measure the system coordinates u’ and v’ for all display devices attached to a workstation. The distance between pairs of (u’,v’) points is linearly proportional to the perceived color difference expressed in terms of just-noticeable-difference (JND) index. Once (u’,v’) are measured for each display device, a color uniformity parameter is computed as the maximum distance between any possible pair of (u’,v’) points. Distance (D) between two points (u1’,v1’) and (u2’,v2’) is calculated using D = ( (u1’-u2’)2 + (v1’-v2’)2 )1/2. The distance represented by the color uniformity parameter is equivalent to the diameter of the smallest circle in the color space that can encompass all of the (u’,v’) points. In this report, color uniformity is specified by the delta-u'v' metric and not by other metrics for a number of reasons. First, delta-u'v' is part of the ISO, VESA, and IEC standards. Secondly, the delta-u'v' metric offers a luminance-independent metric for screen uniformity. Finally, delta-u'v' is proven to be an effective measure of color uniformity and is much less complicated than other metrics. 4.8.3 Visual Evaluation of Display Chromaticity 4.8.3.1 Assessment Method The visual assessment of color uniformity is performed using the TG18-UN80 test pattern. Display the pattern on all the display devices associated with a workstation. Discern the relative color uniformity of the displayed pattern across the display area of each display device and across different display devices. 4.8.3.2 Expected Response No significantly perceivable color differences should be present among display devices and across the display area of each device for primary class devices. With monochrome phosphor-based displays such as CRTs, any perceivable differences can be attributed to the use of different phosphors (e.g., P45 and P104), different batches of phosphor materials in the manufacturing process, aging of multiple component phosphors, or differences in faceplate anti-reflection/glare treatments. No requirements are specified for secondary class displays. 4.8.4 Quantitative Evaluation of Display Chromaticity 4.8.4.1 Assessment Method Display the TG18-UNL80 test pattern on all the display devices associated with a workstation. Using a colorimeter, measure the (u’,v’) color coordinates at the center and at the four corners of the display area of each display device, and average these coordinates to produce a mean (u’,v’) chromaticity measurement for the display device. Repeat the measurements for all display devices and compute the color uniformity index as the maximum distance in u’-v’ space between any possible pair of average (u’,v’) points using D = ( (u1’-u2’)2 + (v1’-v2’)2 )1/2. If the colorimeter used outputs the color coordinate in the older (x,y) space, the values can be converted to (u’,v’) space using the following transformations:
u' = 4x / ( -2x + 12y + 3 ) v' = 9y / ( -2x + 12y + 3 ) or x = 27u' / ( 18u' - 48v' + 36 ) y = 12v' / ( 18u' - 48v' + 36 )

AAPM TG18 Preprint DRAFT (version 10.0)
114 August 26, 2004
4.8.4.2 Expected Response Based on clinical experience, a color uniformity parameter of 0.01 or less is necessary to assure acceptable color-matching of primary class gray-scale display devices of a workstation (Fetterly 1998). The distance between any pair of color coordinates across the display area of each device should also not exceed this limit. No quantitative requirements are specified for secondary class displays. 4.8.5 Advanced Evaluation of Display Chromaticity 4.8.5.1 Assessment Method Some display devices may demonstrate a color shift as a function of viewing angle, particularly for certain types of flat panel devices. Advanced tests may be used to evaluate the chromaticity as a function of viewing angle. This can be done with collimated or focused colorimeter probes or CCD test devices specifically equipped to measure color over the full field of an image. For these advanced tests, color coordinates should be measured for uniform fields with low, medium and high luminance. 4.8.5.2 Expected Response For advanced measurements, the color uniformity parameter for primary class displays should not exceed 0.01 for all viewing angles within the useable viewing angle range and for all luminance values tested. No advanced requirements are specified for secondary class displays. 4.9 Miscellaneous Tests In addition to the primary display attributes described above, there are a number of secondary attributes that may need to be addressed in a full display performance evaluation. Brief descriptions and assessment methods for these characteristics are outlined below. 4.9.1 CRT Displays 4.9.1.1 Artifacts 4.9.1.1.1 Description CRT devices are prone to a number of video artifacts. Ghosting or shadowing appears as a sort of shadow or mirror image around structures, particularly characters. It is usually caused by an impedance mismatch, often in the video cable or in the termination within the display device itself. When multiple display devices are configured into a workstation, such a mismatch can also be induced by using cables of varying lengths or inadequate shielding. Smearing is a bright to dim shadow easily seen trailing to the right from a bright area, such as the test patches on the TG18-QC pattern. Like ghosting, the cause can be either an internal or external (i.e., video cable connection) impedance mismatch, or a defective cable or controller card. Jitter and swim are two other artifacts that can appear at fixed or random locations. They are most visible at the edge of the display area and are due to instability in the video card sync output or the display itself. Yoke ringing, or simply ringing, is the term used to describe a number of vertical white lines at the left edge of the screen. They are typically visible in the first few centimeters of a new raster line. The source
AAPM TG18 Preprint DRAFT (version 10.0)
115 August 26, 2004
of this artifact is a crosstalk between the deflection yoke’s horizontal and vertical windings, inductance resulting from the fields collapsing during retrace. From the time of the horizontal synchronization pulse until the next video line starts, there needs to be a design-dependent damping period that permits the cross-talk to be fully damped. Fixed frequency displays will normally state specific timing capabilities that provide for the damping. Multi-frequency displays covering a broad range of horizontal timings also have a minimum time period. Low cost, commercial video controllers using lower cost DAC’s do not always provide sufficient damping periods resulting in instabilities and horizontal jitter. This problem also causes an inability to center the video signal within the display area. In a system with a sufficient damping period, there are over-scans, i.e., the raster is larger than the usable display area. If the active video drifts into this blanked area, ringing artifacts may appear, which would require a readjustment of the device. Such readjustments are often made by a service engineers. Breathing or pulsing of the video is caused by poor or failing high voltage regulation. The appearance can be deceiving to the observer. The video area is actually expanding in size as the high-voltage is lowered during a transition from a dark screen to a bright screen. The opposite occurs when the transition is from a bright screen to a dark screen. Non-regulated high voltage circuits are more typical of commercial color displays. Medical displays should have either a regulated HV supply independent of the horizontal circuits or a regulated fly-back. In extreme cases, a high-voltage supply that cannot recover during horizontal retrace, but does on vertical retrace, will have a luminance non-uniformity with the upper left corner being the brightest and values falling as the scan progresses to the bottom. 4.9.1.1.2 Evaluation Method Examine the white-to-black and black-to-white signal changes in the appropriate portions of the TG18-QC test pattern. The pattern should be examined from a viewing distance of 30 cm. The transitions should be abrupt, with little to no evidence of a slow transition or “tail,” overshoot, shadowing, or ghosting. The pattern overall should be free of any artifacts. 4.9.1.2 Moiré Patterns 4.9.1.2.1 Description Color displays exhibit Moiré patterns when the addressable pixel format is not matched with the shadow mask or aperture grill dot pitch. The aliasing is a periodic pattern seen as a rainbow of colors floating in the glass. Most commercial color displays have adjustments for both vertical and horizontal Moiré. The approaches taken by the manufacturers have been either to adjust the phase of both axes or modify the focus values to diminish Moiré. Monochrome displays can also exhibit Moiré caused by invisible artifacts in the glass that beat with the scan rate. In this case, selecting a slower or faster refresh rate on the video card will usually remove the problem. 4.9.1.2.2 Evaluation Method Moiré patterns are most noticeable when the displayed pixel size approaches the spacing or pitch of the color phosphor trio. Regular patterns of alternating On-Off-On-Off pixels such as checkerboards or grilles tend to enhance the visibility of Moiré patterns. Alternating pixel patterns displayed at low luminance levels may exhibit increased Moiré if the pixel size decreases with beam current as is typically the case for CRTs. It is usually sufficient to use alternating pixel patterns to visually inspect for the presence of objectionable Moiré and to evaluate the effectiveness of Moiré cancellation circuits. Moiré

AAPM TG18 Preprint DRAFT (version 10.0)
116 August 26, 2004
cancellation methods often introduce negative side effects such as defocused spots and/or jitter. It is important to determine whether such side effects noticeably degrade the image. 4.9.1.3 Color Artifacts 4.9.1.3.1 Description Color convergence in color CRTs is a factory setting performed in the alignment procedures for the yoke and guns that must function as a matched set. Color CRTs are purchased by display manufacturers as pre-aligned assemblies and may not be adjustable in the field. In medical applications using color display devices to display gray scale images, color misconvergence often appears as a colored ghost or shadow, usually around sharp edges and characters. Poor color purity also occurs because of poor color registration whereby a percentage of one gun is landing on another color phosphor. Degaussing circuits automatically activate when the CRT display device is powered on to demagnetize the shadow mask so as to negate any ambient magnetic field which may otherwise disrupt the registration between the individual beams and their respective red, green and blue phosphors on the screen. Another potential cause of color errors is mis-matched video amplifiers in that the rise and fall time on one does not track with the other two. Again, ghosting of one color will be noticed on either the leading or trailing edge (or both) of characters. In addition, when one or more of the video amplifiers is overdriven, it may become saturated causing a visible horizontal streak (sometimes called bleed) from the trailing edge of a displayed object or character. This condition is often avoided by reducing Lmax using the contrast control. It should be noted that color purity can be mistaken with misconvergence if it is not localized. Misconvergence refers to any separation between individual beams at the screen. Some displays provide a dynamic adjustment for convergence and are user correctable. 4.9.1.3.2 Evaluation Method Convergence is evaluated by inspecting a crosshatch pattern consisting of two or more primary colors. Handheld optical devices (e.g., Klein Gauge) provide a quantitative measure of the misconvergence. Advanced photometric measurements require the use of a CCD camera to locate the centroids of individual red, green and blue spots. Color registration errors are assessed the same as luminance uniformity on monochrome displays, except individual red, green and blue primaries are evaluated. For full screen white, the CIE color coordinates are recorded in addition to the luminance. Color bleeding (streaking) is assessed for white and individual red, green and blue primaries in the same way as are video artifacts in monochrome displays. 4.9.1.4 Physical Defects 4.9.1.4.1 Description Defects in the screen of a CRT can be categorized as either glass or phosphor blemishes. Manufacturers screen for phosphor defects such as voids and particle contamination and reject the display device according to the size and position of the defect(s). On site physical damage to the phosphor is rare but

AAPM TG18 Preprint DRAFT (version 10.0)
117 August 26, 2004
not impossible. Phosphor burn is still a real possibility in spite of the universal use of screen savers. Hours of use reading one type of image or displaying a menu bar will ultimately affect the phosphor. Glass defects occur when the faceplate is formed. Very small particles in the glass may appear as dark specks but may also disappear when the display is turned on. Occlusions are caused by trapped gas during forming and are voids in the glass. Visually they appear like cracks because of the opposing surfaces reflecting light. 4.9.1.4.2 Evaluation Method Display artifacts can be evaluated using a uniform test pattern, TG18-UN80. The pattern should appear uniform without any of the defects described above. 4.9.1.5 Flicker 4.9.1.5.1 Description While not an artifact per se, it is one of the more distracting and disturbing characteristics of a softcopy display. Flicker is a description of the human perception of the vertical refresh as well as the interference of the refresh rate with other periodic sources of illumination. We see flicker more at high luminance levels and lower refresh rates under 65 Hz. Peripheral vision is also more sensitive to flicker. Interference from fluorescent lights is the most common cause of the perception of flicker. At refresh rates above 72 Hz most people will not be significantly bothered, and at rates over 80 Hz very few people will perceive any flicker. CRT displays operating at or near 60 Hz refresh rates should be avoided. LCD displays typically exhibit no flicker even at refresh rates as low as 20 Hz. Phosphor decay is the performance characteristic that causes flicker. The proper matching of refresh rates and phosphor will minimize flicker. The two dominant medical phosphors, P104 and P45, at or above 72 Hz refresh rate will satisfy a majority of the general population. 4.9.1.5.2 Evaluation Method The presence of flicker can be visually ascertained using the TG18-UN80 test pattern at a viewing distance of 30 cm. The flicker should be evaluated for both foveal and peripheral visions. For quantitative assessment of flicker, VESA standards can be consulted (VESA 2001). 4.9.2 LCD Displays The image quality of flat panel LCD displays is affected by the specific way these devices generate the image for the viewer. The significant differences with respect to the CRT merit a separate discussion introducing the factors that have to be considered when assessing the performance of a LCD, and the artifacts that can be found in displaying medical images. In this section, we describe two factors that affect the image quality of flat-panel displays in displaying static images, electronic cross-talk, and pixel defects. Other aspects that are not covered here are angular variations in the luminance (covered in Section 4.4), temperature effect (particularly important in LCDs), and mura patterns (visible non-uniformity due to imperfections in the display pixel matrix surface).

AAPM TG18 Preprint DRAFT (version 10.0)
118 August 26, 2004
4.9.2.1 Electronic Cross-talk 4.9.2.1.1 Description Of particular importance to high-resolution display devices with large numbers of gray levels is the scene-dependent, undesired artifact caused by crosstalk in the active matrix array circuitry. Crosstalk is primarily an electronic term designating unwanted coupling between adjacent or nearby circuits. In AMLCDs, crosstalk is associated with the modification of the intended voltage across the liquid crystal cell that results in an undesired alteration of the pixel luminance. The artifact is caused by incomplete pixel charging, by currents through the thin-film transistor, and by displacement currents determined by parasitic capacitive coupling. Display crosstalk is more important for large-sized panels having higher resolution and gray-scales (Libsch 1998). Although having different origins, cross-talk artifacts have also been studied for passive-matrix polymer light-emitting displays. Even for medium resolution display devices, crosstalk can affect the level of a centrally located small target by as much as 1% (Badano 2000). Careful material selection, improved driving schema, precision in fabrication process, and device design optimization have been used to reduce cross-talk artifacts. The use of low-capacitance design and the selection of higher conductivity metals, such as copper, for the scan lines reduce occurrences of incomplete pixel charging. In addition, integrating a black matrix acting as a light shield for the a-Si:H TFT reduces photo-generated leakage currents. 4.9.2.1.2 Evaluation Methods Measurements of crosstalk involve the use of bar patterns where a small target within the bar is at a different luminance level than the rest of the bar. Patterns with horizontal and vertical bars are useful since crosstalk can be present along both directions, depending on the display device architecture. The variations of target gray level when the background level changes can be recorded with a luminance-meter. An advanced test should use a luminance-meter that records target luminance without contamination from the background gray level, as described in Section 3.1.1.1 (Badano 2000, Wright 1999, VESA 2001). As a visual test, the crosstalk element of the TG18-QC test pattern may be used. When examined with the surround regions masked from view, the central low contrast vertical target of the element should exhibit constant contrast along its length. Significant variations are indicative of objectionable crosstalk in the horizontal direction. The pattern should also be examined with 90-degree rotation for evaluating the presence of crosstalk in the vertical direction. 4.9.2.2 Pixel defects 4.9.2.2.1 Description Defective pixels are pixels that operate improperly when addressed with proper signal. Pixel defects can be classified as stuck pixel (never change state), intermittent pixel (change state independently of addressing signal), and defective pixel (state does not correspond with addressing signal). Off pixels are pixels that remain black for all signals, while partial pixels are pixels that have defective sub-pixels. Most frequently for LCD with sub-pixels, the pixels are only partially defective. 4.9.2.2.2 Evaluation Methods The number of pixel defects in a matrix-addressed display should be assessed visually on a frequent basis and compared with a given tolerance. They should also be characterized in terms of proximity or

AAPM TG18 Preprint DRAFT (version 10.0)
119 August 26, 2004
clustering in the display area. Quantitative methods have been proposed both in ISO standards (ISO 13406-2) and in the Flat Panel Display Measurements Standard (VESA 2001) for such measurements. 4.10 Overall Evaluations In addition to the testing a display device for a specific performance characteristic, the overall quality of a system can be assessed using a comprehensive visual/quantitative approach. Overall assessment can be based on any of the recommended multi-purpose test patterns. Each pattern should be displayed with one display pixel representing each image pixel and examined from a viewing distance of 30 cm. The findings can be correlated with the results of more focused testing methods specified above and serve as a basis for quality control assessments. The frequency of such an evaluation is discussed in Chapter 6. 4.10.1 Evaluations using TG18-QC Pattern The appearance of the elements in the TG18-QC test pattern can be used to assess the overall performance of display systems. The following are recommended:
1. General image quality and artifacts: Evaluate the overall appearance of the pattern. Note any non-uniformities or artifacts, especially at black-to-white and white-to-black transitions. Verify that the ramp bars appear continuous without any contour lines.
2. Geometric distortion: Verify that the borders and lines of the pattern are visible and straight and that the pattern appears to be centered in the active area of the display device. If desired, measure any distortions (see Section 4.1.3.2).
3. Luminance, reflection, noise, and glare: Verify that all 16 luminance patches are distinctly visible. Measure their luminance using a luminance-meter if desired, and evaluate the results in comparison to the DICOM standard (Section 4.3.3.2). Verify that the 5% and 95% patches are visible. Evaluate the appearance of low contrast letters and the targets at the corners of all luminance patches with and without ambient lighting.
4. Resolution: Evaluate the Cx patterns at the center and corners of the pattern and grade them compared to the reference score (see Section 4.5.3.1). Also verify the visibility of the line-pair patterns at the Nyquist frequency at the center and corners of the pattern, and if desired, measure the luminance difference between the vertical and horizontal high-modulation patterns (see Section 4.5.3.1).
4.10.2 Evaluations using TG18-BR Pattern In using the TG18-BR pattern the viewer assesses the checkerboard patterns to discern the smallest checkerboard that can be distinguished in each panel of a quadrant. Quadrants are read clockwise from upper-left to lower-left. Within each quadrant, the panels are also read clockwise. A magnifier can be used for reading the smallest checkerboards. Refer to Section 3.2.1.4 for specific details on checker/checkerboard sizes and scoring. A display with sufficient bandwidth and proper setup will have a balanced response from the darkest to the brightest panel with equal perception of the checkerboards. On primary class display systems, the B-60 checkerboard should be easily observed in all panels and quadrants. Displays with balanced response characteristics can be read up to B-90 in the 3rd and 4th quadrants, B-80 in the 2nd quadrant and B-60 in the 1st quadrant. Performance above this level is exceptional. This level of performance is indicative of a high-quality 1600x1200, 21 inch, monochrome CRT.

AAPM TG18 Preprint DRAFT (version 10.0)
120 August 26, 2004
4.10.3 Evaluations using TG18-PQC Pattern While this report is intended for the assessment of electronic display devices, the images displayed on such devices are often printed on transparent film for interpretation on an illuminator. The TG18-PQC is a multi-purpose test pattern primarily designed to insure that the appearance of printed images is similar to that of electronic display devices. Using the central column of the pattern, the film optical density of the 18 marked regions should be recorded. Secondly, the average luminance of the illuminator used for viewing films should be measured. The luminance of the 18 regions should then be computed from the optical density and illuminator luminance measurements. These luminance values should be evaluated to establish that the print device is properly set up to yield a luminance response consistent with the gray scale display standard. As described in Section 4.3.4.2.2, this is best done by evaluating the contrast response. Modern film printers that are properly maintained will generally not exhibit problems with resolution, distortion, or noise. A quick visual test of resolution can be done using the bar patterns at the top and bottom of the PQC test pattern. For this, the size of the test pattern should be matched to the size of the print matrix for the printer being used so that there is a one to one correspondence between image pixels and printer pixels. At each luminance step, a set of low contrast bars of varying size and contrast can be examined to determine whether the prints have aberrant noise. Finally, the ramp pattern at the right and left of the PQC pattern should be examined to determine whether any contrast artifacts are present. 4.10.4 Evaluations using TG18-LP Patterns The TG18-LP test patterns can be used to visually establish whether the resolution of a display device is acceptable. The low luminance test pattern should be displayed first for both the horizontal and vertical bar patterns. Using a consistent viewing condition, the patterns should be examined to establish that the pattern of one line pair for every two pixels could be seen in all regions of the display. Any region where the pattern is not visible is indicative of a device with aberrant resolution at that position. Since high performance devices have very small pixels, a large field of view magnifying glass in convenient for evaluating this test pattern. If the performance at low brightness is satisfactory, the performance should be similarly evaluated with the mid and the high luminance horizontal and vertical test patterns. Again, any indication that the line pair pattern is not visible in all regions is an indication of improper resolution performance. 4.10.5 Evaluations using Anatomical Images A radiologist should evaluate the overall clinical image quality of the display using patient images. As part of this report patient images TG18-CH, TG18-KN, TG18-MM1, and TG18-MM2 are supplied for this purpose. These correspond to a chest radiograph, a knee radiograph, and two digital mammograms. Clinical criteria for evaluating these images are given in Table 6. The images may be scored according to these criteria corresponding to the different image features. The radiologist who wishes to evaluate his/her display should independently rate the image features according to the criteria in Table 6, and then compare their ratings to those obtained with a high-quality trans-illuminated film print of the patterns. Significant discrepancies need to be brought to the attention of the responsible medical physicist or service engineer.

AAPM TG18 Preprint DRAFT (version 10.0)
121 August 26, 2004
Table 6: Criteria for evaluating the TG18 anatomical images
Test pattern Evaluation Criteria TG18-CH Degree of difficulty for exam
Overall contrast Overall sharpness Symmetrical reproduction of the thorax, as shown by the central position of a spinous process between the medial ends of the clavicles Medial border of the scapulae Reproduction of the whole rib cage above the diaphragm Visually sharp reproduction of the vascular pattern of the lungs, particularly the peripheral vessels Sharp reproduction of the trachea and proximal bronchi Sharp reproduction of the borders of the heart and the aorta Sharp reproduction of the diaphragm Visibility of the retrocardiac lung and the mediastinum Visibility of the sub-diaphragmatic features Visibility of the spine through the heart shadow Visibility of small details in the whole lung, including the retrocardiac areas Visibility of linear and reticular details out to the lung periphery
TG18-KN Degree of difficulty for exam Overall contrast Overall sharpness Reproduction of trabecular detail Reproduction of bony and soft tissue
TG18-MM1 and TG18-MM2
Degree of difficulty for exam Overall contrast and brightness Overall sharpness (no blur) Sharp appearance of Cooper's ligaments Structure of the clip and the presence of the gap at its apex (TG18-MM1 only) Appearance and visibility of subtle microcalcifications (TG18-MM1 only) Visibility of structures at the margins of the breast (TG18-MM1 only)

AAPM TG18 Preprint DRAFT (version 10.0)
122 August 26, 2004
5 Acceptance Testing of a Display System Previous sections described the methods for assessing the performance of a display system. In this section, we specifically outline the recommended tests to be performed as a part of an acceptance testing procedure with references back to detailed tests and equipment in Sections 3 and 4. 5.1 Prerequisites for Acceptance Testing As in any acceptance testing initiative, the display acceptance testing is justified and meaningful only if it is directly linked to the contract between the user and the vendor, commonly in the form of a Request for Proposal (RFP) or Request for Quotation (RFQ). In the contract, the user must specifically delineate the engineering specification for the display device, acceptance testing procedures, definitive acceptance criteria, and the actions to be taken should non-compliance be identified. Other prerequisites for acceptance testing of a display device are described below. 5.1.1 Personnel The acceptance testing of a display system must be performed by an individual(s) having appropriate technical and clinical competencies. Even though the vendor is expected to perform some testing before turning a display system over to the user, the user must independently test the system(s). Medical physicists trained in display performance assessments should perform the tests. Other staff including biomedical engineers, in-house service electronic technicians, or trained x-ray technologists can perform most of the tests described herein; however, the Medical Physicist should accept oversight responsibilities, both for the training of support staff as well as for final approval of the results. 5.1.2 Preliminary Communications Preliminary communication with the vendor is essential for understanding how the system is intended to be operated and how the test patterns of interest can be loaded on the system. Some systems come with dedicated QC utilities. The details and usage of these utilities must be fully documented and understood beforehand. Any recommended service and/or calibration schedule, including the services provided, tests performed, and the service/calibration intervals, must be obtained from the manufacturer ideally as part of the purchasing process. 5.1.3 Component Inventory Prior to acceptance testing, the characteristics of the display systems delivered should be verified against those specified in the purchase agreement. A database should be established which includes information such as display type, size, resolution, manufacturer, model, serial number, manufacture date, room number, display ID (if applicable), associated display hardware (e.g. display controller) and test patterns available on the systems. 5.1.4 Initial Steps The following procedures are recommended prior to acceptance testing of the display device:
1. Review all delivered documentation from the vendor. Especially note the quality testing results performed in the factory.

AAPM TG18 Preprint DRAFT (version 10.0)
123 August 26, 2004
2. Verify the availability of desired tools (see Sections 3.4.1 and 5.2, and Table 7). 3. Check display placement (see Section 3.4.2). 4. Follow the start-up procedures (see Section 3.4.3). 5. Document the ambient lighting level (see Section 3.4.4). 6. Calibrate/verify the Lmax and Lmin,, and Brightness and Contrast settings (see Section 3.4.5). 7. If applicable, verify/perform a DICOM luminance calibration (see Section 3.4.6).
5.2 Tests and Criteria Table 7 provides a list of the tests to be performed at acceptance testing, the required tools, and the expected performance. In addition to the tests specified in Table 7, other miscellaneous tests as described in 4.9 and some of the overall assessment tests as specified in Section 4.10 can be used to establish baseline performance for future quality control tests. Depending on the interest and resources, additional advanced tests are further encouraged as a part of acceptance testing. The use of worksheets and checklists will help in recording the results and performing the desired calculations. Note that all the visual tests should be performed from a viewing distance in the range of 30 cm unless otherwise noted in the testing procedures.
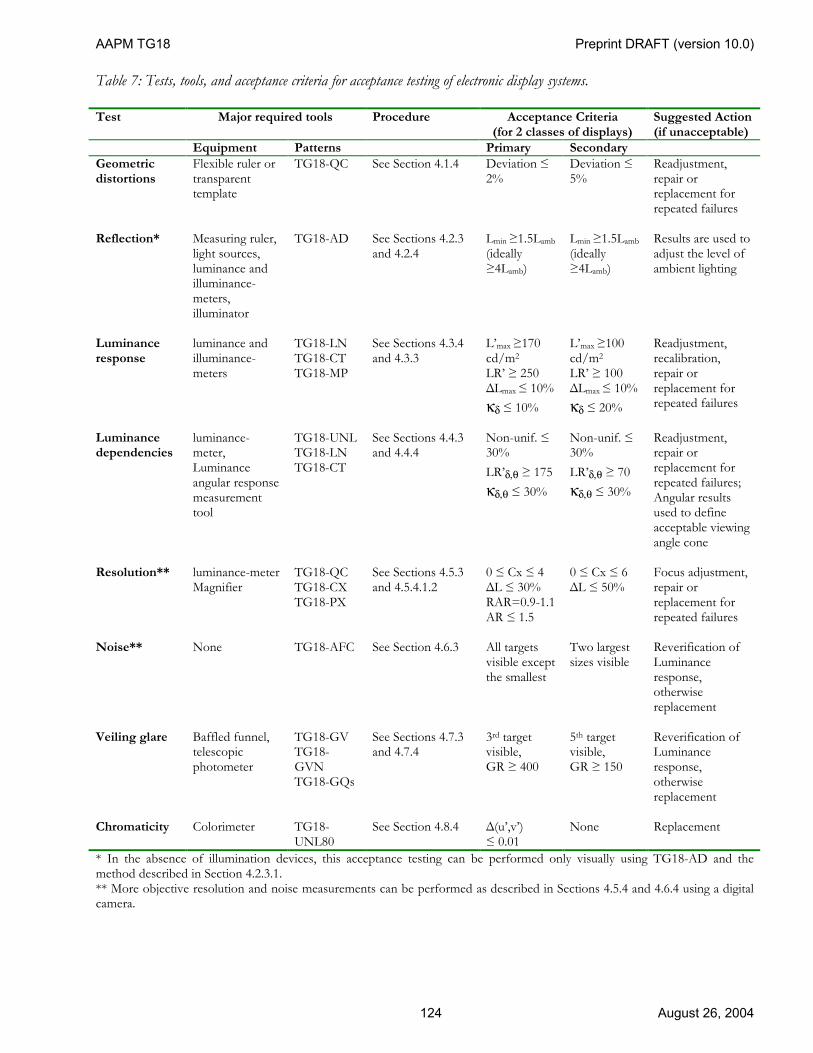
AAPM TG18 Preprint DRAFT (version 10.0)
124 August 26, 2004
Table 7: Tests, tools, and acceptance criteria for acceptance testing of electronic display systems. Test Major required tools Procedure Acceptance Criteria
(for 2 classes of displays) Suggested Action (if unacceptable)
Equipment Patterns Primary Secondary Geometric distortions
Flexible ruler or transparent template
TG18-QC See Section 4.1.4 Deviation ≤ 2%
Deviation ≤ 5%
Readjustment, repair or replacement for repeated failures
Reflection* Measuring ruler,
light sources, luminance and illuminance-meters, illuminator
TG18-AD See Sections 4.2.3 and 4.2.4
Lmin ≥1.5Lamb (ideally ≥4Lamb)
Lmin ≥1.5Lamb (ideally ≥4Lamb)
Results are used to adjust the level of ambient lighting
Luminance response
luminance and illuminance-meters
TG18-LN TG18-CT TG18-MP
See Sections 4.3.4 and 4.3.3
L’max ≥170 cd/m2 LR’ ≥ 250 ∆Lmax ≤ 10% κδ ≤ 10%
L’max ≥100 cd/m2 LR’ ≥ 100 ∆Lmax ≤ 10% κδ ≤ 20%
Readjustment, recalibration, repair or replacement for repeated failures
Luminance dependencies
luminance-meter, Luminance angular response measurement tool
TG18-UNL TG18-LN TG18-CT
See Sections 4.4.3 and 4.4.4
Non-unif. ≤ 30% LR’δ,θ ≥ 175 κδ,θ ≤ 30%
Non-unif. ≤ 30% LR’δ,θ ≥ 70 κδ,θ ≤ 30%
Readjustment, repair or replacement for repeated failures; Angular results used to define acceptable viewing angle cone
Resolution** luminance-meter
Magnifier TG18-QC TG18-CX TG18-PX
See Sections 4.5.3 and 4.5.4.1.2
0 ≤ Cx ≤ 4 ∆L ≤ 30% RAR=0.9-1.1 AR ≤ 1.5
0 ≤ Cx ≤ 6 ∆L ≤ 50%
Focus adjustment, repair or replacement for repeated failures
Noise** None TG18-AFC See Section 4.6.3 All targets
visible except the smallest
Two largest sizes visible
Reverification of Luminance response, otherwise replacement
Veiling glare Baffled funnel,
telescopic photometer
TG18-GV TG18-GVN TG18-GQs
See Sections 4.7.3 and 4.7.4
3rd target visible, GR ≥ 400
5th target visible, GR ≥ 150
Reverification of Luminance response, otherwise replacement
Chromaticity Colorimeter TG18-
UNL80 See Section 4.8.4 ∆(u’,v’)
≤ 0.01 None Replacement
* In the absence of illumination devices, this acceptance testing can be performed only visually using TG18-AD and the method described in Section 4.2.3.1. ** More objective resolution and noise measurements can be performed as described in Sections 4.5.4 and 4.6.4 using a digital camera.

AAPM TG18 Preprint DRAFT (version 10.0)
125 August 26, 2004
6 Quality Control of a Display System Previous sections described in detail the methods for assessing the performance of a display system. In this section, we specifically outline the recommended tests to be performed as a part of a quality control program with references back to Sections 3 and 4 for detailed description of the tests and equipment. 6.1 Prerequisites for Quality Control The performance of electronic display systems needs to be tested on a periodic basis as outlined below. There is some flexibility is the required periodicity of the QC tests as hardware features and reproducible performance can reduce the need for very frequent testing. It is recommended that initial testing be done more frequently, and an assessment made on the results. If stability is maintained, a determination can be made to decrease the frequency of testing based on validated results. Additionally, some manufacturers offer automated software tools that facilitate the QC tests. These software tools are acceptable for use, as long as they are validated against standard methods described in this report. 6.1.1 Personnel The QC procedures must be performed by individuals with appropriate technical and clinical competencies. The daily QC of a display system should be performed by the operator/user of the system. Radiology staff using electronic displays should be familiar with the daily testing procedure and expected results. For less frequent tests, designation of responsible personnel will ensure that these individuals develop and maintain familiarity with the tests, reducing variability in the QC data and in the interpretation of the results. These individuals should be under the supervision of a Medical Physicist. The annual QC evaluation should be performed by a qualified medical physicist or by a QC technologist working under the close supervision of a qualified medical physicist. All personnel responsible for performing QC tests will require initial training specific to their level of responsibility and periodic re-training and mentoring by Medical Physics staff. 6.1.2 Availability of Prior Evaluations The initial acceptance testing data are used to establish and maintain expected performance. Data acquired during routine QC testing must be compared to the limits established around the baseline values. It is also essential to utilize the same pattern for repeat evaluations of a given display device. The use of worksheets and checklists will help in establishing and monitoring the baselines. It is strongly recommended to record and maintain this information in electronic databases. Most commercial calibration packages support automated recording, tracking and analysis. 6.1.3 Initial Steps The following procedure should be followed before performing any QC tests except for daily QC.
1. Review the results of previous QC tests. 2. Verify the availability of desired tools (see Sections 3.4.1 and 6.2, and Table 8). 3. Check display placement (see Section 3.4.2). 4. Follow the start-up procedures (see Section 3.4.3). 5. Document the ambient lighting level (see Section 3.4.4). 6. Calibrate/verify the Lmax and Lmin,, and Brightness and Contrast settings (see Section 3.4.5).

AAPM TG18 Preprint DRAFT (version 10.0)
126 August 26, 2004
7. If applicable, verify/perform a DICOM GSDF luminance calibration (see Section 3.4.6). 6.2 Tests and Criteria Tables 8a-c provide an outline of the tests to be performed as a part of a routine QC program, the required tools, and the expected performance. In addition to the stated tests, other overall assessment tests as specified in Section 4.10 can be used as a part of a routine QC program. Note that all the visual tests should be performed from a viewing distance in the range of 30 cm unless otherwise noted in the testing procedures. Table 8a: Tests for daily quality control of electronic display system, performed by the display user. Test Major required tools Procedure Acceptance Criteria
(for 2 classes of displays) Suggested Action (if unacceptable)
Equipment Patterns Primary Secondary Overall visual assessment
None TG18-QC or anat. images
See Sections 4.10.1 or 4.10.6
See Sections 4.10.1/4.10.6
See Sections 4.10.1/4.10.6
Further /closer evaluation
Table 8b: Tests for monthly/quarterly quality control of electronic display systems performed by a medical physicist, or by a QC technologist under the supervision of a medical physicist. Test Major required tools Procedure Acceptance Criteria
(for 2 classes of displays) Suggested Action (if unacceptable)
Equipment Patterns Primary Secondary Geometric distortions
None TG18-QC See Section 4.1.3.1 See 4.1.3.2 See 4.1.3.2 Further /closer evaluation
Reflection luminance and
illuminance-meters
TG18-AD See Sections 4.2.3 and 4.2.4
Lmin ≥1.5Lamb (ideally ≥4Lamb)
Lmin ≥1.5Lamb (ideally ≥4Lamb)
Readjust the level of ambient lighting
Luminance response
luminance and illuminance-meters
TG18-LN TG18-CT TG18-MP
See Sections 4.3.4 and 4.3.3
L’max ≥170 cd/m2 LR’ ≥ 250 ∆Lmax ≤ 10% κδ ≤ 10%
L’max ≥100 cd/m2 LR’ ≥ 100 ∆Lmax ≤ 10% κδ ≤ 20%
Readjustment, recalibration, repair or replacement for repeated failures
Luminance dependencies
luminance-meter TG18-UN TG18-UNL
See Sections 4.4.3 and 4.4.4
Non-unif. ≤ 30%
Non-unif. ≤ 30%
Readjustment, repair or replacement for repeated failures
Resolution Magnifier TG18-QC
TG18-CX See Sections 4.5.3 0 ≤ Cx ≤ 4
0 ≤ Cx ≤ 6 Focus adjustment,
repair or replacement for repeated failures
Noise NA NA NA NA NA NA Veiling glare NA NA NA NA NA NA Chromaticity NA NA NA NA NA NA

AAPM TG18 Preprint DRAFT (version 10.0)
127 August 26, 2004
Table 8c: Tests for annual quality control of electronic display systems performed by a medical physicist.
Test Major required tools Procedure Acceptance Criteria
(for 2 classes of displays) Suggested Action (if unacceptable)
Equipment Patterns Primary Secondary Geometric distortions
Flexible ruler TG18-QC See Section 4.1.4 Deviation ≤ 2%
Deviation ≤ 5%
Readjustment, repair or replacement for repeated failures
Reflection luminance and
illuminance-meters
TG18-AD See Sections 4.2.3 and 4.2.4
Lmin ≥1.5Lamb (ideally ≥4Lamb)
Lmin ≥1.5Lamb (ideally ≥4Lamb)
Readjust the level of ambient lighting
Luminance response
luminance and illuminance-meters
TG18-LN TG18-CT TG18-MP
See Sections 4.3.4 And 4.3.3
L’max ≥170 cd/m2 LR’ ≥ 250 ∆Lmax ≤ 10% κδ ≤ 10%
L’max ≥100 cd/m2 LR’ ≥ 100 ∆Lmax ≤ 10% κδ ≤ 20%
Readjustment, recalibration, repair or replacement for repeated failures
Luminance dependencies
luminance-meter TG18-UNL See Section 4.4.4 Non-unif. ≤ 30%
Non-unif. ≤ 30%
Readjustment, repair or replacement for repeated failures
Resolution* luminance-meter
Magnifier TG18-QC TG18-CX TG18-PX
See Sections 4.5.3 and 4.5.4.1.2
0 ≤ Cx ≤ 4 ∆L ≤ 30% RAR=0.9-1.1 AR ≤ 1.5
0 ≤ Cx ≤ 6 ∆L ≤ 50%
Focus adjustment, repair or replacement for repeated failures
Noise None TG18-AFC See Section 4.6.3 All targets
visible except the smallest
Two largest sizes visible
Reverification of Luminance response, otherwise replacement
Veiling glare Baffled funnel,
telescopic photometer
TG18-GV TG18-GVN TG18-GQs
See Sections 4.7.3 and 4.7.4
3rd target visible, GR ≥ 400
5th target visible, GR ≥ 150
Reverification of Luminance response, otherwise replacement
Chromaticity Colorimeter TG18-
UNL80 See Section 4.8.4 ∆(u’,v’)
≤ 0.01 None Replacement
* More objective resolution measurements can be performed as described in Section 4.5.4 using a digital camera.

AAPM TG18 Preprint DRAFT (version 10.0)
128 August 26, 2004
References
1. AAPM, The role of the clinical medical physicist in diagnostic radiology, Report of the AAPM Task Group No. 2, AIP Publication, 1994.
2. Ackerman SJ, Gitlin JN, Gayler RW, Flagle CD, Bryan RN, Receiver operating characteristic
analysis of fracture and pneumonia detection: comparison of laser-digitized workstation images and conventional analog radiographs, Radiology 186:263-268, 1993.
3. American College of Radiology (ACR), ACR Standard for Teleradiology, 1999. American College
of Radiology, 1891 Preston White Drive, Reston, VA 20191-4397, USA; http://www.acr.org/.
4. Badano A, Flynn MJ, Kanicki J, Accurate small-spot luminance measurements in display devices, Displays 23:177-182, 2002.
5. Badano A, Kanicki J, Monte carlo analysis of the spectral photon emission and extraction
efficiency of organic light-emitting devices. Journal of Applied Physics 90:1827-1830, 2001.
6. Badano A, Flynn MJ, A method for measuring veiling glare in high performance display devices, Applied Optics 39:2059-2066, 2000.
7. Badano A, Flynn MJ, Muka E, Compton K, Monsees T, The veiling glare point-spread function of
medical imaging monitors, Proc. SPIE, Vol. 3658, pp. 458-467, 1999.
8. Barrett HH, Swindell W, Radiological imaging: the theory of image formation, detection and processing, Academic Press, New York, 1981.
9. Barten PGJ, Contrast Sensitivity of the Human Eye and Its Effects on Image Quality, SPIE Press,
Bellingham, WA, 1999.
10. Barten PGL, Physical model for the contrast sensitivity of the human eye, Proc SPIE 1666:57-72, 1992.
11. Barten PGL, Spatio-temporal model for the contrast sensitivity of the human eye and its temporal
aspects, Proc SPIE 1913:1, 1993.
12. Blume H, Ho AMK, Stevens F, Steven PM, Practical aspects of gray-scale calibration of display systems, Proc. SPIE, Vol. 4323, pp. 28-41, 2001.
13. Boynton PA, Kelley EF, Accurate contrast-ratio measurements using a cone mask. Proc. SID, pp.
823-826, 1992.
14. Briggs SJ, Softcopy display of electro-optical imagery, Proc. SPIE 762 (1987), pp. 153-169.
15. Briggs SJ, Report D180-25066-1, Manual Digital Test Target BTP #4, Boeing Aerospace Company, Seattle, Washington, January 1979.
16. Dainty JC, Shaw R, Image science: principles, analysis and evaluation of photographic-type
imaging processes, Academic Press, London, 1974.

AAPM TG18 Preprint DRAFT (version 10.0)
129 August 26, 2004
17. DIN 6868-57-2001, Image quality assurance in x-ray diagnostics, Acceptance testing for image display devices, The German Standards Institution, Deutsches Institut für Normung e.V., February 2001.
18. Dwyer SJ, Stewart BK, Clinical Uses of Grayscale Workstations. Digital Imaging. AAPM
Monograph No. 22. pp 241- 264, 1993.
19. Eckert MP, Chakraborty DP, Video display quality control measurements for PACS, Proc. SPIE, Vol. 2431, pp. 328-340, 1995.
20. Fetterly KA, Bernatz SN, Groth DS, Hangiandreou NJ, Quantitative color measurement for the
characterization of grayscale PACS CRTs, Radiology 209(P):320, 1998.
21. Flynn MJ, Badano A, Image Quality Degradation by Light Scattering in Display Devices, Journal of Digital Imaging 12:50-59, 1999a.
22. Flynn MJ, Kanicki J, Badano A, Eyler WR, High Fidelity Electronic Display of Digital
Radiographs, Radiographics 19:1653-1669, 1999b.
23. Flynn MJ, Couwenhoven M, Eyler WR, Whiting BR, Samei E, Foss DH, Slone R, Marom E, Optimal image processing for digital radiography, Proc. SPIE, Vol. 4319, pp. 298-305, 2001.
24. Gaskill JD, Linear Systems, Fourier Transforms and Optics, John Wiley & Sons, New York, 1978.
25. Gray JE, Lisk KG, Haddick DH, Harschbarger JH, Oosterhof A, Schwenker R, Test pattern for
video displays and hardcopy cameras, Radiology 152:519-527, 1985.
26. Gray JE, Use of SMPTE test pattern in picture archiving and communication systems, J Digital Imaging 5:54-58, 1992.
27. Gray HF, Sune CT, Jones GW, Silicon Field-emitter Arrays for Cathodoluminescent Flat-panel
Displays, J Soc Information Displays 1:143-146, 1993.
28. Hangiandreou NJ, Fetterly KA, Flemlee JP, Optimization of a contrast-detail-based method for electronic image display quality evaluation, J Dig Imaging 12:60-67, 1999.
29. He Y, Gong S, Hattori R, Kanicki J, High performance organic polymer light-emitting
heterostructures. Applied Physics Letters 16:661-663, 1999.
30. He Y, Kanicki J, High-efficiency organic polymer light-emitting heterostructure devices on flexible plastic substrates. Applied Physics Letters 76:661-663, 2000.
31. Hemminger BM, Johnston RE, Rolland JR, Muller KE, Perceptual Linearization of Video Display
Monitors for Medical Image Presentation", Proc. SPIE, Vol. 2164, pp. 222-240, 1994.
32. Hoke CD, Mori H, Bos PJ, An ultra-wide-viewing angle STN-LCD with a negative-birefringence compensation film, Proceedings of the International Display Research Conference, Proc. SID, pp. 21-24, 1997.

AAPM TG18 Preprint DRAFT (version 10.0)
130 August 26, 2004
33. Holloway P, Sebastian J, Trottier T, Production and control of vacuum in field emission flat panel displays. Solid State Technology, pp. 47-54, Aug 1995.
34. Horowitz P, Hill W, The Art of Electronics, Cambridge University Press, Cambridge, MA, 1980.
35. IEC/CIE, Publication No. 15.2, Colorimetry, 2nd Edition, Vienna, 1986. International
Commission on Illumination, Commission Internationale de l’Eclairage (CIE), CIE Central Bureau, Kegelgasse 27, A-1030, Wien, Austria, http://www.cie.co.at/cie/.
36. IEC 61223-2-5:1994, Evaluation and routine testing in medical imaging departments - Part 2-5:
Constancy tests - Image display devices, International Commission on Illumination, Commission Internationale de l’Eclairage (CIE), CIE Central Bureau, Kegelgasse 27, A-1030, Wien, Austria, http://www.cie.co.at/cie/.
37. ISO 13406-2:2001, Ergonomic requirements for the use of flat-panel displays. American National
Standards Institute, 11 West 42nd Street, New York, New York 10036, http://www.ansi.org/.
38. ISO 9241-3:1992 Ergonomic requirements for office work with visual display terminals (VDTs) -- Part 3: Visual display requirements, American National Standards Institute, 11 West 42nd Street, New York, New York 10036, http://www.ansi.org/.
39. Kato H, Hard- and soft-copy image quality, RSNA Categorical Course in Physics, pp. 243-258,
1995.
40. Keller PA, Electronic Display Measurement: Concepts, Techniques and Instrumentation. John Wiley & Sons, Inc, 1997.
41. Kelley EF, Jones GR, Boynton PA, Grote MD, Bechis DJ, A survey of the components of display
measurement standards, SID Digest, pp. 637-640, 1995.
42. Kelley EF, Proposed diffuse ambient lighting contrast measurement methods for flat panel displays, NISTIR 6738, National Institute of Standards and Technology, Gaithersburg, MD, 2001.
43. Kelley EF, Sensitivity of display reflection measurements to apparatus geometry, SID Digest 11.3,
2002.
44. Kohm KS, Cameron AW, Van Metter RL, Visual CRT sharpness estimation using a fiducial marker set, Proc. SPIE, Vol. 4319, pp. 286-297, 2001.
45. Libsch FR, Lien A, Understanding crosstalk in high-resolution color thin-film-transistor liquid
crystal displays. IBM Journal of Research and Development, 42:467-479, 1998.
46. Lippincott H (ed.), The CRT Book, The ABCs of CRTs, Clinton Electronics Corp., Rockford, IL, 1988.
47. Mertelmeier T, Kocher T, Monitor simulations for the optimization of medical soft copies, Proc.
SPIE, Vol. 2707, pp. 322-333, 1996.
48. Moss H, Narrow Angle Electron Guns and Cathode Ray Tubes, Academic Press, 1968.

AAPM TG18 Preprint DRAFT (version 10.0)
131 August 26, 2004
49. Muka E, Blume H, Daly S, Display of medical images on CRT soft-copy displays: a tutorial, Proc. SPIE, Vol. 2431, pp. 341-359, 1995.
50. Muka E, Mertelmeier T, Slone RM, Senol E, Impact of phosphor luminescence noise on the
specification of high-resolution CRT displays for medical imaging, Proc. SPIE, Vol. 3031, pp. 210-221, 1997.
51. Nam MS, Wu JW, Choi YJ, Wide-viewing-angle TFT-LCD with photo-aligned four-domain TN
mode. Proc. SID, pp. 933-936, 1997.
52. Nawfel RD, Chan KH, Wagenaar DJ, Judy PF, Evaluation of video gray-scale display, Medical Physics 19:561-567, 1992.
53. NEMA PS 3.14-2000, "Digital Imaging and Communications in Medicine (DICOM) Part 14:
Grayscale Display Standard Function", National Electrical Manufacturers Association, NEMA, 1300 North 17th Street, Suite 1847, Rosslyn, VA 22209, USA; http://www.nema.org/. Draft viewable at http://medical.nema.org/dicom/2000/draft/00_14DR.PDF, Available for purchase in whole or in parts from Global Sales, Global Engineering Documents, 15 Inverness Way East Englewood, COLORADO, 80112 USA; http://global.ihs.com/
54. Nier MC, Courtot ME (eds.). Standards for Electronic Imaging Systems, Proc. SPIE, Vol. CR37,
1991.
55. Nier MC (ed.). Standards for Electronic Imaging Technologies, Devices, and Systems, Proc. SPIE, Vol. CR61, 1996.
56. Oekel JJv, Improving the contrast of CRTs under low ambient illumination with a graphite
coating. Proc. SID, pp. 427-430, 1995.
57. Paszkowski B, Electron Optics, Life Books Inc, London, 1968.
58. Reimann DA, Flynn MJ, Ciarelli JJ, A system to maintain perceptually linear networked display devices, Proc. SPIE, Vol. 2431, pp. 316-326, 1995.
59. Roehrig H, Blume H, Ji TL, Browne M, Performance tests and quality control of cathode ray tube
displays, J Digital Imaging 3:134-145, 1990a.
60. Roehrig H, Ji TL, Browne M, Dallas WJ Blume H, Signal-to-Noise Ratio and Maximum Information Content of Images Displayed by a CRT, Proc. SPIE, Vol. 1232, pp. 115-133, 1990b.
61. Roehrig H, Blume H, Ji TL Sundareshan MK, Noise of CRT Display Systems, Proc. SPIE. Vol.
1897, pp. 232-245, 1993.
62. Roehrig H, Willis CE, Damento MA, Characterization of monochome CRT display systems in the field, J Dig. Imaging 12:152-165, 1999.
63. Rose A, Vision, Human and Electronic, Plenum Press, New York-London, 1974.
64. Ryer AD, Light Measurement Handbook, International Light, Newburyport, MA, 1998.

AAPM TG18 Preprint DRAFT (version 10.0)
132 August 26, 2004
65. Samei E, Flynn MJ, A method for in-field evaluation of the modulation transfer function of electronic display devices, Proc. SPIE, Vol. 4319, pp. 599-607, 2001.
66. Samei E. Digital Mammography Displays. In: Advances in Breast Imaging: Physics, Technology,
and Clinical Applications, A Karellas and ML Giger (eds). Radiological Society of North America (RSNA) Publication, Categorical Course Syllabus, Oak Brook, IL (in press, 2004a).
67. Samei E, Wright SL. The effect of viewing angle response on DICOM compliance of LCD
displays. Proc. SPIE Medical Imaging 5371: 170-177, 2004b.
68. Scott WW, Rosenbaum JE, Ackerman SJ, Reichle RL, Magid D, Weller JC, Gitlin JN, Subtle orthopedic fractures: teleradiology workstation versus film interpretation, Radiology 187:811-815, 1993.
69. Scott WW, Bluemke DA, Mysko WK, Weller GER, Kelen GD, Reichle RL, Weller JC, Gitlin JN,
Interpretation of emergency department radiographs by radiologists and emergency medicine physicians: teleradiology workstation versus radiograph readings, Radiology 195:223-229, 1995.
70. Senol E, Muka E, Spatial frequency characteristics of CRT soft-copy displays, Proc. SPIE, Vol.
2431, pp. 302-315, 1995.
71. Sheats JR, Roitman DB, Failure modes in polymer-based light-emitting diodes, Synthetic Metals 95:85-79, 1998.
72. SMPTE RP133, Specifications for Medical Diagnostic Imaging Test Pattern for Television
Monitors and Hardcopy Recording Cameras, Society of Motion Picture & Television Engineers (SMPTE), 595 West Hartsdale Avenue, White Plains, NY 10607.
73. Spekowius G, Characterization of color CRT display systems for monochrome applications, J
Digital Imaging 12:102-113, 1999. 74.
Tang CM, Swyden TA, Beam collimation from field-emitter arrays with linear planar lenses. Proc. SID, pp. 115-118, 1997.
75. Tang CW, VanSlyke SA, Organic electroluminescent diodes. Applied Physics Letters 51:913-915,
1987.
76. Tirard-Gatel N, Perrin A, Levy F, Charging and reliability effects associated with FED spacers. Proc. SID, pp. 1134-1137, 1999.
77. Umezu N, Nakamo Y, Sakai T, et al, Specular and diffuse reflection measurement feasibility study
of ISO 9241 part 7 method, Displays 19:17-25, 1998.
78. VESA; Flat Panel Display Measurements Standard (FPDM), Version 2.0, June 2001, Video Electronics Standards Association, 920 Hillview Court, Suite 140, Milpitas, CA 95035, www.vesa.org.
79. VESA; Flat Panel Display Measurements Standard (FPDM), Version 1.0, May 1998, Video
Electronics Standards Association, 920 Hillview Court, Suite 140, Milpitas, CA 95035, www.vesa.org.

AAPM TG18 Preprint DRAFT (version 10.0)
133 August 26, 2004
80. VESA; Video Signal Standard (VSIS), Version 1, Rev. 1, Draft 4, February 14, 2000, Video
Electronics Standards Association, 920 Hillview Court, Suite 140, Milpitas, CA 95035, www.vesa.org.
81. Wakemoto H, Asada S, Kato N, An advanced in-plane switching mode TFT-LCD, Proc. SID, pp.
929-932, 1997.
82. Weibrecht M, Spekowius G, Quadflieg P, Blume H, Image Quality Assessment of Monochrome Monitors for Medical Softcopy Display, Proc. SPIE, Vol. 3031, pp. 232-244, 1997.
83. Wright SL, Millman S, Kodate M, Measurement and digital compensation of crosstalk and
photoleakage in high-resolution TFT-LCDs. Proc. SPIE, Vol. 3636, pp. 200-211, 1999.
84. Xie C, Kumar N, Collins CB, Lee T, Schmidt H, Wagal S, Electron field emission from amorphic diamond thin films. Proc. of 6th International Vacuum Microelectronics Conference, p.162, 1993.

AAPM TG18 Preprint DRAFT (version 10.0)
134 August 26, 2004
Appx I Evaluation of “Closed” Display Systems This report focuses primarily on “open” systems. An open system is one that allows user-introduced digital test patterns to be retrieved from a PACS or local archive and displayed for the purposes of monitor evaluation and calibration. These monitors are primarily used for display of diagnostic images residing in a PACS. In diagnostic imaging today, the some clinical display systems are not “open” systems. Those may include display devices dedicated to one system intended to display only images obtained on that system (e.g., a fluoroscopy system or a CT scanner). Typically, the only controls available to the operator of such systems are Contrast and Brightness. There may be no way to calibrate the gray-scale display function, no way to display a TG18 test pattern, and no tools present for image manipulation. The manufacturers of these systems may provide test patterns of their own design, but in most cases these are inadequate to meet the display assessment requirements of this report. These systems are referred to as closed systems. Because the capabilities of closed systems vary considerably between manufacturers, recommendations for quality control on closed systems cannot be uniformly established. This appendix will establish general QC methodology, which should be adapted wherever feasible. Manufacturers are strongly encouraged to migrate towards open systems for all of their displays in order to facilitate clear specification and fair evaluation in a standardized environment. This will include the development of systems that allow the introduction of user-defined DICOM-compliant images into the local image database. This is most easily accomplished with systems that are capable of performing DICOM Query/Retrieve from any DICOM-compliant PACS. I.1 General Considerations I.1.1 Preliminary communications Prior to purchase, it is important to include specifications of the size of the active area, the resolution or number of scan lines, color/spectral luminance, monochrome vs. color display, dynamic range, and magnetic shielding. These requirements will vary depending upon the intended use of the system, such as fluoroscopy, CT, ultrasound, MRI, digital spot imaging, etc. A service and/or calibration schedule including the services to be provided, tests to be performed, and the service/calibration intervals will need to be agreed upon prior to purchase. I.1.2 Component inventory At acceptance testing, verify the characteristics of the monitors delivered against those specified in the purchase agreement. Keep a log of the monitors and display devices in use. Record information such as monitor type, size, resolution, manufacturer, model, serial number, manufacture date, room number, monitor ID (if applicable), type of test pattern used, etc. It may not be possible to use the same test pattern source for all monitors in the department. However, it is essential to utilize the same pattern for repeat evaluations of a given monitor.

AAPM TG18 Preprint DRAFT (version 10.0)
135 August 26, 2004
I.2 Preparation for evaluation I.2.1 Instrumentation needed A variety of special tools are needed for acceptance and QC testing of monitors. The following instrumentation is recommended:
1. Digital test pattern images from the system, or from digital distribution media. Short of availability of TG18 test patterns, SMPTE or other multi-purpose test patterns stored on the imaging system may be used. The same pattern(s) should be utilized whenever a test is initiated. In the absence of any suitable test pattern on the system, a video test pattern generator (equipped with TG18-QC, SMPTE, or other multi-purpose test patterns) will need to be utilized. The video signal from the pattern generator should have the same peak voltage, refresh rate, and line rate as that from the image source.
2. Calibrated luminance-meter (see Section 3.1.1.1) 3. Calibrated illuminance-meter (see Section 3.1.1.2) 4. Calibrated colorimeter (see Section 3.1.1.3) 5. Glass-cleaning solution and lint-free cloth or paper 6. Flexible ruler or small tape measure 7. Screwdriver (for accessing rear panel) 8. Mask (for accurate positioning of instruments), if desired. If it is used, it must be used in every
subsequent evaluation of the display device. I.2.2 Initial Steps Follow the initial steps as outlined in Section 5.1.4, keeping in mind that DICOM calibration may not be applicable to many “closed” systems. I.2.2.1 Special Considerations for Operator Console Displays Console display devices are used in one of two ways: without and with operator adjustment of Brightness and Contrast settings. The quality control procedures for these devices will vary, depending upon which of these operations is used. As an example of the first kind, many CT departments utilize pre-programmed Brightness and Contrast settings for hard copy production. This is possible because the CT number associated with a particular type of tissue varies insignificantly assuming correct CT calibration and the use of consistent kV. The operator makes no adjustments to the image density or contrast. In this case, the QC program should guarantee that, for a given dataset with window width (WW) and level (WL) set in a prescribed manner, the contrast and brightness of the hard copy image are constant from copy to copy over time. If multiple CT devices are in use, the same dataset from any scanner, having WW and WL set in the prescribed manner, should also result in the same hard-copy image density and contrast from scanner to scanner. The appearance of the CT image on the control console monitor has no bearing on the contrast and density of the final hard-copy image. This is an example of a system operated without adjustment of the image by the operator. Calibration of these monitors may be performed without reference to the corresponding hard-copy image. For such systems, the maximum and minimum luminance values are adjusted according to the guidelines provided in Section 4.2 or otherwise manufacturer’s recommendations. A test pattern (SMPTE or preferably TG18-QC) containing luminance patches that are larger than the luminance-meter’s detector head (electronic magnification may be used, if necessary) may be used for this purpose.

AAPM TG18 Preprint DRAFT (version 10.0)
136 August 26, 2004
Other modalities do not lend themselves to the use of prescribed WW and WL settings. For example, in MRI the signal strength associated with a glioma may not be reproducible from scan to scan even on the same patient. In order to properly record the pathology of interest, operator adjustment of WW and WL is essential. These adjustments are made by viewing the data set at a video monitor with the expectation that the resulting hard copy will match the image on the monitor. Therefore, it is essential that the contrast and brightness settings on the monitor be adjusted such that the contrast transfer function (CTF) of the monitor closely approximates that of the printer. For such systems, the Brightness and Contrast settings should be adjusted to match the appearance of images on the operator consoles and hard-copy prints. This is a challenging task as equivalent appearance depends on factors such as the ambient light level at the console and the response of the operator’s visual system, which will vary among individuals. Initially, the calibration of hard-copy printer should be verified. The adjustment of the console is best performed by setting up the display with several operators present. Generate a print of a test pattern (SMPTE or preferably TG18-QC). With test pattern displayed on the monitor, adjust the Brightness and Contrast settings on the monitor to match the hard copy as closely as possible. When all observers agree that the monitor accurately reflects (or resembles as closely as possible) the contrast seen in the hard copy image, the monitor is considered calibrated. Measure the luminance levels of the maximum, minimum, and two or three intermediary brightness patches of the displayed test pattern, and record these for future reference. I.2 Display Evaluation Procedures Ideally, as many as possible of the tests outlined in Sections 5 and 6 should be performed on “closed” systems. Displays used for diagnosis of medical images (exam room monitors) should conform to Primary specifications. Operator’s console displays should conform to Secondary specifications (see Tables 7 and 8). As a minimum, the display visual evaluation procedures contained in Section 4.10.1 or 4.10.2 should be followed using the TG18-QC or SMPTE test patterns. The test pattern from a video test pattern generator can be simultaneously displayed on two or more monitors by attaching an RG59U video cable from the output of the first monitor to the input of the second (daisy-chain). Check to ensure that both monitors are properly terminated (75 ohms total impedance) and that the test pattern generator is set to the appropriate peak voltage, refresh rate and line rate. The QC procedure should be repeated on a monthly basis for the first quarter of operation and then quarterly thereafter is the system is proved to be stable enough over time. The tests should also be repeated after any change to monitor Brightness and Contrast setting to maintain constancy. The image appearance should also be compared to that of the hard copy on a quarterly or annual basis. Furthermore, for display systems with more than one display monitor, the performance of various monitors should be benchmarked with respect to each other.

AAPM TG18 Preprint DRAFT (version 10.0)
137 August 26, 2004
Appx II Equivalent Appearance in Monochrome Image Display Throughout a single institution, the same image data is often presented on multiple display devices. These devices may be laser-printed films, diagnostic workstation monitors, or referring physician workstation monitors. This appendix considers how equivalent appearance of the same image can be achieved on different displays. Section 4.3 describes two requirements for obtaining equivalent image appearance on multiple display devices. The first requirement is that the devices be calibrated using the same luminance response standard. The DICOM Grayscale Display Function (GSDF), specified in DICOM 3.14 (NEMA PS3.14), is the model selected for the standardized luminance response. The GSDF provides a well-defined rendering aim so that acquisition modalities can produce image code values with the expectation that the intrinsic response of display workstations and laser-film printers has been calibrated to render image code values to the standard. The second requirement is that the devices have the same luminance ratio, L’max/L’min. When viewing an image, the human visual system adapts to contrast within a limited range of luminance. After adaptation to the overall brightness of an image, the visual system has reduced contrast in brighter and darker regions (see Fig. 43, Section 4.3). An image viewed on a device with a large luminance ratio (i.e., a film with an optical density range of 0.15 to 3.0 and LR = 708) will have poor contrast in bright and dark regions when compared with the same image display on a device with a small luminance ratio (e.g., a secondary class display with LR = 100). Thus, equivalent appearance requires that images be displayed on GSDF-calibrated devices with the same luminance ratio. It is notable that equivalent appearance can be achieved with devices having different L’max. While visual perception has poor sensitivity in dark regions, the GSDF increases the contrast between display controller input states, p-values, at low luminance levels. The value of a bright display device is that L’min is large for the same luminance ratio and therefore higher values of Lamb can be tolerated. Bright displays can thus be used in clinical locations where it is impractical to reduce ambient light levels. Most modern film printers and primary class display devices can be calibrated to the DICOM GSDF. Secondary class display devices can usually be set up to approximate the GSDF. Significant differences in appearance are thus often due to differences in luminance ratio. This is particularly true in medical centers for which imaging systems were originally set up with the expectation that interpretations would be made on printed films. In these circumstances, application grayscale transformations and presentation window and level values are often set up for films printed with high maximum film density (i.e. 2.80 to 3.10) and image values of interest are set to appear in a well visualized range of film densities (i.e. 0.10 to 2.10). For radiographic images, image values printed at higher film densities are then viewed with high brightness spot illuminators. Electronic display devices typically have a lower L’max than film and ambient lighting restricts the luminance ratio to about 250. This luminance ratio provides good contrast visualization over the full range of image values. However, an image with an application grayscale transformation and presentation window and level intended for film viewing will appear significantly different when viewed on an electronic display with lower luminance ratio. When an image needs to be presented on a display with a different luminance ratio, an adjustment in window and level can provide equivalent contrast appearance. The adjustment requires knowledge of the intended L’max and L’max/L’min and the alternative L’max and L’max/L’min. For an alternative luminance ratio that is less than an intended luminance ratio, a reduced p-value range for presentation of the image is computed by considering the DICOM calibration curve of the intended device and the calibration curve for the alternative device. As illustrated in Fig. II.1, the ratio of the JND indices associated with the alternative L’max/L’min to JND indices associated with the intended L’max/L’min (i.e., the ratio of A to B in

AAPM TG18 Preprint DRAFT (version 10.0)
138 August 26, 2004
Fig. II.1) is used to narrow the window width. The window level is otherwise set to place the upper level at the maximum p-value. Similar methods are applied when the alternative luminance range is larger than the intended and the window width needs to be adjusted to a larger value. In either case, knowledge of the intended and alternative L’max is required only to properly compute the JNDs associated with both devices (i.e., the length of the lines labeled A and B in Fig. II.1). This can be done using the polynomial expressions or tables published in DICOM 3.14.
0.1
1
10
100
1000
10000
0 200 400 600 800 1000JND index (Dicom 3.14)
Lum
inan
ce, c
d/m
2
Lmax = 500 cd/m2
A, LR = 100
B, LR = 650
Fig. II.1: The window width and level of an alternative display is adjusted to reflect the reduced range of JND indices associated with a reduced luminance range. This is illustrated by comparing the length A to the length B. The upper display level remains the same but the lower display level is increased. Ideally, the intended Lmax and Lmax/Lmin should be included in an appropriate data element of the image object. When a remote display device displays this image, the window width and level may be automatically adjusted to account for differences in Lmax/Lmin relative to the intended value stored in the image object. If the luminance range of the alternative device is the same as the intended device, the full range of p-values is displayed even if the Lmax of the alternative device is different. If the luminance range is different, then a change in the range of displayed p-values is required. It should be noted that there is not a standard method for communicating the intended Lmax and Lmax/Lmin for an image. However, this is presently being considered as an addition to the DICOM standards for image presentation. In the absence of an automated implementation, present window and level settings for different image object types can be used to make the needed adjustment. Factors other than contrast may cause the appearance of images displayed on various devices to be different. The size of the presented images will affect the perceived spatial frequency of image features in cycles/mm. Since the human visual contrast sensitivity is strongly dependant on perceived spatial frequency, a difference in the size of presented images will cause a difference in contrast perception. Resolution, noise, and ambient reflection may otherwise cause a difference in appearance not related to image contrast.

AAPM TG18 Preprint DRAFT (version 10.0)
139 August 26, 2004
Appx III Description of TG18 Test Patterns Medical physicists, investigators, vendors, or other users can utilized the authentic copy-righted TG18 patterns supplied in conjunction with this report for any professional, investigational, educational, or commercial purposes. However, the patterns may not be altered in any form or fashion, and their labels may not be removed. Alternatively, with the aid of the descriptions provided in Section 3 and Appendix III and with the exception of anatomical test patterns, the users may generate patterns similar to the TG18 patterns. To do so, four requirements should be observed:
1) The original reference should be acknowledged. 2) The generated pattern may not duplicate the original TG18 label. 3) The generated pattern should include a label indicating that it is a synthetic pattern based
on the description provided in the TG18 report. 4) If the pattern is scaled (e.g., a new 1.5k x 2k pattern versus the original 1k and 2k patterns),
all the specified elements of the original pattern should be present, and the label should indicate that it is a scaled pattern.
In using the patterns, for most patterns, it is essential to have a one-on-one relationship between the image pixels and the display pixels, unless indicated otherwise in the test procedures in Section 4. Patterns in DICOM and 16-bit TIFF formats should be displayed with a window and level set to cover the range from 0 to 4095 (WW = 4096, WL =2048), except for the TG18-PQC, TG18-LN, and TG18-AFC patterns, where a WW of 4080 and WL of 2040 should be used. For 8-bit patterns, the displayed range should be from 0 to 255 (WW = 256, WL =128).
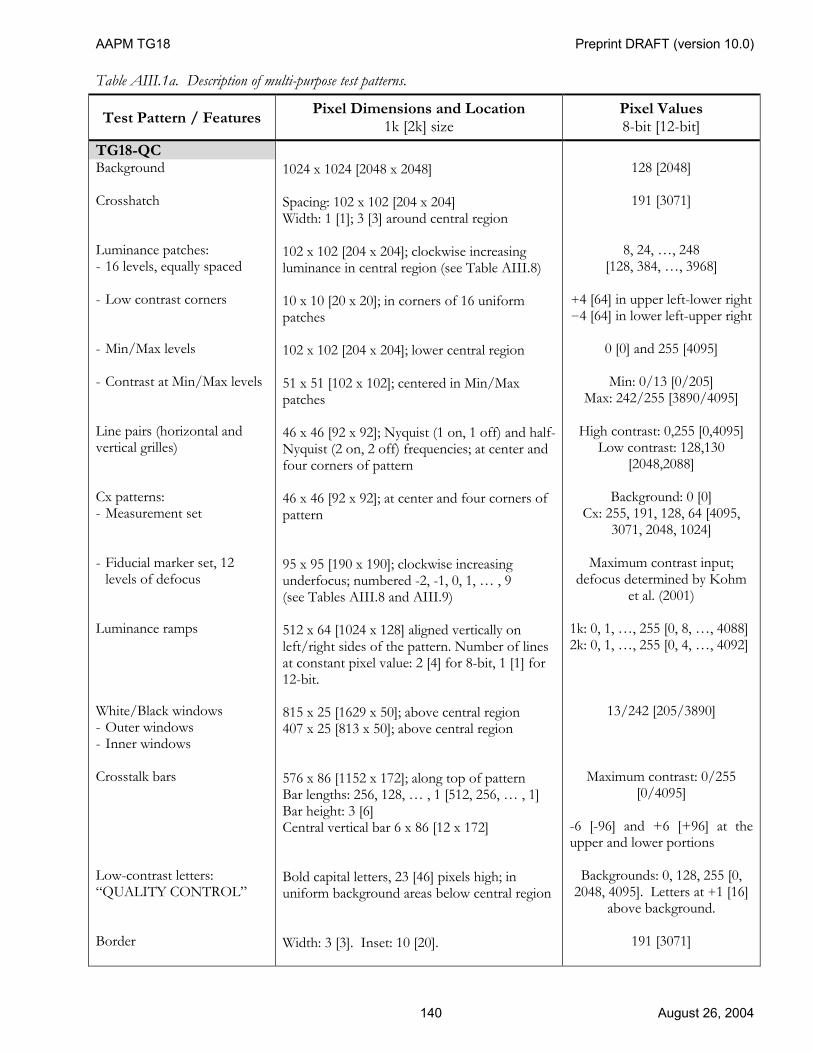
AAPM TG18 Preprint DRAFT (version 10.0)
140 August 26, 2004
Table AIII.1a. Description of multi-purpose test patterns.
Test Pattern / Features Pixel Dimensions and Location 1k [2k] size
Pixel Values 8-bit [12-bit]
TG18-QC Background Crosshatch Luminance patches: - 16 levels, equally spaced - Low contrast corners - Min/Max levels - Contrast at Min/Max levels Line pairs (horizontal and vertical grilles) Cx patterns: - Measurement set - Fiducial marker set, 12
levels of defocus Luminance ramps White/Black windows - Outer windows - Inner windows Crosstalk bars Low-contrast letters: “QUALITY CONTROL” Border
1024 x 1024 [2048 x 2048] Spacing: 102 x 102 [204 x 204] Width: 1 [1]; 3 [3] around central region 102 x 102 [204 x 204]; clockwise increasing luminance in central region (see Table AIII.8) 10 x 10 [20 x 20]; in corners of 16 uniform patches 102 x 102 [204 x 204]; lower central region 51 x 51 [102 x 102]; centered in Min/Max patches 46 x 46 [92 x 92]; Nyquist (1 on, 1 off) and half-Nyquist (2 on, 2 off) frequencies; at center and four corners of pattern 46 x 46 [92 x 92]; at center and four corners of pattern 95 x 95 [190 x 190]; clockwise increasing underfocus; numbered -2, -1, 0, 1, … , 9 (see Tables AIII.8 and AIII.9) 512 x 64 [1024 x 128] aligned vertically on left/right sides of the pattern. Number of lines at constant pixel value: 2 [4] for 8-bit, 1 [1] for 12-bit. 815 x 25 [1629 x 50]; above central region 407 x 25 [813 x 50]; above central region 576 x 86 [1152 x 172]; along top of pattern Bar lengths: 256, 128, … , 1 [512, 256, … , 1] Bar height: 3 [6] Central vertical bar 6 x 86 [12 x 172] Bold capital letters, 23 [46] pixels high; in uniform background areas below central region Width: 3 [3]. Inset: 10 [20].
128 [2048]
191 [3071]
8, 24, …, 248 [128, 384, …, 3968]
+4 [64] in upper left-lower right −4 [64] in lower left-upper right
0 [0] and 255 [4095]
Min: 0/13 [0/205] Max: 242/255 [3890/4095]
High contrast: 0,255 [0,4095]
Low contrast: 128,130 [2048,2088]
Background: 0 [0]
Cx: 255, 191, 128, 64 [4095, 3071, 2048, 1024]
Maximum contrast input;
defocus determined by Kohm et al. (2001)
1k: 0, 1, …, 255 [0, 8, …, 4088] 2k: 0, 1, …, 255 [0, 4, …, 4092]
13/242 [205/3890]
Maximum contrast: 0/255 [0/4095]
-6 [-96] and +6 [+96] at the upper and lower portions
Backgrounds: 0, 128, 255 [0, 2048, 4095]. Letters at +1 [16]
above background.
191 [3071]

AAPM TG18 Preprint DRAFT (version 10.0)
141 August 26, 2004
Table AIII.1b. Description of multi-purpose test patterns (continued).
Test Pattern / Features Pixel Dimensions and Location 1k [2k] size
Pixel Values 8-bit [12-bit]
TG18-BR Test Pattern #4
See references (Briggs 1979, 1987).
TG18-PQC Right luminance ramp Left luminance ramp Top section Bottom section Mid section
87 x 1024 [174 x 2048] Center 29 [58] columns 87 x 1024 [174 x 2048] Center 29 [58] columns 850 x 62 [1700 x 124] 850 x 62 [1700 x 124] 18 horizontal steps of 850 x 50 [1700 x 100] Each horizontal step modulated differently for each of 17 50 x 50 [100 x 100] squares Central squares have constant value with the borders marked with high contrast Left 8 squares have horizontal square wave modulation with two groups having line widths of 2, 3, 5, and 8 pixels: Right 8 squares identical to the left ones except for orientation of patterns (vertical)
255-0 [4080-0] ramp, last 7 rows at 0 [0] modulated by 0 [0], 0 [+8], 0 [+12], 0 [+8], 0 [0], 0 [-8], 0 [-12], 0 [-8], … cyclically for sequential rows 0-255 [0-4080] ramp, last 7 rows at 255 [4080] modulated by 0 [0], 0 [+8], 0 [+12], 0 [+8], 0 [0], 0 [-8], 0 [-12], 0 [-8], … cyclically for sequential rows Alternating rows changing between 0 [0] and 255 [4080] Alternating rows changing between 0 [0] and 255 [4080] Mean values of 0 [0], 15 [240], 30 [480], … 255 [4080] The inner 4 squares are modulated by ±1 [16] (0.4%) except for the first and last steps with the max and min values that have modulation of +2 [32] or -2 [32] The outer 4 squares are modulated by ±5 [80] (2%) except for the first and last steps with the max and min values that have modulation of +10 [160] or –10 [160] Same as above

AAPM TG18 Preprint DRAFT (version 10.0)
142 August 26, 2004
Table AIII.2a. Description of luminance test patterns.
Test Pattern / Features Pixel Dimensions and Location Pixel Values 8-bit [12-bit]
TG18-CT Background Luminance patches: - 16 levels, equally spaced - Low contrast corners - Low contrast central disk
(half moon)
1024 x 1024 102 x 102, separated by 51; ordered in 4 x 4 matrix, diagonal zig-zag increment, centered in pattern 10 x 10; in four corners of each luminance patch Diameter: 34
128 [2048]
8, 24, …, 248 [128, 384, …, 3968]
+4 [64] in upper left-lower right −4 [64] in lower left-upper right
±2 [32] + on right half, − on left half
TG18-LN8,12-nn Background Luminance measurement areas: nn = 01 to 18
1024 x 1024 324 x 324 (10% of full area); centered in background
153 [2457]
(~20% of peak luminance)
0, 15, … , 255 [0, 240, … , 4080]
TG18-UN10,80 Background
1024 x 1024
26 [410] or 204 [3276]
TG18-UNL10,80 Background Borders of measurement areas
1024 x 1024 324 x 324 (10% of full area), 1 pixel wide; at center and four corners of pattern.
26 [410] or 204 [3276]
128 [2048]
TG18-AD Background Horizontal line pairs Grid
1024 x 1024 60 x 60 blocks; half-Nyquist frequency (2 on, 2 off); in 7 x 7 block array, centered in pattern Spacing: 60 x 60. Width: 2.
0 [0]
Bright lines at pixel value = C+7R, where C is column number (1 to 7) and R is row number (0 to 6). For 12-bit, multiply pixel values by 4.
50 [200]

AAPM TG18 Preprint DRAFT (version 10.0)
143 August 26, 2004
Table AIII.2b. Description of luminance test patterns (continued).
Test Pattern / Features Pixel Dimensions and Location Pixel Values 8-bit [12-bit]
TG18-MP Background Vertical ramps Border Markers
1024x1024 16 768x48 ramps 770x770, pixel-wide bordering the ramp area 1x3 and 1x5 markers for various bit transitions
16 [256]
Each ramp:48 [3] horizontal lines per pixel value Pixel value = 32 [512] 4 1x3 markers per 8 bit transition [1x3 markers for 10 bit and 1x5 markers for 8 bit transitions] Pixel value = pixel value of the adjacent lines + 16 [256] (left half) and – 16 [256] (right half)

AAPM TG18 Preprint DRAFT (version 10.0)
144 August 26, 2004
Table AIII.3. Description of resolution test patterns.
Test Pattern / Features Pixel Dimensions and Location 1k [2k] size
Pixel Values 8-bit [12-bit]
TG18-RH,V10,50,89 Background Measurement areas Horizontal or Vertical line Position markers
1024 x 1024 [2048 x 2048] 324 x 324 [648 x 648] (10% of full area); at center and four corners of pattern Length: 324 [648]. Width: 1 [1]. Centered in each measurement area. Four single pixels at corners of square, 60 [120] pixels wide, centered in each measurement area
51 [819]
26, 128, 228
[410, 2048, 3656]
+12% pixel value contrast: 29, 143, 255 [459, 2293, 4095]
128, 26, 128
[2048, 410, 2048]
TG18-PX Background Array of single pixels
1024 x 1024 [2048 x 2048] Single pixels on 100 x 100 [200 x 200] grid; reduced contrast arrays offset by 25 [50]
0 [0]
255, 191, 128, 64
[4095, 3071, 2048, 1024]
TG18-CX Background Cx patterns: - Measurement set - Fiducial marker set, 12
levels of defocus
1024 x 1024 [2048 x 2048] 7x7 “Cx” repeated with 90° rotations over entire pattern 95 x 95 [190 x 190] patches; clockwise increasing underfocus around central region; numbered -2, -1, 0, 1, … , 9 (see Tables AIII.8 and AIII.9)
0 [0]
255, 191, 128, 64
[4095, 3071, 2048, 1024] Maximum contrast input; defocus determined by Kohm et al. (2001)
TG18-LPH,V10,50,89 Background Line pairs: Horizontal or Vertical
1024 x 1024 [2048 x 2048] Nyquist frequency (1 on, 1 off) over entire pattern
26, 128, 228 [410, 2048, 3656]
+12% contrast:
29, 143, 255 [459, 2293, 4095]

AAPM TG18 Preprint DRAFT (version 10.0)
145 August 26, 2004
Table AIII.4. Description of noise test patterns.
Test Pattern / Features Pixel Dimensions and Location Pixel Values 8-bit [12-bit]
TG18-AFC Background Center and four quadrants
1024 x 1024 size Divided into quadrants with 4 pixel wide lines Each quadrant divided into an 8 x 8 set of square boxes by 2 pixel wide lines 128 x 128 regions containing 16 small square low contrast object arranged in a 4 x 4 pattern Size of the objects from top to bottom with square dimensions, of 2, 3, 4, and 6 pixels In each small box filling the quadrants, a small square low contrast object randomly placed in one of four subquadrants of the box. upper left quadrant: size = 2 upper right quadrant: size = 3 lower left quadrant: size = 4 lower right quadrant: size = 6
128 [2040] Line values = 143 [2280] Objects values from left to right, background plus 2, 3, 4, and 6 [32, 48, 64, and 96] (contrasts 0.8%, 1.2%, 1.6%, 2.4%) Values = background + upper left quadrant, 2 [32] upper right quadrant, 3 [48] lower left quadrant, 4 [64] lower right quadrant, 6 [96]
TG18-NS10,50,89 Background Measurement areas Position markers
1024 x 1024 324 x 324 (10% of full area); at center and four corners of pattern Four single pixels at corners of 60-pixel square, centered in each measurement area
51 [819]
26, 128, 228
[410, 2048, 3656]
128, 26, 128 [2048, 410, 2048]

AAPM TG18 Preprint DRAFT (version 10.0)
146 August 26, 2004
Table AIII.5. Description of glare test patterns.
Test Pattern / Features Pixel Dimensions and Location Pixel Values 8-bit [12-bit]
TG18-GV Background White annulus Low-contrast disks
TG18-GVN Same as TG18-GV but without white annulus
1024 x 1024 Inner, outer radii: 15, 300. Centered in pattern. Diameter: 9. Five disks, equally spaced inside inner radius of white annulus.
0 [0]
255 [4095]
2, 4, 6, 8, 10
[32, 64, 96, 128, 160]
TG18-GQ Background White annulus
TG18-GQN Same as TG18-GQ but without white annulus
TG18-GQB Same as TG18-GQ but with white disk replacing annulus
1024 x 1024 Inner, outer radii: 15, 300. Centered in pattern. Radius: 300. Centered in pattern.
0 [0]
255 [4095]
255 [4095]
TG18-GAr Background White annulus
1024 x 1024 Outer radius: 300. Centered in pattern. Inner radius, r: 3, 5, 8, 10, 15, 20, 25, or 30.
0 [0]
255 [4095]
Table AIII.6. Description of anatomical test patterns.
Test Pattern / Features Pixel Dimensions Pixel Values
TG18-CH
TG18-KN
TG18-MM1 TG18-MM2
PA chest test pattern (see 3.2.6.1) 2048 x 2048 Knee test pattern (see 3.2.6.2) 2048 x 2048 Mammogram test pattern 1 (see 3.2.6.4) 2048 x 2048 Mammogram test pattern 1 (see 3.2.6.4) 2048 x 2048
12-bit range: 8 to 3944 12-bit range: 2 to 3902 12-bit range: 0 to 4095 12-bit range: 0 to 4095

AAPM TG18 Preprint DRAFT (version 10.0)
147 August 26, 2004
Table AIII.7. Pixel values used in TG18 test patterns.
Percent of Maximum Pixel Value
8-bit Pixel Value
12-bit Pixel Value
0 1 5
10 11.2 20 25 50 51 56 60 75 80 89.3 95
100
0 3 13 26 29 51 64 128 130 143 153 191 204 228 242 255
0 41 205 410 459 819 1024 2048 2088 2293 2457 3071 3276 3656 3890 4095
Table AIII.8. TG18-QC pattern: luminance levels with 8-bit and [12-bit] pixel values and Cx ratings.
Level 6 Level 7 Level 8 Level 9 Level 10 Level 1188 [1408] 104 [1664] 120 [1920] 136 [2176] 152 [2432] 168 [2688]
Level 5 Level 1272 [1152] 184 [2944]
Level 4 Level 1356 [896] 200 [3200]
Level 3 Level 1440 [640] 216 [3456]
Level 2 Level 1524 [384] 232 [3712]
Level 1 0 / 5% 100 / 95% Level 168 [128] 0 / 13
[0 / 205] 255 / 242
[4095 / 3890]248 [3968]
Cx -1 Cx -2 Cx 9 Cx 8
Cx 1 Cx 6
Cx 0 Cx 7
Cx 2 Cx 3 Cx 4 Cx 5

AAPM TG18 Preprint DRAFT (version 10.0)
148 August 26, 2004
Table AIII.9: The blurring characteristics of the Cx reference set utilized in Tg18-QC and TG18-CX test patterns (Kohm 2001).
Ref No. Standard Deviation of blurring in pixels
Corresponding RAR
-2 0.35 σ1, 0.875 σ2 * NA -1 0.3 σ1, 0.99 σ2 * NA 0 0 1 (perfect) 1 0.339 0.80 2 0.383 0.90 3 0.432 1.02 4 0.488 1.15 5 0.551 1.30 6 0.622 1.47 7 0.703 1.65 8 0.794 1.87 9 0.896 2.11
* Profile = 0.85 N(σ1)+ 0.15 N(σ2), where N is Gaussian distribution.

AAPM TG18 Preprint DRAFT (version 10.0)
149 August 26, 2004
Appx IV Selected Bibliography
1. Anrijs H, Digital imaging: the Agfa experience, J Belge Radiol 80:196-198, 1997. 2. Ackerman SJ, Gitlin JN, Gayler RW, Flagle CD, Bryan RN, Receiver operating characteristic
analysis of fracture and pneumonia detection: comparison of laser-digitized workstation images and conventional analog radiographs, Radiology 186:263-268, 1993.
3. Badano A, Flynn MJ, Kanicki J, Accurate small-spot luminance measurements in display devices,
Displays 23:177-182, 2002. 4. Badano A, Kanicki J, Monte carlo analysis of the spectral photon emission and extraction
efficiency of organic light-emitting devices. Journal of Applied Physics 90:1827-1830, 2001. 5. Badano A, Flynn MJ, A method for measuring veiling glare in high performance display devices,
Applied Optics 39:2059-2066, 2000. 6. Badano A, Flynn MJ, Muka E, Compton K, Monsees T, The veiling glare point-spread function
of medical imaging monitors, Proc. SPIE, Vol. 3658, pp. 458-467, 1999. 7. Badano A, Flynn MJ, Image degradation by glare in radiologic display devices, Proc. SPIE, Vol.
3031, pp. 222-231, 1997. 8. Barten PGJ, Contrast Sensitivity of the Human Eye and Its Effects on Image Quality, SPIE
Press, Bellingham, WA, 1999. 9. Barten PGL, Physical model for the contrast sensitivity of the human eye, Proc SPIE 1666:57-72,
1992. 10. Barten PGL, Spatio-temporal model for the contrast sensitivity of the human eye and its
temporal aspects, Proc SPIE 1913:1, 1993. 11. Blume H, Image processing strategies in picture archiving and communication systems. J Digital
Imaging 12:43-47, 1999. 12. Blume H, Hemminger BM, Image presentation in digital radiology: perspectives on the emerging
DICOM display function standard and its application. Radiographics 17:769-77, 1997. 13. Blume H, Daly S, Muka E, Presentation of Medical Images on CRT Displays – A Renewed
Proposal for a Display Function Standard, Proc. SPIE, Vol. 1897, pp. 215-231, 1993. 14. Blume H, Ho AMK, Stevens F, Steven PM, Practical aspects of gray-scale calibration of display
systems, Proc. SPIE, Vol. 4323, pp. 28-41, 2001. 15. Boynton PA, Kelley EF, Accurate contrast-ratio measurements using a cone mask. Proc. SID, pp.
823-826, 1992. 16. Briggs SJ, Softcopy display of electro-optical imagery, Proc. SPIE, Vol. 762, pp. 153-169, 1987.

AAPM TG18 Preprint DRAFT (version 10.0)
150 August 26, 2004
17. Briggs SJ, Report D180-25066-1, Manual Digital Test Target BTP #4, Boeing Aerospace Company, Seattle, Washington, January 1979.
18. Brill MH, Seeing through screen reflection, Information Display 14:28-31, 1999. 19. Brill MH, LCD color reversal at a glance, Information Display 16:36-37, 2000. 20. Cook LT, Cox GG, Insana MF, McFadden MA, Hall TJ, Gaborski RS, Lure FY, Comparison of
a cathode-ray-tube and film for display of computed radiographic images, Med Phys 25:1132-1138, 1998.
21. Droege RT, A practical method to routinely monitor resolution in digital images, Med Phys
10:337-343, 1983. 22. DIN 6868-57-2001, Image quality assurance in x-ray diagnostics, Acceptance testing for image
display devices, The German Standards Institution, Deutsches Institut für Normung e.V., February 2001.
23. Dwyer SJ, Stewart BK, Clinical uses of grayscale workstations. Digital Imaging. AAPM
Monograph No. 22. pp 241- 264, 1993. 24. Dwyer SJ, Stewart BK, Sayre JW, Aberle DR, Boechat MI, Honeyman JC, Boehme JM, Roehrig
H, Ji TL, Blaine GJ, Performance characteristics and image fidelity of gray-scale monitors. Radiographics 12:765-772, 1992.
25. Dwyer SJ, Softcopy displays and digitizers, Proc. AAPM Summer School, Frey G, and Sprawls P
(eds.), 1997, pp. 381. 26. Eckert MP, Chakraborty DP, Video display quality control measurements for PACS, Proc. SPIE,
Vol. 2431, pp. 328-340, 1995. 27. Enstrom RE, Grote MD, Brill MH, Display performance assessment at NIDL, Proc. SPIE, Vol.
4022, pp. 358-368, 2000. 28. Fetterly KA, Bernatz SN, Groth DS, Hangiandreou NJ, Quantitative color measurement for the
characterization of grayscale PACS CRTs, Radiology 209(P):320, 1998. 29. Flynn MJ, Badano A, Image Quality Degradation by Light Scattering in Display Devices, J Digital
Imaging 12:50-59, 1999. 30. Flynn MJ, Kanicki J, Badano A, Eyler WR, High Fidelity Electronic Display of Digital
Radiographs, Radiographics 19:1653-1669, 1999. 31. Flynn, MJ, Couwenhoven M, Eyler WR, Whiting BR, Samei E, Foss DH, Slone R, Marom E,
Optimal image processing for digital radiography, Proc. SPIE, Vol. 4319, pp. 298-305, 2001. 32. Golden WE, Entering the quality assurance decade, Am J Med Sci 300:178-180, 1990. 33. Gray JE, Lisk KG, Haddick DH, Harschbarger JH, Oosterhof A, Schwenker R, Test pattern for
video displays and hardcopy cameras, Radiology 152:519-527, 1985.

AAPM TG18 Preprint DRAFT (version 10.0)
151 August 26, 2004
34. Gray JE, Use of SMPTE test pattern in picture archiving and communication systems, J Digital
Imaging 5:54-58, 1992. 35. Gray HF, Sune CT, Jones GW, Silicon Field-emitter Arrays for Cathodoluminescent Flat-panel
Displays, J Soc Information Displays 1-2:143-146, 1993. 36. Hall JA, Evaluation of signal-generting image tubes, Photoelectronic Imaging Devices 2:468-471,
1954. 37. Hangiandreou NJ, Fetterly KA, Flemlee JP, Optimization of a contrast-detail-based method for
electronic image display quality evaluation, J Digital Imaging 12:60-67, 1999. 38. Hangiandreou NJ, Fetterly KA, Bernatz SN, Cesar LJ, Groth DS, Felmlee JP, Quantitative
evaluation of overall electronic display quality, J Digital Imaging 11:180-186, 1998. 39. Hangiandreou NJ, O'Connor TJ, Felmlee JP, An evaluation of the signal and noise characteristics
of four CCD-based film digitizers, Med Phys 25:2020-2026, 1998. 40. He Y, Gong S, Hattori R, Kanicki J, High performance organic polymer light-emitting
heterostructures. Applied Physics Letters 16:661-663, 1999. 41. He Y, Kanicki J, High-efficiency organic polymer light-emitting heterostructure devices on
flexible plastic substrates. Applied Physics Letters 76:661-663, 2000. 42. Hemminger BM, Johnston RE, Rolland JR, Muller KE, Perceptual linearization of video display
monitors for medical image presentation, Proc. SPIE, Vol. 2164, pp. 222-240, 1994. 43. Hemminger BM, Johnston RE, Rolland JP, Muller KE, Introduction to perceptual linearization
of video display systems for medical image presentation, J Digital Imaging 8:21-34, 1995. 44. Hoke CD, Mori H, Bos PJ, An ultra-wide-viewing angle STN-LCD with a negative-birefringence
compensation film, Proceedings of the International Display Research Conference, Proc. SID, pp. 21-24, 1997.
45. Holloway P, Sebastian J, Trottier T, Production and control of vacuum in field emission flat
panel displays. Solid State Technology, pp. 47-54, Aug 1995. 46. Horii SC, Quality assurance for picture archiving and communication systems (PACS) and PACS
technology applications in radiology, J Digital Imaging 8:1-2, 1995. 47. Hsieh M, Hsu K, Paek E, Wilson C, Modulation transfer function of a liquid crystal spatial light
modulator, Optics Communications 170:221-227, 1999. 48. IEC/CIE, Publication No. 15.2, Colorimetry, 2nd Edition, Vienna, 1986. International
Commission on Illumination, Commission Internationale de l’Eclairage (CIE), CIE Central Bureau, Kegelgasse 27, A-1030, Wien, Austria, http://www.cie.co.at/cie/.
49. IEC 61223-2-5, 1994, Evaluation and routine testing in medical imaging departments - Part 2-5:
Constancy tests - Image display devices, International Commission on Illumination, Commission

AAPM TG18 Preprint DRAFT (version 10.0)
152 August 26, 2004
Internationale de l’Eclairage (CIE), CIE Central Bureau, Kegelgasse 27, A-1030, Wien, Austria, www.cie.co.at/cie/.
50. Infante C, CRT display measurements and quality, Proc. SID, pp. 1-54, 1993. 51. ISO 13406-2, 2001, Ergonomic requirements for the use of flat-panel displays. American
National Standards Institute, 11 West 42nd Street, New York, New York 10036, www.ansi.org/. 52. ISO 9241-7, 1997 Ergonomic requirements for office work with visual display terminals.
American National Standards Institute, 11 West 42nd Street, New York, New York 10036, www.ansi.org/.
53. ISO 9241-3, 1992 Ergonomic requirements for office work with visual display terminals (VDTs) -
- Part 3: Visual display requirements, American National Standards Institute, 11 West 42nd Street, New York, New York 10036, www.ansi.org/.
54. Kato H, Hard- and soft-copy image quality, RSNA Categorical Course in Physics, pp. 243-258,
1995. 55. Keller PA, Electronic Display Measurement: Concepts, Techniques and Instrumentation. John
Wiley & Sons, Inc, 1997. 56. Kelley EF, Jones GR, Boynton PA, Grote MD, Bechis DJ, A survey of the components of
display measurement standards, SID Digest, pp. 637-640, 1995. 57. Kelley EF, Proposed diffuse ambient lighting contrast measurement methods for flat panel
displays, NISTIR 6738, National Institute of Standards and Technology, Gaithersburg, MD, 2001.
58. Kelley EF, Sensitivity of display refelection measurements to apparatus geometry, SID Digest
11.3, 2002. 59. Kohm KS, Cameron AW, Van Metter RL, Visual CRT sharpness estimation using a fiducial
marker set, Proc. SPIE, Vol. 4319, pp. 286-297, 2001. 60. Libsch FR, Lien A, Understanding crosstalk in high-resolution color thin-film-transistor liquid
crystal displays. IBM Journal of Research and Development, 42:467-479, 1998. 61. Lie A, Coordination of quality assurance [in Norwegian], Tidsskr Nor Laegeforen 114:613-615.
1994. 62. Lippincott H (ed.), The CRT Book, The ABCs of CRTs, Clinton Electronics Corp., Rockford, I,
1988. 63. Leclet H, About the importance of building quality assurance programs in medical imaging [in
French], J Radiol 78:479-480, 1997. 64. Ludlow JB, Abreu M Jr, Performance of film, desktop monitor and laptop displays in caries
detection, Dentomaxillofac Radiol 28:26-30, 1999.

AAPM TG18 Preprint DRAFT (version 10.0)
153 August 26, 2004
65. Mertelmeier T, Why and how is softcopy reading possible? J Digital Imaging 12:3-11, 1999. 66. Mertelmeier T, Kocher T, Monitor simulations for the optimization of medical soft copies, Proc.
SPIE, Vol. 2707, pp. 322-333, 1996. 67. Moss H, Narrow Angle Electron Guns and Cathode Ray Tubes, Academic Press, 1968. 68. Muka E, Blume H, Daly S, Display of medical images on CRT soft-copy displays: a tutorial, Proc.
SPIE, Vol. 2431, pp. 341-359, 1995. 69. Muka E, Mertelmeier T, Slone RM, Senol E, Impact of phosphor luminescence noise on the
specification of high-resolution CRT displays for medical imaging, Proc. SPIE, Vol. 3031, pp. 210-221, 1997.
70. Nam MS, Wu JW, Choi YJ, Wide-viewing-angle TFT-LCD with photo-aligned four-domain TN
mode. Proc. SID, pp. 933-936, 1997. 71. Nawfel RD, Chan KH, Wagenaar DJ, Judy PF, Evaluation of video gray-scale display, Medical
Physics 19:561-567, 1992. 72. NEMA PS 3.14, 2000, "Digital Imaging and Communications in Medicine (DICOM) Part 14:
Grayscale Display Standard Function", National Electrical Manufacturers Association, NEMA, 1300 North 17th Street, Suite 1847, Rosslyn, VA 22209, www.nema.org/. Draft viewable at http://medical.nema.org/dicom/2000/draft/00_14DR.PDF, Available for purchase in whole or in parts from Global Sales, Global Engineering Documents, 15 Inverness Way East Englewood, CO, 80112, USA; global.ihs.com/.
73. NIDL Publication 171795-036, Display Monitor Measurement Methods under discussion by EIA
(Electronic Industries Association) Committee JT-20 Part 1: Monochrome CRT Monitor Performance, National Information Display Laboratory, Princeton, New Jersey, July 12, 1995.
74. NIDL Publication No. 0201099-091, Request for Evaluation Monitors for the National Imagery
& Mapping Agency (NIMA) Integrated Exploitation Capability (IEC), National Information Display Laboratory, Princeton, New Jersey, August 25, 1999.
75. NIDL Publication, Test Procedures for Evaluation of CRT Display Monitors, Version 3.1,
National Information Display Laboratory, Princeton, New Jersey, June 15, 1992. 76. Nier MC, Courtot ME (eds.). Standards for Electronic Imaging Systems, Proc. SPIE, Vol. CR37,
1991. 77. Nier MC (ed.). Standards for Electronic Imaging Technologies, Devices, and Systems, Proc.
SPIE, Vol. CR61, 1996. 78. Oekel JJv, Improving the contrast of CRTs under low ambient illumination with a graphite
coating. Proc. SID, pp. 427-430, 1995. 79. Paszkowski B, Electron Optics, Life Books Inc, London, 1968.

AAPM TG18 Preprint DRAFT (version 10.0)
154 August 26, 2004
80. Pavlicek W, Owen J, Peter MB, Active matrix liquid crystal displays for clinical imaging: comparison with cathode ray tube displays, J Digital Imaging 134:155-161, 2000.
81. Pavlicek W, Liu P, Computed radiographic examinations of subtle bone pathology; implications
for liquid crystal displays in radiology, Proc. SPIE, Vol. 4295, pp. 164-175, 2001. 82. Peli E, Arend L, Labianca AT, Contrast perception across changes in luminance and spatial
frequency. J Opt Soc Am A 13:1953-1959, 1996. 83. Pilgram TK, Slone RM, Muka E, Cox JR, Blaine GJ, Perceived fidelity of compressed and
reconstructed radiological images: a preliminary exploration of compression, luminance, and viewing distance, J Digital Imaging 11:168-175, 1998.
84. Pizer SM, Intensity Mapping to linearize display devices, Proc. Computer Graphics Image
Processing, Vol. 17, pp. 262-268, 1981. 85. Rao GN, Relevance of quality assurance, Indian J Ophthalmol. 42:49, 1994. 86. Reiker GG, Gohel N, Muka E, Blaine GJ, Quality monitoring of soft-copy displays for medical
radiography, J Digital Imaging 5:161-167, 1992. 87. Reimann DA, Flynn MJ, Ciarelli JJ, A system to maintain perceptually linear networked display
devices, Proc. SPIE, Vol. 2431, pp. 316-326, 1995. 88. Roehrig H, The monochrome cathode ray tube display and its performance, in: Beutel J, Kundel
HL, and Van Metter RL, eds, “Handbook of Medical Imaging”, Volume 3, Chapter 4, SPIE Press, Bellingham, WA, 2000.
89. Roehrig H, Dallas WJ, Blume H, Sivarudrappa M, Software for CRT image quality evaluation,
Proc. SPIE, Vol 3976, pp. 442-453, 2000. 90. Roehrig-H., “Image quality assurance for CRT display systems.” J Digital Imaging. vol.12. pp. 1-
2. 1999.
91. Roehrig H, Image quality assurance for CRT display systems--Part II [editorial], J Digital Imaging 12:49, 1999.
92. Roehrig H, Image quality assurance for CRT display systems [editorial], J Digital Imaging 12:1-2,
1999. 93. Roehrig H, Krupinski E, Image Quality of CRT displays and the effect of brightness of diagnosis
of mammograms. J Digital Imaging 11:187-188, 1998.
94. Roehrig H, Blume H, Ji TL, Browne M, Performance tests and quality control of cathode ray tube displays, J Digital Imaging 3:134-145, 1990.
95. Roehrig H, Ji TL, Browne M, Dallas WJ, Blume H, Signal-to-Noise Ratio and Maximum
Information Content of Images Displayed by a CRT, Proc. SPIE, Vol. 1232, pp. 115-133, 1990.

AAPM TG18 Preprint DRAFT (version 10.0)
155 August 26, 2004
96. Roehrig H, Blume H, Ji TL, Sundareshan MK, Noise of CRT Display Systems, Proc. SPIE. Vol. 1897, pp. 232-245, 1993.
97. Roehrig H, Willis CE, Damento MA, Characterization of monochome CRT display systems in
the field, J Digital Imaging 12:152-165, 1999. 98. Rose A, Vision, Human and Electronic, Plenum Press, New York-London, 1974. 99. Rowlands J, Television camera design and specification, Proc. AAPM Summer School, Seibert
JA, Barnes G, and Gould R (eds), AAPM, 1992, pp. 461. 100. Ryer AD, Light Measurement Handbook, International Light, Newburyport, MA, 1998. 101. Samei E, Flynn MJ, A method for in-field evaluation of the modulation transfer function of
electronic display devices, Proc. SPIE, Vol. 4319, pp. 599-607, 2001.
102. Samei E. Digital Mammography Displays. In: Advances in Breast Imaging: Physics, Technology, and Clinical Applications, A Karellas and ML Giger (eds). Radiological Society of North America (RSNA) Publication, Categorical Course Syllabus, Oak Brook, IL (in press, 2004a).
103. Samei E, Wright SL. The effect of viewing angle response on DICOM compliance of LCD
displays. Proc. SPIE Medical Imaging 5371: 170-177, 2004b. 104. Scott WW, Rosenbaum JE, Ackerman SJ, Reichle RL, Magid D, Weller JC, Gitlin JN, Subtle
orthopedic fractures: teleradiology workstation versus film interpretation, Radiology 187:811-815, 1993.
105. Scott WW, Bluemke DA, Mysko WK, Weller GER, Kelen GD, Reichle RL, Weller JC, Gitlin JN,
Interpretation of emergency department radiographs by radiologists and emergency medicine physicians: teleradiology workstation versus radiograph readings, Radiology 195:223-229, 1995.
106. Senol E, Muka E, Spatial frequency characteristics of CRT soft-copy displays, Proc. SPIE, Vol.
2431, pp. 302-315, 1995. 107. Sheats JR, Roitman DB, Failure modes in polymer-based light-emitting diodes, Synthetic Metals
95:85-79, 1998. 108. SMPTE RP133, Specifications for Medical Diagnostic Imaging Test Pattern for Television
Monitors and Hardcopy Recording Cameras, Society of Motion Picture & Television Engineers (SMPTE), 595 West Hartsdale Avenue, White Plains, NY 10607, +1 (914) 761-1100.
109. Spekowius G, Characterization of color CRT display systems for monochrome applications, J
Digital Imaging 12:102-113, 1999.
110. Suzuki J, Furukawa I, Ono S, Kitamura M, Ando Y, Contrast mapping and evaluation for electronic X-ray images on CRT display monitor, IEEE Trans Med Imaging 16:772-784, 1997.
111. Tang CM, Swyden TA, Beam collimation from field-emitter arrays with linear planar lenses.
Proc. SID, pp. 115-118, 1997.

AAPM TG18 Preprint DRAFT (version 10.0)
156 August 26, 2004
112. Tang CW, VanSlyke SA, Organic electroluminescent diodes. Applied Physics Letters 51:913-915, 1987.
113. Tirard-Gatel N, Perrin A, Levy F, Charging and reliability effects associated with FED spacers.
Proc. SID, pp. 1134-1137, 1999. 114. Umezu N, Nakamo Y, Sakai T, et al, Specular and diffuse reflection measurement feasibility study
of ISO 9241 part 7 method, Displays 19:17-25, 1998. 115. Van Metter R, Binsheng Z, Kohm K, The sensitivity of visual targets for display quality
assessment. Proc. SPIE, Vol. 3658, pp. 254-268, 1999. 116. VESA; Flat Panel Display Measurements Standard, Version 2.0, June 2001, Video Electronics
Standards Association, 920 Hillview Court, Suite 140, Milpitas, CA 95035, www.vesa.org. 117. VESA; Flat Panel Display Measurements Standard, Version 1.0, May 1998, Video Electronics
Standards Association, 920 Hillview Court, Suite 140, Milpitas, CA 95035, www.vesa.org. 118. VESA; Video Signal Standard, (VSIS) Version 1, Rev. 1, Draft 4, February 14, 2000, Video
Electronics Standards Association, 920 Hillview Court, Suite 140, Milpitas, CA 95035, www.vesa.org.
119. Wakemoto H, Asada S, Kato N, An advanced in-plane switching mode TFT-LCD, Proc. SID,
pp. 929-932, 1997. 120. Wang J, Langer, A brief review of human perception factors in digital displays for picture
archiving and communications systems. J Digital Imaging 10:158-168, 1997. 121. Wang HK, Multimodality image viewing, Proc. AAPM Summer School, Hendee W, and
Trueblood J (eds.), AAPM, 1993, pp. 267. 122. Weibrecht M, Spekowius G, Quadflieg P, Blume H, Image quality assessment of monochrome
monitors for medical softcopy display, Proc. SPIE, Vol. 3031, pp. 232-244, 1997. 123. Weiser JC, Drummond KT, Evans BD, Shock DJ, Frick MP, Quality assurance for digital
imaging, J Digital Imaging 10:7-8, 1997. 124. Wright SL, Millman S, Kodate M, Measurement and digital compensation of crosstalk and
photoleakage in high-resolution TFT-LCDs. Proc. SPIE, Vol. 3636, pp. 200-211, 1999. 125. Xie C, Kumar N, Collins CB, Lee T, Schmidt H, Wagal S, Electron field emission from amorphic
diamond thin films. Proc. of 6th International Vacuum Microelectronics Conference, 1993, p.162.