appendices h1 2017 results - engie€¦ · appendices - index financial appendices page 31 ......
TRANSCRIPT

FIN
AN
CIA
L A
PP
EN
DIC
ES
APPENDICES
H1 2017 RESULTS
July 28th, 2017

APPENDICES - INDEX
FINANCIALAPPENDICES
PAGE 31
Generation capacity & electricity output 32
Outright power generation in Europe
Nuclear & Hydro 43
Reportable segments 45
— North America 46
— Latin America 48
— Africa/Asia 50
— Benelux 52
— France 55
— Europe excluding France & Benelux 59
— Infrastructures Europe 62
— GEM & LNG 65
— Others 67
PAGE 70
Impact of weather in France 71
Change in number of shares, scope & forex 74
Balance sheet, P/L & cash flow statement 78
Profit & Loss details 84
Cash flow details 102
Credit 107
BUSINESS APPENDICES
BUSINESS APPENDICES
H1 2017 RESULTS

GENERATION CAPACITY
& ELECTRICITY OUTPUT

At 100%
% consolidation(1)
Net ownership(2)
BREAKDOWN OF GENERATION CAPACITY BY GEOGRAPHIC AREAAS OF 06/30/2017
33
(1) % of consolidation for full consolidated and joint operations affiliates and % holding for equity consolidated companies(2) ENGIE ownership
META
Asia
Latin America
Europe
North America
Oceania
H1 2017 RESULTS
International
59% 94%
In fast growing markets
54% 94%
International
46% 91%
In fast growing markets
41% 91%
International
43% 91%
In fast growing markets
38% 91%
101.1 GW41%
2%7%
29%
17% 3%
67.8 GW 54%
3%8%
13%
19%
2%
58.4 GW 57%
3%7%
15%
16%
3%
6.0 GW
6%5%
68%
21%
3.1 GW
9%7%
43%41%
2.7 GW
8%9%
50%
33%
Installed Under construction
BU
SIN
ES
S A
PP
EN
DIC
ES

At 100%
% consolidation(2)
Net ownership(3)
BREAKDOWN OF GENERATION CAPACITY BY TECHNOLOGYAS OF 06/30/2017
34
(1) Excluding pumped storage for hydro capacity(2) % of consolidation for full consolidated and joint operations affiliates and % holding for equity consolidated companies(3) ENGIE ownership
Natural gas
Hydro
Wind
Biomass
& biogas
Coal
Nuclear
Other
non-renewable
Solar
H1 2017 RESULTS
low CO2 emissions
88% 68%
renewables(1)
21% 23%
low CO2 emissions
85% 65%
renewables(1)
22% 37%
low CO2 emissions
87% 69%
renewables(1)
19% 37%
Installed Under construction
101.1 GW
7%6%
1%
57%
1%
5%
19%
5%
67.8 GW
10%
9%1%
47%1%
5%
22%
6%
58.4 GW
8%
11%
50%1%
5%
18%
5%
1%
6.0 GW
32%
11%
46%
10%
1%
3.1 GW
35%
18%
28%
19%
1%
2.7 GW
31%
19%
32%
16%
1%
Other
renewable
BU
SIN
ES
S A
PP
EN
DIC
ES

INSTALLED CAPACITY EVOLUTION VS END 2016AS OF 06/30/2017, IN GW, AT 100%
35
112.7
101.1
06/30/2016 06/30/2017LatinAmerica
Europe & Others Africa/Asia Disposals Closing/
Decommissioning
Others
+0.1+0.3+0.4
• Solairedirect(USA, solar, 64 MW)
• Solairedirect(France, solar, 96 MW)
• Engie Green (France, wind, 29 MW)
• Wind4 (Belgium, wind, 27 MW)
• Mirfa(UAE, gas, 360 MW)
(10.2)
(2.1)
(0.01)• US assets
(gas 7,422 MW & coal 686 MW)
• Polaniec(Poland, coal 1,527 MW & biomass 190 MW)
• Rosen(Italy, gas 356 MW)
-12.3 GW closed or sold
of which -3.8 GW coal
• Estrela & Ouro Verde (Brazil, wind, 59 MW)
+0.7 GW of new capacity added: • 100% in low CO2 technologies:
47% renewables, 53% gas
• 61% in fast growing markets
• Hazelwood (Australia, coal,1,554 MW)
• Eems(NL, gas, 359 MW)
• Charqueadas(Brazil, coal, 60 MW)
• Capacity revisions
H1 2017 RESULTS
59%international
54%fast growing markets
88%low CO2 emissions
21%renewables
BU
SIN
ES
S A
PP
EN
DIC
ES
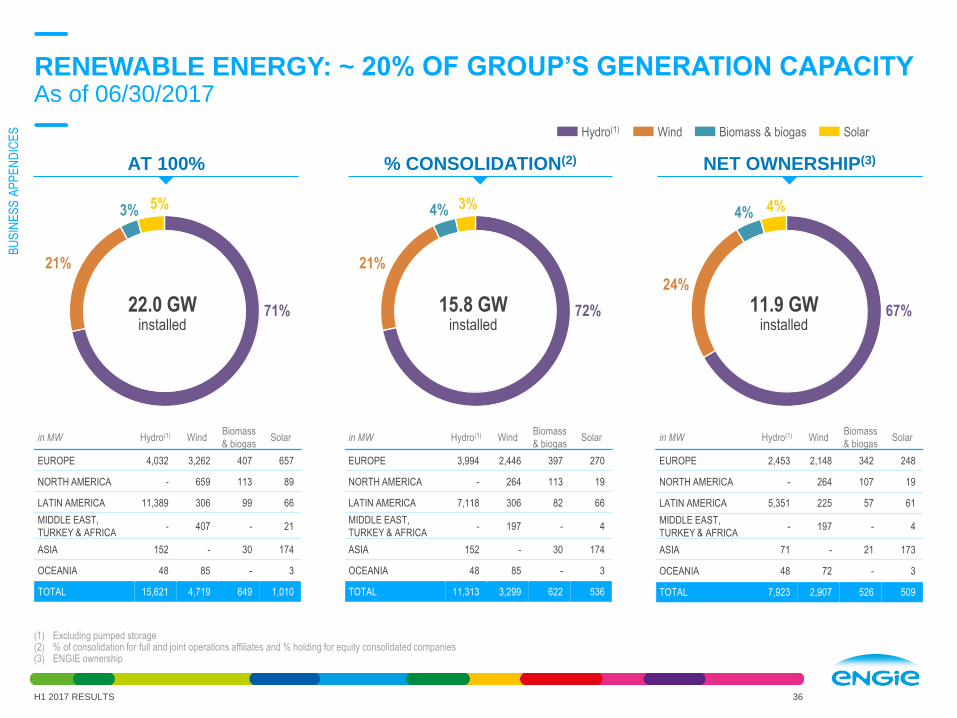
in MW Hydro(1) WindBiomass
& biogasSolar
EUROPE 4,032 3,262 407 657
NORTH AMERICA - 659 113 89
LATIN AMERICA 11,389 306 99 66
MIDDLE EAST,
TURKEY & AFRICA- 407 - 21
ASIA 152 - 30 174
OCEANIA 48 85 - 3
TOTAL 15,621 4,719 649 1,010
RENEWABLE ENERGY: ~ 20% OF GROUP’S GENERATION CAPACITYAs of 06/30/2017
36
(1) Excluding pumped storage(2) % of consolidation for full and joint operations affiliates and % holding for equity consolidated companies(3) ENGIE ownership
22.0 GWinstalled
5%3%
21%
71%
3%4%
21%
15.8 GWinstalled
72%
in MW Hydro(1) WindBiomass
& biogasSolar
EUROPE 3,994 2,446 397 270
NORTH AMERICA - 264 113 19
LATIN AMERICA 7,118 306 82 66
MIDDLE EAST,
TURKEY & AFRICA- 197 - 4
ASIA 152 - 30 174
OCEANIA 48 85 - 3
TOTAL 11,313 3,299 622 536
in MW Hydro(1) WindBiomass
& biogasSolar
EUROPE 2,453 2,148 342 248
NORTH AMERICA - 264 107 19
LATIN AMERICA 5,351 225 57 61
MIDDLE EAST,
TURKEY & AFRICA- 197 - 4
ASIA 71 - 21 173
OCEANIA 48 72 - 3
TOTAL 7,923 2,907 526 509
4%4%
24%
11.9 GWinstalled
67%
Hydro(1) Wind Biomass & biogas Solar
H1 2017 RESULTS
AT 100% % CONSOLIDATION(2) NET OWNERSHIP(3)
BU
SIN
ES
S A
PP
EN
DIC
ES
AT 100%
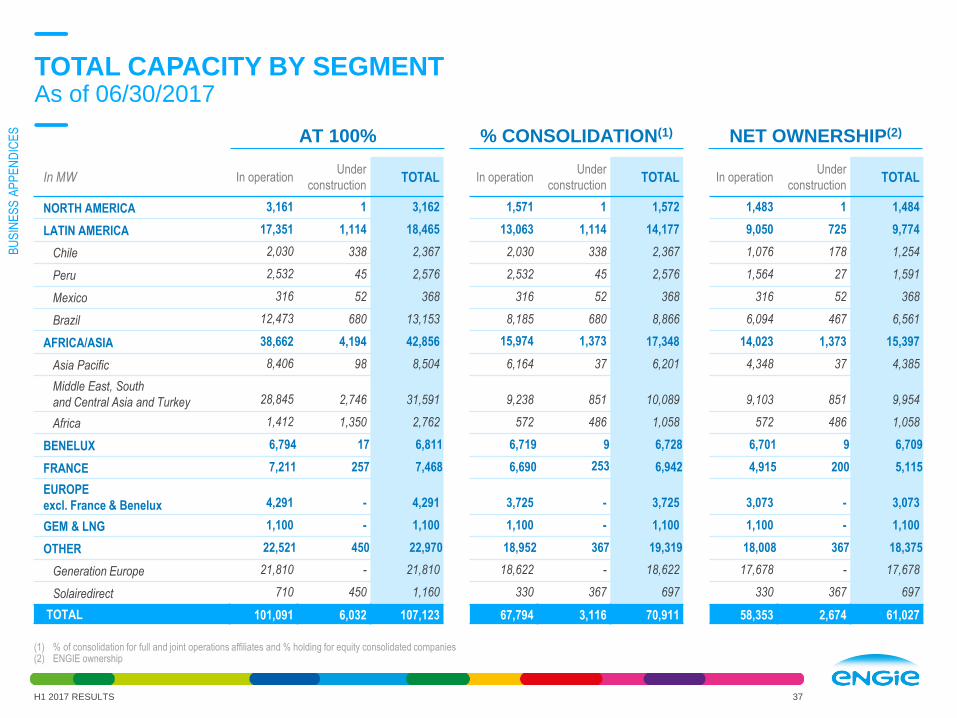
TOTAL CAPACITY BY SEGMENTAs of 06/30/2017
37
(1) % of consolidation for full and joint operations affiliates and % holding for equity consolidated companies(2) ENGIE ownership
In MW In operationUnder
constructionTOTAL In operation
Under
constructionTOTAL In operation
Under
constructionTOTAL
NORTH AMERICA 3,161 1 3,162 1,571 1 1,572 1,483 1 1,484
LATIN AMERICA 17,351 1,114 18,465 13,063 1,114 14,177 9,050 725 9,774
Chile 2,030 338 2,367 2,030 338 2,367 1,076 178 1,254
Peru 2,532 45 2,576 2,532 45 2,576 1,564 27 1,591
Mexico 316 52 368 316 52 368 316 52 368
Brazil 12,473 680 13,153 8,185 680 8,866 6,094 467 6,561
AFRICA/ASIA 38,662 4,194 42,856 15,974 1,373 17,348 14,023 1,373 15,397
Asia Pacific 8,406 98 8,504 6,164 37 6,201 4,348 37 4,385
Middle East, South
and Central Asia and Turkey 28,845 2,746 31,591 9,238 851 10,089 9,103 851 9,954
Africa 1,412 1,350 2,762 572 486 1,058 572 486 1,058
BENELUX 6,794 17 6,811 6,719 9 6,728 6,701 9 6,709
FRANCE 7,211 257 7,468 6,690 253 6,942 4,915 200 5,115
EUROPE
excl. France & Benelux 4,291 - 4,291 3,725 - 3,725 3,073 - 3,073
GEM & LNG 1,100 - 1,100 1,100 - 1,100 1,100 - 1,100
OTHER 22,521 450 22,970 18,952 367 19,319 18,008 367 18,375
Generation Europe 21,810 - 21,810 18,622 - 18,622 17,678 - 17,678
Solairedirect 710 450 1,160 330 367 697 330 367 697
TOTAL 101,091 6,032 107,123 67,794 3,116 70,911 58,353 2,674 61,027
H1 2017 RESULTS
% CONSOLIDATION(1) NET OWNERSHIP(2)
BU
SIN
ES
S A
PP
EN
DIC
ES
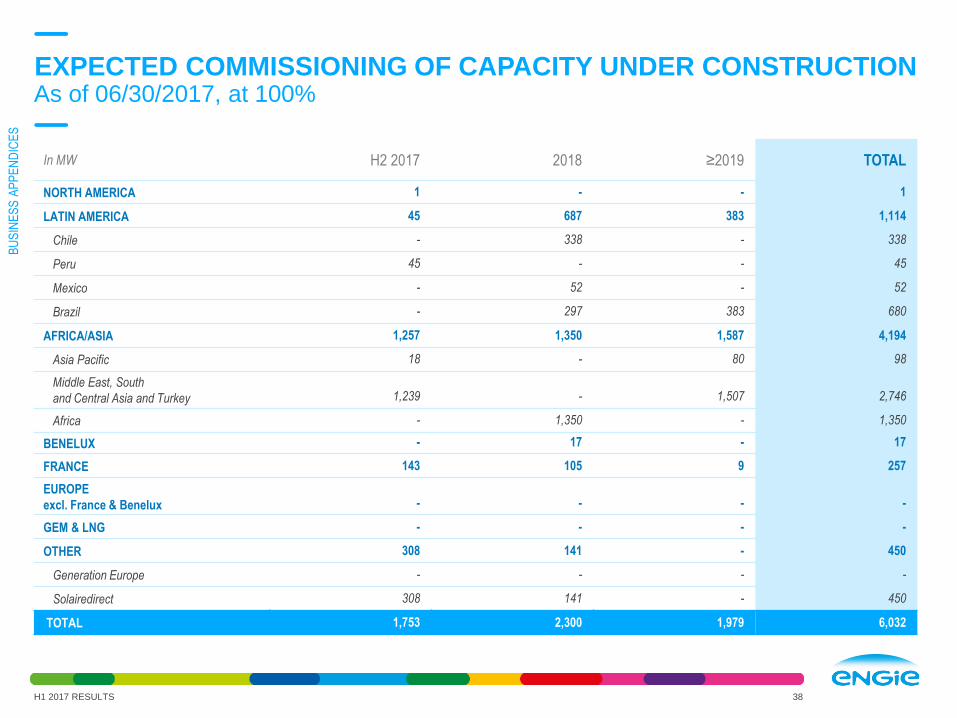
EXPECTED COMMISSIONING OF CAPACITY UNDER CONSTRUCTIONAs of 06/30/2017, at 100%
38H1 2017 RESULTS
In MW H2 2017 2018 ≥2019 TOTAL
NORTH AMERICA 1 - - 1
LATIN AMERICA 45 687 383 1,114
Chile - 338 - 338
Peru 45 - - 45
Mexico - 52 - 52
Brazil - 297 383 680
AFRICA/ASIA 1,257 1,350 1,587 4,194
Asia Pacific 18 - 80 98
Middle East, South
and Central Asia and Turkey 1,239 - 1,507 2,746
Africa - 1,350 - 1,350
BENELUX - 17 - 17
FRANCE 143 105 9 257
EUROPE
excl. France & Benelux - - - -
GEM & LNG - - - -
OTHER 308 141 - 450
Generation Europe - - - -
Solairedirect 308 141 - 450
TOTAL 1,753 2,300 1,979 6,032
BU
SIN
ES
S A
PP
EN
DIC
ES
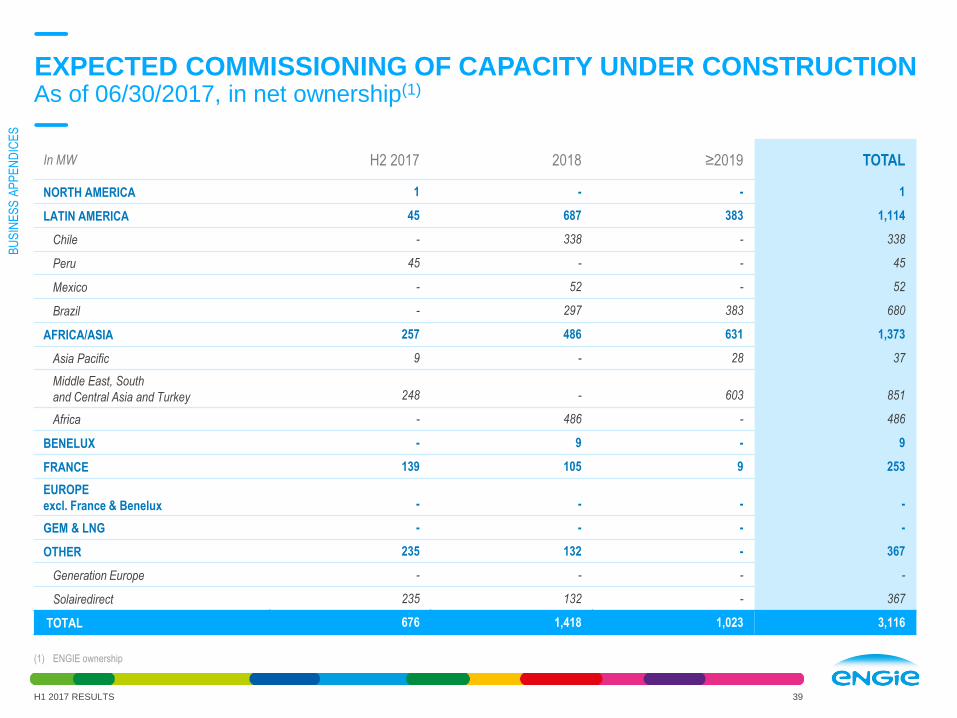
EXPECTED COMMISSIONING OF CAPACITY UNDER CONSTRUCTIONAs of 06/30/2017, in net ownership(1)
39
(1) ENGIE ownership
H1 2017 RESULTS
In MW H2 2017 2018 ≥2019 TOTAL
NORTH AMERICA 1 - - 1
LATIN AMERICA 45 687 383 1,114
Chile - 338 - 338
Peru 45 - - 45
Mexico - 52 - 52
Brazil - 297 383 680
AFRICA/ASIA 257 486 631 1,373
Asia Pacific 9 - 28 37
Middle East, South
and Central Asia and Turkey 248 - 603 851
Africa - 486 - 486
BENELUX - 9 - 9
FRANCE 139 105 9 253
EUROPE
excl. France & Benelux - - - -
GEM & LNG - - - -
OTHER 235 132 - 367
Generation Europe - - - -
Solairedirect 235 132 - 367
TOTAL 676 1,418 1,023 3,116
BU
SIN
ES
S A
PP
EN
DIC
ES
145 TWh
15%
2%
2%
46%
2%2%
15%
127 TWh
12%2%
17% 50%
2%14%
2%
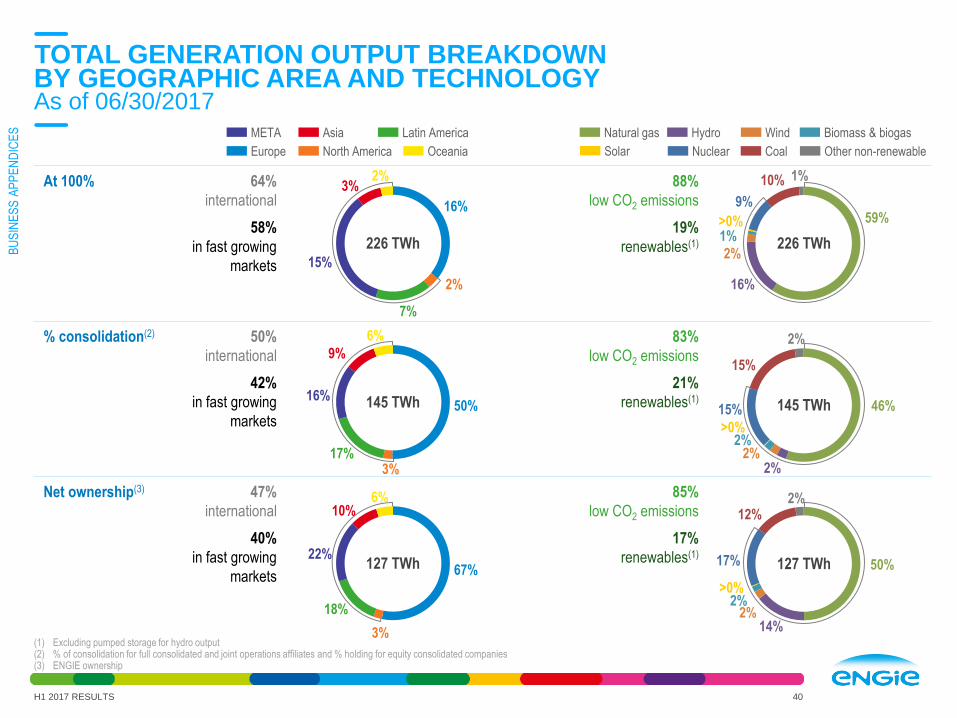
At 100% 64%
international
58%
in fast growing
markets
88%
low CO2 emissions
19%
renewables(1)
% consolidation(2) 50%
international
42%
in fast growing
markets
83%
low CO2 emissions
21%
renewables(1)
Net ownership(3) 47%
international
40%
in fast growing
markets
85%
low CO2 emissions
17%
renewables(1)127 TWh 67%
6%10%
22%
18%
3%
145 TWh 50%
6%
9%
16%
17%3%
TOTAL GENERATION OUTPUT BREAKDOWNBY GEOGRAPHIC AREA AND TECHNOLOGYAs of 06/30/2017
40
(1) Excluding pumped storage for hydro output(2) % of consolidation for full consolidated and joint operations affiliates and % holding for equity consolidated companies(3) ENGIE ownership
H1 2017 RESULTS
META Asia Latin America
Europe North America Oceania
226 TWh
16%
2%3%
15%
7%
2%
Natural gas Hydro Wind Biomass & biogas
CoalNuclear Other non-renewableSolar
226 TWh
10% 1%
1%
59%
2%
16%
9%
>0%
>0%
>0%
BU
SIN
ES
S A
PP
EN
DIC
ES

In TWh At 100% % consolidation(1) Net ownership(2)
NORTH AMERICA 8 4 3
LATIN AMERICA 36 25 18
Chile 3 3 1
Peru 4 4 2
Mexico 1 1 1
Brazil 29 18 14
AFRICA/ASIA 101 43 37
Asia Pacific 20 17 11
Middle East, South
and Central Asia and Turkey 81 26 26
Africa 1 - -
BENELUX 22 22 22
FRANCE 10 10 6
EUROPE
excl. France & Benelux 4 3 3
GEM & LNG 4 4 4
OTHER 42 35 34
Generation Europe 41 35 33
Solairedirect - - -
TOTAL 226 145 127
ELECTRICITY OUTPUT BY SEGMENTAs of 06/30/2017
41
(1) % of consolidation for full and joint operations affiliates and % holding for equity consolidated companies(2) ENGIE ownership
H1 2017 RESULTS
BU
SIN
ES
S A
PP
EN
DIC
ES

In TWhBiomass
and biogas Coal Hydro Natural gas Nuclear
Other non
renewable Solar WindTOTAL
NORTH AMERICA 0.4 - - 2.8 - 0.1 - 0.4 3.7
LATIN AMERICA 0.2 4.5 16.4 3.8 - 0.1 - 0.3 25.3
Chile - 2.3 - 0.5 - - - - 2.9
Peru - 0.3 0.9 2.2 - 0.1 - - 3.5
Mexico - - - 1.1 - - - - 1.1
Brazil 0.2 1.9 15.5 - - - - 0.2 17.8
AFRICA/ASIA - 10.0 0.3 32.0 - 0.2 - 0.4 42.9
Asia Pacific - 10.0 0.3 6.4 - 0.1 - - 16.8
Middle East, South
and Central Asia and Turkey - - - 25.6 - 0.1 - - 25.7
Africa - - - - - - - 0.3 0.4
BENELUX - - - - 21.3(1) - - 0.3 21.6
FRANCE 0.3 - 7.0 0.8 - 0.2 0.1 1.2 9.6
EUROPE
excl. France & Benelux - 0.1 1.4 0.6 - - - 0.9 3.0
GEM & LNG - - - 3.6 - - - - 3.6
OTHER 1.5 6.9 0.6 23.8 - 2.5 0.2 - 35.5
Generation Europe 1.5 6.9 0.6 23.8 - 2.5 - - 35.3
Solairedirect - - - - - - 0.2 - 0.2
TOTAL 2.4 21.5 25.6 67.3 21.3 3.1 0.3 3.4 145.1
ELECTRICITY OUTPUT BY SEGMENT AND BY FUELAs of 06/30/2017, in % of consolidation
42
(1) o/w France 7.4 TWh
H1 2017 RESULTS
BU
SIN
ES
S A
PP
EN
DIC
ES

OUTRIGHT POWER
GENERATION IN EUROPE
Nuclear & Hydro

CWE outright: EBITDA price sensitivity
+/- €1/MWh in achieved price
n ca. +/- €60m EBITDA impact before hedging
3-year rolling hedging policy
OUTRIGHT POWER GENERATION IN EUROPENuclear & Hydro
H1 2017 RESULTS 44
(1) 2016-2018 estimates including D1 & 2 extension, average hydro conditions
As of 06/30/17
France, Belgium (including D1&2 10y extension)
Outright Hedges: prices & volumes
In €/MWh
4037
33 32
2016 2017 2018 2019
100%
100%
94%83%
86%
France
~40%
Belgium
~60%
~60
TWh/year(1)
45%
Forward outright prices Belgium baseload
25
30
35
40
45
50
55
01/01/2013 01/01/2014 01/01/2015 01/01/2016 01/01/2017
Cal16 Cal17 Cal18 Cal19
€40MWh
€32/MWh
€37/MWh
€33/MWh
3-year rolling hedging policy
CWE outright: forward prices and hedges
€/MWh
BU
SIN
ES
S A
PP
EN
DIC
ES

REPORTABLE
SEGMENTS
46
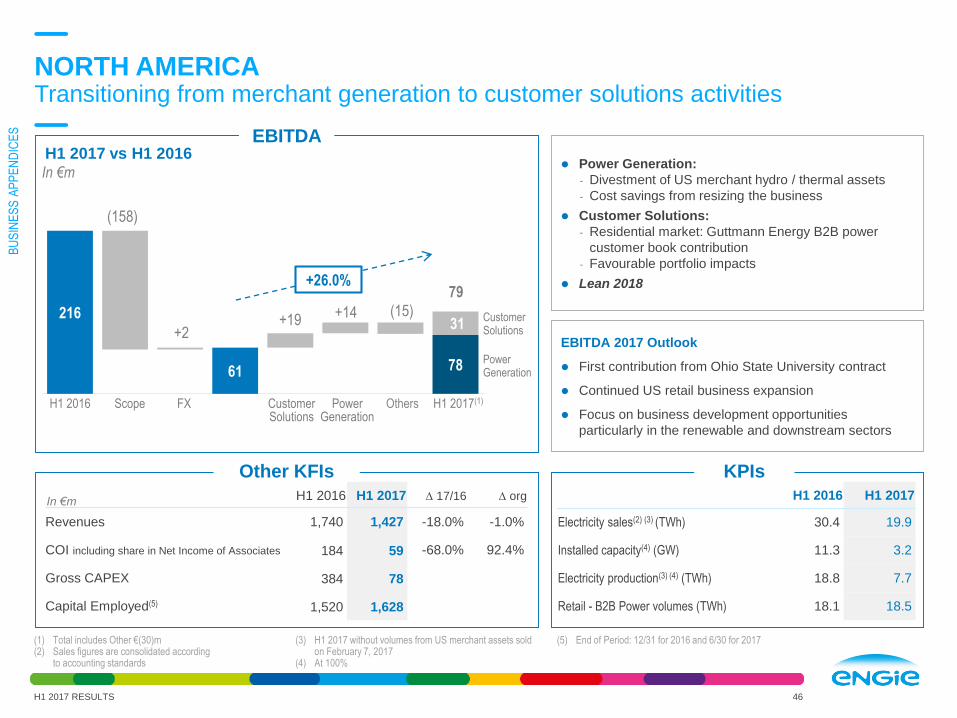
NORTH AMERICATransitioning from merchant generation to customer solutions activities
(1) Total includes Other €(30)m(2) Sales figures are consolidated according
to accounting standards
(3) H1 2017 without volumes from US merchant assets sold on February 7, 2017
(4) At 100%
(5) End of Period: 12/31 for 2016 and 6/30 for 2017
Power Generation:
- Divestment of US merchant hydro / thermal assets
- Cost savings from resizing the business
Customer Solutions:
- Residential market: Guttmann Energy B2B power
customer book contribution
- Favourable portfolio impacts
Lean 2018
EBITDA 2017 Outlook
First contribution from Ohio State University contract
Continued US retail business expansion
Focus on business development opportunities
particularly in the renewable and downstream sectors
216
59 59 61 61 80 79 78
(158)
+2+19 +14 (15)
31 CustomerSolutions
PowerGeneration
79
In €m H1 2016 H1 2017 D 17/16 D org
Revenues 1,740 1,427 -18.0% -1.0%
COI including share in Net Income of Associates 184 59 -68.0% 92.4%
Gross CAPEX 384 78
Capital Employed(5) 1,520 1,628
H1 2016 H1 2017
Electricity sales(2) (3) (TWh) 30.4 19.9
Installed capacity(4) (GW) 11.3 3.2
Electricity production(3) (4) (TWh) 18.8 7.7
Retail - B2B Power volumes (TWh) 18.1 18.5
Other KFIs KPIs
EBITDA
In €m
Scope FXH1 2016 CustomerSolutions
PowerGeneration
H1 2017(1)Others
+26.0%
H1 2017 vs H1 2016
H1 2017 RESULTS
BU
SIN
ES
S A
PP
EN
DIC
ES
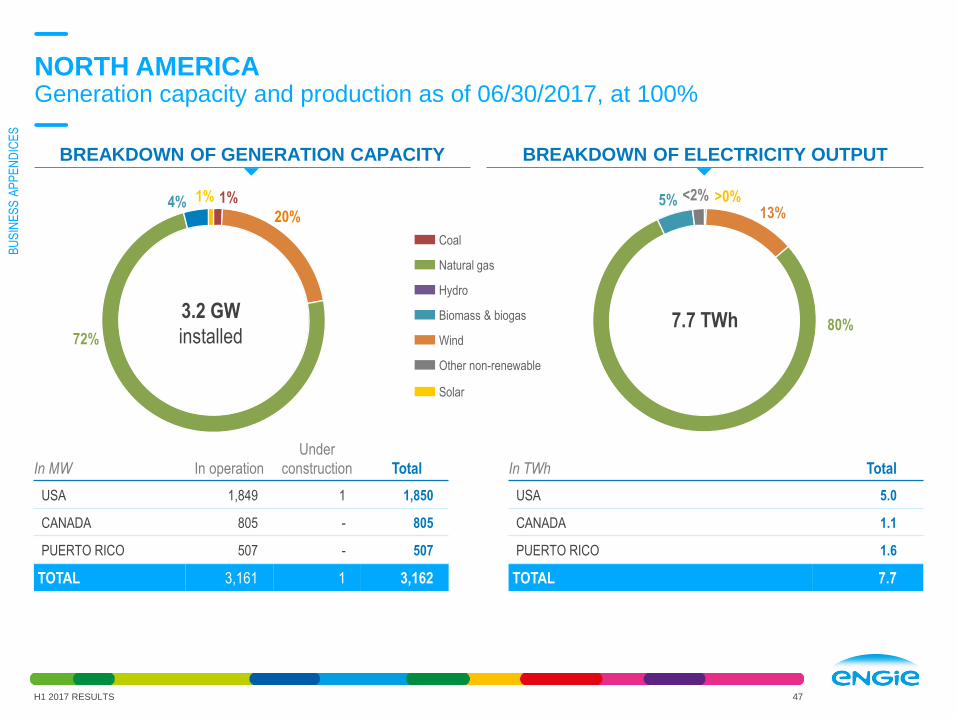
NORTH AMERICAGeneration capacity and production as of 06/30/2017, at 100%
H1 2017 RESULTS 47
In MW In operation
Under
construction Total
USA 1,849 1 1,850
CANADA 805 - 805
PUERTO RICO 507 - 507
TOTAL 3,161 1 3,162
In TWh Total
USA 5.0
CANADA 1.1
PUERTO RICO 1.6
TOTAL 7.7
7.7 TWh3.2 GW
installed
4% 1%
20%
72%
>0%13%
80%
1%
Natural gas
Hydro
Wind
Biomass & biogas
Coal
Other non-renewable
Solar
<2%5%
BREAKDOWN OF ELECTRICITY OUTPUTBREAKDOWN OF GENERATION CAPACITY
BU
SIN
ES
S A
PP
EN
DIC
ES

48
725803
455
+78+35 +13 +31 +37
156
201
107
LATIN AMERICAStrong EBITDA growth despite still difficult market conditions
Brazil:
- Positive impact from EUR/BRL
- Better results from overall positive price effect
Latin America:
- Peru: Nodo and Chilca+ COD and recognition of PPA
cancellation penalty, partially offset by lower demand
- Mexico and Argentina: gas distribution tariff increase
- Chile: indexation on PPAs and insurance collection,
partially compensated by decrease in demand
Lean 2018
+14.4%
In €m H1 2016 H1 2017 D 17/16 D org
Revenues 1,962 2,304 17.4% 7.6%
COI including share in Net Income of Associates 534 701 31.2% 17.8%
Gross CAPEX 484 573
Capital Employed(3) 8,793 8,618
H1 2016 H1 2017
Electricity sales(1) (TWh) 29.2 28.6
Gas sales(1) (TWh) 13.4 14.6
Electricity production(2) (TWh) 38.0 36.0
Mexico: transport capacity sold (MGJ) 73 73
Brazil - Average PLD price (BRL/MWh) 49 230
Brazil - GSF (%) Year to Date 89 96
EBITDA 2017 Outlook
Brazil: lower GSF expected in H2
Latin America: tariff increases in Mexico and Argentina
and lower demand in Chile and Peru
Other KFIs KPIs
EBITDA
In €m
(1) Sales figures are consolidated accordingto accounting standards
(2) At 100%
(3) End of Period : 12/31 for 2016 and 6/30 for 2017
H1 2017 vs H1 2016
Mexico & Others
Peru
Chile
Brazil
Forex& Scope
Chile Peru H1 2017Mexico & Others
BrazilH1 2016
919
H1 2017 RESULTS
BU
SIN
ES
S A
PP
EN
DIC
ES

LATIN AMERICAGeneration capacity and production as of 06/30/2017, at 100%
49
In MW In operation
Under
construction Total
BRAZIL 12,473 680 13,153
CHILE 2,030 338 2,368
PERU 2,532 45 2,577
MEXICO 316 52 368
TOTAL 17,351 1,115 18,286
In TWh Total
BRAZIL 28.5
CHILE 2.9
PERU 3.5
MEXICO 1.1
TOTAL 36.0
Natural gas
Hydro
Wind
Biomass & biogas
Coal
Other non-renewable
36.0 TWh
<1%>0%
17.4 GW
installed
1%9% 11%
66%
2%
12%
13%
75%
1%
11%
Solar
>0%
H1 2017 RESULTS
BREAKDOWN OF ELECTRICITY OUTPUTBREAKDOWN OF GENERATION CAPACITY
>0%
BU
SIN
ES
S A
PP
EN
DIC
ES

50
AFRICA/ASIAAustralia benefitting from higher energy prices
(1) Total includes Other €(7)m(2) Sales figures are consolidated according to accounting standards
(3) At 100%(4) Million Imperial Gallons per Day - installed capacity at 100%(5) End of Period: 12/31 for 2016 and 6/30 for 2017
Thailand: planned major outage at Gheco-1 offset by PTT
NGD gas distribution benefitting from higher margins
MESCAT: sale of Meenakshi (Sep. 2016), COD of AzZour
North (Nov. 2016), Fadhili fee income and Al Dur
settlement, offset by Oman tax increase
Australia: higher energy prices and volumes (thermal
generation & retail) ; closure of Hazelwood in March 2017
Lean 2018
EBITDA 2017 Outlook
Acquisition of Tabreed (UAE)
Favorable market conditions in Australia
De-mothballing & contracting of Pelican Point (Australia)
Expected COD of Mirfa (UAE)
584 551
242
(54) +21 +43
+95 (8) +3
195
255
+24.2%
MESCAT
Australia
Thailand
In €m H1 2016 H1 2017 D 17/16 D org
Revenues 1,896 1,969 3.9% 2.4%
COI including share in Net Income of Associates 484 563 16.4% 25.4%
Gross CAPEX 139 186
Capital Employed(4) 5,520 5,405
H1 2016 H1 2017
Electricity sales(1) (TWh) 25.6 22.1
Gas distributed (TWh) 6.2 7.3
Installed capacity(2) (GW) 40.6 38.7
Electricity production(2) (TWh) 107.7 101.2
Middle-East - Water desalination capacity (MIGD)(3) 1,053 1,160
Other KFIs KPIs
EBITDA
In €m
Scope MESCATFX Australia Thailand Others H1 2017(1)
H1 2017 vs H1 2016
H1 2016
685
H1 2017 RESULTS
BU
SIN
ES
S A
PP
EN
DIC
ES
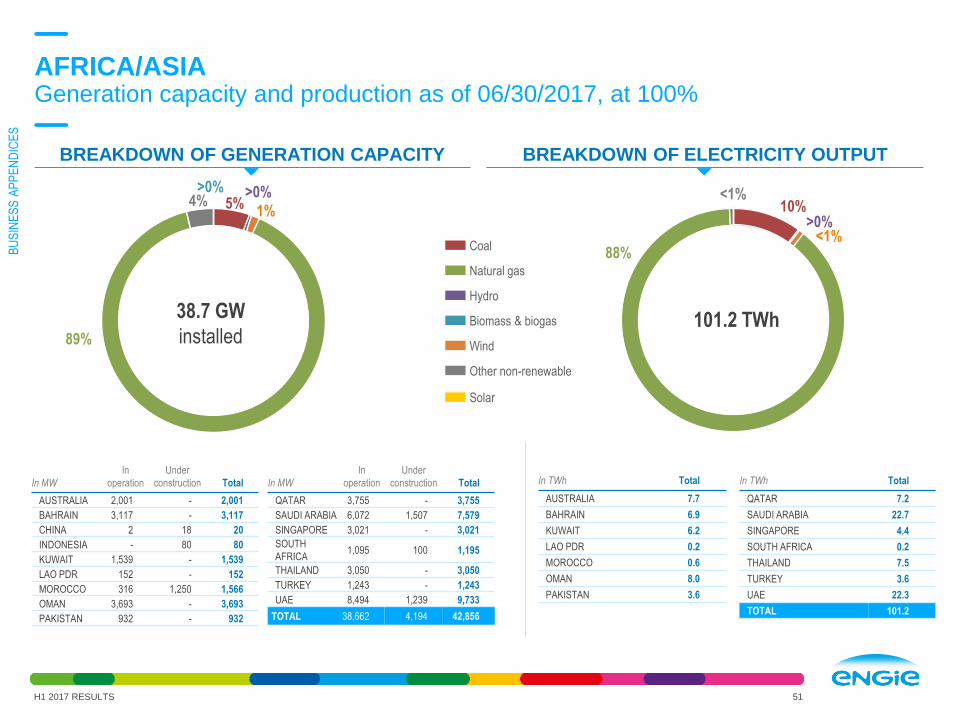
AFRICA/ASIAGeneration capacity and production as of 06/30/2017, at 100%
51
38.7 GW
installed
>0%4% 5%
>0%
1%
89%
In MW
In
operation
Under
construction Total
AUSTRALIA 2,001 - 2,001
BAHRAIN 3,117 - 3,117
CHINA 2 18 20
INDONESIA - 80 80
KUWAIT 1,539 - 1,539
LAO PDR 152 - 152
MOROCCO 316 1,250 1,566
OMAN 3,693 - 3,693
PAKISTAN 932 - 932
In MW
In
operation
Under
construction Total
QATAR 3,755 - 3,755
SAUDI ARABIA 6,072 1,507 7,579
SINGAPORE 3,021 - 3,021
SOUTH
AFRICA1,095 100 1,195
THAILAND 3,050 - 3,050
TURKEY 1,243 - 1,243
UAE 8,494 1,239 9,733
TOTAL 38,662 4,194 42,856
101.2 TWh
10%>0%
<1%88%
<1%
Solar
Natural gas
Hydro
Wind
Biomass & biogas
Coal
Other non-renewable
In TWh Total
AUSTRALIA 7.7
BAHRAIN 6.9
KUWAIT 6.2
LAO PDR 0.2
MOROCCO 0.6
OMAN 8.0
PAKISTAN 3.6
H1 2017 RESULTS
BREAKDOWN OF ELECTRICITY OUTPUTBREAKDOWN OF GENERATION CAPACITY
In TWh Total
QATAR 7.2
SAUDI ARABIA 22.7
SINGAPORE 4.4
SOUTH AFRICA 0.2
THAILAND 7.5
TURKEY 3.6
UAE 22.3
TOTAL 101.2
BU
SIN
ES
S A
PP
EN
DIC
ES
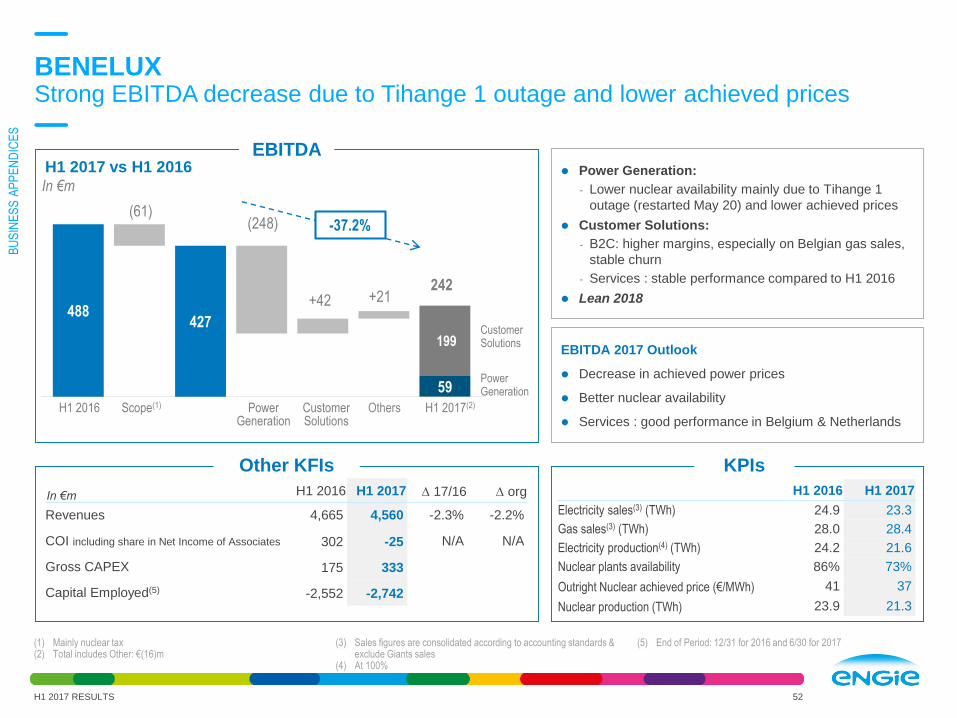
52
488427
59
(61) (248)
+42 +21
199
BENELUXStrong EBITDA decrease due to Tihange 1 outage and lower achieved prices
(1) Mainly nuclear tax(2) Total includes Other: €(16)m
(3) Sales figures are consolidated according to accounting standards & exclude Giants sales
(4) At 100%
(5) End of Period: 12/31 for 2016 and 6/30 for 2017
Power Generation:
- Lower nuclear availability mainly due to Tihange 1
outage (restarted May 20) and lower achieved prices
Customer Solutions:
- B2C: higher margins, especially on Belgian gas sales,
stable churn
- Services : stable performance compared to H1 2016
Lean 2018
EBITDA 2017 Outlook
Decrease in achieved power prices
Better nuclear availability
Services : good performance in Belgium & Netherlands
In €m H1 2016 H1 2017 D 17/16 D org
Revenues 4,665 4,560 -2.3% -2.2%
COI including share in Net Income of Associates 302 -25 N/A N/A
Gross CAPEX 175 333
Capital Employed(5) -2,552 -2,742
H1 2016 H1 2017
Electricity sales(3) (TWh) 24.9 23.3
Gas sales(3) (TWh) 28.0 28.4
Electricity production(4) (TWh) 24.2 21.6
Nuclear plants availability 86% 73%
Outright Nuclear achieved price (€/MWh) 41 37
Nuclear production (TWh) 23.9 21.3
CustomerSolutions
PowerGeneration
242
-37.2%
Other KFIs KPIs
EBITDA
In €m
H1 2017 vs H1 2016
Scope(1) PowerGeneration
CustomerSolutions
OthersH1 2016 H1 2017(2)
H1 2017 RESULTS
BU
SIN
ES
S A
PP
EN
DIC
ES
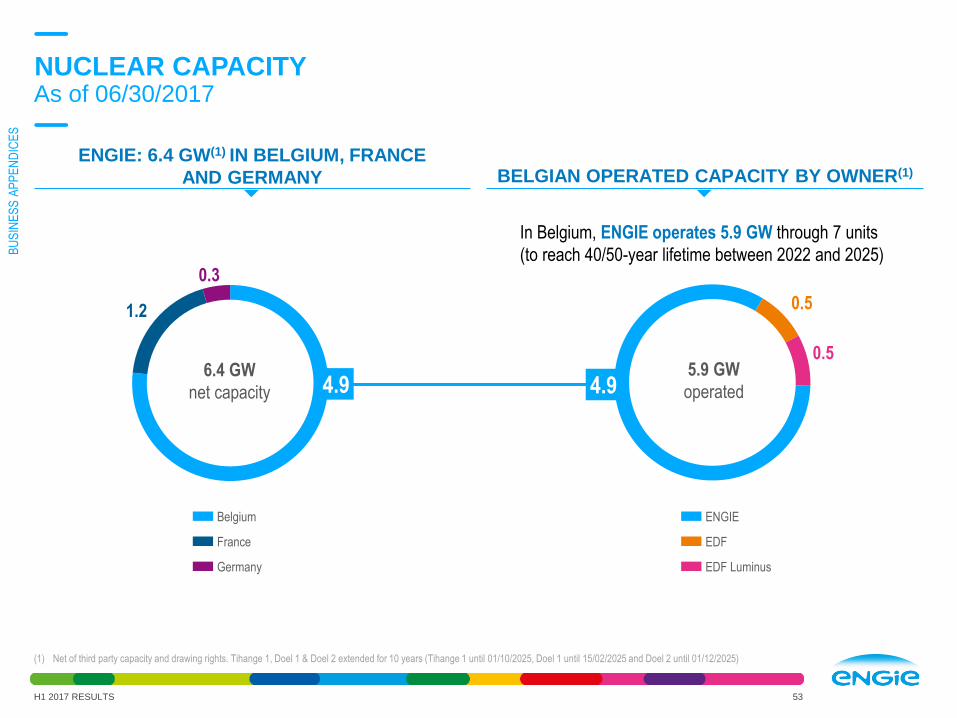
NUCLEAR CAPACITYAs of 06/30/2017
53
(1) Net of third party capacity and drawing rights. Tihange 1, Doel 1 & Doel 2 extended for 10 years (Tihange 1 until 01/10/2025, Doel 1 until 15/02/2025 and Doel 2 until 01/12/2025)
4.9
0.5
0.5
4.9
1.2
0.3
6.4 GW
net capacity
In Belgium, ENGIE operates 5.9 GW through 7 units
(to reach 40/50-year lifetime between 2022 and 2025)
5.9 GW
operated
Germany
France
Belgium
EDF Luminus
EDF
ENGIE
BELGIAN OPERATED CAPACITY BY OWNER(1)
ENGIE: 6.4 GW(1) IN BELGIUM, FRANCE
AND GERMANY
H1 2017 RESULTS
BU
SIN
ES
S A
PP
EN
DIC
ES

Contracts(1) (Million) Sales(2) (TWh)
Gas Electricity Gas Electricity
TOTAL BENELUX 1.6 2.9 28.4 16.1
of which Belgium 1.4 2.6 21.2 11.2
of which Netherlands 0.3 0.3 7.2 4.9
BENELUXBreakdown of electricity and gas sales to final customers
54
Electricity
Electricity
12.1 13.5 14.8
7.7 8.2
2014 2015 2016 2016 H1 2017 H1
13.5 13.7 13.2
6.4 5.8
2014 2015 2016 2016 H1 2017 H2
20.2 21.7 22.2
13.3 13.0
2014 2015 2016 2016 H1 2017 H1
12.0 11.7 11.2
5.8 5.5
2014 2015 2016 2016 H1 2017 H1
Gas at real climate
Gas at real climate
(1) Number of contracts is consolidated at 100%, excluding entities at equity method(2) Sales figures are consolidated according to accounting rules, Group contribution
BELGIUM - B2B SALES (TWh)
BELGIUM - B2C SALES (TWh)
H1 2017 RESULTS
BU
SIN
ES
S A
PP
EN
DIC
ES

55
FRANCEUnfavorable temperature effect on gas sales, increased retail power salesand lower hydro production
(1) Sales figures are consolidated according to accounting standards & exclude Giants sales(2) 2016 figures restated to exclude B2B supply (E&C), activity transferred to segment Other(3) 2016 figures published : 29.9 TWh (without Cogeneration)
(4) At 100%(5) End of Period: 12/31 for 2016 and 6/30 for 2017
Scope: B2B retail (E&C) transferred to segment Other
France Renewables:
- Lower hydro and wind volumes
Customer Solutions:
- B2C: decrease in gas margins & volumes; increase in
power sales
- B2B Services & networks : improved performance
Lean 2018
EBITDA 2017 Outlook
Commissioning of wind and solar assets
Customer solutions B2B: higher contribution of
installation & services in H2; integration of Icomera
acquired in June 2017
938 955
+17 (72)(55)
162
666-13.7% Customer
solutions
France Renewables
828
H1 2016 H1 2017
Electricity sales(1)(2)(3) (TWh) 18.9 17.4Gas sales(1)(2) (TWh) 60.3 56.2Renewables - Installed capacity(4) (GW) 5.6 5.8Renewables - Electricity production(4) (TWh) 12.3 8.6CNR achieved price (€/MWh) 38.2 38.6CNR hydro production (TWh) 9.3 6.1Services - Net commercial developement (€m/y) 49 41Installations - Backlog (€m) 3,865 4,004
Other KFIs KPIs
EBITDA
In €m
Scope& Forex
H1 2017France Renewables
CustomerSolutions
In €m H1 2016 H1 2017 D 17/16 D org
Revenues 10,769 8,619 -20.0% -1.2%
COI including share in Net Income of Associates 641 535 -16.6% -21.0%
Gross CAPEX 455 393
Capital Employed(5) 5,304 6,294
H1 2017 vs H1 2016
H1 2016
H1 2017 RESULTS
BU
SIN
ES
S A
PP
EN
DIC
ES
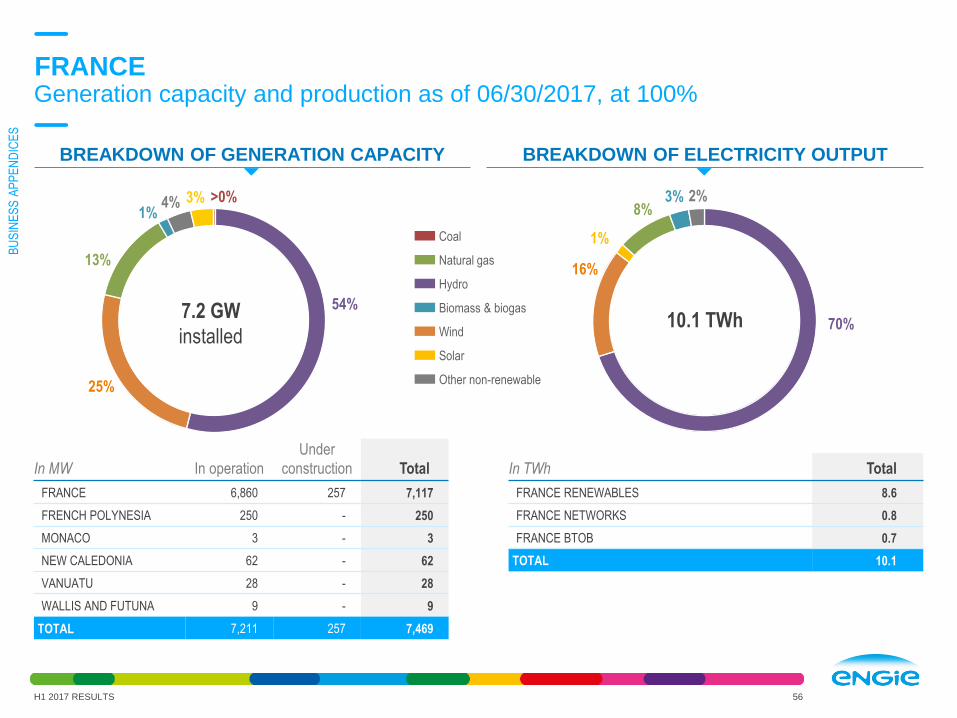
FRANCEGeneration capacity and production as of 06/30/2017, at 100%
56
10.1 TWh
In MW In operation
Under
construction Total
FRANCE 6,860 257 7,117
FRENCH POLYNESIA 250 - 250
MONACO 3 - 3
NEW CALEDONIA 62 - 62
VANUATU 28 - 28
WALLIS AND FUTUNA 9 - 9
TOTAL 7,211 257 7,469
In TWh Total
FRANCE RENEWABLES 8.6
FRANCE NETWORKS 0.8
FRANCE BTOB 0.7
TOTAL 10.1
3% 2%
7.2 GW
installed
1%4%
Natural gas
Hydro
Wind
Biomass & biogas
Other non-renewable
Solar
>0%
54%
25%
13%
70%
1%
8%3%
16%
Coal
H1 2017 RESULTS
BREAKDOWN OF ELECTRICITY OUTPUTBREAKDOWN OF GENERATION CAPACITY
BU
SIN
ES
S A
PP
EN
DIC
ES

FRANCEBreakdown of electricity and gas sales to final customers
57
(1) Of which public distribution tariffs: 114.1 TWh in FY 2013 ; 78.8 TWh in FY 2014 ; 68.4 TWh in FY 2015 ; 67.3 TWh in FY 2016, 40.2 TWh in H1 2016; 35.2 TWh in H1 2017
127.996.2 99.6 102.6
60.3 56.2
2013 2014 2015 2016 H1 2016 H1 2017
Gas at real climate(1) Electricity
7.1 7.910.4 12.5
6.6 7.9
2013 2014 2015 2016 H1 2016 H1 2017
● Development of B2C power sales, market share increased to
10.3%
● H1 2017: decrease due to loss in the residential gas customer base
market share (72,3%)
Contracts (Million) Sales (TWh)
Gas Electricity Gas Electricity
France 7.9 3.5 56.2 7.9
B2C SALES (TWh)
H1 2017 RESULTS
BU
SIN
ES
S A
PP
EN
DIC
ES

FRANCE B2CResidential & small business customers portfolio in France
58
Portfolio of 245,000 contracts as at June 2017,
limited decrease of 19,000 contracts since December 2016
Household• Increased by 605,000 contracts since June 2016
versus 335,000 between June 2016 and June 2015
• The growth in electricity exceeds the decrease in gas
Small businessIncreased by 46,000 contracts since June 2016 versus
43,000 between June 2016 and June 2015
Thousands of contracts
HOUSEHOLD & SMALL BUSINESSMillions of contracts
HOUSEHOLD
Decreased by 340,000 contracts since June 2016
versus 370,000 between June 2016 and June 2015
SMALL BUSINESS (B2C)
ENGIE Competitors
10.2
10.0
9.9
9.8
9.7
9.6
9.4
9.3
9.2
9.1
9.0
8.8
8.7
8.5
8.4
8.2
8.0
7.8
7.7
0.1
0.3
0.5
0.6
0.7
0.7
0.9
1.0
1.1
1.2
1.3
1.4
1.6
1.8
1.9
2.1
2.3
2.5
2.6
jun-
08
dec-
08
jun-
09
dec-
09
jun-
10
dec-
10
jun-
11
dec-
11
jun-
12
dec-
12
jun-
13
dec-
13
jun-
14
dec-
14
jun-
15
dec-
15
jun-
16
dec-
16
jun-
17
Mill
ions
of c
ontr
acts
163
368
500
724
880
939
1,02
2
1,16
7
1,32
2
1,47
6
1,60
5
1,73
8
1,94
5
2,13
8
2,37
7
2,54
7
2,71
3
3,00
1
3,31
8
7781
8484
85 85 8685
8686
8688
90101
118141
161183
207
jun-
08
dec-
08
jun-
09
dec-
09
jun-
10
dec-
10
jun-
11
dec-
11
jun-
12
dec-
12
jun-
13
dec-
13
jun-
14
dec-
14
jun-
15
dec-
15
jun-
16
dec-
16
jun-
17
Household Small business
ELECTRICITY GAS
H1 2017 RESULTS
BU
SIN
ES
S A
PP
EN
DIC
ES

59
H1 2016 H1 2017
Electricity sales(1)(2) (TWh) 14.9 14.5
Gas sales(1) (TWh) 37.1 39.6
Renewables - Installed capacity(3) (GW) 1.2 1.2
Renewables - Electricity production(3) (TWh) 1.2 1.4
Romania - Gas distributed (GWh) 23.7 27.0
EUROPE (excluding FRANCE & BENELUX)Strong organic growth led by Lean achievements, higher performance of First Hydro and higher distributed volumes in Romania
(1) Sales figures are consolidated according to accounting standards & exclude Giants sales(2) H1 2016 figures published: 14.7 TWh (without Cogeneration)
(3) At 100%(4) End of Period: 12/31 for 2016 and 6/30 for 2017
Romania: higher distributed & volumes sold (cold winter)
Germany: execution of large installation projects on track
Italy: positive climate effect; B2C: bad debt reversals
UK: improved performance of First Hydro
Lean 2018
EBITDA 2017 Outlook
First contribution from Keepmoat
Regulation issues in Romania on gas sales margins
347 327
+13+6
+12 +22(20)
(-3)
96
69
72
102
38
+16.2%
Germany
Italy
UK
Others
378
Romania
Other KFIs KPIs
EBITDA
In €m
Scope& Forex
H1 2017Germ. UKRoman. Italy Others
In €mH1 2016 H1 2017 D 17/16 D org
Revenues 4,210 4,237 0.6% 2.8%
COI including share in Net Income of Associates 257 278 8.1% 21%
Gross CAPEX 51 445
Capital Employed(4) 4,720 5,073
H1 2017 vs H1 2016
H1 2016
H1 2017 RESULTS
BU
SIN
ES
S A
PP
EN
DIC
ES

3.6 TWh
6%
Natural gas
Hydro
Wind
Biomass & biogas
Other non-renewable
Solar
39%
19%
36%
Coal
EUROPE (excluding FRANCE & BENELUX)Generation capacity and production as of 06/30/2017, at 100%
H1 2017 RESULTS 60
In MW In operation
Under
construction Total
CZECH REPUBLIC 5 - 5
GERMANY 786 - 786
GREECE 148 - 148
ITALY 280 - 280
POLAND 138 - 138
PORTUGAL 493 - 493
ROMANIA 98 - 98
SPAIN 102 - 102
UNITED KINGDOM 2,241 - 2,241
TOTAL 4,291 - 4,291
4.3 GW
installed
1% 2%
27%
15%
54%
>0% >0%
>0%
>0%
(1) Includes 1.1GW capacity in Italy managed by BU GEM (2) Includes 8.4 TWh output in Italy managed by BU GEM
BREAKDOWN OF ELECTRICITY OUTPUT(2)BREAKDOWN OF GENERATION CAPACITY(1)
In TWh Total
CZECH REPUBLIC <0
GERMANY 0.6
GREECE 0.2
ITALY <0
POLAND 0.5
PORTUGAL 0.2
ROMANIA 0.6
SPAIN 0.2
UNITED KINGDOM 1.3
TOTAL 3.6
BU
SIN
ES
S A
PP
EN
DIC
ES

EUROPE (excluding FRANCE & BENELUX)Breakdown of electricity and gas sales to final customers
61
(1) Number of contracts is consolidated at 100%, excluding entities at equity method
(2) Sales figures are consolidated according to accounting rules, Group contribution
34.5 30.1 34.5 30.2
12.7 15.2
2013 2014 2015 2016 H1 2016 H1 2017
43.1 40.0 39.9 38.0
24.4 24.3
2013 2014 2015 2016 H1 2016 H1 2017
B2B
6.4 5.815.1
24.2
12.4 12.1
2013 2014 2015 2016 H1 2016 H1 2017
B2B(3)Gas at real climate Electricity
Gas at real climate Electricity
1.51.0 1.2
1.9
0.7 0.8
2013 2014 2015 2016 H1 2016 H1 2017
Contracts(1) (Million) Sales(2) (TWh)
Gas Electricity Gas Electricity
TOTAL EUROPE exc. FR/BENELUX 2.4 0.3 39.5 12.9
of which Romania 1.7 0.0 21.7 0.6
of which Italy 0.7 0.1 4.5 0.3
of which Germany 0.1 0.2 4.4 6.7
of which Others (UK mainly) 0.0 0.0 8.9 5.2
B2B SALES (TWh)
B2C SALES (TWh)
H1 2017 RESULTS
BU
SIN
ES
S A
PP
EN
DIC
ES
62
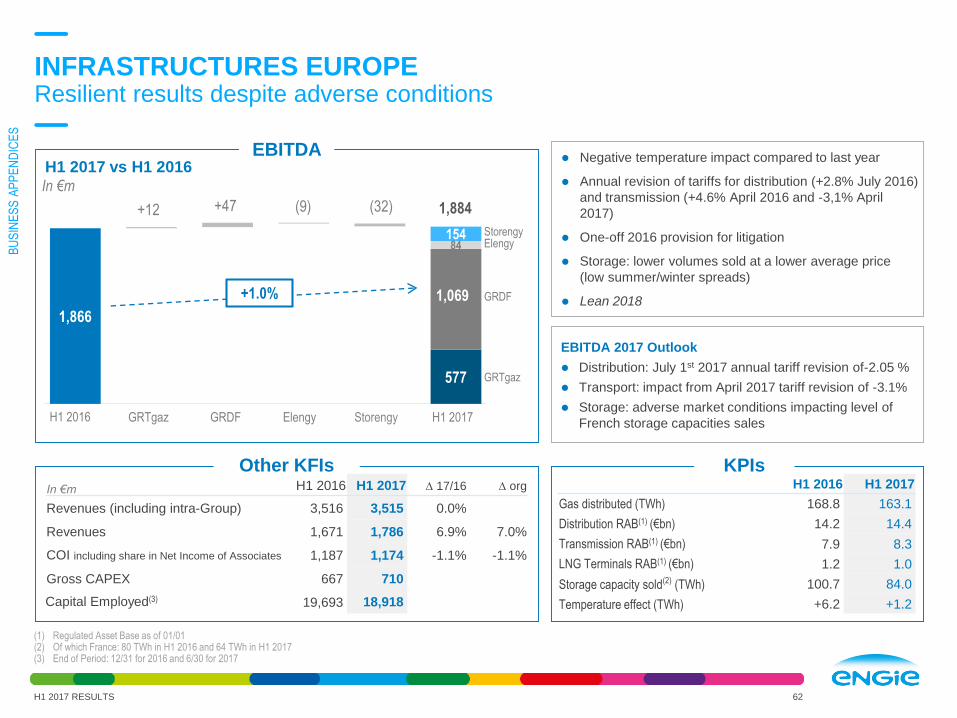
INFRASTRUCTURES EUROPEResilient results despite adverse conditions
164
GRTgaz
ElengyStorengy
GRDF
Negative temperature impact compared to last year
Annual revision of tariffs for distribution (+2.8% July 2016)
and transmission (+4.6% April 2016 and -3,1% April
2017)
One-off 2016 provision for litigation
Storage: lower volumes sold at a lower average price
(low summer/winter spreads)
Lean 2018
EBITDA 2017 Outlook
Distribution: July 1st 2017 annual tariff revision of-2.05 %
Transport: impact from April 2017 tariff revision of -3.1%
Storage: adverse market conditions impacting level of
French storage capacities sales
H1 2016 H1 2017
Gas distributed (TWh) 168.8 163.1
Distribution RAB(1) (€bn) 14.2 14.4
Transmission RAB(1) (€bn) 7.9 8.3
LNG Terminals RAB(1) (€bn) 1.2 1.0
Storage capacity sold(2) (TWh) 100.7 84.0
Temperature effect (TWh) +6.2 +1.2
Other KFIs KPIs
EBITDA
In €m
GRTgaz H1 2017ElengyGRDF Storengy
+1.0%
In €m H1 2016 H1 2017 D 17/16 D org
Revenues (including intra-Group) 3,516 3,515 0.0%
Revenues 1,671 1,786 6.9% 7.0%
COI including share in Net Income of Associates 1,187 1,174 -1.1% -1.1%
Gross CAPEX 667 710
Capital Employed(3) 19,693 18,918
(1) Regulated Asset Base as of 01/01(2) Of which France: 80 TWh in H1 2016 and 64 TWh in H1 2017(3) End of Period: 12/31 for 2016 and 6/30 for 2017
H1 2017 vs H1 2016
H1 2016
1,866
577
84154
+12 +47 (9) (32) 1,884
1,069
H1 2017 RESULTS
BU
SIN
ES
S A
PP
EN
DIC
ES
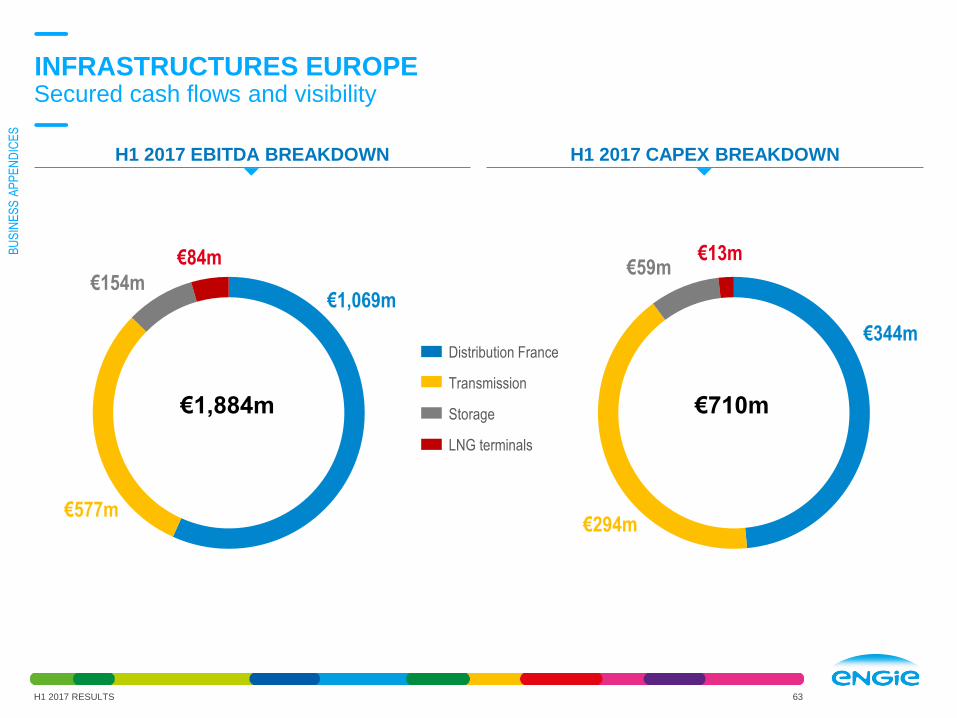
INFRASTRUCTURES EUROPESecured cash flows and visibility
63
Distribution France
Transmission
Storage
LNG terminals
€1,884m €710m
€13m
€344m
€294m
€59m€84m
€1,069m
€577m
€154m
H1 2017 CAPEX BREAKDOWN H1 2017 EBITDA BREAKDOWN
H1 2017 RESULTS
BU
SIN
ES
S A
PP
EN
DIC
ES
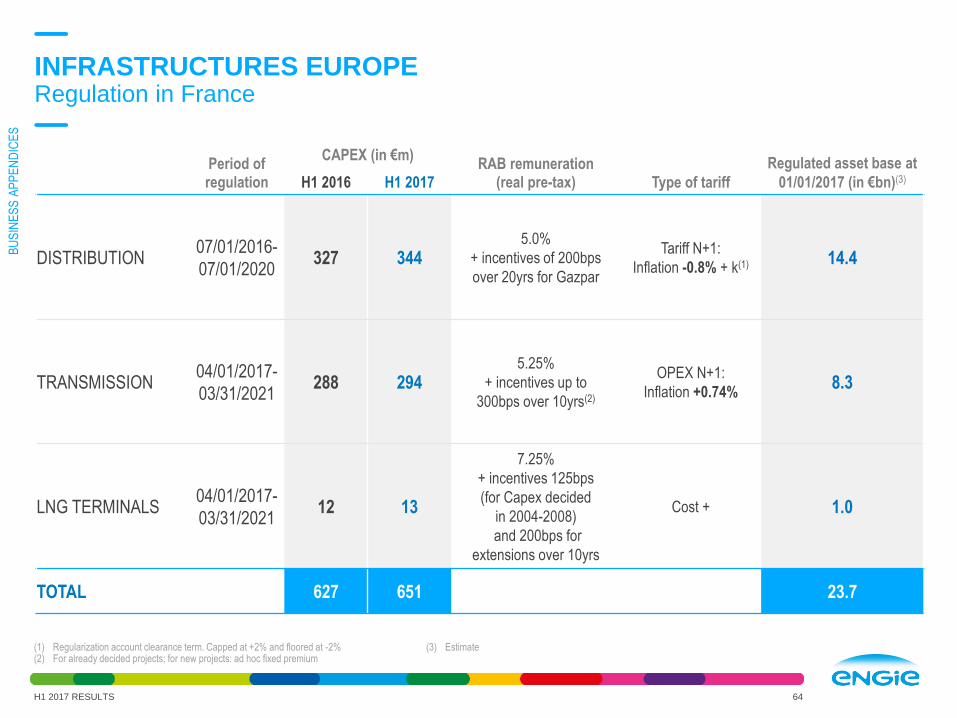
INFRASTRUCTURES EUROPERegulation in France
64
(1) Regularization account clearance term. Capped at +2% and floored at -2%(2) For already decided projects; for new projects: ad hoc fixed premium
(3) Estimate
Period of regulation
CAPEX (in €m)RAB remuneration
(real pre-tax) Type of tariff
Regulated asset base at
01/01/2017 (in €bn)(3)H1 2016 H1 2017
DISTRIBUTION07/01/2016-
07/01/2020327 344
5.0%
+ incentives of 200bps
over 20yrs for Gazpar
Tariff N+1:
Inflation -0.8% + k(1) 14.4
TRANSMISSION04/01/2017-
03/31/2021288 294
5.25%
+ incentives up to
300bps over 10yrs(2)
OPEX N+1:
Inflation +0.74%8.3
LNG TERMINALS04/01/2017-
03/31/202112 13
7.25%
+ incentives 125bps
(for Capex decided
in 2004-2008)
and 200bps for
extensions over 10yrs
Cost + 1.0
TOTAL 627 651 23.7
H1 2017 RESULTS
BU
SIN
ES
S A
PP
EN
DIC
ES

H1 2017 RESULTS 65
GEM & LNGPrice effects still negative, partially compensated by contract renegotiations
LNG lower achieved sales prices
LNG supply contract price revision enforced
Impact from 2017 winter gas congestion situation
in South France
Less volumes sold in electricity to Giants
Lean 2018
EBITDA 2017 Outlook
Active portfolio optimization (gas & LNG) and focus
on cost control
Ongoing price revision discussions
(39) (45)
(82)(6)
(31)+2
(8)
In €m H1 2016 H1 2017 D 17/16 D org
Revenues 4,046 4,834 19.5% 18.6%
COI including share in Net Income of Associates -85 -110 -29.1% -21.5%
Gross CAPEX 18 312
Capital Employed(2) 1,330 779
H1 2016 H1 2017
External LNG sales (TWh) 41.5 44.8
GEM - Gas sales (TWh)(1) 23.2 24.2
GEM - Electricity sales (TWh)(1) 12.4 10.6
Other KFIs KPIs
EBITDA
In €m
Scope& Forex
OthersPrice Volume H1 2017
(1) Giants Global Energy(2) End of Period: 12/31 for 2016 and 6/30 for 2017
H1 2017 vs H1 2016
H1 2016
BU
SIN
ES
S A
PP
EN
DIC
ES

GEM & LNGBreakdown of electricity and gas sales to final customers
66
Gas at real climate Electricity
Sales(1) (TWh)
Gas Electricity
TOTAL GEM(2) 24.2 10.6
of which Belgium 6.2 4.7
of which Netherlands
of which France(3)
2.2
9.6
1.7
2.6
of which Europe exc. France & Benelux 6.2 1.6
16.4 12 9.7 15.38 6.2
18.418.4
7.75.3
2.7 2.2
53.6
41.3
24 17.8
7 9.6
15.9
14.8
12.611.6
5.5 6.2
104.3
86.5
54.0 50.0
23.2 24.2
2013 2014 2015 2016 H1 2016 H1 2017
Other Europe
France(3)
Belgium
● Increasing competition in all European markets for Giant customers, both on Power and Gas markets except for gas in Belgium
16.2 15.8 16.3
8.54.3 4.7
1.6 1.73.8
4.0
2 1.7
8.9 9.2
9.6
8.0
4 2.6
1.13.7
3.9
4.2
2.11.6
27.8
30.433.6
24.7
12.410.6
2013 2014 2015 2016 H1 2016 H1 2017
Netherlands
GIANTS SALES (TWh)
(1) Sales figures are consolidated according to accounting rules, Group contribution(2) Giants Global Energy
(3) Sales Power France in GEM since 01/01/2016; Previous years are restated
H1 2017 RESULTS
BU
SIN
ES
S A
PP
EN
DIC
ES
67
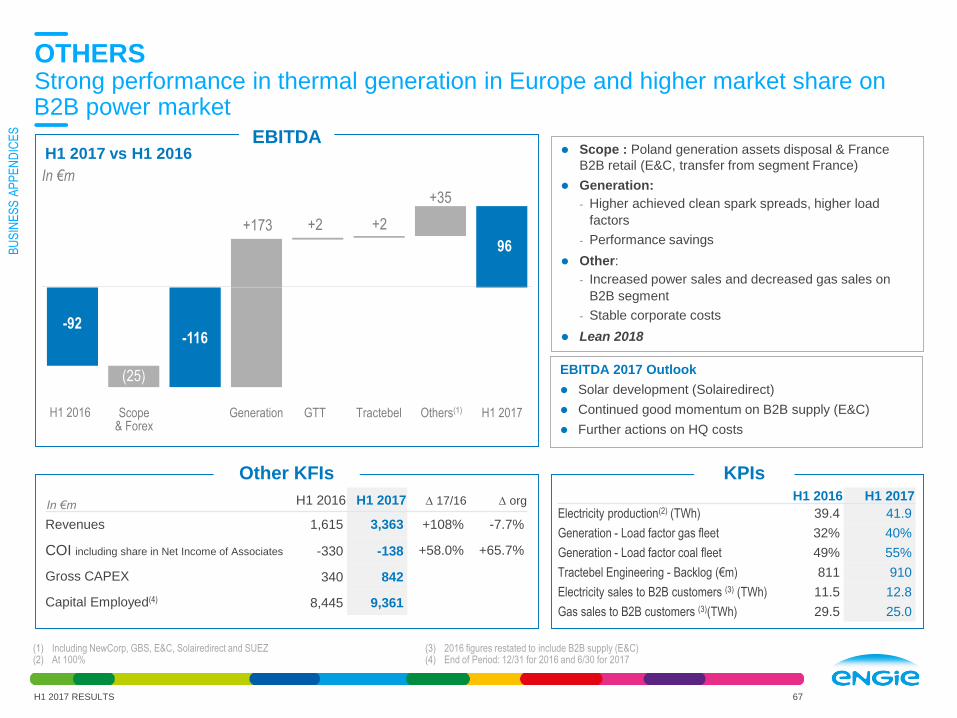
OTHERSStrong performance in thermal generation in Europe and higher market share on B2B power market
(1) Including NewCorp, GBS, E&C, Solairedirect and SUEZ(2) At 100%
(3) 2016 figures restated to include B2B supply (E&C)(4) End of Period: 12/31 for 2016 and 6/30 for 2017
Scope : Poland generation assets disposal & France
B2B retail (E&C, transfer from segment France)
Generation:
- Higher achieved clean spark spreads, higher load
factors
- Performance savings
Other:
- Increased power sales and decreased gas sales on
B2B segment
- Stable corporate costs
Lean 2018
EBITDA 2017 Outlook
Solar development (Solairedirect)
Continued good momentum on B2B supply (E&C)
Further actions on HQ costs
-92-116
96
(25)
+173 +2 +2
+35
In €m H1 2016 H1 2017 D 17/16 D org
Revenues 1,615 3,363 +108% -7.7%
COI including share in Net Income of Associates -330 -138 +58.0% +65.7%
Gross CAPEX 340 842
Capital Employed(4) 8,445 9,361
H1 2016 H1 2017
Electricity production(2) (TWh) 39.4 41.9
Generation - Load factor gas fleet 32% 40%
Generation - Load factor coal fleet 49% 55%
Tractebel Engineering - Backlog (€m) 811 910
Electricity sales to B2B customers (3) (TWh) 11.5 12.8
Gas sales to B2B customers (3)(TWh) 29.5 25.0
Other KFIs KPIs
EBITDA
In €m
Scope& Forex
Others(1)GTT Tractebel H1 2017Generation
H1 2017 vs H1 2016
H1 2016
H1 2017 RESULTS
BU
SIN
ES
S A
PP
EN
DIC
ES

OTHERSBreakdown of electricity and gas sales to B2B customers
68
(1) Of which public distribution tariffs: 61.6 TWh in FY 2013 ; 33.5 TWh in FY 2014 ; 1.9 TWh in FY 2015 ; 0.3 TWh in 2016
93.5
66.150.5 51.5
29.5 25.0
2013 2014 2015 2016 H1 2016 H1 2017
7.4 10.1 11.5
23.6
11.5 12.8
2013 2014 2015 2016 H1 2016 H1 2017
B2B
● Increasing competition on B2B gas sales/market share of 22% (B2B)
Gas at real climate(1) Electricity
Contracts (Thousand) Sales (TWh)
Gas Electricity Gas Electricity
France 32.7 23.3 25.0 12.8
B2B SALES (TWh)
H1 2017 RESULTS
BU
SIN
ES
S A
PP
EN
DIC
ES

22.5 GW
installed
7%13%
70%
6%
1%
3%
OTHERSGeneration capacity and production as of 06/30/2017, at 100%
69
In MW
In
operation
Under
construction Total
BELGIUM 4,416 - 4,416
BRAZIL - 101 101
CHILE 55 - 55
FRANCE 2,588 103 2,691
GERMANY 1,660 - 1,660
GREECE 422 - 422
INDIA 172 196 368
ITALY 3,547 - 3,547
MEXICO - 28 28
41.9 TWh
20%
Natural gas
Hydro
Biomass & biogas
Other non-renewable
Solar
2%
68%
Coal
1%4%
6%
In MW
In
operation
Under
construction Total
PANAMA - 21 21
NETHERLANDS 3,338 - 3,338
PORTUGAL 2,406 - 2,406
SOUTH AFRICA 21 - 21
SPAIN 1,990 - 1,990
UNITED KINGDOM 1,841 - 1,841
USA 64 - 64
TOTAL 22,521 450 22,971
H1 2017 RESULTS
BREAKDOWN OF ELECTRICITY OUTPUTBREAKDOWN OF GENERATION CAPACITY
In TWh Total
BELGIUM 8.2
GERMANY 3.1
SPAIN 0.2
FRANCE 4.5
UK 3.9
GREECE 0.6
ITALY 3.6
NETHERLANDS 6.6
In TWh Total
POLAND 1.8
PORTUGAL 5.5
INDIA 0.1
FRANCE 0.2
CHILE 0.0
SOUTH AFRICA 0.0
TOTAL 41.9
BU
SIN
ES
S A
PP
EN
DIC
ES

FINANCIAL APPENDICES
H1 2017 RESULTS

IMPACT OF WEATHER
IN FRANCE

CLIMATE ADJUSTMENT IN FRANCEImpact on gas sales and distribution
72H1 2017 RESULTS
Sales – B2C/B2B: ~€10m EBITDA / TWh
Distribution - Infrastructures : ~€7m EBITDA / TWh
Sales - B2C/B2B Distribution - Infrastructures
SENSITIVITY
COOLER
WARMER
AVERAGECLIMATE
Q1 Q2
+2.1+1.0
+9.9
+5.4
-0.9-0.4
-3.7-2.1
2016
Sales (B2C/B2B): +0.6 TWh – Distribution (infras): +1.2 TWh
H1 2017 & H1 2016
2017
Sales (B2C/B2B): +3.3 TWh – Distribution (infras): +6.2 TWh
FIN
AN
CIA
L A
PP
EN
DIC
ES

IMPACT OF WEATHER IN FRANCE
H1 2017 RESULTS 73
(1) Impact on Net Income Group share and Net Recurring Income Group share, with a normative income tax
Estimates, in €m
EBITDA Net income(1)
H1 2016 H1 2017 ∆ 17/16 H1 2016 H1 2017 ∆ 17/16
France B2C/B2B
Gas sales+33 +6 -27 +22 +4 -18
Infrastructures Europe
GRDF+43 +9 -35 +28 +6 -22
Total weather adjustment +76 +15 -62 +50 +10 -41
FIN
AN
CIA
L A
PP
EN
DIC
ES

CHANGE IN NUMBER
OF SHARES, SCOPE
& FOREX
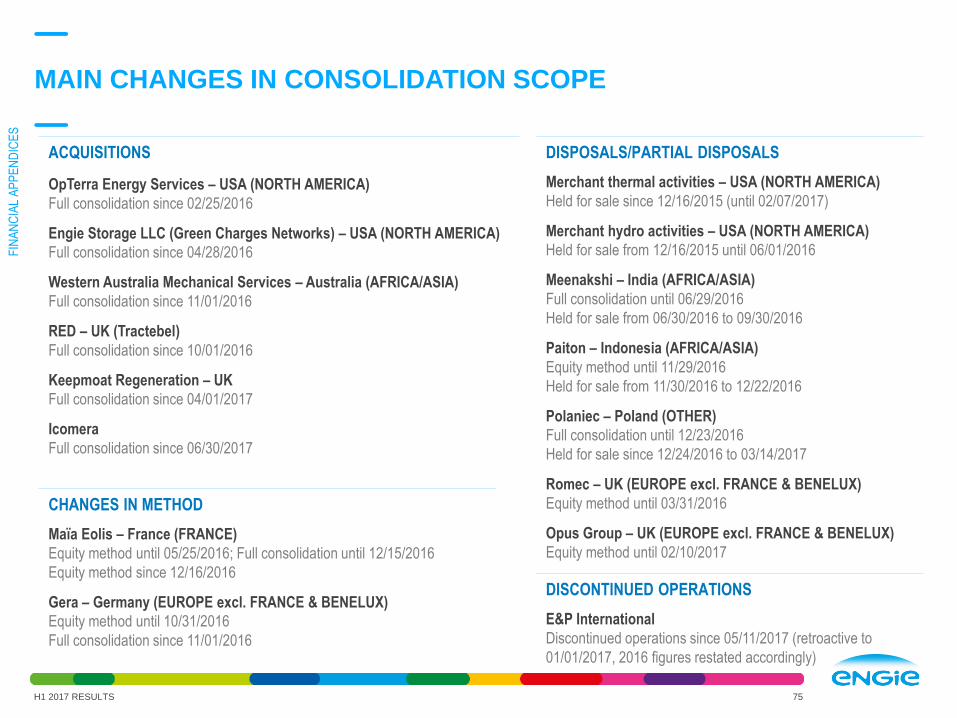
MAIN CHANGES IN CONSOLIDATION SCOPE
H1 2017 RESULTS 75
ACQUISITIONS
OpTerra Energy Services – USA (NORTH AMERICA)
Full consolidation since 02/25/2016
Engie Storage LLC (Green Charges Networks) – USA (NORTH AMERICA)
Full consolidation since 04/28/2016
Western Australia Mechanical Services – Australia (AFRICA/ASIA)
Full consolidation since 11/01/2016
RED – UK (Tractebel)
Full consolidation since 10/01/2016
Keepmoat Regeneration – UK
Full consolidation since 04/01/2017
Icomera
Full consolidation since 06/30/2017
DISPOSALS/PARTIAL DISPOSALS
Merchant thermal activities – USA (NORTH AMERICA)
Held for sale since 12/16/2015 (until 02/07/2017)
Merchant hydro activities – USA (NORTH AMERICA)
Held for sale from 12/16/2015 until 06/01/2016
Meenakshi – India (AFRICA/ASIA)
Full consolidation until 06/29/2016
Held for sale from 06/30/2016 to 09/30/2016
Paiton – Indonesia (AFRICA/ASIA)
Equity method until 11/29/2016
Held for sale from 11/30/2016 to 12/22/2016
Polaniec – Poland (OTHER)
Full consolidation until 12/23/2016
Held for sale since 12/24/2016 to 03/14/2017
Romec – UK (EUROPE excl. FRANCE & BENELUX)
Equity method until 03/31/2016
Opus Group – UK (EUROPE excl. FRANCE & BENELUX)
Equity method until 02/10/2017
CHANGES IN METHOD
Maïa Eolis – France (FRANCE)
Equity method until 05/25/2016; Full consolidation until 12/15/2016
Equity method since 12/16/2016
Gera – Germany (EUROPE excl. FRANCE & BENELUX)
Equity method until 10/31/2016
Full consolidation since 11/01/2016
DISCONTINUED OPERATIONS
E&P International
Discontinued operations since 05/11/2017 (retroactive to
01/01/2017, 2016 figures restated accordingly)
FIN
AN
CIA
L A
PP
EN
DIC
ES
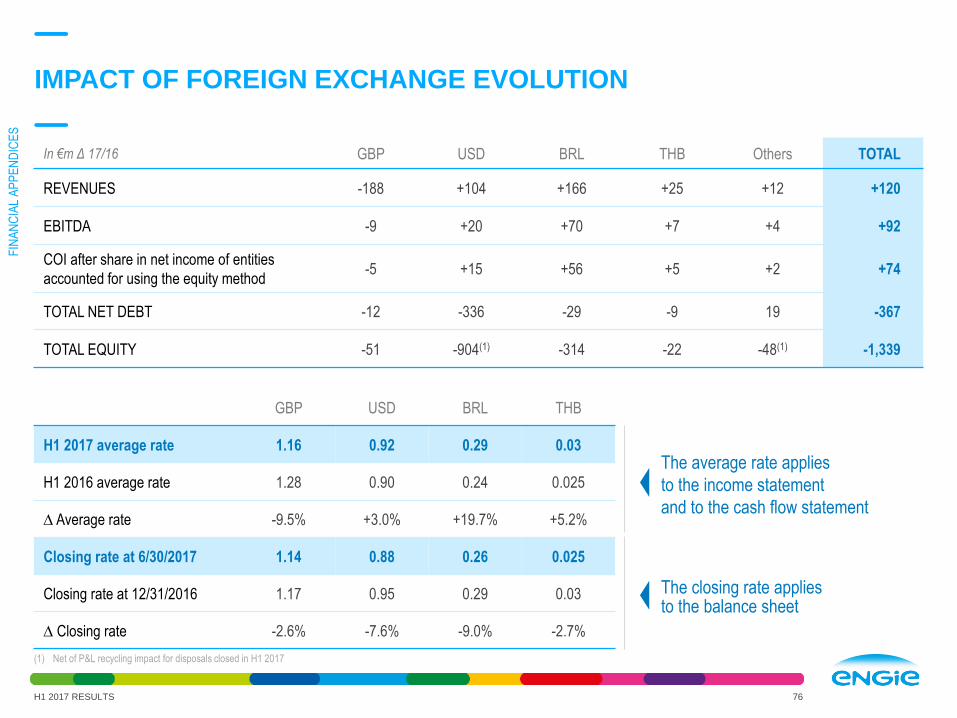
IMPACT OF FOREIGN EXCHANGE EVOLUTION
H1 2017 RESULTS 76
The average rate applies
to the income statement
and to the cash flow statement
The closing rate applies to the balance sheet
In €m Δ 17/16 GBP USD BRL THB Others TOTAL
REVENUES -188 +104 +166 +25 +12 +120
EBITDA -9 +20 +70 +7 +4 +92
COI after share in net income of entities
accounted for using the equity method-5 +15 +56 +5 +2 +74
TOTAL NET DEBT -12 -336 -29 -9 19 -367
TOTAL EQUITY -51 -904(1) -314 -22 -48(1) -1,339
GBP USD BRL THB
H1 2017 average rate 1.16 0.92 0.29 0.03
H1 2016 average rate 1.28 0.90 0.24 0.025
D Average rate -9.5% +3.0% +19.7% +5.2%
Closing rate at 6/30/2017 1.14 0.88 0.26 0.025
Closing rate at 12/31/2016 1.17 0.95 0.29 0.03
D Closing rate -2.6% -7.6% -9.0% -2.7%
(1) Net of P&L recycling impact for disposals closed in H1 2017
FIN
AN
CIA
L A
PP
EN
DIC
ES

H1 2017 EBITDA/COI BREAKDOWN BY CURRENCY
H1 2017 RESULTS 77
(1) After share in net income of entities accounted for using the equity method
€3.0bn€5.0bn
THB/EUR0.03
AUD/EUR0.70
GBP/EUR1.16
BRL/EUR0.29
USD/EUR0.92
EUR3.10
FX38%
USD0.69
BRL0.46
0.120.20
0.15
Other0.31
USD0.52
BRL0.37
0.09
0.150.11
Other0.25
FX49%
EUR51%
EUR1.54
EUR62%
EBITDA H1 2017Amount in EUR after translation (average rate)
FX VS. EURAverage H1 2017
COI(1) H1 2017Amount in EUR after translation (average rate)
FIN
AN
CIA
L A
PP
EN
DIC
ES
BALANCE SHEET, P/L &
CASH FLOW STATEMENT

SUMMARY STATEMENTS OF FINANCIAL POSITION
H1 2017 RESULTS 79
H1 2017 Net Debt €22.7bn = Financial debt of €35.9bn - Cash & equivalents of €10.9bn - Financial assets valued at fair value through profit/loss of €1.7bn - Assets related to financing of €0.1bn(incl. in non-current assets) - Derivative instruments hedging items included in the debt of €0.5bn
In €bn
ASSETS 12/31/2016 6/30/2017 LIABILITIES 12/31/2016 6/30/2017
NON CURRENT ASSETS 98.9 91.9
Equity, Group share 39.6 38.0
Non-controlling interests 5.9 5.8
CURRENT ASSETS 59.6 54.3 TOTAL EQUITY 45.4 43.8
of which financial assets valued
at fair value through profit/loss1.4 1.7 Provisions 22.2 20.8
of which cash & equivalents 9.8 10.9 Financial debt 36.9 35.9
Other liabilities 53.9 45.7
TOTAL ASSETS 158.5 146.2 TOTAL LIABILITIES 158.5 146.2
FIN
AN
CIA
L A
PP
EN
DIC
ES
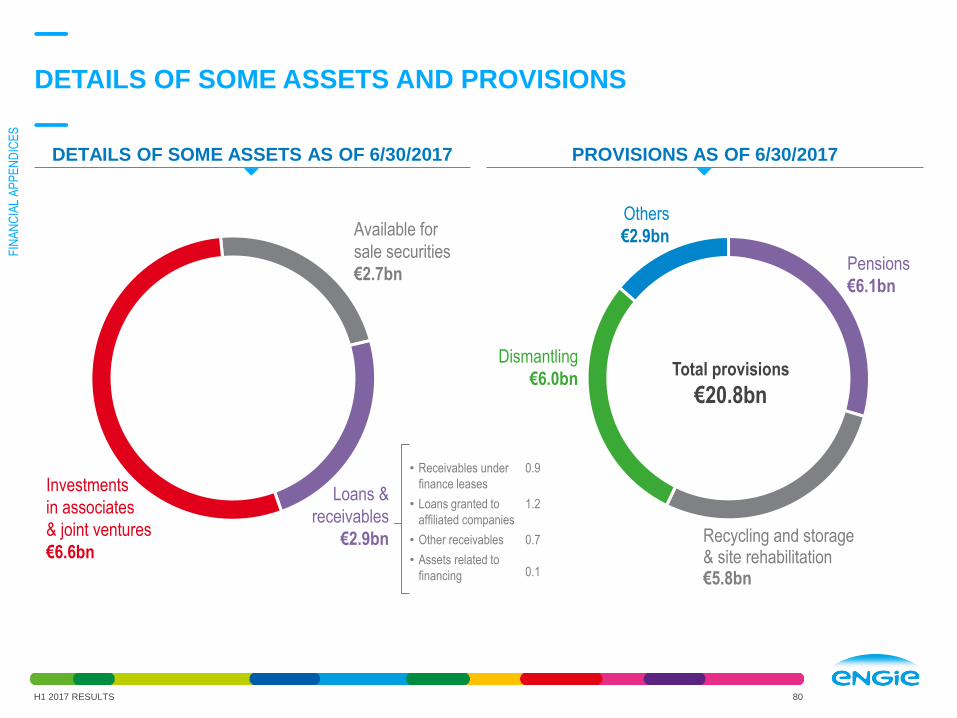
DETAILS OF SOME ASSETS AND PROVISIONS
H1 2017 RESULTS 80
Loans &
receivables
€2.9bn
Available for
sale securities
€2.7bn
Investments
in associates
& joint ventures
€6.6bn
Others
€2.9bn
Recycling and storage & site rehabilitation€5.8bn
Dismantling
€6.0bn
Pensions
€6.1bn
Total provisions
€20.8bn
• Receivables under
finance leases
• Loans granted to
affiliated companies
• Other receivables
• Assets related to
financing
0.9
1.2
0.7
0.1
PROVISIONS AS OF 6/30/2017DETAILS OF SOME ASSETS AS OF 6/30/2017
FIN
AN
CIA
L A
PP
EN
DIC
ES

In €m H1 2016(1) H1 2017
REVENUES 32,574 33,098
Purchases -18,224 -18,898
Personnel costs -5,149 -5,068
Amortization depreciation and provisions -1,897 -1,771
Other operating incomes and expenses -4,383 -4,496
Share in net income of entities accounted for using the equity method 253 169
CURRENT OPERATING INCOME after share in net income
of entities accounted for using the equity method3,174 3,036
MtM, impairment, restructuring, disposals and others 60 -337
INCOME FROM OPERATING ACTIVITIES 3,234 2,698
Financial resultof which recurring cost of net debt
of which non recurring items included in financial income/loss
of which others
-675-384
-88
-203
-626-339
-157
-130
Income taxof which current income tax
of which deferred income tax
-898-719
-180
-366-517
151
Non-controlling interests relating to continued operations -379 -418
Net income/(loss) relating to discontinued operations, Group share -44 -7
NET INCOME GROUP SHARE 1,237 1,281
EBITDA 5,033 5,028
SUMMARY INCOME STATEMENT
H1 2017 RESULTS 81
(1) H1 2016 restated for IFRS 5 (E&P accounted as discontinued operations)
FIN
AN
CIA
L A
PP
EN
DIC
ES

SUMMARY RECURRING INCOME STATEMENT
H1 2017 RESULTS 82
In €m H1 2016(1) H1 2017
EBITDA(1) 5,033 5,028
of which recurring contribution of share in net income of entities accounted for using the
equity method223 190
Depreciation, Amortization and others -1,859 -1,992
CURRENT OPERATING INCOME
after share in net income of entities accounted for using the equity method3,174 3,036
Financial result -587 -470
of which recurring cost of net debt -384 -339
of which others -203 -130
Income tax -779 -734
of which nuclear contribution -58 -
of which others -721 -734
Adjustment for non-recurring share in net income of entities accounted for using
the equity method-31 21
Non-controlling interests relating to continued operations -357 -415
Net recurring income/(loss) relating to discontinued activities, Group share 56 103
NET RECURRING INCOME GROUP SHARE 1,478 1,540
(1) H1 2016 restated for IFRS 5 (E&P accounted as discontinued operations)
FIN
AN
CIA
L A
PP
EN
DIC
ES

CASH FLOW STATEMENT
H1 2017 RESULTS 83
In €m H1 2016(1) H1 2017
Gross cash flow before financial loss and income taxIncome tax paid (excl. income tax paid on disposals)Change in operating working capitalCash flow from (used in) operating activities relating to continued operationsCash flow from (used in) operating activities relating to discontinued operations
4,928-385366
4,909-116
4,425-555-135
3,736259
CASH FLOW FROM (USED IN) OPERATING ACTIVITIES 4,793 3,995
Net tangible and intangible investmentsFinancial investmentsDisposals and other investment flowsCash flow from (used in) investment activities relating to continued operationsCash flow from (used in) investment activities relating to discontinued operations
-2,190-467
1,390-1,267
-424
-2,286-1,3053,981
390-271
CASH FLOW FROM (USED IN) INVESTMENT ACTIVITIES -1,692 119
Dividends paidShare buy backBalance of reimbursement of debt/new debtNet interests paid on financial activitiesCapital increase/hybrid issuesOther cash flowsCash flow from (used in) financial activities relating to continued operationsCash flow from (used in) financial activities relating to discontinued operations
-1,5671
-1,488-395
1-475
-3,92368
-1,6225
-216-369
48-744
-2,8985
CASH FLOW FROM (USED IN) FINANCIAL ACTIVITIES -3,855 -2,892
Impact of currency and other relating to continued operationsImpact of currency and other relating to discontinued operations
951
-13437
CASH AND CASH EQUIVALENTS AT THE BEGINNING OF THE PERIOD 9,183 9,825
TOTAL CASH FLOWS FOR THE PERIODReclassification of cash and cash equivalents relating to discontinued operations
-657-
1,124-21
CASH AND CASH EQUIVALENTS AT THE END OF THE PERIOD 8,526 10,928
(1) H1 2016 restated for IFRS 5 (E&P accounted as discontinued operations)
FIN
AN
CIA
L A
PP
EN
DIC
ES

PROFIT & LOSS DETAILS

BREAKDOWN OF REVENUES
H1 2017 RESULTS 85
In €m H1 2016(1) H1 2017 ∆ 17/16 ∆ Organic
NORTH AMERICA 1,740 1,427 -18.0% -1.0%
LATIN AMERICA 1,962 2,304 +17.4% +7.6%
AFRICA/ASIA 1,896 1,969 +3.9% +2.4%
BENELUX 4,665 4,560 -2.3% -2.2%
FRANCE 10,769 8,619 -20.0% -1.2%
EUROPE excl. France & Benelux 4,210 4,237 +0.6% +2.8%
INFRASTRUCTURES EUROPE 1,671 1,786 +6.9% +7.0%
GEM & LNG 4,046 4,834 +19.5% +18.6%
E&P - - - -
OTHER 1,615 3,363 +108.2% -7.7%
TOTAL 32,574 33,098 +1.6% +2.6%
(1) H1 2016 restated for IFRS 5 (E&P accounted as discontinued operations)
FIN
AN
CIA
L A
PP
EN
DIC
ES

BREAKDOWN OF REVENUES BY REPORTABLE SEGMENT
H1 2017 RESULTS 86
(1) Total revenues, including inter-companies, amount to €1.7bn (2) Total revenues, including inter-companies, amount to €3.9bn
5.9% - €2.0bnAfrica/Asia
14.6% - €4.8bnGEM & LNG(2)
26.0% - €8.6bnFrance
5.4% - €1.8bnInfrastructures Europe(1)
7.0% - €2.3bnLatin America
10.2% - €3.4bnOther
13.8% - €4.6bnBenelux
12.8% - €4.2bnEurope excl. France & Benelux
4.3% - €1.4bnNorth America
€33.1bn
FIN
AN
CIA
L A
PP
EN
DIC
ES

REVENUES BY GEOGRAPHIC REGION BY DESTINATION
H1 2017 RESULTS 87
In €m H1 2016(1) H1 2017 ∆ 17/16
France 12,708 13,053 +2.7%
Belgium 5,008 5,108 +2.0%
SUB-TOTAL FRANCE-BELGIUM 17,716 18,161 +2.5%
Other EU countries 7,501 7,234 -3.5%
of which Italy 1,639 1,311 -20.0%
of which UK 2,079 2,052 -1.3%
of which Germany 1,086 1,310 +20.6%
of which Netherlands 1,059 1,107 +4.5%
Other European countries 536 603 +12.5%
SUB-TOTAL EUROPE 25,753 25,999 +1.0%
North America 2,191 1,907 -13.0%
SUB-TOTAL EUROPE & NORTH AMERICA 27,944 27,906 -0.1%
Asia, Middle East and Oceania 2,653 2,872 +8.3%
South America 1,852 2,154 +16.3%
Africa 125 167 +33.6%
TOTAL 32,574 33,098 +1.6%
(1) H1 2016 restated for IFRS 5 (E&P accounted as discontinued operations)
FIN
AN
CIA
L A
PP
EN
DIC
ES

BREAKDOWN OF EBITDA
H1 2017 RESULTS 88
In €m H1 2016(1) H1 2017 ∆ 17/16 ∆ Organic
NORTH AMERICA 216 79 -63.6% +26.0%
LATIN AMERICA 725 919 +26.7% +14.4%
AFRICA/ASIA 584 685 +17.3% +24.2%
BENELUX 488 242 -50.4% -37.2%
FRANCE 938 828 -11.8% -13.7%
EUROPE excl. France & Benelux 347 378 +9.0% +16.2%
INFRASTRUCTURES EUROPE 1,866 1,884 +1.0% +1.0%
GEM & LNG -39 -82 -109.3% -84.4%
E&P - - - -
OTHER -92 +96 +204.3% +224.2%
TOTAL 5,033 5,028 -0.1% +4.0%
(1) H1 2016 restated for IFRS 5 (E&P accounted as discontinued operations)
FIN
AN
CIA
L A
PP
EN
DIC
ES

EBITDA VARIATION(1)
BY REPORTABLE SEGMENT
H1 2017 RESULTS 89
In €bn
Lean 2018 contribution in all segments(1) Organic variation
Australia generation
& retail
One-off in MESCAT
Africa & Asia +0.13
Retail margins
Noram +0.02
LNG: 2017 contract
renegotiation
LNG: price effects
GEM: 2016 contracts
renegotiation
GEM & LNG -0.04
Generation Europe
(spreads &
load factors)
E&C margins
NewCorp
(2016 one-offs)
Other +0.21
France -0.13
Temperatures
B2B/B2C
Renewables
volumes & prices
B2C: one-offs
Services B2B
& networks
Other Europe +0.05
Romania & Hungary
(temperatures),
Italy (retail)
UK (First Hydro)
Nuclear T1 outage
& prices
Commercialisation
(one-off)
Benelux -0.19
Commissioning
Mexico & Argentina
prices & tariffs
Brazil price effect
Latam +0.12
Infrastructure +0.02
Temperatures GRDF
Tariff increases
GRTgaz/GRDF
Storengy
FIN
AN
CIA
L A
PP
EN
DIC
ES
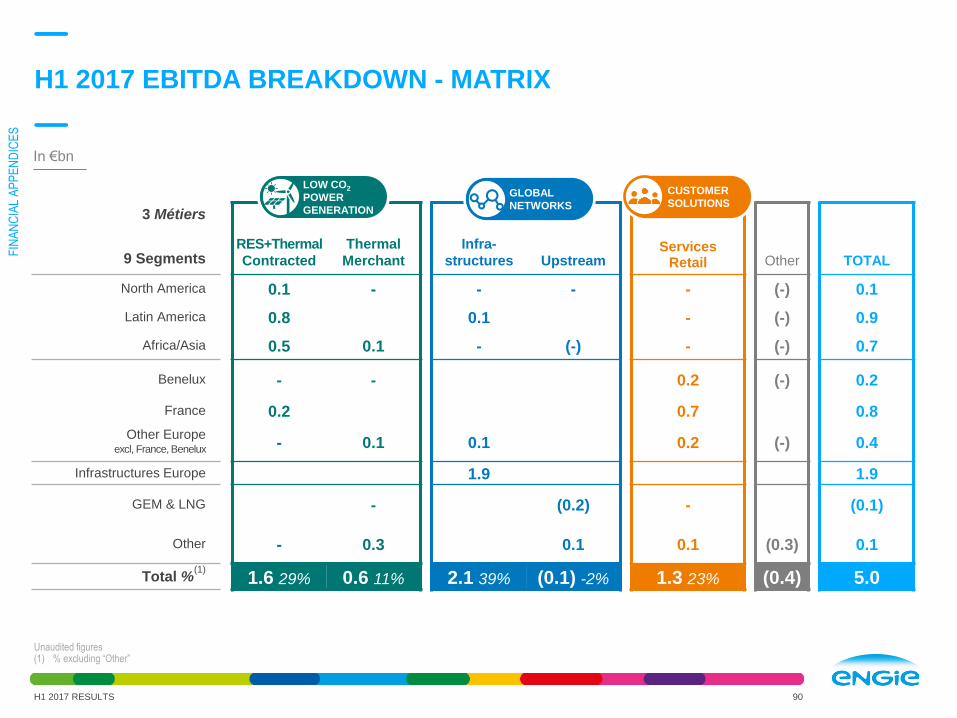
H1 2017 EBITDA BREAKDOWN - MATRIX
90
Unaudited figures(1) % excluding “Other”
In €bn
3 Métiers
9 SegmentsServices
Retail Other TOTAL
RES+Thermal
Contracted
Thermal
Merchant
Infra-
structures Upstream
North America 0.1 - - - - (-) 0.1
Latin America 0.8 - 0.1 - - (-) 0.9
Africa/Asia 0.5 0.1 - (-) - (-) 0.7
Benelux - - - - 0.2 (-) 0.2
France 0.2 - - - 0.7 - 0.8
Other Europeexcl, France, Benelux - 0.1 0.1 - 0.2 (-) 0.4
Infrastructures Europe - - 1.9 - - - 1.9
GEM & LNG - - - (0.2) - (0.1)
Other - 0.3 - 0.1 0.1 (0.3) 0.1
Total %(1)
1.6 29% 0.6 11% 2.1 39% (0.1) -2% 1.3 23% (0.4) 5.0
LOW CO2
POWER
GENERATION
CUSTOMER
SOLUTIONSGLOBAL
NETWORKS
H1 2017 RESULTS
FIN
AN
CIA
L A
PP
EN
DIC
ES

H1 2016 EBITDA BREAKDOWN - MATRIX
91
Unaudited figures(1) % excluding “Other”
In €bn
3 Métiers
9 SegmentsServices
Retail Other TOTAL
RES+Thermal
Contracted
Thermal
Merchant
Infra-
structures Upstream
North America 0.1 0.1 - - (-) 0.2
Latin America 0.7 0.1 - (-) 0.7
Africa/Asia 0.5 0.1 - (-) - (-) 0.6
Benelux - 0.4 0.2 (-) 0.5
France 0.2 0.7 0.9
Other Europeexcl, France, Benelux 0.1 0.1 0.1
0.2(-) 0.3
Infrastructures Europe 1.9 1.9
GEM & LNG - (0.1) - -
Other - 0.1 0.1 (0.3) (0.1)
Total %(1)
1.5 28% 0.7 14% 2.0 37% (-) 0% 1.2 22% (0.4) 5.0
LOW CO2
POWER
GENERATION
CUSTOMER
SOLUTIONSGLOBAL
NETWORKS
FIN
AN
CIA
L A
PP
EN
DIC
ES
H1 2017 RESULTS
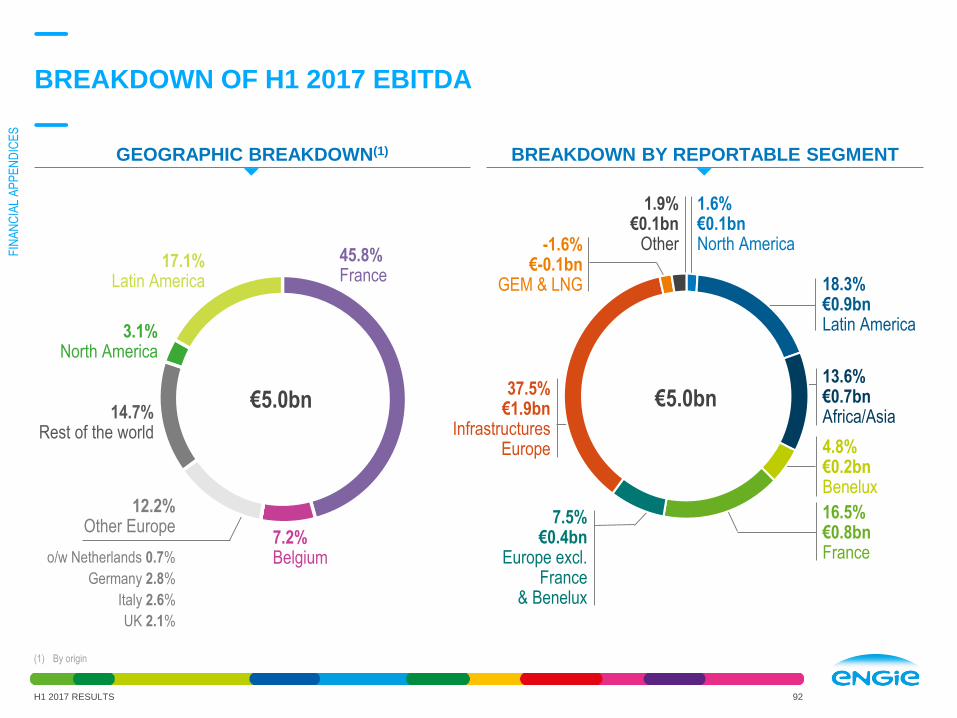
16.5% €0.8bnFrance
BREAKDOWN OF H1 2017 EBITDA
H1 2017 RESULTS 92
(1) By origin
45.8%France
7.2%Belgium
12.2%Other Europe
Italy 2.6%
o/w Netherlands 0.7%
Germany 2.8%
14.7%Rest of the world
3.1%North America
17.1%Latin America
13.6%€0.7bnAfrica/Asia
-1.6%€-0.1bn
GEM & LNG
37.5%€1.9bn
InfrastructuresEurope
18.3%€0.9bnLatin America
1.9%€0.1bn
Other
4.8%€0.2bnBenelux
7.5%€0.4bn
Europe excl.France
& Benelux
1.6%€0.1bnNorth America
UK 2.1%
BREAKDOWN BY REPORTABLE SEGMENTGEOGRAPHIC BREAKDOWN(1)
€5.0bn€5.0bn
FIN
AN
CIA
L A
PP
EN
DIC
ES

BREAKDOWN OF SHARE IN NET INCOMEOF ENTITIES ACCOUNTED FOR USING EQUITY METHOD
H1 2017 RESULTS 93
In €m H1 2016(1) H1 2017 ∆ 17/16
NORTH AMERICA 29 42 +45.1%
LATIN AMERICA 4 -24 NA
AFRICA/ASIA 124 101 -18.7%
BENELUX 1 2 NA
FRANCE -5 -3 NA
EUROPE excl. France & Benelux 65 36 -45.0%
INFRASTRUCTURES EUROPE 4 7 +59.3%
GEM & LNG 0 2 NA
E&P - - -
OTHER 31 7 -78.4%
TOTAL 253 169 -33.2%
(1) H1 2016 restated for IFRS 5 (E&P accounted as discontinued operations)
FIN
AN
CIA
L A
PP
EN
DIC
ES
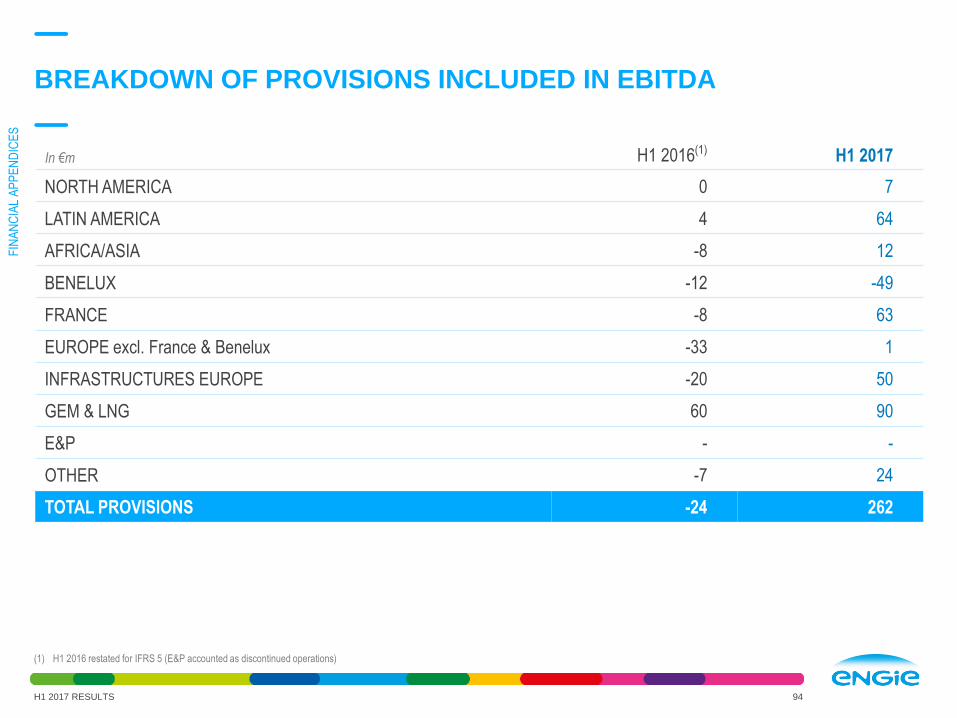
BREAKDOWN OF PROVISIONS INCLUDED IN EBITDA
H1 2017 RESULTS 94
In €m H1 2016(1) H1 2017
NORTH AMERICA 0 7
LATIN AMERICA 4 64
AFRICA/ASIA -8 12
BENELUX -12 -49
FRANCE -8 63
EUROPE excl. France & Benelux -33 1
INFRASTRUCTURES EUROPE -20 50
GEM & LNG 60 90
E&P - -
OTHER -7 24
TOTAL PROVISIONS -24 262
(1) H1 2016 restated for IFRS 5 (E&P accounted as discontinued operations)
FIN
AN
CIA
L A
PP
EN
DIC
ES

BREAKDOWN OF CURRENT OPERATING INCOMEAfter share in net income of entities accounted for using the equity method
H1 2017 RESULTS 95
In €m H1 2016(1) H1 2017 ∆ 17/16 ∆ Organic
NORTH AMERICA 184 59 -68.0% +92.4%
LATIN AMERICA 534 701 +31.2% +17.8%
AFRICA/ASIA 484 563 +16.4% +25.4%
BENELUX 302 -25 NA NA
FRANCE 641 535 -16.6% +21.0%
EUROPE excl. France & Benelux 257 278 +8.1% +21.3%
INFRASTRUCTURES EUROPE 1,187 1,174 -1.1% -1.1%
GEM & LNG -85 -110 -29.1% -21.5%
E&P - - - -
OTHER -330 -138 +58.0% +65.7%
TOTAL 3,174 3,036 -4.4% +2.5%
(1) H1 2016 restated for IFRS 5 (E&P accounted as discontinued operations)
FIN
AN
CIA
L A
PP
EN
DIC
ES
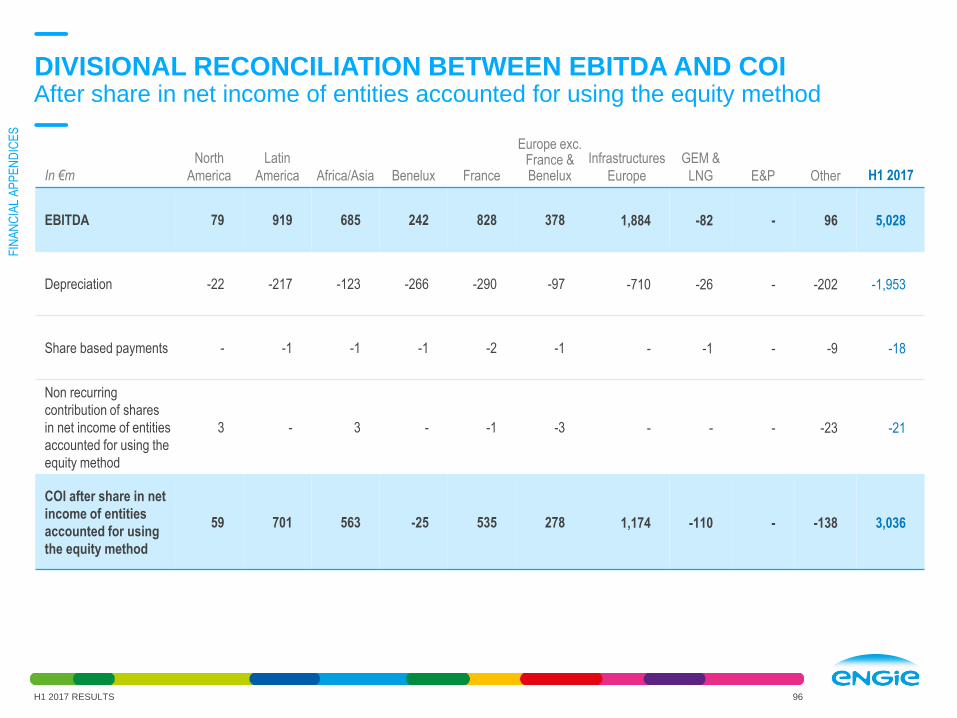
In €m
North
America
Latin
America Africa/Asia Benelux France
Europe exc. France & Benelux
Infrastructures
Europe
GEM &
LNG E&P Other H1 2017
EBITDA 79 919 685 242 828 378 1,884 -82 - 96 5,028
Depreciation -22 -217 -123 -266 -290 -97 -710 -26 - -202 -1,953
Share based payments - -1 -1 -1 -2 -1 - -1 - -9 -18
Non recurring
contribution of shares
in net income of entities
accounted for using the
equity method
3 - 3 - -1 -3 - - - -23 -21
COI after share in net
income of entities
accounted for using
the equity method
59 701 563 -25 535 278 1,174 -110 - -138 3,036
DIVISIONAL RECONCILIATION BETWEEN EBITDA AND COIAfter share in net income of entities accounted for using the equity method
H1 2017 RESULTS 96
FIN
AN
CIA
L A
PP
EN
DIC
ES
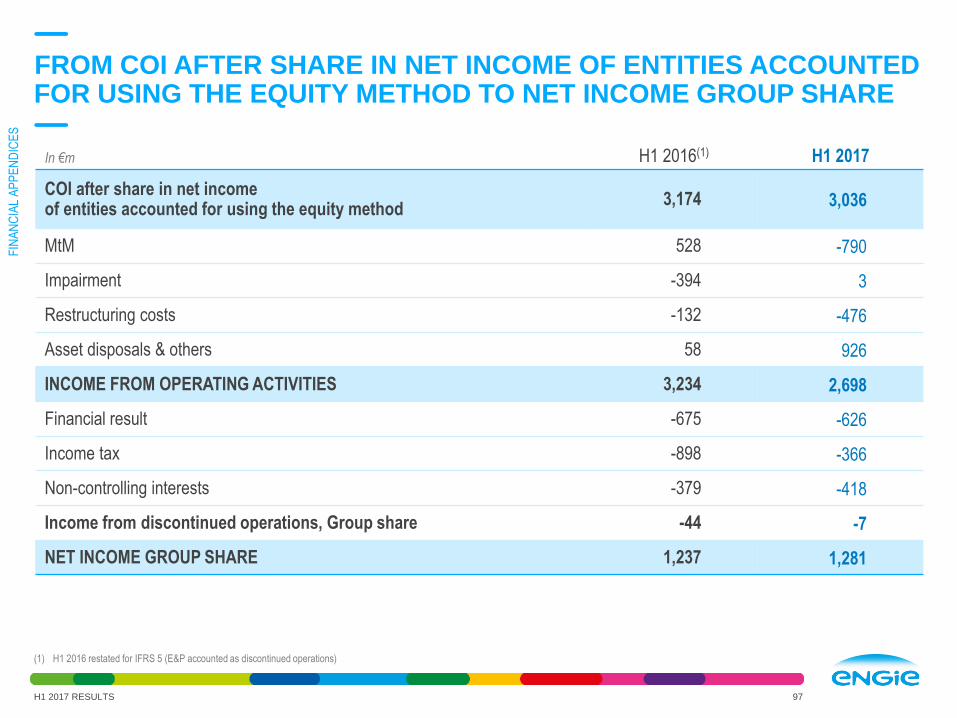
FROM COI AFTER SHARE IN NET INCOME OF ENTITIES ACCOUNTED FOR USING THE EQUITY METHOD TO NET INCOME GROUP SHARE
H1 2017 RESULTS 97
In €m H1 2016(1) H1 2017
COI after share in net incomeof entities accounted for using the equity method
3,174 3,036
MtM 528 -790
Impairment -394 3
Restructuring costs -132 -476
Asset disposals & others 58 926
INCOME FROM OPERATING ACTIVITIES 3,234 2,698
Financial result -675 -626
Income tax -898 -366
Non-controlling interests -379 -418
Income from discontinued operations, Group share -44 -7
NET INCOME GROUP SHARE 1,237 1,281
(1) H1 2016 restated for IFRS 5 (E&P accounted as discontinued operations)
FIN
AN
CIA
L A
PP
EN
DIC
ES

BREAKDOWN OF NON-CONTROLLING INTERESTS
H1 2017 RESULTS 98
In €m H1 2016(1) H1 2017
NORTH AMERICA 8 8
LATIN AMERICA 192 165
AFRICA/ASIA 66 76
BENELUX -16 1
FRANCE 41 15
EUROPE excl. France & Benelux 41 40
INFRASTRUCTURES EUROPE 53 52
GEM & LNG 1 -
E&P - -
OTHER -5 60
Non-controlling interests 379 418
(1) H1 2016 restated for IFRS 5 (E&P accounted as discontinued operations)
FIN
AN
CIA
L A
PP
EN
DIC
ES

In €m H1 2016(1) H1 2017
EBITDA 5,033 5,028
Restructuring costs cashed out -150 -211
Provisions 15 -336
Share in net income of entities accounted for using the equity method -223 -190
Dividends and others 252 135
Cash generated from operations before income tax
and working capital requirements4,928 4,425
RECONCILIATION BETWEEN EBITDA AND OPERATING CASH FLOW
H1 2017 RESULTS 99
(1) H1 2016 restated for IFRS 5 (E&P accounted as discontinued operations)
FIN
AN
CIA
L A
PP
EN
DIC
ES

NET RECURRING INCOME GROUP SHARE
H1 2017 RESULTS 100
In €m H1 2016(1) H1 2017
Net income/(loss) relating to continued operations, Group share 1,281 1,288
Net income/(loss) relating to discontinued operations, Group share -44 -7
NET INCOME GROUP SHARE 1,237 1,281
MtM commodities -528 790
Impairment 394 -3
Restructuring costs 132 476
Asset disposals & others -58 -926
Financial result (non-recurring items) 88 156
Share in net income of entities accounted for using the equity method
(non-recurring items)-31 21
Income tax on non-recurring items 119 -368
Non-controlling interests on above items 22 2
Non-recurring items relating to discontinued operations, Group share 101 110
NET RECURRING INCOME GROUP SHARE 1,478 1,540
(1) H1 2016 restated for IFRS 5 (E&P accounted as discontinued operations)
FIN
AN
CIA
L A
PP
EN
DIC
ES
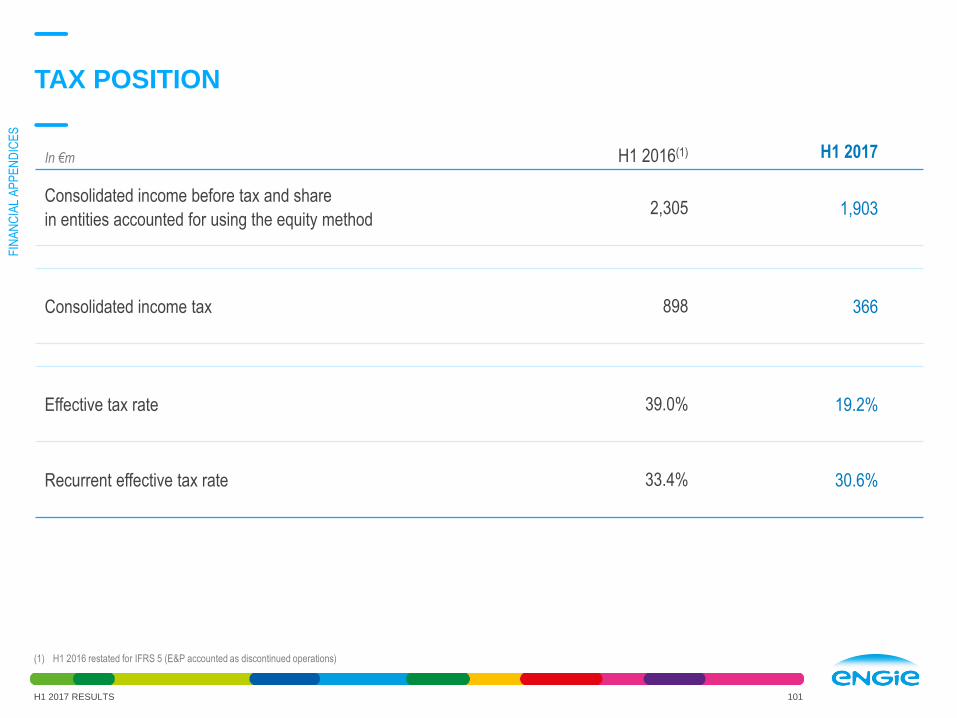
TAX POSITION
H1 2017 RESULTS 101
In €m H1 2016(1) H1 2017
Consolidated income before tax and share
in entities accounted for using the equity method2,305 1,903
Consolidated income tax 898 366
Effective tax rate 39.0% 19.2%
Recurrent effective tax rate 33.4% 30.6%
(1) H1 2016 restated for IFRS 5 (E&P accounted as discontinued operations)
FIN
AN
CIA
L A
PP
EN
DIC
ES
CASH FLOW DETAILS

FROM EBITDA TO FREE CASH FLOW
H1 2017 RESULTS 103
H1 2017FREE CASH
FLOW
RESTRUCTURING& OTHERS
Cash generated from operations before income tax and working
capital requirements
H1 2017EBITDA
TAXCASH
EXPENSES
WCR
MAINTENANCECAPEX
NETFINANCIALEXPENSES
5.0
4.4 (0.6)
(0.1)
(0.6)
2.5
(1.1)(0.2)
3.5
H1 2017CFFO
In €bn
FIN
AN
CIA
L A
PP
EN
DIC
ES

FREE CASH FLOW(1) GENERATION FROM H1 2016 TO H1 2017
H1 2017 RESULTS 104
D OPERATING CASH FLOW
H1 2016FCF(2)
D TAX CASHEXPENSES
D WCR DMAINTENANCE
CAPEX
H1 2017FCF
D NETFINANCIALEXPENSES
3.7 (0.5)
(0.5)
(0.1)
(0.2) +0.0
2.5
In €bn
(1) Free Cash Flow = CFFO after Maintenance Capex(2) H1 2016 restated for IFRS 5 (E&P accounted as discontinued operations)
FIN
AN
CIA
L A
PP
EN
DIC
ES
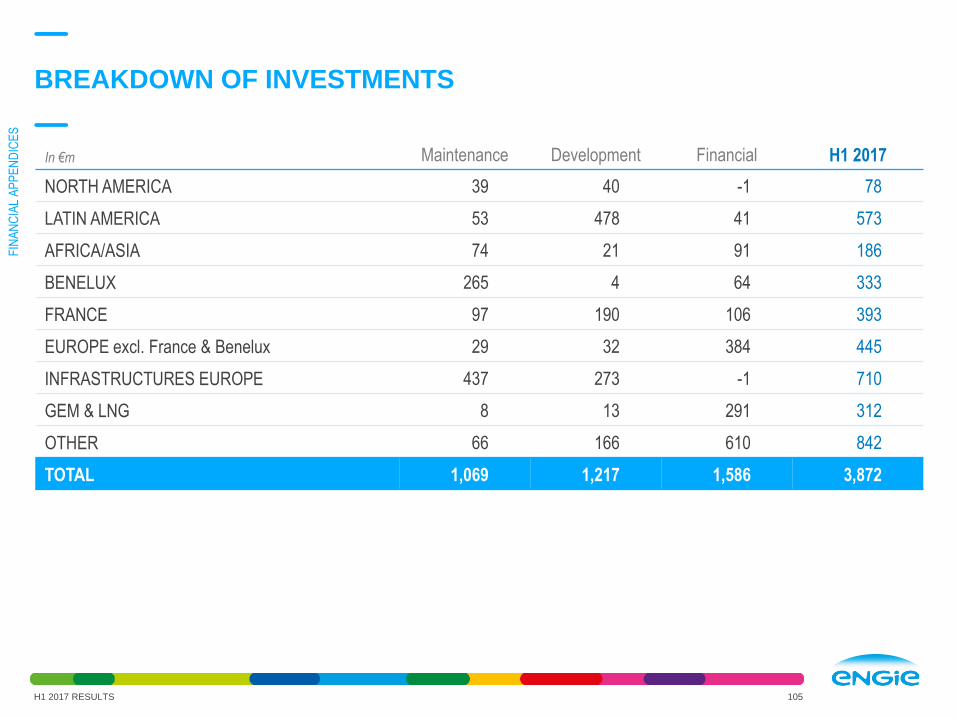
BREAKDOWN OF INVESTMENTS
H1 2017 RESULTS 105
In €m Maintenance Development Financial H1 2017
NORTH AMERICA 39 40 -1 78
LATIN AMERICA 53 478 41 573
AFRICA/ASIA 74 21 91 186
BENELUX 265 4 64 333
FRANCE 97 190 106 393
EUROPE excl. France & Benelux 29 32 384 445
INFRASTRUCTURES EUROPE 437 273 -1 710
GEM & LNG 8 13 291 312
OTHER 66 166 610 842
TOTAL 1,069 1,217 1,586 3,872
FIN
AN
CIA
L A
PP
EN
DIC
ES
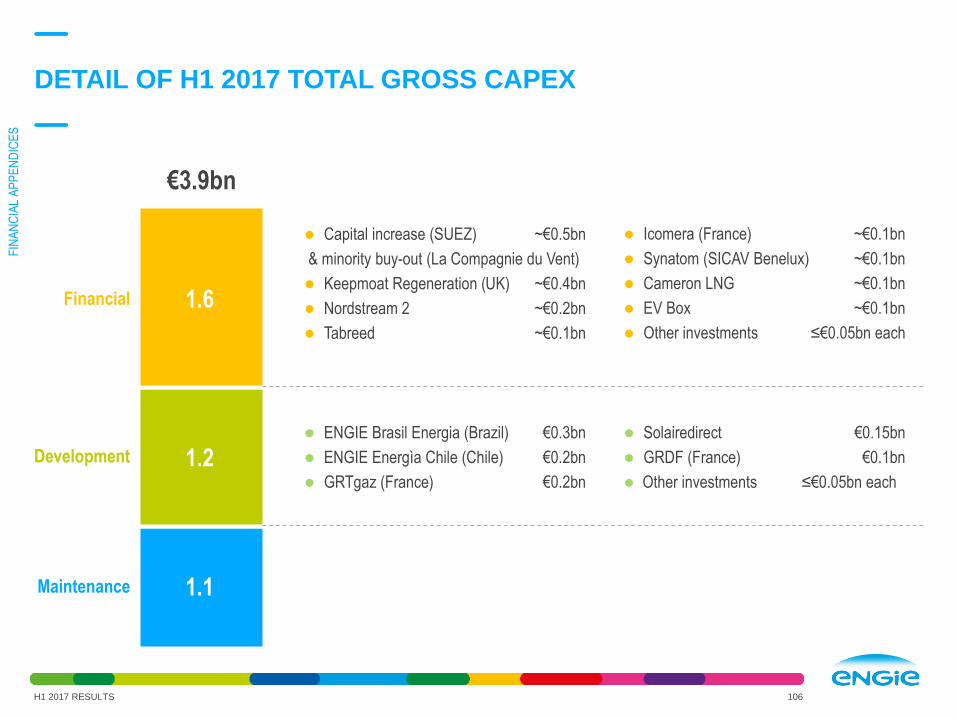
DETAIL OF H1 2017 TOTAL GROSS CAPEX
H1 2017 RESULTS 106
€3.9bn
1.6
1.2
1.1
Financial
Development
Maintenance
ENGIE Brasil Energia (Brazil) €0.3bn
ENGIE Energìa Chile (Chile) €0.2bn
GRTgaz (France) €0.2bn
Solairedirect €0.15bn
GRDF (France) €0.1bn
Other investments ≤€0.05bn each
Capital increase (SUEZ) ~€0.5bn
& minority buy-out (La Compagnie du Vent)
Keepmoat Regeneration (UK) ~€0.4bn
Nordstream 2 ~€0.2bn
Tabreed ~€0.1bn
Icomera (France) ~€0.1bn
Synatom (SICAV Benelux) ~€0.1bn
Cameron LNG ~€0.1bn
EV Box ~€0.1bn
Other investments ≤€0.05bn each
FIN
AN
CIA
L A
PP
EN
DIC
ES

CREDIT

“INVESTMENT GRADE” CATEGORY RATING
108
S&P Moody's
A+ A1
A A2 ENGIE (stable) 27.04.17
A-EDF (stable)
ENGIE (negative)
21.09.16
28.04.16A3
EDF (stable)
Vattenfall (stable)
28.09.16
18.07.17(1)
BBB+IBERDROLA (stable)
Vattenfall (stable)
22.04.16
07.06.17Baa1 IBERDROLA (positive) 25.04.16
BBBENEL (positive)
E.ON (stable)
Gas Natural (stable)
05.05.17
15.03.17
29.03.16
Baa2
E.ON (stable)
ENEL (stable)
Gas Natural (stable)
Innogy (stable)
15.03.17
12.12.16
13.02.16
30.06.17
BBB-Innogy (positive)
Uniper (positive)
RWE (stable)
14.11.16
18.04.17
29.06.17
Baa3 RWE (stable) 30.06.17
CREDIT RATINGS as of June 30, 2017(1)
H1 2017 RESULTS
(1) Except for Vattenfall (18 July 2017)
FIN
AN
CIA
L A
PP
EN
DIC
ES

SPLIT OF GROSS DEBT(1)
109
(1) Without IAS 39 (+€1.5bn) and bank overdraft (+€0.8bn)
€33.9bn 22.2 Bonds
5.3NEU CP/US CP
0.1Drawn credit lines
0.6Leasing
0.3Other borrowings
5.3Bank borrowings
AVERAGE COST OF GROSS DEBT: 2.65%
vs 2.78% as of 12/31/2016
H1 2017 RESULTS
FIN
AN
CIA
L A
PP
EN
DIC
ES
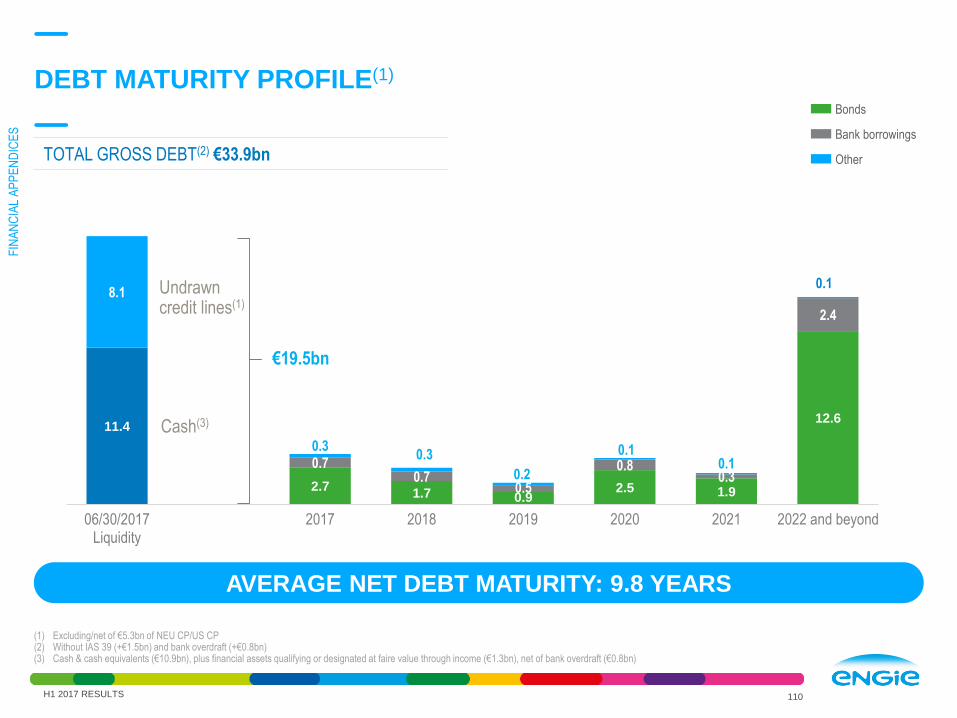
DEBT MATURITY PROFILE(1)
110
(1) Excluding/net of €5.3bn of NEU CP/US CP(2) Without IAS 39 (+€1.5bn) and bank overdraft (+€0.8bn) (3) Cash & cash equivalents (€10.9bn), plus financial assets qualifying or designated at faire value through income (€1.3bn), net of bank overdraft (€0.8bn)
11.4
2.71.7 0.9
2.5 1.9
12.6
8.1
0.70.7
0.5
0.80.3
2.4
0.30.3
0.2
0.10.1
0.1
06/30/2017Liquidity
2017 2018 2019 2020 2021 2022 and beyond
3,4
Undrawn credit lines(1)
Cash(3)
€19.5bn
AVERAGE NET DEBT MATURITY: 9.8 YEARS
TOTAL GROSS DEBT(2) €33.9bnBank borrowings
Other
Bonds
H1 2017 RESULTS
FIN
AN
CIA
L A
PP
EN
DIC
ES
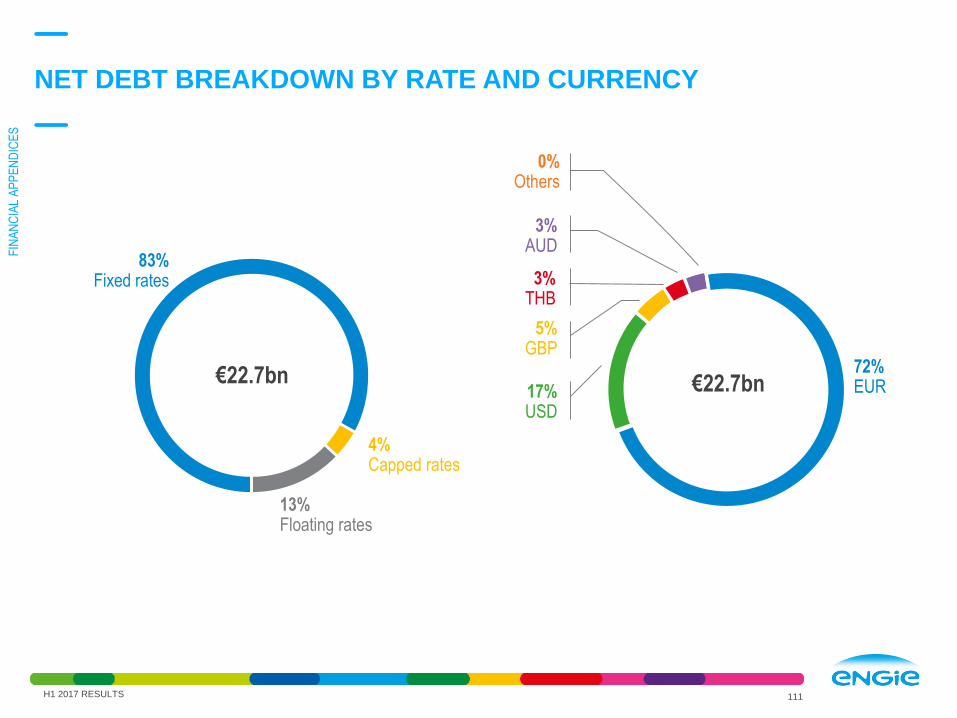
NET DEBT BREAKDOWN BY RATE AND CURRENCY
111
€22.7bn
4%Capped rates
€22.7bn
83%Fixed rates
13%Floating rates
72%EUR
0%Others
3%AUD
3%THB
5%GBP
17%USD
H1 2017 RESULTS
FIN
AN
CIA
L A
PP
EN
DIC
ES
Disclaimer
Forward-Looking statements
This communication contains forward-looking information and statements. These statements
include financial projections, synergies, cost-savings and estimates, statements regarding plans,
objectives, savings, expectations and benefits from the transactions and expectations with respect
to future operations, products and services, and statements regarding future performance.
Although the management of ENGIE believes that the expectations reflected in such forward-
looking statements are reasonable, investors and holders of ENGIE securities are cautioned that
forward-looking information and statements are not guarantees of future performances and are
subject to various risks and uncertainties, many of which are difficult to predict and generally
beyond the control of ENGIE , that could cause actual results, developments, synergies, savings
and benefits to differ materially from those expressed in, or implied or projected by, the forward-
looking information and statements. These risks and uncertainties include those discussed or
identified in the public filings made by ENGIE with the Autorité des Marchés Financiers (AMF),
including those listed under “Facteurs de Risque” (Risk factors) section in the Document de
Référence filed by ENGIE (ex GDF SUEZ) with the AMF on 24 March 2017 (under no: D.17-0220).
Investors and holders of ENGIE securities should consider that the occurrence of some or all of
these risks may have a material adverse effect on ENGIE.
H1 2017 RESULTS 112

Symbol ENGIY
CUSIP 29286D105
Platform OTC
Type of programme Level 1 sponsored
ADR ratio 1:1
Depositary bank Citibank, NA
ADR PROGRAMAMERICAN DEPOSITARY RECEIPT
113
FOR MORE INFORMATION, GO TO
http://www.citi.com/dr
H1 2017 RESULTS

FOR MORE INFORMATION ABOUT ENGIE
+33 1 44 22 66 29
Presentation
http://www.engie.com/en/investors-area/
FOR MORE INFORMATION ABOUT H1 2017 RESULTS, YOU WILL FIND ON
http://www.engie.com/en/investors/results/results-2017/
Analyst
pack
Appendices Press
Release
Recorded
conference
audiocast
Financial
report
Download the new ENGIE Investor relations app !
114
2017
First-half
Ticker: ENGI
H1 2017 RESULTS 114