appropriatezza degli esami di laboratorio i … · analysis •the primary measure is the number of...
TRANSCRIPT

APPROPRIATEZZA DEGLI ESAMI DI
LABORATORIO
I RISVOLTI ECONOMICI
Emidia Vagnoni
Barbara Bonvento
Ferrara, 2 Ottobre 2015
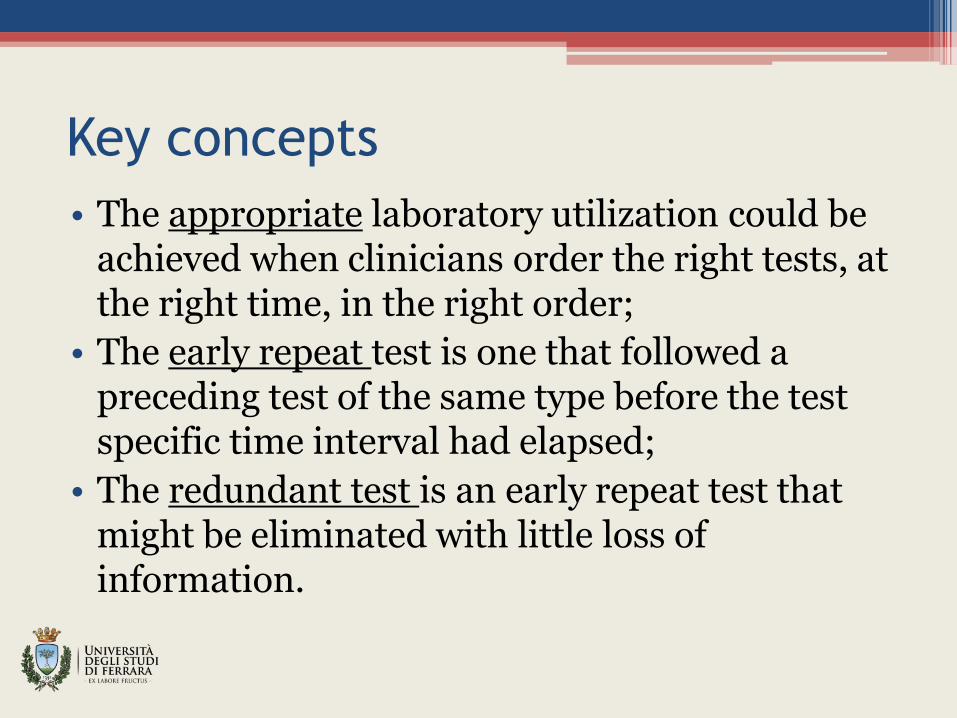
Key concepts
• The appropriate laboratory utilization could be achieved when clinicians order the right tests, at the right time, in the right order;
• The early repeat test is one that followed a preceding test of the same type before the test specific time interval had elapsed;
• The redundant test is an early repeat test that might be eliminated with little loss of information.
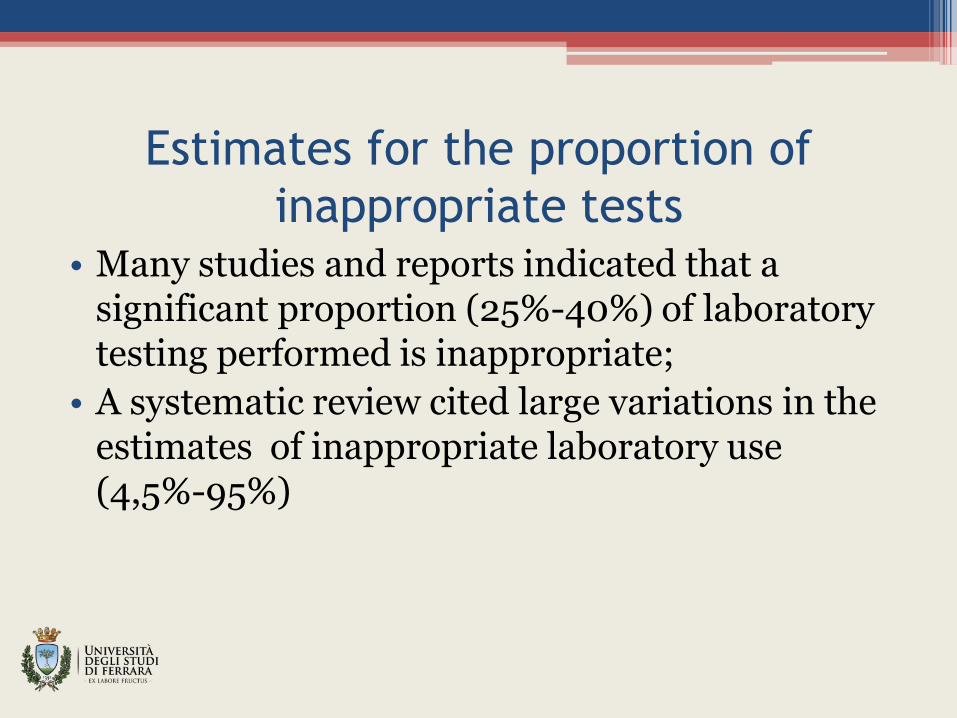
Estimates for the proportion of
inappropriate tests • Many studies and reports indicated that a
significant proportion (25%-40%) of laboratory testing performed is inappropriate;
• A systematic review cited large variations in the estimates of inappropriate laboratory use (4,5%-95%)
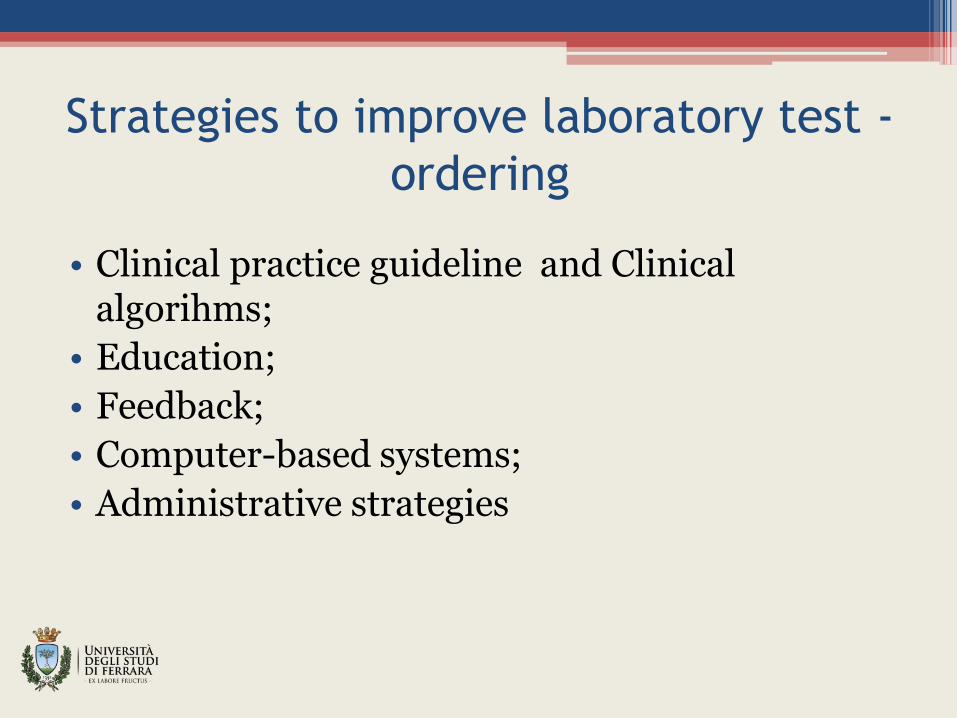
Strategies to improve laboratory test -
ordering
• Clinical practice guideline and Clinical algorihms;
• Education;
• Feedback;
• Computer-based systems;
• Administrative strategies
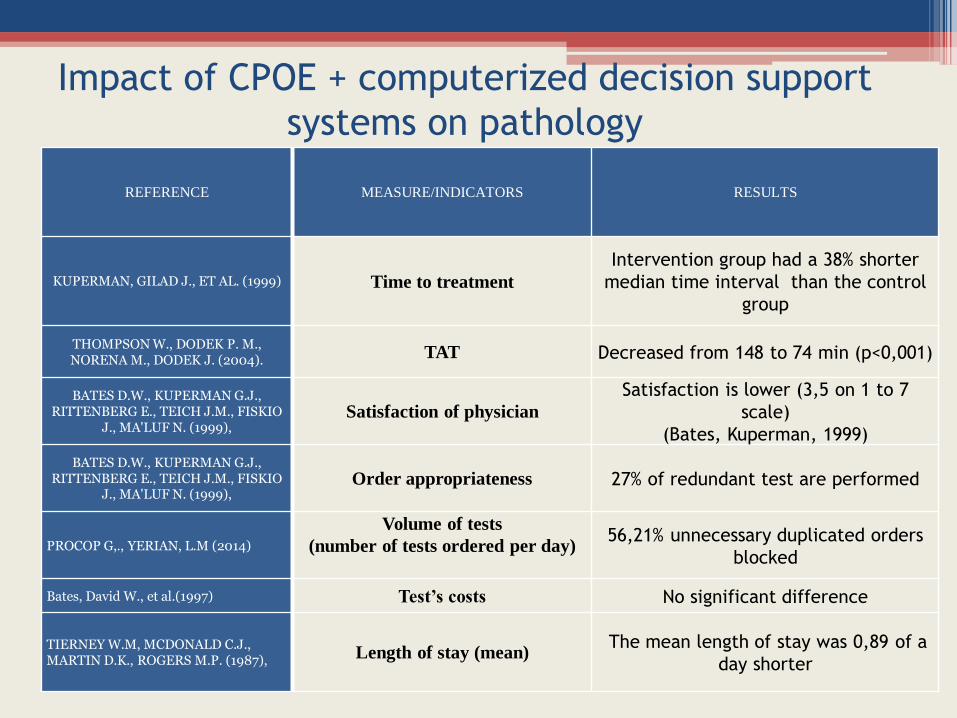
REFERENCE MEASURE/INDICATORS RESULTS
KUPERMAN, GILAD J., ET AL. (1999) Time to treatment
Intervention group had a 38% shorter
median time interval than the control
group
THOMPSON W., DODEK P. M., NORENA M., DODEK J. (2004). TAT Decreased from 148 to 74 min (p<0,001)
BATES D.W., KUPERMAN G.J., RITTENBERG E., TEICH J.M., FISKIO
J., MA'LUF N. (1999), Satisfaction of physician
Satisfaction is lower (3,5 on 1 to 7
scale)
(Bates, Kuperman, 1999)
BATES D.W., KUPERMAN G.J., RITTENBERG E., TEICH J.M., FISKIO
J., MA'LUF N. (1999), Order appropriateness
27% of redundant test are performed
PROCOP G,., YERIAN, L.M (2014)
Volume of tests
(number of tests ordered per day)
56,21% unnecessary duplicated orders
blocked
Bates, David W., et al.(1997) Test’s costs No significant difference
TIERNEY W.M, MCDONALD C.J., MARTIN D.K., ROGERS M.P. (1987), Length of stay (mean)
The mean length of stay was 0,89 of a
day shorter
Impact of CPOE + computerized decision support
systems on pathology
Objective
• Primary objective of the present study is to determine whether the management intervention, consisting of guideline development, computerized order template design, and educational efforts, could decrease test utilization without affecting clinical outcomes.
To that end a study has been conducted at Ferrara health authority (Asl) and Ferrara Teaching Hospital
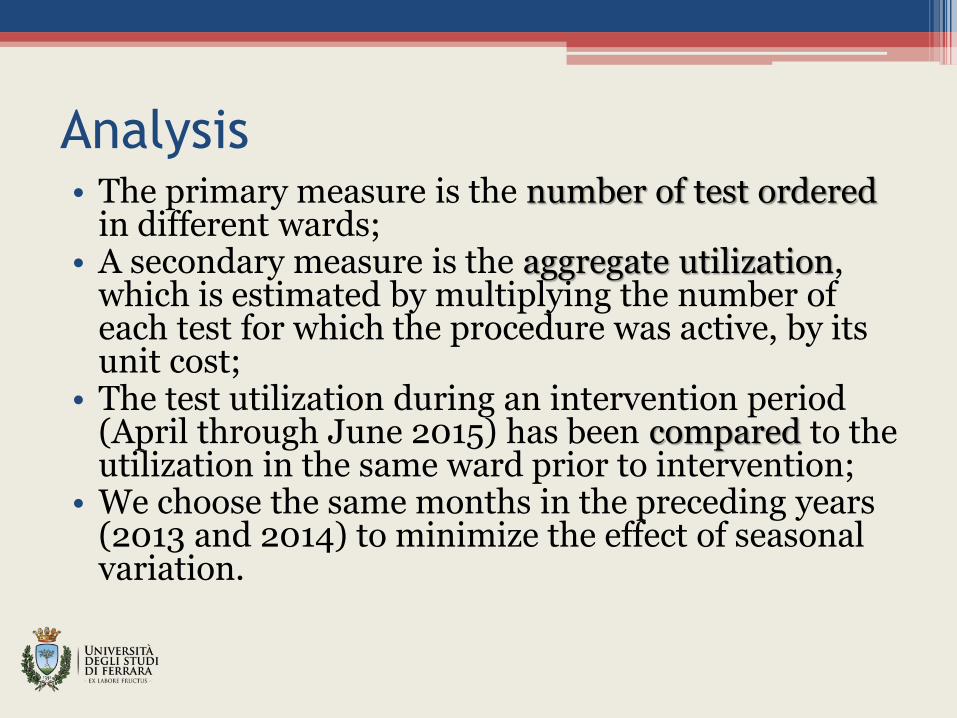
Analysis • The primary measure is the number of test ordered
in different wards; • A secondary measure is the aggregate utilization,
which is estimated by multiplying the number of each test for which the procedure was active, by its unit cost;
• The test utilization during an intervention period (April through June 2015) has been compared to the utilization in the same ward prior to intervention;
• We choose the same months in the preceding years (2013 and 2014) to minimize the effect of seasonal variation.
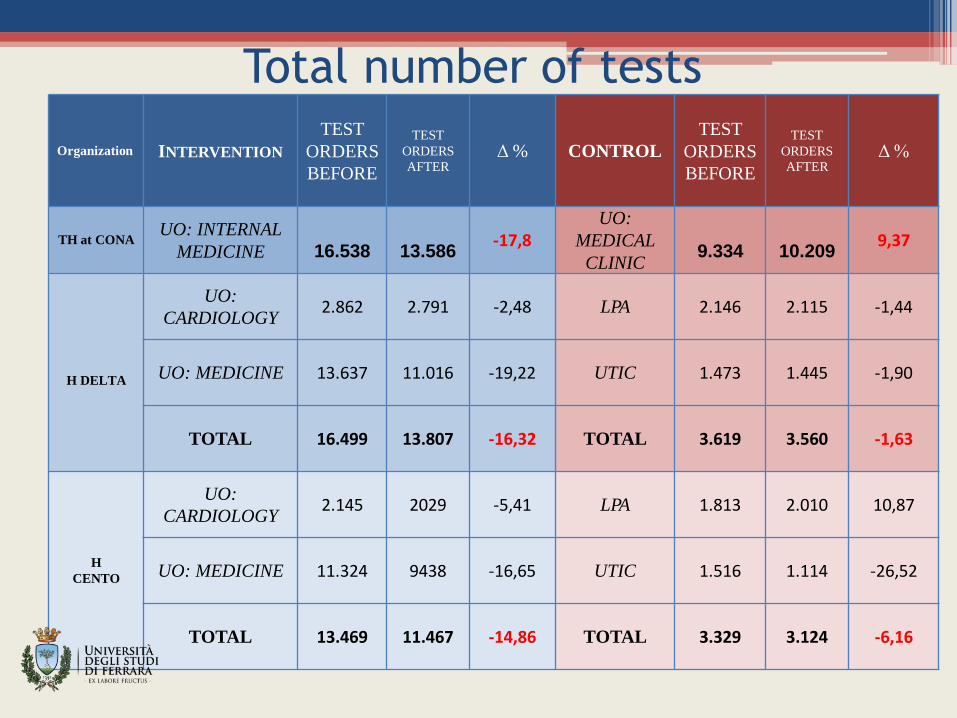
Total number of tests
Organization INTERVENTION
TEST
ORDERS
BEFORE
TEST
ORDERS
AFTER Δ % CONTROL
TEST
ORDERS
BEFORE
TEST
ORDERS
AFTER Δ %
TH at CONA UO: INTERNAL
MEDICINE
16.538
13.586
-17,8 UO:
MEDICAL
CLINIC
9.334
10.209
9,37
H DELTA
UO:
CARDIOLOGY 2.862 2.791 -2,48 LPA 2.146 2.115 -1,44
UO: MEDICINE 13.637 11.016 -19,22 UTIC 1.473 1.445 -1,90
TOTAL 16.499 13.807 -16,32 TOTAL 3.619 3.560 -1,63
H CENTO
UO:
CARDIOLOGY 2.145 2029 -5,41 LPA 1.813 2.010 10,87
UO: MEDICINE 11.324 9438 -16,65 UTIC 1.516 1.114 -26,52
TOTAL 13.469 11.467 -14,86 TOTAL 3.329 3.124 -6,16
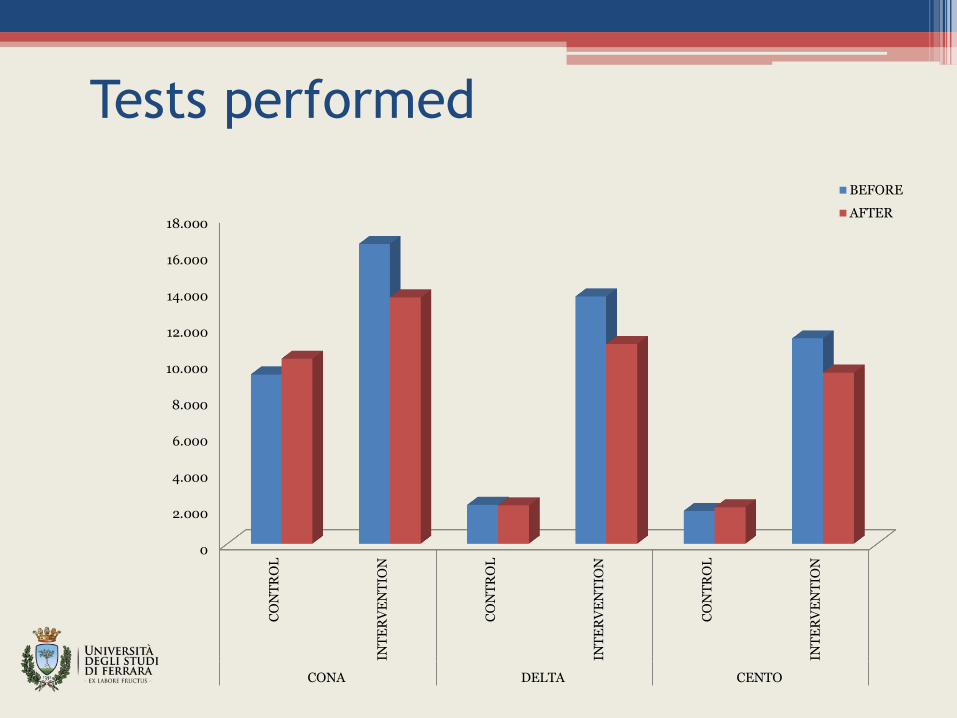
Tests performed
0
2.000
4.000
6.000
8.000
10.000
12.000
14.000
16.000
18.000
CO
NT
RO
L
INT
ER
VE
NT
ION
CO
NT
RO
L
INT
ER
VE
NT
ION
CO
NT
RO
L
INT
ER
VE
NT
ION
CONA DELTA CENTO
BEFORE
AFTER
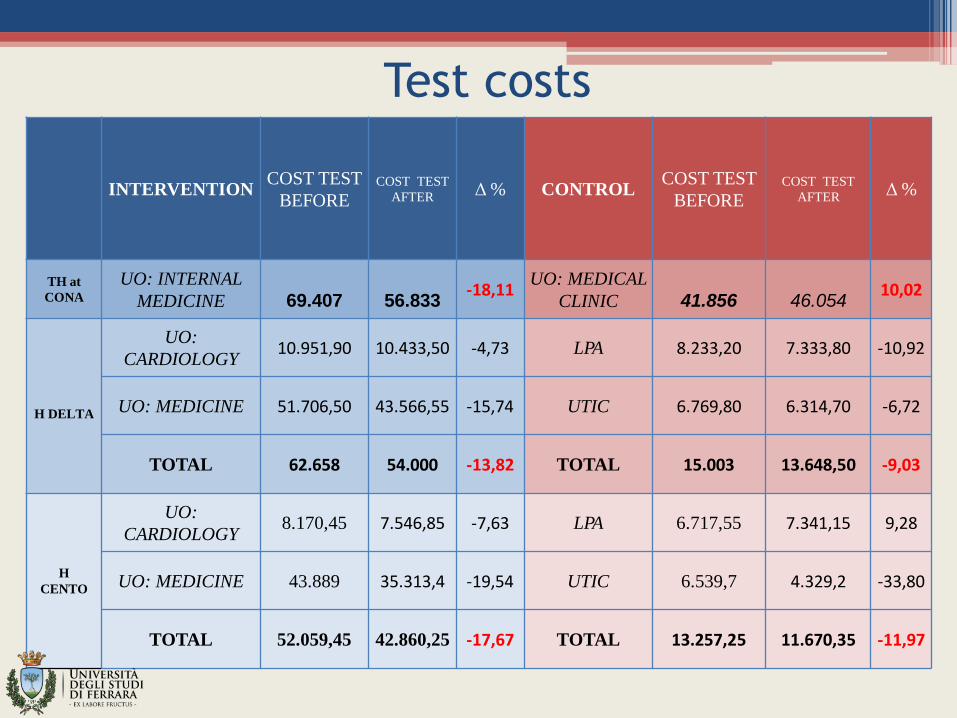
Test costs
INTERVENTION COST TEST
BEFORE COST TEST
AFTER Δ % CONTROL COST TEST
BEFORE COST TEST
AFTER Δ %
TH at
CONA
UO: INTERNAL
MEDICINE
69.407
56.833
-18,11 UO: MEDICAL
CLINIC
41.856
46.054
10,02
H DELTA
UO:
CARDIOLOGY 10.951,90 10.433,50 -4,73 LPA 8.233,20 7.333,80 -10,92
UO: MEDICINE 51.706,50 43.566,55 -15,74 UTIC 6.769,80 6.314,70 -6,72
TOTAL 62.658 54.000 -13,82 TOTAL 15.003 13.648,50 -9,03
H CENTO
UO:
CARDIOLOGY 8.170,45 7.546,85 -7,63 LPA 6.717,55 7.341,15 9,28
UO: MEDICINE 43.889 35.313,4 -19,54 UTIC 6.539,7 4.329,2 -33,80
TOTAL 52.059,45 42.860,25 -17,67 TOTAL 13.257,25 11.670,35 -11,97
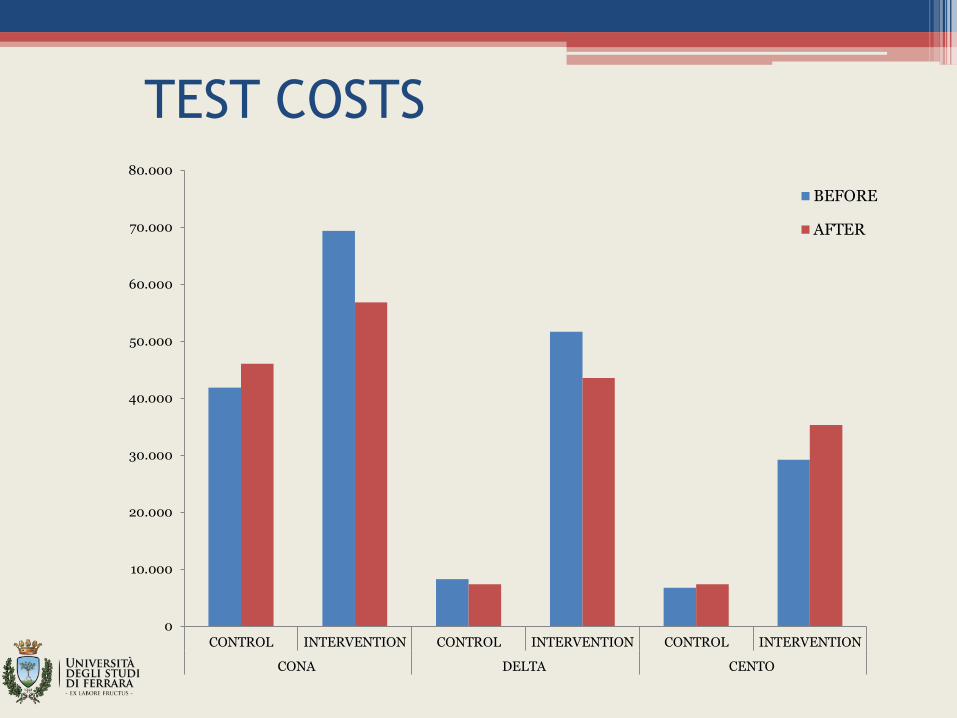
TEST COSTS
0
10.000
20.000
30.000
40.000
50.000
60.000
70.000
80.000
CONTROL INTERVENTION CONTROL INTERVENTION CONTROL INTERVENTION
CONA DELTA CENTO
BEFORE
AFTER
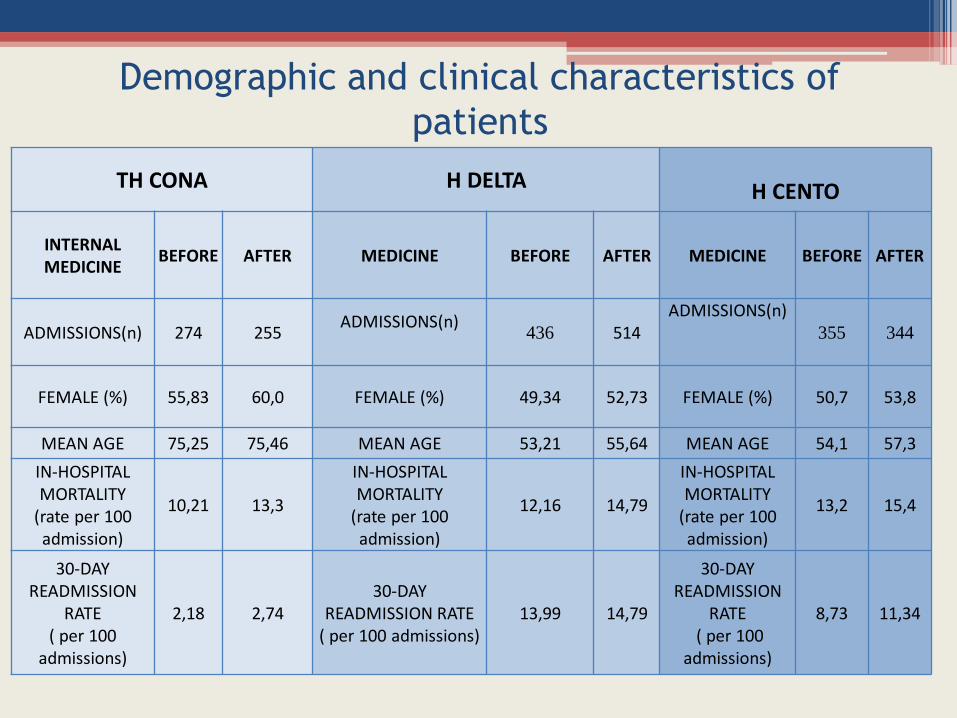
Demographic and clinical characteristics of
patients
TH CONA H DELTA
H CENTO
INTERNAL MEDICINE
BEFORE AFTER MEDICINE BEFORE AFTER MEDICINE BEFORE AFTER
ADMISSIONS(n) 274 255 ADMISSIONS(n)
436 514
ADMISSIONS(n)
355 344
FEMALE (%) 55,83 60,0 FEMALE (%) 49,34 52,73 FEMALE (%) 50,7 53,8
MEAN AGE 75,25 75,46 MEAN AGE 53,21 55,64 MEAN AGE 54,1 57,3
IN-HOSPITAL MORTALITY
(rate per 100 admission)
10,21 13,3
IN-HOSPITAL MORTALITY
(rate per 100 admission)
12,16 14,79
IN-HOSPITAL MORTALITY
(rate per 100 admission)
13,2 15,4
30-DAY READMISSION
RATE ( per 100
admissions)
2,18 2,74 30-DAY
READMISSION RATE ( per 100 admissions)
13,99 14,79
30-DAY READMISSION
RATE ( per 100
admissions)
8,73 11,34
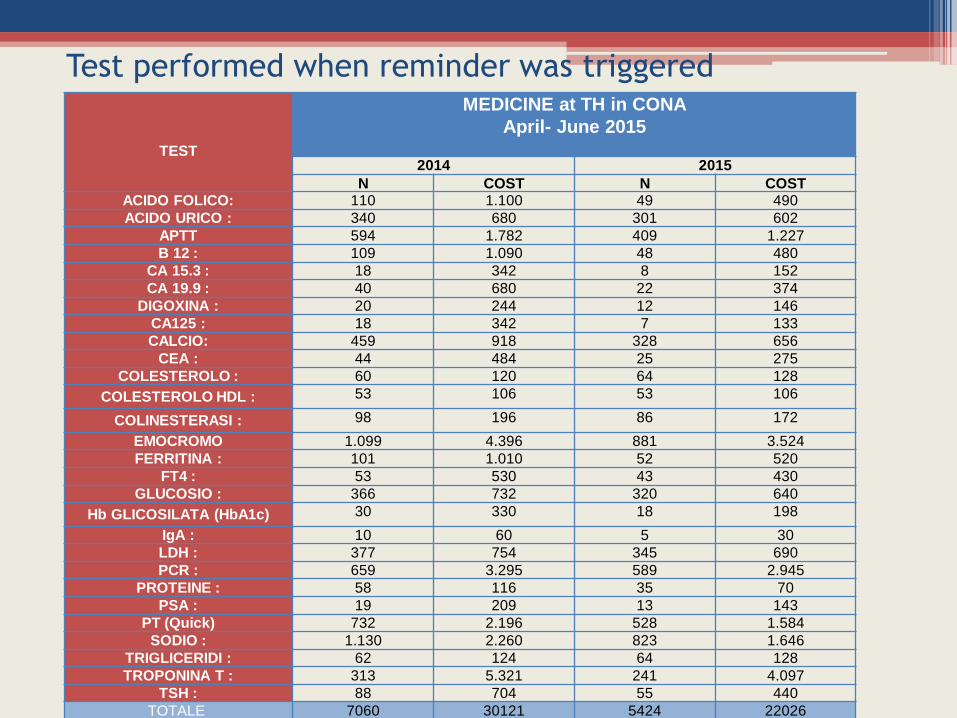
Test performed when reminder was triggered
TEST
MEDICINE at TH in CONA
April- June 2015
2014 2015
N COST N COST ACIDO FOLICO: 110 1.100 49 490
ACIDO URICO : 340 680 301 602
APTT 594 1.782 409 1.227
B 12 : 109 1.090 48 480
CA 15.3 : 18 342 8 152
CA 19.9 : 40 680 22 374
DIGOXINA : 20 244 12 146
CA125 : 18 342 7 133
CALCIO: 459 918 328 656
CEA : 44 484 25 275
COLESTEROLO : 60 120 64 128
COLESTEROLO HDL : 53 106 53 106
COLINESTERASI : 98 196 86 172
EMOCROMO 1.099 4.396 881 3.524
FERRITINA : 101 1.010 52 520
FT4 : 53 530 43 430
GLUCOSIO : 366 732 320 640
Hb GLICOSILATA (HbA1c) 30 330 18 198
IgA : 10 60 5 30
LDH : 377 754 345 690
PCR : 659 3.295 589 2.945
PROTEINE : 58 116 35 70
PSA : 19 209 13 143
PT (Quick) 732 2.196 528 1.584
SODIO : 1.130 2.260 823 1.646
TRIGLICERIDI : 62 124 64 128
TROPONINA T : 313 5.321 241 4.097
TSH : 88 704 55 440
TOTALE 7060 30121 5424 22026
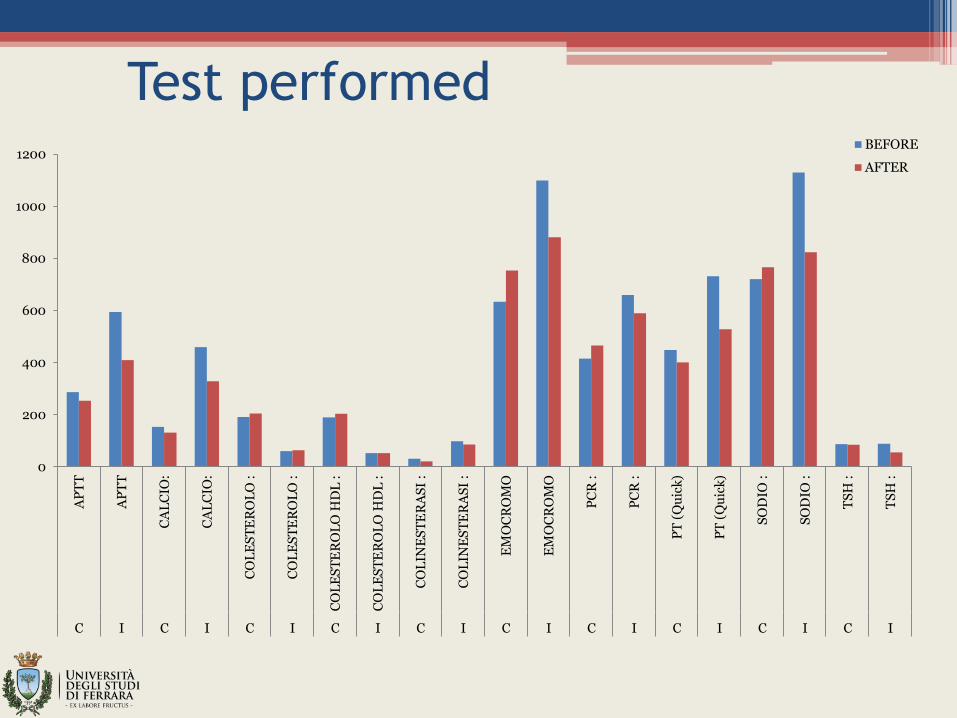
Test performed
0
200
400
600
800
1000
1200
AP
TT
AP
TT
CA
LC
IO:
CA
LC
IO:
CO
LE
ST
ER
OL
O :
CO
LE
ST
ER
OL
O :
CO
LE
ST
ER
OL
O H
DL
:
CO
LE
ST
ER
OL
O H
DL
:
CO
LIN
ES
TE
RA
SI
:
CO
LIN
ES
TE
RA
SI
:
EM
OC
RO
MO
EM
OC
RO
MO
PC
R :
PC
R :
PT
(Q
uic
k)
PT
(Q
uic
k)
SO
DIO
:
SO
DIO
:
TS
H :
TS
H :
C I C I C I C I C I C I C I C I C I C I
BEFORE
AFTER
Reminders accepted and test performed
at UO of MEDICINE - CONA TH
April - June 2015
TEST TEST potentially
inappropriate (%) TEST repeated
(%) TEST NON repeated
(%)
ACIDO FOLICO: 10,20 4,08 6,12
ACIDO URICO : 15,61 6,31 9,30
APTT 11,98 6,36 5,62
B 12 : 10,42 4,17 6,25
CA 15.3 : 12,50 12,50
CA 19.9 : 4,55 0,00 4,55
DIGOXINA : 16,67 8,33 8,33
CA125 : 14,29 0,00 14,29
CALCIO: 3,66 2,13 1,52
CEA : 8,00 4,00 4,00
COLESTEROLO : 23,44 9,38 14,06
COLESTEROLO HDL : 7,55 5,66 1,89
COLINESTERASI : 4,65 3,49 1,16
EMOCROMO 12,71 8,06 4,65
FERRITINA : 7,69 5,77 1,92
FT4 : 2,33 0,00 2,33
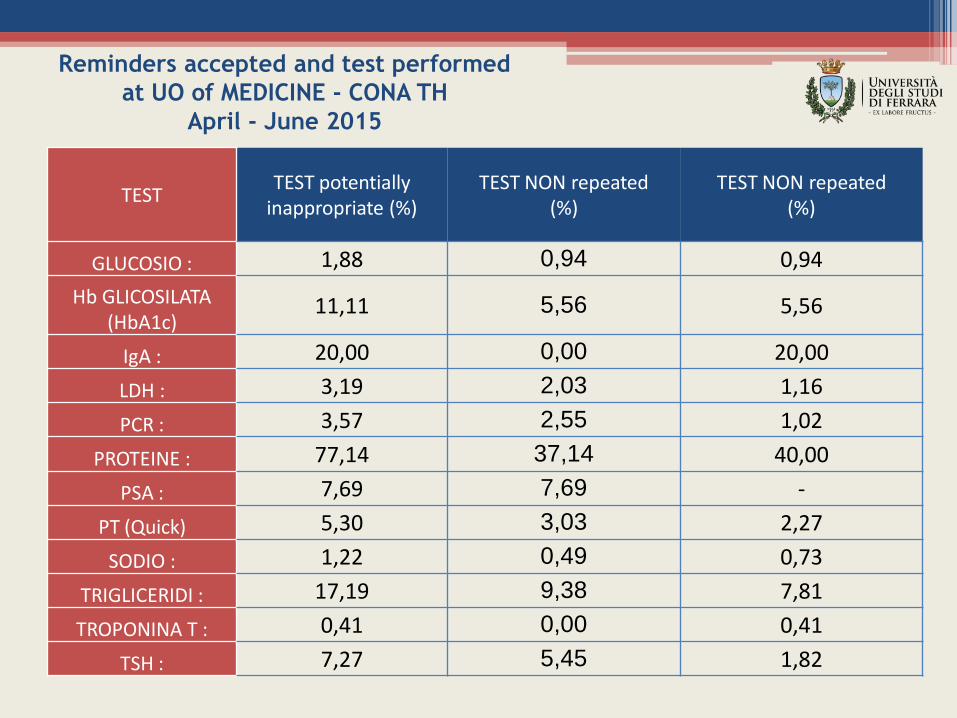
TEST TEST potentially
inappropriate (%) TEST NON repeated
(%) TEST NON repeated
(%)
GLUCOSIO : 1,88 0,94 0,94
Hb GLICOSILATA (HbA1c)
11,11 5,56 5,56
IgA : 20,00 0,00 20,00
LDH : 3,19 2,03 1,16
PCR : 3,57 2,55 1,02
PROTEINE : 77,14 37,14 40,00
PSA : 7,69 7,69 -
PT (Quick) 5,30 3,03 2,27
SODIO : 1,22 0,49 0,73
TRIGLICERIDI : 17,19 9,38 7,81
TROPONINA T : 0,41 0,00 0,41
TSH : 7,27 5,45 1,82
Reminders accepted and test performed
at UO of MEDICINE - CONA TH
April - June 2015
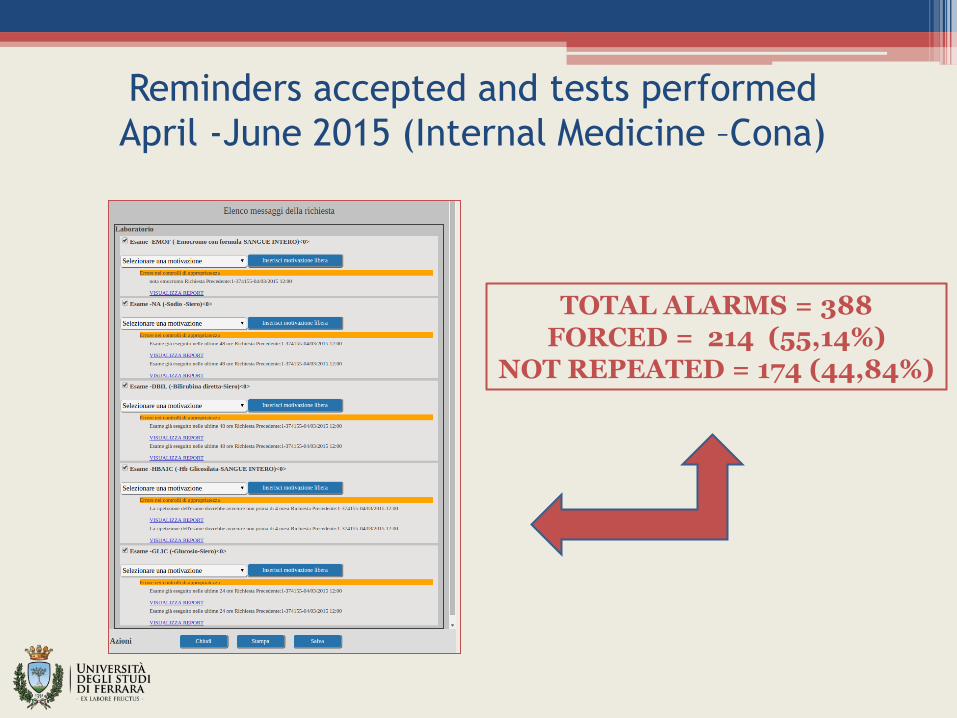
Reminders accepted and tests performed
April -June 2015 (Internal Medicine –Cona)
TOTAL ALARMS = 388 FORCED = 214 (55,14%)
NOT REPEATED = 174 (44,84%)
Discussion
• We demonstrated a reduction in testing after an intervention consisting in giving physicians computerized reminders related to apparently redundant clinical laboratory tests.
• This result is more relevant when data related to a control unit is considered.
• The measured results were not associated with any change in clinical outcomes, although our power to detect such a change is limited to the aggregate data.
Next steps of the research
To analyze the extent to which reminders for
apparently redundant laboratory tests affects:
The number of tests ordered;
The number of test performed;
The proportion of overrides of reminders justified;
The cancellation of tests resulted in adverse effects for patients;
The charge savings;
Patients and outcomes Specific Setting: Sant’Anna Hospital (Cona)
Study Objectives: To determine the cost-effectiveness of SIP to reduce utilization
of redundant laboratory tests
Patient baseline demographics : All inpatients during the 4-month period
between April and June 2014-2015 ;
Outcome measures
Outcome 1: Proportion of reminders accepted
Outcome 2: Proportion of test performed after reminder
Outcome 3: Proportion of tests performed earlier than test-specific intervals
Outcome 4: Proportion of justified overrides of reminders by specific test
Outcome 5: Adverse effects of test cancellation (new abnormal results for the
same test performed within 3 days of cancellation)
Outcome 6: Charge savings associated with reminders for redundant tests
Methods of statistical analysis: Comparisons between intervention and
control group and between different time periods made using multiple
regression models. Annual charge savings estimated by multiplying the
charges for each test by the number of test cancelled, and annualized to 1 year.
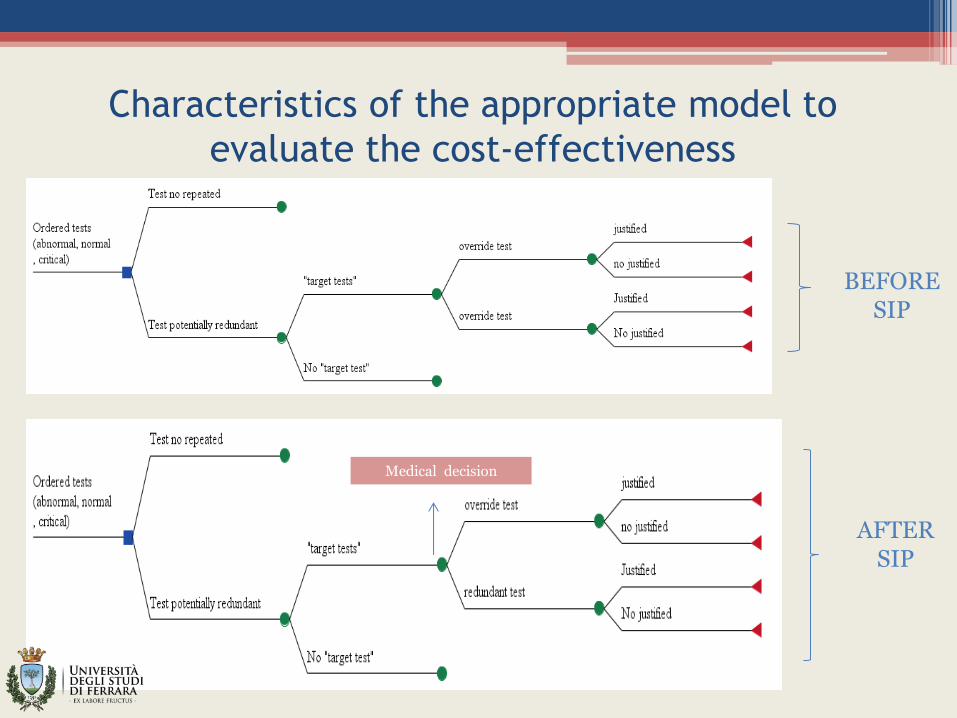
Characteristics of the appropriate model to
evaluate the cost-effectiveness
BEFORE SIP
AFTER SIP
Medical decision
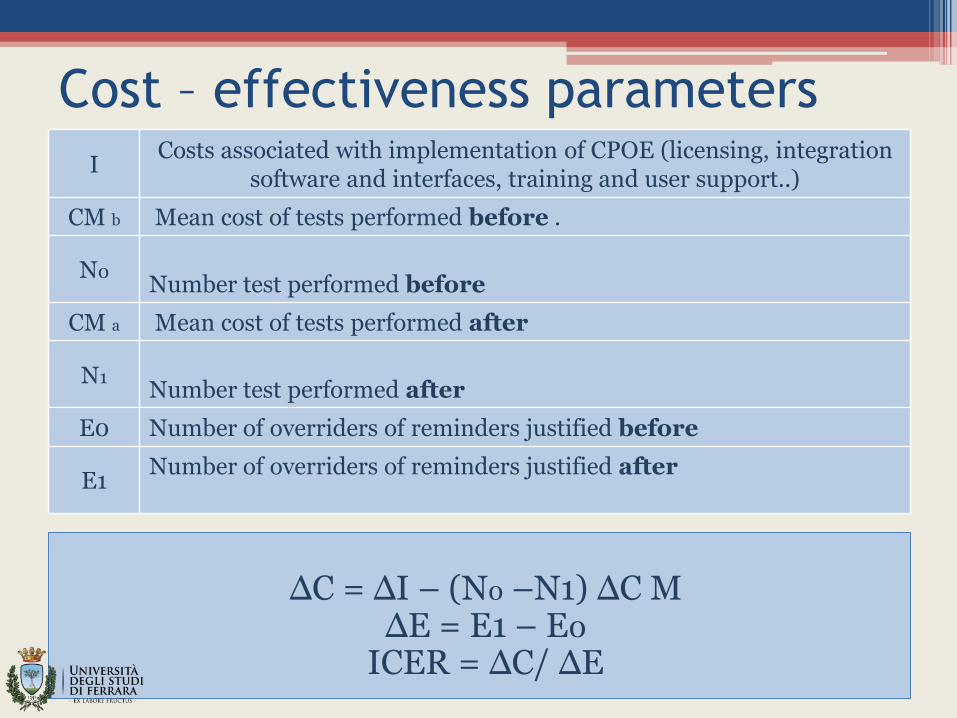
Cost – effectiveness parameters
I Costs associated with implementation of CPOE (licensing, integration
software and interfaces, training and user support..)
CM b Mean cost of tests performed before .
N0 Number test performed before
CM a Mean cost of tests performed after
N1 Number test performed after
E0 Number of overriders of reminders justified before
E1 Number of overriders of reminders justified after
ΔC = ΔI – (N0 –N1) ΔC M
ΔE = E1 – E0 ICER = ΔC/ ΔE
Conclusion
• It is important to associate each test to the patient characteristics to model the cost-effectiveness on covariates;
• To evaluate the effectiveness of reminders it must be demonstrated that cancellation of redundant tests appeared to result in little or no loss of clinical information;
• To evaluate the potential consequences to eliminating test that appeared redundant it is necessary to evaluate the proportion of early repeats and the frequency with which repeated tests had a result that represent a change from the first result.