arie van steensel
TRANSCRIPT
PINAR CEYLAN
368
dal rent in the region was transferred mainly to cavalrymen and other lower serv-ants of the state who earned modest incomes and exercised only limited power over the producers. In the villages located in the northern part of the district, larger plot sizes, fewer landless producers, and possible access to common use rights point to more ample and equal opportunities in land access for direct producers. At the same time, the agrarian surplus extracted from producers was distributed rela-tively equally within the landlords’ class at a low level of concentration.
Overall, higher levels of inequality were observed in the densely populated,
more developed and highly commercialised area in southern Manisa, whereas a more egalitarian socioeconomic structure prevailed in the mountainous northern part that was inhabited by a high number of tribal groups. While stressing the ne-cessity of a comparative regional approach in studying rural inequality in pre-industrial societies, these results also lend support to arguments that inequality lev-els in these societies were positively associated with the level of market develop-ment and population.
Arie van Steensel
Measuring urban inequalities Spatial patterns of service access in sixteenth-century Leiden INTRODUCTION
The historical study of economic inequality has attracted considerable attention in recent years, even though the topic is not entirely new. Urban historians have already noticed the skewed distribution of wealth and income typical of late medieval cities and towns, as for example in Norwich, Augsburg or Ghent.1 Moreover, two decades ago, Lee Soltow and Jan Luiten van Zanden wrote a seminal study on economic inequality in the northern Low Countries, in which they offer a broader analysis of its development and causes in the pre-industrial era.2 Nonetheless, the compelling argument made by Thomas Piketty about the rise of economic inequality in the closing decades of the twentieth century has inspired historians to revisit the long-term historical evolution of inequality.3 The most prominent recent work is being conducted by Guido Alfani, who leads a major research project that reconstructs and compares inequality trends across premodern Europe.4 On his part, Wouter Ryckbosch has published a more detailed picture of urban inequality trends in the premodern Low Countries.5 These studies have significantly increased our understanding of the historical development of economic inequality: apart from during a short period after the Black Death, the level of inequality appears to have risen slowly and incrementally across Europe,
1 J.F. POUND, The Social and Trade Structure of Norwich 1525-1575, in “Past & Present”, 34, 1966,
pp. 49‑69; J. JAHN, Die Augsburger Sozialstruktur im 15. Jahrhundert, in Geschichte der Stadt Augsburg von der Römerzeit bis zur Gegenwart, G. GOTTLIEB, W. BAER, J. BECKER eds., Stuttgart 1984, pp. 187‑193; Studiën betreffende de sociale strukturen te Brugge, Kortrijk en Gent in de 14e en 15e eeuw, I-III, W.P. BLOCKMANS, I. DE MEYER, J. MERTENS, J.A. VAN HOUTTE, H.VAN WEVERKE eds., Heule 1971.
2 L. SOLTOW, J.L VAN ZANDEN, Income and Wealth Inequality in the Netherlands, 16th-20th Century, Amsterdam, 1998.
3 T. PIKETTY, Capital in the Twenty-First Century, Cambridge, MA, 2014. 4 G. ALFANI, M. DI TULLIO, The Lion’s Share: Inequality and the Rise of the Fiscal State in Preindustrial
Europe, Cambridge 2019. 5 W. RYCKBOSCH, Economic Inequality and Growth Before the Industrial Revolution: the Case of the Low
Countries (fourteenth to nineteenth Centuries), in “European Review of Economic History”, 20, 2016, pp. 1‑22.
Arie Van Steensel, Measuring urban inequalities. Spatial patterns of service access in sixteenth-century Leiden, pp. 369-388, © 2020 Author(s), CC BY 4.0 International, DOI 10.36253/978-88-5518-053-5.23

ARIE VAN STEENSEL
370
although this general trend was regionally differentiated.6 The causes of this trend, however, remain poorly understood, as do their real impact on the lives of men and women living in premodern European societies.
Historians have put forward several possible explanations for the increase of economic inequality in premodern Europe. Van Zanden, for example, has demonstrated that economic expansion in the premodern era was coupled with a considerable growth in inequality, a process to which, according to him, urbanisation and changes in the functional distribution of income contributed more than did an increase in the skill premium.7 Recently, Alfani and Ryckbosch have shown that economic growth offers no conclusive explanation for the estimated trend of rising inequality, which was even more pronounced in those regions that experienced economic stagnation, as central-northern Italy did, for example, in contrast to the Low Countries during the same period. Non-egalitarian inheritance systems and differences in kinship structures did not have a differentiated effect on inequality either; they rather point to a number of other factors that had an impact on economic (re)distribution: increasing proletarianisation and the formation of a more centralised fiscal state contributed to growing disparities, while the presence of representative political institutions and a relatively progressive fiscal system with higher social expenditure suppressed this increase of economic inequality slightly.8 These findings, and the ongoing debate, illustrate the preliminary nature of our understanding of the causes and effects of long-term trends of economic inequality in premodern Europe.
The recent macro-economic focus on the evolution and causes of inequality, relying on cross-regional statistical analyses of aggregated data from extant fiscal sources, implicates that the micro-economic effects of disparities in wealth and in-come distribution at the household level have drawn less interest from historians. Arguably, adopting such an approach could make the factors and processes that drove the evolution of inequality more observable, as is shown by a notable excep-tion: the article by Jord Hanus on the Brabantine city of ’s-Hertogenbosch, in which he argues that the social consequences of economic developments deserve more attention from economic historians.9 Specifically, he demonstrates for his case study how household composition and relative prices had an impact on real
6 G. ALFANI, W. RYCKBOSCH, Growing Apart in Early Modern Europe? A Comparison of Inequality
Trends in Italy and the Low Countries, 1500-1800, in “Explorations in Economic History”, 62, 2016, pp. 143‑153.
7 J.L. VAN ZANDEN, Tracing the Beginning of the Kuznets Curve: Western Europe during the Early Modern Period, in “The Economic History Review”, 48, 1995, pp. 643‑664; cf. B. MILANOVIĆ, Global Inequality: A New Approach for the Age of Globalization, Cambridge, MA, 2016, p. 69: “…inequality expands and contracts in preindustrial economies against a broadly unchanging mean income, driven by accidental or exogenous events such as epidemics, discoveries, or wars. Absent are the endogenous forces of economic development that we in the modern era assume to be the forces that affect inequality.”
8 G. ALFANI, W. RYCKBOSCH, Growing apart in early modern Europe?, cit., p. 152, and for an extensive discussion: G. ALFANI, M. DI TULLIO, The Lion’s Share, cit., chapter 4.
9 J. HANUS, Real Inequality in the Early Modern Low Countries: the City of ’s-Hertogenbosch, 1500-1660, in “The Economic History Review”, 66, 2013, pp. 733‑756.
MEASURING URBAN INEQUALITIES 371
inequality, a fact which is not captured by common measurements of nominal eco-nomic inequality.10 This insight, and micro-economic approaches, are also central to the efforts by present-day (inter)national bodies to measure human well-being in a broader way than merely relying on macro-economic indicators such as GDP trends. The CES Recommendations on Measuring Sustainable Development (2014), for ex-ample, offer a framework for measuring human well-being in multiple ways (includ-ing inequality as an important driver of well-being) and for taking its geographical and intergenerational distributions into account.11
The present contribution, then, focuses on the micro-economic determinants and effects of economic inequality at a local, urban level. It raises the question of how to develop alternative, complementary ways of getting a better grip on inequal-ity in past (urban) societies that incorporate indicators of the broader effects of so-cial and economic disparities. Ideally, these measures would also be less dependent on the fiscal records from which the distribution of wealth and income distribu-tions are commonly inferred, but which are not widely available for premodern Eu-rope. Studies both by archaeologists and social scientists on socio-spatial equality or equity suggest that spatial analysis might offer an alternative measure of inequality that can also be applied to premodern urban societies.12 Therefore, with the late medieval Dutch town of Leiden serving as a case study, this contribution explores the spatial distribution of social and economic indicators, as well as the spatial accessibility of certain public facilities and services to urbanites. Spatial equity defines the relative access households or individuals have to certain (public) services or resources in geographic terms. This spatial accessibility can be measured and geo-visualised, for example, by calculating the shortest or real routes by means of a route network analysis. For Leiden, a preliminary analysis reveals different patterns of spatial accessibility within town walls, which did not necessarily correlate with other distributional patterns of indicators of socio-economic status. Although it can be assumed that the (contingent) urban morphology and geographic context affected the spatial distribution of resources and the relative accessibility of services,13 these determinants should be considered in relation to other political, economic and socio-cultural variables. The notion of spatial equity
10 See, also for this point: P.T. HOFFMAN, D.S. JACKS, P.A. LEVIN, P.H. LINDERT, Real Inequality
in Europe since 1500, in “The Journal of Economic History”, 62, 2002, pp. 322‑355. 11 UNECE, Conference of European Statisticians Recommendations on Measuring Sustainable Development
(2014), unece.org/fileadmin/DAM/stats/publications/2013/CES_SD_web.pdf (accessed 1 March 2019).
12 B.W. STANLEY, T.J. DENNEHY, M.E. SMITH, B.L. STARK, A.M. YORK, G.L. COWGILL, J. NOVIC, J. EK, Service Access in Premodern Cities: An Exploratory Comparison of Spatial Equity, in “Journal of Urban History”, 42, 2016, pp. 121‑144; E. TALEN, Geovisualization of Spatial Equity, in The SAGE Handbook of GIS and Society, T. NYERGES, H. COUCLELIS, R. MCMASTER eds., London 2011, pp. 458‑479.
13 See, for the importance and measurement of inter and intra-urban inequalities in contemporary societies, E.L. GLAESER, M. RESSEGER, K. TOBIO, Inequality in Cities, in “Journal of Regional Science”, 49, 2009, pp. 617‑646; A. MICHEL, A. RIBARDIÈRE, Identifier les ressources urbaines pour lire les inégalités socio-spatiales. Introduction, in “EchoGéo”, 39, 2017, pp. 1-7.
ARIE VAN STEENSEL
372
here refers to a process rather than to an (ideal) outcome, and it will be argued that measuring spatial or service (in)equity patterns can provide a complementary indication of disparities in premodern urban well-being and the opportunities individuals had to improve their living conditions through residential choice.
Before turning to the relevant conceptual and methodological issues in more detail, the case study of late medieval Leiden is briefly introduced. The second part of this contribution discusses the spatial patterns of economic inequality and social segregation, and is followed by an exploratory examination of location-based inequalities in sixteenth-century Leiden. Since the study is limited to one town, only intra-urban inequalities can be examined. Nonetheless, this allows for a critical assessment of the applicability of the methodology of measuring inter-urban spatial equity in premodern Europe.
LATE MEDIEVAL LEIDEN
Leiden was a relative latecomer in the urban landscape of the Low Countries, but the Dutch town grew rapidly from the fourteenth century onwards. Halfway through that century, it counted an estimated 4,000 inhabitants, but this number increased to about 6,000 in 1440 and further to 12,000 by the end of the fifteenth century. Leiden maintained this approximate population level until the last decade of the sixteenth century (the Spanish Siege of 1573-74 was a turning point, when, after a short slump, the population grew rapidly after 1581).14 The initial growth of the urban population was contained within the town walls of 1389, as the town was only physically expanded again in the early seventeenth century to handle the large influx of migrants. Between 1581 and 1606, the town’s building density increased significantly to cope with the rapid growth of the population.15 The start of the demographic growth of Leiden coincided with the rapid development of Holland’s economy in the fourteenth century.16 The town developed into an important centre of cloth production, involving the import of high-quality English wool and the export of finished products to international markets. The textile sector flourished until the last decade of the fifteenth century. The urban authorities were unable to reverse the decline that subsequently set in due to political uncertainty and changing market conditions, despite the various protective measures that they
14 A. VAN STEENSEL, Mapping Medieval Leiden: Residential and Occupational Topographies, in Trabajar en
la ciudad medieval europea, J.Á. SOLÓRZANO TELECHEA, A. SOUSA MELO eds., Logroño 2018, p. 254. Leiden’s census records from 1574 and 1581 have been recently republished by a group of volunteers led by Martin Hooymans. In 1574, Leiden counted 12,543 inhabitants and 3,043 households, and, in 1581, 12,243 and 2,785 households; M. HOOYMANS, ‘Dataset: Volkstelling Leiden 1581 (deel 1)’, DANS, 2018, https://doi.org/10.17026/dans-zwa-xdxy. The 1581-census has been subject to an elaborate socio-demographic analysis by F. DAELEMANS, Leiden 1581. Een socio-demografisch onderzoek, in “AAG bijdragen”, 19, 1975, pp. 137‑215.
15 F. DAELEMANS, Leiden 1581, cit., pp. 187-188. 2,686 houses were inhabited in 1581, and 4,886 in 1606, an increase of 82 per cent.
16 B.J.P. VAN BAVEL, J.L. VAN ZANDEN, The Jump-Start of the Holland Economy during the Late-Medieval Crisis, c.1350-c.1500, in “The Economic History Review”, 57, 2004, pp. 503‑532.
MEASURING URBAN INEQUALITIES 373
took.17 Other economic activities in and around Leiden were of secondary importance, such as trading, brewing, victualling, manufacturing and servicing.
The economic importance of the drapery sector was reflected in Leiden’s political and social structures. The town’s political and economic elites largely overlapped, and they exerted strict control over the urban economy, excluding organisations of artisans and the labourers from positions of formal political influence, although these groups functioned as occupational brotherhoods in the fifteenth and sixteenth centuries. The coalition of magistrates and ‘industrial capitalists’ managed to implement a repressive wage policy in the textile industry, which in the long run negatively affected the purchasing power of a significant share of the urban labour force.18 The social and economic conditions in late medieval Leiden resulted in a process of proletarianisation, although the distribution of wealth and income was not as skewed as in other European textile centres, mainly because the households belonging to the top tier of wealth distribution were not extraordinarily wealthy from a comparative point of view. A wealth tax of one per cent levied in 1498 shows that 56 per cent of households were living at a subsistence level: 883 out of 3,010 registered households were deemed too poor to contribute or were exempted for other reasons, while the wealth of another 762 households was assessed at less than 25 pounds (equivalent to about a 100 days’ wages of a master mason).19 This meant that, at times, a large share of the urban population relied on social assistance, putting a strain on Leiden’s charitable institutions over the course of the sixteenth century. Dirk Jaap Noordam has calculated that the number of indigent urbanites that received some form of social support (annual distribution of doles of bread and bacon by the town’s main charitable body, the so-called Table of the Holy Ghost) rose from 1,600 in 1495 to 2,530 in 1570 (a steady rise from 13 to 22 per cent of the total population respectively).20
17 N.W.POSTHUMUS, De geschiedenis van de Leidsche lakenindustrie. De middeleeuwen (veertiende tot
zestiende eeuw), The Hague 1908. 18 H. BRAND, P. STABEL, De ontwikkeling van vollerslonen in enkele laat-middeleeuwse textielcentra in de
Nederlanden. Een poging tot reconstructie, in Peasants and townsmen in medieval Europe. Studia in honorem Adriaan Verhulst, J.-M. DUVOSQUEL, E. THOEN eds., Ghent 1995, pp. 203‑222. Historians have disagreed on the question whether Leiden’s economy was capitalistic in nature, or rather an example of an alternative economic system of small commodity production; R.S. DUPLESSIS, M.C. HOWELL, Reconsidering the Early modern Urban Economy: the Cases of Leiden and Lille, in “Past and Present”, 94, 1982, pp. 49‑84; H. BRAND, Urban Policy or Personal Government. The Involvement of the Urban Elite in the Economy of Leiden at the End of the Middle Ages, in Economic Policy since the Late Middle Ages. The Visible Hand and the Fortune of Cities, H. DIEDERIKS, P.M. HOHENBERG, M. WAGENAAR eds., Leicester 1992, pp. 17‑35.
19 D.J. NOORDAM, Leiden in last. De financiële positie van de Leidenaren aan het einde van de Middeleeuwen, in “Jaarboek der sociale en economische geschiedenis van Leiden en omstreken”, 13, 2002, pp. 16-40.
20 Ibid., pp. 19-20; H. BRAND, Sociale omstandigheden en charitatieve zorg, in Leiden tot 1574. De geschiedenis van een Hollandse stad, ed. J.W. MARSILJE, Leiden 2003, pp. 114‑150.
ARIE VAN STEENSEL
374
ECONOMIC DISPARITIES AND SOCIAL SEGREGATION
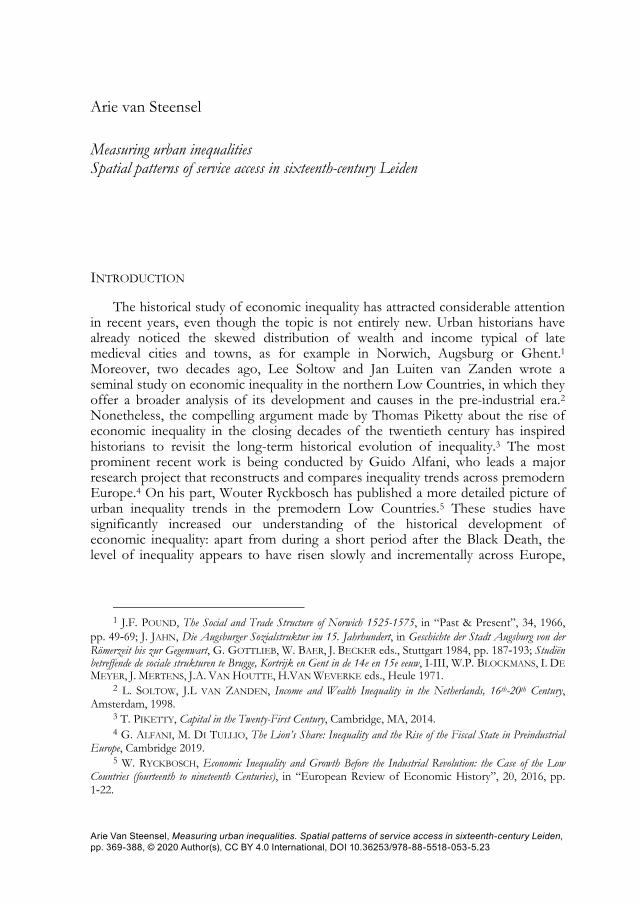
The distribution of wealth and income amongst the households in premodern Leiden has been analysed statistically by several historians, who have drawn on fiscal records extant from the fifteenth century onwards. Soltow and Van Zanden, for example, used the wealth tax of 1498 and a tax on rental values of homes from 1561 for their calculation of wealth and income inequality in Leiden (Gini’s of 0.84 and 0.45 respectively).21
Fig. 1. The spatial distribution of income based on rental values in Leiden, 1561, showing the average income per household per ward (darker is higher)
The available fiscal data have also been analysed from a geographical perspective to uncover spatial patterns of social segregation. Leiden’s eighteen administrative wards (bonnen) are used as units of analysis for this purpose, even though these boundaries were rather arbitrary, and the social composition of the wards too heterogenous, to make meaningful observations about the distribution of
21 L. SOLTOW, J.L VAN ZANDEN, Income and Wealth Inequality in the Netherlands, cit., p. 51.
MEASURING URBAN INEQUALITIES 375
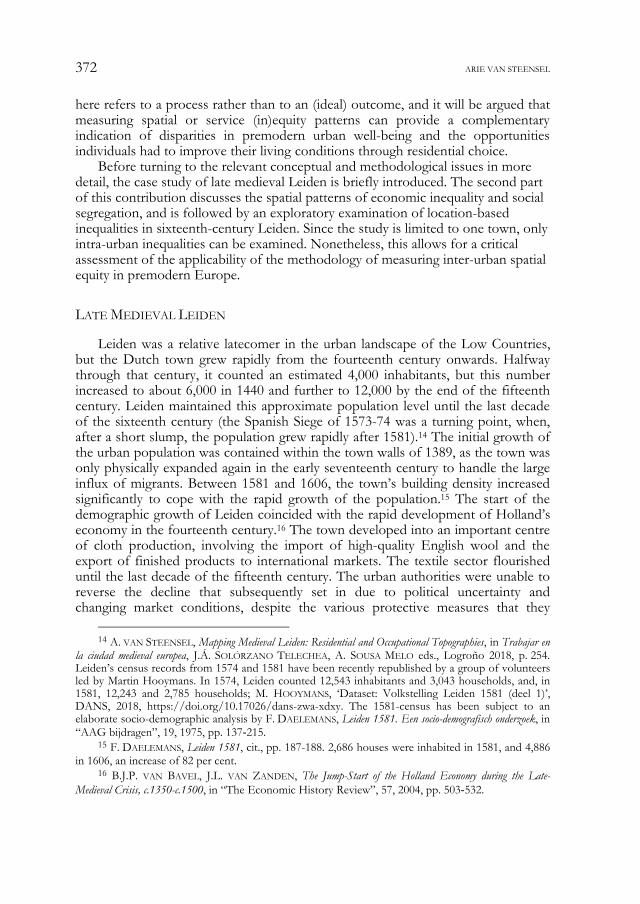
social and economic variables. Hence, spatial patterns of social and economic segregation or clustering remain concealed at the aggregate level of the wards. For this reason, Tim Bisschops has already explored the possibility of a parcel-based analysis of the distribution of wealth and income amongst households to offer a more refined view of changes in the spatial distribution patterns.22
Fig. 2. The spatial distribution of income based on rental values in Leiden, 1561, showing income per household (darker is higher)
A parcel-based historical GIS has been developed for sixteenth-century Leiden
in the meantime, enabling the geo-visualisation and analysis of geo-coded information about the social and economic characteristics of households, such as wealth, income, household size, ownership, tenancy or occupation, which can be
22 T. BISSCHOPS, Ruimtelijke vermogensverhoudingen in Leiden (1438-1561): een pleidooi voor een
perceelsgewijze analyse van steden en stedelijke samenlevingen in de Lage Landen, in “Stadsgeschiedenis”, 2, 2007, pp. 121‑138; A.J. BRAND, Leiden rond 1500. Een pre-industriële stad onder spanning, in “Leids Jaarboekje”, 100, 2008, pp. 95‑120.

ARIE VAN STEENSEL
374
ECONOMIC DISPARITIES AND SOCIAL SEGREGATION
The distribution of wealth and income amongst the households in premodern Leiden has been analysed statistically by several historians, who have drawn on fiscal records extant from the fifteenth century onwards. Soltow and Van Zanden, for example, used the wealth tax of 1498 and a tax on rental values of homes from 1561 for their calculation of wealth and income inequality in Leiden (Gini’s of 0.84 and 0.45 respectively).21
Fig. 1. The spatial distribution of income based on rental values in Leiden, 1561, showing the average income per household per ward (darker is higher)
The available fiscal data have also been analysed from a geographical perspective to uncover spatial patterns of social segregation. Leiden’s eighteen administrative wards (bonnen) are used as units of analysis for this purpose, even though these boundaries were rather arbitrary, and the social composition of the wards too heterogenous, to make meaningful observations about the distribution of
21 L. SOLTOW, J.L VAN ZANDEN, Income and Wealth Inequality in the Netherlands, cit., p. 51.
MEASURING URBAN INEQUALITIES 375
social and economic variables. Hence, spatial patterns of social and economic segregation or clustering remain concealed at the aggregate level of the wards. For this reason, Tim Bisschops has already explored the possibility of a parcel-based analysis of the distribution of wealth and income amongst households to offer a more refined view of changes in the spatial distribution patterns.22
Fig. 2. The spatial distribution of income based on rental values in Leiden, 1561, showing income per household (darker is higher)
A parcel-based historical GIS has been developed for sixteenth-century Leiden
in the meantime, enabling the geo-visualisation and analysis of geo-coded information about the social and economic characteristics of households, such as wealth, income, household size, ownership, tenancy or occupation, which can be
22 T. BISSCHOPS, Ruimtelijke vermogensverhoudingen in Leiden (1438-1561): een pleidooi voor een
perceelsgewijze analyse van steden en stedelijke samenlevingen in de Lage Landen, in “Stadsgeschiedenis”, 2, 2007, pp. 121‑138; A.J. BRAND, Leiden rond 1500. Een pre-industriële stad onder spanning, in “Leids Jaarboekje”, 100, 2008, pp. 95‑120.

ARIE VAN STEENSEL
376
gleaned from various fiscal and census records.23 Unfortunately, these sources often lack a precise identification of location, meaning that some locations have been interpolated only from parcels that can be linked to households with certainty. Figures 1 and 2 show the distribution of income based on the tax on rental values of houses in 1561 at both the aggregate level of the wards and of the parcels.24 The first map shows the relative difference between the average income per household per ward, which varied between the central bon of Wanthuis (average value of 21,5 guilders) and the small, south-eastern bon of Levendaal (average value of 5,3 guilders). Thus, the rental average value in Wanthuis was four times higher than in Levendaal, while the mean value for the whole town was eleven guilders. This gives a very crude impression of the distribution rental values as a proxy for income inequality in Leiden.25 The second map gives a more refined, but difficult to visualise in greyscale, picture of the distribution of income (each dot represents a household, clustered into 32 income categories and linked to a geo-referenced parcel).
The parcel map demonstrates that the ward boundaries indeed conceal the clusters of houses with higher rental values along the town’s main street (Breestraat) and waterways, the River Rhine, which split at the west point of the bon of Burchstreng, the canal that ran north of the bon of Nieuwland, or the canal that separated the bon of Hooigracht from that of Kerkvierendeel. Furthermore, the parcel map puts the low averages in the wards of Rapenburg, Overmare Landzijde and Marendorp Landzijde into perspective, as these newer parts of the medieval town were less densely populated than other peripheral wards. Several religious institutions and public facilities, such as convents and shooting ranges, were located in these three bonnen, which were consequently less densely built and populated.26
23 A. VAN STEENSEL, Mapping Medieval Leiden, cit. 24 Owners and renters of properties assesed at less than six guilders were exempted from the tax
of ten per cent on all real estate, but they are listed in the register. A draft copy can be found at ERFGOED LEIDEN EN OMSTREKEN (ELO), Archief der Secretarie van de stad Leiden I (SAI), no. 993, which was compared to the final version of the register at the NATIONAAL ARCHIEF, DEN HAAG (NA), Staten van Holland voor 1572 (SH), no. 1330.
25 Rental values are used as a proxy for income, although this method is problematic. W.C. BOESCHOTEN, E. VAN MANEN, Een welstandsverdeling van Haarlem in 1543. Kwantitatieve toetsing van een zestiende-eeuwse fiscale bron, in “BMGN - Low Countries Historical Review”, 98, 1983, pp. 523-539, have demonstrated that the assessment of the rental value of properties inhabited by owners was lower than the market rental value of properties rented out. Furthermore, the tax was regressive, because rental values did not increase proportionally with market values of properties. Taking these issues into account, the Gini calculated on the basis of a tax register for Haarlem from 1543 had to be corrected (resulting in an increase of fifty per cent from 0.34 to 0.50). In contrast to Haarlem, the Leiden tax register from 1561 includes the rental values of all houses (also those below the treshold of six guilders).
26 Rapenburg, Nieuwland and Levendaal were the last medieval wards (developed in 1386/1389). However, building and population densities varied strongly within these wards in the sixteenth century. For example, the northern and southern sections of Rapenburg were densely built and inhabited, while the middle section - where the university is now located - remained relatively open, with expensive properties along the canal bordering to the oldest part of Leiden. See, for the
MEASURING URBAN INEQUALITIES 377
The differences in population density are revealed by the census of 1574: the wards of Rapenburg and Marendorp Landzijde counted respectively 74,8 and 104,6 inhabitants per hectare, while the eastern, older wards of Sint Nicolaasgracht and Levendaal had ratios of respectively 120,7 and 144,9 (mean average for Leiden was 120,7 inhabitants per hectare).27 The wealthiest ward was the most densely populated, as Wanthuis counted 201,3 inhabitants per hectare, although in general the correlation between average income and population density was not very strong.
Finally, as other urban historians have already pointed out, the geographic distribution of income inequality in sixteenth-century Leiden problematises Gideon Sjoberg’s theory about the spatial organisation of pre-industrial cities that proposes a concentric model with social degradation extending from core to periphery. The spatial configuration of premodern towns was in fact not characterised by static social or occupational zoning, resulting in a strict social segregation between groups, but was instead varied, showing patterns of social heterogeneity and change over time.28 In the case of Leiden, the average numbers revealing the distribution of wealth and income apparently confirm that the wealthiest inhabitants resided in the central bonnen: the oldest parts of town, where the town’s most important churches were located, in Zevenhuizen and Kerkvierendeel; beside the town hall in Wanthuis; the comital keep in Burchstreng; and the comital court (later the municipal prison) in Over ‘t hof. The poorer households, on their part, were overrepresented in the peripheral wards of Overmare Landzijde, Sint Nicolaasgracht, and parts of Rapenburg and Niewland.29 However, by zooming in to the level of the parcels, several exceptions to this broad pattern can be detected. First, several wealthy entrepreneurs lived outside the central wards; a significant number of drapers, for example, lived in Nieuwland, where the (uninhabited, as shown by the dot-map) tenter fields (raamlanden) were located, with the frames on which cloth was dried and stretched. The brewers were another example; they were scattered over the town, along major waterways, as their industry required a constant supply of water. Their choice of residence, as well as those of other artisans and merchants, was largely determined by their economic activities and needs, the presence of the necessary physical infrastructure, and, sometimes, the (environmental) regulations made by the town
morphological development of Leiden, H. VAN OERLE, Leiden binnen en buiten de stadsvesten: de geschiedenis van de stedebouwkundige ontwikkeling binnen het Leidse rechtsgebied tot aan het einde van de Gouden Eeuw, 2 vols, Leiden 1975, and, for Rapenburg in particular, see TH.H. LUNSINGH SCHEURLEER, C.W. FOCK, A.J. VAN DISSEL, Het Rapenburg: geschiedenis van een Leidse gracht, 6 vols, Leiden 1986-1989.
27 These observations remain the same if only the built area is taken into account. See, for the source, ELO, SAI, no. 24; D.E.H. DE BOER, R.C.J. VAN MAANEN, De volkstelling van 1574: Leiden ten tijde van het beleg, Leiden 1986.
28 G. SJOBERG, The Preindustrial City: Past and Present, New York 1960. Cf. J.E. VANCE, Land Assignment in the Precapitalist, Capitalist, and Postcapitalist City, in “Economic Geography”, 47, 1971, pp. 101-120; J. LANGTON, Residential Patterns in Pre-Industrial Cities: Some Case Studies from seventeenth-Century Britain, in “Transactions of the Institute of British Geographers”, 65, 1975, pp. 1-27.
29 See, for the wealth tax of 1498, ELO, SAI, no. 578; A. BRAND, Leiden rond 1500, cit., pp. 103-105. The register groups the tax payers per ward, making it difficult to link them to specific parcels.

ARIE VAN STEENSEL
378
council. Overall, occupational clustering in Leiden, with its weak guild structure, was limited in the late medieval and early modern era.30
Fig. 3. The spatial distribution of occupations, clustered according to social status (HISCLASS), in Leiden, 1561 (lower status is indicated by darker dots)
The plotting of the mentioned 1,386 occupations of the heads of households from the tax register of 1561, classified into the twelve categories of HISCLASS, shown in Figure 3, illustrates the spatial dispersion of occupations and the weak socio-spatial segregation in Leiden.31 No obvious occupational clusters emerge
30 For a comparative perspective, see the case of late medieval London, J. COLSON, Commerce,
Clusters, and Community: A Re-Evaluation of the Occupational Geography of London, c. 1400-c. 1550, in “The Economic History Review”, 69, 2016, pp. 104‑130.
31 The occupations and professions have been standardised and coded according to the Historical International Classification of Occupations (HISCO) scheme; M.H.D. VAN LEEUWEN, I. MAAS, A. MILES, HISCO. Historical International Standard Classification of Occupations, Leuven 2002. For the sake of visual clarity the occupations have also been coded using HISCLASS, even though this classifiction system is not entirely satisfying when applied to premodern case studies; M. VAN LEEUWEN AND I. MAAS, HISCLASS. A Historical International Social Class Scheme, Leuven 2011.
MEASURING URBAN INEQUALITIES 379
from the analysis, although unskilled workers, such as dyers and fullers, who generally lived away from their workplace, were overrepresented in the poorer neighbourhoods. Agrarian workers (gardeners, fruit-growers) and fishers also predominantly lived in the peripheral wards, where more space was available for farms, gardens and orchards.
The second reason why residential choices resulted in socially mixed areas was related to several other considerations that were less economic in nature. Individual choices were determined or informed by factors such as property rights, housing quality, the market for real estate, and spatial factors such as the propinquity of public services and symbolic locations.32 Members of the urban political elites tended to have persistent location preferences, as they clustered around or close to places of power in the oldest parts of town, even though the ownership of real property, land in particular, was not a defining feature of this group. In the case of Leiden, prominent members of the political elite also built their stately homes, after Rapenburg was added to the town in 1389, along the new canal opposite the older wards of Over ‘t hof and Zevenhuizen.33 This connects to the last reason: the urban elites, middling groups and poor lived in close proximity to each other, as poorer house owners and tenants could be found in all wards, especially in the back alleys of streets with more expensive properties.34 The parcel-level analysis of the tax register of 1561 highlights the fact that economic inequality did not produce patterns of spatial social segregation in absolute terms, although clusters of rich and poor households did exist. If property ownership is taken as an indicator of wealth, the visualisation in Figure 4 of spatial patterns of ownership and tenancy in Leiden in 1561 confirms the predominance of socially mixed neighbourhoods (63.3 per cent of the 2,786 properties had owner occupants).35 This more refined view also problematises the idea that the poorest households lived in low-quality tenement houses and rooms in the newer, peripheral neighbourhoods of the town.
32 See, for an in-depth analysis of property rents confirming that market forces largely shaped the
medieval property market: M. CASSON, C. CASSON, Location, Location, Location? Analysing Property Rents in Medieval Gloucester, in “The Economic History Review”, 69, 2016, pp. 575‑599. A broader discussion of social segregation and residential preferences can be found in: C. LESGER, M.H.D. VAN LEEUWEN, Residential Segregation from the sixteenth to the nineteenth Century: Evidence from the Netherlands, in “Journal of Interdisciplinary History”, 42, 2012, pp. 333‑369.
33 H. BRAND, Over macht en overwicht: stedelijke elites in Leiden (1420-1510), Leuven 1996, pp. 205‑208.
34 D. DENECKE, “Social Status and Place of Residence in Preindustrial German Towns: Recent Studies in Social Topography”, in Urban Historical Geography: Recent Progress in Britain and Germany, D. DENECKE, G. SHAW eds., Cambridge 1988, p. 136; N.A. ECKSTEIN, Addressing Wealth in Renaissance Florence: Some New Soundings from the Catasto of 1427, in “Journal of Urban History”, 32, 2006, pp. 711‑728; C. ARNAUD, Topographien des Alltags: Bologna und Straßburg um 1400, Berlin 2018.
35 Cf. W.C. BOESCHOTEN, E. VAN MANEN, Een welstandsverdeling van Haarlem in 1543, cit., pp. 526.

ARIE VAN STEENSEL
380
Fig. 4. The spatial distribution of owner occupants (dark dots) and tenant households (light dots) in Leiden, 1561
This snapshot of the spatial distribution of income inequality in Leiden in 1561 raises two other issues that have not yet been sufficiently resolved. First, although wealth was an important determinant of choice of place of residence, its interplay with other relevant hierarchies based on status or occupation are less well understood. This also relates to the question of intra-urban residential mobility: were urbanites able to improve their position by moving within the town (for example, from poorer to wealthier neighbourhoods, or from tenancy to house ownership), or were socio-economic inequalities persistent over time, and spatially ingrained? The preliminary evidence suggests that the spatial distribution of economic resources (and likely the level of economic inequality itself) remained relatively stable in the second half of the fifteenth and throughout sixteenth centuries, during which Leiden’s economic and demographic expansion stalled, yet residential patterns never became entirely solidified, due to structural spatial, legal, social and economic dynamics. A comparison of records from 1581 (census register) and 1585 (tax register called Vetus) shows that 48.6 per cent of the houses
MEASURING URBAN INEQUALITIES 381
had new residents during this relatively short period, but that mobility was much higher in poorer wards such as Nieuwland (65 per cent) than in wealthier wards such as Wanthuis (27.5 per cent).36
The long-term evolution of the spatial distribution of wealth and income in late medieval and early modern Leiden is a second issue that needs further attention. Although Bisschops argues that the spatial patterns of wealth distribution and social segregation changed halfway through the fifteenth century, from a broad division between wealthier wards below and poorer wards above the River Rhine to a more concentric model typical of a preindustrial urban society with richer central and poorer outer neighbourhoods, more empirical research from a longitudinal perspective is required to confirm this hypothesis.37 The evolution of socio-spatial relations was presumably shaped by the major physical expansion of the town in the fourteenth century, as well as by phases of demographic expansion and subsequent contraction that took place in the early fifteenth century and in the late sixteenth centuries. Moreover, the question is to what extent Leiden’s late medieval and early modern housing market co-evolved with the demand for lower-cost housing from migrants who were attracted by the chances of employment in the textile industry.
SPATIAL EQUITY, SERVICE ACCESS AND ROUTE NETWORK ANALYSIS
The spatial distribution of the social and economic attributes of households has long been examined by historians specialising in urban historical geography or social topography with the aim of charting patterns of social segregation or economic clustering.38 However, these studies prove that it is difficult to move from a description of differentiations in spatial configurations that express social and economic hierarchies between or within towns to arrive at a more analytical approach that understands space as an independent variable that shapes social and economic outcomes at the individual and collective levels.39 How, for example, did access or denial of access to certain locations and spaces affect the social and economic well-being of urbanites? Answering this question requires dealing with the methodological challenges of measuring spatial equity patterns and linking them to social and economic outcomes.40 With regard to the case at hand, the recent
36 F. DAELEMANS, Leiden 1581, cit., pp. 167-168. 37 T. BISSCHOPS, Ruimtelijke vermogensverhoudingen, cit., p. 126; A.J. BRAND, Leiden rond 1500, cit., pp.
105-113. 38 D. DENECKE, G. SHAW eds., Urban Historical Geography: Recent Progress in Britain and Germany,
Cambridge 1988; M. MEINHARDT, A. RANFT eds., Die Sozialstruktur und Sozialtopographie vorindustrieller Städte, München 2005.
39 B. HILLIER, N. RAFORD, Description and Discovery in Socio-Ppatial Analysis: the Case of Space Syntax, in The SAGE Handbook of Measurement, G. WALFORD, E. TUCKER, M. VISWANATHAN eds., London 2010, pp. 265-282.
40 Even in studies on inequality in contemporary societies the relation between household income or wealth inequality and spatial inequality is not yet properly addressed. See, for example, S.

ARIE VAN STEENSEL
382
studies on economic inequality (which generally recognise the importance of spatial inequality on a global and regional scale)41 could be complemented by socio-spatial approaches to analysing the spatial aspects and geographic crystallisation of socio-economic inequalities. With the help of new digital methods it is possible to perform geo-statistical analyses on the basis of extant fiscal records, but also to measure differences in well-being at a local level using alternative indicators, most notably relative access to services or exposure to hazards in an urban context.42 Hence, the reconstruction of Leiden’s social topography leads to the question of the extent to which the observed spatial configurations shaped and were shaped by social and economic disparities.
The concept of spatial equity can be helpful to understand the effects of social and economic hierarchies on the well-being of urbanites, but it has different meanings in the literature. On the one hand, it is simply used to express the spatial distribution of resources in a specified area; on the other, it is defined as the geographic access of individuals to specific services or facilities (or, in a negative way, the extent to which they are geographically exposed to certain hazards or experienced social disadvantages).43 Both perspectives are related to each other, because spatial equity and the distribution of resources often correlate. The distance-based approach is most relevant here, taking the available source material for medieval Leiden into account. Nevertheless, it should be acknowledged that spatial accessibility to (public) services and facilities in terms of absolute or real distance was never the only factor that determined their affordability and availability to individuals. Moreover, distance was never an absolute obstacle in a small town like late medieval Leiden, as all possible destinations were within walking distance, but graded differences in accessibility between different parts of the town did exist. It is less meaningful to measure individual spatial access to services, because not all urbanites had the same institutional access rights, and it is difficult to establish and differentiate between specific individual demands. In contemporary societies, for example, spatial equity is typically deemed important with regard to the provision of health care, local administration, or access to public resources, and social scientists and policy makers refer to the notion of spatial justice that they derive from the work of geographers, more than to economic theories.44
CHAKRAVORTY, A Measurement of Spatial Disparity: The Case of Income Inequality, in “Urban Studies”, 33, 1996, pp. 1671‑1686.
41 R. KANBUR, A.J. VENABLES eds., Spatial Inequality and Development, Oxford 2005. 42 See, for example, D. SCHOTT, Infrastrukturnetze und soziale Ungleichheit: Die historische Perspektive, in
“Moderne Stadtgeschichte”, 2, 2017, pp. 66‑78. 43 E. TALEN, Geovisualization of Spatial Equity, in The SAGE Handbook of GIS and Society, T.
NYERGES, H. COUCLELIS, R. MCMASTER eds., London 2011, pp. 458‑479; L. LOBAO, G. HOOKS, A. TICKAMYER eds., The Sociology of Spatial Inequality, Albany 2007; J. Stillwell, C. Norman, C. Thomas, P. Surridge eds., Spatial and Social Disparities, Dordrecht 2010.
44 See, for example, F. GAO, W. KIHAL, N. LE MEUR, M. SOURIS, S. DEGUEN, Assessment of the Spatial Accessibility to Health Professionals at French Census Block Level, in “International Journal for Equity in Health”, 15, 2016, n. 125; M. HALÁS, P. KLAPKA, V. BAČÍK, M. KLOBUČNÍK, The Spatial Equity
MEASURING URBAN INEQUALITIES 383
In the case of premodern towns, in contrast, access to (public) services and facilities such as markets, hospitals, courts or schools was discriminatory through formal and informal barriers. These services were less public and more exclusionary than modern understandings of public goods or services presume. Hence, public services might be broadly understood as ‘facilities provided by urban agents’ to urban residents in the realms of ‘economic regulation, public administration, public security, public welfare and public works’.45 Spatial equity in accessing these services, then, can be measured in a number of ways: equitable distribution based on equality, need, demand or price. The demand-based approach is most appropriate with regard to the premodern context, as it seeks to match the distribution of available services to populations with specific socio-economic characteristics that need access to them.46 In short, by measuring spatial equity, it is possible to determine whether the access to certain services was discriminatory and if spatial patterns in accessibility were linked to socio-economic variables. If public works are taken as an example, the question is whether inhabitants of all parts of the town profited equally from services like street maintenance or sanitation policies.
The degree of urban spatial equity can be established and geo-visualised by mapping the places of residence of urbanites (parcels) and the locations of services or facilities, and by subsequently calculating the actual distance (in metres or walking time) between these points by means of a route network analysis (for this case study, Dijkstra’s Shortest Path First algorithm was used).47 The historical GIS for Leiden, based on the so-called Street and Canal Books (Grachten- en Stratenboek), which was produced in the last two decades of the sixteenth century, offers a starting point for a route network analysis.48 The points of origin are placed in the parcels and linked to the correct adjacent street(s) or alley(s). The destination points are kept rather broad in this exploratory analysis and categorised into four types of services: administrative (for example, the town hall), economic (markets), social (hospitals) and cultural (churches). A total number of 52 service locations have
Principle in the Administrative Division of the Central European Countries, in “PLOS ONE”, 12, 2017, e0187406; P.Y. TAN, R. SAMSUDIN, Effects of Spatial Scale on Assessment of Spatial Equity of Urban Park Provision, in “Landscape and Urban Planning”, 158, 2017, pp. 139‑154.
45 M. VAN DER BURG, M. VAN DER HEIJDEN, E. VAN NEDERVEEN MEERKERK, G. VERMEESCH, Introduction. The Rise of Public Facilities in the Low Countries, 1400-1800, in Serving the Urban Community. The Rise of Public Facilities in the Low Countries, M. VAN DER BURG, M. VAN DER HEIJDEN, E. VAN NEDERVEEN MEERKERK, G. VERMEESCH eds., Amsterdam 2009, p. 11.
46 E. TALEN, Geovisualization of Spatial Equity, cit., pp. 462-463. 47 Special thanks are due to Thomas Vermaut who conducted these calculations. See, for the
algorithm, C. CHADHA, S. GARG, Shortest Path Analysis on Geospatial Data Using PgRouting, in International Conference on Innovative Computing and Communications, S. BHATTACHARYYA, A.E. HASSANIEN, D. GUPTA, A. KHANNA, I. PAN eds., Singapore 2019, pp. 201‑214.
48 A. VAN STEENSEL, Mapping Medieval Leiden, cit.; P.J.M. DE BAAR, Jan van Hout en zijn Stratenboek en Grachtenboek, in Ups en Downer. Bundel artikelen bij het afscheid van mr. W. Downer als gemeentearchivaris van Leiden, Leiden 1985, pp. 5‑18. In 1583, when the first maps were drawn on instigation of Jan van Hout, the raamlanden were already moved outside the town walls, and houses were built in this part of Nieuwland.

ARIE VAN STEENSEL
384
been identified for sixteenth-century Leiden, and they are treated equally in the analysis, even though it is possible to further differentiate between them according to type and quality, as well as to weigh the possible walking routes.49
Fig. 5. Average real distance to all service locations in Leiden, 1583 (lighter dots indicates easier access than darker dots)
The results of the route network analysis are shown on a map (Figure 5), which lays out the aggregate service accessibility in Leiden during the last quarter of the sixteenth century. The average travel distance from each parcel to all identified public services and facilities is calculated (lighter dots indicate relatively easier access than darker dots). The real distance in meters is expressed in the results. Each parcel’s frontage is connected to the route network consisting of streets and alleys, and waterways and bridges are taken into consideration, although the route network is not weighed, for example, by distinguishing alleys from main streets. The spatial equity pattern that follows from the analysis of average real travel distances is different from the pattern of spatial integration that can be calculated through a space syntax analysis, a method of expressing the relative accessibility of
49 E. TALEN, Geovisualization of Spatial Equity, cit., pp. 465-469.
MEASURING URBAN INEQUALITIES 385
spaces in a certain area.50 This is explained by the fact that the locations of services and the street pattern in Leiden, as in any other town, developed independently from each other, meaning that it is essential to take the development of both the urban morphology and the distribution of services into account when interpreting both patterns of spatial equity and spatial integration.
Fig. 6. Minimum real distance to economic services in Leiden, 1583 (lighter dots indicate easier access than darker dots)
Figure 5 shows that public services and facilities were mostly located in the
central, western and northern parts of Leiden, and not in the more densely populated and comparatively poorer south-eastern wards. The administrative and economic services were concentrated in the four oldest, thirteenth-century bonnen of Leiden, Wanthuis, Wolhuis, Vleeshuis and Gasthuis, along the south bank of the River Rhine, together with the comital precinct of Over het hof and the ecclesiastical precinct Zevenhuizen, where the urban settlement first emerged in the twelfth and thirteenth centuries. The three churches were slightly offset from this centre, as
50 See, for an example of the application of this method to a historical case study, V. VALENTE,
Space Syntax and Urban Form: the Case of Late Medieval Padova, in “PCA. Post classical archaeologies”, 2, 2012, pp. 147‑186.
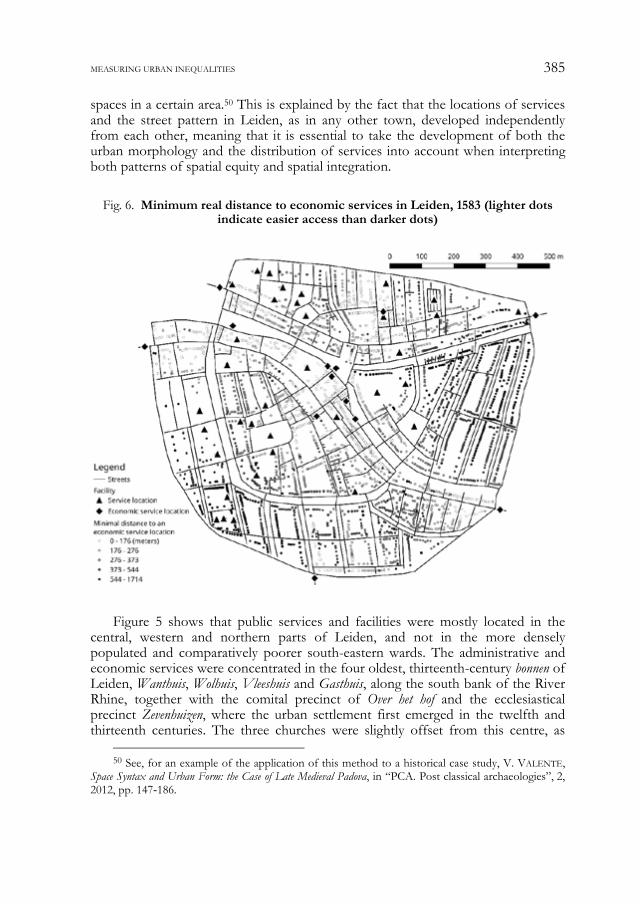
ARIE VAN STEENSEL
386
they were more closely situated in the three original settlements out of which Leiden was formed, catering to the needs of their parishioners rather than the urban community as a whole. Furthermore, the majority of the 28 monasteries, hospitals, almshouses and orphanages were located in the newer parts of Leiden – the northern and south-western wards Overmare Landzijde, Marendorp Landzijde and Rapenburg – which were founded during the town’s fourteenth-century expansion. These parts of Leiden were less densely built and populated in contrast to the younger wards at the town’s eastern side. In particular, the inhabitants of the bonnen of Gansoorde en Sint Nicolaasgracht were disadvantaged when it came to service access. This pattern of aggregate spatial inequity presumably evolved slowly throughout the fifteenth and sixteenth centuries, as the town’s main street network was in place by the end of the fourteenth century and the location of services (markets, churches, administrative buildings) were mostly (semi-)permanent. The distribution and function of services, however, could change over time. All convents in Leiden, for example, lost their religious role in the last quarter of the sixteenth century due to religious change.
Patterns of spatial equity change if specific services are selected or if shortest rather than average travel distances to all services are calculated. Figure 6, for example, shows the minimum distance from parcels to selected economic services (markets, access gates, the weigh house). If this map is compared to the one depicting aggregate service accessibility (Figure 5), the parcels closest to Leiden’s main streets (Breestraat and Haarlemmerstraat) and waterways (River Rhine) were more favourably located from a general economic perspective. The selected economic facilities were of course not of daily importance to all inhabitants, and the analysis could potentially be extended by adding data on shops and workplaces, such as bakers and brewers, which are not included following the used definition of public services. Here, economic service accessibility is measured at an aggregate level to establish how accessible Leiden was in the late sixteenth century.
The next questions concern for which inhabitants the established patterns of spatial equity meant better access, and whether the level of access was related to the socio-economic characteristics of the inhabitants and their specific demands. At this point, the research results are still inconclusive. In theory, a relation between spatial equity patterns and the spatial distribution of resources and status (economic inequality and social segregation) can be hypothesised, since it can be assumed that wealthier urbanites could afford housing in the more accessible parts of Leiden, resulting in a positive correlation between service accessibility and the spatial distribution of income. Statistical analysis, however, does not show any significant correlation between the distribution of rental values (as a proxy for income) in 1561 and the established patterns of spatial service access, and only a weak statistical significance can be observed if the average rental value per parcel is aggregated per ward. The explanation for this negative outcome is that residential choice was determined by multiple factors, such as individual (non-economic) preferences, the dynamics of the property market, or the urban morphology and the distribution of services. Likewise, no significant correlation can be established between population density, calculated on the basis of the census of 1574, and spatial equity patterns. Although population density could affect service access, the size of Leiden was not
MEASURING URBAN INEQUALITIES 387
that large that distances exceeded the walkability threshold within the town walls. This does not mean that service access was not a factor in the choice of residence of urbanites (whether owners or tenants), but the analysis of the aggregated data does not capture the ways in which the urban spatial organisation interplayed with the demands of specific households in premodern medieval Leiden.
Mapping the spatial accessibility of services provides a novel way of determining the differential effects of the redistribution of public resources, even though these were minor because social expenditure in premodern societies was limited and its funds were collected by regressive fiscal systems.51 Although the aim of measuring the accessibility of services for different households in Leiden, taking their location and economic status into account, has not yet been achieved, the established general performance of the town in terms of spatial equity and service accessibility can be compared over time or with other places.52 Benjamin Stanley and his colleagues have explored this approach in a seminal contribution on service access in premodern cities across the globe. They have measured and compared the access to religious, commercial and political services for a number of case studies, for which they have used archaeological rather than written records, on the basis of which they conclude that the size, shape and spatial structure of urban settlements determined the access to public services as much as did residential patterns (elite clustering) or the political decision-making about the location of certain facilities. Elites generally did have better access to services, but more densely built urban centres also demonstrated a more equitable access to services.53 Methodologically, they chose to take neighbourhoods as an aggregate point of origin and measured the Euclidean distance to the nearest service. This approach is appropriate for the comparative scope of their study, but it is a rather crude way of measuring spatial equity at an intra-urban level. The parcels and route networks in Leiden’s historical GIS offer more precise calculations of the real distance to facilities and public services, but the results of the calculation of spatial equity would provide more meaningful results in a study that compares towns of different sizes and structures.
CONCLUDING REMARKS
In sixteenth-century Leiden, place of residence was determined by social and economic factors, and it had a differential impact on access to services and well-being in general. This exploration of service accessibility in this town has not provided conclusive findings about the use of the concept of spatial equity and historical GIS as a complementary method to measure inequality in premodern
51 G. ALFANI, M. Di Tullio, The Lion’s Share, p. 169. To give an impression, the town council of
Leiden spent 14.2 per cent of its total expenditure in 1560 on administration and public services. This was more than the 8.3 per cent of the budget that was used to meet the princely fiscal demands. However, these amounts varied considerably per year; ELO, SAI, no. 631 (town accounts).
52 E. TALEN, Geovisualization of Spatial Equity, cit., p. 470. 53 B.W. STANLEY, T.J. DENNEHY, M.E. SMITH, B.L. STARK, A.M. YORK, G.L. COWGILL, J.
NOVIC, J. EK, Service Access in Premodern Cities, cit.

ARIE VAN STEENSEL
388
urban societies. Although the sources and the digital methods are available to conduct such a spatial analysis, its application should be further refined to determine the factors that shaped service access (as a proxy for the redistribution of resources) at a household level. The location of services in Leiden, whether dispersed or clustered, was determined by geographical factors, the path-dependent development of the urban settlement, long-established residential patterns, and political decision-making about public service provision. Although the geographic distribution of wealth in Leiden shows limited overlap with the spatial pattern of average access of urbanites to services, a more specific analysis that takes the wealth and occupation of property owners or tenants into account might still reveal significant relations. Like the spatial distribution of services, the spatial patterns of economic inequality and social segregation were relatively stable in late medieval Leiden. Historical processes, however, induced change and influenced the lives of residents. First, tenants, and, albeit to a lesser extent, property owners, appear to have been relatively mobile, implying that they could improve their living conditions by moving into new neighbourhoods. Second, the town’s population and building density changed over time, affecting the living conditions of residents differentially. Finally, the dependence on (public) services varied according to economic conditions and social position.
By tying the bits of information about wealth, occupation, type of housing and service access together with broader process of social and economic change, it becomes possible to determine the meaning of place to the inhabitants of late medieval Leiden: on the one hand, it reflected their political and socio-economic position in urban society; on the other, the town’s spatial organisation shaped both the choices that households made and their experience of socio-spatial boundaries. Thus, a geo-visualisation of inequalities at the micro-level complements macro-statistical analyses in the sense that it ‘moves the user from the GIS world of observation to one of habitation where the material world is experienced through our own embodiment and sense of “being in the world.”’54 More importantly, a spatial approach to urban inequality potentially offers a method to analyse the distribution of resources and access to services as an indicator of the effect of economic inequality on broader well-being in medieval towns. This approach also draws on various historical sources and archaeological findings, making it applicable to cases that are less replete with the type of fiscal records required for statistical analyses of social and economic disparities.
54 D.J. BODENHAMER, Beyond GIS: Geospatial Technologies and the Future of History, in History and GIS,
A. VON LÜNEN, C. TRAVIS eds., Dordrecht 2013, p. 1‑13.
Stef Espeel, Sam Geens1
Feeding inequalities: the role of economic inequalities and the urban market in late medieval food security. The case of fourteenth-century Ghent
1. INTRODUCTION
Food security is the situation where “all people, at all times, have physical, social, and economic access to sufficient, safe, and nutritious food that meets their dietary needs and food preferences for an active and healthy life.”2 The definition, put forward by the Food and Agricultural Organization (hereafter FAO) in 1996, stressed the importance of a long-term, socially inclusive and multidimensional approach to the topic and replaced an older vision that focused mainly on the availability of food.3 Scholars working on contemporary food security have since largely adopted this theoretical framework to better understand why certain groups or societies are more vulnerable to undernourishment than others. For example, recent research has focused on the unequal impact of (future) climate change.4 In contrast, historians studying the pre-modern period have been much slower to integrate new perspectives, which is unfortunate given that history is the instrument par excellence to assess long-term evolutions. Despite repeated calls for new approaches by some scholars, especially famine experts, empirical studies on pre-modern food security remain rare to this date.5
1 Both authors are affiliated with the Centre for Urban History, University of Antwerp. We
gratefully acknowledge the support of the Flemish Research Foundation FWO for the project ‘Shock Cities? Food Prices and Access to Food in Flemish Cities in an Age of Crises (1280-1370)’ and the project ‘A Golden Age of labour? Economic inequality and labour income after the Black Death: Flanders and Tuscany compared (1350-1500).’
2 FAO, Rome declaration on World Food Security, Rome 1996. For other definitions of food security, see: M. SMITH, J. POINTING, S. MAXWELL, Household Food Security, Concepts and Definitions: An annotated Bibliography, Brighton 1993.
3 Notice that the definition still includes the availability of food as one variable of food security (i.e. “physical access to sufficient food”). M. SASSI, Understanding Food Insecurity, Cham 2018, pp. 89-120.
4 Both in academics and policy-making. For example: M. NILES, M. BROWN, A multi-country assessment of factors related to smallholder food security in varying rainfall conditions, in “Scientific Reports”, 7, 2017, pp. 1-11.
FAO, IFAD, UNICEF, WFP and WHO, The State of Food Security and Nutrition in the World. Building climate resilience for food security and nutrition, Rome 2018, pp. 38-111.
5 Some strong advocates include but are not limited to: M. BOURIN, F. MENANT, Les disettes dans la conjoncture de 1300 en Méditerranée occidentale, in La conjoncture de 1300 en Méditerranée occidentale, M. BOURIN, F. MENANT, J. DRENDEL eds., Rome, 2004, pp. 9-33; P. SCHOFIELD, Approaches to famine in medieval England, in Crisis alimentarias en la Edad Media, ed. P.B. I MONCLÚS, Lleida 2013, pp. 71-86; IDEM, De Labrousse a Sen. Modelos de causalidad y paradigmas interpretativos de las crisis alimentarias preindustriales, in