assessing national competitivenessmishal.com.pk/wp-content/uploads/2017/09/pakistans...2017/09/27...
TRANSCRIPT


Assessing National CompetitivenessThe Global Competitiveness Report 2017-201827 September 2017
Amir JahangirChief Executive OfficerMishal PakistanA Country Partner Institute of the Global Competitiveness and Benchmarking Network, World Economic Forum

Credibility Lab @ Mishal:
§ Mishal Pakistan through its Credibility Lab’s initiative is working with policymakers, researchers, academia media and industry professionals on creatingnew industry benchmarks.
§ The Credibility Lab undertakes the following initiatives in Pakistan:§ As a Country Partner Institute of the World Economic Forum, works on the
following:§ The Global Competitiveness Report§ The Travel & Tourism Competitiveness Report§ The Global Enabling Trade Report§ The Global Gender Gap Report§ The Human Capital Report§ The Financial Development Index Report§ The Global Information Technology Report§ The Global Risks Reports§ EOS serves as the basis for Corruption Perception Index by TI§ The AGAHI Awards – First Journalism Awards
in Pakistan – Framework for Ethical Journalism§ Media Development Trust§ Trust Gold Medal Recognition for Public Interest Communication§ Ethical Audit of News Media (Framework)§ Media Credibility Index
4
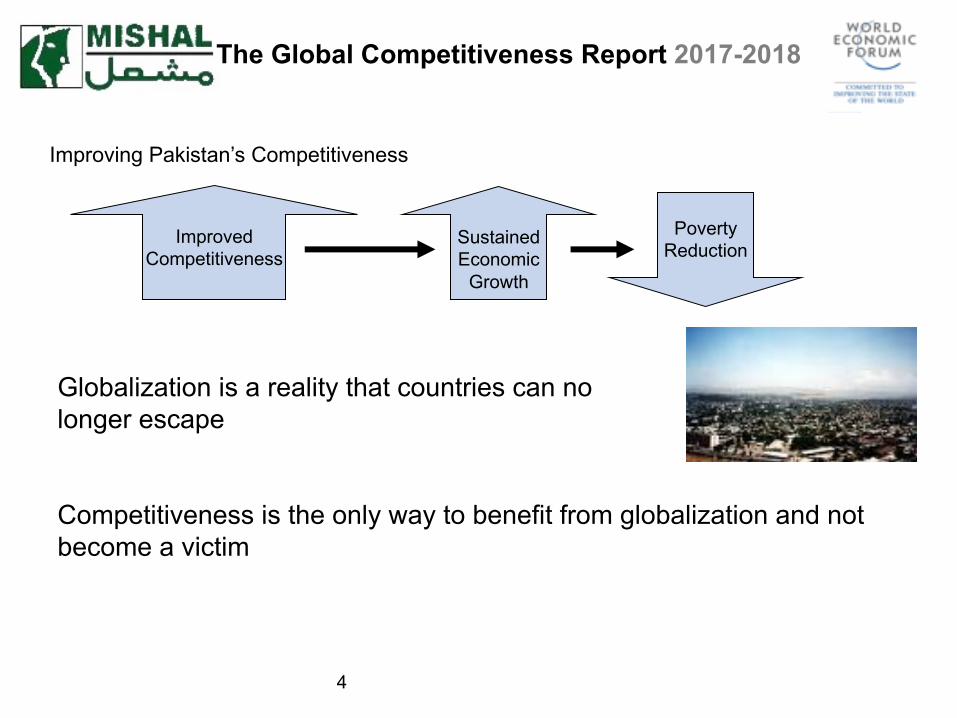
Globalization is a reality that countries can no longer escape
Competitiveness is the only way to benefit from globalization and not become a victim
Improving Pakistan’s Competitiveness
Sustained Economic
Growth
Poverty Reduction
Improved Competitiveness
The Global Competitiveness Report 2017-2018

The World Economic Forum’s Global Competitiveness Report is the Most Influential Ranking of a Country’s Competitiveness and it Effects Pakistan's Image in the World Among Business, Government and Financial Leaders
Understanding and Monitoring the Rankings is Important
Improved Competitiveness Leads to Sustained Economic Growth Which Has Proven to Be Effective in Poverty Reduction and Employment Generation
Sustained Economic
Growth
Poverty Reduction
Improved Competitiveness
The Global Competitiveness Report 2017-2018
The Global Competitiveness Report 2017-2018
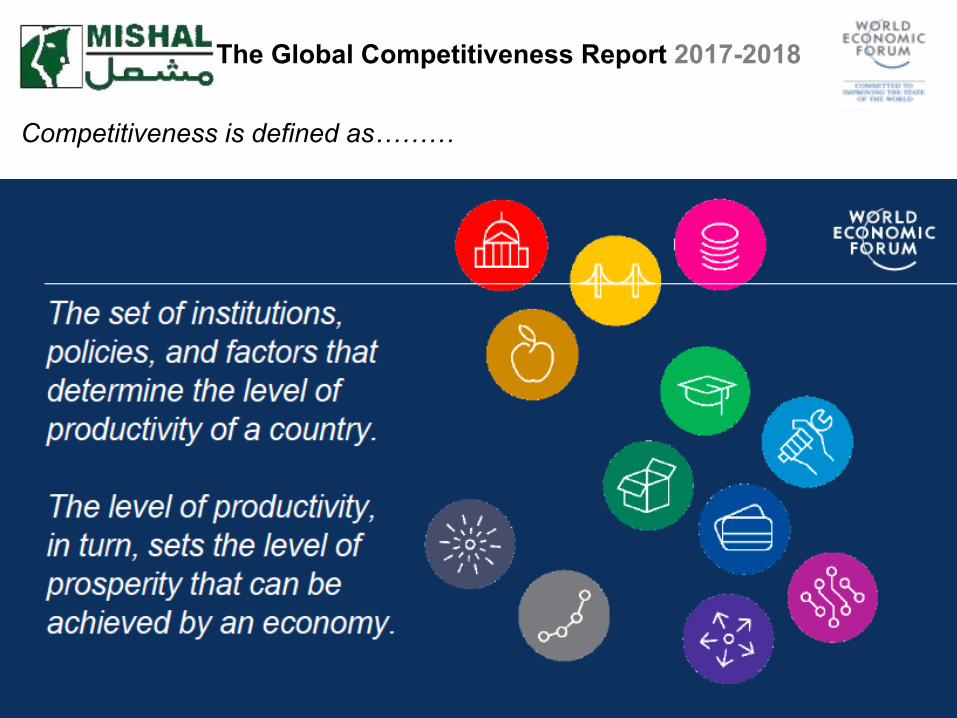
Competitiveness is defined as………

The Global Competitiveness Report 2017-2018
The Global Competitiveness Index measures………

Basic requirements
1.Institutions
2.Infrastructure
3.Macroeconomic environment
4.Health and primary education
Efficiency enhancers
5.Higher education and training
6. Goods market efficiency
7. Labor market efficiency
8. Financial market development
9. Technological readiness
10. Market size
Innovation and sophistication factors
11. Business sophistication
12. Innovation
The Global Competitiveness Index
The Global Competitiveness Report 2017-2018

The Global Competitiveness Report 2017-2018

The Global Competitiveness Report 2017-2018

The Global Competitiveness Report 2017-2018

26/09/2017
Top20
TheGlobalCompetitivenessReport2017-2018
Bottom
20

26/09/2017
SouthAsiaCompetitivenesshasimprovedacrossmostcountriesinSouthAsia,inparticularinthetwoHimalayancountriesofBhutan(82nd,up15)andNepal(88th,up10).
Onasimilarlypositivetrend,Pakistan(115th,upseven)andBangladesh(99th,upseven)havebothimprovedtheirscoresacrossallpillarsofcompetitiveness.
BothIndia(40th,downone)andSriLanka(85th,down14),Corruptionandinefficientgovernmentbureaucracyremainsthekeyfactorforhindranceinprogress.
UpgradingICTinfrastructureandincreasingICTuseremainamongthebiggestchallengesfortheregion:overthepastdecade,SouthAsiahasbeentheareawheretechnologicalreadinessstagnated themost.
TheGlobalCompetitivenessReport2017-2018
40
85 8288
99
115
India SriLanka Bhutan Nepal Bangladesh Pakistan
SouthAsianCountries'RankingGCR2017-2018

TheGlobalCompetitivenessReport2017-2018
ExecutiveOpinionSurveyfor2017-2018=TotalSampleSize - Global:12,775Pakistan:526
Pakistanhadthe3rd largestsamplesizeintheworldafterChinaandMexicoEOSwasmadeavailableinEnglishandUrdu
Period1 Period2Surveyedition No.ofrespondents Weight(%)* Surveyedition No.ofrespondents Weight(%)2016/17 236 42.4 2017/18 290 57.6DetailofWEF’sExecutiveOpinionSurveyfortheYear2017-2018
Large
30%
SME
59%
Micro
11%
EOS2017-2018RespondentsbyOrganizationSize
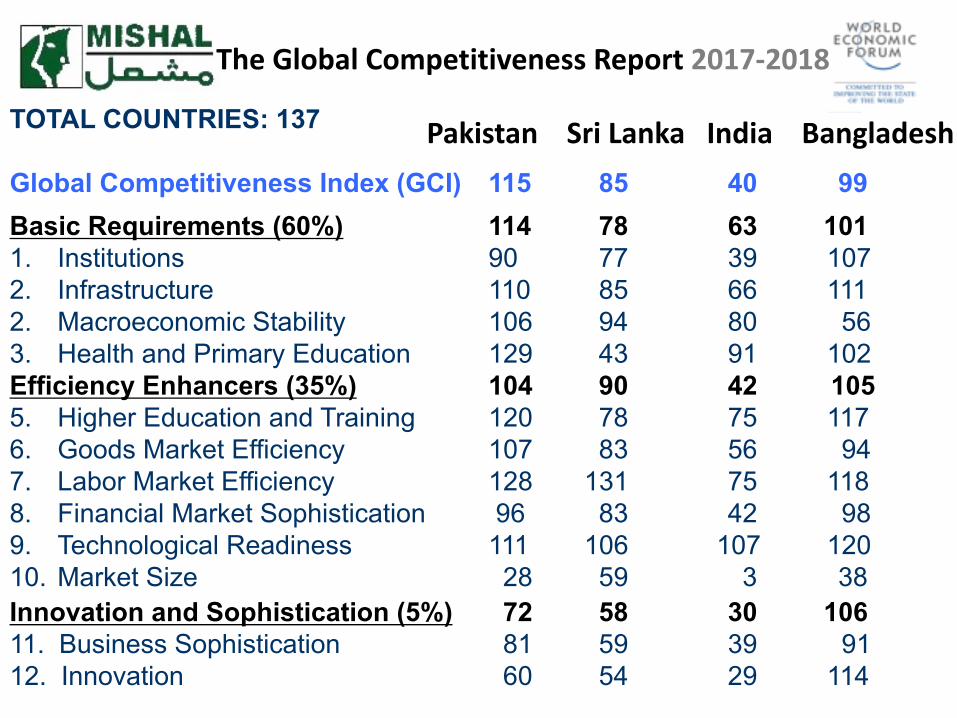
TOTAL COUNTRIES: 137
Global Competitiveness Index (GCI) 115 85 40 99Basic Requirements (60%) 114 78 63 1011. Institutions 90 77 39 1072. Infrastructure 110 85 66 1112. Macroeconomic Stability 106 94 80 563. Health and Primary Education 129 43 91 102Efficiency Enhancers (35%) 104 90 42 1055. Higher Education and Training 120 78 75 1176. Goods Market Efficiency 107 83 56 947. Labor Market Efficiency 128 131 75 1188. Financial Market Sophistication 96 83 42 989. Technological Readiness 111 106 107 12010. Market Size 28 59 3 38Innovation and Sophistication (5%) 72 58 30 10611. Business Sophistication 81 59 39 9112. Innovation 60 54 29 114
PakistanSriLankaIndiaBangladesh
TheGlobalCompetitivenessReport2017-2018

TheGlobalCompetitivenessReport2017-2018
2014/15 2015/16 2016/17 2017/18 ChangeBasic Requirements (60%)1. Institutions 123 119 111 90 - 21 2. Infrastructure 119 117 116 110 - 063. Macroeconomic Stability 137 128 116 106 - 104. Health and Primary Education 129 127 128 129 +01
Efficiency Enhancers (35%)5. Higher Education and Training 127 124 123 120 - 036. Goods Market Efficiency 100 116 117 107 - 107. Labor Market Efficiency 132 132 129 128 - 018. Financial Market Sophistication 72 99 107 96 - 119. Technological Readiness 114 113 119 111 - 08 10. Market Size 30 28 29 28 - 01
Innovation and Sophistication (5%)11. Business Sophistication 81 86 95 81 - 1412. Innovation 88 89 75 60 - 15
Pakistan’s Competitiveness Scores
TheGlobalCompetitivenessReport2017-2018
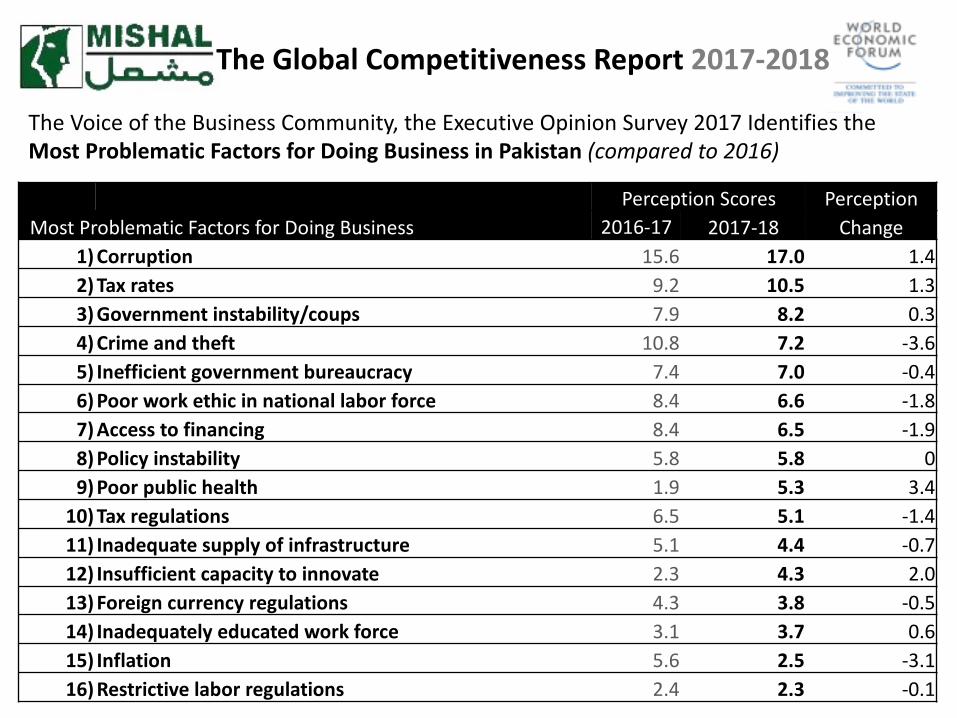
PerceptionScores PerceptionMostProblematicFactorsforDoingBusiness 2016-17 2017-18 Change
1)Corruption 15.6 17.0 1.42)Taxrates 9.2 10.5 1.33)Governmentinstability/coups 7.9 8.2 0.34)Crimeandtheft 10.8 7.2 -3.65)Inefficientgovernmentbureaucracy 7.4 7.0 -0.46)Poorworkethicinnationallaborforce 8.4 6.6 -1.87)Accesstofinancing 8.4 6.5 -1.98)Policyinstability 5.8 5.8 09)Poorpublichealth 1.9 5.3 3.4
10)Taxregulations 6.5 5.1 -1.411)Inadequatesupplyofinfrastructure 5.1 4.4 -0.712)Insufficientcapacitytoinnovate 2.3 4.3 2.013)Foreigncurrencyregulations 4.3 3.8 -0.514)Inadequatelyeducatedworkforce 3.1 3.7 0.615)Inflation 5.6 2.5 -3.116)Restrictivelaborregulations 2.4 2.3 -0.1
TheVoiceoftheBusinessCommunity,theExecutiveOpinionSurvey2017IdentifiestheMostProblematicFactorsforDoingBusinessinPakistan(comparedto2016)

Overall Performance of Pakistan on the Global Competitiveness Index 2016-17 vs. 2017-18
2016-17 2017-18
• Pakistanmadeimprovementsonnumberofindices 54 82
• Pakistandeterioratedonnumberofindices 50 20
• Pakistanretainedsameposition 10 12TOTAL 114 114
TheGlobalCompetitivenessReport2017-2018

19
Areas where Pakistan has shown significant improvements
Indicator 2016-17 è 2017-18 ImprovementIntellectual Property Protection 109 è 97 +10
Diversion of Public Funds 79 è 66 +13
Public Trust in Politicians 85 è 62 +23
Favouritism in Decisions of Government Officials 73 è 62 +11
Efficiency of Government Spending 98 è 58 +40
Burden of Government Regulation 75 è 64 +11
Efficiency of Legal Framework in settling disputes 109 è 83 +26
Efficiency of Legal Framework in Challenging Regs. 100 è 69 +31
Transparency of Government Policy Making 108 è 97 +11
Ethical Behaviour of Firms 90 è 76 +24
Strength of Auditing and Reporting Standards 121 è110 +11
Quality of overall infrastructure 93 è 82 +11
Quality of port infrastructure 84 è 73 +11
TheGlobalCompetitivenessReport2017-2018

20
Areas where Pakistan has shown significant improvements
Indicator 2016-17 è 2017-18 ImprovementGovernment budget balance, % GDP 106 è 95 +11
Extent of Staff Training 120 è 93 +27
Burden of Customs Procedures 113 è 93 +20
Buyer sophistication 86 è 56 +30
Pay and productivity 97 è 82 +15
Reliance on Professional Management 119 è106 +13
Country capacity to retain Talent 78 è 58 +20
Availability to Financial Services 102 è 89 +13
Affordability of financial services 88 è 73 +15
Financing through local Equity Market 73 è 58 +15
Ease of access to Loans 103 è 88 +15
Venture Capital Availability 68 è 39 +29
Soundness of Banks 101 è 89 +12
Regulation of securities exchanges 106 è 91 +15
TheGlobalCompetitivenessReport2017-2018

21
Areas where Pakistan has shown significant improvements
Indicator 2016-17 è 2017-18 ImprovementAvailability of latest technologies 99 è 70 +29
Firm Level Technology Absorption 114 è 88 +26
FDI and Technology Transfer 86 è 69 +17
Capacity for Innovation 95è 80 +15
Quality of Scientific Research Institutions 87è 67 +20
Company Spending on R&D 67è 52 +15
TheGlobalCompetitivenessReport2017-2018

22
Areas where Pakistan has shown deterioration
Indicator 2016-17 è 2017-18 WeakeningStrength of Investor Protection 26 è 25 -01
Government Debt, % GDP 95 è 98 -03
Malaria Incidents, Cases/100,000 Pop. 40 è 42 -02
Business Impact of Tuberculosis 104 è 123 -19
Business Impact of HIV/AIDS 95 è 121 -26
Infant mortality, deaths/1,000 live births 131 è 132 -01
Tertiary Education Enrollment Rate Gross %age 115 è 116 -01
Quality of management schools 84 è 102 -18
Local availability of Specialized Training Services 97 è 99 -02
Intensity of Local Competition 118 è 120 -02
Total Tax Rate, % Profits 48 è 52 -04
No. of procedures to start a business 116 è 126 -10
Trade tariff, % duty 134 è 136 -02
TheGlobalCompetitivenessReport2017-2018

23
Areas where Pakistan has shown deterioration
Indicator 2016-17 è 2017-18 WeakeningDegree of Customer Orientation 114 è 116 -02
Flexibility of Wage Determination 120 è 122 -02
Effect of Taxation on Incentives to Work 84 è 89 -05
Internet Users %age Pop. 119 è 125 -06
Local supplier quantity 102 è 107 -05
Control of international distribution 60 è 67 -07
TheGlobalCompetitivenessReport2017-2018

24
GlobalRankingsofNationalInstitutionsonImprovingCompetitivenessInstitutions 2012-13 2014-15 2015-16 2016-17 2017-2018
Intellectual Property Organization
106 117 112 109 97
Judicial Independence 57 67 82 88 80Police Services 127 127 128 118 116AGPR 86 90 117 121 110NHA 73 75 77 77 76Railways 66 72 60 53 52CAA 78 92 79 91 91NEPRA 126 133 129 121 115HEC 125 115 115 115 116NAVTEC 102 101 94 97 99CCP 71 85 106 96 70Customs 93 87 111 113 93SBP 85 71 99 101 89SECP 55 51 93 106 91TDAP X 141 137 135 135NAB 139 126 117 116 Not available as yet
TheGlobalCompetitivenessReport2017-2018

25
GoalshouldbetoInvolvePublicPrivatePartnershipsandActasacatalystto:
Public-PrivatePartnershipistheonlywaytoimprovePakistan’sCompetitiveness
Improve Competitiveness
Increase Productivity
Enhance prosperity
TheGlobalCompetitivenessReport2017-2018

The Way Forward – Steps to be Taken to Improve Competitiveness
• National Competitiveness Council• The Annual State of Competitiveness Report• Institutional Effort to Update the Data
• Regional Competitiveness Councils• Provincial Competitiveness Reports
• Industry Academia Linkages• Get Out of “The Narrative Trap”
• Narrative Building Strategy • Inward Looking• Outward Looking

The Narrative Trap
2016-17 2017-18
• Pakistan Made Improvements on number of indices 54 82
• Pakistan Deteriorated on number of indices 50 20
• Pakistan Retained its Position 10 12
TOTAL 114 114

KeyMessages

TheGlobalCompetitivenessReport2016-2017


Backup Slides

32
Improvements 2016-17 è 2017-18• Property Rights 122è115• Intellectual Property Protection 109è 97• Diversion of Public Funds 79è 66 • Public Trust in Politicians 85è 62• Irregular Payment and Bribes 110è102• Judicial Independence 88è 80• Favouritism in Decisions of Government Officials 73è 62• Efficiency of Government Spending 98è 58• Burden of Government Regulation 75è 64• Efficiency of Legal Framework in settling disputes 109è 83• Efficiency of Legal Framework in Challenging Regs. 100è 69• Transparency of Government Policy Making 108è 97• Business Costs of Terrorism 134è130• Business Costs of Crime and Violence 125è121• Organized Crime 130è127• Reliability of Police Services 118è116• Ethical Behaviour of Firms 90è 76• Strength of Auditing and Reporting Standards 121è110• Efficacy of Corporate Boards 123è121 • Protection of Minority Shareholders Interests 109è109Weakening• Strength of Investor Protection 26è 25
Pillar 1 Institutions

Improvements 2016-17 è 2017-18
• Quality of overall infrastructure 93è 82• Quality of roads 77è 76• Quality of railroad Infrastructure 53è 52• Quality of port infrastructure 84è 73• Quality of Air transport Structure 91è 91• Available Airline Seat Km/week, million 46è 46• Quality of Electricity Supply 130è126• Mobile Telephone Subscriptions/100 pop 130è126• Fixed Telephone lines/100 pop* 117è115
Weakening
Pillar 2 Infrastructure

Improvements 2016-17 è 2017-18
• Government budget balance, % GDP 106è 95• Gross National Savings, % GDP 107è105• Inflation, annual % change 93è 1• Country Credit Rating 0-100 pop* 114è109
Weakening
• Government Debt, % GDP 95è 98
Pillar 3 Macroeconomic environment

Improvements 2016-17 è 2017-18
• Business Impact of Malaria 48è 43• Tuberculosis Cases/100,000 pop* 122è122• HIV Prevalence, % adult pop. 1è 1 • Life Expectancy Years 108è108• Quality of primary education 115è100• Primary Education enrollment, net % 133è131
Weakening
• Malaria Incidents, Cases/100,000 Pop. 40è 42• Business Impact of Tuberculosis 104è123• Business Impact of HIV/AIDS 95è121• Infant mortality, deaths/1,000 live births 131è132
Pillar 4 Health and Primary Education
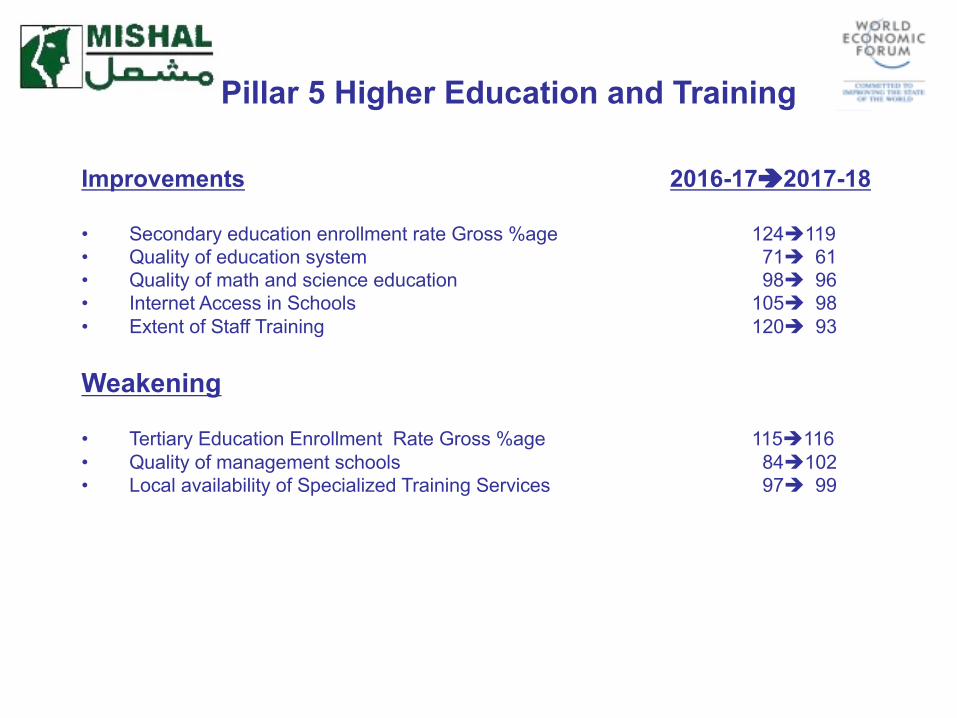
Improvements 2016-17è2017-18
• Secondary education enrollment rate Gross %age 124è119• Quality of education system 71è 61• Quality of math and science education 98è 96• Internet Access in Schools 105è 98• Extent of Staff Training 120è 93
Weakening
• Tertiary Education Enrollment Rate Gross %age 115è116• Quality of management schools 84è102• Local availability of Specialized Training Services 97è 99
Pillar 5 Higher Education and Training
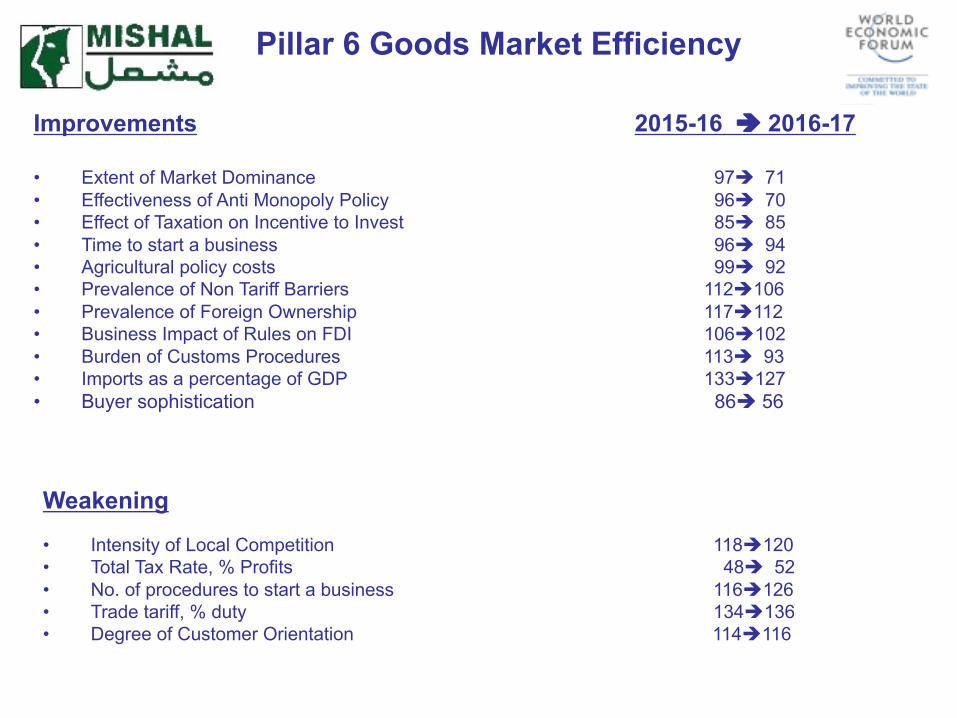
Improvements 2015-16 è 2016-17
• Extent of Market Dominance 97è 71• Effectiveness of Anti Monopoly Policy 96è 70• Effect of Taxation on Incentive to Invest 85è 85• Time to start a business 96è 94• Agricultural policy costs 99è 92• Prevalence of Non Tariff Barriers 112è106• Prevalence of Foreign Ownership 117è112• Business Impact of Rules on FDI 106è102• Burden of Customs Procedures 113è 93• Imports as a percentage of GDP 133è127• Buyer sophistication 86è 56
Weakening• Intensity of Local Competition 118è120• Total Tax Rate, % Profits 48è 52• No. of procedures to start a business 116è126• Trade tariff, % duty 134è136• Degree of Customer Orientation 114è116
Pillar 6 Goods Market Efficiency

Improvements 2016-17 è 2017-18
• Cooperation in labor employment relations 134è125• Hiring and firing practices 63è 63 • Redundancy costs, weeks of salary 110è 110• Pay and productivity 97è 82• Reliance on Professional Management 119è106• Country capacity to retain Talent 78è 58• Country capacity to attract Talent 86è 85• Female Participation in the labor force, ratio to men* 134è133
Weakening
• Flexibility of Wage Determination 120è122• Effect of Taxation on Incentives to Work 84è 89
Pillar 7 Labor Market Efficiency

Improvements 2016-17 è 2017-18
• Availability to Financial Services 102è 89• Affordability of financial services 88è 73• Financing through local Equity Market 73è 58• Ease of access to Loans 103è 88• Venture Capital Availability 68è 39• Soundness of Banks 101è 89• Regulation of securities exchanges 106è 91• Legal rights index 97è 96
Weakening
Pillar 8 Financial Market Development

Improvements 2016-17 è 2017-18
• Availability of latest technologies 99è 70• Firm Level Technology Absorption 114è 88• FDI and Technology Transfer 86è 69• Fixed Broadband Internet subscription/100 Pop. 110è108• Internet bandwidth, kb/s user 103è102• Mobile Broadband subscriptions/100 Pop. 121è120
Weakening
• Internet Users %age Pop. 119è125
Pillar 9 Technological Readiness
Improvements 2016-17 è 2017-18
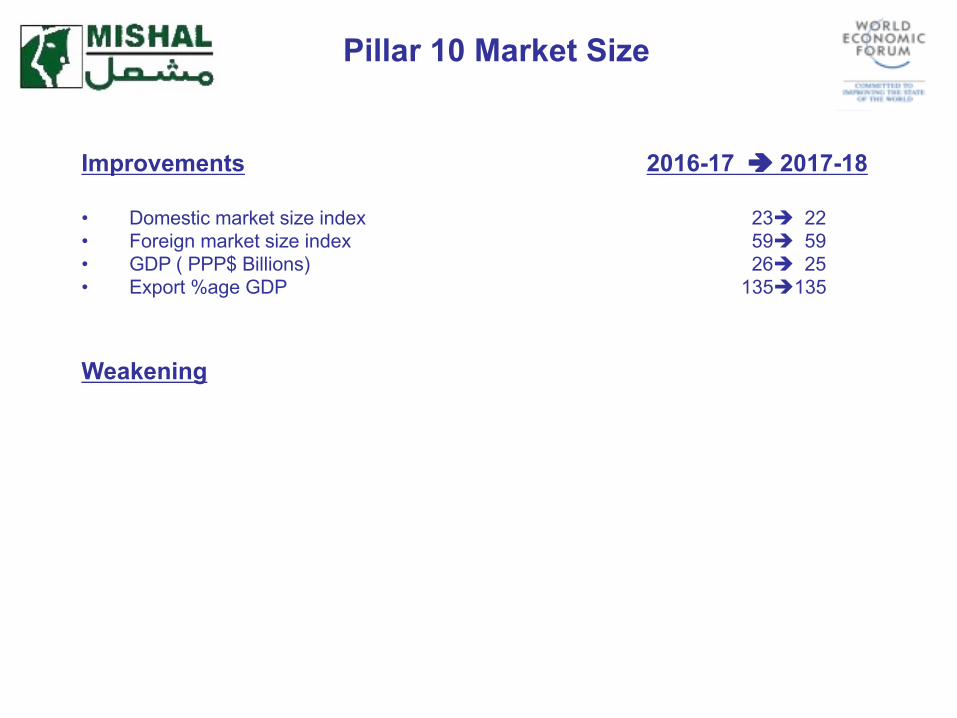
• Domestic market size index 23è 22• Foreign market size index 59è 59 • GDP ( PPP$ Billions) 26è 25• Export %age GDP 135è135
Weakening
Pillar 10 Market Size

Improvements 2016-17 è 2017-18
• Local supplier quality 111è108• State of Cluster Development 76è 55• Nature of competitive advantage 86è 68• Value Chain Breadth 77è 74• Production process sophistication 77è 75• Extent of marketing 114è103• Willingness to delegate Authority 114è101
Weakening
• Local supplier quantity 102è107• Control of international distribution 60è 67
Pillar 11 Business Sophistication
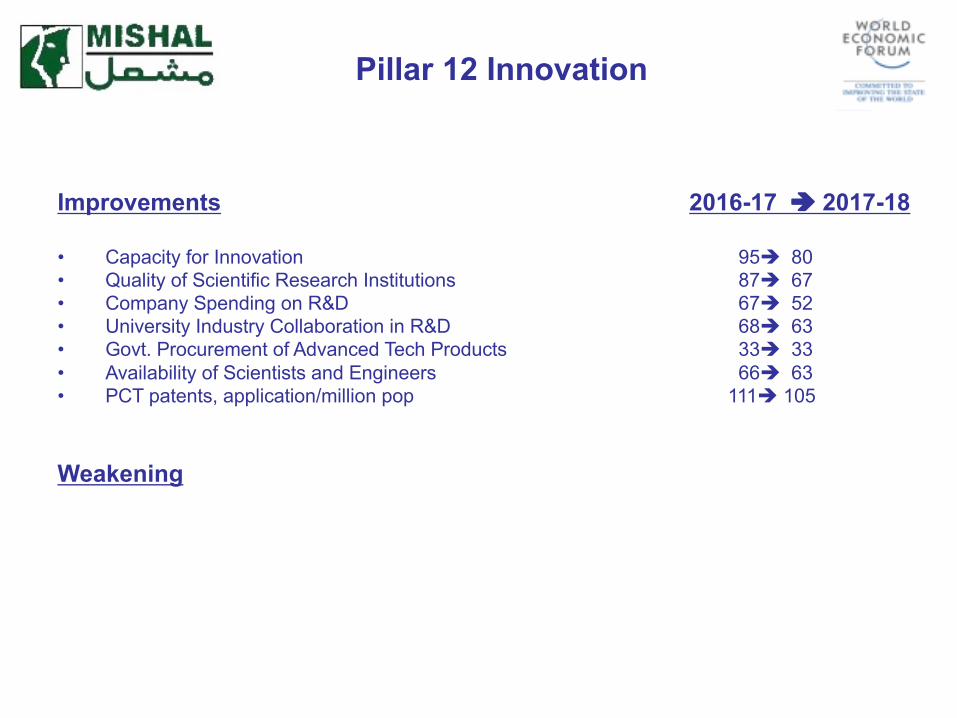
Improvements 2016-17 è 2017-18
• Capacity for Innovation 95è 80• Quality of Scientific Research Institutions 87è 67• Company Spending on R&D 67è 52• University Industry Collaboration in R&D 68è 63• Govt. Procurement of Advanced Tech Products 33è 33• Availability of Scientists and Engineers 66è 63• PCT patents, application/million pop 111è 105
Weakening
Pillar 12 Innovation

Thank you!