ats company reports: acrysil ltd
TRANSCRIPT


Current price 220.00
Sector Kitchen Sinks
No of shares 4658000
52 week high 714.90
52 week low 220.10
BSE Sensex 27890.13
Nifty 8429.70
Average Volume 7000
BSE Code 524091
Acrysil (India) Ltd.
Recommendation
– BUY/HOLD
Date – 22/04/2015

Company Details
Acrysil Ltd is one the leading manufacturer and exporter of Composite Quartz Granite Kitchen Sinks in India.
The company is engaged in the manufacture and sale of kitchen sinks in India. They offer granite kitchen sinks
and stainless steel kitchen sinks. They market their sinks under the brand name 'Carysil'. The Company is
also an original equipment manufacturer (OEM) for brands worldwide. The company is exporting their product
to more than 40 countries which includes Poland, China, Malaysia, Greece, Great Britain, France, Bahrain,
and USA.
The company’s products include granite sinks, stainless steel sinks, and wash basins. Its kitchen appliances
comprise faucets, hoods and chimneys, hobs and cook tops, ovens and microwave ovens, food waste
disposers, and wine chillers, as well as other free standing cooking products. The Company's granite sinks are
manufactured in various range, such as jazz series, vivaldi series, beethoven series, single series, swan
series, tango, and entertainment series. The Company’s stainless steel sinks range include quadro, trend,
vogue, catwalk, diva, glamour, and big bowl. Acrysil is the only company in all of Asia - and one of just four
companies worldwide - manufacturing composite quartz sinks. They are the India's largest sink manufacturer
in the non-steel category and the company has set the goal to be the No. 1 manufacturer across all
categories, in terms of branded volume.
Sternhagen, the German brand that symbolises the pinnacle of luxury in design and engineering will soon be
launched in India. The brand, owned by Acrysil GmbH, Germany (a wholly owned subsidiary of Acrysil Limited,
India). The Sternhagen collection of washbasins will initially have four nature inspired exclusive designs
namely, Düne (inspired by sand dunes), Seerose (inspired by petals of water lily), Golden Cut (90° geometric
cut design) and Kristall (inspired by natural crystal). The collection provides a subtle visual reminder of nature,
and each design connects people with emotions and memories associated with nature. The washbasins are
designed in Berlin, Germany by EMAMI DESIGN (No.1 of the worldwide Red Dot Design ranking). The current
market capitalisation stands at Rs 246.91 crore.

Market Cap (Rs Cr) – 246.30
Company P/E (x) – 27.30
Industry P/E (x) – 54.82
Book Value (Rs) – 79.41
Price / BV (x) – 6.38
Dividend (%) – 40 %
EPS (TTM) – 18.61
Dividend Yield (%) – 0.79 %
Face Value (Rs) – 10
Category No. of Shares Percentage
Promoters 2,201,350 47.26
General Public 1,418,747 30.46
Foreign - OCB 452,400 9.71
Foreign - NRI 313,929 6.74
Other
Companies262,257 5.63
Others 5,888 0.13
Directors 3,204 0.07
Financial
Institutions150 0.00
Central
Government75 0.00
Share Holding Pattern Financial Details

Balance Sheet
Mar '14 Mar '13 Mar '12 Mar '11 Mar '10
Sources Of Funds
Total Share Capital 4.51 4.46 2.97 2.97 2.97
Equity Share Capital 4.51 4.46 2.97 2.97 2.97
Share Application Money 0.38 0.00 0.00 0.00 0.00
Reserves 33.72 27.40 25.10 22.54 17.87
Networth 38.61 31.86 28.07 25.51 20.84
Secured Loans 27.95 20.83 13.79 16.24 9.00
Unsecured Loans 5.18 4.11 2.62 0.88 1.84
Total Debt 33.13 24.94 16.41 17.12 10.84
Total Liabilities 71.74 56.80 44.48 42.63 31.68
Application Of Funds
Gross Block 54.04 46.88 39.19 35.89 30.48
Less: Accum. Depreciation 26.21 22.08 18.63 15.51 12.84
Net Block 27.83 24.80 20.56 20.38 17.64
Capital Work in Progress 0.82 0.06 0.40 0.47 0.73
Investments 7.40 5.19 1.09 0.33 0.00
Inventories 21.29 16.27 10.45 9.80 9.70
Sundry Debtors 24.39 20.06 14.86 16.23 10.86
Cash and Bank Balance 2.04 1.86 1.47 0.83 0.88
Total Current Assets 47.72 38.19 26.78 26.86 21.44
Loans and Advances 12.97 7.97 9.26 7.15 5.10
Fixed Deposits 0.00 0.00 0.00 0.26 0.15
Total CA, Loans & Advances 60.69 46.16 36.04 34.27 26.69
Current Liabilities 21.56 15.96 10.91 10.54 8.40
Provisions 3.43 3.46 2.71 2.28 4.96
Total CL & Provisions 24.99 19.42 13.62 12.82 13.36
Net Current Assets 35.70 26.74 22.42 21.45 13.33
Total Assets 71.75 56.79 44.47 42.63 31.70
Contingent Liabilities 9.03 6.89 8.41 8.41 0.10
Book Value (Rs) 84.80 71.46 94.46 85.85 70.12

Profit and Loss Account
Mar '14 Mar '13 Mar '12 Mar '11 Mar '10
Income
Sales Turnover 103.71 78.45 62.23 56.08 47.13
Excise Duty 0.00 0.00 0.00 0.71 0.48
Net Sales 103.71 78.45 62.23 55.37 46.65
Other Income 0.77 0.81 0.89 0.44 -0.75
Stock Adjustments 5.32 2.61 1.12 0.14 1.90
Total Income 109.80 81.87 64.24 55.95 47.80
Expenditure
Raw Materials 58.96 43.64 33.17 24.70 21.45
Power & Fuel Cost 3.59 3.22 2.49 2.11 1.90
Employee Cost 6.98 4.81 5.57 5.14 4.31
Other Manufacturing Expenses 3.62 2.78 0.36 0.43 0.33
Selling and Admin Expenses 0.00 0.00 0.00 10.41 7.73
Miscellaneous Expenses 18.50 13.80 11.92 1.06 0.84
Total Expenses 91.65 68.25 53.51 43.85 36.56
Operating Profit 17.38 12.81 9.84 11.66 11.99
PBDIT 18.15 13.62 10.73 12.10 11.24
Interest 3.44 2.66 2.12 1.63 0.95
PBDT 14.71 10.96 8.61 10.47 10.29
Depreciation 4.20 3.79 3.32 2.86 2.65
Profit Before Tax 10.51 7.17 5.29 7.61 7.64
Extra-ordinary items 0.00 0.00 0.00 0.12 -0.17
PBT (Post Extra-ord Items) 10.51 7.17 5.29 7.73 7.47
Tax 2.54 1.66 1.37 1.68 1.57
Reported Net Profit 7.98 5.50 3.94 6.10 5.91
Total Value Addition 32.69 24.61 20.33 19.15 15.10
Equity Dividend 1.80 1.47 1.19 1.19 1.18
Corporate Dividend Tax 0.31 0.25 0.19 0.19 0.20
Per share data (annualised)
Shares in issue (lakhs) 45.08 44.58 29.72 29.72 29.72
Earning Per Share (Rs) 17.70 12.35 13.26 20.53 19.88
Equity Dividend (%) 40.00 33.00 40.00 40.00 40.00
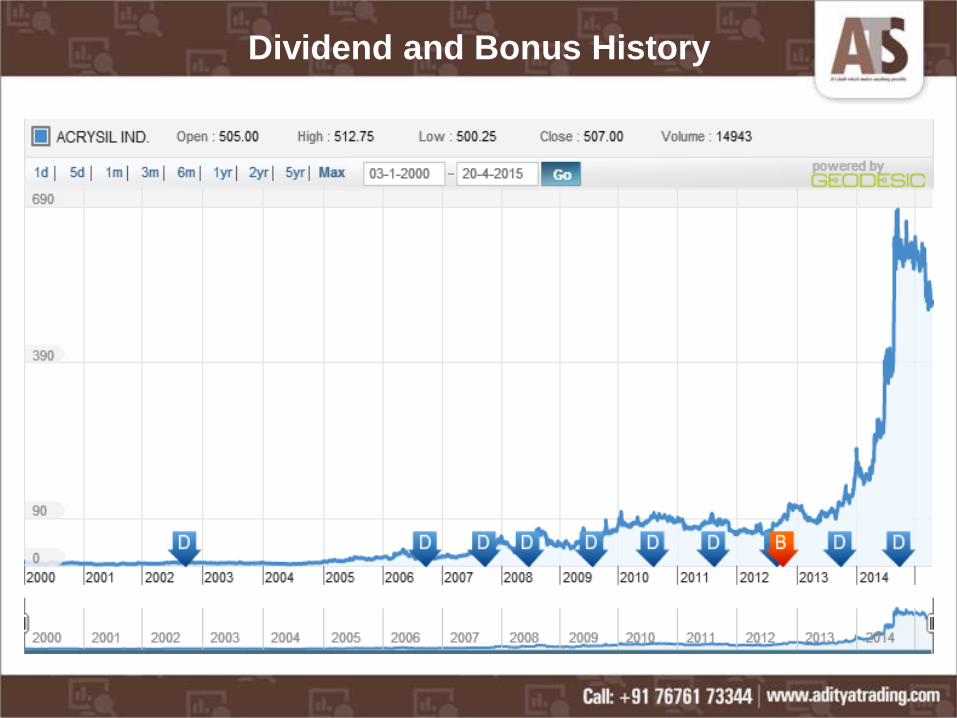
Dividend and Bonus History

Index and Company Price Movement Comparison

Symbol Value Action
RSI(14) 63.615 Buy
STOCH(9,6) 66.966 Buy
STOCHRSI(14) 78.714 Overbought
MACD(12,26) 4.940 Buy
ADX(14) 24.813 Buy
Williams %R -16.703 Overbought
CCI(14) 97.4447 Buy
ATR(14) 5.2893 High Volatility
Highs/Lows(14) 6.6357 Buy
Ultimate Oscillator 58.764 Buy
ROC 4.981 Buy
Bull/Bear Power(13) 7.0360 Buy
Technical Indicators

PBIT – 12.62 v/s 11.37
RoCE – 19.75 v/s 17.28
RoE – 22.08 v/s 17.63
Net Profit Margin – 7.63 v/s 6.94
Return on net worth – 20.87 v/s 17.27
D/E Ratio – 0.87 v/s 0.78
Interest Cover – 4.06 v/s 3.70
Current Ratio – 0.88 v/s 0.79
Reserves – 33.72 cr v/s 27.40
PAT – 7.98 cr v/s 5.50 cr
Total assets – 71.75 cr v/s 56.76 cr
Net sales – 103.71 cr v/s 78.45 cr
Book Value – 84.80 v/s 71.46
Important Ratios (YoY)
Days BSE NSE
30 517.58
50 548.67
150 586.00
200 550.08
Simple Moving Average

Investment Rationalize
Acrysil Ltd manufactures and sells kitchen sinks/centers with Quartz composite sink being a niche product,
has no substitutes in the market.
Acrysil has tied up with some other German and Swiss companies for new products for both designing and
technology. It is selling to some big retail chains in USA and Europe. This will assure quality and revenue
growth.
The company launched a range of lifestyle kitchen appliances like faucets, hoods and chimneys, hobs and
cook tops, ovens and microwave ovens, food waste disposers and wine chillers which will help the company
to tap the market potential in more effective manner.
The Revenue has grown at an impressive CAGR of 17.1%, Asset Turnover of 1.22(x), sound ratios and
margins and Reserves of Rs.33.72 crore which will help the company in expansion plans.
Only 20% of the companies revenue from India which implies huge growth potential of the affordable high
quality fashionable products to the company to be sold in fast growing domestic market with more demand of
branded kitchen products by the fast growing middle class population.
Companies expansion plans in both manufacturing and number of outlets will add to the growth potential of
the company, as the number of nuclear families and real estate sector sentiment improves.
Being a capital intensive company Acrysil has been able to maintain fast and positive cash flow by having an
impressive business model.
Revenue from untapped international market and fully owned subsidiaries will add to the Profit of the
company.
