aup 1214 close 12-16-14 · how to analyze an automobile manufacturing company ... contacts:...
TRANSCRIPT
Please see General Disclaimers on the last page of this report.
Current Environment ............................................................................................ 1
Industry Profile .................................................................................................... 10
Industry Trends ................................................................................................... 12
How the Industry Operates ............................................................................... 22
Key Industry Ratios and Statistics ................................................................... 28
How to Analyze an Automobile Manufacturing Company .......................... 30
Glossary ................................................................................................................ 34
Industry References ........................................................................................... 36
Comparative Company Analysis ...................................................................... 37
This issue updates the one dated July 2014.
Industry Surveys Autos & Auto Parts Efraim Levy, CFA, Auto Manufacturers & Auto Parts Equity Analyst
DECEMBER 2014
CONTACTS:
INQUIRIES & CLIENT SUPPORT 800.523.4534 clientsupport@ standardandpoors.com
SALES 877.219.1247 [email protected]
MEDIA Michael Privitera 212.438.6679 [email protected]
S&P CAPITAL IQ 55 Water Street New York, NY 10041
Topics Covered by Industry Surveys
Aerospace & Defense
Airlines
Alcoholic Beverages & Tobacco
Apparel & Footwear: Retailers & Brands
Autos & Auto Parts
Banking
Biotechnology
Broadcasting, Cable & Satellite
Chemicals
Communications Equipment
Computers: Commercial Services
Computers: Consumer Services & the Internet
Computers: Hardware
Computers: Software
Electric Utilities
Environmental & Waste Management
Financial Services: Diversified
Foods & Nonalcoholic Beverages
Healthcare: Facilities
Healthcare: Managed Care
Healthcare: Pharmaceuticals
Healthcare: Products & Supplies
Heavy Equipment & Trucks
Homebuilding
Household Durables
Household Nondurables
Industrial Machinery
Insurance: Life & Health
Insurance: Property-Casualty
Investment Services
Lodging & Gaming
Metals: Industrial
Movies & Entertainment
Natural Gas Distribution
Oil & Gas: Equipment & Services
Oil & Gas: Production & Marketing
Paper & Forest Products
Publishing & Advertising
Real Estate Investment Trusts
Restaurants
Retailing: General
Retailing: Specialty
Semiconductors & Equipment
Supermarkets & Drugstores
Telecommunications
Thrifts & Mortgage Finance
Transportation: Commercial
Global Industry Surveys
Airlines: Asia
Autos & Auto Parts: Europe
Banking: Europe
Food Retail: Europe
Foods & Beverages: Europe
Media: Europe
Oil & Gas: Europe
Pharmaceuticals: Europe
Telecommunications: Asia
Telecommunications: Europe
S&P Capital IQ Industry Surveys 55 Water Street, New York, NY 10041
CLIENT SUPPORT: 1-800-523-4534
VISIT THE S&P CAPITAL IQ WEBSITE: www.spcapitaliq.com
S&P CAPITAL IQ INDUSTRY SURVEYS (ISSN 0196-4666) is published weekly. Redistribution or reproduction in whole or in part (including inputting into a computer) is prohibited without written permission. To learn more about Industry Surveys and the S&P Capital IQ product offering, please contact our Product Specialist team at 1-877-219-1247 or visit getmarketscope.com. Executive and Editorial Office: S&P Capital IQ, 55 Water Street, New York, NY 10041. Officers of McGraw Hill Financial: Douglas L. Peterson, President, and CEO; Jack F. Callahan, Jr., Executive Vice President, Chief Financial Officer; John Berisford, Executive Vice President, Human Resources; D. Edward Smyth, Executive Vice President, Corporate Affairs; and Lucy Fato, Executive Vice President and General Counsel. Information has been obtained by S&P Capital IQ INDUSTRY SURVEYS from sources believed to be reliable. However, because of the possibility of human or mechanical error by our sources, INDUSTRY SURVEYS, or others, INDUSTRY SURVEYS does not guarantee the accuracy, adequacy, or completeness of any information and is not responsible for any errors or omissions or for the results obtained from the use of such information. Copyright © 2014 Standard & Poor's Financial Services LLC, a part of McGraw Hill Financial. All rights reserved. STANDARD & POOR’S, S&P, S&P 500, S&P MIDCAP 400, S&P SMALLCAP 600, and S&P EUROPE 350 are registered trademarks of Standard & Poor’s Financial Services LLC. S&P CAPITAL IQ is a trademark of Standard & Poor’s Financial Services LLC.

INDUSTRY SURVEYS AUTOS & AUTO PARTS / DECEMBER 2014 1
CURRENT ENVIRONMENT
Corporate actions pick up
Mergers and acquisitions (M&A) activity saw a sizeable jump in the auto manufacturing industry and the auto retail market in the first 10 months of 2014.
Following Fiat SpA’s complete takeover of Chrysler Group LLC’s after buying the 41% stake for $2.9 billion in January 2014, the combined company—Fiat Chrysler Automobiles NV (FCA)—went public on October 13, forming the seventh-largest automaker in the world.
Another M&A activity is ZF Friedrichshafen AG’s buyout of TRW Automotive Holdings Corp. for $13.5 billion. The deal was announced on September 15, 2014 and is expected to be completed in the first half of 2015. While TRW Automotive will operate as a separate business division, the combined company will bring together complementary product offerings and leading technology positions that will better position the company in different markets and high-growth areas. ZF Friedrichshafen estimated that the merger will result in a business that will more than double sales in the US and China. The transaction creates the second largest auto parts supplier in the world.
We think the consolidation phase in the industry will continue in 2015, as companies want to have access to different segments, markets, and technologies.
Dealership M&A US auto retailers, though benefiting from improving domestic sales, are queuing up to acquire dealerships overseas. They believe that international markets will play a crucial role by providing potential growth even amid cyclicality of the domestic market.
In October, Lithia Motors, Inc. completed its acquisition of DCH Auto Group Inc. for $362.5 million, which is expected to result in a $2.3-billion increase in annual revenue to Lithia. The deal diversifies the combined company’s brand portfolio, reducing reliance on any one brand. For example, prior to the acquisition, Lithia had focused mainly on domestic brands and was heavily dependent on Chrysler vehicle growth, but the combined company can now expand to imported and luxury brands. There are two growth paths in store for the company—Lithia will be focusing on exclusive franchises in medium markets, while DCH will be focusing on extra-large and mega markets. The combination develops a metro market strategy for Lithia.
Meanwhile, Warren Buffet’s investment company, Berkshire Hathaway Inc., announced in October that it is entering the auto business through its decision to acquire Van Tuyl Group, the largest privately owned auto dealership in the US, with almost $8 billion in revenues. After the anticipated acquisition closes in the first quarter of 2015, Van Tuyl Group will be renamed Berkshire Hathaway Automotive. While the terms of the acquisition are undisclosed, the move shows Buffet’s confidence in car retailing, which is noteworthy as he is one of the most influential businessmen and investors in the world. Buffet has mentioned that he may buy more dealerships. We think this acquisition could stimulate other dealership M&A activity, as Buffet’s interest in dealerships indicate their value in the automotive industry.
Identifying growth opportunities in dealerships, Asbury Automotive Group Inc. announced in October 2014 that it aims to buy stores that will add $500 million in annual revenue over the next 18 months. At the end of October 2014, the company announced the acquisition of two unidentified dealerships that are expected to contribute $250 million in revenue. These transactions are expected to close by the end of 2014 or early in 2015.
There has also been movement toward international expansion among publicly traded auto dealers. For example, Group 1 Automotive is expanding its international presence. The company acquired UAB Motors Participacoes SA, a Brazilian automotive retailer, in 2013. Group 1 obtained full ownership of 18

2 AUTOS & AUTO PARTS / DECEMBER 2014 INDUSTRY SURVEYS
dealerships representing 22 franchises in the deal, which was worth about $146 million. In the same month, it also acquired four Ford dealerships from Inchcape Retail Ltd in the UK.
Penske Automotive Group Inc. has been very active on the acquisition trail. The company acquired 13 franchises in the UK that were formerly part of the Isaac Agnew dealership group in January 2012. Further, in March 2012, the company established a joint venture with Andrea Mantellini, which operates a BMW/MINI dealer group in Bologna, Italy; the joint venture acquired the Mariani BMW/MINI dealership in Monza, Italy. Penske acquired Western Star Trucks Australia Pty. Ltd. from Transpacific Industries Group Ltd. for about $200 million in August 2013. Western Star is a distributor of commercial vehicles, related spare parts, and aftermarket support across Australia, New Zealand, and parts of Southeast Asia.
Ford launches aluminum-bodied F-150 The Ford F-150 was the best-selling vehicle in the US for the past 32 years. Despite the success of this vehicle, Ford has decided to take it a notch higher, and is scheduled to begin production of its redesigned, all-aluminum body F-150, which is expected to be launched onto the market in December 2014.
While aluminum is as strong as steel, it is lighter, and hence increases fuel efficiency as well as towing and payload capacities, and improves power-to-weight ratio for faster acceleration. The use of aluminum also makes the F-150 stronger, considering that this material is more resistant to dents and dings than steel. Switching to an aluminum body adds $395 to the price. Consumers and investors will be on the lookout, even though there has been some controversy about how the F-150’s all-aluminum body will stand up to the abuse that pickup trucks often endure.
Good news for used car buyers A key indicator in the US automobile industry, the Manheim Used Vehicle Value Index, has been on a downward trend since reaching a price peak in May 2014, showing year-on-year declines in August and September of 0.4% and 1.1%, respectively. In 2013, the Mainheim Used Vehicle Value Index averaged 121.4, down 1.8% from the 2012 average. However, year to date through October, the index averaged 123.1, up 1.6% from the year-ago period. We still think the prices of used cars will continue to decline, despite the moderate increase in October. The decline in prices provides an opportunity for car shoppers, especially for those who otherwise could not afford to buy a used car in the wake of the recession. However, the used car price trend may be a threat to new-car sales, as some car shoppers may forgo buying a new car, and may have a renewed interest in owning used vehicles.
GAS PRICES DROPPING
As of November 13, 2014, gas prices in the US averaged $2.92, down 8.4% on a year-on-year basis, according to the AAA. Drivers are expected to pay less than $3 for a gallon of gas in 2015, according to the Energy Information Association (EIA), a division of the US Energy Department.
As gas price per gallon reached the below-$3 dollar mark, consumer preference is shifting from fuel-efficient and smaller cars to SUVs and other light-duty trucks. Year to date through October, total unit sales for SUV and light-duty trucks (including pickups, cross-overs, minivans, and SUVs) jumped 7.1% and 9.7%, respectively, compared with a slower growth for cars (1.4%), according to Motor Intelligence. The slow growth in car sales can largely be attributed to the decline in midsize and large-car sales. Based on WardsAuto data, year to date through October, the biggest winner for light-duty trucks was Jeep Cherokee, with unit sales increase of 144,287 from 579 units, on a year-on-year basis. Meanwhile, the Grand Cherokee’s sales grew 5.5% year to date through October, on a year-on-year basis. The best-selling light truck, the Ford F-150, declined 0.5% as buyers put off their purchasing decisions in anticipation of the 2015 F-150.

INDUSTRY SURVEYS AUTOS & AUTO PARTS / DECEMBER 2014 3
RECALLS IN THE FOREFRONT
According to the National Highway Traffic Safety Administration (NHTSA), auto manufacturers recalled 21.9 million vehicles in the US in 2013, representing a nine-year high. The highest number of recalls affected Toyota (24.1%), Chrysler (21.2%), and Honda (12.6%). Auto recalls are on an upward trend in 2014, resulting in billion-dollar penalties, e.g., the $1.2 billion penalty on Toyota in March 2014 for misleading the public and regulators, and there is a push for an independent review of safety processes in automobile companies. In the first half of 2014 alone, the NHTSA reported 37.5 million recalled vehicles, which is 71.2% more than the total recalls in full-year 2013.
General Motors Co. (GM) is facing a probe into faulty parts that have allegedly caused deaths and serious injuries. Year to date through October, GM had 77 separate recalls involving 26.6 million vehicles in the US market and 3.5 million vehicles in foreign markets, bringing the total to 30.1 million. The company has been in the hot seat over faulty ignition switches. Ignition-related vehicle recalls totaled 13.2 million (including exports), i.e., 2.6 million units of 1997–2005 Chevrolet Malibu and 1998–2002 Chevrolet HHR were recalled due to faulty ignition cylinders in April 2014. According to a November 2014 article published by Reuters, this ignition problem has resulted in 196 claims for death, 116 for catastrophic injuries, and 1,460 for other injuries since August 1, 2014, when GM’s compensation program for victims of faulty ignition switch accidents started. Overall, GM incurred recall-related charges of $2.7 billion, year to date through September.
S&P Capital IQ (S&P) expects recall activity by automakers in 2015, but at a slower pace, as manufacturers want to avoid penalties from the government and lawsuits from customers for safety defects. Evidently, Ford, Toyota, and GM, as well as other companies, seem to have realized that early, voluntary safety recalls are more to their advantage than billion-dollar penalties and prolonged public condemnation arising from defect-related accidents.
Takata massive recalls Airbag-related problems have also resulted in-vehicle recalls, particularly those manufactured by Takata Corp. In June 2014, the NHTSA received notification from BMW, Chrysler, Ford, Honda, Mazda, Nissan, Toyota, and Mitsubishi that they are conducting limited regional recalls to address possible defects of Takata air bag inflators. According to an October 22, 2014 article published by Automotive News, 7.8 million vehicles were involved in the Takata airbag recalls; Honda took the hardest hit, with a total of 5.1 million recalled vehicles manufactured between 2001 and 2007. As of November 2014, five deaths were linked to defective Takata airbags, according to The New York Times, resulting in multiple lawsuits for the company. On October 27, 2014, a class-action suit was filed with the US District Court in Florida against Takata and several automobile manufacturers. If class-action status is granted, Takata will have to pay a larger amount in a trial or settlement costs compared with individually filed lawsuits against the company.
Record fines for Hyundai and Kia US regulators have set standards in an attempt to increase product safety and environmental efficiency. In November 2014, the Environmental Protection Agency (EPA) and the US Justice Department fined Hyundai and Kia $100 million (the largest Clean Air Act penalty ever) for overstating fuel economy claims. The EPA found that 1.2 million cars sold by the Korean automobile carmaker were manufactured under false fuel economy ratings. The Agency argued that this contributed to over 5.2 million unaccounted tons of greenhouse gases. As a result, the companies will forfeit carbon credits, which are linked with the unaccounted emissions, valued at $200 million. The car models involved include Hyundai’s Accent, Elantra, Veloster, and Santa Fe as well as Kia’s Rio and Soul. In effect, Hyundai and Kia earned greater profits while also misleading consumers about the environmental impact of about one million of their 2012 and 2013 models. These penalties should serve as a warning to auto carmakers that tightening regulations in the US and other markets are being enforced to ensure that they comply with EPA requirements, and that failure to do so could blemish the company’s reputation.
4 AUTOS & AUTO PARTS / DECEMBER 2014 INDUSTRY SURVEYS
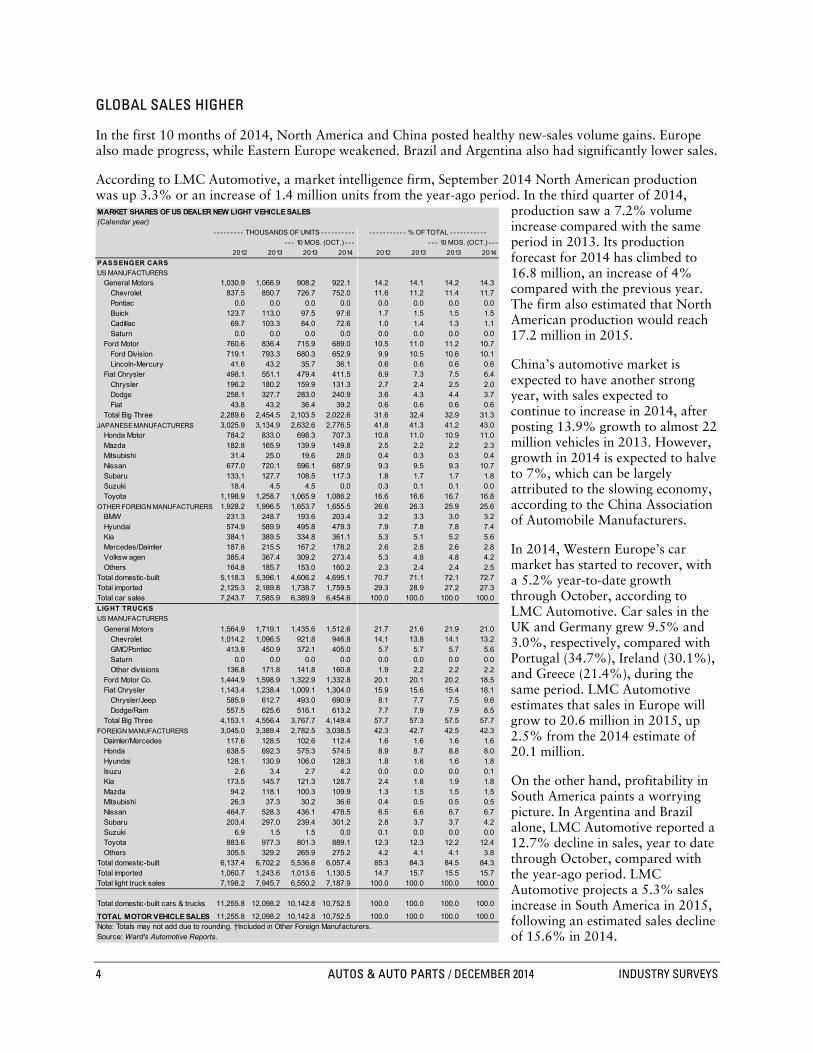
GLOBAL SALES HIGHER
In the first 10 months of 2014, North America and China posted healthy new-sales volume gains. Europe also made progress, while Eastern Europe weakened. Brazil and Argentina also had significantly lower sales.
According to LMC Automotive, a market intelligence firm, September 2014 North American production was up 3.3% or an increase of 1.4 million units from the year-ago period. In the third quarter of 2014,
production saw a 7.2% volume increase compared with the same period in 2013. Its production forecast for 2014 has climbed to 16.8 million, an increase of 4% compared with the previous year. The firm also estimated that North American production would reach 17.2 million in 2015.
China’s automotive market is expected to have another strong year, with sales expected to continue to increase in 2014, after posting 13.9% growth to almost 22 million vehicles in 2013. However, growth in 2014 is expected to halve to 7%, which can be largely attributed to the slowing economy, according to the China Association of Automobile Manufacturers.
In 2014, Western Europe’s car market has started to recover, with a 5.2% year-to-date growth through October, according to LMC Automotive. Car sales in the UK and Germany grew 9.5% and 3.0%, respectively, compared with Portugal (34.7%), Ireland (30.1%), and Greece (21.4%), during the same period. LMC Automotive estimates that sales in Europe will grow to 20.6 million in 2015, up 2.5% from the 2014 estimate of 20.1 million.
On the other hand, profitability in South America paints a worrying picture. In Argentina and Brazil alone, LMC Automotive reported a 12.7% decline in sales, year to date through October, compared with the year-ago period. LMC Automotive projects a 5.3% sales increase in South America in 2015, following an estimated sales decline of 15.6% in 2014.
Table B02: MARKET SHARES OF US DEALER NEW LIGHT VEHICLE SALES
MARKET SHARES OF US DEALER NEW LIGHT VEHICLE SALES(Calendar year)
2012 2013 2013 2014 2012 2013 2013 2014
PASSENGER CARS
US MANUFACTURERS
General Motors 1,030.9 1,066.9 908.2 922.1 14.2 14.1 14.2 14.3Chevrolet 837.5 850.7 726.7 752.0 11.6 11.2 11.4 11.7Pontiac 0.0 0.0 0.0 0.0 0.0 0.0 0.0 0.0Buick 123.7 113.0 97.5 97.6 1.7 1.5 1.5 1.5Cadillac 69.7 103.3 84.0 72.6 1.0 1.4 1.3 1.1Saturn 0.0 0.0 0.0 0.0 0.0 0.0 0.0 0.0
Ford Motor 760.6 836.4 715.9 689.0 10.5 11.0 11.2 10.7Ford Division 719.1 793.3 680.3 652.9 9.9 10.5 10.6 10.1Lincoln-Mercury 41.6 43.2 35.7 36.1 0.6 0.6 0.6 0.6
Fiat Chrysler 498.1 551.1 479.4 411.5 6.9 7.3 7.5 6.4Chrysler 196.2 180.2 159.9 131.3 2.7 2.4 2.5 2.0Dodge 258.1 327.7 283.0 240.9 3.6 4.3 4.4 3.7Fiat 43.8 43.2 36.4 39.2 0.6 0.6 0.6 0.6
Total Big Three 2,289.6 2,454.5 2,103.5 2,022.6 31.6 32.4 32.9 31.3JAPANESE MANUFACTURERS 3,025.9 3,134.9 2,632.6 2,776.5 41.8 41.3 41.2 43.0
Honda Motor 784.2 833.0 698.3 707.3 10.8 11.0 10.9 11.0Mazda 182.8 165.9 139.9 149.8 2.5 2.2 2.2 2.3Mitsubishi 31.4 25.0 19.6 28.0 0.4 0.3 0.3 0.4Nissan 677.0 720.1 596.1 687.9 9.3 9.5 9.3 10.7Subaru 133.1 127.7 108.5 117.3 1.8 1.7 1.7 1.8Suzuki 18.4 4.5 4.5 0.0 0.3 0.1 0.1 0.0Toyota 1,198.9 1,258.7 1,065.9 1,086.2 16.6 16.6 16.7 16.8
OTHER FOREIGN MANUFACTURERS 1,928.2 1,996.5 1,653.7 1,655.5 26.6 26.3 25.9 25.6BMW 231.3 248.7 193.6 203.4 3.2 3.3 3.0 3.2Hyundai 574.9 589.9 495.8 479.3 7.9 7.8 7.8 7.4Kia 384.1 389.5 334.8 361.1 5.3 5.1 5.2 5.6Mercedes/Daimler 187.8 215.5 167.2 178.2 2.6 2.8 2.6 2.8Volksw agen 385.4 367.4 309.2 273.4 5.3 4.8 4.8 4.2Others 164.8 185.7 153.0 160.2 2.3 2.4 2.4 2.5
Total domestic-built 5,118.3 5,396.1 4,606.2 4,695.1 70.7 71.1 72.1 72.7Total imported 2,125.3 2,189.8 1,738.7 1,759.5 29.3 28.9 27.2 27.3Total car sales 7,243.7 7,585.9 6,389.9 6,454.6 100.0 100.0 100.0 100.0LIGHT TRUCKS
US MANUFACTURERS
General Motors 1,564.9 1,719.1 1,435.6 1,512.6 21.7 21.6 21.9 21.0Chevrolet 1,014.2 1,096.5 921.8 946.8 14.1 13.8 14.1 13.2GMC/Pontiac 413.9 450.9 372.1 405.0 5.7 5.7 5.7 5.6Saturn 0.0 0.0 0.0 0.0 0.0 0.0 0.0 0.0Other divisions 136.8 171.8 141.8 160.8 1.9 2.2 2.2 2.2
Ford Motor Co. 1,444.9 1,598.9 1,322.9 1,332.8 20.1 20.1 20.2 18.5Fiat Chrysler 1,143.4 1,238.4 1,009.1 1,304.0 15.9 15.6 15.4 18.1
Chrysler/Jeep 585.9 612.7 493.0 690.9 8.1 7.7 7.5 9.6Dodge/Ram 557.5 625.6 516.1 613.2 7.7 7.9 7.9 8.5
Total Big Three 4,153.1 4,556.4 3,767.7 4,149.4 57.7 57.3 57.5 57.7FOREIGN MANUFACTURERS 3,045.0 3,389.4 2,782.5 3,038.5 42.3 42.7 42.5 42.3
Daimler/Mercedes 117.6 128.5 102.6 112.4 1.6 1.6 1.6 1.6Honda 638.5 692.3 575.3 574.5 8.9 8.7 8.8 8.0Hyundai 128.1 130.9 106.0 128.3 1.8 1.6 1.6 1.8Isuzu 2.6 3.4 2.7 4.2 0.0 0.0 0.0 0.1Kia 173.5 145.7 121.3 128.7 2.4 1.8 1.9 1.8Mazda 94.2 118.1 100.3 109.9 1.3 1.5 1.5 1.5Mitsubishi 26.3 37.3 30.2 36.6 0.4 0.5 0.5 0.5Nissan 464.7 528.3 436.1 478.5 6.5 6.6 6.7 6.7Subaru 203.4 297.0 239.4 301.2 2.8 3.7 3.7 4.2Suzuki 6.9 1.5 1.5 0.0 0.1 0.0 0.0 0.0Toyota 883.6 977.3 801.3 889.1 12.3 12.3 12.2 12.4Others 305.5 329.2 265.9 275.2 4.2 4.1 4.1 3.8
Total domestic-built 6,137.4 6,702.2 5,536.6 6,057.4 85.3 84.3 84.5 84.3Total imported 1,060.7 1,243.6 1,013.6 1,130.5 14.7 15.7 15.5 15.7Total light truck sales 7,198.2 7,945.7 6,550.2 7,187.9 100.0 100.0 100.0 100.0
Total domestic-built cars & trucks 11,255.8 12,098.2 10,142.8 10,752.5 100.0 100.0 100.0 100.0
TOTAL MOTOR VEHICLE SALES 11,255.8 12,098.2 10,142.8 10,752.5 100.0 100.0 100.0 100.0Note: Totals may not add due to rounding. †Included in Other Foreign Manufacturers.Source: Ward's Automotive Reports.
- - - 10 MOS. (OCT.) - - -
- - - - - - - - - THOUSANDS OF UNITS - - - - - - - - - - - - - - - - - - - - - % OF TOTAL - - - - - - - - - - -
- - - 10 MOS. (OCT.) - - -

INDUSTRY SURVEYS AUTOS & AUTO PARTS / DECEMBER 2014 5
Pickups picking up US pickup sales gained momentum throughout 2014, and we expect further growth in 2015. The Detroit Three—the three biggest US automakers, which are based in Detroit, Michigan—reported combined year-over-year double-digit sales gains in 2013, mainly due to the rising demand for pickup trucks. Year to date through October, the Detroit Three reported growth of 5.2%, which can largely be attributed to a 0.6% drop in Ford sales, a 3.9% sales growth of GM vehicles, and the double-digit growth of Fiat Chrysler vehicles at 15.3%.
According to WardsAuto, year to date through October, sales of large pickup trucks rose 5.4%, year over year. Chrysler Group LLC sales of Ram pickup trucks rose 22.9%, while Ford’s F-series truck sales declined 0.5%, as buyers wait for the 2015 F-150. Sales of GM’s Silverado and GMC Sierra climbed 6.4% and 9.0%, respectively. In 2013, sales of large pickup trucks rose 10% on a year-on-year basis. Year to date through October, truck sales grew 9.8%.
We think that economic growth and steady gasoline prices will support expansion in the highly profitable light truck segment. Furthermore, new and refreshed pickup trucks—whether available or soon-to-be for sale—should boost overall truck sales, especially when improving construction, housing, and contractor activities are ongoing.
According to the US Census Bureau, housing starts reached a seasonally adjusted annual rate (SAAR) of nearly 9,839,000 units in year to date through October, up 9.1% from 9,017,000 in the same period in 2013. As of October, Standard & Poor’s Economics (which operates separately from S&P Capital IQ) forecast housing starts to reach 1.02 million in 2014 and 1.28 million in 2015, both up from the 930,000 units in 2013.
Detroit Three market share relatively stable in 2014 According to WardsAuto, US sales in light vehicles reached 13.6 million units year to date through October, which is a 5.4% increase from the year-ago period. Of these units sold, GM contributed 2.3 million units with a 3.9% sales increase. Ford’s sales dropped 0.8% to 2.0 million units, and Fiat Chrysler increased 15.3% to 1.5 million units.
The market share of the Detroit Three in the light truck category is up to 57.7%, year to date through October, from 57.5% recorded a year ago. The slow market share growth can be attributed to a decline in GM’s and Ford’s market share, from 21.9% and 21.0% as of October to 20.2% and 18.5%, respectively.
China to remain the world’s largest vehicle market Sales of new vehicles in China reached a record 21.98 million units in 2013, according to WardsAuto. This made China the first country to exceed 20 million deliveries in a year. The huge market also overtook the 20-million benchmark in auto production, with 22.12 million units manufactured in 2013. Year to date through October, China’s vehicle sales grew 8.1%, reaching 19.2 million sales, according to LMC. China had a 28.2% share in global vehicle sales as of October, outperforming the US, which had a 17.5% share.
In 2009, China overcame the US’ decades-long run as sales champ, years earlier than we had expected. China remains an under-penetrated market and S&P thinks that the country is likely to continue to lead in the future, given its large population. In our view, this development represents a shift in the center of the automotive world from Detroit to Asia. We expect more and more automotive trends and technologies to originate in Asia, as that market grows even larger in size and importance. Asia and other emerging markets already account for the majority of new vehicle growth. Nevertheless, the US and Europe will remain important and competitive markets for automotive products.
FORD CHINA SALES TAKING OFF
Ford China sold 906,613 units year to date through October, posting a strong year-on-year growth of 22.2%. This steady growth in sales is significant in the overall growth of the Chinese market. Ford has increased its focus on the Chinese market, as it expects that this market will have the highest growth rates in

6 AUTOS & AUTO PARTS / DECEMBER 2014 INDUSTRY SURVEYS
both revenue and profits over the next few years. In 2013, wholesale volume was up 30% to 935,813 vehicles, while revenue rose 17%, compared with 2012.
Ford is a late entrant in the Chinese market compared with its peers. It primarily concentrates its operations in the US and Europe and has a small market share in China—around 5%, versus nearly 15% each for Volkswagen and GM. Ford began producing cars in a Chinese joint venture in 2003, four years after GM and 18 years after Volkswagen (Forbes, March 19, 2014). To make up for its late entry, the company plans to increase its market share to 6% by 2015 through expanding its production capacity, marketing and distribution network, and introducing new products.
Global sales forecast In 2015, the rising prosperity in emerging markets, led by China, is expected to drive global demand growth, and European demand is expected to rise slightly, partly offset by declines in some emerging markets. S&P thinks that higher volume in the US and abroad will help increase corporate profit and cash flow, but this could be partly offset by difficulties coming from intense competition in Europe. Overall, we expect auto sales to increase in 2015, helped in part by rising wealth, pent-up demand, and the improved availability of credit.
Europe stabilizing In the third quarter of 2014, Eurozone gross domestic product (GDP) rose only 1.0%, slightly higher than the previous quarter’s 0.9% growth. Europe has pressured GM and Ford in the troubled regions, but we think the European demand should rise slightly, partly offset by declines in some emerging markets. According to Ford, the industry’s SAAR of vehicles was 14.5 million units in the third quarter of 2014, for the 20 European markets it tracks.
Ford Europe’s sales grew 7.8% year to date through September, on a year-on-year basis. The company’s European market share increased to 8.1%, up from 2013. In addition, Ford’s European operations reported a pre-tax loss of $619 million, year to date through September, an improvement over the $913 million loss of a year earlier, and revenues of $22.7 billion, up from $20.3 billion in 2013.
GM Europe reported an operating loss before income taxes of $976 million year to date through September, versus a $504 million loss in the prior-year period. Overall, GM Europe’s total net sales and revenue in the first nine months of 2014 reached $16.8 billion, up 3.5% from $16.3 billion in the same period in 2013.
BATTLE FOR THE MIDSIZED VEHICLE
Demand for the latest models with dramatic styling and interior is what fuels the battle in family-sedan sector. Companies usually wait five years to redesign their vehicles, but fierce competition in the midsized vehicles is driving automakers to restyle sedans faster. For instance, in May 2014, Toyota launched redesigns of the current version of Camry that has been around for only two years, and Hyundai debuted the redesign of its 2011 Sonata model. Camry has been leading the race in this segment for 12 years now, but keeping up with the pace and closing the lead are Ford’s Fusion, Nissan’s Altima, and Honda’s Accord. Year to date through October, Camry sold 368,006 units (up 5.8% from the year-ago period); Honda Accord, 331,167 units (up 8.0%); Ford Fusion, 263,431 units (up 6.2%); and Nissan Altima, 280,479 units (up 3.4%).
The demand for affordable midsized vehicles, the biggest segment of the car market, is at a historically high level, sparking competition among car manufacturers to get the biggest piece of the pie. Hyundai’s strategy lies in Sonata’s below-industry-average pricing and “fluidic sculpture,” the company’s design philosophy that centers on a flowing and dynamic form.
Automakers are in a race to offer the best deals and discounts. With the looming threat of Accord overtaking Camry, Toyota’s sales incentives averaged about $3,200 in the first three months of 2014, which is almost $500 more than the industry’s average for midsized cars. In October Toyota was offering 0% financing for 72 months with a $500 rebate for 2014 models, Honda was offering 0% for 60 months with $1,500 rebate.

INDUSTRY SURVEYS AUTOS & AUTO PARTS / DECEMBER 2014 7
BANKS’ AUTO LENDING INCREASES
Rising vehicle sales of vehicles has led to an increase in overall auto lending by banks and other financial institutions and auto finance companies. According to the latest “National Consumer Credit Trends Report” published by Equifax (a consumer credit reporting agency), balances on outstanding auto loans in August 2014 totaled $924.2 billion, an all-time high and a 10.8% increase from the year-ago period. While the auto finance companies were the first to start lending after the financial crisis, banks and other financial institutions have increased their lending recently. According to Experian, automotive delinquency rate has been improving since the crisis, and auto finance lenders have been granting longer-term loans. In its “State of the Automotive Finance Market Second Quarter 2014”, Experian reported that recent automotive 30-day delinquency decreased to 1.9% in banks, but increased to 5.1% in financial institutions during the second quarter of the year. We think this decline in delinquency rates will continue in 2014.
The average monthly payment through the second quarter of 2014 was $407, slightly lower than the $408 a year ago. On the other hand, average interest rate for new cars and used cars was 4.6% and 8.8%, respectively, compared with 4.4% and 8.6% a year ago. In the second quarter of 2014, the average loan term was 66 months for new cars (up from 65 months a year earlier) and 61 months for used cars (flat from year earlier).
Auto prices rise, but monthly loan payments remain flat Attractive deals are making it easier for more buyers to get their hands on new-car purchases. According to Kelley Blue Book, a vehicle valuation and automotive research company, the average transaction price of new cars has increased from $25,500 in 2008 to an estimated $33,361 in October 2014, a moderate increase from $33,176 in the prior-year period. Even though this represents a 30.8% increase in transaction prices over the last six years, average monthly payments on car loans have declined 2% from $464 in 2008 to an estimated $455 in 2014. Therefore, more middle-class car buyers can afford more expensive vehicles despite flat wages. Consumers need to be aware, however, of lease contract limitations and longer-term debts.
Several reasons explain why car loan payments have remained essentially flat, including record low interest rates, loans with longer repayment schedules, subsidized loans, and a strong market for used cars. According to J.D. Power and Associates, loans with a tenure of 72 and more months were used to finance an estimated 31% of all car purchases in 2014, versus 22% in 2009. Furthermore, the market for used cars has been strong as the average transaction price of used cars has increased from $15,900 in 2008 to an estimated $19,300 in 2014, according to J.D. Power.
AUTO RETAILERS: IMPROVED OPERATING EFFICIENCIES
Auto retailers cut their operating costs in order to survive in the environment of declining sales during the economic recession. However, as the economy gradually improved and auto sales picked up in 2013, we see a discipline among auto retailers to contain operating costs. Some of the largest auto retailers have seen their selling, general and administrative (SGA) costs as a percentage of gross profit improve considerably over time. For instance, AutoNation’s SGA as percentage of gross profit declined from 75.3% in 2008 to 70.1% in 2013. During the first nine months of 2014, the company saw this figure at 70.2%, slightly lower than 70.6% from a year ago due to increased sales and effective management of costs.
Replacement market still strong The US replacement parts market continued to grow strongly in 2013 as thrifty consumers repaired aging vehicles. According to Autocare Association, a trade group, the aftermarket industry’s revenues totaled $317.2 billion in 2013, up 3.1% from 2012. These figures include all automotive aftermarket sales (including medium and heavy-duty vehicle parts). We expect improved market demand for US automotive replacement parts for the following reasons: vehicle longevity has crossed 11 years, thrifty consumers continue to hold on to and repair their aging vehicles, and more than 261 million vehicles are expected to be on the road by 2017, according to Autocare Association.
Many auto parts suppliers are increasing their revenues generated outside the US, and emerging markets are becoming more attractive to parts manufacturers due to lower labor costs. Tenneco Inc., which produces
8 AUTOS & AUTO PARTS / DECEMBER 2014 INDUSTRY SURVEYS
ride control and exhaust systems for original equipment manufacturers (OEMs) and the aftermarket, is expected to see continued growth in its partnerships with OEMs in North America and Europe. Most of the company’s cost cutting has been aimed at shifting manufacturing overseas. We expect Tenneco’s revenue to advance about 9% in 2014 to $8.7 billion and a further 10% increase in 2015.
TIRES: ORIGINAL EQUIPMENT SHOULD DRIVE TIRE SALES HIGHER
With the expected rise in global vehicle production in 2015 comes an expanding global demand for tires. Replacement demand could also improve in the US as the economy starts to pick up. At some point soon, we think that consumers will start spending to replace tires and purchase items they have deferred.
Modern Tire Dealer, a monthly trade publication, reported in “Facts Issue 2014” that original equipment (OE) shipments of passenger tires rose about 9% to 44.0 million in 2013 from 40.5 million units in 2012, while light truck tires rose about 5% to 4.4 million in 2013 from 4.2 million in 2012. Total replacement passenger tire units shipped in 2013 amounted to 201.6 million units, up 5% from 192.0 in 2012, and nearing the record 205.8 million in 2005. Sales for replacement passenger tires reached $25.0 billion, truck tires $6.3 billion, and light truck tires $4.9 billion. Tire imports from China increased markedly by 57.5% to 51.2 million units in 2013 from 32.5 million in 2012.
About three-quarters of the tire shipments for the automotive industry are for replacement tires, with one-quarter for new vehicles. Margins on replacement tires are typically higher than for original equipment tires, as automakers receive discounts for high volume buying.
Costs have been more favorable than we expected in terms of raw materials. Tire manufacturers, which have been dealing with high raw material costs for a long time, witnessed a decline in prices recently. A noteworthy raw material is rubber, which reached a five-year low in October 2014. While the price trend of rubber hurts farmers in countries like Thailand and Vietnam, it has helped boost revenues for tire manufacturers, such as Cooper Tire & Rubber Co. and Goodyear Tire & Rubber Co. Year to date through September, Goodyear’s sales in North America dipped 8.7% on a year-on-year basis. Nonetheless, Goodyear’s operating income in North America increased 16.7%. Similarly, Cooper Tire’s net revenues increased 2.0% year to date through September, whereas its operating profit increased 23.7%. This indicates that low rubber prices have helped trim down the operating costs of both Goodyear and Cooper Tire, allowing the companies to post favorable operating income.
Despite declining rubber prices, producers may shrink their supply, which could increase the prices for this commodity once again. While we think volume will rise in 2015, potentially higher raw materials costs could restrict profitability.
NEW LIGHT VEHICLE SALES FORECASTS
S&P projects that US light vehicle sales volume would reach 16.4 million units in 2014, a 5.5% increase compared with a year-ago period. In 2015, we expect this sales volume to further increase to 16.8 million As of October 2014, Standard & Poor’s Economics was forecasting a 2.2% increase in real GDP for 2014 and a 3.0% increase for 2015. We see the industry in the early stages of a multiyear uptrend in demand.
As of October 2014, J.D. Power and Associates and LMC Automotive were forecasting that North American production would reach 16.8 million, up 4% from the year-ago period. LMC also adjusted its forecast for light vehicle retail sales to 13.6 million units this year, while estimated total light vehicle units were raised to 16.4 million.
SUB-INDUSTRY REVIEWS & OUTLOOK
As of November 2014, our fundamental outlook for the automobile manufacturers sub-industry for the next 12 months was positive. We see US automotive demand trending higher on a year-over-year basis, and while we expect to see uneven geographic progress, we look for global demand to rise in 2014. Also, despite the risks we perceive, we forecast steady improvement overall. Europe has pressured GM and Ford in the
INDUSTRY SURVEYS AUTOS & AUTO PARTS / DECEMBER 2014 9
troubled region, but the companies have shown progress, and we see slightly higher volume sales there after years of declines. Russia and parts of South America still look likely to be challenged areas.
We estimate US light vehicle sales in 2014 rising 5.5% to 16.4 million units, and reaching 16.8 million in 2015. In 2014, we expect gains in most other regions too, including emerging markets led by China, leading to a global demand growth and slight rise in European demand. However, this is also partly offset by declines in some emerging markets.
We think higher volume in the US and abroad versus 2013 will help corporate profits and cash flows. European difficulties, including competitive pressures, should be partly offsetting factors. Positive factors we see in the US include pent-up demand and widely available access to consumer credit. The average vehicle is now more than 11 years old, an industry record. We think lower gasoline prices are a positive for sales.
We also think recently lower gasoline prices and economic growth will support expansion in the highly profitable light truck segment. Also, new and refreshed pickup trucks—available and soon-to-be for sale—combined with improved construction, as well as housing and contractor activity, should boost overall truck sales. Luxury vehicle sales in the US, which were also restrained by economic weakness, should show improvement, in our view, as wealthy consumers become more confident. Luxury sales should be strong in China.
We think GM’s and Chrysler’s respective bankruptcy filings allowed the automakers to shed billions of dollars in liabilities and lower their operating costs. Overall, we see this makes the companies more cost-competitive and focused, but they still face competitive challenges. Chrysler has merged with Fiat SpA of Italy.
As for the auto parts and equipment sub-industry, our outlook is also positive, reflecting our expectations for rising demand and volume in the US and abroad, including China. Many auto parts suppliers are increasing their revenues generated outside the US. Emerging markets are becoming more attractive to manufacturers of auto parts due to lower labor costs for manufacturing and engineering and/or due to growing demand in local and regional markets. Over time, we expect some domestic parts suppliers to increase penetration of import brands, which are shifting more of their production to the US.
We think the worst has passed for Europe, but it will likely remain relatively weak during 2015. We expect profits should benefit from higher global vehicle production and higher production in Asia, despite a likely decline in Japan. Lastly, we expect improved market demand for US automotive replacement parts in 2014 and 2015.
Year to date through November 11, 2014, the S&P Automobile Manufacturers Index was down 10.8% while the S&P Auto Parts & Equipment Index rose moderately to 1.8%, versus the 9.8% gain for the S&P 1500 Index. In 2013, the Automobile Manufacturers Index and Auto Parts & Equipment Index surged 27.8% and 62.4%, respectively, compared with a 30.1% gain for the S&P 1500.

10 AUTOS & AUTO PARTS / DECEMBER 2014 INDUSTRY SURVEYS
INDUSTRY PROFILE
Competition in overdrive
Based on dollar value, the US is the world’s largest consumer market for light vehicles, a category that comprises passenger cars and light trucks. According to the National Automobile Dealers Association’s “NADA Data 2014”, revenues (including sales of new and used vehicles, as well as service and other items)
for dealers in the US totaled $730 billion in 2013, up 8.8% from in the previous year.
Year to date through October, new light vehicle sales in the US reached 13.6 million (up from 12.9 million in 2013), whereas US vehicle sales reached 14.0 million (up from 13.2 million in the year-ago period). For 2013, new light vehicle sales in the US advanced to 15.5 million, compared with 14.5 million in 2012 and 12.7 million in 2011. In 2013, US vehicle sales reached 15.9 million units, up 7.4% from 14.8 million in
2012. S&P Capital IQ (S&P) expects volume to increase to 16.4 million in 2014, fueled by replacement demand as American consumers replace their aging vehicles.
In recent years, light trucks have been popular passenger vehicles. In terms of units sold, light trucks (less than 14,000 pounds gross vehicle weight, or GVW) accounted for almost 96% of the truck market as of October 2014.
Approximately 335,000 medium- and heavy-duty trucks were sold in the US year to date through October, up from 288,000 in the year-ago period. In 2013, about 352,000 medium- and heavy-duty trucks were sold, up from
346,000 in 2012, but still sharply lower than the high of 545,000 in 2006. (Medium-duty trucks weigh 14,001 to 33,000 pounds; heavy-duty trucks exceed 33,000 pounds). S&P estimates that sales of medium- and heavy-duty trucks will advance about 14% in 2014.
Table B18: US MOTOR VEHICLE SALES & PRODUCTION
US MOTOR VEHICLE SALES & PRODUCTION(In thousands)
MED. & TOTAL MED. & TOTAL
PASSENGER LIGHT HEAVY MOTOR PASSENGER LIGHT HEAVY MOTOR
YEAR CARS TRUCKS TRUCKS VEHICLES CARS TRUCKS TRUCKS VEHICLES
2014ʬ 6,455 7,188 335 13,977 3,606 6,055 246 9,9082013ʬ 6,390 6,550 288 13,228 3,709 5,455 214 9,378
2013 7,586 7,946 352 15,884 4,369 6,446 251 11,0662012 7,244 7,198 346 14,788 4,109 5,959 268 10,3362011 6,089 6,645 306 13,041 2,978 5,441 243 8,6622010 5,635 5,919 218 11,772 2,732 4,866 146 7,7442009 5,401 5,001 200 10,601 2,196 3,382 132 5,7102008 6,813 6,381 298 13,493 3,731 4,671 225 8,6272007 7,618 8,471 371 16,460 3,867 6,549 279 10,6952006 7,821 8,684 545 17,049 4,312 6,431 462 11,2052005 7,667 9,281 497 17,444 4,266 7,203 422 11,8912004 7,506 9,361 432 17,299 4,166 7,373 386 11,9242003 7,610 9,029 328 16,967 4,453 7,319 268 12,040NOTE: Totals may not add due to rounding. *Total US sales, including foreign models produced bothinside and outside the United States, as w ell as domestic models produced in Canada and Mexico.†Foreign and domestic models produced inside the United States. ʬData through October.Source: Ward's Automotive Reports.
- - - - - - - - - - - - - - - - - - SALES* - - - - - - - - - - - - - - - - - - - - - - - - - - - - - - - - - PRODUCTION† - - - - - - - - - - - - - - -
Table B12: US RETAIL SALES OF MOTOR VEHICLES, BY WEIGHT CLASS
US RETAIL SALES OF MOTOR VEHICLES, BY WEIGHT CLASS
- - - - - - - 2013 - - - - - - -
UNITS % OF UNITS % OF UNITS % OF
CATEGORY (THOUS.) TOTAL (THOUS.) TOTAL (THOUS.) TOTAL
PASSENGER CARS 7,586 49.2 6,390 48.3 6,455 46.2Domestic 5,396 35.0 4,606 34.8 4,695 33.6Import 2,190 14.2 1,784 13.5 1,759 12.6
TRUCKS 7,848 50.8 6,838 51.7 7,522 53.8Light trucks, total 7,496 48.6 6,550 49.5 7,188 51.4
0-6,000 lbs. 5,165 33.5 4,636 35.0 5,126 36.76,001-10,000 lbs. 2,077 13.5 1,708 12.9 1,851 13.210,001-14,000 lbs. 254 1.6 207 1.6 211 1.5
Medium-duty trucks, total 167 1.1 138 1.0 154 1.114,001-26,000 lbs. 119 0.8 98 0.7 109 0.826,001-33,000 lbs. 48 0.3 40 0.3 45 0.3
Heavy-duty trucks 185 1.2 151 1.1 180 1.3(over 33,000 lbs.)
Total US sales 15,434 100.0 13,228 100.0 13,977 100.0*Data through October.Source: Ward's Automotive Reports.
- - - - - - - - - - - - - - - OCTOBER - - - - - - - - - - - - - - -
- - - - - - 2013* - - - - - - - - - - - - - 2014* - - - - - - -

INDUSTRY SURVEYS AUTOS & AUTO PARTS / DECEMBER 2014 11
Participants in the medium- and heavy-duty commercial truck markets include Daimler AG, Freightliner Corp. (a subsidiary of Daimler that makes Freightliner brand trucks), Volvo Trucks North America Inc., PACCAR Inc., Navistar International Transportation Corp., and Mack Trucks Inc. (acquired by Volvo in 2001).
THE DETROIT THREE SEE DWINDLING MARKET SHARE
The “Detroit Three” (formerly known as the “Big Three”) US automakers—General Motors Co. (or GM, the new name of General Motors Corp. following its emergence from bankruptcy in 2009), Ford Motor Co., and Chrysler Group LLC—accounted for 31.3% of passenger cars sold in the US year to date through October. Their market shares were 14.3%, 10.7%, and 6.4%, respectively. Year to date through October, the top three foreign companies had a combined US car market share of 38.4%: Toyota Motor Corp. (16.8%), Honda Motor Co. Ltd. (11.0%), and Nissan Motor Co. Ltd. (10.7%).
In the light truck category, however, the Detroit Three still dominates the US market. Ford, GM (maker of Chevrolet and GMC trucks), and Chrysler (maker of Dodge trucks and Jeep SUVs and recreational vehicles) accounted for 57.7% of light truck sales year to date through October. Among foreign automakers expanding in the US light truck market are Toyota (12.4%), Honda (8.0%), and Nissan (6.7%).
In the overall US light vehicle market (a category that comprises passenger cars and light trucks), Detroit Three brands had a 44.9% share in 2013, according to industry publication Ward’s Automotive Reports, up from 44.6% in 2012 and down from 46.9% in 2011. Market share for the Detroit Three brands in October 2014 was 45.2% slightly down from 45.4% a year ago.
Auto parts sector highly fragmented The auto parts sector of the US auto industry is highly fragmented, consisting of thousands of parts suppliers that range in size from small shops to large multinational corporations. It comprises four lines of business: original equipment manufacturing, replacement parts manufacturing, replacement parts distribution, and rubber fabrication.
Table B01: NORTH AMERICAN MOTOR VEHICLE PRODUCTION
NORTH AMERICAN MOTOR VEHICLE PRODUCTION(Calendar year)
2013 2013* 2014* 2013 2013* 2014* 2013 2013* 2014* 2013 2013* 2014*
General Motors 1,249 1,045 1,032 17.6 17.2 17.2 2,036 1,726 1,835 21.7 21.8 21.0Ford Motor 952 923 781 13.4 15.2 13.1 2,032 1,723 1,742 21.6 21.7 19.9Fiat Chrysler 641 546 446 9.1 9.0 7.4 1,868 1,539 1,921 19.9 19.4 22.0
Total Big Three 2,841 2,514 2,259 40.1 41.4 37.7 5,936 4,987 5,498 63.2 62.9 62.8Auto Alliance 117 ... ... 1.7 ... ... ... ... ... ... ... ... BMW ... ... ... ... ... ... 297 255 295 3.2 3.2 3.4Honda Motor 949 815 811 13.4 13.4 13.5 832 708 724 8.9 8.9 8.3Hyundai 399 348 337 5.6 5.7 5.6 ... ... ... ... ... ... Isuzu ... ... ... ... ... ... 4 4 5 0.0 0.0 0.1Kia 134 114 122 1.9 1.9 2.0 236 203 196 2.5 2.6 2.2Mazda ... ... 77 ... ... ... ... ... ... Mercedes ... ... 22 ... ... 0.4 186 159 160 2.0 2.0 1.8Mitsubishi ... ... ... ... ... ... 67 57 59 0.7 0.7 0.7Nissan 1,038 884 977 14.7 14.5 16.3 433 362 513 4.6 4.6 5.9Subaru 138 119 128 1.9 2.0 2.1 128 109 113 1.4 1.4 1.3Tesla ... 20 27 ... 0.3 0.5Toyota 815 690 719 11.5 11.4 12.0 945 810 861 10.1 10.2 9.8Volksw agen 652 570 509 9.2 9.4 8.5 ... ... ... ... ... ... Others ... ... ... ... ... ... 328 278 324 3.5 3.5 3.7
Total transplants 4,243 3,560 3,728 59.9 58.6 62.3 3,458 2,946 3,250 36.8 37.1 37.2Grand total 7,084 6,074 5,987 100.0 100.0 100.0 9,394 7,933 8,748 100.0 100.0 100.0
Note: Totals may not add due to rounding. *Data through October.Source: Ward's Automotive Reports.
CARS TRUCKS
THOUSANDS OF UNITS - - - - - - % OF TOTAL - - - - - - THOUSANDS OF UNITS - - - - - - % OF TOTAL - - - - - -

12 AUTOS & AUTO PARTS / DECEMBER 2014 INDUSTRY SURVEYS
Original equipment manufacturers (OEM). These manufacturers produce parts and components that automakers use in the assembly of new vehicles. Thousands of OEMs are independent firms; among the largest independents are Dana Holding Corp., Delphi Automotive PLC, Goodyear Tire & Rubber Co., Johnson Controls Inc., Magna International Inc., Superior Industries International Inc., Tenneco Inc., TRW Automotive Holdings, and Visteon Corp. Other OEMs are subsidiaries of large diversified companies, such as AlliedSignal Inc., Eaton Corp., General Electric Co., 3M Co., PPG Industries, Textron Inc., and United Technologies Corp.
Replacement parts manufacturing. Participants in the replacement market, also known as the aftermarket, produce parts and components to replace or supplement parts that were included in a vehicle’s original assembly. Among the field’s important players are Meritor Inc., Cooper Tire & Rubber Co., Dana Holding Corp., and Federal-Mogul Corp. As in the original equipment segment, aftermarket parts suppliers and distributors may be independent companies or subsidiaries of larger companies. Some firms, like Dana, participate in both the original equipment and replacement sectors.
Replacement parts distribution. Companies in this category distribute automotive accessories and parts, such as air filters, light bulbs, and fuses, which replace or supplement original vehicle parts. Sales are primarily to automotive parts retail stores and fleet owners.
Genuine Parts Co. (GPC) is by far the largest independent distributor of auto parts, and its largest division is The Automotive Parts Group. The Group operates four Balkamp distribution centers, six Rayloc facilities, 12 Johnson industries facilities, and 58 distribution centers associated with the National Automotive Parts Association (NAPA), a leading US franchiser of auto/parts accessories stores and distribution centers. GPC also operates 900 co-owned NAPA auto parts stores, and its major products include access to more than 300,000 items such as heavy-duty parts, farm and marine supplies, and refinishing supplies. The company serves approximately 5,800 NAPA auto parts stores in the US, according to GPC’s 2013 annual report.
Rubber fabricating. Rubber fabricators manufacture the tires, belts, hoses, and other rubber products used in vehicles. Approximately 60% of rubber production for the auto industry is tire-related.
About half of worldwide tire production is estimated to come from three companies: Compagnie Générale des Établissements Michelin (France), Goodyear Tire & Rubber (US), and Bridgestone/Firestone Inc. (Japan). Foreign-based tire manufacturers now own a substantial portion of US domestic capacity. Only two publicly traded US tire companies remain: Cooper and Goodyear.
In January 2014, the Modern Tire Dealer reported that 298 million tires (for both original equipment and replacement) were shipped in 2013 (latest available), more than the 284 million tires in 2012. Of these shipments, 245.6 million tires were for replacement, up from 236.3 million tires in 2012. S&P thinks economic growth should cause industry tire sales to improve in the remainder of 2014 and into 2015, primarily driven by new vehicle production and better results in 2013 due to an improving global economy.
INDUSTRY TRENDS
In the luxury automobile market trend, new buyers take center stage. According to a report published by the National Automobile Dealers Association (NADA) in its April 2014 “NADA Market Review: Shifting Luxury Vehicle Preferences”, luxury sales, which includes luxury cars and utility vehicles, soared to more than 62% between 2009 and 2013, and climbed to 12.8% of the total market in 2013. Year to date through September, luxury car sales increased 5.9%, according to WardsAuto.
NADA also reported that luxury car share went up 0.4 percentage points in 2013 as automakers successfully competed to attract new buyers entering the market. Among luxury utility vehicles, the consumer preferences for the crossover utility vehicle (CUV) increased 0.9 percentage points, while the sport utility vehicles’ (SUVs) consumer preference points were down 0.3 percentage points. Buyers appear to be leaning more toward the lower, lighter, and economical CUVs than the roomy, fuel-thirsty SUVs. However,

INDUSTRY SURVEYS AUTOS & AUTO PARTS / DECEMBER 2014 13
according to WardsAuto data, there was a shift to SUVs in the first nine months of 2014—sales of luxury SUVs (16.9%) outperformed luxury CUVs (10.7%), thanks to lower gas prices.
NADA’s April 2014 report also highlighted that the luxury compact car segment has retained about 49% of its perceived value—more than the luxury midsize and large-car segments. Thus, luxury compact cars, which cost less than the midsized and large cars, are becoming more popular due to their superior value retention. In fact, the new lower-luxury cars market share is 5%, substantially higher than the 3% share of the other luxury car segments. Since retention value for luxury compact cars is high, used cars in this segment are in high demand. Similarly, the luxury compact utility vehicle and the luxury large SUVs have retained their value at 60%. Buyers, who are becoming more value conscious, prefer the cost-effective and better-value luxury CUVs to the more expensive SUVs.
Luxury compact utilities volume was 70,000 in 2013 and this is forecast to climb 51% by 2015, according to NADA, resulting in lower prices expected for used luxury CUVs in 2014 and 2015. On the other hand, luxury large SUVs are forecast to increase by only 17% by 2015, which shows declining consumer demand for these vehicles since 2013. Despite this small rise in supply, prices in this segment are expected to decline, partly because of steep depreciation curves.
Other industry trends include the increasing prevalence of smaller-sized cars, particularly in the developing world; improved repayment rates on vehicle loans; rising vehicle rental revenues; and the growing phenomenon of car sharing.
Exogenous factors are also having an impact on the industry. Higher oil prices, as well as expectations that any lull in these prices is only temporary, are spurring demand for smaller, more fuel-efficient gasoline-powered vehicles, and encouraging investment in alternative fuel technologies. In addition, efforts to reduce US energy dependence and the negative impact of fossil fuels are forces driving regulatory demands for higher fuel efficiency.
Notwithstanding these cost pressures, consumers still want vehicles that are safe and fun. Demand for the latest technology—including entertainment systems and communications devices—continues to drive growth in automotive electronics. In addition, demand for safety continues to increase. We note that greater use of safety equipment has helped reduce vehicle fatality rates in the US.
Economically expanding emerging markets are becoming a key source of growth for today’s global auto industry. Companies in developing markets are looking for opportunities in the US, while US manufacturers are looking to expand sales and production in other areas. In the US, challenges from import brands mean that the top US automakers, Detroit Three—General Motors Co. (GM), Ford Motor Co., and Chrysler (now Fiat Chrysler Automobiles) —have long seen reduced share in their domestic market. At the same time, growth in global demand means that the US market is accounting for a shrinking share of worldwide industry volume. For US auto parts companies, automaker demand for larger global suppliers has contributed to industry consolidation, as has profit margin pressure from rapidly rising costs.
THE ROLE OF INTERNET IN PURCHASE DECISIONS
Millennials, also known as Generation Y consumers (born 1977–1994) have outpaced their older Generation X counterparts (born 1965–1976) in new-car sales. In July, J.D. Power and Associates reported that Millennials accounted for 25% of total car sales year to date through June, whereas Gen X accounted for 24% of sales. Compact cars were the most popular choice for Millennials, whereas compact SUVs were more popular for Gen X buyers.
With the shifting share of the different generations on the US car market, understanding how they make their car purchase decisions is worth noting. The Multi-Device Car Shopping Study published by AutoTrader.com in October 2013 revealed that the PC or laptop is still the primary device used for car shopping, although a rapid adoption of mobile devices can be seen. The study found that 23% of car shoppers use two or more devices when purchasing a car. According to the study, 80% of consumers think that multi-device usage enhances the vehicle shopping process.

14 AUTOS & AUTO PARTS / DECEMBER 2014 INDUSTRY SURVEYS
LEASE RETURNS ON THE RISE
Another trend in the automobile market is the release of pent-up demand through an increasing number of lease returners. According to Edmund.com’s “Q3 2014 Used Vehicle Report”, lease returns are increasing, which resulted in greater concentration of newer used vehicles sold in the quarter. The report cited that one out of five vehicles sold in the third quarter of 2014 were between one and two years old.
Overall, an increase in lease returns can provide benefits for dealers and automakers. When a car lease expires, a lease return could present an opportunity for a dealer to sell a customer another car or to offer another car lease. The more cars dealers sell, the greater the manufacturing expansion for automakers.
Leasing makes a comeback Consumers, who are willing to spend on more expensive vehicles, believe that the market has been stabilizing and that leasing is becoming more desirable. According to Edmunds.com, easing credit conditions make new-car leasing easier for consumers and put lease penetration at an all-time high. Lease penetration hit a record high of 25.6% during the second quarter of 2014, up from the same period in 2013, according to Experian Automotive, a source of auto industry information. The average loan term for new vehicles reached 66 months in the second quarter, up from 65 months a year ago. For used vehicles, the term reached 61 months, flat from the prior-year period.
Leasing is becoming more attractive, despite the fact that the average monthly lease payment for new vehicles increased to $467 in the first quarter of 2014 from $457 a year ago. By leasing a new vehicle, many shoppers are able to get a car for less the price than if they had bought it. Leasing peaked in 1999 with 3.7 million units. About a decade later, GM and Chrysler ended their leasing programs due to losses stemming from poor residuals on returned vehicles. By 2009, overall leasing plunged to 1.1 million units, but since 2012, it grew steadily from 2.5 million to 3.0 million in 2013. Among young buyers, average lease penetration rose to 23% in 2013 from a record low of 13% in 2009, according to J.D. Power.
According to Auto Remarketing, a news media of pre-owned industry, leasing has a high penetration in the luxury segments, but in recent years, the mainstream segments are becoming more popular. Subcompact cars saw a 187% increase in the lease share of sales between 2008 and 2013 (latest available), while compact cars’ leasing share saw a 131% increase. This resulted in the drop of leasing share of new luxury vehicles from 30% in 2008 to 24% in 2013.
RISING DEMAND FOR DIESEL-POWERED VEHICLES
Consumers are seeking eco-friendly cars more than ever before. Hence, diesel-powered vehicles have become more common. In addition, the Motor & Equipment Manufacturers Association published on November 25, that the average price of diesel has fallen to $3.60. However, according to a November 2014 Forbes article, diesel fuel is not as widely available as gasoline.
According to the National Association of Convenience Stores, an international trade association of retail and supplier company members, US diesel car sales increased 25%, year to date through June, compared with the year-ago period. This sales growth is more than the overall US car market, which increased 4.2%.
With the potential sales of this type of vehicle, GM, Porsche, and Volkswagen are just some of the automakers that have expressed interest in producing diesel cars. GM’s Vice President Steve Kiefer thinks that diesel cars could make up 10% share of the US market by 2020. As of August, Chevrolet Cruz and some heavy-duty pickups have a diesel-engine option, and the company plans to introduce more diesel-powered vehicles in 2016. In October, Porsche announced that it plans to introduce a diesel-powered Macan crossover in the US by late 2015 or early 2016. Finally, Volkswagen is still one of the biggest players in the diesel vehicle segment, with diesel-powered cars accounting for 10% to 30% of the company’s sales.
INDUSTRY SURVEYS AUTOS & AUTO PARTS / DECEMBER 2014 15
FUEL EFFICIENCY RISING
The fuel efficiency of vehicles is on the rise in the US. The University of Michigan’s Transportation Research Institute (UMTRI) reports the average sales-weighted fuel economy of light vehicles (calculated from the monthly sales of individual models and published fuel economy ratings for city and highway combined). UMTRI reported that fuel economy increased by 25.9% from October 2007 through October 2014. Year to date through October, the index averaged 25.4 miles per gallon (mpg) in, from the 20.4 mpg average in the same period in 2013. UMTRI’s Eco-Driving Index, which estimates the average monthly emissions generated by an individual US driver, showed a 24% improvement in August 2014 compared with October 2007, when UMTRI started tracking this data.
The US Environment Protection Agency (EPA) has been imposing stringent regulations on vehicles. It has taken steps to reduce greenhouse gas (GHG) emissions in heavy-duty engines and vehicles. Fuel efficiency will increase further because of the new Corporate Average Fuel Economy (CAFE) enacted in 2011. According to the new CAFE, automakers have to increase the fuel economy of light vehicles to 35.5 mpg by 2016 and then to 54.5 mpg by 2025.
The EPA have put forward these regulations to encourage production of cleaner vehicles, reduce energy consumption by increasing the fuel economy of vehicles, and dissuade buying or manufacturing of fuel-inefficient vehicles.
ELECTRONICS IN VEHICLES
There is undoubtedly an increasing use of electronics in vehicles, from power windows to power sockets. The advancement of technology has allowed automakers to add more features to their vehicles. For example, starting in June 2014 with Chevrolet Malibu, GM is offering OnStar 4G Long Term Evolution (LTE) capability over a range of its vehicles. OnStar with 4G LTE brings a built-in Wi-Fi hotspot into and around the vehicle that can be paired with a laptop, smartphone, videogame console, and other electronic gadgets.
One use of electronics that is particularly worth noting is the development of self-driving cars. Automakers and technology companies are in a race to introduce the first self-driving car. Interestingly, Google Inc. has been developing self-driving cars and aims to introduce this technology to the market by 2017. GM also plans to introduce a self-driving Cadillac model in 2017, according to a Bloomberg article published in September. Not to be outdone, Huawei Technologies is currently designing self-driving cars that will be connected to the Internet, which the company expects to be commercially available by 2020.
While the production of self-driving vehicles may be costly, experts at the Los Angeles Auto Show in November 2014 highlighted that self-driving vehicles may reduce accidents, which together with increased productivity, would increase cost savings. In November 2013, Morgan Stanley reported that autonomous cars could contribute $1.3 trillion in annual savings to the US economy, due to reduction in fuel consumption and accidents, and $507 billion in productivity gains, as people could work while commuting.
EMERGING MARKETS STILL SHAKY
While the automotive industry in China is the largest in the world, growth of the industry in this country has been slowing. Year to date through October, China’s vehicle sales increased 8.1% compared with the year-ago period, according to LMC Automotive, slower compared with the double-digit growth experienced over the past few years. Fragile demand is holding back India from any serious growth, which is reflected in its 3.8% decline, year to date through October. Meanwhile, Western Europe is slowly rebounding, posting a 5.7% growth, year to date through October. France, however, has been left behind with a 1.4% growth, substantially lower than the growth of other large European markets such as Germany (3.0%), Italy (4.2%), Spain (18.1%), and the UK (9.5%). On the other hand, Eastern Europe’s vehicle sales saw a 9.4% decline, which mirrors Russia’s 12.7% decline year to date through October.
In South America, Brazil has been lagging in regaining the rapid economic growth it had previously exhibited, thus stalling vehicle sales, delaying future expansions, and jeopardizing profitability in the region.
16 AUTOS & AUTO PARTS / DECEMBER 2014 INDUSTRY SURVEYS
Based on LMC Automotive data, year to date through September, South America’s sales dropped 13.9%. In addition, Argentina and Brazil saw a 12.7% sales decline year to date through October.
Overall, LMC data shows that the global industry rose 3.1% year to date through October, thanks to continuing sales growth in North America; US and Canada rose 5.5% and 5.8%, respectively.
SUPPLIERS: ARE CAPACITY CONSTRAINTS A RISK?
The auto industry’s supply chain consolidated operations and reduced plant capacity by about 30% during the financial crisis, according to IRN Inc., a consulting firm. However, as sales figures improved in 2014, US auto manufacturers ramped up their production to meet demand. For instance, Ford Motor Co. has stepped up production at every plant in 2013 after raising plant capacity by 3% in 2012. Further, in 2013, the company announced plans to hire 3,000 salaried workers in 2014 and increase hourly employment by 12,000 by 2015. According to a Bloomberg article published in October 2014, Ford has hired 23,000 employees since 2011. The company also added 850 workers to help meet the demand for the 2015 F-150. This has brought Ford’s hourly employment total to 14,000, exceeding its earlier pledge of 12,000.
As automakers increase their production, it is becoming increasingly difficult for suppliers to keep up. According to the Original Equipment Suppliers Association (OESA), a trade group, the median running capacity of suppliers was at 90% in May 2014, up slightly from 89% from the year-ago period. In the same survey, suppliers cited engineering talent and production capacity as the top two significant new product launches. The trade group also highlighted that suppliers remain cautious in adding incremental capacity, which can be attributed to issues such as return on investment, excess capitalization, and risk sharing. Year to date through November, the OESA Automotive Supplier Sentiment Index averaged 58, down 4.4% from the year-ago period.
The industry faced disruptions due to material shortages, troubled suppliers, and quality issues. For instance, Chrysler’s launch of the 2014 Jeep Cherokee was delayed from an expected launch in July 2013 to the end of October, while the all-new Lincoln MKZ finally made its debut in November 2013 after months of delay.
Ford’s shrinking supplier base In October 2013, Ford, which buys about $100 billion worth of parts annually, announced a long-term plan to reduce its number of suppliers to 750 (from 1,260 in 2012). Cutting the supplier base by 40% will allow the company to reduce production costs and complexity. Under then CEO Allan Mulally, Ford’s global platform count has dropped from 27 in 2007 to 15 as of June 2014.
MANUFACTURING RETURNING TO THE US (AND MEXICO)
With billions of dollars lined up for investments, auto manufacturers are shifting operations to North America, mainly the US and Mexico. In May 2013, GM announced plans to invest $16 billion in the US by 2016. In December 2012, Ford announced plans to invest $6.2 billion by 2015, which would add 12,000 jobs (subsequently raised to 14,000). This trend is being driven by the shrinking wage gap between the US and China, company restructurings of unproductive markets, and the federal government’s efforts to increase domestic jobs. Furthermore, riding on a weaker yen, Japanese automakers manufactured 3.7 vehicles in the US in fiscal year ended March 2014 compared with 3.4 million in the year-ago period. More than a million cars and light trucks were exported from US auto plants in 2012, according to the US International Trade Commission. Companies like Chrysler and Honda are hoping to export even greater number of cars from North America (particularly from the US) in 2014.
Mexico is witnessing an upswing in its automotive industry. Year to date through September, Mexico’s auto production increased 7.5% to about 2.4 million units, whereas its exports increased 8.7% to almost 2.0 million units. The Wall Street Journal reported in October that recently announced investments in the country include the building of Kia Motors Corp’s $1.5-billion assembly plant near the Mexico border. In 2013, the Mexican auto industry looked promising with plans for $10 billion plant investments from various automakers. BMW, Toyota Motor Corp., and Daimler AG’s Mercedes-Benz are expected to announce at least $2 billion plant deals in the next year or two, following the plans also announced last year

INDUSTRY SURVEYS AUTOS & AUTO PARTS / DECEMBER 2014 17
that Nissan, Honda, Mazda, and Volkswagen would invest a total of $6 billion in Mexican plants in 2014. Mexico stands to benefit from its geographical position, lower wages, and free trade agreements (NAFTA), pushing up its share of production in North America.
ASIAN PRODUCTION SHARE OF INDUSTRY RISING
With Asia in the lead, the global automotive industry is increasingly shifting its focus to the emerging markets. Asia contributed 40.9% of global automobile production in 2012 and about 42.9% in 2013.The number is expected to rise to 44.9% in 2014 and 47.2% by 2015, according to LMC Automotive. Countries in the region are trying to develop their automobile sector through innovative policies, government influence (direct or indirect), and trade liberalization programs.
According to LMC Automotive, China will lead the expansion in Asia and is expected to open around 22 net new plants in 2015, with 75% of these new plants belonging to foreign players. India is second with seven net new light vehicle plants expected to open in 2015, followed by Indonesia and Thailand, which are expected to open five and three net new light vehicle plants, respectively.
HISPANIC BUYERS: A GROWING DEMOGRAPHIC
The Hispanic population is the fastest growing ethnic group in the US. According to the US Census Bureau, the US Hispanic population represented 17% of the country’s total population as of July 2013.
According to “State of the Hispanic Consumer—The Hispanic Market Imperative”, a second-quarter 2012 (latest available) report by Nielsen, a global consumer information and measurement firm, Hispanics are expected to account for most of the US population’s future growth. Their population is expected to rise by 167% from 2010 to 2050, versus 42% growth in the US population in the same period. In addition, according to the Nielsen report, the purchasing power of Hispanics is set to increase by 50% to $1.5 trillion in 2015 (from $1 trillion in 2010), thereby making them an important consumer segment.
Polk, the automotive research firm, reported that Hispanic consumer purchases increased in 2013, and that the top 10 brands that Hispanics preferred were Toyota, Honda, Nissan, Chevrolet, Ford, Hyundai, Dodge, Kia, VW, and Jeep. Among these brands, Toyota accounted for 17.5% of Hispanic sales in 2013 while Honda and Nissan represented 12.4% and 11.7%, respectively. According to the “2013 Hispanic Business Automotive Report” (latest available), car sales to Hispanics, particularly with the top 20 US Hispanic-owned dealerships, increased 21.1% to $4.0 billion compared with $3.3 billion from the 2011–2012 report.
DEALERSHIPS SEE RISING SALES PER STORE
Automotive dealership consolidation has long been an important trend. The number of franchised outlets in the US has declined over the past three decades, from approximately 24,725 in 1983 to 17,838 as of January 1, 2014, a slight decrease from 17,851 in the year-ago period, according to Urban Science, an auto industry consulting firm. During the period mentioned, the number of US dealerships trended steadily downward, with closures (mostly domestic brands) outweighing openings (mostly Asian brands).
Over the past five years though, the dealership network has been maintaining a conservative rate, setting a new normal pattern of increasing sales per dealer, leading to slighter decreases compared with sharp decreases in prior years. Moreover, based on the vehicle sales of 15.6 million (which is slightly different from Ward’s Automotive Reports), Urban Science shows that US new vehicle sales rose to an average of 874 sales per dealership, up 7.1% from the prior-year average of 812. S&P Capital IQ expects 2014 sales of new vehicles to reach 16.4 million units, with further gains to 16.8 million in 2015.
Higher sales per store have a huge impact on dealer profitability. The top 125 dealers—ranked based on retail unit sales of new cars and light trucks—continue to take a larger share of the US sales pie. These top groups sold more than 3.14 million new cars and light trucks in 2013, or 20% of the industry’s total sales in these categories, according to Automotive News (March 17, 2014). The 2013 sales of the top 125 dealers

18 AUTOS & AUTO PARTS / DECEMBER 2014 INDUSTRY SURVEYS
represent a 19% increase compared with 2012 sales. Sixty-five of these groups added at least one dealership last year, and only 15 of the 125 groups had a reduced net in their rooftop total.
CHANGE IN GLOBAL RANKINGS
The dominance of North America is gradually declining, and the Asia-Pacific region is strengthening its presence in the industry on the back of supportive demographic trends. The automotive market is shifting toward a new order in terms of ranking of geographies by sales and production. The middle-income population segment that can afford a vehicle is growing at a rapid rate in the Asia-Pacific region, causing this restructuring of the automotive industry, along with various other factors.
The emerging markets of China, India, Brazil, and Eastern Europe increased their share of global light vehicle sales when the global auto industry’s balance of power started to shift in the emerging markets, which accounted for 38% in 2011. Sales remained at 38% in 2012 and reached 39% in 2013. According to J.D. Power/LMC Automotive, figures are expected to climb to 41% in 2014 and 42% in 2015. These current figures show that several emerging markets are performing less than expected, and that the outlook for vehicle sales in these regions is bleak due to slower growth than estimated. Year to date through October, light vehicle sales in Brazil/Argentina and Eastern Europe were down 12.7% and 9.4%, respectively, on a year-on-year basis.
According to J.D. Power and Associates, Asia-Pacific’s share in the world’s total light vehicles sales has grown from 32% in 2011 to more than 35% in 2013, with China contributing the highest percentage followed by India. China’s share in total sales has grown from 23% in 2011 to 26% in 2013. By 2016, the share of China and the entire Asia-Pacific region in global sales is expected to grow to 29.3% and 40%, respectively, while that of North America will climb to 23%in 2014 from 22%in 2013, according to J.D. Power. The US market, which is second to China, is also gradually recovering as there is pent-up demand in the market that will translate into sales with greater credit availability. Year to date through October, light vehicle sales grew 8.1% in China, on a year-on-year basis. Further, the average age of cars in the US was around 11.4 years as of June 2014, which is expected to remain flat until 2015, and then rise to 11.7 years by 2019, according to Polk Automotive Intelligence. There will also be a need to replace these older vehicles with new purchases.
The world production figures present a similar picture. North America’s share in global production of light vehicles had a temporary rebound, in our view, when it climbed from 17% in 2011, to 18.8% in 2012, and 19% in 2013. We expect this to decline to 18.3% by 2016. Year to date October, light vehicle sales increased 5.5% in the US and 5.8% in Canada on a year-on-year basis. On the other hand, Asia’s share in global production rose from 37% in 2011 to about 40% in 2013, and is projected to grow to 44% by 2016. Within the Asian region, China is the clear leader, contributing around 25% to global production in 2013 and a projected 28.1% by 2016. Japan, which was ahead of China in terms of production in 2008, fell far behind China in 2009 and the gap has only been widening since. In 2013, Japan produced 9.2 million units, which is not even half of China’s 20.9 million.
RENTAL INDUSTRY REVENUES ON AN UPTREND
US car rental industry revenues have been generally rising since bottoming in 2002. Industry revenues peaked at $19.40 billion in 2000, then slipped to a low of $16.43 billion in 2002, before rising steadily to a new high of $21.88 billion in 2008, according to Auto Rental News, a bimonthly magazine covering the car and truck rental industry. In 2009, however, rental volume and sales both succumbed to the “Great Recession,” as businesses and consumers cut back on travel and non-essential spending. With a resumption of economic growth, revenues edged up in 2010 and 2011 and went on to record high in 2012 of $23.6 billion, and another new high in 2013 of $24.5 billion. We expect to see higher revenues over the next several years.
A closer look at the number of vehicles in service shows a trend that largely matches that of revenues. However, in 2008, revenues increased despite a decline from the 2007 peak volume of cars in service. We note that even as revenues fell in 2009, revenues per rental vehicle continued to rise, showing increased efficiency by rental car companies. Revenues per vehicle edged up slightly in 2011, despite an 8% increase

INDUSTRY SURVEYS AUTOS & AUTO PARTS / DECEMBER 2014 19
in the number of vehicles in service. In 2013, the average monthly revenue per rental unit was down 1% to $1,048 from the previous year, despite a 5% increase in the average fleet.
Another trend in the vehicle rental market is the rise of car-sharing/hourly rental car companies, versus the traditional rent-by-the-day or longer services. Car sharing refers to vehicles that are owned by an organization or firm and shared by several members each day. Alternatively, one can look at it as ande hourly car rental program. The leader of this trend is Zipcar, the world’s largest car-sharing company, with some 10,000 vehicles and 792,000 members. Zipcar, which went public in April 2011, was purchased by Avis Budget Group Inc. in March 2013. In July 2013, Avis also acquired Payless Car Rental, which contributed $44 million to its 2013 revenue.
Hertz offers a car-sharing program called “Hertz on Demand,” (formerly called “Connect by Hertz,”) and in Munich, Germany, BMW offers the “BMW on Demand” program to offer car-sharing options by the hour to compete with the likes of Zipcar. Frost & Sullivan, a business research and consulting firm, has projected that by 2016, revenue from car-sharing services could reach $3.3 billion in North America and $3.2 billion in Europe, up from $253 million and $270 million, respectively, in 2009. In an April 2011 filing with the US Securities and Exchange Commission ahead of its going public, Zipcar said that, based upon its own study, it believes that the Frost & Sullivan market forecasts are more likely achievable by 2020.
Enterprise Holdings, which owns the Enterprise, Alamo, and National car rental companies, seeks to become a bigger player in the car-sharing industry. In May 2013, it purchased IGO CarSharing, a nonprofit local car-sharing service in Chicago, adding to its existing presence in cities such as New York and Philadelphia.
REGULATORY CROSSCURRENTS
Automakers are often caught between conflicting regulatory requirements and market demands. They must comply with government regulations regarding safety, fuel consumption, and pollution control, each of which typically has repercussions on the vehicle’s performance in other areas. For instance, the most effective way to improve a car’s fuel economy is to lighten its weight; doing so, however, increases its vulnerability in collisions, making the job of designing a safe vehicle more challenging. Meanwhile, pollution regulations, which are periodically tightened, require emissions equipment that hurts fuel economy.
Compliance with government rules can also clash with consumer demand. For much of the past decade, consumers clamored for SUVs and for larger and more powerful engines. These desires have been in direct conflict with the government’s goal of reducing fuel consumption, because large-engine cars and SUVs consume more fuel than smaller vehicles. The need to satisfy opposing regulatory and consumer demands has generally driven vehicle costs up, forcing automakers to turn to ever-more complex solutions.
Rear-view mirrors In February 2008, the Kids Transportation Safety Act of 2007 (KTSA) was enacted. Under the law, the NHTSA was asked to revise the federal standard to expand the field of view so that drivers can detect objects directly behind vehicles. In December 2010, the NHTSA issued a Notice of Proposed Rulemaking (NPRM), requiring all new vehicles, including buses and trucks, weighing under 10,000 pounds to have backup camera-based systems by September 2014. In March 2014, the NHTSA issued a final rule requiring this rear visibility technology, which should meet requirements such as image size, linger time, response time and durability, to reduce injuries and fatalities from backover incidents. Of the 210 fatalities and 15,000 injuries every year due to backover crashes, 31% are children under 5 years old and 76% are adults 70 years old and above.
Large truck standards In October 2010, the US Environmental Protection Agency (EPA) and the Department of Transportation’s NHTSA announced a program to reduce greenhouse gas (GHG) emissions and improve fuel efficiency of medium- and heavy-duty vehicles, such as the largest pickup trucks and vans, semi-trucks, and all types and sizes of work trucks and buses in between. These vehicles make up the transportation segment’s second largest contributor to oil consumption and GHG emissions.
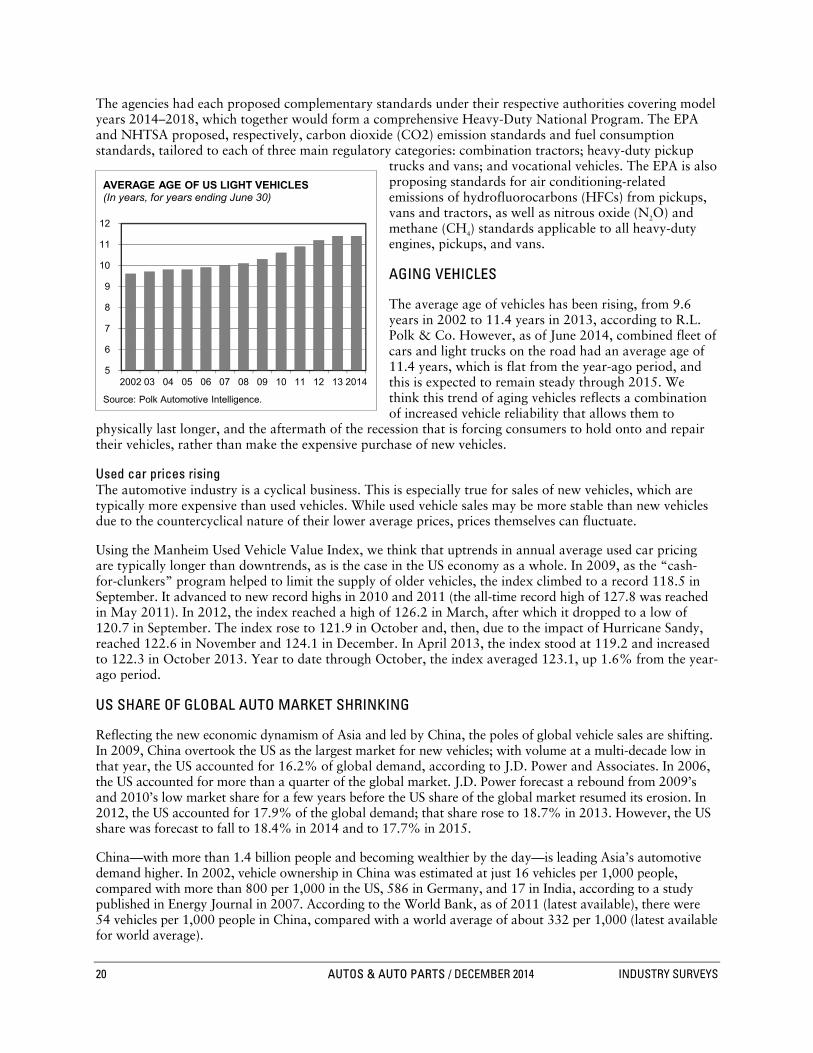
20 AUTOS & AUTO PARTS / DECEMBER 2014 INDUSTRY SURVEYS
The agencies had each proposed complementary standards under their respective authorities covering model years 2014–2018, which together would form a comprehensive Heavy-Duty National Program. The EPA and NHTSA proposed, respectively, carbon dioxide (CO2) emission standards and fuel consumption standards, tailored to each of three main regulatory categories: combination tractors; heavy-duty pickup
trucks and vans; and vocational vehicles. The EPA is also proposing standards for air conditioning-related emissions of hydrofluorocarbons (HFCs) from pickups, vans and tractors, as well as nitrous oxide (N2O) and methane (CH4) standards applicable to all heavy-duty engines, pickups, and vans.
AGING VEHICLES
The average age of vehicles has been rising, from 9.6 years in 2002 to 11.4 years in 2013, according to R.L. Polk & Co. However, as of June 2014, combined fleet of cars and light trucks on the road had an average age of 11.4 years, which is flat from the year-ago period, and this is expected to remain steady through 2015. We think this trend of aging vehicles reflects a combination of increased vehicle reliability that allows them to
physically last longer, and the aftermath of the recession that is forcing consumers to hold onto and repair their vehicles, rather than make the expensive purchase of new vehicles.
Used car prices rising The automotive industry is a cyclical business. This is especially true for sales of new vehicles, which are typically more expensive than used vehicles. While used vehicle sales may be more stable than new vehicles due to the countercyclical nature of their lower average prices, prices themselves can fluctuate.
Using the Manheim Used Vehicle Value Index, we think that uptrends in annual average used car pricing are typically longer than downtrends, as is the case in the US economy as a whole. In 2009, as the “cash-for-clunkers” program helped to limit the supply of older vehicles, the index climbed to a record 118.5 in September. It advanced to new record highs in 2010 and 2011 (the all-time record high of 127.8 was reached in May 2011). In 2012, the index reached a high of 126.2 in March, after which it dropped to a low of 120.7 in September. The index rose to 121.9 in October and, then, due to the impact of Hurricane Sandy, reached 122.6 in November and 124.1 in December. In April 2013, the index stood at 119.2 and increased to 122.3 in October 2013. Year to date through October, the index averaged 123.1, up 1.6% from the year-ago period.
US SHARE OF GLOBAL AUTO MARKET SHRINKING
Reflecting the new economic dynamism of Asia and led by China, the poles of global vehicle sales are shifting. In 2009, China overtook the US as the largest market for new vehicles; with volume at a multi-decade low in that year, the US accounted for 16.2% of global demand, according to J.D. Power and Associates. In 2006, the US accounted for more than a quarter of the global market. J.D. Power forecast a rebound from 2009’s and 2010’s low market share for a few years before the US share of the global market resumed its erosion. In 2012, the US accounted for 17.9% of the global demand; that share rose to 18.7% in 2013. However, the US share was forecast to fall to 18.4% in 2014 and to 17.7% in 2015.
China—with more than 1.4 billion people and becoming wealthier by the day—is leading Asia’s automotive demand higher. In 2002, vehicle ownership in China was estimated at just 16 vehicles per 1,000 people, compared with more than 800 per 1,000 in the US, 586 in Germany, and 17 in India, according to a study published in Energy Journal in 2007. According to the World Bank, as of 2011 (latest available), there were 54 vehicles per 1,000 people in China, compared with a world average of about 332 per 1,000 (latest available for world average).
Chart H03: AVERAGE AGE OF US LIGHT VEHICLES
5
6
7
8
9
10
11
12
2002 03 04 05 06 07 08 09 10 11 12 13 2014
Source: Polk Automotive Intelligence.
AVERAGE AGE OF US LIGHT VEHICLES (In years, for years ending June 30)

INDUSTRY SURVEYS AUTOS & AUTO PARTS / DECEMBER 2014 21
Demand in developing markets, including the BRIC economies (Brazil, Russia, India, and China), has outstripped that of the world’s mature markets (North America, Europe, and Japan). According to J.D. Power, developed markets’ share of global vehicle sales fell to a minority position (49%) in 2011, faster than previously expected. Developing markets accounted for 51% in 2011, a proportion expected to rise to 58% by 2015. However, due to weakness in Brazil and Russia, the BRIC countries’ share of global light vehicle sales was down to 36%in 2012 and 37% in 2013, while the developing markets stand at a 44% market share both in 2012 and 2013.
THE DETROIT THREE MARKET SHARE SLIDE
Since 1930, GM has led the US automobile industry in sales, when it first overtook Ford. In 1978, GM’s market share peaked at 47.7%. Afterward, it declined steadily, hitting 19.1% in 2010 (cars and light trucks
combined), down from 19.8% in 2009. The market share edged up in 2011 to 19.7%, primarily due to limited supply at the Japanese automakers following the earthquake and tsunami in Japan. In 2013, GM’s share was 17.9%.
Ford and Chrysler are attempting to reverse years of lost ground. After years of lower market share, Ford’s share climbed to 15.3% in 2009, then to 16.5% in 2010, and to 16.6% in 2011, but dropped to 15.3% in 2012, then slightly up to 15.7% in 2013;
Ford’s market share reached a peak of 26.2% in 1995. Chrysler’s share dipped to 8.9% in 2009 from 11.0% in 2008, then rose to 9.3% in 2010, to 10.7% in 2011, to 11.4% in 2012, and finally to 11.5% in 2013, but it remains below its peak of 16.8% in 1998.
Overall, the Detroit Three brands commanded 44.9% of the US market in 2013, according to Ward’s Automotive Reports—up from 44.6% in 2012, down from 46.9% in 2011, 48.1% in 2008, and 51.8% in 2007. In 2014 through October, the Detroit Three amassed 45.6%, down slightly from the year-ago period.
The long-term decline reflected the Detroit Three’s financial difficulties and their rivals’ well-received new products, the sales of certain brands by US automakers, and their growing selection of hybrid and more fuel-efficient vehicles. It also reflected the growing attraction to Asian and European nameplates.
Last year’s progress in the US market share reflects a reversal of some of these trends. American automakers’ collective financial health and product offering have shown improvement. Meanwhile, the Japanese manufacturers who had taken a hit from the Japanese crisis are also beginning to recover by getting production back to normal levels.
Japanese manufacturers recovering market share Toyota’s market share in the US was 14.1% in 2013 and 2012, both up from 12.7% in 2011, according to data Ward’s Automotive Reports. Honda also showed improvement, with a US market share of 9.6% in 2013 and 2012 versus 8.8% in 2011. Nissan, on the other hand, showed a slight decline in US market share, to 7.9% in 2013 and 2012, from 8.0% in 2011. Together, these three companies managed to maintain the market share of 31.7% in 2013 compared with 31.6% in 2012.
In 2011, the Japanese manufacturers lost sales due to a supply shock after the earthquake hit Japan in March. The US market shares of Toyota, Honda, and Nissan dropped to 10.6%, 8.0%, and 6.9%, respectively, in June 2011, down from 14.2%, 10.8%, and 9.8% in March. The market share of these three automakers dropped to 25.4% in June 2011 from 34.7% in March. Subsequently, the market share of the Japanese automakers in the US started recovering, due to improved demand from US consumers. Year to date through October, the combined market share of these companies reached 32.3%, up from 32.1% in 2013.
Table B03: LIGHT VEHICLE PRODUCTION BY REGION
LIGHT VEHICLE PRODUCTION BY REGION(In thousand of vehicles)
2010 2011 R2012 2013 2014*
North America 11,910 13,087 15,381 16,075 8,567South America 3,919 3,998 4,079 4,383 1,771European Union 16,697 17,313 16,075 16,043 8,782Other Europe 2,594 3,255 3,408 3,380 1,625Asia & Oceania 37,417 37,346 40,653 42,680 22,175Africa 379 524 556 607 194
Total 73,016 75,523 80,153 83,168 43,113
R-Revised. *Data through June 2014.Source: International Organization of Motor Vehicle Manufacturers.

22 AUTOS & AUTO PARTS / DECEMBER 2014 INDUSTRY SURVEYS
HAS AFFORDABILITY DECLINED?
Several developments—including heightened competition, consumer demand for affordability, currency fluctuations, and cost cutting by manufacturers—helped keep a lid on automotive prices, after years in which price increases outstripped income growth. In 1973, the average US citizen needed 17.5 weeks of annual family income to buy an average-priced car, a figure that rose to 23.5 weeks by 1993. By 2008, however, the figure had fallen to 19.3 weeks. Affordability subsequently declined due to weak income growth, and in 2011, the purchasing and financing of an average-priced new vehicle rose to 21.6 weeks of median family income. In 2013, affordability improved slightly, with the required 20.8 weeks of income, which further improved to 20.2 weeks of income, year to date through October.
In October 2014, the US Auto Buyer’s Affordability Index (ABAI) was 54.1 (scale of 0 to 100), which means a median-income buyer can afford 54.1% of the new-car average transaction price in October. Based on the US Bureau of Economic Analysis, the average expenditure per car was $25,329, year to date through September, down 0.8% in the year-ago period. We think new-car affordability will continue to improve in 2015, as long as the current rate of household income continues.
For years heated competition contributed to the weak automotive pricing environment. With improved overall quality among most manufacturers, buyers were more inclined to use price to differentiate similar offerings. When one manufacturer offered incentives, such as rebates or discounted financing, the others generally followed or risked losing market share. Customers, armed with dealer cost information from
consumer publications and the Internet, learned to drive a hard bargain when negotiating the purchase of a vehicle.
Despite this push to lower costs, several factors should offset this trend. First, the bankruptcies and related restructurings of both GM and Chrysler reduced their manufacturing capacity and allowed them to shift from a “push” model—producing vehicles in volume and then discounting unsold vehicles—to a “pull” model, where real demand drives production. In addition, rising raw materials costs are increasing the price of producing vehicles, forcing manufacturers to raise prices in an attempt to recoup costs. Vehicle scarcity due to the current Japanese crisis also supports higher selling prices.
HOW THE INDUSTRY OPERATES
The automobile industry is engaged in the design, production, marketing, sale, and servicing of motor vehicles. Many different companies and participants are involved in production and sales, and these processes require collaborative efforts.
MADE IN DETROIT—AND ELSEWHERE
Automobiles are built-in factories around the world: in North and South America, in Eastern and Western Europe, and in Asia. The industry’s globalization notwithstanding, the plants of the Detroit Three—US automobile manufacturers General Motors Co. (GM), Ford Motor Co., and Chrysler Group LLC—are still concentrated in the area of Detroit, Michigan.
Foreign companies have significant production capacity in the US, mostly in the Midwest. By increasing in-region development and procurement, these companies can better adapt to US tastes and preferences, while
Chart H09: NEW CAR AFFORDABILITY TRENDS
5
6
7
8
9
10
11
12
11
13
15
17
19
21
23
25
1982 1986 1990 1994 1998 2002 2006 2010 2014*
NEW CAR AFFORDABILITY TRENDS
Average weeks of income required to buy a new car (left scale)
Passenger car sales (in millions, right scale)
*Data through October.Sources: Ward's Automotive Reports; US Census Bureau.

INDUSTRY SURVEYS AUTOS & AUTO PARTS / DECEMBER 2014 23
insulating themselves from currency fluctuations. During the past decade, foreign companies’ share of US production has accelerated as domestic brands’ share of vehicle sales declined and they closed plants, while foreign manufacturers gained market share and opened plants. After a decade of relative stability, when foreign share rose only from 23.5% to 25.0% between 1992 and 2002, non-US share surged to nearly 45% of production in 2009.
As of 2013, there were six Japanese companies, three German companies, and two Korean companies operating US plants, as more companies opened US plants in the 2000s. Volkswagen AG opened a plant in May 2011, after a gap of 25 years. Sales of the Korean brands rose rapidly in the past years. However, Hyundai’s market share in the US dropped from 4.9% in 2012 to 4.6% in 2013, while Kia’s market share dropped from 3.8% in 2012 to 3.4% in 2013. Meanwhile, Volkswagen’s share in the US fell from 3.0% in 2012 to 2.6% in 2013. Year to date through October, Kia’s market share increased 3.6% (from 3.5%), whereas Hyundai and Volkswagen declined 4.4% (from 4.6%) and 2.2% (from 2.6%), respectively.
FROM DRAWING BOARD TO DEALERSHIP
In the manufacturing process, raw materials such as steel, glass, plastic, and rubber are first procured from numerous suppliers. They are made into parts at component facilities and are then shipped to assembly plants, where thousands of workers put the vehicles together on assembly lines. When going full throttle, plants operate two or three eight-hour shifts per 24 hours. In North America and Europe, automakers’ labor unions often organize work forces.
Automakers’ operations are integrated to varying degrees. However, all work with independent parts producers—companies that frequently are located near the automakers’ assembly plants. In recent years, automakers have come to depend on suppliers to assume greater design and engineering responsibilities in creating new parts and systems.
Computers revolutionize design Before production begins, automakers undertake extensive efforts to ensure that new designs will appeal to consumers. In the past, the time between a new model’s first sketch and its production was as long as five years. Today, most automakers have reduced that time to about three years or less, and they aim to reduce it to less than two years. In fact, it is now possible to move from a sketch or a concept to an actual prototype in less than a year. A “concept car” or prototype may not be brought to production, however, if it is not well received in market testing or is not cost-effective to produce.
The design process, in particular, has been greatly expedited with the help of computers. For example, it once could take 12 workers 12 weeks to produce a clay model, an essential step in the design process. Now, a single designer can take an idea on a computer screen to an animated video of a vehicle in three weeks. In addition, the Detroit Three US automakers are implementing a labor practice called “simultaneous engineering.” It calls for designers and engineers from various specialties to collaborate during a vehicle’s design phase in order to reduce or eliminate redesign work during the later developmental stages.
Simplifying parts and processes In automobile manufacturing, fewer parts mean lower production costs and a reduced likelihood of assembly errors. Thus, the Detroit Three are trying to reduce the number of primary Tier 1 suppliers they use. The increase in subassemblies, a unit assembled separately, but designed to fit with other units within a manufactured product, may also reduce the number of individual parts.
When redesigning vehicles, automakers try to save production costs and improve quality by reducing the number of stampings on sheet-metal parts, such as hoods, trunks, fenders, and doors. In the past, these parts usually required between five and seven stampings; today, three stampings are common.
Manufacturers are lowering costs by minimizing industrial waste and pollution. Nearly all component manufacturers now deliver their goods in reusable shipping containers. This saves money for the automakers and their suppliers by eliminating excess packaging and disposal costs.

24 AUTOS & AUTO PARTS / DECEMBER 2014 INDUSTRY SURVEYS
Reducing the number of labor hours required for the final assembly stage has been a high priority for automakers. Greater proportions of components are being made at parts facilities and delivered to the assembly plants on a just-in-time basis. For example, virtually all seating today is produced off-site. Automakers send daily or even hourly orders for specific seats, which are then produced and delivered. Years ago, seats were produced at the assembly plant as needed from an inventory of seating parts, components, and other materials.
Close ties with dealers Finished vehicles are sold to franchised dealerships, which are independent businesses. Automakers record these sales (net of expected marketing costs) when the vehicles are shipped to the dealers. They work closely and share many costs with dealers in developing national, regional, and local marketing plans. On occasion, they offer discounts to dealers, but usually incentives are offered directly to retail customers. In addition, automakers’ financing divisions sometimes offer deals to consumers that may be better than those available from other sources, such as banks and credit unions. For example, a manufacturer’s in-house finance unit might offer consumers 0% financing on auto purchases to stimulate sales of that automaker’s vehicles.
As independent businesses, dealers assume the risk of reselling the vehicles they buy. Today, dealers are often well-capitalized firms and may operate multiple franchises in order to protect themselves from sales swings in individual brands and models. While automakers offer guidance in making marketing and pricing decisions, dealers are free to set vehicle prices, and they may or may not offer customers the discounts that automakers provide.
Matching production to inventories Car dealers usually aim to stock a 60-day supply of vehicles in inventory. When the daily sales rate is rising dealers increase their inventories so that they will not lose sales due to a lack of supply.
Changes in dealer inventory levels have a ripple effect on auto production. For example, in late 2009, with low vehicle inventories due to prior production cuts and increased sales stemming from the “cash-for-clunkers” program, automakers were raising production and inventories to meet demand. Vehicle production in the US rose 71% in the first half of 2010 to help fill inventories in anticipation of higher demand.
Role of the Internet on research and sales The growing use of the Internet has changed the way consumers make their buying decisions. There is no dearth of research material and reviews available on the Internet, which helps consumers select the best option that matches their need at the best possible price from a wide range of alternatives. The Internet also serves best those consumers who find the overall buying experience, such as dealing with a car salesperson, tedious and are willing to opt for an alternative that can expedite the process.
Several sites are dedicated to consumer auto research, including Edmunds and True Car, which cater to the growing demand for research for car-buying decisions. These sites provide pricing information, vehicle inventory availability, comparison tools, discounts, and other information for new and used cars. True Car facilitates car selling through its dealer network and assures its users of the savings on their purchases. Other websites, such as consumerautomativeresearch.com, releases reports for extended warranties and repairs.
To respond to this emerging trend, some dealerships have given their salespeople iPads, containing such useful information ranging from all the details of each vehicle model to comparison information. Other interactive features in iPads include video demos of the features, which are primarily used to enhance the customer’s engagement level in the buying process. In this way, sales personnel have all the information readily available for consumers and can help reduce the waiting time at dealers’ stores.
HEAVY CAPITAL COMMITMENTS
Large capital commitments are required to keep pace with product development and model changeovers. Capital budgets vary among the Detroit Three, with Ford and GM generally spending the most, and Chrysler, which is less vertically integrated, spending the least.

INDUSTRY SURVEYS AUTOS & AUTO PARTS / DECEMBER 2014 25
General Motors (GM). GM’s capital investments peaked in 1985 and 1986, when spending on product redesign and plant construction and modernization for the two years totaled $22.8 billion. For 1991 through 1994, its average annual global expenditures dipped to about $5.4 billion. By 2001, as the company invested in new plants and machinery upgrades in the US and Europe, it increased its capital expenditures to $8.1 billion. This increase is even more astounding because it excludes outlays from GM’s Hughes Defense Operations, which was divested, and the Delphi Automotive parts business, which was spun off. (GM sold the remaining parts of Hughes Electronics in 2003.) In both 2007 and 2008, GM’s worldwide capital expenditures totaled $7.5 billion—a commitment that reflected the company’s global product programs, as well as its power train (engines and transmissions) and tooling requirements. This total, while substantial, is still lower than the mid-1980s peak, both in absolute dollars and as a percentage of sales. For 2013, GM spent $9.8 billion. Year to date through October, GM’s capital expenditure reached $5.1 billion, down from $5.8 billion in the year-ago period. S&P Capital IQ (S&P) expects GM to spend $7.3 billion in 2014—including $1.1 billion for restructuring expenses and $1.3 billion for recalls—and $7.8 billion in 2015.
Ford. Up from an average of $3.5 billion in the early to mid-1980s, Ford’s annual capital expenditures generally exceeded $7 billion worldwide during the early part of the last decade, as the company spent heavily to update its vehicles and power trains. Outlays subsequently declined, however, totaling $6.5 billion in 2008, $4.5 billion in 2009, and $3.9 billion in 2010. In 2012, expenditures went up to $5.5 billion and in 2013, capital spending was $6.6 billion. Year to date through September, Ford’s capital expenditure stood at $5.3 billion, up from $4.7 billion in the year-ago period. This capital spending was intended to support the company’s product development, growth, restructuring, and infrastructure investments. We expect a rebound to about $7.2 billion in 2014 and $7.5 billion in 2015.
Toyota. Although Toyota is not a Detroit Three member, it is the largest vehicle seller and manufacturer in the world. In addition, it has a growing sales and production presence in the US. For the fiscal year ended March 31, 2014, the company had worldwide automotive capital outlays of ¥2.7 trillion ($26.2 billion), from ¥854 billion spent in the fiscal year ended March 31, 2013 ($8 billion). We project capital expenditure of about ¥1.0 trillion (about $8.6 billion at December exchange rates) for the fiscal year ending March 31, 2015, rising in the next fiscal year to nearly ¥1.3 trillion ($10.5 billion).
3D PRINTING
3D printing, also known as “additive manufacturing,” uses a 3D printer to make a three-dimensional solid object from computer-aided design (CAD) or animation modeling software. 3D printing makes use of the additive process whereby material is added layer by layer to create objects of any shape. Anyone with access to a 3D printer and the design file (software) can create virtually any object in a matter of minutes. This technology has already made inroads in the automobile sector for developing prototypes, thereby reducing lead times, costs, and even eliminating the need for certain tools.
With 3D printing, manufacturers are able to create scale models for testing new designs before they are mass-produced. In October 2013, Stratasys Ltd., a manufacturer of 3D printers, announced that Robert Seuffer, GmbH & Co. KG, a German supplier of auto parts, had incorporated Stratasys 3D printing in its manufacturing process and, as a result, had reduced the time needed to produce injection-molded samples by 97% and related costs by 98%.
COMPETITION REDESIGNS THE MARKET
The US motor vehicle market, which domestic automakers divided among themselves as an oligopoly from the 1950s through the early 1970s, has since become the world’s most vigorously competitive auto market. Many foreign automakers entered the open US market in the early 1980s. Once established, they seized significant market share by addressing shifting consumer tastes and the quality shortfalls of domestic products. Japanese vehicle manufacturers were particularly successful in these regards, steadily expanding their market share at the expense of the Detroit Three.
Foreign competition forced domestic automakers to solve underlying organizational problems and address poor product quality. After a two-decade slide in market share, which culminated in disastrous financial

26 AUTOS & AUTO PARTS / DECEMBER 2014 INDUSTRY SURVEYS
performances in the early 1990s, the Detroit Three took extensive actions to improve their designs and streamline their manufacturing processes. As a result, product quality and design are becoming less of an issue in differentiating foreign and domestic manufacturers.
The selling process The battle for sales takes place mainly on the dealership floor, where price and service are the primary weapons. Although price competition is generally intense, dealers have flexibility to raise or lower prices in response to consumer interest in a given vehicle model. Today, many products sell within a tight price range. In such a market, dealers are differentiated by their customer service. Service quality must be honed day in and day out; any gains in this area can only be achieved over a long period. Any advantage can quickly be lost if poor service generates unfavorable publicity.
Pricing factors Several factors can force retail auto prices to rise. Over time, consumers come to expect as standard equipment features once offered as optional. New safety or emissions-control items may be required to comply with government regulations. Prices may also rise as consumer demand for a model increases.
Competitive pressures can result in lower prices. Lower automobile prices, however, can be supported through higher unit production volume, cost savings on parts and labor, and improved manufacturing efficiencies. When costs are reduced through innovation, savings can be shared between manufacturer, supplier and consumer; therefore, profits can still rise. However, when prices are reduced solely to stimulate demand and there are no offsetting cost savings, profitability often declines.
When sales lag, automakers use numerous tactics to stimulate demand, including discounts and cash rebates. Dealers can—and often do—give their own discounts in addition to those offered by manufacturers. An auto company’s captive finance subsidiary can spur sales by offering car buyers financing at lower interest rates than those available elsewhere. Alternatively, manufacturers may eliminate options on a particular model to offer buyers a low-priced alternative.
Costs for rebates and other marketing tactics, such as cash back, discounted financing, and employee-discount-for-all-buyers, rose since the end of 1996 through 2008. This trend, however, has flattened and has even declined.
Demand factors The economic environment naturally affects demand for automobiles. Cars are a major purchase for most families, and consumers need to feel comfortable before they spend so much of their hard-earned money. During periods of sustained economic growth and plentiful employment, sales typically rise as customers feel flush and confident enough to buy new vehicles. Conversely, when the economy weakens and jobs are hard to come by, consumers are more likely to delay the purchase of new vehicles.
Other factors affecting new-car sales include cost of ownership to drive, changes in style, engineering, safety, and quality (which hasten the obsolescence of existing models), and the cost and availability of gasoline and insurance. Safety has captured vehicle buyers’ attention and has become a pervasive theme in automakers’ ad campaigns. In response to consumer demand for safer vehicles, automakers have made wide use of components such as airbags and antilock brake systems.
THE WORLD OF AUTO PARTS
Auto parts manufacturers produce original parts and accessories for new vehicles, replacement parts, and accessories for older vehicles, or both. The automotive business provides the majority of revenues and profits at most of these companies. At some diversified firms, however, nonautomotive operations (usually some sort of manufacturing business) account for more than half of total sales and earnings.
Online procurement has changed the automotive parts business. The increased transparency of online competitive bidding often pressures selling prices for commodity items, although value-added products are generally less affected.
INDUSTRY SURVEYS AUTOS & AUTO PARTS / DECEMBER 2014 27
A dependent relationship Parts suppliers are an important part of the vehicle manufacturing process. Automakers such as GM and Ford design and market vehicles, but they outsource production of the vehicle parts to relatively large parts manufacturers called Tier 1 (T1) suppliers. T1 suppliers, in turn, subcontract production of some parts among thousands of smaller manufacturers called Tier 2 (T2) and Tier 3 (T3) suppliers. If T2 and T3 suppliers run into financial difficulties, they can create costly problems for the automobile and T1 parts makers by interrupting the production of vehicles. Therefore, when suppliers farther down the supply chain have financial or manufacturing difficulties, carmakers and T1 suppliers may help in order to maintain timely parts production.
The cost of supplier distress can absorb more than just cash; it also can demand management time and attention. In addition to providing loans and making higher than contractually required payments for parts, some T1 companies, such as Delphi Automotive LLP, have committed staff to help the smaller companies with purchasing and manufacturing.
Original and replacement parts Original parts suppliers (OES) and replacement parts makers alike tend to specialize in items that require a high degree of skill and efficiency to manufacture. Their ability to spread outlays for research, product development, and tools and dies over several contracts gives them an important cost advantage over automakers’ parts divisions. In addition, new equipment and aftermarket parts suppliers are less likely to be unionized and are thus more likely to have lower labor costs than auto manufacturers that run unionized plants. While they are similar in some respects, original equipment suppliers and replacement parts makers diverge in others, as outlined below. Original equipment suppliers often also supply replacement parts, as they already have the production lines for the parts.
Original equipment sales. For original parts makers, equipment sales depend on the number, size, and complexity of cars and trucks produced in a given year. Another variable is the percentage of any given part that automakers produce captively.
The equipment made by new parts supplies usually is sold directly to auto manufacturers. However, some of it is distributed as replacement parts to the aftermarket, which comprises new-car dealers, a few major parts distributors, thousands of smaller jobbers, and other local firms.
For many large manufacturers of auto parts, the backbone of the business is original equipment sales. The US market’s trend line allows OES to leverage their expertise across models and customers and into the aftermarket. Original equipment is a cyclical business, however, and changes in the economic environment can cause sales to fluctuate considerably from year to year. The sales volume increase we forecast for 2014 (to about 16.4 million units) should show operating leverage working for manufacturers as production rises.
Replacement parts sales. Sales of replacement parts have traditionally been more stable than original equipment sales, because the number of cars on the road, especially older models, had been in a generally long-term uptrend. Variables affecting replacement part demand include the quality of original equipment (longer-lasting, higher-quality equipment reduces demand for replacement parts) and the number and age of cars on the road. Replacement parts are distributed to the aftermarket via car dealers, gas stations, parts distributors, small jobbers, and other local firms. Although this increases opportunities for aftermarket vendors, unit sales of replacement parts have declined, largely because of the improved quality of the original equipment.
The integral role of the OES in auto production In the past, OES sold their products to vehicle manufacturers largely by signing annual contracts that covered one model year. The contracts were generally elastic with respect to price and volume deliveries.
Today, however, manufacturers normally award contracts for the life of a vehicle model, provided the supplier agrees to specific targets for productivity increases that offset price inflation for the manufacturer and can also lower per-unit prices. Automakers share with suppliers part of the savings that they help to achieve, in order to encourage and reward their loyalty to corporate goals.

28 AUTOS & AUTO PARTS / DECEMBER 2014 INDUSTRY SURVEYS
Original equipment parts suppliers thus play a large role in production programs and bear greater responsibility for the programs’ outcomes. While automakers give parts makers specific goals for cost, quality, performance, timing, and product features, they leave them to their own devices to find the appropriate solutions. Given just-in-time inventory pressures, suppliers often locate their facilities near the automakers’ production sites or risk losing business. Companies that meet the automakers’ needs can expect to receive long-term contracts and expand their businesses.
Parts makers help automakers by enabling them to accelerate the introduction of new-car lines, by sharing the high cost of developing new models, and by adding new technology, such as Sync by Microsoft Corp. (a hands-free in-vehicle communications and entertainment system) for Ford vehicles. Microsoft, of course, is not your traditional auto parts suppliers, but the logic still works for traditional suppliers that are able to help automakers with developing technology. In addition, key suppliers are now involved in the earlier design phases of new products or processes, helping to reduce component costs.
THE TIRE MARKET
According to estimates by Modern Tire Dealer, a monthly trade publication, 53.4 million tires were shipped to automakers in 2013 for new cars, light trucks, and medium/heavy trucks—up from about 50 million tires in 2012, while 245.6 million replacement tires were delivered for sale in 2013, up from 236.3 million tires in 2012. Volume should see additional gains in 2014.
With the exception of bias-ply temporary spare tires, radial tires have accounted for all original tires installed on new light vehicles (passenger cars, minivans, SUVs, and pickup trucks) for many years. The increased popularity of high-performance speed-rated radial tires, which wear out much faster than conventional radials, has helped to boost tire replacement frequency.
According to Modern Tire Dealer, total industry sales of replacement tires for all vehicles was $37.3 billion in 2013, slightly down from $37.7 billion in 2012. On a unit basis, replacement tire sales to the aftermarket are much more profitable than those tires sold to automobile producers as original equipment. One reason is that automakers wield enormous buying power and can negotiate favorable prices. Nonetheless, tire makers strive to obtain original equipment contracts, which can mean a larger market share than a supplier can receive in the aftermarket. In addition, when a supplier ships huge numbers of tires directly to an auto manufacturer, its distribution expenses are greatly reduced, and it incurs no advertising costs. Furthermore, car owners have a marked propensity to replace tires on their cars with the same brand that was originally installed. Thus, OEM contracts can mean future profits for tire manufacturers.
The rest of the auto-related rubber fabricating industry includes manufacturers of items such as belts, hoses, motor mounts, bushings, window and door moldings and seals, and other rubber parts that go into most vehicles. These manufacturers participate in the original equipment market and aftermarket, and their fortunes closely resemble those of makers of traditional original equipment parts and aftermarket parts.
KEY INDUSTRY RATIOS AND STATISTICS
Seasonally adjusted annual rate (SAAR) of vehicle sales. Adjustment factors for production and motor vehicle imports and exports are distributed once a year by the Bureau of Economic Analysis, a division of the US Department of Commerce. These factors adjust motor vehicle sales in order to account for seasonal changes in demand and production, and are based on the prior five years’ experience. For example, in December the industry always sells many cars, aided by special sales. Meanwhile, January and February, because of the cold weather and the pull-ahead impact of December sales, are always weak sales months. The SAAR adjusts for these factors on a monthly basis.
The SAAR for vehicle sales calculates the annualized rate of vehicle sales, based on one month’s results. In October 2001, the annualized rate of US sales reached a record 21.30 million light vehicles, reflecting unprecedented 0% financing offered to consumers following the terrorist attacks of September 11, 2001. In contrast, in February 2009, the SAAR was just 9.1 million vehicles, the lowest since 1981. Despite economic

INDUSTRY SURVEYS AUTOS & AUTO PARTS / DECEMBER 2014 29
weakness, but aided by the “cash-for-clunkers” program, the August 2009 SAAR surged to 14.1 million (the sales pace eased in September 2009, however). In October 2014, the sales pace was 16.4 million units (SAAR), which was the seventh month in 2014 in which sales fell within the 16.0–16.9 million range.
Monthly sales reports. Companies typically report their unadjusted (and sometimes adjusted) monthly vehicle sales volumes one to three days after the end of each month. These data give the analyst a good sense of how individual companies are performing and are the timeliest indicators of overall industry sales trends. Comparing one company’s report with those of other companies provides a snapshot of what’s hot and what’s not, and who’s gaining share and who’s losing it. These numbers, though interesting, have their limits. Individual monthly sales reports, seen in isolation and without seasonal adjustments, may not give a full picture of what is occurring in the industry. However, each month’s numbers can be compared with year-earlier levels and with preceding months to get a broader view of industry trends.
Detailed monthly sales reports, broken down by brand, are available from Ward’s Automotive Reports (see this Survey’s “Industry References” section). In addition, monthly sales by company are usually available in The Wall Street Journal.
Days’ supply of inventory. This statistic is calculated by dividing the number of units in inventory (including those in transit) by average daily sales to determine how long sales can continue out of present stock. It can be calculated for a single model, a particular automaker, or the entire industry. US automakers often disclose inventory data; some may also calculate days’ supply. Analysts and other observers take the
individual company data and perform industry-wide analyses.
Automakers typically target dealers to keep 60 days’ worth of inventory on hand. The actual number of vehicles needed can swing wildly, as actual sales fluctuate. Due to slow sales during the polar vortex in January, the supply of total US light vehicles for the Detroit Three was more than 100 days as of February 1, 2014, which was enough to last roughly until Memorial Day, while other automakers in the industry had 88 days’ worth of supply. As of October 2014, both the Ford F-Series had a
106-day supply, while Ram pickup had an 83-day supply. GM had a 95-day supply of Chevrolet Silverado and a 98-day supply of GMC Sierra.
Scrap rates. This eagerly awaited statistic, released annually in April, records the number of vehicles scrapped or sent to a junkyard in a 12-month period (July 1 to June 30). An increase in scrapped vehicles is generally believed to precede a rise in demand for motor vehicles. The number of vehicles scrapped in 2013 was significantly less than in previous years with just over 11.5 million vehicles scrapped during a 12-month period analyzed by IHS Automotive, while a record 14 million vehicles were scrapped in 2012.
Consumer confidence. One of the most widely followed consumer confidence surveys is conducted by the Conference Board, a private research organization that polls 5,000 representative US households to gauge consumer sentiment. This qualitative measure of consumer attitudes is expressed as an index, with 1985 used as a base year (1985=100). The index is compiled from monthly surveys that tally responses to a series of questions. It has two components: the present situation index, which measures consumers’ feelings about their current economic situation, and the expectations index, which tracks their feelings about the future.
Table B17: VEHICLE SCRAPPAGE
VEHICLE SCRAPPAGE(In thousands of vehicles, except as noted)
TOTAL NEW SCRAPPAGE SCRAPPAGE AS % OF
VEHICLES REGIS- SCRAP- AS % OF NEW - - ALL VEHICLES IN USE - - - -
YEAR* IN USE† TRATIONS PAGE REGISTRATIONS CARS TRUCKS TOTAL
2013 252,715 14,318 11,500 80.3 NA NA 4.6
2012 251,497 14,315 14,000 97.8 4.8 4.5 4.72011 248,932 12,657 12,330 97.4 5.8 3.8 4.82010 248,231 11,480 11,408 99.4 5.3 3.6 4.42009 248,972 10,351 12,839 124.0 7.7 4.3 6.12008 249,813 13,218 12,954 98.0 5.1 6.3 5.62007 248,701 16,023 13,496 84.2 5.5 4.8 5.22006 244,643 16,574 13,673 82.5 4.9 5.2 5.02005 238,384 16,761 13,497 80.5 4.5 4.1 4.32004 232,167 16,867 13,014 77.2 4.8 5.1 4.92003 225,882 16,619 12,441 74.9 5.2 5.9 5.52002 221,027 16,715 12,097 72.4 5.6 7.0 6.1
*Year ending June 30. †Registered.Sources: WardsAuto, Polk Automotive Intelligence.
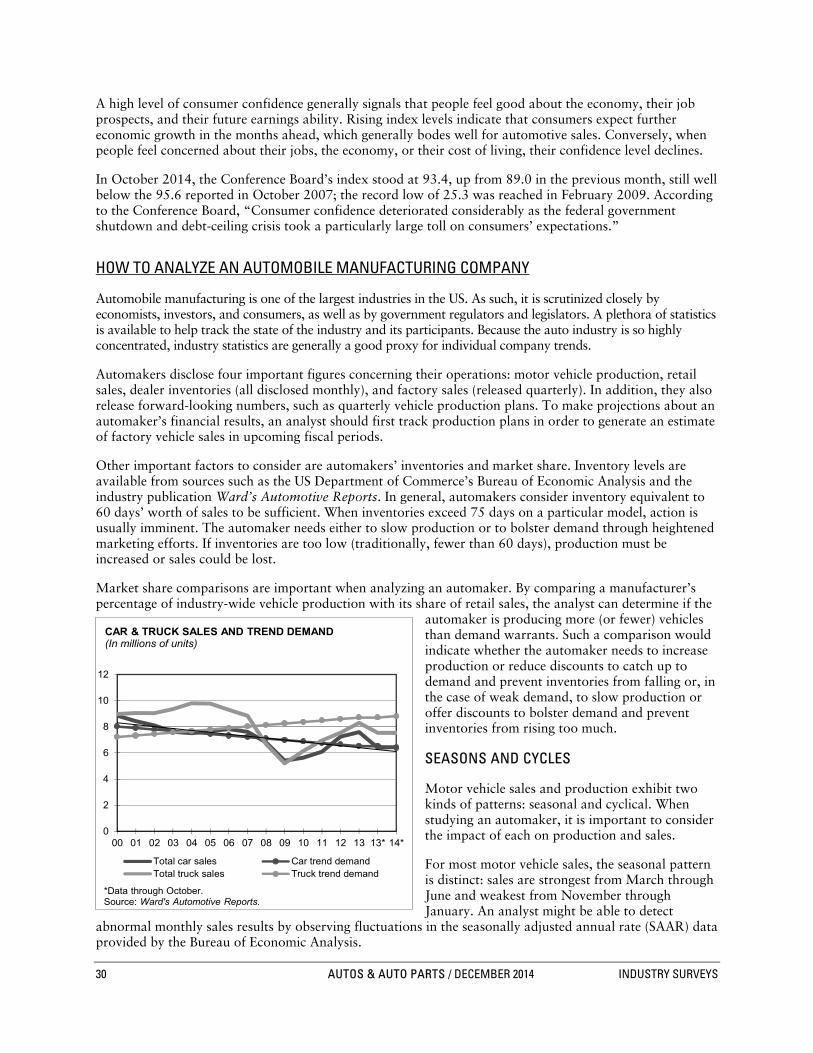
30 AUTOS & AUTO PARTS / DECEMBER 2014 INDUSTRY SURVEYS
A high level of consumer confidence generally signals that people feel good about the economy, their job prospects, and their future earnings ability. Rising index levels indicate that consumers expect further economic growth in the months ahead, which generally bodes well for automotive sales. Conversely, when people feel concerned about their jobs, the economy, or their cost of living, their confidence level declines.
In October 2014, the Conference Board’s index stood at 93.4, up from 89.0 in the previous month, still well below the 95.6 reported in October 2007; the record low of 25.3 was reached in February 2009. According to the Conference Board, “Consumer confidence deteriorated considerably as the federal government shutdown and debt-ceiling crisis took a particularly large toll on consumers’ expectations.”
HOW TO ANALYZE AN AUTOMOBILE MANUFACTURING COMPANY
Automobile manufacturing is one of the largest industries in the US. As such, it is scrutinized closely by economists, investors, and consumers, as well as by government regulators and legislators. A plethora of statistics is available to help track the state of the industry and its participants. Because the auto industry is so highly concentrated, industry statistics are generally a good proxy for individual company trends.
Automakers disclose four important figures concerning their operations: motor vehicle production, retail sales, dealer inventories (all disclosed monthly), and factory sales (released quarterly). In addition, they also release forward-looking numbers, such as quarterly vehicle production plans. To make projections about an automaker’s financial results, an analyst should first track production plans in order to generate an estimate of factory vehicle sales in upcoming fiscal periods.
Other important factors to consider are automakers’ inventories and market share. Inventory levels are available from sources such as the US Department of Commerce’s Bureau of Economic Analysis and the industry publication Ward’s Automotive Reports. In general, automakers consider inventory equivalent to 60 days’ worth of sales to be sufficient. When inventories exceed 75 days on a particular model, action is usually imminent. The automaker needs either to slow production or to bolster demand through heightened marketing efforts. If inventories are too low (traditionally, fewer than 60 days), production must be increased or sales could be lost.
Market share comparisons are important when analyzing an automaker. By comparing a manufacturer’s percentage of industry-wide vehicle production with its share of retail sales, the analyst can determine if the
automaker is producing more (or fewer) vehicles than demand warrants. Such a comparison would indicate whether the automaker needs to increase production or reduce discounts to catch up to demand and prevent inventories from falling or, in the case of weak demand, to slow production or offer discounts to bolster demand and prevent inventories from rising too much.
SEASONS AND CYCLES
Motor vehicle sales and production exhibit two kinds of patterns: seasonal and cyclical. When studying an automaker, it is important to consider the impact of each on production and sales.
For most motor vehicle sales, the seasonal pattern is distinct: sales are strongest from March through June and weakest from November through January. An analyst might be able to detect
abnormal monthly sales results by observing fluctuations in the seasonally adjusted annual rate (SAAR) data provided by the Bureau of Economic Analysis.
Chart H02: CAR & TRUCK SALES AND TREND DEMAND
0
2
4
6
8
10
12
00 01 02 03 04 05 06 07 08 09 10 11 12 13 13* 14*
CAR & TRUCK SALES AND TREND DEMAND (In millions of units)
Total car sales Car trend demandTotal truck sales Truck trend demand
*Data through October.Source: Ward's Automotive Reports.

INDUSTRY SURVEYS AUTOS & AUTO PARTS / DECEMBER 2014 31
Production is strongest from February through June. It slows in July and August, when shutdowns for annual model changeovers coincide with workers’ summer vacations. December is also a weak month for production, as holiday vacation shutdowns usually last one or two weeks. These two vacation periods are also a popular time for automakers to rebalance their inventories: shutdowns are frequently extended on a plant-by-plant basis to correct excessive inventories for any particular models.
The cyclical pattern is evident in long-term sales trends. In the past two decades, annual US vehicle sales have ranged from a low of 12.5 million units in 1991 to a record 17.8 million units in 2000 and back down to 10.4 million in 2009. Such wide divergences in annual sales have occurred repeatedly over the past four decades. We now expect several years of increases, after the recent lows.
Model changeovers The analyst should examine an automaker’s plans for model changeovers. Annual model changes do not usually cause severe disruptions in automakers’ operations, because a two- to four-week changeover period is normally scheduled during the summer. However, a major model redesign, which puts billions of dollars in expenditures at stake, can severely disrupt production, sales, and liquidity.
Major changeovers frequently require extensive plant renovations and slow start-ups as equipment is proven and debugged. Significant glitches often occur in new equipment or production processes. These problems may slow the start-up and saddle an automaker with low production levels for an extended period. Such events can have a severe impact on the automaker’s cash flow, and seriously distort its balance sheet and income statements for several quarters.
Qualitative factors regarding model changeovers must be taken into account. An analyst should attempt to gauge the prospects of new or modified products. Are the features and styling attractive to consumers? Is the price perceived to be a good value? What sales volume and margins are expected for the vehicle? Is the product in a moneymaking segment—a profitable truck or SUV—or is it a money-losing sedan? Is the segment growing or shrinking? If the answers are favorable, then the company may have a hit on its hands.
THE INCOME STATEMENT
Among the major items to examine on an automaker’s income statement are revenues, gross margins, and marketing costs. Automakers typically include them in two different statements. In accordance with financial accounting standards, automakers since 1988 have presented consolidated statements of income. These statements separate and detail the income from, and expenses for, automotive manufacturing and financial services. Automakers are allowed to present a second set of financial statements, in which their finance subsidiaries’ results are reported on an equity basis. This means that the company’s income statement gives only the net operating income for financial services, rather than a detailed breakdown of income and expenses.
Revenues Automakers derive the bulk of their revenues from the sale and financing of light vehicles, which are defined as cars and light trucks weighing less than 10,000 pounds.
Sales revenues. Automobile companies listed on US stock exchanges report their revenues on a quarterly basis. Most revenues are derived from wholesale (or factory) vehicle shipments; these are recorded when automakers ship vehicles to dealerships.
Monthly vehicle sales reports record the retail volume of motor vehicle sales by dealerships. These numbers are disclosed to the public and followed closely by economists, analysts, and the media. In the long term, factory shipments and retail sales should balance out. As a practical matter, however, differences usually arise due to the timing of shipments and retail sales, and the impact of imports and exports.
Average revenue per vehicle sold can be tracked by dividing an automaker’s revenues from vehicle sales by the number of vehicles shipped during the same period. Generally, the trend should be upward; if an automaker has flat or declining revenues per vehicle, it may have discounted heavily to sustain unit

32 AUTOS & AUTO PARTS / DECEMBER 2014 INDUSTRY SURVEYS
shipments, or it may be selling more of its cheaper models. A sharp rise in revenues per vehicle could indicate that an automaker has seen a shift in production volume to models that are more expensive.
Financing revenues. Automakers receive revenues from the dealer inventories and retail customer sales that they finance. In addition to generating revenues, financing is an important sales tool: automakers use their financing divisions to support various marketing initiatives. These include encouraging dealers to keep larger inventories on hand (by offering a favorable interest rate on inventory purchases) and subsidizing customers’ vehicle purchases (via rebates, below-market interest rates, and the like). US automakers also generate revenues by offering a variety of services, including insurance and extended service contracts.
An automaker’s financing revenues may rise or fall with the general level of interest rates without dramatically affecting income from financing operations. This is because the automaker earns a markup on the interest it pays to borrow funds. Auto loans are usually made for a period of 24 to 48 months. Automakers attempt to match their borrowings with loan maturities to minimize their exposure to interest rate fluctuations. The low interest rates of the past several years aided finance operations.
Gross margins Gross margins in the automobile industry fluctuate greatly with production volume because many of the costs related to vehicle production are fixed. Even labor costs had become largely fixed because of union contracts, which restricted layoffs or required automakers to pay certain laid-off workers benefits worth up to 95% of their take-home pay. This policy has changed, largely due to the industry’s latest financial crisis and government intervention.
Therefore, automakers must sustain relatively high production levels to break even. Once the break-even point has been passed and fixed costs are spread over more units, however, the automaker can earn substantial profits. For each additional unit of production beyond the break-even point, variable profit for high-end vehicles can exceed $10,000 per unit.
Even so, it is rare for an automaker’s gross margin to exceed 25% of its revenues. By the time the company has deducted marketing, selling, general, and administrative costs, its average return on sales (i.e., net income from operations as a percentage of revenues) may be as little as 5% over the automotive cycle, which may run more than four years. Over the past two decades, US automakers’ return on sales has often been even lower due to strenuous competition.
Marketing costs Marketing costs tend to rise and fall with the underlying level of demand for motor vehicles. Normally, automakers devote about 10% of sales revenue to marketing costs (which may include financial incentives). When attempting to stimulate demand, however, they may spend 14% or more. Nevertheless, when it is clear that demand is declining severely due to recession, automakers may have to face reality and curtail advertising and marketing expenditures.
THE BALANCE SHEETS
As with their income statements, automakers produce two sets of balance sheets. One set uses the full consolidation method, and one accounts for financial operations on an equity basis. An equity balance sheet separates the automaker’s financial services operation (which customarily operates with high debt leverage ratios) from its manufacturing operation. Auto analysts usually focus on the equity-method balance sheets because these make it easier to determine the financial strength of a company’s manufacturing operations.
When studying an automaker’s balance sheets, it is easy to be impressed with the strong cash position the company may have accumulated during a favorable economic period. When business slows, however, an automaker’s cash position can quickly erode for several reasons. First, the company receives less revenue. Second, the float created by timing differences between the purchase of supplies and materials and payment of accounts payable diminishes, as fewer materials are purchased and more bills are paid. Third, the automaker must continue to pay its fixed costs even as its business volume decreases. Thus, an automaker can see wide swings in liquidity in a short time.

INDUSTRY SURVEYS AUTOS & AUTO PARTS / DECEMBER 2014 33
VALUATION MEASURES
Valuation measures are used to determine how much a company or its stock is worth. A common measurement is a multiple of projected earnings. Keep in mind that valuations depend on various factors, including overall investor sentiment, industry conditions, the level of interest rates, and the extent to which future earnings seem predictable. As is the case with other measures, valuations of a particular company should be compared with those of similar companies in the same industry.
Price/earnings (P/E) ratio. When valuing a company’s stock, a good place to start is the basic investment ratio of stock price to earnings per share, called the price/earnings ratio. This ratio (or multiple) is useful in judging a company’s performance relative to firms in the same industry, as well as in other industries.
Historically, automotive P/Es expanded during recessions or times of economic weakness that would lead to lower profits. During flusher times, P/E ratios will often contract. The reason for this counterintuitive action reflects the cyclical nature of the industry: when profits are rising, the multiple contracts in anticipation of the inevitable decrease in profits; when profits are falling, the multiple increases.
Price/sales. At times, companies may not have forward earnings to apply P/E multiples to. In such cases, other metrics might come into play, such as price to cash flow or enterprise value to EBITDA ratios. However, in extreme circumstances (such as seen in 2009), these numbers many not be meaningful, and the analyst has to rely on price-to-sales ratios or discounting to future years’ expected profits.

34 AUTOS & AUTO PARTS / DECEMBER 2014 INDUSTRY SURVEYS
GLOSSARY
Accessories—Comfort, convenience, and safety products not essential to the performance of a vehicle, such as audio, security products, floor mats, and covers.
Aftermarket—Replacement or add-on purchases for a product after its original sale. The automotive aftermarket includes replacement parts, accessories, lubricants, fuel, appearance products, and repairs.
Axle—A shaft on which the wheels revolve.
Block exemption—A network of distribution agreements that makes penetration of the market difficult for other players is forbidden under European antitrust law, unless the industry is granted what is referred to as a block exemption. The exemption is a set of provisions designed by the European Commission establishing competitive procedures for an industry that does not meet antitrust standards. The auto industry has a block exemption, which was recently revised.
Captive import—Car or truck made overseas with a domestic nameplate.
CFCs—Chlorofluorocarbons; used in motor vehicle air conditioning units.
Changeover—The task of assigning a production machine to perform a different operation, such as changing a press tool or jig, but could also mean changing the color of paint in a paint plant or loading a new part program into a lathe.
Diesel engine—An internal combustion engine that uses diesel oil for fuel. Rather than using a traditional ignition system, it functions by injecting diesel oil into the cylinders when the piston has compressed the air to make it hot enough to ignite the diesel fuel without a spark.
Driveline—All the individual components beyond the engine up to the wheels, including the clutch and drive shaft, but not the engine or transmission.
Fuel injection—Using pressure to deliver fuel into an engine’s combustion chamber.
General service parts—Spark plugs and electrical parts (tune-up kits, wiring, switches); filters (oil, air, and gas); batteries; belts and hoses; engine accessories (speed control, carburetors, oil and water pumps, alternators).
Gross vehicle weight (GVW)—The weight of a vehicle, including passengers, options, and all cargo.
Heavy parts—Chassis (shock absorbers, mufflers and exhaust system products, struts); drive train (U-joints, transmission parts, clutches); brake parts (brake pads, rotors, discs); crash parts (body repair kits, fenders and bumpers, fiberglass panels, glass).
High performance—Products that enhance the speed and handling of a motor vehicle.
Hybrid—A vehicle utilizing two distinct but interdependent forms of propulsion, usually a gasoline engine coupled with an electric motor.
Just-in-sequence—A further refinement of just-in-time, in which parts are delivered not only at the right time and in the right quantity, but are synchronized to the customer’s schedules so that they match the customer’s own product flow, completely eliminating stock held next to the assembly track. Just-in-sequence delivery requires effective systems for sharing information between customer and supplier, and a high degree of integration between the two operations.
Just-in-time (JIT)—A system based on frequent, small deliveries of parts to maintain minimum on-site inventory.
New Domestics—A reference to foreign-owned automakers with manufacturing plants in North America, typically referring to Asia-based companies.
Platform—Mechanical underpinnings of a vehicle.
INDUSTRY SURVEYS AUTOS & AUTO PARTS / DECEMBER 2014 35
Powertrain—An engine and transmission combination, which sometimes includes the drive shaft and drive axle.
Six Sigma—A process improvement methodology based on statistical analysis of the production process. Sigma is the symbol for standard deviation (SD) and Six Sigma refers to the condition where control limits are at least six standard deviations apart (i.e., plus or minus three SD from the mean). This equates to a 3.4 parts-per-million defect rate. Six Sigma philosophy focuses on a quantitative analysis of defects and identification of the opportunity for defects to occur, in processes as well as products.
Specialty repair—Establishment specializing in one facet of automotive repair (i.e., transmission, ignition, exhaust). The outlet’s specialty accounts for more than 50% of total sales receipts.
Stamping—A sheet-metal part created by pressing rolled sheet metal between metal dies.
Tier 1 (T1) suppliers—Automotive parts manufacturers that supply final equipment directly to automakers (OEMs or original equipment manufacturers). Increasingly, Tier 1 suppliers are becoming “systems integrators” or producers of major subassemblies and modular components that can be installed into a vehicle as a unit, such as a complete chassis.
Tier 2 (T2) suppliers—Manufacturers that produce components for Tier 1 suppliers.
Tier 3 (T3) suppliers—Manufacturers that supply raw materials used in the production of components.
Tire dealer—An automotive store that generates at least 50% of its sales from tires.
Transplant—Car or truck with a foreign nameplate made within a country where it will be distributed.
Truck weights—Light trucks are less than 10,000 pounds gross vehicle weight (GVW). Medium-duty trucks weigh 10,000 to 33,000 pounds. Heavy-duty trucks exceed 33,000 pounds.
Turbocharging—A way to generate increased power and lower emissions by sending exhaust gases through a turbine, which drives a pump, forcing more air into the engine cylinders.
Upside down trade—This occurs when what a buyer owes on a trade-in vehicle exceeds its current value.

36 AUTOS & AUTO PARTS / DECEMBER 2014 INDUSTRY SURVEYS
INDUSTRY REFERENCES
PERIODICALS
Automotive Industries http://www.ai-online.com Monthly; covers the automotive industry, targeting those in automotive engineering, design, manufacturing, and purchasing.
Automotive News http://www.autonews.com Weekly; covers the automotive industry.
Car and Driver http://www.caranddriver.com Monthly; covers the auto industry from an enthusiast/consumer angle.
Modern Tire Dealer http://www.moderntiredealer.com Monthly; covers the tire industry.
Motor Trend http://www.motortrend.com Monthly; covers the auto industry from an enthusiast/consumer angle.
Rubber and Plastics News http://www.rubbernews.com Daily; covers the rubber and plastics industries.
Rubber World http://www.rubberworld.com Monthly; covers the tire and rubber industry.
Ward’s Automotive Reports Ward’s AutoWorld Ward’s Automotive Yearbook http://wardsauto.com Weekly, monthly, and annual publications, respectively, that provide information on the auto industry; the weekly includes the latest production and sales statistics.
TRADE ORGANIZATIONS
The Alliance of Automobile Manufacturers http://www.autoalliance.org Trade association comprising twelve car and light truck manufacturers; advocates for the auto industry on public policy matters.
Auto Care Association http://www.autocare.org Represents 5,000 member companies that conduct business in the motor vehicle aftermarket industry; provides legislative, legal, research, and operational services and information.
National Automobile Dealers Association (NADA) http://www.nada.org A national association representing national franchised new car and truck dealers in legal and legislative affairs; provides services and training programs to help members improve their operations.
Rubber Manufacturers Association (RMA) http://www.rma.org Trade association representing the interests of tire manufacturers in the US.
CONSULTING AND RESEARCH FIRMS
The Conference Board http://www.conference-board.org Publishes the monthly consumer confidence survey, which measures consumer sentiment.
J.D. Power and Associates http://www.jdpower.com International marketing and information firm that studies consumer opinion and customer satisfaction; supplies auto industry statistics and survey information on the auto industry. (J.D. Power is a unit of McGraw Hill Financial.)
R.L. Polk & Co. https://www.ihs.com/btp/polk.html Provides automotive information and marketing solutions to the automotive industry, insurance companies, and related firms. It is a unit of IHS Inc.
GOVERNMENT AGENCIES
Bureau of Economic Analysis (BEA) http://www.bea.gov Part of the US Department of Commerce, the BEA produces and disseminates statistics that provide a comprehensive, up-to-date picture of US economic activity.

INDUSTRY SURVEYS AUTOS & AUTO PARTS / DECEMBER 2014 37
COMPARATIVE COMPANY ANALYSIS
Operating Revenues
Million $ CAGR (%) Index Basis (2003 = 100)
Ticker Company Yr. End 2013 2012 2011 2010 2009 2008 2003 10-Yr. 5-Yr. 1-Yr. 2013 2012 2011 2010 2009
AUTOMOBILE MANUFACTURERS‡F [] FORD MOTOR CO DEC 146,917.0 134,252.0 136,264.0 128,954.0 118,308 146,277 164,196 D (1) 0 9 89 82 83 79 72GM [] GENERAL MOTORS CO DEC 155,427.0 152,256.0 150,276.0 135,592.0 A 104,589 148,979 182,005 D,F (2) 1 2 85 84 83 74 57THO † THOR INDUSTRIES INC JUL 3,241.8 A,C 3,084.7 2,755.5 A 2,276.6 1,522 2,641 1,571 A 8 4 5 206 196 175 145 97WGO § WINNEBAGO INDUSTRIES AUG 803.2 581.7 496.4 449.5 212 604 845 D (1) 6 38 95 69 59 53 25
AUTO PARTS & EQUIPMENT‡BWA [] BORGWARNER INC DEC 7,436.6 7,183.2 7,114.7 A 5,652.8 A 3,962 5,264 3,069 9 7 4 242 234 232 184 129DLPH [] DELPHI AUTOMOTIVE PLC DEC 16,463.0 15,519.0 16,041.0 13,817.0 11,755 A,C 18,060 28,096 (5) (2) 6 59 55 57 49 42DORM § DORMAN PRODUCTS INC DEC 664.5 A 570.4 D 529.3 455.7 377 342 222 12 14 16 299 257 238 205 170DW § DREW INDUSTRIES INC DEC 1,015.6 901.1 A 681.2 A 572.8 A 398 A 511 A 353 A 11 15 13 288 255 193 162 113GNTX † GENTEX CORP DEC 1,171.9 A 1,099.6 1,023.8 816.3 545 624 469 10 13 7 250 234 218 174 116
JCI [] JOHNSON CONTROLS INC SEP 42,730.0 41,955.0 40,833.0 34,305.0 28,497 38,062 22,646 7 2 2 189 185 180 151 126SMP § STANDARD MOTOR PRODS DEC 983.7 A 948.9 A 874.6 A 810.9 735 775 679 A 4 5 4 145 140 129 119 108SUP § SUPERIOR INDUSTRIES INTL DEC 789.6 821.5 822.2 719.5 419 755 840 (1) 1 (4) 94 98 98 86 50
MOTORCYCLE MANUFACTURERS‡HOG [] HARLEY-DAVIDSON INC DEC 5,899.9 F 5,580.5 F 5,311.7 F 4,859.3 F 4,782 D,F 5,971 F 4,904 F 2 (0) 6 120 114 108 99 98
TIRES & RUBBER‡GT [] GOODYEAR TIRE & RUBBER CO DEC 19,540.0 20,992.0 22,767.0 18,832.0 16,301 19,488 15,119 C 3 0 (7) 129 139 151 125 108
OTHER COMPANIES WITH SIGNIFICANT AUTOS AND PARTS OPERATIONSAIT § APPLIED INDUSTRIAL TECH INC JUN 2,462.2 2,375.4 2,212.8 1,893.2 1,923 A 2,089 1,464 5 3 4 168 162 151 129 131GPC [] GENUINE PARTS CO DEC 14,077.8 A 13,013.9 A 12,458.9 A 11,207.6 A 10,058 A 11,015 A 8,449 5 5 8 167 154 147 133 119HMC HONDA MOTOR CO LTD -ADR # MAR 114,997.6 104,906.0 96,445.8 107,985.3 91,854 100,971 78,351 4 3 10 147 134 123 138 117MGA MAGNA INTERNATIONAL INC DEC 34,835.0 A 30,837.0 A 28,748.0 A,C 24,102.0 A 17,367 A 23,704 A 15,345 A,C 9 8 13 227 201 187 157 113NSANY NISSAN MOTOR CO LTD -ADR # MAR 101,791.8 102,268.2 114,173.4 106,006.4 80,485 85,093 70,087 4 4 (0) 145 146 163 151 115
TEN TENNECO INC DEC 7,964.0 7,363.0 7,205.0 5,937.0 4,649 5,916 A 3,766 8 6 8 211 196 191 158 123TM TOYOTA MOTOR CORP -ADR # MAR 249,484.0 234,327.0 225,502.0 229,503.0 202,901 208,995 163,637 4 4 6 152 143 138 140 124
Note: Data as originally reported. CAGR-Compound annual grow th rate. ‡S&P 1500 index group. []Company included in the S&P 500. †Company included in the S&P MidCap 400. §Company included in the S&P SmallCap 600. #Of the follow ing calendar year. **Not calculated; data for base year or end year not available. A - This year's data reflect an acquisition or merger. B - This year's data reflect a major merger resulting in the formation of a new company. C - This year's data reflect an accounting change. D - Data exclude discontinued operations. E - Includes excise taxes. F - Includes other (nonoperating) income. G - Includes sale of leased depts. H - Some or all data are not available, due to a f iscal year change.
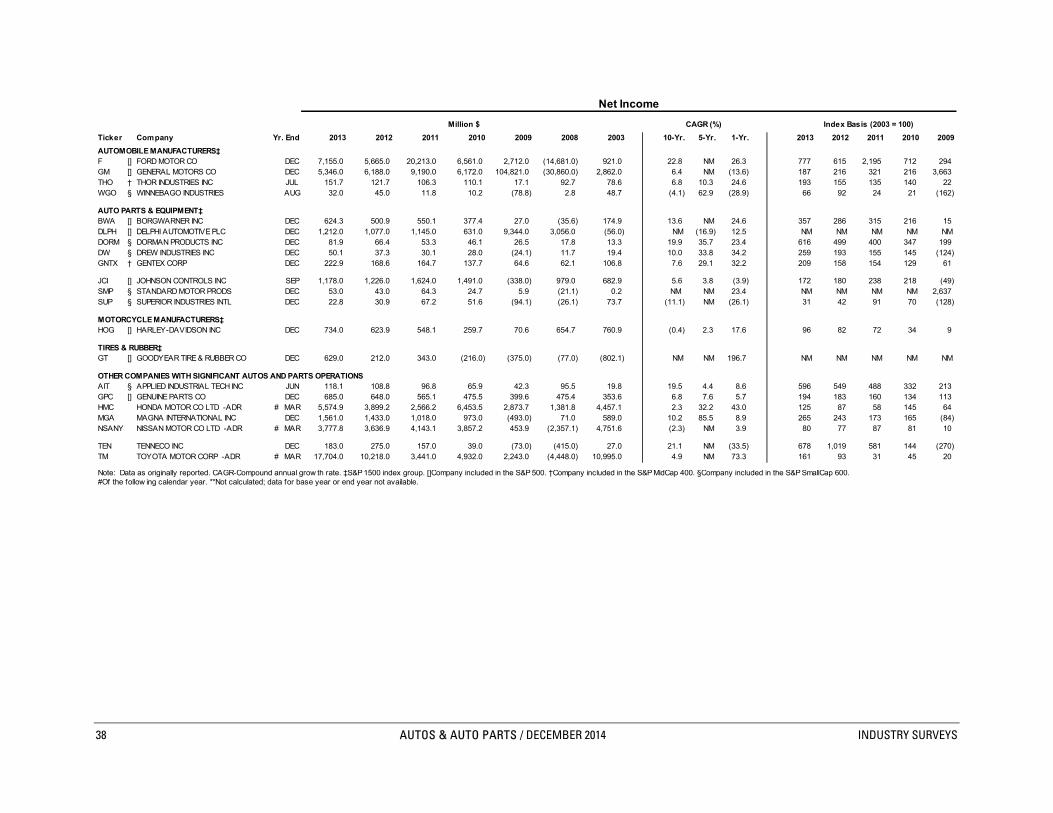
38 AUTOS & AUTO PARTS / DECEMBER 2014 INDUSTRY SURVEYS
Net Income
Million $ CAGR (%) Index Basis (2003 = 100)
Ticker Company Yr. End 2013 2012 2011 2010 2009 2008 2003 10-Yr. 5-Yr. 1-Yr. 2013 2012 2011 2010 2009
AUTOMOBILE MANUFACTURERS‡F [] FORD MOTOR CO DEC 7,155.0 5,665.0 20,213.0 6,561.0 2,712.0 (14,681.0) 921.0 22.8 NM 26.3 777 615 2,195 712 294GM [] GENERAL MOTORS CO DEC 5,346.0 6,188.0 9,190.0 6,172.0 104,821.0 (30,860.0) 2,862.0 6.4 NM (13.6) 187 216 321 216 3,663THO † THOR INDUSTRIES INC JUL 151.7 121.7 106.3 110.1 17.1 92.7 78.6 6.8 10.3 24.6 193 155 135 140 22WGO § WINNEBAGO INDUSTRIES AUG 32.0 45.0 11.8 10.2 (78.8) 2.8 48.7 (4.1) 62.9 (28.9) 66 92 24 21 (162)
AUTO PARTS & EQUIPMENT‡BWA [] BORGWARNER INC DEC 624.3 500.9 550.1 377.4 27.0 (35.6) 174.9 13.6 NM 24.6 357 286 315 216 15DLPH [] DELPHI AUTOMOTIVE PLC DEC 1,212.0 1,077.0 1,145.0 631.0 9,344.0 3,056.0 (56.0) NM (16.9) 12.5 NM NM NM NM NM DORM § DORMAN PRODUCTS INC DEC 81.9 66.4 53.3 46.1 26.5 17.8 13.3 19.9 35.7 23.4 616 499 400 347 199DW § DREW INDUSTRIES INC DEC 50.1 37.3 30.1 28.0 (24.1) 11.7 19.4 10.0 33.8 34.2 259 193 155 145 (124)GNTX † GENTEX CORP DEC 222.9 168.6 164.7 137.7 64.6 62.1 106.8 7.6 29.1 32.2 209 158 154 129 61
JCI [] JOHNSON CONTROLS INC SEP 1,178.0 1,226.0 1,624.0 1,491.0 (338.0) 979.0 682.9 5.6 3.8 (3.9) 172 180 238 218 (49)SMP § STANDARD MOTOR PRODS DEC 53.0 43.0 64.3 24.7 5.9 (21.1) 0.2 NM NM 23.4 NM NM NM NM 2,637SUP § SUPERIOR INDUSTRIES INTL DEC 22.8 30.9 67.2 51.6 (94.1) (26.1) 73.7 (11.1) NM (26.1) 31 42 91 70 (128)
MOTORCYCLE MANUFACTURERS‡HOG [] HARLEY-DAVIDSON INC DEC 734.0 623.9 548.1 259.7 70.6 654.7 760.9 (0.4) 2.3 17.6 96 82 72 34 9
TIRES & RUBBER‡GT [] GOODYEAR TIRE & RUBBER CO DEC 629.0 212.0 343.0 (216.0) (375.0) (77.0) (802.1) NM NM 196.7 NM NM NM NM NM
OTHER COMPANIES WITH SIGNIFICANT AUTOS AND PARTS OPERATIONSAIT § APPLIED INDUSTRIAL TECH INC JUN 118.1 108.8 96.8 65.9 42.3 95.5 19.8 19.5 4.4 8.6 596 549 488 332 213GPC [] GENUINE PARTS CO DEC 685.0 648.0 565.1 475.5 399.6 475.4 353.6 6.8 7.6 5.7 194 183 160 134 113HMC HONDA MOTOR CO LTD -ADR # MAR 5,574.9 3,899.2 2,566.2 6,453.5 2,873.7 1,381.8 4,457.1 2.3 32.2 43.0 125 87 58 145 64MGA MAGNA INTERNATIONAL INC DEC 1,561.0 1,433.0 1,018.0 973.0 (493.0) 71.0 589.0 10.2 85.5 8.9 265 243 173 165 (84)NSANY NISSAN MOTOR CO LTD -ADR # MAR 3,777.8 3,636.9 4,143.1 3,857.2 453.9 (2,357.1) 4,751.6 (2.3) NM 3.9 80 77 87 81 10
TEN TENNECO INC DEC 183.0 275.0 157.0 39.0 (73.0) (415.0) 27.0 21.1 NM (33.5) 678 1,019 581 144 (270)TM TOYOTA MOTOR CORP -ADR # MAR 17,704.0 10,218.0 3,441.0 4,932.0 2,243.0 (4,448.0) 10,995.0 4.9 NM 73.3 161 93 31 45 20
Note: Data as originally reported. CAGR-Compound annual grow th rate. ‡S&P 1500 index group. []Company included in the S&P 500. †Company included in the S&P MidCap 400. §Company included in the S&P SmallCap 600. #Of the follow ing calendar year. **Not calculated; data for base year or end year not available.

INDUSTRY SURVEYS AUTOS & AUTO PARTS / DECEMBER 2014 39
Return on Revenues (%) Return on Assets (%) Return on Equity (%)
Ticker Company Yr. End 2013 2012 2011 2010 2009 2013 2012 2011 2010 2009 2013 2012 2011 2010 2009
AUTOMOBILE MANUFACTURERS‡F [] FORD MOTOR CO DEC 4.9 4.2 14.8 5.1 2.3 3.6 3.1 11.8 3.6 1.3 33.8 36.6 281.6 NA NA GM [] GENERAL MOTORS CO DEC 3.4 4.1 6.1 4.6 100.2 2.4 3.6 5.9 3.4 92.1 11.5 19.9 31.1 19.8 NA THO † THOR INDUSTRIES INC JUL 4.7 3.9 3.9 4.8 1.1 11.8 10.0 9.8 11.5 1.8 17.4 14.4 14.2 16.2 2.4WGO § WINNEBAGO INDUSTRIES AUG 4.0 7.7 2.4 2.3 NM 10.7 17.1 5.1 4.6 NM 20.3 35.5 11.5 10.8 NM
AUTO PARTS & EQUIPMENT‡BWA [] BORGWARNER INC DEC 8.4 7.0 7.7 6.7 0.7 9.4 8.1 9.6 7.3 0.6 18.8 18.3 23.7 17.0 1.3DLPH [] DELPHI AUTOMOTIVE PLC DEC 7.4 6.9 7.1 4.6 79.5 11.4 11.2 11.3 5.9 90.7 46.1 53.4 31.2 11.9 NA DORM § DORMAN PRODUCTS INC DEC 12.3 11.6 10.1 10.1 7.0 17.5 17.0 15.2 15.9 10.6 21.9 20.4 18.4 19.3 13.1DW § DREW INDUSTRIES INC DEC 4.9 4.1 4.4 4.9 NM 12.1 10.3 9.1 9.4 NM 16.8 13.3 11.5 11.5 NMGNTX † GENTEX CORP DEC 19.0 15.3 16.1 16.9 11.9 14.7 13.8 15.1 15.1 8.2 18.2 15.7 17.1 16.9 9.0
JCI [] JOHNSON CONTROLS INC SEP 2.8 2.9 4.0 4.3 NM 3.8 4.0 5.9 6.0 NM 9.9 10.9 15.4 15.5 NMSMP § STANDARD MOTOR PRODS DEC 5.4 4.5 7.4 3.0 0.8 8.9 7.6 12.3 5.1 1.1 16.1 14.8 26.7 12.2 3.3SUP § SUPERIOR INDUSTRIES INTL DEC 2.9 3.8 8.2 7.2 NM 3.6 5.2 11.5 9.3 NM 4.8 6.7 15.4 13.1 NM
MOTORCYCLE MANUFACTURERS‡HOG [] HARLEY-DAVIDSON INC DEC 12.4 11.2 10.3 5.3 1.5 7.9 6.6 5.7 2.8 0.8 26.4 25.1 23.7 12.0 3.3
TIRES & RUBBER‡GT [] GOODYEAR TIRE & RUBBER CO DEC 3.2 1.0 1.5 NM NM 3.5 1.1 1.9 NM NM 123.0 307.6 71.9 NM NM
OTHER COMPANIES WITH SIGNIFICANT AUTOS AND PARTS OPERATIONSAIT § APPLIED INDUSTRIAL TECH INC JUN 4.8 4.6 4.4 3.5 2.2 11.7 11.6 10.7 7.7 5.3 16.5 16.7 16.3 12.4 8.4GPC [] GENUINE PARTS CO DEC 4.9 5.0 4.5 4.2 4.0 9.5 10.2 10.0 9.1 8.2 21.6 22.4 20.3 17.6 16.2HMC HONDA MOTOR CO LTD -ADR # MAR 4.8 3.7 2.7 6.0 3.1 3.8 2.7 1.8 4.9 2.4 10.0 7.3 4.8 12.9 6.6MGA MAGNA INTERNATIONAL INC DEC 4.5 4.6 3.5 4.0 NM 8.9 9.0 7.1 7.4 NM 16.4 16.3 12.5 12.6 NMNSANY NISSAN MOTOR CO LTD -ADR # MAR 3.7 3.6 3.6 3.6 0.6 2.7 2.7 3.1 3.2 0.4 9.2 9.3 11.2 11.9 1.6
TEN TENNECO INC DEC 2.3 3.7 2.2 0.7 NM 4.9 7.9 4.8 1.3 NM 53.9 223.6 NA NA NA TM TOYOTA MOTOR CORP -ADR # MAR 7.1 4.4 1.5 2.1 1.1 4.5 2.7 0.9 1.4 0.7 13.1 8.0 2.7 4.2 2.1
Note: Data as originally reported. ‡S&P 1500 index group. []Company included in the S&P 500. †Company included in the S&P MidCap 400. §Company included in the S&P SmallCap 600. #Of the follow ing calendar year.

40 AUTOS & AUTO PARTS / DECEMBER 2014 INDUSTRY SURVEYS
Debt as a % ofCurrent Ratio Debt / Capital Ratio (%) Net Working Capital
Ticker Company Yr. End 2013 2012 2011 2010 2009 2013 2012 2011 2010 2009 2013 2012 2011 2010 2009
AUTOMOBILE MANUFACTURERS‡ F [] FORD MOTOR CO DEC NA NA NA NA NA 73.7 79.8 79.0 99.3 106.5 NA NA NA NA NAGM [] GENERAL MOTORS CO DEC 1.3 1.3 NA NA 1.1 34.1 22.2 16.8 14.9 16.1 115.4 65.8 NA NA 81.7THO † THOR INDUSTRIES INC JUL 2.3 2.2 2.2 2.3 3.3 0.0 0.0 0.0 0.0 0.0 0.0 0.0 0.0 0.0 0.0WGO § WINNEBAGO INDUSTRIES AUG 3.2 3.1 3.2 2.8 2.6 0.0 0.0 0.0 0.0 0.0 0.0 0.0 0.0 0.0 0.0
AUTO PARTS & EQUIPMENT‡BWA [] BORGWARNER INC DEC 1.7 1.5 1.1 1.5 1.5 21.9 20.6 23.1 30.7 25.4 86.9 94.7 323.3 157.6 152.9DLPH [] DELPHI AUTOMOTIVE PLC DEC 1.5 1.4 1.5 2.1 2.0 43.4 47.9 52.3 1.2 1.8 126.5 148.2 111.6 1.8 2.8DORM § DORMAN PRODUCTS INC DEC 4.7 5.8 7.0 5.5 6.7 0.0 0.0 0.0 0.0 0.1 0.0 0.0 0.0 0.0 0.2DW § DREW INDUSTRIES INC DEC 1.9 2.2 2.7 3.2 4.2 0.0 0.0 0.0 0.0 0.0 0.0 0.0 0.0 0.0 0.0GNTX † GENTEX CORP DEC 5.0 8.5 7.5 9.1 8.6 16.2 0.0 0.0 0.0 0.0 55.2 0.0 0.0 0.0 0.0
JCI [] JOHNSON CONTROLS INC SEP 1.1 1.2 1.1 1.1 1.1 26.7 30.9 28.5 20.4 25.2 288.4 292.7 367.6 357.4 285.4SMP § STANDARD MOTOR PRODS DEC 2.0 1.9 1.8 1.8 1.8 0.0 0.0 0.1 0.1 8.5 0.0 0.0 0.1 0.2 11.2SUP § SUPERIOR INDUSTRIES INTL DEC 3.9 6.1 5.9 5.4 4.6 0.0 0.0 0.0 0.0 0.0 0.0 0.0 0.0 0.0 0.0
MOTORCYCLE MANUFACTURERS‡HOG [] HARLEY-DAVIDSON INC DEC 1.6 2.7 1.7 2.0 1.9 52.8 63.1 61.4 67.2 66.1 231.0 171.5 208.5 220.2 198.4
TIRES & RUBBER‡GT [] GOODYEAR TIRE & RUBBER CO DEC 1.7 1.6 1.7 1.5 1.8 73.8 84.4 77.9 77.9 75.9 170.3 153.9 123.3 157.7 133.6
OTHER COMPANIES WITH SIGNIFICANT AUTOS AND PARTS OPERATIONSAIT § APPLIED INDUSTRIAL TECH INC JUN 3.0 2.9 2.9 2.3 3.4 0.0 0.0 0.0 0.0 12.9 0.0 0.0 0.0 0.0 20.3GPC [] GENUINE PARTS CO DEC 1.6 1.9 2.5 2.2 2.9 12.7 7.7 15.2 8.2 16.0 24.5 10.7 18.1 10.2 19.1HMC HONDA MOTOR CO LTD -ADR # MAR 1.2 1.3 1.3 1.3 1.3 32.8 32.4 31.2 29.3 32.8 305.1 221.0 192.8 182.1 193.6MGA MAGNA INTERNATIONAL INC DEC 1.4 1.4 1.4 1.5 1.5 1.0 1.2 0.6 0.6 1.5 3.9 4.6 1.9 1.8 5.7NSANY NISSAN MOTOR CO LTD -ADR # MAR 1.7 1.7 1.6 1.4 1.4 42.3 41.6 40.7 38.5 43.1 105.9 100.6 101.3 108.4 138.4
TEN TENNECO INC DEC 1.2 1.3 1.3 1.2 1.2 67.9 78.7 94.8 94.8 95.7 225.4 224.6 283.1 360.2 596.4TM TOYOTA MOTOR CORP -ADR # MAR 1.1 1.1 1.0 1.1 1.2 34.4 35.2 34.5 36.7 38.6 824.2 841.1 NM 620.9 293.9
Note: Data as originally reported. ‡S&P 1500 index group. []Company included in the S&P 500. †Company included in the S&P MidCap 400. §Company included in the S&P SmallCap 600. #Of the follow ing calendar year.
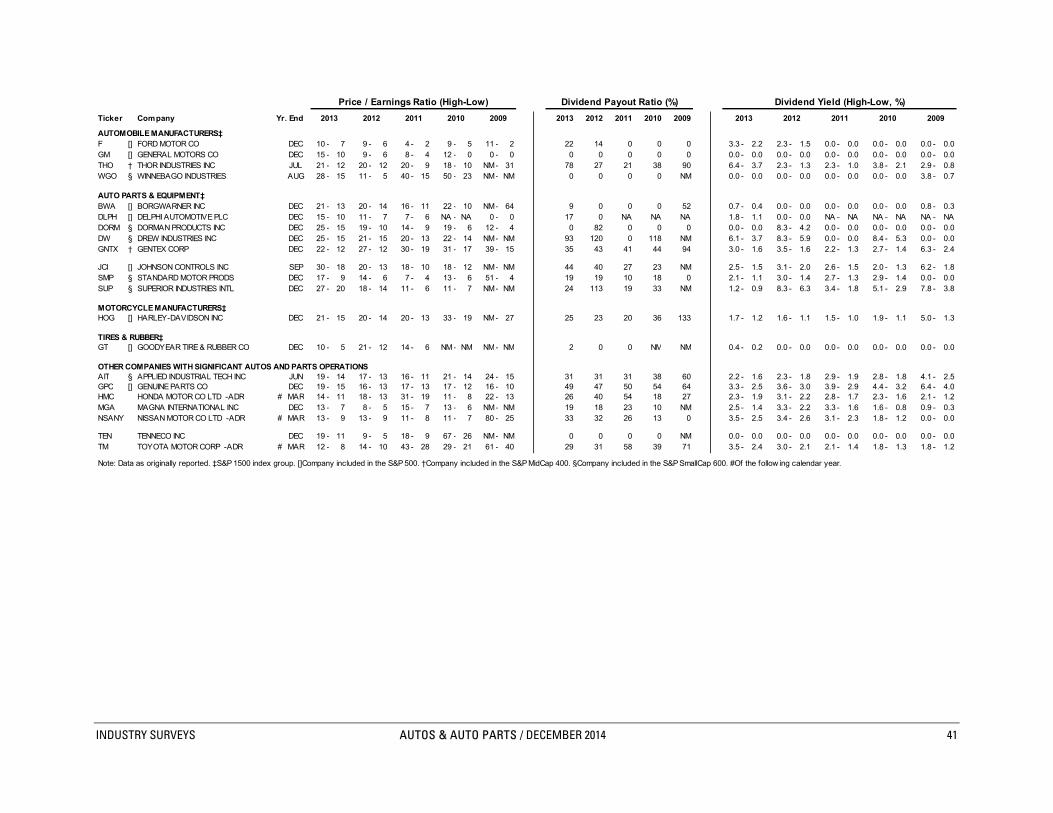
INDUSTRY SURVEYS AUTOS & AUTO PARTS / DECEMBER 2014 41
Price / Earnings Ratio (High-Low) Dividend Payout Ratio (%) Dividend Yield (High-Low, %)
Ticker Company Yr. End 2013 2012 2011 2010 2009 2013 2012 2011 2010 2009
AUTOMOBILE MANUFACTURERS‡F [] FORD MOTOR CO DEC 10 - 7 9 - 6 4 - 2 9 - 5 11 - 2 22 14 0 0 0 3.3 - 2.2 2.3 - 1.5 0.0 - 0.0 0.0 - 0.0 0.0 - 0.0GM [] GENERAL MOTORS CO DEC 15 - 10 9 - 6 8 - 4 12 - 0 0 - 0 0 0 0 0 0 0.0 - 0.0 0.0 - 0.0 0.0 - 0.0 0.0 - 0.0 0.0 - 0.0THO † THOR INDUSTRIES INC JUL 21 - 12 20 - 12 20 - 9 18 - 10 NM- 31 78 27 21 38 90 6.4 - 3.7 2.3 - 1.3 2.3 - 1.0 3.8 - 2.1 2.9 - 0.8WGO § WINNEBAGO INDUSTRIES AUG 28 - 15 11 - 5 40 - 15 50 - 23 NM- NM 0 0 0 0 NM 0.0 - 0.0 0.0 - 0.0 0.0 - 0.0 0.0 - 0.0 3.8 - 0.7
AUTO PARTS & EQUIPMENT‡BWA [] BORGWARNER INC DEC 21 - 13 20 - 14 16 - 11 22 - 10 NM- 64 9 0 0 0 52 0.7 - 0.4 0.0 - 0.0 0.0 - 0.0 0.0 - 0.0 0.8 - 0.3DLPH [] DELPHI AUTOMOTIVE PLC DEC 15 - 10 11 - 7 7 - 6 NA - NA 0 - 0 17 0 NA NA NA 1.8 - 1.1 0.0 - 0.0 NA - NA NA - NA NA - NADORM § DORMAN PRODUCTS INC DEC 25 - 15 19 - 10 14 - 9 19 - 6 12 - 4 0 82 0 0 0 0.0 - 0.0 8.3 - 4.2 0.0 - 0.0 0.0 - 0.0 0.0 - 0.0DW § DREW INDUSTRIES INC DEC 25 - 15 21 - 15 20 - 13 22 - 14 NM- NM 93 120 0 118 NM 6.1 - 3.7 8.3 - 5.9 0.0 - 0.0 8.4 - 5.3 0.0 - 0.0GNTX † GENTEX CORP DEC 22 - 12 27 - 12 30 - 19 31 - 17 39 - 15 35 43 41 44 94 3.0 - 1.6 3.5 - 1.6 2.2 - 1.3 2.7 - 1.4 6.3 - 2.4
JCI [] JOHNSON CONTROLS INC SEP 30 - 18 20 - 13 18 - 10 18 - 12 NM- NM 44 40 27 23 NM 2.5 - 1.5 3.1 - 2.0 2.6 - 1.5 2.0 - 1.3 6.2 - 1.8SMP § STANDARD MOTOR PRODS DEC 17 - 9 14 - 6 7 - 4 13 - 6 51 - 4 19 19 10 18 0 2.1 - 1.1 3.0 - 1.4 2.7 - 1.3 2.9 - 1.4 0.0 - 0.0SUP § SUPERIOR INDUSTRIES INTL DEC 27 - 20 18 - 14 11 - 6 11 - 7 NM- NM 24 113 19 33 NM 1.2 - 0.9 8.3 - 6.3 3.4 - 1.8 5.1 - 2.9 7.8 - 3.8
MOTORCYCLE MANUFACTURERS‡HOG [] HARLEY-DAVIDSON INC DEC 21 - 15 20 - 14 20 - 13 33 - 19 NM- 27 25 23 20 36 133 1.7 - 1.2 1.6 - 1.1 1.5 - 1.0 1.9 - 1.1 5.0 - 1.3
TIRES & RUBBER‡GT [] GOODYEAR TIRE & RUBBER CO DEC 10 - 5 21 - 12 14 - 6 NM- NM NM- NM 2 0 0 NM NM 0.4 - 0.2 0.0 - 0.0 0.0 - 0.0 0.0 - 0.0 0.0 - 0.0
OTHER COMPANIES WITH SIGNIFICANT AUTOS AND PARTS OPERATIONSAIT § APPLIED INDUSTRIAL TECH INC JUN 19 - 14 17 - 13 16 - 11 21 - 14 24 - 15 31 31 31 38 60 2.2 - 1.6 2.3 - 1.8 2.9 - 1.9 2.8 - 1.8 4.1 - 2.5GPC [] GENUINE PARTS CO DEC 19 - 15 16 - 13 17 - 13 17 - 12 16 - 10 49 47 50 54 64 3.3 - 2.5 3.6 - 3.0 3.9 - 2.9 4.4 - 3.2 6.4 - 4.0HMC HONDA MOTOR CO LTD -ADR # MAR 14 - 11 18 - 13 31 - 19 11 - 8 22 - 13 26 40 54 18 27 2.3 - 1.9 3.1 - 2.2 2.8 - 1.7 2.3 - 1.6 2.1 - 1.2MGA MAGNA INTERNATIONAL INC DEC 13 - 7 8 - 5 15 - 7 13 - 6 NM- NM 19 18 23 10 NM 2.5 - 1.4 3.3 - 2.2 3.3 - 1.6 1.6 - 0.8 0.9 - 0.3NSANY NISSAN MOTOR CO LTD -ADR # MAR 13 - 9 13 - 9 11 - 8 11 - 7 80 - 25 33 32 26 13 0 3.5 - 2.5 3.4 - 2.6 3.1 - 2.3 1.8 - 1.2 0.0 - 0.0
TEN TENNECO INC DEC 19 - 11 9 - 5 18 - 9 67 - 26 NM- NM 0 0 0 0 NM 0.0 - 0.0 0.0 - 0.0 0.0 - 0.0 0.0 - 0.0 0.0 - 0.0TM TOYOTA MOTOR CORP -ADR # MAR 12 - 8 14 - 10 43 - 28 29 - 21 61 - 40 29 31 58 39 71 3.5 - 2.4 3.0 - 2.1 2.1 - 1.4 1.8 - 1.3 1.8 - 1.2
Note: Data as originally reported. ‡S&P 1500 index group. []Company included in the S&P 500. †Company included in the S&P MidCap 400. §Company included in the S&P SmallCap 600. #Of the follow ing calendar year.
20092013 2012 2011 2010

42 AUTOS & AUTO PARTS / DECEMBER 2014 INDUSTRY SURVEYS
Earnings per Share ($) Tangible Book Value per Share ($) Share Price (High-Low, $)
Ticker Company Yr. End 2013 2012 2011 2010 2009 2013 2012 2011 2010 2009 2013 2012 2011 2010 2009
AUTOMOBILE MANUFACTURERS‡F [] FORD MOTOR CO DEC 1.82 1.48 5.33 1.90 0.91 6.67 4.04 3.93 (0.20) (2.38) 18.02 - 12.10 13.08 - 8.82 18.97 - 9.05 17.42 - 9.75 10.37 - 1.50GM [] GENERAL MOTORS CO DEC 2.71 3.10 4.94 3.11 253.49 21.51 12.49 (7.22) (11.91) (47.94) 41.85 - 26.19 28.90 - 18.72 39.48 - 19.00 36.98 - 0.15 4.20 - 0.06THO † THOR INDUSTRIES INC JUL 2.86 2.26 1.92 2.08 0.31 10.47 9.29 8.36 9.44 9.79 59.94 - 34.51 45.75 - 26.27 39.12 - 17.62 36.85 - 20.74 32.98 - 9.54WGO § WINNEBAGO INDUSTRIES AUG 1.14 1.54 0.41 0.35 (2.71) 6.08 4.98 3.67 3.35 3.17 32.41 - 16.72 17.19 - 7.36 16.60 - 6.02 17.43 - 8.10 16.44 - 3.14
AUTO PARTS & EQUIPMENT‡BWA [] BORGWARNER INC DEC 2.73 2.22 2.52 1.65 0.12 9.63 7.33 4.42 4.35 4.17 56.45 - 35.22 43.72 - 30.08 41.14 - 27.30 36.72 - 16.72 18.39 - 7.31DLPH [] DELPHI AUTOMOTIVE PLC DEC 3.90 3.34 3.49 1.92 28.47 5.52 3.39 3.33 NA NA 60.42 - 37.24 38.28 - 21.76 22.89 - 19.22 NA - NA 0.17 - 0.03DORM § DORMAN PRODUCTS INC DEC 2.25 1.84 1.49 1.30 0.75 10.52 8.40 8.04 6.61 5.34 56.51 - 32.70 35.42 - 18.05 21.52 - 13.28 24.66 - 7.44 8.63 - 3.06DW § DREW INDUSTRIES INC DEC 2.15 1.66 1.35 1.27 (1.10) 9.95 8.54 8.03 8.11 9.33 54.64 - 33.01 34.13 - 24.24 26.78 - 17.49 28.10 - 17.89 24.44 - 5.40GNTX † GENTEX CORP DEC 1.55 1.18 1.16 0.99 0.47 4.49 7.83 J 7.13 J 6.28 J 5.32 J 34.15 - 18.11 31.40 - 14.38 35.35 - 21.84 30.36 - 16.54 18.36 - 7.01
JCI [] JOHNSON CONTROLS INC SEP 1.72 1.80 2.40 2.22 (0.57) 6.90 5.31 4.53 4.20 2.77 51.90 - 30.30 35.95 - 23.37 42.92 - 24.29 40.15 - 25.56 28.34 - 8.35SMP § STANDARD MOTOR PRODS DEC 2.31 1.88 2.82 1.10 0.31 12.05 10.31 9.38 8.71 8.05 39.99 - 21.35 25.91 - 11.94 20.87 - 10.25 14.25 - 7.00 15.71 - 1.36SUP § SUPERIOR INDUSTRIES INTL DEC 0.83 1.13 2.48 1.93 (3.53) 17.79 17.11 16.95 15.40 14.00 22.09 - 17.01 20.45 - 15.50 26.34 - 14.17 21.96 - 12.55 17.00 - 8.19
MOTORCYCLE MANUFACTURERS‡HOG [] HARLEY-DAVIDSON INC DEC 3.30 2.75 2.35 1.11 0.30 13.54 11.18 10.37 9.24 8.86 69.75 - 48.40 54.32 - 37.84 46.88 - 31.50 36.13 - 21.26 30.00 - 7.99
TIRES & RUBBER‡GT [] GOODYEAR TIRE & RUBBER CO DEC 2.44 0.75 1.32 (0.89) (1.55) 1.21 (3.81) (2.30) (0.82) (0.56) 24.00 - 11.83 15.80 - 9.23 18.83 - 8.53 16.39 - 9.10 18.84 - 3.17
OTHER COMPANIES WITH SIGNIFICANT AUTOS AND PARTS OPERATIONSAIT § APPLIED INDUSTRIAL TECH INC JUN 2.81 2.58 2.28 1.56 1.00 13.32 12.01 10.96 9.57 8.26 53.57 - 40.39 44.86 - 34.44 36.77 - 24.50 33.34 - 21.06 23.95 - 14.63GPC [] GENUINE PARTS CO DEC 4.43 4.17 3.61 3.01 2.51 13.39 16.15 16.08 16.39 15.42 85.41 - 64.43 66.90 - 55.58 62.21 - 46.10 51.61 - 36.94 39.82 - 24.93HMC HONDA MOTOR CO LTD -ADR # MAR 3.09 2.16 1.42 3.57 1.58 31.83 29.62 29.57 29.75 25.47 42.96 - 35.15 39.35 - 28.50 44.56 - 27.52 39.69 - 28.33 34.52 - 20.28MGA MAGNA INTERNATIONAL INC DEC 6.85 6.17 4.26 4.23 (2.20) 36.16 33.30 29.78 28.21 27.55 88.76 - 50.77 50.13 - 33.32 62.20 - 30.03 52.98 - 25.58 25.98 - 9.81NSANY NISSAN MOTOR CO LTD -ADR # MAR 1.80 1.74 1.98 1.85 0.22 19.69 18.31 17.54 16.23 13.47 24.03 - 16.67 21.89 - 16.45 22.13 - 16.24 19.89 - 13.49 17.69 - 5.59
TEN TENNECO INC DEC 3.03 4.58 2.62 0.65 (1.50) 4.58 1.34 (2.71) (2.07) (2.35) 57.85 - 34.26 40.69 - 24.35 46.81 - 22.47 43.71 - 17.17 19.78 - 0.67TM TOYOTA MOTOR CORP -ADR # MAR 11.17 6.45 2.19 3.15 1.43 88.65 81.46 80.85 79.63 70.74 134.94 - 93.20 93.36 - 67.27 93.90 - 60.37 91.97 - 67.56 87.67 - 56.79
Note: Data as originally reported. ‡S&P 1500 index group. []Company included in the S&P 500. †Company included in the S&P MidCap 400. §Company included in the S&P SmallCap 600. #Of the follow ing calendar year. J-This amount includes intangibles that cannot be identif ied.
The analysis and opinion set forth in this publication are provided by S&P Capital IQ Equity Research and are prepared separately from any other analytic activity of Standard & Poor’s.
In this regard, S&P Capital IQ Equity Research has no access to nonpublic information received by other units of Standard & Poor’s.
The accuracy and completeness of information obtained from third-party sources, and the opinions based on such information, are not guaranteed.

INDUSTRY SURVEYS AUTOS & AUTO PARTS / DECEMBER 2014 43
General Disclaimers S&P Capital IQ’s Industry Surveys Reports (the “Industry Surveys”) have been prepared and issued by S&P Capital IQ and/or one of its affiliates. In the United States and United Kingdom, the Industry Surveys are prepared and issued by Standard & Poor’s Financial Services LLC; in Hong Kong, by Standard & Poor’s Investment Advisory Services (HK) Limited, which is regulated by the Hong Kong Securities Futures Commission; in Singapore, by McGraw Hill Financial Singapore Pte. Limited, which is regulated by the Monetary Authority of Singapore; in Malaysia, by Standard & Poor’s Malaysia Sdn Bhd, which is regulated by the Securities Commission of Malaysia; in Australia, by Standard & Poor’s Information Services (Australia) Pty Ltd, which is regulated by the Australian Securities & Investments Commission; and in Japan, by McGraw Hill Financial Japan KK, which is registered by Kanto Financial Bureau. No content (including ratings, credit-related analyses and data, valuations, model, software or other application or output therefrom) or any part thereof (Content) may be modified, reverse engineered, reproduced or distributed in any form by any means, or stored in a database or retrieval system, without the prior written permission of Standard & Poor’s Financial Services LLC or its affiliates (collectively, S&P). The Content shall not be used for any unlawful or unauthorized purposes. S&P and any third-party providers, as well as their directors, officers, shareholders, employees or agents (collectively S&P Parties) do not guarantee the accuracy, completeness, timeliness or availability of the Content. S&P Parties are not responsible for any errors or omissions (negligent or otherwise), regardless of the cause, for the results obtained from the use of the Content, or for the security or maintenance of any data input by the user. The Content is provided on an “as is” basis. S&P PARTIES DISCLAIM ANY AND ALL EXPRESS OR IMPLIED WARRANTIES, INCLUDING, BUT NOT LIMITED TO, ANY WARRANTIES OF MERCHANTABILITY OR FITNESS FOR A PARTICULAR PURPOSE OR USE, FREEDOM FROM BUGS, SOFTWARE ERRORS OR DEFECTS, THAT THE CONTENT’S FUNCTIONING WILL BE UNINTERRUPTED OR THAT THE CONTENT WILL OPERATE WITH ANY SOFTWARE OR HARDWARE CONFIGURATION. In no event shall S&P Parties be liable to any party for any direct, indirect, incidental, exemplary, compensatory, punitive, special or consequential damages, costs, expenses, legal fees, or losses (including, without limitation, lost income or lost profits and opportunity costs or losses caused by negligence) in connection with any use of the Content even if advised of the possibility of such damages. Credit-related and other analyses, including ratings, and statements in the Content are statements of opinion as of the date they are expressed and not statements of fact. S&P’s opinions, analyses and rating acknowledgment decisions (described below) are not recommendations to purchase, hold, or sell any securities or to make any investment decisions, and do not address the suitability of any security. S&P assumes no obligation to update the Content following publication in any form or format. The Content should not be relied on and is not a substitute for the skill, judgment and experience of the user, its management, employees, advisers and/or clients when making investment and other business decisions. S&P does not act as a fiduciary or an investment adviser except where registered as such. While S&P has obtained information from sources it believes to be reliable, S&P does not perform an audit and undertakes no duty of due diligence or independent verification of any information it receives. S&P keeps certain activities of its business units separate from each other in order to preserve the independence and objectivity of their respective activities. As a result, certain business units of S&P may have information that is not available to other S&P business units. S&P has established policies and procedures to maintain the confidentiality of certain non-public information received in connection with each analytical process. S&P provides a wide range of services to, or relating to, many organizations, including issuers or underwriters of securities or obligors, investment advisers, broker-dealers, investment banks, other financial institutions and financial intermediaries. As a result, S&P may receive fees or other economic benefits from organizations whose securities or services it may recommend, analyze, rate, include in model portfolios, evaluate, price or otherwise address. The Industry Surveys are not intended to be investment advice and do not constitute any form of invitation or inducement by S&P Capital IQ to engage in investment activity. This material is not intended as an offer or solicitation for the purchase or sale of any security or other financial instrument. Any opinions expressed herein are given in good faith, are subject to change without notice, and are only current as of the stated date of their issue. Past performance is not necessarily indicative of future results. For details on the S&P Capital IQ conflict-of-interest policies, please visit: www.spcapitaliq.com/policies
Notice to all Non US Residents: S&P Capital IQ’s Industry Surveys may be distributed in certain localities, countries and/or jurisdictions (“Territories”) by independent third parties or independent intermediaries and/or distributors (the “Intermediaries” or “Distributors”). Intermediaries are not acting as agents or representatives of S&P Capital IQ. In Territories where an Intermediary distributes S&P Capital IQ’s Industry Surveys, the Intermediary, and not S&P Capital IQ, is solely responsible for complying with all applicable regulations, laws, rules, circulars, codes and guidelines established by local and/or regional regulatory authorities, including laws in connection with the distribution of third-party investment research, licensing requirements, supervisory and record keeping obligations that the Intermediary may have under the applicable laws and regulations of the territories where it distributes the Industry Surveys. Industry Surveys are not directed to, or intended for distribution to or use by, any person or entity who is a citizen or resident of or located in any locality, state, country or other jurisdiction where such distribution, publication, availability or use would be contrary to law or regulation or which would subject S&P Capital IQ or its affiliates to any registration or licensing requirements in such jurisdiction. Industry Surveys are not directed to, or intended for distribution to or use by, any person or entity who is not in a class qualified to receive Industry Surveys (e.g., a qualified person and/or investor), as defined by the local laws or regulations in the country or jurisdiction where the person is domiciled, a citizen or resident of, or the entity is legally registered or domiciled. S&P Capital IQ’s Industry Surveys are not intended for distribution in or directed to entities, residents or investors in: Albania, Belarus, Bosnia, Burma, Cote d’Ivoire, Croatia, Cuba, Democratic Republic of the Congo, Former Yugoslav Republic of Macedonia, Herzegovina, Iran, Iraq, Kosovo, Lebanon, Libya, Montenegro and Serbia, North Korea, Somali, Sudan, Syria, Taiwan, Yemen and Zimbabwe. For residents of Australia: Industry Surveys are issued and/or distributed in Australia by SPIS. Any express or implied opinion contained in an Industry Survey is limited to “General Advice” and based solely on consideration of the investment merits of the financial product(s) alone. The information in an Industry Survey has not been prepared for use by retail investors and has been prepared without taking account of any particular investor’s financial or investment objectives, financial situation or needs. Before acting on any advice, any investor using the advice should consider its appropriateness having regard to their own or their clients’ objectives, financial situation and needs. Investors should obtain a Product Disclosure Statement relating to the product and consider the statement before making any decision or recommendation about whether to acquire the product. Each opinion must be weighed solely as one factor in any investment decision made by or on behalf of any adviser and any such adviser must accordingly make their own assessment taking into account an individual’s particular circumstances. SPIS holds an Australian Financial Services License Number 258896. Please refer to the SPIS Financial Services Guide for more information at: http://www.spcapitaliq.com/financialservicesguide For residents of China: Industry Surveys are not distributed in or directed to residents in The People’s Republic of China. Neither S&P Capital IQ nor its affiliates target investors in China. For residents of Kuwait: The Distributor, and not S&P Capital IQ, is responsible for complying with all relevant licensing requirements as set forth by the Kuwait Capital Markets Law (“CML”) and Kuwait Capital Markets Authority (“CMA”) and with all relevant rules and regulations set out in the CML and CMA rule books. For residents of Malaysia: All queries in relation to Industry Surveys should be referred to Ahmad Halim at [email protected]. For residents of Mexico: S&P Capital IQ is not regulated or supervised by the Mexican National Banking and Securities Commission (“CNBV”). S&P Capital IQ has a licensed rating agency affiliate in Mexico (Standard & Poor’s, S.A. De C.V.), of which S&P maintains firewalls and seeks to avoid conflicts of interest, pursuant to approved policies. For residents of Qatar: The Distributor, and not S&P Capital IQ, is responsible for complying with all relevant licensing requirements as set forth by the Qatar Financial Markets Authority or the Qatar Central Bank, and with all relevant rules and regulations set out in the Qatar Financial Markets Authority’s rule book, including third party branded investment research distribution of securities that are admitted for trading on a Qatari securities exchange (Admitted Securities). Copyright © 2014 Standard & Poor’s Financial Services LLC. All rights reserved. STANDARD & POOR’S, S&P, S&P 500, S&P EUROPE 350 and STARS are registered trademarks of Standard & Poor’s Financial Services LLC. S&P CAPITAL IQ is a trademark of Standard & Poor’s Financial Services LLC.