avances en el tratamiento sistémico de los tumores ......sistémico de los tumores neuroendocrinos...
TRANSCRIPT
Avances en el tratamiento sistémico de los tumores
neuroendocrinos
Emma Dotor19.3.2013
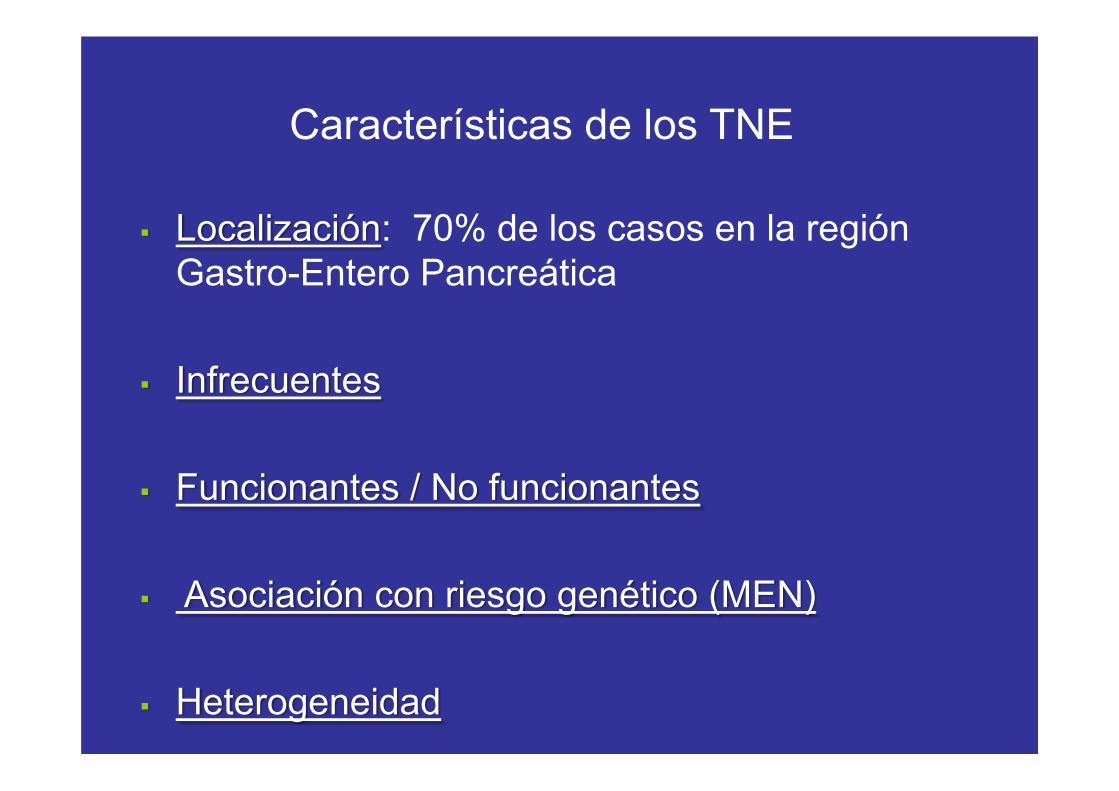
Características de los TNE
Localización: 70% de los casos en la región Gastro-Entero Pancreática
Infrecuentes
Funcionantes / No funcionantes
Asociación con riesgo genético (MEN)
Heterogeneidad

Parameters With an Impacton Therapeutic Decision Making
Histology
– Grading G1/G2 (NET) vs G3 (NEC) (WHO 2010)
– Well/moderately or poorly differentiated NET/NEC (US)
Functionality– Carcinoid syndrome, insulinoma, gastrinoma, VIPoma
Primary tumor site – Pancreatic vs intestinal
‐ 5‐year overall survival 40‐50% vs 70‐90% in metastatic disease
Somatostatin receptor imaging
Tumor burden/extrahepatic disease
Abbreviations: NEC, neuroendocrine carcinoma; NET, neuroendocrine tumor; WHO, World Health Organization.

Tratamiento quirúrgico en los TNE metastásicos
• Objetivo: tratamiento curativo o reducir masa tumoral(garantizar mínimo resección 90% masa tumoral)
• Chen H / J Am Coll Surg 1998;187:88-93:38 pacientes con metástasis hepáticas como localización única.15 pacientes con resección quirúrgica y 23 sin cirugía.OS 5a : 73% vs 29%
• Chamberlain RS / J Am Coll Surg 2000;190:432-445:85 pacientes con metastasis hepáticas por TNE. 34 pacientes conintervención quirúrgica (15 con cirugía potencialmente curativa y 19con resección paliativa).OS 5a: 85% cirugía completa vs 63% cirugía incompleta
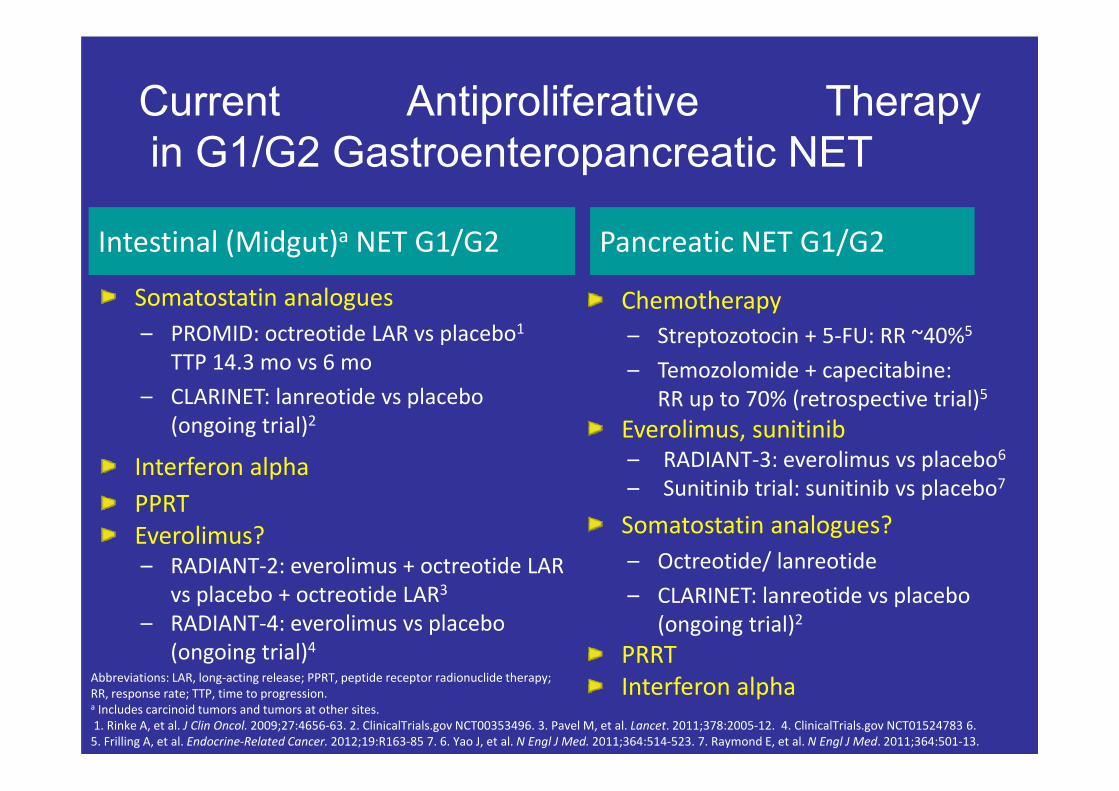
Current Antiproliferative Therapyin G1/G2 Gastroenteropancreatic NET
Somatostatin analogues– PROMID: octreotide LAR vs placebo1
TTP 14.3 mo vs 6 mo
– CLARINET: lanreotide vs placebo (ongoing trial)2
Interferon alphaPPRTEverolimus?– RADIANT‐2: everolimus + octreotide LAR
vs placebo + octreotide LAR3
– RADIANT‐4: everolimus vs placebo (ongoing trial)4
Chemotherapy– Streptozotocin + 5‐FU: RR ~40%5
– Temozolomide + capecitabine: RR up to 70% (retrospective trial)5
Everolimus, sunitinib– RADIANT‐3: everolimus vs placebo6
– Sunitinib trial: sunitinib vs placebo7
Somatostatin analogues?– Octreotide/ lanreotide
– CLARINET: lanreotide vs placebo(ongoing trial)2
PRRTInterferon alpha
Intestinal (Midgut)a NET G1/G2 Pancreatic NET G1/G2
Abbreviations: LAR, long‐acting release; PPRT, peptide receptor radionuclide therapy; RR, response rate; TTP, time to progression.a Includes carcinoid tumors and tumors at other sites.1. Rinke A, et al. J Clin Oncol. 2009;27:4656‐63. 2. ClinicalTrials.gov NCT00353496. 3. Pavel M, et al. Lancet. 2011;378:2005‐12. 4. ClinicalTrials.gov NCT01524783 6. 5. Frilling A, et al. Endocrine‐Related Cancer. 2012;19:R163‐85 7. 6. Yao J, et al. N Engl J Med. 2011;364:514‐523. 7. Raymond E, et al. N Engl J Med. 2011;364:501‐13.
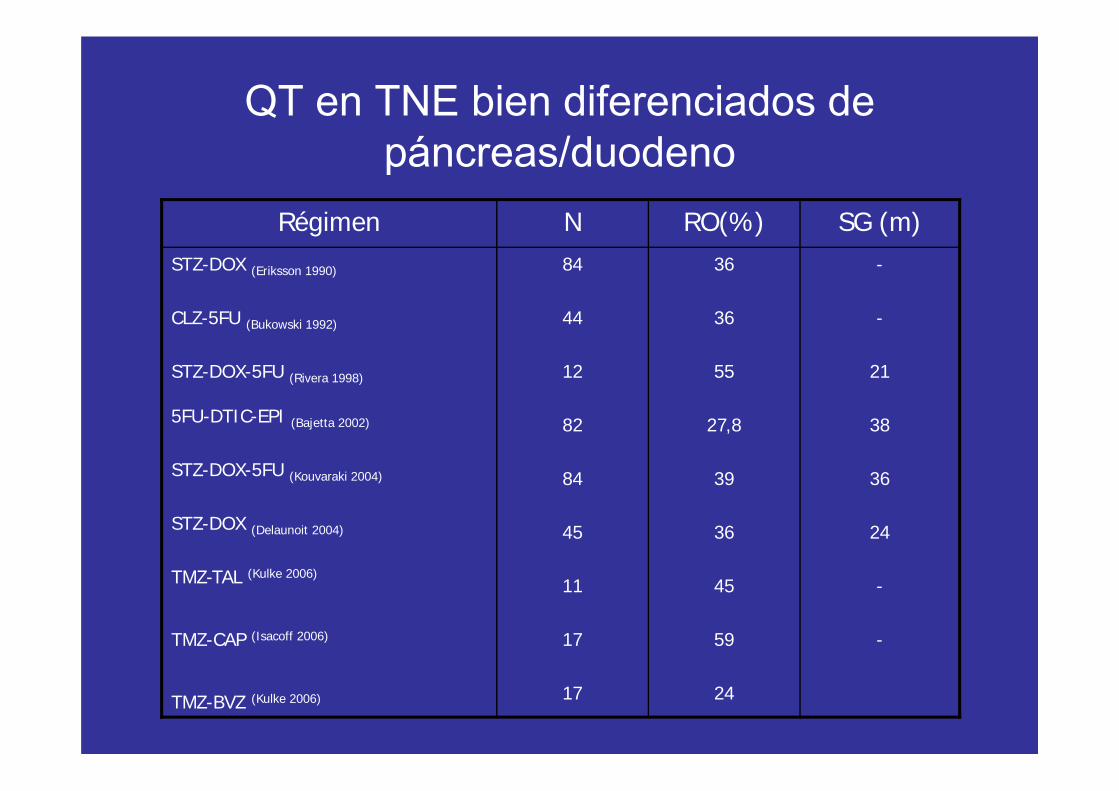
QT en TNE bien diferenciados de páncreas/duodeno
Régimen N RO(%) SG (m)STZ-DOX (Eriksson 1990)
CLZ-5FU (Bukowski 1992)
STZ-DOX-5FU (Rivera 1998)
5FU-DTIC-EPI (Bajetta 2002)
STZ-DOX-5FU (Kouvaraki 2004)
STZ-DOX (Delaunoit 2004)
TMZ-TAL (Kulke 2006)
TMZ-CAP (Isacoff 2006)
TMZ-BVZ (Kulke 2006)
84
44
12
82
84
45
11
17
17
36
36
55
27,8
39
36
45
59
24
-
-
21
38
36
24
-
-

Fase III aleatorizado STZ-ADR vs STZ-5FU vs CLZMoertel, NEJM 1992
Esquema(n:105)
0R (%)
OS (a.) TTP (m.) RESP (m.)
STZ-ADR 69 2,2 18
STZ-FU 45 1,4 14
CLZ 30 1,4 17
20
6,9
6,9

Quimioterapia en TNE indiferenciadosRégimen N % RR SG
CDDP-VP16(Seitz 1995)
11 54
CDDP-VP16(Moertel 1991)
18 67 19
CDDP-VP16(Mitry1999)
41 42 15
CDDP-VP16(Fjallskog2001)
36 55 19
TAX-CBDCA-VP16 (Miranda 2005)
66 55 14,8
TAX-CDDP-VP16(Hainsworth 2006)
78 53 14,8

Estudios fase II: IFN y análogos-SST
Estudio N DosisIFN SST
Resp-Biol (%)
Resp-Tum (%)
Janson (1991) 24 9 MU/s 300 mcg/d 77 0
Frank (1999) 21 15 MU/s 600 mcg/d 69 5
Fjallskog (2003) 16 9 MU/s 450 mcg/d 63 18
Pavel (2006) 17 50-100 mcg/s 20-30 mg 40 12

IFN y análogos SST. Fases III
Estudio N Esquema Resultdos P
Kölby (2003) 68 IFNOCT-IFN
Superv 5 a30,656,8
P=0.132
Faiss (2003) 80 IFNLANLAN-IFN
SLP 1 a44,44050
P=0,69
Arnold (2005) 109 IFNOCT_IFN
OS3551
P=0.55

90 pts 1/2001-1/2008: 85 pts aleatorizados. Midgut welldifferentiated tumors
43 pts octeotride LAR im 30 mg/28 d42 pts placebo im c/28 d hasta progresión o muerte
Primary end point: Time to tumor progression
Secondary end points: survival time, quality of life and clinicaland biochemical response

-Pacientes diagnosticados, sin tratamiento previo-Confirmación histológica, TNE intestino medio
inoperables o metastáticos
-TNE de intestino medio funcionantes y no funcionantes
- No opciones terapéuticas curativas
-Tumor medible por TAC o RNM
Criterios de Inclusión

Patient DemographicsOctreotide LAR
(n=42)Placebo
(n=43)Total(n=85)
Median age, years (range) 63.5 (38–79) 61.0 (39–82) 62.0 (38–82)
Sex male (%)female (%)
47.6% 52.4%
53.5%46.5%
50.6%49.4%
Time since diagnosis, months (range) 7.5 (0.8–271.2) 3.3 (0.8–109.4) 4.3 (0.8–271.2)
Karnofsky Score ≤80>80
16.7%83.3%
11.6%88.4%
14.1%85.9%
Carcinoid syndrome* 40.5% 37.2% 38.8%
Resection of primary 69.1% 62.8% 65.9%
Hepatic tumor load0%0–10%10–25%25–50%50%
16.7%59.5%7.1%11.9%4.8%
11.6%62.8%4.7%9.3%11.6%
14.1%61.2%5.9%
10.6%8.2%
Octreoscan positive 76.2% 72.1% 74.1%
Ki-67 up to 2% 97.6% 93.0% 95.3%
CgA elevated 61.9% 69.8% 65.9%
* not requiring octreotide for symptom control

0
0.25
0.5
0.75
1
0 6 12 18 24 30 36 42 48 54 60 66 72 78 84 90
Octreotide LAR 30mg Significantly Increases Time to Tumor Progression (TTP)
Octreotide LAR vs placebo P=0.000017HR= 0.33 [95% CI: 0.19–0.55]
Based on Intention to treat analysis
Prop
ortio
n w
ithou
t pro
gres
sion
Time (months)
Octreotide LAR: 42 patients / 27 eventsMedian 15.6 months [95% CI: 11.0–29.4]
Placebo: 43 patients / 41 eventsMedian 5.9 months [95% CI: 5.5–9.1]

Octreotide LAR (n=42)
Placebo(n=43)
Complete response (n) 0 0
Partial response (n) 1 1
Stable disease (n) 28 (64%) 16 (37 %)
Progressive disease (n) 10 23
Unknown (n) 3 3
Wilcoxon-Mann-Whitney: P=0.0079
Octreotide LAR Achieved Superior Tumor Response at 6 Months (WHO)

0
0.25
0.5
0.75
1
0 6 12 18 24 30 36 42 48 54 60 66 72 78 84 900
0.25
0.5
0.75
1
0 6 12 18 24 30 36 42 48 54 60 66 72 78 84 90
Based on the per protocol analysis
P=0.0008; HR=0.27 [95% CI: 0.12–0.61]
Prop
ortio
n w
ithou
t pro
gres
sion
P=0.0007; HR=0.23 [95% CI: 0.09–0.57]
Prop
ortio
n w
ithou
t pro
gres
sion
Octreotide LAR Lengthens TTP in Patients with Functioning and Non-Functioning Midgut NETs
Patients with non-functioning tumors Patients with functioning tumors
Time (months)Time (months)
Octreotide LAR: 17 patients / 11 eventsMedian TTP 10.35 months
Placebo: 16 patients / 14 eventsMedian TTP 5.45 months
Octreotide LAR: 25 patients / 9 eventsMedian TTP 27.14 months
Placebo: 27 patients / 24 eventsMedian TTP 7.21 months

0
0.25
0.5
0.75
1
0 3 6 9 12 15
Octreotide LAR: 32 patients / 14 eventsMedian TTP 28.78 months
Placebo: 32 patients / 28 eventsMedian TTP 6.14 months
Patients with tumor load ≤10%
Based on the per protocol analysis
Octreotide LAR Increases TTP Predominantly in Patients with Hepatic Tumor Load≤10%
Octreotide LAR: 10 patients / 6 eventsMedian TTP 10.35 months
Placebo: 11 patients / 10 eventsMedian TTP 4.48 months
0
0.25
0.5
0.75
1
0 6 12 18 24 30 36 42 48 54 60 66 72 78 84 90
Patients with tumor load >10%
P<0.0001; HR=0.21 [95% CI: 0.10–0.44] P=0.1381; HR=0.45 [95% CI: 0.15–1.35]
Prop
ortio
n w
ithou
t pro
gres
sion
Prop
ortio
n w
ithou
t pro
gres
sion

Overall survivalOctreotide LAR median survival duration not yet reached (>77.4 months)Placebo: 73.7 months
Octreotide LAR: 42 patients / 7 eventsMedian >77.4 months (not reached)
Placebo: 43 patients / 9 eventsMedian 73.7 months
0
0.25
0.5
0.75
1
0 6 12 18 24 30 36 42 48 54 60 66 72 78 84
Pro
porti
on w
ithou
t pro
gres
sion
Time (months)
Es probable que no se observen diferencias en SG debido a que
son pacientes con TNE bien diferenciados, que son tumores de
crecimiento lento
El tto recibido tras la progresión en ambos grupos fue a criterio del
clinico y no formó parte del protocolo del estudio.

Safety Consistent with Established Octreotide LAR Profile
• No treatment-related deaths
• Treatment was discontinued because of AEs in 5 of 42 octreotide LARrecipients and 0 of 43 placebo recipients
• Most frequent serious AEs affected:– GI tract (octreotide LAR n=6; placebo n=8)– Hematopoietic system (octreotide LAR n=5; placebo n=1)– General health status, e.g. fatigue, fever (octreotide LAR n=8; placebo
n=2)
• Serious AEs in 11 octreotide LAR and 10 placebo recipients

• Octreotide LAR 30mg significantly prolongs TTP in all patients andpatients with low tumor load (≤10%) show an even more impressiveresponse
–Thus, initiating octreotide LAR early may improve patient outcomes,even following cytoreductive surgery
• Octreotide LAR should be considered the standard of care in patientswith well-differentiated midgut neuroendocrine tumors
Conclusions

Randomized, Phase III Trial of Everolimus + Octreotide LAR vs Placebo + Octreotide LAR in
Patients with Advanced Neuroendocrine Tumours (NET) (RADIANT-2)
Marianne Pavel1, John Hainsworth2,Eric Baudin3, Marc Peeters4, Dieter Hoersch5,
Lowell Anthony6, Sakina Hoosen7, Jessica St Peter7, Valentine Jehl8, and James Yao9
for the RADIANT-2 Study Group
1Charité-Universitätsmedizin Berlin/Campus Virchow Klinikum, Berlin, Germany; 2Sarah Cannon Cancer Center, Nashville, TN, USA; 3Oncologie Endocrinienne et Médecine Nucléaire, Institut Gustave Roussy,
Villejuif, France; 4Department of Oncology, Antwerp University Hospital, Edegem, Belgium; 5Klinik für Innere Medizin, Gastroenterologie und Endokrinologie, Zentralklinik Bad Berka GmbH, Bad Berka,
Germany; 6Ochsner Kenner Medical Center, Kenner, LA, USA; 7Novartis Oncology, Florham Park, NJ, USA; 8Novartis Pharma, Basel, Switzerland ; 9M. D. Anderson Cancer Center, Houston, TX, USA
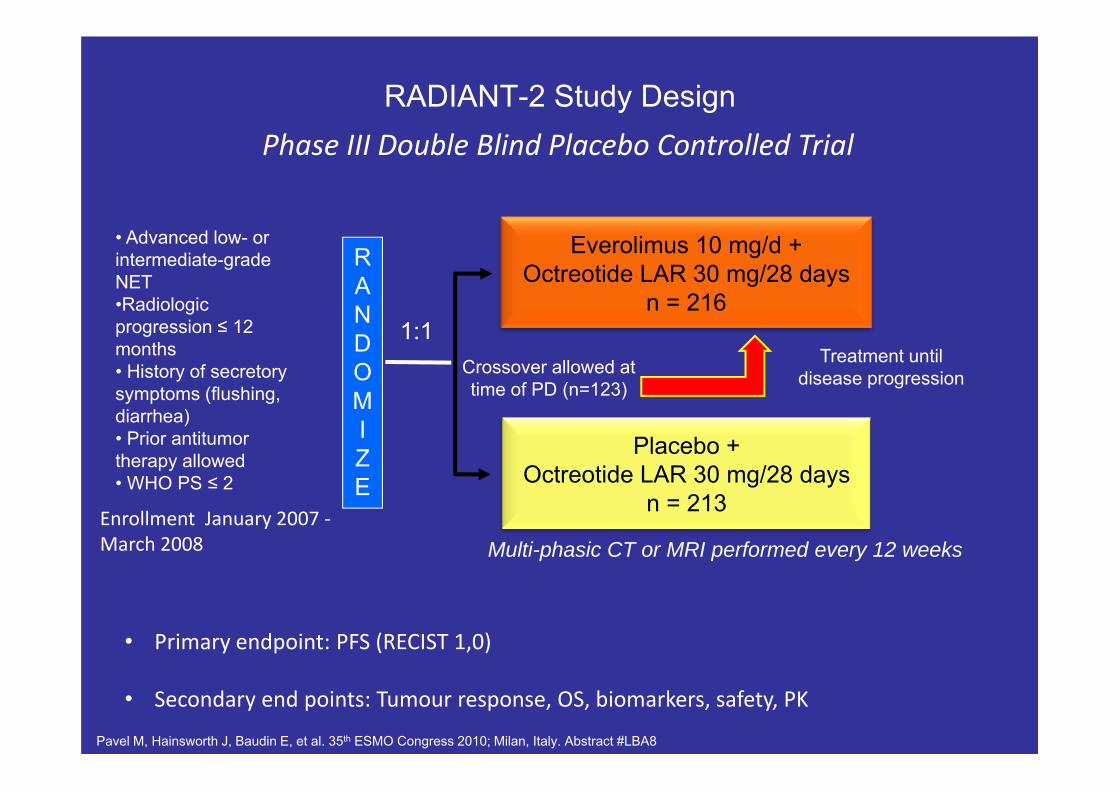
RADIANT-2 Study Design
Everolimus 10 mg/d + Octreotide LAR 30 mg/28 days
n = 216
Placebo + Octreotide LAR 30 mg/28 days
n = 213
Treatment until disease progression
RANDOMIZE
Enrollment January 2007 ‐March 2008
1:1
Multi-phasic CT or MRI performed every 12 weeks
Crossover allowed at time of PD (n=123)
Phase III Double Blind Placebo Controlled Trial
Pavel M, Hainsworth J, Baudin E, et al. 35th ESMO Congress 2010; Milan, Italy. Abstract #LBA8
• Primary endpoint: PFS (RECIST 1,0)
• Secondary end points: Tumour response, OS, biomarkers, safety, PK
• Advanced low- orintermediate-grade NET•Radiologicprogression ≤ 12 months• History of secretorysymptoms (flushing, diarrhea)• Prior antitumortherapy allowed• WHO PS ≤ 2

Everolimus + Oct LARN = 216, %
Placebo + Oct LARN = 213, %
Median age, years (range) 60 (22-83) 60 (27-81)Male 45 58Female 55 42WHO Performance Status
0 55 661 / 2* 39 / 6 29 / 5
Primary siteSmall intestine 51 53Lung* 15 5Colon 7 7Pancreas 5 7Liver 3 5
Baseline Characteristics
*One missing PS in placebo armOct LAR= Octreotide LAR
*Statistically significant for imbalance, P < 0.05
Pavel M, Hainsworth J, Baudin E, et al. 35th ESMO Congress 2010; Milan, Italy. Abstract #LBA8

Prior Therapies
Everolimus + Oct LARN = 216n (%)
Placebo + Oct LARN = 213n (%)
Prior long-acting SSA 173 (80.1) 166 (77.9)Other systemic anti-tumour therapies 99 (45.8) 82 (38.5)
Chemotherapy* 75 (34.7) 55 (25.8)Immunotherapy 27 (12.5) 20 (9.4)Targeted therapy 15 (6.9) 16 (7.5)Other 21 (9.7) 28 (13.1)
24
*Statistically significant, p < 0.05
Oct LAR = Octreotide LAR
Pavel M, Hainsworth J, Baudin E, et al. 35th ESMO Congress 2010; Milan, Italy. Abstract #LBA8

PFS by Central Review*
Time (months)No. of patients still at riskE + OP + O
216213
202202
167155
129117
120106
10284
8172
6965
6357
5650
5042
4235
3324
2218
1711
119
43
11
10
00
* Independent adjudicated central review committee• P-value is obtained from the one-sided log rank test• Hazard ratio is obtained from unadjusted Cox model
E + O = Everolimus + Octreotide LARP + O = Placebo + Octreotide LAR
0
20
40
60
80
100
0 2 4 6 8 10 12 14 16 18 20 22 24 26 28 30 32 34 36 38
Per
cent
age
even
t-fre
eKaplan-Meier median PFSEverolimus + Octreotide LAR: 16.4 monthsPlacebo + Octreotide LAR: 11.3 months
Hazard ratio = 0.77; 95% CI [0.59 -1.00]P-value = 0.026
Total events = 223Censoring timesE + O (n/N = 103/216)P + O (n/N = 120/213)
Pavel M, Hainsworth J, Baudin E, et al. 35th ESMO Congress 2010; Milan, Italy. Abstract #LBA8

PFS by Local Investigator Review
• P-value is obtained from the one-sided log rank test• Hazard ratio is obtained from unadjusted Cox model
No. of patients still at riskE + OP + O
216213
199201
167159
129121
119114
10092
8175
7472
6864
6256
5150
4041
3227
2421
1811
1110
44
21
10
00
E + O = Everolimus + Octreotide LARP + O = Placebo + Octreotide LAR
Per
cent
age
even
t-fre
e
0
20
40
60
80
100
0 2 4 6 8 10 12 14 16 18 20 22 24 26 28 30 32 34 36 38Time (months)
Kaplan-Meier median PFSEverolimus + Octreotide LAR: 12.0 monthsPlacebo + Octreotide LAR: 8.6 months
Hazard ratio = 0.78; 95% CI [0.62-0.98]P-value = 0.018
Total events = 284Censoring timesE + O (n/N = 128/216)P + O (n/N = 156/213)
Pavel M, Hainsworth J, Baudin E, et al. 35th ESMO Congress 2010; Milan, Italy. Abstract #LBA8

Everolimus plus octreotide LAR (E+O) versus placebo plus octreotide LAR (P+O) in patients with advanced neuroendocrine tumors (NET): Updated
results of a randomized, double-blind, placebo-controlled, multicenter phase III trial (RADIANT-2).
N HR CI P-valuePFS
Ever + LAR Plac + LARCentral review 429 0.77 0.59-1.00 0.026 16.4 11.3Prior SSA 339 0.81 0.60-1.09 0.077 14.3 11.1No prior SSA 90 0.63 0.35-1.11 0.054 25.2 13.6
HR P-valueMedian PFS (95% CI)
Ever + LAR Plac + LARLocal review(284 events)
0.78(0.62; 0.98) 0.018 12.0 (10.6; 16.1) 8.6 (8.1; 11.1)
Central review(223 events)
0.77(0.59; 1.00) 0.026 16.4 (13.7; 21.2) 11.3 (8.4; 14.6)
Ever + LAR Plac + LARDisease progression, N (%) 95 (44) 146 (68.5%)AEs, N (%) 57 (26.4) 14 (6.6)Duration of exposure, weeks median (range) 37 (1-163) 37 (0-152)

Occurring in >10%Everolimus + Octreotide LAR
n = 215+ Octreotide Placebo LAR
n = 211All Grades (%) Grade 3/4 (%) All Grades (%) Grade 3/4 (%)
Stomatitis* 62 7 14 0Rash 37 1 12 0Fatigue 31 7 23 3Diarrhea 27 6 16 2Nausea 20 1 16 1Infections* 20 5 6 1Dysgeusia 17 1 3 0Anemia 15 1 5 0Weight decreased 15 1 3 0Thrombocytopenia 14 5 0 0Decreased appetite 14 0 6 0Peripheral edema 13 0 3 0Hyperglycemia 12 5 2 1Dyspnea 12 2 1 0Pulmonary events* 12 2 0 0Vomiting 11 1 5 1Pruritus 11 0 4 0Asthenia 10 1 7 1
*Related toxicities grouped for calculations
Treatment Related Adverse Events
Pavel M, Hainsworth J, Baudin E, et al. 35th ESMO Congress 2010; Milan, Italy. Abstract #LBA8
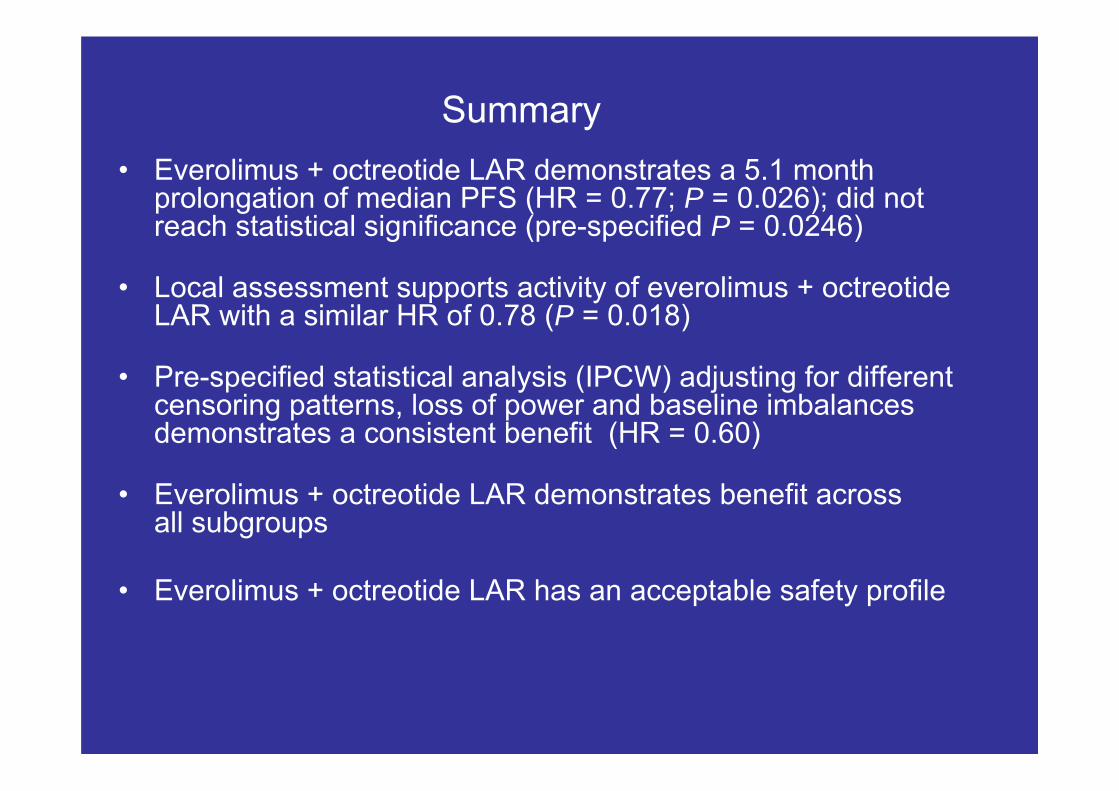
Summary• Everolimus + octreotide LAR demonstrates a 5.1 month
prolongation of median PFS (HR = 0.77; P = 0.026); did not reach statistical significance (pre-specified P = 0.0246)
• Local assessment supports activity of everolimus + octreotide LAR with a similar HR of 0.78 (P = 0.018)
• Pre-specified statistical analysis (IPCW) adjusting for different censoring patterns, loss of power and baseline imbalances demonstrates a consistent benefit (HR = 0.60)
• Everolimus + octreotide LAR demonstrates benefit across all subgroups
• Everolimus + octreotide LAR has an acceptable safety profile

RADIANT-3: Phase III Randomized Trial of Everolimus vs. Placebo in Advanced
Pancreatic NET(RADIANT-3)

RADIANT-3 Study Design
Everolimus 10 mg/d +best supportive care*
n = 207
Placebo +best supportive care*
n = 203
Multi‐phasic CT or MRI performed every 12 weeks
Treatment until disease progression
Patients with advanced pNET, N = 410
Crossover
1:1
* Concurrent somatostatin analogs allowed
RANDOMIZE
Primary endpoint:• PFS (RECIST)
Secondary endpoints:• Response, OS, biomarkers, safety, and PK
Randomization August 2007 ‐May 2009
Phase III Double Blind Placebo Controlled Trial
Yao JC, Shah M, Ito T, et al. N Engl J Med 2011 Feb 10;364(6):514-23
• Disease progression within 12 months
• Prior antitumor therapy allowed
• WHO PS ≤ 2
Stratified by• WHO PS• Prior chemotherapy

RADIANT-3: Baseline Characteristics Everolimus 10mg
(N = 207)Placebo(N = 203)
Median age, years (range) 58 (23-87) 57 (20-82)Male (%) 53 58Female (%) 47 42WHO Performance Status (%)
0 67 661 30 322 3 3
Number of organs involved (%)1 25 312 41 32≥3 34 38
Histologic Grade (%)Well differentiated 82 84Moderately differentiated 17 15Unknown 1 1
Yao JC, Shah M, Ito T, et al. N Engl J Med 2011 Feb 10;364(6):514-23

RADIANT-3: Prior Therapies
Everolimus 10mg N = 207, %
Placebo N = 203, %
Somatostatin analogs 49 50
Systemic anti-tumour therapy 58 58
Chemotherapy 50 50
Targeted therapy 5 7
Immunotherapy 3 4
Hormonal therapy 1 1
Other 10 13
Yao JC, Shah M, Ito T, et al. N Engl J Med 2011 Feb 10;364(6):514-23

RADIANT-3: PFS by Investigator Review
• P-value obtained from stratified one-sided log rank test• Hazard ratio is obtained from stratified unadjusted Cox model
No. of patients still at riskEverolimusPlacebo
207203
189177
15398
12659
11452
8024
4916
367
284
213
102
61
21
01
Kaplan-Meier medians PFSEverolimus: 11.0 monthsPlacebo: 4.6 months
Hazard ratio = 0.35; 95% CI [0.27-0.45]P-value: <0.0001
01
00
Time (months)
100
80
Per
cent
age
even
t-fre
e
Censoring TimesEverolimus (n/N = 109/207)Placebo (n/N = 165/203)
60
40
20
0
0 2 4 6 8 10 12 14 16 18 20 22 24 26 28 30
Yao JC, Shah M, Ito T, et al. N Engl J Med 2011 Feb 10;364(6):514-23

RADIANT-3: PFS by Central Review*
* Independent adjudicated central review committee• P‐value obtained from stratified one‐sided log rank test• Hazard ratio is obtained from stratified unadjusted Cox model
Kaplan‐Meier medians PFSEverolimus: 11.4 monthsPlacebo: 5.4 months
Hazard ratio = 0.34; 95% CI [0.26‐0.44]P‐value: <0.0001
No. of patients still at riskEverolimusPlacebo
207203
187180
15299
12660
11752
8122
4912
365
273
221
101
61
20
00
Time (months)
100
80
Percentage event‐free
Censoring TimesEverolimus (n/N = 95/207)Placebo (n/N = 142/203)
60
40
20
0
0 2 4 6 8 10 12 14 16 18 20 22 24 26
Yao JC, Shah M, Ito T, et al. N Engl J Med 2011 Feb 10;364(6):514-23

RADIANT-3: Response to Everolimus was Significantly Superior to Placebo
Everolimus 10mg N = 207 n (%)
PlaceboN = 203n (%)
Complete response (CR) 0 0Partial response (PR) 10 (4.8) 4 (2.0)Stable disease (SD) 151 (72.9) 103 (50.7)Progressive disease (PD) 29 (14.0) 85 (41.9)Unknown 17 (8.2) 11 (5.4)Two-sided P-value for treatment difference* P < 0.0001
Disease control rate (CR + PR +SD) 161 (77.7) 107 (52.7)
*Wilcoxon two‐sample test
Per investigator reviewRECIST 1.0
Yao JC, Shah M, Ito T, et al. N Engl J Med 2011 Feb 10;364(6):514-23

RADIANT-3: Overall Survival
Everolimus 10mg
N = 207
Placebo N = 203
Kaplan-Meier estimates [95% CI] at:2
3 months 97.1 [93.6-98.7]
98.5 [95.5-99.5]
6 months 93.1 [88.7-95.9]
91.6 [86.8-94.7]
12 months
82.3 [76.0-87.0]
82.6 [76.5-87.3]
18 months
73.1 [65.1-79.6]
73.9 [66.1-80.2]
24 months
57.3 [43.0-69.2]
62.8 [51.1-72.4]
148 placebo patients crossed over to receive everolimus
100
80
60
40
20
0
Perc
enta
ge o
f eve
nt-fr
ee
No. of patients still at risk
Censoring Times1
Everolimus (n/N = 51/207)Placebo (n/N = 50/203)
EverolimusPlacebo
207203
Kaplan Meier mediansEverolimus: NA monthsPlacebo : NA months
Hazard Ratio: 1.0595% CI [0.71,1.55]
Log-rank p-value = 0.594
0 2 4 6 8 10 12 14 16 18 20 22 24 26Time (months)
203199
195195
188183
181174
162160
122129
97109
7487
5363
3842
2623
916
57
28 30
03
01
32
00
Yao JC, Shah M, Ito T, et al. N Engl J Med 2011 Feb 10;364(6):514-23

Occurring in >10% Everolimus n = 204 Placebo n = 203All Grades (%) Grade 3/4 (%) All Grades (%) Grade 3/4 (%)
Stomatitis* 64 7 17 0Rash 49 <1 10 0Diarrhea 34 3 10 0Fatigue 31 2 14 <1Nausea 20 2 18 0Infections* 23 3 6 1Peripheral Edema 20 <1 3 0Decreased appetite 20 0 7 1Headache 19 0 6 0Dysgeusia 17 0 4 0Anemia 17 6 3 0Epistaxis 17 0 0 0Weight decreased 16 0 4 0Vomiting 15 0 6 0Pruritus 15 0 9 0Hyperglycemia 13 5 4 2Thrombocytopenia 13 4 <1 0Asthenia 13 1 8 1Pulmonary Events* 17 3 0 0Nail disorder 12 <1 1 0Cough 11 0 2 0Pyrexia 11 0 0 0
RADIANT‐3: Treatment Related Adverse Events

RADIANT 3: Conclusion
• RADIANT 3 evaluated the efficacy and safety of everolimus in advanced pNET, enrolling 410 patients in the largest-ever placebo-controlled phase III clinical trial in this patient population
• Everolimus provided a 65% reduction in risk for progression compared to placebo in patients with pancreatic NET (HR = 0.35, P < 0.0001)
• Everolimus 10mg daily provided a 6.4 month improvement in median progression free survival compared to placebo demonstrating a 2.4 fold increase– 11.0 months with everolimus compared to 4.6 months with placebo

RADIANT 3: Conclusion
• 18 months PFS rate of 34% vs. 9% placebo demonstrates a durable benefit with everolimus
• Disease control rate (CR+PR+SD) was 77.7% with a significant response difference, P < 0.0001
• Everolimus showed a consistent benefit in all subgroups
• Everolimus has an acceptable safety profile
• Everolimus should be considered a standard of care for patients with advanced pancreatic NET
Updated Results of the Phase III Trial
of Sunitinib vs. Placebo for Treatment of Advanced Pancreatic
Neuroendocrine Tumors
Eric Raymond,1 Patricia Niccoli,2 Yung-Jue Bang,3 Ivan Borbath,4Catherine Lombard-Bohas,5 Juan Valle,6 Shem Patyna,7Dongrui-Ray Lu,7 Richard Chao,7 Jean-Luc Raoul8

Phase III, Randomized, Double-Blind Study of Sunitinib vs. Placebo in Patients with Advanced, Progressive,
Well-Differentiated Pancreatic Endocrine Tumors
RANDOMIZATION
N=340
Study A6181111
Eligibility criteria•Well‐differentiated, malignant pancreatic endocrine tumor
• Disease progression in past 12 months
• Not amenable to treatment with curative intent
Balanced by region• Europe, Asia, Americas/Australia
Sunitinib 37.5 mg/day orally, continuous daily dosing (CDD)*
Arm A
Placebo*
Arm B
1:1
*With best supportive care
Somatostatin analogs were permitted
Primary endpoint: PFS
Secondary endpoints: OS, ORR, TTR, duration of response, safety, patient‐reported outcomes
1. Escudier B, et al. J Clin Oncol 2009;27:4068–75; 2. George S, et al. Eur J Cancer 2009;45:1959–683. Barrios CH, et al. Eur J Cancer Suppl 2009;7:429
Previous experience with sunitinib daily dosing:

Demographic and Baseline Characteristics
● Patients were enrolled between June 2007 and April 2009 Sunitinib
(n=86)Placebo(n=85)
Median (range) age, years 56 (25–84) 57 (26–78)Gender, n (%)
MaleFemale
42 (48.8)44 (51.2)
40 (47.1)45 (52.9)
ECOG performance status, n (%)012
53 (61.6)33 (38.4)
0
41 (48.2)43 (50.6)1 (1.2)*
Race, n (%)WhiteAsianOther/unspecified†
48 (55.8)13 (15.1)25 (29.1)
53 (62.4)10 (11.8)22 (25.9)
*Protocol violation†Per local regulations, race was not routinely reported in one participating country

Tumor Characteristics at Baseline Sunitinib
(n=86)Placebo (n=85)
Tumor functionality, n (%)*Non-functioningFunctioning
GastrinomaGlucagonomaInsulinomaVIPomaOther/multiple neuropeptide(s)
Not specified
42 (48.8)
9 (10.5)3 (3.5)2 (2.3)
011 (12.8)19 (22.1)
44 (51.8)
10 (11.8)2 (2.4)2 (2.4)2 (2.4)5 (5.9)
20 (23.5)Ki-67 index
Patients with Ki-67 index reported, n≤2%>2–5% >5–10%>10%
367
1658
366
14106
*Tumor functionality was as reported by investigators

Prior Treatments and Concomitant Somatostatin Analog (SSA) Use
Sunitinib (n=86)
Placebo (n=85)
Prior treatments, n (%) of patientsSurgeryRadiation therapyChemoembolizationRadiofrequency ablationPercutaneous ethanol injectionSSA
76 (88.4)9 (10.5)7 (8.1)3 (3.5)1 (1.2)
21 (24.4)
77 (90.6)12 (14.1)14 (16.5)6 (7.1)2 (2.4)
19 (22.4)Prior systemic treatment, n (%) of patients
AnyStreptozocinAnthracyclinesFluoropyrimidines
57 (66.3)24 (27.9)27 (31.4)20 (23.3)
61 (71.8)28 (32.9)35 (41.2)25 (29.4)
Concomitant SSA treatment, n (%) of patientsStarted prior to study and continuedStarted during study
17 (20.5)15 (18.1)2 (2.4)
18 (22.0)12 (14.6)6 (7.3)

Progression-Free Survival (Primary Endpoint)
1.0
0.8
0.6
0.4
0.2
0
Prop
ortio
n of patients
0 5 10 15 20 25
86 39 19 4 0 085 28 7 2 1 0
Number at risk
SunitinibPlacebo
Time (months)
Median PFSSunitinib 11.4 months (95% CI 7.4, 19.8)Placebo 5.5 months (95% CI 3.6, 7.4)
HR 0.418 (95% CI 0.263, 0.662)p=0.0001
Study stoppedearly
– Many events censored
– Number at risk low from month 15

Overall Survival1.0
0.8
0.6
0.4
0.2
0
Prop
ortio
n of patients
0 5 10 15 20 25
86 60 38 16 3 085 61 33 12 3 0
Number at risk
SunitinibPlacebo
Time (months)
Sunitinib
Placebo
HR 0.409 (95% CI 0.187, 0.894)
p=0.0204

RECIST-Defined Objective Tumor Responses
Sunitinib (n=86)
Placebo(n=85)
Best confirmed tumor response, n (%)Complete responsePartial responseStable disease/no responseObjective progressionNot evaluable
2 (2.3)6 (7.0)
54 (62.8)12 (14.0)12 (14.0)
00
51 (60.0)23 (27.1)11 (12.9)
Objective response rate (95% CI) Two-sided p value for treatment difference
9.3% (3.2%, 15.4%) 0.0066
0
Median (range) duration of response, months 8.1 (1.0–15.0) –
Stable disease >6 months, n (%) 30 (34.9) 21 (24.7)
Tumor responses were assessed using RECIST 1.1Objective response rate = patients with complete or partial tumor response

Most Frequent Grade 3+ Adverse Events with Sunitinib 37.5 mg/day CDD
All-causality grade 3/4 adverse events in ≥4 patients in either arm, n (%)
Sunitinib (n=83)
Placebo (n=82)
Neutropenia 10 (12.0) 0
Hypertension 8 (9.6) 1 (1.2)Hand–foot syndrome 5 (6.0) 0Leukopenia 5 (6.0) 0Diarrhea 4 (4.8) 2 (2.4)Asthenia 4 (4.8) 3 (3.7)Fatigue 4 (4.8) 7 (8.5)Abdominal pain 4 (4.8) 8 (9.8)Hypoglycemia 4 (4.8) 1 (1.2)
Back pain 0 4 (4.9)
Grade 5 adverse events
Patients experiencing grade 5 events, n (%) 4 (4.8) 6 (7.3)Treatment-related events, n (%) 1 (1.2) 1 (1.2)Nature of treatment-related event Cardiac failure Dehydration

Summary• In patients with progressive, well-differentiated pancreatic endocrine tumors,
sunitinib 37.5 mg/day continuous daily dosing resulted in:– Clinically significant improvement in median PFS vs. placebo
• 11.4 months vs. 5.5 with placebo, HR 0.418, p=0.0001– Improvement in overall survival vs. placebo
• HR 0.409, p=0.0204– Clinically significant increase in ORR vs. placebo
• 9.3% vs 0%, p=0.0066
• Adverse events observed with sunitinib continuous daily dosing weregenerally tolerable, and manageable by dosing interruption, dose reductionand/or standard medical therapy
– The most frequent events were consistent with previous trials of sunitinib1,2
– Rates of asthenia, vomiting and fatigue were similar in both arms
• These data support the clinical safety and efficacy of sunitinib inpatients with advanced pancreatic NET
1. Faivre S, et al. J Clin Oncol 2006;24:25–35; 2. Kulke MH, et al. J Clin Oncol 2008;26:3403–10

Conclusiones

Parameters With an Impacton Therapeutic Decision Making
Histology
– Grading G1/G2 (NET) vs G3 (NEC) (WHO 2010)
– Well/moderately or poorly differentiated NET/NEC (US)
Functionality– Carcinoid syndrome, insulinoma, gastrinoma, VIPoma
Primary tumor site – Pancreatic vs intestinal
‐ 5‐year overall survival 40‐50% vs 70‐90% in metastatic disease
Somatostatin receptor imaging
Tumor burden/extrahepatic disease
Abbreviations: NEC, neuroendocrine carcinoma; NET, neuroendocrine tumor; WHO, World Health Organization.

Conclusiones

ENETS Consensus Guidelines

Gracias