b.a.r.c-1177 - inis.iaea.org
TRANSCRIPT
B.A.R.C-1177
i0
OP
GOVERNMENT OF INDIA
ATOMIC ENERGY COMMISSION
RESEARCH & DEVELOPMENT ACTIVITIES OF THENEUTRON PHYSICS DIVISION
For the periodJanuary 1981 - December 1981
Edited by
Sandhya Bhakay-Tamhane and Falguni Roy
BHABHA ATOMIC RESEARCH CENTRE
BOMBAY, INDIA1982

B.A.ft.C. - 1177
GOVERNMENT OP INDIA
ATOMIC BNERGI COMMISSION
RESEARCH i DEVELOPMENT ACTIVITIES OF THENEUTRON PHYSICS DIVISION
For 'ih« periodJanuary 1981 - D«e«mb«r 1981
by
Sandhya Bhakay-Tanhane and Falgunl Roy
BHABHA ATOMIC RESEARCH CENTRE
BOMBAY, INDIA
1982

FOREWORD
This year has been a period of consolidation and growthof the research activities in the Division.
The current interests of the Purnlma Group include 233-Ucritical systems and minimum critical mass systems, applica-tions of the Trombay .Criticality Formula, oil-well loggingapplications of 14 MeV neutrons, fusion blanket neutronlcs,plasma pinches and various advanced fusion concepts. The 233-Ufuelled neutron source reactor project at RHC, Kalpakkam waaaccorded sanction during this year enabling it to enter the phaseof procurement and fabrication. Several fusion plasma relatedexperiments have been carried out with the available 80 KJcapacitor bank anti a much larger 500 KJ facility is being set up atthe Purnlma Complex for pulsed fusion studies.
In neutron crystallography, the emphasis waa on structuralphase transitions and the physics of diffraction, particularlythe physical reasonableness of the parameters characterising acrystal as obtained from a study of extinction effects. Severalmolecules of pharmacological Importance have also been studiedusing X-rays. In macroaolecular crystallography, the refinementof two important enzyme structures-human erythrocyte carbonicanhydrase B and Cu 2+ lysozyme complex- waa carried out. Severalcomputer programs for biological crystallography were alsoimplemented on the computers accessible to us.
The main thrust of the materials physics researchprogramme is on high pressure and shock wave phenomena. Theequation of state studies have continued and it was shown thatthe valence charge in a solid at OK can' be viewed as a pressureionisation effect. In another study, the non-thermallsation ofpositrons at very low temperatures in alk&li metals was shownto be interpretable in terms of a charge-density-wave groundstate.
The R&D work of the Seismology Section is centered aroundthe development of new methods of detecting underground nuclearexplosions and of new algorithms for extracting the signals anddiscriminating between nuclear explosions and earthquakes. Theexpertise acquired, particularly from the Qauribidanur SeismicArray, is finding use in the seismic risk estimation for sitinglarge structures including nuclear power plants. In thecollaborative project for rockburst studies in the Kolar (toldFields, the feasibility study for a three-dimensional network ofsensors close to the working mines was completed. The seismologyresearch has both a strong Instrumentation base and an extensive
- i. -

- il -
theoretical back-up.
The workshop facilities for the Division are providedby the Fhyslcs Group Workshop whose staff Is affiliated tothe Nuclear Physics Division. We are also grateful for thecollaboration and support froa several Divisions In B.A.R.C.
(It. Chldaabaraa)

CONTENTS
Page
FOREWORD 4
1 PURNIMA LABORATORIES233
1.1 U Fuelled Neutron Source Reactor atRRC, Kalpakkam - Progress Report i
1.2 Purnima-II, Beo Reflected 2 3 3U UraaylNitrate Solution System - Progress Report .. 3
1.3 Reactivity Contribution due to (n,2n)Multiplication in BeHg /Moderated MinimumCritical Mass Systems ., 4
1.4 Probability Distribution in Time ofOccurrence of Fission Burst and its Effecton' Peak Fission Power and Yield inSolution Systems 6
1*5 Analysis of CRAC Series of Kinetic Experi-ments on Enriched Uranyl Nitrate SolutionSystems - Some Results 7
1.6 Systematic* of Variation of ReflectorSavings with Reflector Thickness for SnailReactor Assemblies 8
1.7 "Development of Neutron Transport TheoryCodes Using Finite Element Technique ...... 10
1.8 Neutron Pulse Propagation in a FissileMedium and Multiplication Aspects of Micro-Fission Systems 11-
1.9 Neutron Multiplication due to 14-MeVNeutrons in Spherical Fertile Blankets:Calculations 12
1.10 Multilayered Blanket Concept for TritiumBreeding Assemblies 14
1.11 Composite Lead-Bsryllium Neutron Multipliersfor Fusion Blankets 16
- iii -

- ir -
1.12 Absolute Neutron Yield DeterminationUsing Associated oC-particle Method 17
1.13 Neutron Physics Studies for Oil WellLogging Applicationa 18
1.14 Optimum Moderator Thickneoti for MaximumCharged Particle Conversion Efficiencyfor the Detection of D-D Fusion Neutrons ... 20
1.15 Use of SSTD for the Detection of Neutronsfrom Low Yield Plasma Experiments 21
1.16 Scaling of Plasma Focus Properties withCapacitor Bank Current 22
1*17 Use of an Electric Gun for Compressionof Deuterium Gas In Conical Targets ........ 23
1.18 Some Aspects of Modelling • MXQMA FusionReactor 25
1.19 Proposed.500 KJ Capacitor Bank Facilityfor Pulsed Fusion Studies 27
CRYSTALLOGRAPHY
2.1 Structural Study of LiKSO^ 31
2.2 Comparative Study of Mosaic Structure inCrystals by Refinement of ExtinctionParameters from Neutron Data and by X-RayTopography 32
2.3 The Crystal and Molecular Structure of N-Methyl-Crotananium Iodide, C)7H25O5N-CH3I .. 34
2.4 The Crystal and Molecular Structure ofFalladium-L-Hydroxyproline Trihydrate ...... 35
2.5 Crystal Structure of a Substituted EthyleneLI-Methyl. 2~<Nitro Methylene)Pyrrolidine3.. 36
2.6 Structure of (NH.)-CuCl,.2H-0 in itsOrdered Phase ..7.7...."...7 36

2.7 Refinement or the Structure of HuacnBrythrocyte Carbonic Anhydrase B ,, 37
2.8 X-Ray Piffraction Study of Cus*-LysotymekS21
Complex at 2* Resolution 39
1,9 Magnetic Tap* Controller for tha TDC-312Computer Controlled X-Ray DiffraetometeriStatua Report • 40
2*10 Printout Syatea for Double CryatalDlffractomater (D1) and Positron AngularCorrelation (PAC) Experiments 40
t.11 Computer Program for Thermal Motion
Analysis 41
t.it Computer Program MULTAN , 41
t,13 Computer Programs Related to BiologicalCrystallography 41
MATBRXAL PHYSICS
3.1 Kon-Thermallxation of Positrons in AlkaliMetals: An Alternative Interpretation InTerms of a Charge-Denslty»Wave around State.. 43
3.2 Valence Charge in a Solid at OK Viewedas a Pressure lonlsation Effect .....•••*«.•. 44
3.3 Positron Annihilation Studies la ThermalCycled Uranium 46
3.4 Single Crystal Neutron Diffraction Studyof High Pressure Omega Polymorph of Zr ..... 46
3.5 A Semiemplrical Bquatlon of State forMetallic Solids 47
3.6 Liquid Disorder and Shock Hugoniot of Lead •• 49

-Tt -
S1ISM0L00T
4.1 Velocity Variations in Kolar OoldQold Fields (KOF) 52
4.2 Processing of Core-Reflected F Phase 52
4.3 Further Studies on Source Discriminationin "Difficult" Cases 54
4.4 Synthesis of F-trave Selsmogram* fromEarthquakes 55
4.5 Data Requests for Research and DevelopmentPurposes ..................... «« 56
4.6 automation of the Daily Calibration ........ 56
4.7 Magnetic Tape Controller » 57
4.8 Digital Telemetry 58
4.9 Rockburst Research Project: Phase XI Studies 59
4.10 Some Examples of Detection of PcP Signalfrom Earthquake* 59
4*11 Encoding and Decoding Circuitry forModified Miller Code, Manchester Sodsand Biphase M Code 60
4.12 Multichannel Analog Data Acquisition System'for Field Use ............................. 61
4.13 Multichannel Low Frequency Analog SignalRecording on a Common Track of an AudioTape Using rDMT«chniq«« .................. 61
4.14 On the Problem of Enumeration of RootedTrees 63
4.15 Application of Discrete ProbabilityDistribution of Rooted Trees to Outenberg-Rlchter Frequency-Magnitude Relation ...... 64
4.16 Further Studies on the Statistics of KoynaTremors ................................... 65
4.17 Fracture as a time depending topology ofIncluaions , 66
Tii -
Pace
4.18 Depth Estimation Using Multistation Data .. 66
4.19 Data Compression by Auto Regressive (Alt)Methodt Son* Case Studies 68
4.20 Selsnotectonic Studies of the Decoan Plateau 69
4.21 Siting Nuclear Power Plants 70
4.22 Beam Forming Unit as an Aid to Study theSlowness of the Seismic Signals 71
4.23 Tripartite Microbarograph and Seismic Unit 71
4.24 Modification to TD10 Tape Deck 72
4.25 Attenuation and Velocity of wavesPropagating Along Steel-Steel Interface ... 72
4.26 Seismic-Instrumentation 74
APPENDIX
Papers Published/Accepted for Publicationin Scientific Journals etc. 77BARC Reports 80
Papers Presented/Accepted for Presenta-tion at Symposia, Seminars, Conferences etc. 81
Lectures Given in Training School etc. ..... 86
Awards and Degrees 87
Neutron Physics Division Staff 88

1. FORHIMA LABORATORIES
1.1 2 3 3U Fuelled Neutron Source Boactor at BRC.Kalpskkam -Progress Report i
(C.S. Fasupathy, M. Srinivasan, V, Anandkumar*• S. Srinlvaaan")
This project was accorded financial sanction In July1981 enabling it to enter the second phase of activitynamely procurement and fabrication in areaa where designswere froxen. Design computational activity was continuedIn other areas.
(A) Reactor Core Prototype Fuel Sub-assembly and ReflectortBaaed on the phyaica calculations performed so far, /1/fit was decided to lnorease the fuel content in the 333U-A1alloy to 25% to permit an Increased core loading withoutincreasing the core volume. A prototype fuel sub-assemblyla to be fabricated shortly with the above uranium alloycontent and other.specifications by the RadiometallurgyDivision. BARC, using natural uranium and tasted as p*r theguidelines provided in ANS-15.2,/2/. The final fabricationand testing procedure for the fuel will be drawn up on thebasis of these trials.
(B) Reactor Structure: The earlier reflector module designis being scrutinized to reduce the overall streaming andalso work out special beryllium requirements in the regionof beam holes.
The reactor structure comprising of the reactor tank,catcher vessel and top structure are to be fabricated asper ASME code for Nuclear components (sec. Ill), usingSS304L. Various metallurgical tests and weld qualificationand checks required to meet the above specifications areunder way.
(C) Mock-up Tank: A full scale MS mock-up in reactor tank waterhas bean fabricated with the help of CWS, RRC for carryingout various under-water handling and maintenance operations.Fabrication of other fixtures for simulation and testing underwater will be taken up shortly.
(D) 'Nuclear Instrumentation and Control? A basic schematicof the requirement of nuclear instrumentation channels, processinstruments and safety control mechanisms has been prepared.
• RRC, Kalpakkam
- 1 -

- 2 -
The nuclear Instrumentation channel* to be fabricated would beof the ?AC« type (evolved by Electron!** Division , BARC forthe research reactor* at Trombay), on account of their reliabilitybated oo extensive testing. A design for safety control aecha-altas using stepper motors, electromagnetic clutches and wirepope drives Is being worked out on account of the Halted headrooa available.
The microprocessor based data processing and loggingsystea is to be augmented by a low cost colour display terminalfor projecting trends and other essential information in colourcoded form. Some of the software required for this purpose wouldbe developed on an LSI-11/03 system available at PurnlaaLaboratories, BARC,
(I) Shield Arrangement: A modified shield design for highdensity concrete bricks baa been worked out. This design callsfor less number of mould shapes and is being examined to seehow well the various cutouts required can be aeeoaaodated.
Moulds are under fabrication for doing trial castings tocheek surface finish, density, reproduelbllity and interlocking.Various geometries are being worked out for evaluating dossrates using MORSE cod* and coupled neutron-gamma cross sectionsfor optimising shield thickness in different regions.
(f) Water Systems: The requirements for mixed bed deaincraliserbased on FBTR water quality and resin load due to leaching wereevaluated. This item and various other materials required forto* shell and tub* beat exchanger are under procurement. Detailsof piping and other components like valves, Indicators etc.are being worked out at present.
A hoist facility having 1.5 Te capacity for us* In reac-tor vault area and also in meszanine extension during spent fueldisposal (by a suitable beam extension) Is being designed withthe help of CVS, BARC. This hoist will incorporate some specialfeatures of lncell cranes like S3 rubbing parts, radiationresistant lubrication, remote tools for lowering load and movingthe crane during power failure etc.
(0) Project Planning and Scheduling: A scheme for monitoringth* project progress along the lines adopted for FBTR is being••ployed. Based on various major tasks required for comple-tion of the project and appropriate weightage factors assignedto each of the tasks a schedule is being prepared and compute-rised for monitoring project status/progress.
• ZAC stsnds for £*rlina, JLpsara and Cirua

Fig. 1.2.1 General view of the Purnima 11 assembly

- 3 -
Reference*
1. rasupathy, C.S., Srinlvasan, M., Anand Kumar, V. andKantian, N., Neutron Physic* Division Report for theTear 1960, p. 1, BARC-1134 (1981).
2, Quality Control for Plate-Type 0raniui>-Aluainlum FuelElements ANS-15.2/N398-197*.
1.2 Purnlma-II. BaO Reflected 2 3 3U Uranyl Hitrate Solutionj -Progress Rsporf
(K. Cbandr«nol«ahwar, P.K. Job, C.3. Pasupathy,H. Srinivasan and K. Subba Rao)
A platform structure was erected around the twin glovebox** housing th* peristaltic pump in th* lower box and weireup and leval probe in th* upper box. Th* lower platform itdesigned to give access to the operator to carry out cbeaicalhandling operations Inside the glove box. The upper platformfacilitates carrying out maintenance and repair of equipmentthrough th* glove ports. The final wiring for the levelprobe, weir cup, peristaltic pump, solenoid valves etc. frouwithin to outside the glove box is complete.
The safety plates and the control blade drive mecha-nisms were installed in place and tested. Inter-coaparisonchecks of analog and digital position indication were carriedout. The control console panel layout indicating states ofreactor, causes of scram, warnings etc. were finalised andthe modified panel is under fabrication.
An instrumented neutron pulse channel driving a seriesof preset block circuits is being Incorporated for use duringreactor start up to sense fuel overload condition. The first,block is to check for minimum counts. Subsequent blockssequentially prevent energisation of reactivity manipulationdevices if the count rates are above preset levels indicatinghigher than anticipated multiplications. The instrument Isunder fabrication at the Electronics Division. The controland nuclear instrumentation cabling is currently in progressunder the supervision of Reactor Control Division, Fhotogr*3hshows the general view of Purnlma II.
•In collaboration with Reactor Control Division, Fuel Reproces-sing Division and Radiometallurgy Division.

- 4 -
1.3 Reactivity Contribution duo to (n,2n) Multiplication InBon*.. Moderated Minimum Critical Mass Systems
<P»K. Job, K. Subba Rao and M. Srinivaaan)
B«Hg has bean shown to be an effective Moderator Inreducing critical, masses in minimum critical mass systemson account of its (nt2n) reactivity bonus and higher hydrogennumber density /1/. The precise (n,2n) reaction rate, reac-tivity contribution and corresponding critical nass savingwas evaluated using the latest 'Be cross section data /2/.
All calculations were done in spherical geometry usingthe one-dimensional transport theory code DTF IV in 84quadrature. The 16 group HR cross section set with F1 treat-ment of anlsotropic scattering of hydrogen was used as thebasic set except for beryllium. Beryllium set has beenderived using the latest available point cress section data/3/. Calculations were done for an optimum Hydrogen to Fissilematerial ratio for which the critical mass Is minimum. Eventhough nonsolvated crystalline BeH2 has a density of780 Kg/m3, four different densities of BeHg were analysednamely 600 Kg/m3, 760 Xg/m3, 800 Kg/m3, 1000 Kg/m3 designatedas 0,6, 0.78, 0.8 and 1.0 BeHg.
Table 1.3.1 summarises the results of th« calculatians.Columns 5 and 6 give the additional (n,2n) neutrons produceddue to (n,2n) reactions in 9Be in the core and in the reflec-tor per fission neutron born in the core. It can be seenthat the (n,2n) multiplication is maximum In the case of BeH2moderated - BeO reflected systems. In this case an additional5% (n,2n) neutrons are produced in the-core and reflectorper fission neutron born In the systems.
Reactivity Bonus Due to (n,2n) Neutrons: Table 1.3.I(Column 7)also gives the reactivity bonus due to (n,2n) neutrons. Itcan be seen that in the case of B0H2 moderated and BeO reflec-ted systems the reactivity gain is of the order of 3 to 4%which corresponds to a critical mass saving of 13 to 16%(Column 4 of .Table 1.3.II). The critical mass saving is smal-ler for cores with higher hydrogen number density. In thecase of H2O and CH2 moderated - BeO reflected systems thecritical mass saving due to (n,2n) multiplication is to 10%.for water moderated - BeH2 reflected systems the (n,2n) reac-tions do not contribute to system reactivity significantly,because (n,2n) neutrons born in the hydrogenous reflectorhave* a higher probability of getting absorbed in the reflec-tor itself without ever entering the core.
In conclusion, the (n,2n) multiplication contributessubstantial reactivity in BeH2 moderated minimum critical masssystems. This makes BeH2 an ideal moderator for minimumcritical mass systems.

Tabla 1.3.It Suaaary of k # f f Rssul&a and (n,2n) Bonus
Mas* In th« COP* • 0.205 Kf
H/233D Ration • 364
Raflactor Thioknss* • .80 a
•adaritar
H,0
CH,
o.» iaHj.
0.8 BaH,
1.0 BaHj
Ceraradimtal
0.8833
0.8237
0.8667
0.8076
0.7502
Rariaetorattarlal
H,0
0.6
o.e1.0
v0.81.0
0.6
0.8
1.0
BaHj
laH3
BaHj
OtO
BaH,
BaH2
BaH.
BaO
BaH2
BaO
BaH,BaO*
B«H2
BaO
k.ff
0.734
0.744
0.777
0.799
0.964
0.8*6
0.832
0.662
0.883
1.036
0.765
0.986
0.915I.ObO
1.032
1.157
(n,2n) Raaetiontpar riaitonnautron aalttad .
Ineera
0.00.0
0.00.00.0
0.00.0
0.00,00.0
1.44
1.44
1.551.59
1.62
1.70
In rtflac-ter
0.0.1.40
1.40
1.40
3.94
0.0
1.16
1.10
1.12
3.55
1.2S
3.76
1.103.27
1.00
2.90
• " I.Ilenufu>
dut to
raattlana*
0.00.80
0.90
0.88
2.49
O'.O
0.60O.TO0.6B
t.12
1.60
4.25
2.733.80
2.713.60
(a) rarctntig* dacraaint In k rt whan (n,2n) raaetlona are•Hitchad 9tt.... * r r
Tabla) 1.3.II: Suaaary of Critical Haas Rapalta and (nt2n) Bonna
Coro a»t«rial • 233,0 •»• aodarator H/233O Ratio « 3*4
Raflcetor Tbicknaaa » 0.40 a
Cora•odaratoi*
H8O
0.60 BaH£
0.7U BaH2
1.00 BaH2
HjO
o«20.60 BaH2
0.78 B«H2
1.00 BaH2
(iaflactor•atarlal
NilNilNil
Nil
BaOB.O
BaO
BaOBaO
Critical Maaa!«g)
1.162
1.045
0.620
0.379
0.189
0.15*
0.177
0.137
0.106.
Critical Ha**'5"bonua dua to(n,2n) raactlona
0.08.9
8.78.4
11.1
8.8
16.J
15.7
13.2
(a) Fareantaga lneraaaaa In critical •••» whan ln,2n) raaetlana•ra twltcKad off.

- tt -
Referencea
1. Subbe Rao K. and Srinlraaan, N«, Nuel. Tech., 49.315 (1980). ~*
2. Tha LLL Evaluated Nuclear Data Library (INDL) 1978.
3. Job, P.K. and Srlnlvasan, M., Neutron PbyalcaDivision Report for the year 1930, p.7,BARC(1981).
1.4 Probability Distribution in Tlae of Occurrence ofFission Burst and its Effect on feaic riaaion rower andTltld in Solution System*
(3. Das)
Ths paak power and the total number of flasions la anaoaldsntal excursion of fiaaila aaterial (aithar an unaodora-tad enriched systea such as Qodiva, Purniaa, ate, or an en-riched uranyl nltrata aolutlon nystaa aueh aa CRAC, Purniaa XIate.) dapand to a graat axtant on tba rata of raaetlvltyaddition (R) and tba affaet of tna nautron flux. In fchaprasanca of a waak sourea of atrtingth 5 n/a (condition for tblala %-SSi/S« 1 ), thara la a probability distribution intiaa of tha initiation of a chain raactlon giving rlaa to aprobability distribution in tins of burat oceurranea and anargyralaaaa. If initiation la dalayad significantly aftar thaattalnasnt of a critical mass, »r*tmm attains a aora supar-critlcal configuration and fission yiald froa tha systaabacons* largar. In ordar to coaputa tha paak fission povarand ylald in tha first pronpt critical aplka in accidentalaxcursions In uranyl nitrata solutions, a study was aada of thaprobability P(t)dt of tha first parslatant chain raaetionoccurring in a given tlaa interval. For this, tha aquationgiven by Hansen f\t was used.
Fig. 1.4.1 shows plots of P(t)dt for several ratea of
Fig.1.4.1: Tba probabilitypar unit tlae P(t) of thafirst persistent fission chainsponsored at tiae t for seve-ral selected raap reactivityInsertion rates and soureastrengths It i 26 usec,j8 > 815 pea). '
re* cwrwuoui CIMVUH I TW KAtl OK IM
HflHU CMVKS » t THCK M OH tHC HI.HT

reactivity Insertion (R) for a 92 g/litre of 93* enricheduranyl nitrate solution in a bare cylindrical assembly.Though areas under the curves are equal, there is a greatlyvarying delay between reaching a critical aass (t « 0) andthe average tine at which the first persistent chain reac-tion occurs. For the addition rate of 100 dollars/sec,average delay (*t) is less than 0.1 sec which represents anexcess reactivity of fi£ 10 dollars; however, for an addi-tion rate of 0.1 dollar /sec, average delay is* 2.5 sec withan excess reactivity of s> 0.26 dollar. Figure 1.4.1 also•hows that as the source neutrons Increase, the delay betweenreaching a critical mass and the initiation of the chainreaction decreases. The aean probability r of initiationof first persistent fission chain increases both due to theIncrease in reactivity insertion rate for a fixed sourcestrongth S • 172 n/s and.also due to the increase in sourcestrength for a fixed reactivity insertion rate R • 0.31 t/see»
Study also Jhowed that both f and 1 were Insensitiveto a change in the value of l> by orders of Magnitude oneither side of the used value of 26 usee. Changing S froa2.43 to 2.5 neutrons/fission did not aake any appreciablechange either In r or "€.
Reference
1. Hansen, O.E., Nuclear Science and Engineering, 8,709, (1960),
1.5 Analysis of CRAC Series of Kinetic Experlaonts onE"nriched branyl Nitrate Solution Systems - Some Results
<S. Das)
In an earlier analysis of the kinetic experimentsreported by Lecorche and Seale /1/t an equation to describethe dynamics of radiolytlc gas bubbles in squeous solutionswas developed and the total void fraction aa a function oftlae was computed therefrom /2/« Further analysis estabiahadthat:
(1) the primary feedback mechanism governing the firstpower spike is determined essentially by the radlolyiic gasvoid coefficient reactivity and that the reactivity gaindue to solution addition and the release of radlolytic gasgives rise to the second peak.
Oscillations in reactivity and power, occurring inphase and lasting typically for a few minutes, are due toappearance and disappearance of gas bubbles and not due tosource variation effect (see re/. /2/, pp.13?). The anti-reactivity brought about by tha rise in solution teaperature

- 8 -
compensates the total reactivity introduced and the powerreaches an equilibrium value which la in kilowatts regionin the absence of solution boiling and higher where solu-tion boils. Long term oscillations appearing after thisphase AV due to beat exchanges. Boiling leads to evapora-tion and a decrease in volume and is stopped when a newminimum critical volume <\T „ ) at the new concentrationla reached. c new
(11) Total yield (Yf) in number of fissions when plottedagainat duration of experiment is found to be about 5 timeshigher In the experiments with 800 mm tank than with the300 am tank. This is due to the larger quantity of fissilesolution used in the former. It waa found that
¥f £ a eonatant for a tank of given diameter
where Vf s total volume Introduced in cm3
Ak s total potential reactivity introduced. A
major portion of energy releaae occurred during the oscil-lations, the fraction varying mostly from w80% to 100%. Inmajority of the experiments, energy in the pulse contributedtow 10% of the total yield in the experiment; only iu 12experiments this fraction exceeded 12% becoming as much as60% of the total In a couple of them.
(iii) In enriched homogeneous solution system, the maxi-mum number of fissions for a tank of given diameter isequal to the energy necessary for raising the total solutionvolume to its boiling point and then evaporating the frac-tion of the volume till V Q C H is reached.
(lv) For a 300 mm tank, the minimum instantaneous reactorperiod extended from a little less than a millisecond to afew seconds and the peak power varied from<v9 x 1015 fis-sions per second to 3 x 10¹⁹ fissions per second, i.e.,from <v> 300 kW to 3000 HW.
References
1. Lecorche, P. and Seale, R.L., Oak Ridge CriticalityData Centre, Report T-CDC-12 (1973).
2. Das, S., Ph.D. Thesis, University of Bombay (1980).
Systems.tics of Variation of Reflector Savings withTfeflector Thickness for Small Reactor Assemblies
(Anil Kumar, M. Srinivasan and K. Subba Rao)
Studies of the systematics of variation of reflector

savings S with reflector thickness T In small high leakagesystems have lead to the following simple relation:
where 6 represents reflector savings corresponding to aninfinitely thick reflector of density fr (ke/n3). JJ. freferred to as characteristic reflector penetration thick-ness parameter and is expressed in Kg/m2. Fin.r.e.i Anowa a
seailog plot of {,\-6(J )/$*>) r»-reflector thickness. It is seenthat most of the reflectorsexhibit an almost exponentialbehaviour for C1 -6*CT)/<s»), withwater giving an excellent straightline on a semilog plot.
In order to incorporatevariable reflector thickness(I4.Deffects In Trombay CritlcalltyFormula, the above relation wasrecasted In terms of y and y°°asfollows:
orFlq. 1.6.1: Variation of
(i-<S<T)/(5»)With reflec-tor thickness T.
where y, referred to as degreeof reflection parameter, Isdefined as the ratio (R£/R£) ofcritical radius Kg of the reflec-
ted core to that of the corresponding bare critical coreRb. 3"» i« the saturation value of y for infinite reflec-tor thickness. Table?• 6.r «ivea y«» and /J. values for a number
Table 1.6.I: Reflector savings data
Reflector
H20
BeGraphite
AlFe
j(Kg/m )
1000
1:00
1850
1600
2700
7900
y00
0.78
0.65
0.60
0.70
0.85
0.78
**• a<Kg/mz)
19
85127143
130
346
(cm)1.9
7.76.98.94.8
4.4
23 5of reflectors surrounding 93.5% 0 enriched fast uranium

- 10 -
core. Table 1.6.I also gives the reflector thicknessTfc ( > M r ) which gives Ci-1/e)th value (63%) of infinitereflector savings. Critical surface mass density <*c <?>of an assembly having reflector thickness T can now becalculated using
where y is given by Eq. 2.
This formulation has enabled generalisation ofTrombay Critlcality Formula in order to calculate critical•ass (through critical surface mass density o*c (T) andof non-spherical systems having variable reflector thick-nesses, given the reflector savings data for the infinitelythick reflected systems.
1.7 Development of Neutron Transport Theory Codes DsingFinite Element technique
(0.V. Acharya)
The conventional approach of spatial finite differencesolution for the group diffusion equations may turn out tobe a practical impossibility in situations like treatmentof a lump of burnable poison. On the other hand, thetreatment of large heterogeneous reactors by finite diffe-rence method is quite tractable but highly time-consuming.One of the successful methods to treat particularly thelatter class of problems is the finite element method. Inthis context, a computer program FEMRS is being developed.This program makes an eigen-value search for the effectivemultiplication factor keff in spherical geometry and alsocalculates the value of the nodal fluxes in the r —jx meshesof the even parity flux u(r, u).
As the computer code written earlier resulted Inmemory overflow, a novel method is adopted to calculate theelements of the coefficient matrix, AKb, where the valuesof H and N designate the matrix row iy while K and L denoteits column J, i.e. I * 4(M-1)+N, J « 4(K-1)+L. Generalexpressions were written for the matrix elements which wereintroduced as subroutines. Further, as the Gauss-Jordanmethod gave some difficulty, a separate subroutine usingGauss elimination technique is incorporated for the inversionof the coefficient matrix A.
A Japanese computer code, FEMRE, which is moreversatile is also being adapted to the BESM-6 computer.This code uses a finite element technique for the spatial

- 11 -
variables of raultigroup neutron transport equation in thetwo dimensional cylindrical (r,z) geometry and adopts the S ntechnique for the treatment of angular variable,
1.8 Neutron Pulse Propagation in a Fissile Mediua andMultiplication Aspects" of Micro-Fission Systems "
(K. Subba Rao, Tejen K. Basu and M. Srlnivasan)
To study neutron pulse propagation in spherical fis-sile media, a time-dependent neutron transport theory code/^/ has been used. In these calculations it was observedthat though arbitrary choice of Ax and At gave almostthe same equilibrium value tor the prompt neutron decay con-stant eC , there was a considerable difference in the absentneutron multiplication. A number of systems were therefor*studied and on the basis of the results it is found thatto get the correct neutron population as a function of time,the following criteria have to be satisfied:
(a) A x should be of the order of 1/3 of mean-free path,(b) the time interval At should be chosen such that the
incident neutron travels at most one Ax in At.(c) The ratio of the neighbouring mesh sizes should not
be more than a factor of three. This type of problemarises if a thin zone Is sandwiched between two thickregions.
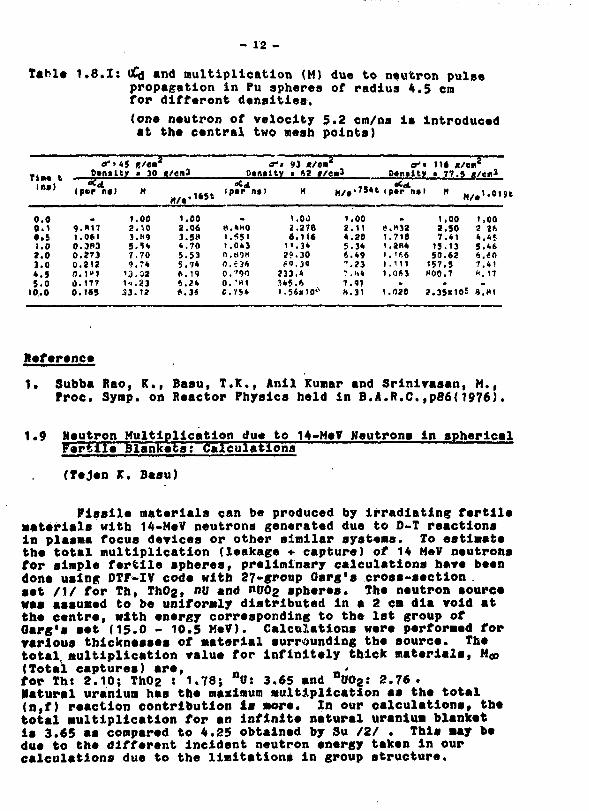
Xf a pulse of neutron is deposited at the centreof a medium, it takes finite time to reach the boundary andif the medium consists of fissile material, the oC^, value(saturated 0C4, value using dynamic code) reaches oC» value(oC value using static code) after the flux has attainedequilibrium. As the neutron pulse propagates outwards inthe medium, the oCa. is very high initially, becauae it"»eea" an infinite medium and sufficient multiplication isattained before the equilibrium is established. The neutronmultiplication aspects of a central pulse have been studiedfor a plutonium sphere of radius 4.5 cm for differentdensities. Table 1.8.1 summarises the results. Thevalues of M/(exp ot dot) is the extra multiplication obtaineddue to the introduction of a high energy neutron source atthe centre. In the three cases studied, this value wasfound to vary from 6.4 to 8.8. If the incident pulse isvery strong, this additional multiplication plays an impor-tant role in the dynamics of micro-fission systems.
- 12 -
Table 1.8.1: oCg end multiplication (M) due to neutron pulsepropagation in Pu spheres of radius 4.5 cmfor different densities.
(one neutron of velocity 5.2 cm/ns is Introducedat the central two mesh points)
in*)
0.00.1• .51.02.03.0*.55.010.0
'45Dcnitty
(per ng)
9.1.0.0.0.0.0.0.
m
m 70613M273212
177165
,2357t'31«*33
• 30
H
.00
.10
.H9* 54.70.?».02.23.12
ift/em)
rt/i23455A
*
,.1*51
.00
.06
.5H
.70
.53
.94
.19
.24
.36
Dtn»
ip»r n*l
H.t.i.
o.0.0.0.0.
4H0551043BOM£3*V'00•HI754
<r* 91 */ea*
i26112?f. 0
233345
62 r/en
M |
.00
.276
.116
.34
.30
. 39,4• A
3
)/l
124
•*77ft
,.734t
.00
.11 t
.20
.34
.23
.H 4
.9?
.31 1
a'i 11
Daniity •
.718
.2R4
. i<>6
.111
.1)63•
.020
• 1
127'550157»00
• x/e77.5
H
.00
.50
.41
.13
.62
.5
.7
2.35x10⁵
B2
f/
'»
\24<i47ft
1.01
,00
.4*
.46
.to
.41
. 17
.HI
Heference
1. Subba Rao, K., Basil, T.K., Anil Kumar and Srinivasan, M.,Proc. Synp. on Reactor Physics held in B.A.R.C.tp86(1976).
1.9 Neutron Multiplication due to H-MeV Neutrons in sphericalFertile blankets: Calculaiiona
(Tejen K. Basu)
Fissile materials can be produced by irradiating fertileMaterials with 14-MeV neutrons generated due to D-T reactionsIn plasma focus devices or other similar systems. To estimatethe total multiplication (leakage + capture) of 14 MeV neutronsfor simple fertile spheres, preliminary calculations have beendone using DTF-IV code with 27-group Oarg's cross-section .set /I/ for Th, ThO2, Wl and npog spheres. The neutron sourcewas assumed to be uniformly distributed in a 2 cm dia void atthe centre, with energy corresponding to the 1st group ofOarg's set (15.0 - 10.5 MeV). Calculations were performed forvarious thicknesses of material surrounding the source. Thetotal, multiplication value for infinitely thick materials, H(Total captures) are, _ <for Th: 2.10; ThO2 : 1.78; n0: 3.65 and n0O2: 2.76.Natural uranium has the maximum multiplication as the total(n,f) reaction contribution la more. In our calculations, thetotal multiplication for an infinite natural uranium blanketis 3.65 as compared to 4.25 obtained by Su /2/ . This may bedue to the different Incident neutron energy taken in ourcalculations due to the limitations in group structure.
- 13 -
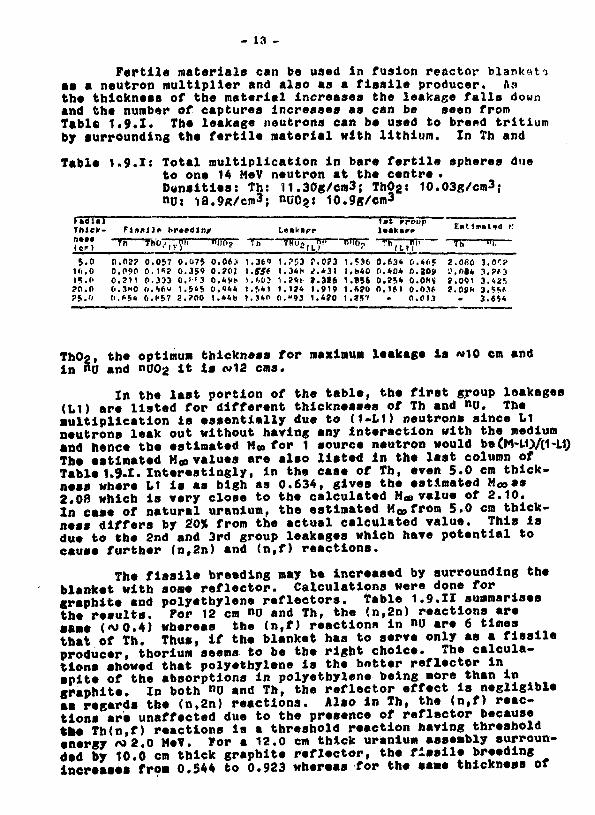
Fertile materials can be used in fusion reactor blanketJas a neutron multiplier and also as a fissile producer. Asthe thickness of the material Increases the leakage falls downand the number of captures Increases as can be seen fromTable 1.9.1. The leakage neutrons can be used to brend tritiumby surrounding the fertile material with lithium. In Th and
Table 1.9.1: Total multiplication in bare fertile spheres dueto one 14 MeV neutron at the centre .Densities: Th: 11.30g/cm3; Th<>2: I0.03g/cm3;
3 10.9g/cm3
FmllalThick-
(en5.0
Ki.OH.fl?0,0?S.'<
000( l
( I
Ftaxllv brtedln/
TV T
.02? 0.090 0• ?' t 0• .1H0 0
>s* o
.057
.333
. SAW.H57
• \
0001
.07>
. " 3• &4fi.700
'
0000\
no?
.Of 3• ?0J*4Vt>• Q44, * * b
111t1
In
.36"
.SSf
.(,(13
. f>4 1
Laakapr
11110
?53 r.34«< ^ .
1 2 4 1 »
"93 1 .
!•
C?34313(69194?0
n-10,1
1.536l .h«O.856. ft?O.?S7
Itakarr
0f>00
.634
.40*
.2S*• If 1
0 .0 .0 .0 .0 .
p
«6«.iOS>OHV0.1*01.1
2
Entlnmtod K
Vh
.Cfifi,0(4.091.09ft-
3333
" I .
.0'?,7i'S.42S. ^ • i ^. *54
ThOo, the optimum thickness for maximum leakage is «»10 cm andin "0 and nuog it is <«12 cms.
In the last portion of the table, the first group leakages(LI) are listed for different thicknesses of Th and nu. TheMultiplication is essentially due to (1-L1) neutrons since L1neutrons leak out without having any interaction with the mediumand hence the estimated M» for 1 source neutron would be (M-U)/(1-LI)The estimated Moo values are also listed in the last column ofTable 1.9.1. Interestingly, in the case of Th, even 5.0 cm thick-ness where L1 is as high as 0.634, gives the estimated Moo as2.08 which is very close to the calculated Moo value ot 2.10.In ease of natural uranium, the estimated Mwfrom 5.0 era thick-ness differs by 20% from the actual calculated value. This isdue to the 2nd and 3rd group leakages which have potential tocause further (n,2n) and (n,f) reactions.
The fissile breeding may be increased by surrounding theblanket with some reflector. Calculations were done forgraphite and polyethylene reflectors. Table 1.9.II summarisesthe results. Por 12 cm >*U and Th, the (n,2n) reactions aresame (M0.4) whereas the (n,f) reaction* in nu are 6 timesthat of Th. Thus, if the blanket has to serve only as a fissileproducer, thorium seems to be the right choice. The calcula-tions showed that polyethylene is the hotter reflector inspite of the absorptions in polyethylene being more than ingraphite. In both n0 and Th, the reflector effect is negligible•• regards the (n,2n) reactions. Also in Th, the (n,f) reac-tions are unaffected due to the presence of reflector becausethe Th(n.f) reactions is a threshold reaction having thresholdenergy *»2.0 MeV. ror a 12.0 cm thick uranium assembly surroun-ded by 10.0 cm thick graphite reflector, the fissile breedingincreases from 0.544 to 0.923 whereas for the same thickness of

polyethyl«n« reflector it becomes 1.301. The presence ofpolyethylene substantially increases the fission rate innatural uranium, particularly in 235a and hence the capturesin uranium is more in the presence of CH2 reflector. In case of12.0 cm thick thorium, a 10.0 cm thick CHg reflector Increasesthe fissile breeding from 0.135 to 0.490.
To Terify the calculated results, an experimentalassembly has been made in which the leakage neutrons fromvarious fusion reactor blanket models will be measured.
Table 1.9.
BlanketHate-rial
UUUUUD0TbThThThThTh
.11:
Thick-ness(CM)
12.12.12.12.12.12.12.12.12.12.12.
25.25.
References
0000
000
0000
00
Reaction rates ingraphite
fertilepolyethylene i
neutron Introduced
ReflectorMate- Thick-rial
_CccCH2CH2CH2
CH2CH2CH2„
CH2
ness(cm)_5.010.020.0
5.010.020.0
5.010.020.0
20.0
at the
spheres in the presencereflector per 14-MeVcentre*
Reaction ratesblanket
Tn, 2n)
0000,
0,0,0,
0.0.0.0.
0.0,
.414
.418
.419
.420
.418
.421
.421
,474.478,480,480
,637650
(n,f)
0.6110.6340.6450.683
0.7780.9060,935
0.1020.1030.1040.104
0.1480.152
0001111
0000
01
in
(n,-n
.544
.749
.923
.166
.116
.301
.338
.135
.394
.490
.511
.654
.139
Cap-turesinreflec-tor_
0.0120.0210.037
0.1800.8551.762„
0.0970.4140.895
_0.740
Leakage
2221
110
110010
.440
.268
.104
.904
.943
.279
.379
.598
.249
.839
.337
.340
.340
1. Oarg, S.B., BARC - 892 (1976).
2. Su, S.F., "A Fusion - Fission Hybrid Reactor for Produ-cing Uranium - 233", Ph.D. thesis, Univ. of Washington(1975).
1.10 Multllayerad Blanket Concept for Tritium BreedingAssemblies
(V.R. Nargundkar and O.P. Joneja)
Composite low Inventory lithium blankets are gainingimportance due to the fact that the total lithium inventoryrequired Is quite small for adequate breading. Also, due tothe localization of the breeding zone, extraction of the tritium

- 15 -
produced would be simpler. We have studied a compositeblanket consisting of a block of neutron multiplier followedby several alternate layers of moderating and breeding mate-rial . The concept exploits the slowing down properties ofthe moderating medium and allows preferential capture of slowedneutrons in the breeding zone. The calculations are performedon a simple onion skin model in spherical geometry, shown inFig. 1.10.1, using 30 group Los ^lamos cross section library.MORSE-E code is employed and the results are presented as average
Neutron source position - SNeutron Multiplier - 1
Moderating Material -2,4,6Breeding zones—3,5,7
Fig. 1.10.1: A typical multilayered composite tritiumbreeding blanket
values for 1000 histories.
Table 1.10.1 presents results obtained for a systemcomprising blocks of lead, natural lithium and graphite having
Table 1.10.1: Tritium production for different sphericalassemblies
CaseMo.
Zone thickness in cm Tritium production or leakage perincident neutron
Neutron NaturalMulti- Lithiumpller(Lead)
Moderator(Graphite)
Leakage
123456
-
-1010
5010203010
5+5
-40302030
10+10+10
0.100.070.160.240.390.68
000000
64.15.31.45.09.04
0.740.220.470.690.480.72
0.920.690.680.680.910.63
a point source at the centra. It ia quite- clear from the case1 and 4 that even in the block concept, coupling of the modera-tor cum reflector with the natural lithium block, results insaving a significant amount of lithium inventory. Also, replace-
- 18 -
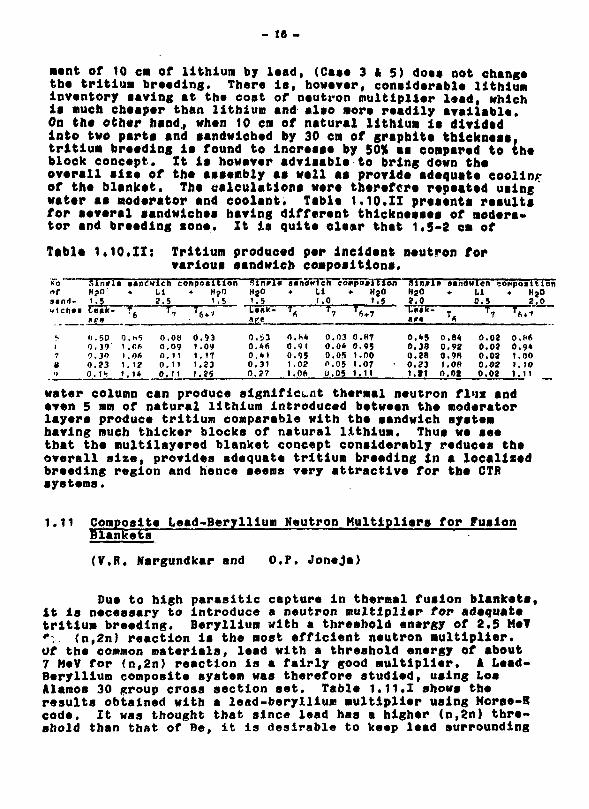
••nt of 10 ci of lithium by lead, (Case 3 & 5) dots not changethe trltiua breading. There is, however, conaiderable lithiuminventory saving at the cost of neutron multiplier lead, whichis much cheaper than lithium and also more readily available.On the other hand,, when 10 em of natural lithium is dividedInto two parts and sandwiched by 30 cm of graphite thickness,trltiua breeding is found to increase by 50% as compared to theblock concept. It is however advisable to bring down theoverall size of the assembly as well »a provide adequate eoolln?of the blanket. The calculations were thtrefcre repeated usingwater as moderator and coolant. Table 1.10.11 presents resultsfor several sandwiches having different thicknesses of nodera-tor and breeding sone. It is quite clear that 1.5-2 cm of
Table 1.10.II: Tritium produced per incident neutron forvarious sandwich compositions.
KO
ntsanrl-
wtehaa
fc
i7
8•>
RinrlsH1
c„0000
.5
.SO
.39'
.30
.23
. 1>!
Q1111
sandwich composition*
V.MS
.c*• 06. 12. I*
LI2.5T_
0.080.09n. 110.11O.ti
*
01111
'.56*1
.93
.09
. 17
.23
.25
inrl.HjO1.5L'SIIK-
00.00.0.
.S3
,41,31,27
' asndKien•
0,0,0,i.
i.
i
,h*,91,950206
Li1.0T
000l>0
composition•
7
.03
.04
.05
.05
.05
*
1
0011
y
HS01.5
«+7
.«7
.95
.00
.07
.11
hlnjrlH202.0Td»k-
00001
.*5
.38
.20
.23
.at
It
0001
n
ssndwlen eomposttlon*
.84
.92• 98.09.Ot
LI0.
00000
5T?
.02
.02
.02
.02
.02
(
0.0,1,1,1.
HjO2.0
1.1
,86,9*,00to11
water column can produce significant thermal neutron fl'iz andeven 5 mm of natural lithium Introduced between the moderatorlayers produce tritium comparable with the sandwich systemhaving much thicker blocks of natural lithium. Thus we seethat the multilayered blanket concept considerably reduces theoverall size, provides adequate tritium breeding in a localisedbreeding region and hence seems very attractive for the CTRsystems.
1.11 Composite Lead-Beryllium Neutron Multipliers for FusionBlankets'
(V.R. Nargundkar and O.F. Joneja)
Due to high parasitic capture in thermal fusion blankets,it is necessary to introduce a neutron multiplier tor adequatetritium breeding. Beryllium with a threshold energy of 2.5 Me?':. (n,2n) reaction is the most efficient neutron multiplier,of the common materials, lead with a threshold energy of about7 MeV for (n,2n) reaction is a fairly good multiplier, k Lead-Beryllium composite system was therefore studied, using LosAlamos 30 group cross section set. Table 1.11.1 shows theresults obtained with a lead-beryllium multiplier using Morse-Bcode. It was thought that since lead has a higher (n,2n) thre-shold than that of Be, it is desirable to keep lead surrounding

- 17 -
the jource followed by Be. However, the results show thatdespite Beryllium producing an effective Multiplication of1.1, the composite blanket has the same multiplication as that
Table 1.11.1 ; Spherical geometry (Lead-Beryllium system)
Lead Be H.. Total M(CM) (c»J HI!20 - - 1.6920 10 1.10 1.69
of lead alone. This is due to the fact that Be acts as a goodreflector of thermal neutrons which are absorbed in lead andtherefore effectively neutralises the beryllium Multiplication.
Table 1.11.II shows the results obtained with <a beryl-lium-lead composite multiplier. It can be seen that fairlygood neutron multiplication can be obtained by using just 4 to
Table 1.11.II: Spherical geometry (Beryllium-Lead system)
"Be "H^ Eiad" Total M "
1.611.691.721.391.78
466
12
1.251.251.381.521.70
8121220-
8 cm thick beryllium layer and 8 to 12 cm of lead thus reducingthe cost of Multipliers considerably.
1,12 Absolute Neutron Yield Determination Using AssociatedoC-particle Method
(O.F. Joneja, D.V.S. Ramakrishna and S.K. Sadavarte)
In order to determine absolute yield of a neutron genera-tor, on-line monitoring of oC-particles is used. In this methodone measures the rate of production of < -particles by a suitabledetector and the neutron yield Is then given by:
D ... O)
Where C«c * oC-particles detected per secondbit. s solid angle subtended by the detectorRjt, s Anisotropy factor
Computer codes ANIZO and GEOM are developed to find the aniso-tropy factor as well as the solid angle subtended by the detec-

tor. ANIZO finds It* for various Incident neutron erergieaand angles for a <:iven beam composition. Results obtained arepresented in table 1.12.1.
Table 1.12.1: Anlsotropy factor for various deutron energiesand detector angles
oet. angle neutron(Degrees) Energy (keV)
(D+ . 85*)
<D* m 6.3X)
(DJ - 6.7*)
100100100180180180(40140140160160160
110120138110180130110180130110180 1
130 1
1.0321.037(.0361.0911.0991.100 11.143 11.153 11.155 11.178 11.189 11.193 1
1.0381.0371.0361.0901.0981.0961.1411.1511.153.176.187.190
QBOM is based en Monte-Carle tracking of histories.Large number of neutrons are selected by random numbers in awell defined solid angle, which it larger than that subtendedby the oC-detector. The fraction Intercepted by the detectorarea is then determined. The program also takes Into accountthe definite spread of the neutron source in determining the•olid angle.
1.13 Neutron fhysics Studies for Oil Well Logging Applications
(D.V.S. Itamakrlahna, S.JC. Sadavarte and M.r. Havalkar*)
A bore hole model jlmulating the conditions of a sand-atoneformation in the earth*s sub-surface was fabricated to carry outthe feasibility studies for the application of pulsed neutrontechniques to oil well logging. Experiments were conductedusing this model to develop carbon-oxygen ratio method fordistinguishing between oil and water regions in the formation*,details of which were reported earlier /I/. Theoretical calcula-tions to Interpret the experimental results for field appllea-
• Now Head, Training Division, BARC.

- 10 -
tion are in progress.
The detection rate of gamma rays resulting from theinelastic scattering of 14-MeV neutrons by carbon and oxygennuclei present in the medium were evaluated assuming a singleInteraction source - detector transfer equation which is givenby,
* tin . ^
/9m0 rf.O
were I Is the total gamma flux at a detector kept at a distanced.
XQ is the source strength.n is the atom density whose differential inelastic crossw section is doVdJl.
of, Q are the emission angle of the neutron from the source andthe Incoming angle of photon to the detector respectively.
p.. Is the total neutron absorption coefficient for 14-MeVneutrons, and
yUg Is the total gamma absorption coefficient for the gamma/ energy produced during inelastic scattering (4.44 MeV
for carbon and 6.13 MeV for oxygen).
Calculations were done for an infinite medium assuming• point isotroplc 14-MEV neutron source, for the source-detector distances of 10,20,40 and 80 cms and for various poro-sities ranging from 0 to 40%. For a neutron source of aboutlO^n/sec, the estimated gamma counting rate was about 500 counts/sec at d s 40 cm which is sufficient for reasonable countingstatistics. The effect of porosity ($) and oil and waterssturations <SO,SH) on neutron and gamma absorption coefficientsfor the sandstone matrix were studied. It is found that theneutron absorption coefficients vary only by 10% while thegamma coefficients tend to change to the extent of 25% for theextreme cases of 0 < $ < 40% and 0<S w<100%. This indicatesthat the effective use of the logging tool based on countingthe inelastic gammas for the estimation of oil saturationrequires an accurate knowledge of the poresity of the oil-bearingformation.
Reference
1. Ramakriahna, D.V.S. et al., Neutron Physics DivisionReport for the year 1980, p23, BARC-1134 (1961).
- 20 -
1.14 Optimum Moderator Thickness For Maximum Charged ParticleConversion Efficiency For the Detection of D-D FusionNeutrons
(P.K. Job and N. Srinivasan)
Solid state nuclear track detectors (SSTD) are often usedfor the detection of fualon neutrons in low yield plasma experi-ments by means of the charged particle produced in a suitableconverter reaction such as 10B (n,oC), 235u(n,f) and 233(Hn,f)reactions. The 10B, 2 3 5 U ©*• 2 3 3 U is deposited as a thin coatingon a backing material such *m a thin aluminium plate. The thick-ness of coating should be small enough such that the (C-particlesor fission fragments can escape and enter the SSTD to producetrack*,
In order to improve the overall neutron detection effi-ciency, the neutrons should first be slowed down since the crosssections for these reactions are higher at thermal energies.Alternate layers of suitable thickness of a neutron moderatorsuch as water or perspex or paraffin and boron/uranium coatedplates form the detector pack. The fraction of neutrons absor-bed in 10p/235u per incident source neutron was taken as themeasure of the efficiency of the detection system. Over-modera-tion will lead to wasteful neutron absorption in hydrogen whileunder-moderation will reduce interactions with boron/uranium.Optimisation calculations were therefore carried out for themoderator thickness to maximise the detection efficiency. Onedimensional transport theory calculations were done usingDTFIV code and 26-group ABBM cross section set in infinite slabgeometry with a 2.5 MeV plane source (lsotropic emission) atone end. .Calculations were carried out as a function of latticepitch with 10B/235U coated plates and water moderator forminga lattice cell.
Table 1.14.1 summarises the results. A 5 cm thicknessof water between 10B coated plates (0.5 am each) gave maximumabsorption in boron. The total absorption probability in thiscase was 47% with a pack of five boron plates. Out of this,40% was absorbed in the first two plates. Absorption in Z35ufor the same geometry and coating thickness was twenty timeslower than that of 10B since the thermal absorption crosssection of 235U is eight times lesser. With a pack of ten235u plates having 1 cm thick layers of water in between, anabsorption of only " 4 % could be achieved.

Table 1.14.1: Results of optimum moderator thickness calcula-tions.
Convertermaterial
Tootplataauaad
Coatingdonalty(mg/en2)
TnUlal•odara-torthlek-naaa(em)
"Catnei"pitchthlek-naaa
(en)
Total—thlck-n*aa• r thopacktea)
Aba parincidentiwutronIn B/U
«Ba pap totalntutron*•baorbad Inpack In B/U
10B1 08'°»'°B'°B10»1 O i" » U*«„835U
44
44
4
*
4
4
4
*
*
IP
10
10
10
to
1
1
1
0.4
0.4
1
1
1
1
10
553
553
5
3
553
5
53i
3
353
5
3
$331
25.220.214.2
12.2
14.220,212.220.2
12.2
20.214.2
12.2
14.S
0.4570.66SO.ttt0.633
0.4420.4720.4620.004
0.004
0.0100.010
0.0110.030
0.4760.7910.7690.87S
0.S870.53!0.6880.0048
0.0086
0.01?0.0200.0210.042
1.15 g y of SSTD for the Detection of Keutrons from Low YieldFlasma Experiments
(D.V.S. Rasnakrishna)
In plasma focus and other low yield pulsed dischargeexperiments the measurement of neutron yield is rendered difficultdue to the presence of large electromagnetic disturbances. Va9of Solid State Track Detectors (SSTD) after converting the neu-trons into charged particles by means of 10B or 233n coatedconverter plates was therefore Investigated. Preliminary measured-ments Here first carried out to find a suitable track detectorfor use in the SSTD packs. The expected track densities regis-tered in the detectors for such applications are considerably lowand it is therefore important to choose a detector which hasbetter sensitivity to register an event and which gives rela-tively low background. Polycarbonate and cellulose nitratefilms were investigated to study the alpha and fission fragmentregistration in the film using boron converter or 2 3 3o electro-plated sources. The etchants and etching conditions were opti-mised for CN-80 and Makrofol films, which were found to be suita-ble for the purpose.
The cellulose nitrate film CN-80 has shown better sensi-tivity for oC -registration. The tracks appear distinctly as

- 22 -
clear circular holes which could be easily distinguishedagainst background. CN films are etched In 2.5 N NaOH solu-tion at 40oc for a period of 1j hrs and the tracks were observedwith a microscope having magnification of around 600. ForMakrofol film of 200 u (polycarbonate film), a mixture ofKOH and Alcohol (KOH-30 gm, CoHgOH -100 cc and H20-100 cc) at70©C was found to be a suitable etchant and the optimum etchingtime was 8 rats. Thin (10 ju'> Makrofol film which is good forspark counting, requires less concentrated solution (6M NaOH•t 60°C) but the etching time Is 30 mtg.
1.16 Scaling of Plasma Focus Properties With Capacitor BankCurrent
(Anurag Shyam)
The scaling of various characteristics such as plasmatemperature, size and density of focus , neutron and ion emis-sions etc of the Trombay Plasma Focus-I device /I/, was studiedas a function of operating parameters of the capacitor BankHEXA /2/. Plasma temperature was estimated by determining thespectrum of soft X-rays emitted from the focus. While the sizeand density of the focus were deduced from the intensity oflight emission in the visible region, the neutron yield wasmeasured using a silver activation counter and the acceleratedion current by a biased ion collector. Since the behaviour ofplasma focus devices is still not very well known at low bankcurrents (I), the experiments were conducted with low chargingvoltages (7 to 16 KV) resulting in low I )(100 to 230 KA) and lowdl/dt (0.15 to 0.35 x 1 0 ^ A/JI) .
Our results were compared with the data reported fromother laboratories experimenting with higher I and dl/dt plasmafocus devices. It was found that the plasma temperature, six*,the charged particle energy, beam intensity and neutron yieldscale with the bank current as 10.35, 10.75, 10.75, I1«5 and14.3 respectively. On the other hand, the plasma density lacorrelated to dl/dt and scales as (dI/dt)0.85.
References
1. Anurag Shyam et al., Neutron Physics Division Report forthe year 1980, p.17, BARC-1134 (1981).
2. Anurag Shyam et al., Neutron Physics Division Report forthe year 1979, p.19, BARC-1076 (1980).

- 23 -
1.17 Use of an Electric Oun for Compression of Deuteriumpas "in Conical Targets — —
(P.K. Pal, M. Srinivasan and Anurag Shy am)
Compression of deuterium gas by a high speed Jiner ina conical cavity embedded in lead, haa been reported to y.iol<tfusion neutrons by a number of laboratories /1-5/ . This isan elegant experimental approach to simulate spherical implo-alon of inertial pellet fusion targets. The various driversused in the reported experiments are: Relativistic ElectronBeam (REB) /I/, Lasers /2,3/ and explosively acceleratedliners /4>,5/. Our interest in conical targets stems from th«possibility of using the 20KJ Capacitor bank of PurniroaLaboratories as an "electric gun" to produce high speed polye-thylene projectiles which can then be used for such "impactfusion" experiments. Projectile velocities in the 5-10 km/arange appear possible /6/.
In all the experiments reported, the target comprisesof a small conical cavity, 0.2 to 2.S mm deep, filled with Dg(or D-T) gas at 0.1 to 0.5 atmospheric pressure, embedded onthe surface of a lead (or gold) anvil and covered with aspherical or plane polyethylene cap, 5 to 100 micron thick.The cap, which serves as the piston during compression, isaccelerated to velocities of 0.5 to 5 x 106 cm/s by the actionof the Incident driver beam or flying plate.
The processes that lead to compression and heating ofthe fusile fuel are the following:(a) Initial shock heating: the piston sends in a strong shockwave in front of it. By virtue of energy dissipation at theshock front, the gas Is heated up. In deuterium gas, for aplane incident shock wave the temperature rise (Ts) in eV isgiven by
Ts <yi 0.35 Vg (1a)
where v$ is the velocity of piston in cm/ fxs. Here it has beenassumed that the gas is completely ionised, which may not betrue at velocities close to vg = 1. In that case the tempera-ture of the gas will be double of what is given in Eq. (la).
Additional heating takes place because of reflectedshock waves (first reflected shock wave multiplies the tempera-ture by a factor of 2.4) and also because of convergence (Thishas very minor effect on the average temperature of the gas).Hence the temperature rise because of shock-heatin/? can ingeneral be written as,
T <•. H V* (1b)S 6

- 24 -
where A is of the order of unity.
(b) Compressive heating: After the shock heated plasma assumesa uniform pressure and density profile, further heating takesplace by the PdV work done on the plasma by the piston. If ToIs the shock-heated temperature and y> la the volumetric compres-sion to which the plasma is subjected following the shock-beatingstage, then the final temperature T, in absence of any lossmechanism is given by,
T . To %2'3 *. (2)
In the presence of 6remsstraMung and conduction lossesit is the heating rate, rather than the compression, that deter-mines the terminal condition of the plasma. The compressiveheating rat* increases as the radius decreases, as seen fromBq. (3),
(3)
where v is the piston velocity.
Assuming Initial shock-heating only by the incident shockwave followed by compressive heating in presence of onlyftremsatraMung loss, an expression for the maximum attainabletemperature in eV has been obtained in terms of piston velocityVp (cm/a), initial filling pressure of gas n0 (per cm3), andcone depth ro (cm),
The different confinement times have been estimatedand compared at different temperatures and density regimes(Table 1.17.1). It shows that inertial confinement time(untampered) is the shortest. Conduction loss is important onlyat high temperature, i.e. towards the final stage of compression.Pressure and neutron yield per ns has also been cited in theTable.
A major- difference of conical compression from sphericalpellet fusion lies in the final stage of compression when thepressure of the hot and dense plasma becomes too high for the leadcone to hold it. Beyond this stage no further compression ispossible and even if the piston is left with some kinetic energy,this will be spent in deforming tha con* material. Assumingthat the terminal condition is a plasma at 30 Mb pressure, thefollowing expression for the neutron yield/ ( y n) has been obtained:

- 26 -
where p is the filling pressure in bar.
As is obvious from Eq. (5), the neutron yield is verysensitive to piston velocity (°C iriO). Also, a decrease ininitial pressure, p, enhances the neutron yield.
The neutron yield and temperature obtained from thesimple model falls short of that reported by experimenters. Wefeel that shock-heating plays a much more Important role In theconical compression experiment ' and only a hydrodynamic codecan resolve this problem.
Table 1.17.1: Confinement Characteristics of fusion plasmaCo»pr»Mlou leap In «Y To(nt) ^L,(«*) %(«*) y / . . - l i «(»)
100
250
500
1000
250Q
100250600
1000
100
250600
1000
100250600
IOOO
loo250600
1030100253600
1000
References1,2,3.4.5.6.
1.
•
>
»
»
18
3.7 x io'375
* i
11.7
5 * 10J
50557
15.86.J x 105
6J771to
a x io J
8099125
1.1 x 10*1.1 x 105
12234
Bogolyubskii etVovchenko et al .
1171S52S7370
4774
113148
21.4375774
U . 718.52937
4.77.411.514.9
a l . , JETP
1.91.20.760.591.40.860.560.4)1.10.690.44
. 0.J40.960.540.350.270.630.400.260.20
lett., JETP l e t t . 26
Mason et a l . , Appl. Phys.Anisimov et a l . ,Kallski etChan et al
a l . ,. , 'Rev
JEa'P LettJ. Techn.
lett.. litPhys.
. Sci-Instrim.
Some Aspects of Modelling a
0.027 x 10s
1.1 x 10C
3.1 > 107
0.C41.7 X 105
2.7 X 10*7 X 107
0.63.5 X 10J
5.5 x 10*1.5 x 10s
0.170.7 x 10*1.1 x 107
J.I r 10*0.42
1.7 x 10*2.7 M 107
7.0 x Vfi
1.026
10
2
.5
.0
.0
.96.2
1525.
512,30.30,
.0
.0
.0
.3
.0
.0
10.025.60.
,0,0
100.029.0C2. .5
150.0250.
. 24.* 182 (1976).», 476 (1977).
34(2), 14 (1!, oT (1980).. 18(4) (1977).
?79)
£[7 1676 (1980).
HIOMA Fusion Reactor
0
.
YS.K.H. Auluck)
The HIGHA fusion reactor concept is intrinsically a steadystate configuration characterised by ion kinetic energies of theorder of a few hundred Kev, Ion Larmor radii large compared to

- 26 -
the scale length of the particle density distribution andselective injection of ions (obtained from a Van-de-Graaffaccelerator) into zero canonical angular momentum orbits in asimple-mirror-type magnetic field. A special feature of thissystem is the lone life time of this configuration after theion injector is turned off (2.2 seconds in early experimentslimited only by vacuum conditions). This suggests that thesystem should be Intrinsically stable at least at the low densi-ties encountered in these experiments. It is then of interestto be able to calculate the time-asymptotic properties of thesystem, i.e. the properties one would observe If the distri-bution reached a steady state after the bean is switched off.It is reasonable to assume that at these low densities (108 cm"3)if a steady state is reached at all, it is reached via colli-sions rather than via collective processes. The usual prescrip-tion of assuming a single parameter canonical distribution func-tion (CDF) in such cases is not applicable to the MIOMA system.The MIGMA orbita are much less random than what a Maxwelliandistribution would suggest. It is necessary to use a two para-meter canonical distribution of the form
In which the Hamiltonian H and the canonical angular momentumf>c enter on an equal footing. The parameter to turns out to
be an angular velocity of rotation. The electrostatic potentialand the magnetic vector potential, which, enter the expressionfor Hamiltonian and the canonical angular momentum must bedetermined from Poisson equations with charge and current densi-ties obtained from this distribution function.
Some conclusions can b« reached /2/ regarding this model-ling scheme without carrying out detailed aumerical calculations.Firstly, the fusion reaction rate would not be determined by theenergy to whleb the ion is initially accelerated. This initialenergy per ion would be divided into a drift kinetic energyassociated with the rotational parameter u> , an electrostaticpotential energy associated with the charge separation becauseof the difference in the masses of electrons and ions and athermal kinetic energy associated with the temperature. Thereaction rate would be determined only by the temperature, sincethe fusion cross section depends only on the relative velocitybetween two nuclei at a given point in space . Secondly, thecyclotron radiation would be enhanced because it would dependnot only on the thermal motion but also (much more) on the rota-tional motion.
The two parameter canonical distribution function for asystem of two species (electrons and ions) can lead to simulta-
neous confinement for both the species provided some condi-tions are met. A nonquantitative argument leading to thisconclusion is available t2t but it need* further elaboration.Briefly, it shows that a pure ion apace charge with a twoparameter canonical distribution function created inside asimple mirror magnetic field with electrostatic and plugs•ust result In an electrostatic potential well for the elec-trons. If the total electron kinetic energy (drift plus thermal)is less than the depth of the electrostatic potential well, theelectron* can be confined in this well. But the presence of•any electrons will partially neutralise the ion space chargeand thus reduce the depth of the potential well. Departurefrom quasineutrality /3/ is thus a necessary condition forsimultaneous confinement of electrons and ions in a two para-meter canonical distribution function*
References
1. S.K.H. Auluck, Paper presented at the Spring Collegeof Fusion Energy at ICTF, Trieste, May 1981.
2. S.K.H. Auluck, Unpublished, 1981.
3. R.C. Davidson, Phys. Fluids Jj)» 1183 (1976).
1.19 Proposed 500 KJ Capacitor Bank Facility for Pulsed• Fusion Studies
(M. Srinivasan, Anurag Shyam, S.K.H,Auluck and P.K.Pal)
A 500 KJ fast capacitor bank facility is proposed to beset up at the Purnima Complex for pulsed fusion studies duringthe next five years as part of an inter-divisional BARC ResearchProgramme on investigation of High Temperature High DensityPlasmas. A 250 nfi laboratory building is to be constructed tohouse the bank and associated facilities. The tentative speci-fications of the bank are summarised in Table 1.19.1. Thevoltage rating of the bank is one of the most important designchoices to be made. While a 20 KV system will render the systemoperationally easy to manage, the overall bank performance willbe more acceptable from the point of view of the envisagedexperimental programme if 40-50 KV capacitors are used. Thefinal decision may also be influenced by other constraints suchas indigenous vs. imported procurement of the energy storagecapacitors, their voltage reversal and shot-life characteris-tics, unit capacitor costs, delivery schedules etc. The designobjective calls for peak short circuit discharge currents oft\i 9 million amperes with rise times of a few micro-seconds. Theoverall bank inductance would.have to be restricted to 10 nH toachieve this performance.
The availability of a versatile and general purposefacility will enable a broad category of fusion and relatedphysical investigations such as: (a) Z (and 9) pinches of various

- 28 -
types: Dense plasma-focus, exploding wires, vacuum sparks andthe recently developed gas puff devices fall in this category,(b) Production of hyper-velocity projectiles and implodingcylindrical liners for compression and heating of fusile tar-gets: Rail guns , electric guns and plasma Impact drivers areexamples of such devices. (c) Generation and study of highmagnetic fields using flux compression techniques* Varioustypes of imploding liners and even a plasma focus device hasbeen used successfully for production of megagauss levelMagnetic fields. The only limitation is perhaps the small(a few mm3) volume over which the high fields are produced,(d) Study of compact toroids and other field reversed confi-gurations; for which Marshall type coaxial plasma guns have beenused effectively, (e) Generation and use of ion beams forfusion related research; Various ingeneous techniques ofproducing powerful bursts of Ion beams for use as ZCF drivershave been investigated. Groups at Poland and the Universityof Maryland in USA have recently investigated theae. A set upusing multiple plasma focus guns is also under Investigation,(f) Application of fusion neutrdn bursts for neotron radio-graphy and fiaslle fuel breeding related studies, (g) Radiationstudies using the intense X-ray pulses generated in some ofthese high density plasma configurations, (h) Spectroscopicstudies of X-ray emissions from highly ionized high Z plasmasand Investigation of transient atomic processes, (1) Shock tubesand their research applications, (J) High pressure physics,equation of state (EOS) and shock wave related studies. AtLivermore for example an exploding foil accelerated highvelocity <A>20 Km/sec) projectile produced by an electric gunhas been used very effectively for ultra high pressure shockwavs studies.
Each of these topics would in itself constitute a fulltime research programme for a small group of physicists. It isenvissged that the study of Dense Plasma Focus and other typesof Z-pinchea initiated with the help of the present 20KJ capacitorbank facility of Pucnima Laboratories would be continued. Othertopics in the list would subsequently be identified for detailedinvestigations.

Table 1.19.1: Specifications of capacitor bank
s.No.
Item Singlecapa-citor
ModuleUnit
OverallBank
1 Capacitors/unit
2 laergy3 Voltage Rating4 Capacity5 Seriei Inductance6 Charging tine7 Peak discharge eurrent
(ahort circuit)8 dl/dt9 Bate area10 Voltage reversal11 Shot life12 Casing strength18 Type of inter-connection
14 Soark gap type
15 Switching system
1
5 KJ50 KV4 uF200 nH
90 KA
—
•80%10525 KJ
•
•
4(squarearray)
20 KJ50 KV16 uF100 nH
360 KA
1.5»1.5H280%10*»SandwichtypeTrans*missionline
100
500 KJ50 KV
400 uF10 nH60 sec
«9 MA
5x10¹²A/sec•
80%105m
1«cables/module fee*ding sandwichline collec-tor plate
Three elec°trode pres-surised air
100 KV,100 n*pulse

2. CRYSTALLOGRAPHY
2.1 Structural Study of
(Sandhya Bhakay-Tarahane, A. Sequeira and R. Chidambaram)
A combined X-ray and neutron study of the title com-pound at room temperature revealed several unusual features./U.
Initial attempts to refine the structure (sp.gp. P63a«b»5.146(2), c*8.636(1) A, Z«2) yielded unusually high valuesof the R-factor [F(F)rJ6.8% for neutrons and 7.7% for X-raya]•• compared to the precision obtained In earlier studiesR(F) iv»3X using the data from our computer-controlled diffrae-tometers . As such, refinement Including various possibletypes of disorders of S0j;2were attempted!i) SO4 disordered between two positions staggered by 60
about the S-01 bond along the 3-fold axis.ii) SO4 disordered between two positions, related by a
translation c/2 along x-axia.ill) Splitting of 01 about the 3-fold symmetry axis.
Ot these models 1) resulted in a marginal improvementX-ray structure though this was not supported by the neutrondata. The neutron data, however, favoured model (ill).
At this stage, refinement incorporating twinning, aboutthe CllOJ axis was attempted.' This resulted in a dramatic fallin the R-value for the neutron data to 0.038 and to 0.055 forthe X-ray data, with the introduction of only one additionalparameter defining the proportion of the two twin domains.CThe relative volumes of the two crystallites refined to 0.791:0.209 (5) , The proportion of twins resulting from the X-raydata is nearly the same.3
Large thermal notion attributed to the oxygen atom 01 onthe 3-fold axis was indicative of some disorders for 01. Hencerefinement was continued with a) disorder of 01 in P63 as repor-ted earlier by Chung and Hahn /2/ and b) lower symmetric spacegroup P2i. Both these refinements led to significant improve-ments in R-values. However, the bond angles and distances(shown in table 2.1.II) resulting from P2i refinement seem morerealistic. The final R(F) for neutron is 3.26V. The atomicparameters are indicated in Table 2.1.1. 'Fig. 2.1.1 shows thechain-like structure of the compound. The X-ray data alsogenerally confirm these findings. These results are significantfor the interpretation of other experiments on the crystal.
- 31 -

Table 2.1.1: Atomic Parameters of ^obtained from neutron dataTwin crystal atomic para-meters are y x z
**<»•• Trac- Co-ordi-tional nates
B•q10*
P6:
KLI3010201
03333333333623438
3410
06667666766669414
7150
08134203803542581
0368
1.571.430.853.622.12
3.85
Table 2.1JI: Relevant bond lengtha andangles in P63 and
V2. order P6, disorder
SoJ21x5-013XS-0202-8*0201-S°02
1.454{8)A 1.462(3)X1.465(3) 1.461(10)110.2(3)* 110.4(3)*108.9(4) 99-6(1.8T.918(10)* 1.935(12)A1.925(3) 1.926(3)114.1(2)° 113.8(2)*104.2(3) _g9.6(9)»
<2.986(5)>A<2.BftB(58)>A
1XL1-013xLi-02
L104 02-L1-02OI-Li-023XK-013xK-02 2.849(4) 2.854(4)
K-CO-ord 3xK-02 2.954(4) 2.955(4)
# distorted angle only
References
K
K
Fig. 2.1.1; An ORTEP plotof LiKSO^ showing theSO^"2 and LiO^ tetrahedrallinkages.
Bhakay-Tarahene, S., Sequeira, A. and Chidaabaramt R.,Neutron Physics Dirision Annual Report for the year1980 BARC-1134, p 30 (1981).
Chung, S. and Hahn, Th., Z. Krist., 13J, 447 (1973).
2.2 Comparative Study of Mosaic Structure in Crystals by Refine-ment of Extinction Parameters frow Neutron Data and by X-RayTopography
(A. Sequeira, H. Rajagopal and R. Chidambaram)
It is now possible to correct extinction effects in diffrac-

tion data rather precisely by using the Zachariaaen's theoryor some of its modifications. However, the physical signifi-cance of the derived extinction parametera has often been indoubt. The reasonableness of extinction parametera for twocrystals has been examined using direct estimates of thedomain sizen obtained from x-ray topography and the mosaicspreads from multicrystal diffractometry.
1. KC1 Crystal
The data set (54 reflections) was moderately affected byextinction (Ymin=0.7, A = 1.03A). The results of refinementusing various models of extinction are given in table 2.2.1.
Table 2.2.1: Results obtainedtion.
uaing various models of extinc-
nodel based on Zachariasen's theory RCFJ AverageParticleradlua
I) Isotropic Primary 0.0152II) Isotropic Secondary 0.0154III) Anisotropic Primary 0.0067iv) Anisotropic Secondary (Type I) 0.0098v) Anisotropic secondary (Type II) 0.0066 0.10
* Equivalent mosaic spread <v2 mln. (FWHM).
It Is clear from these results that it is not possible to choosebetween the primary and secondary extinction models. The parentcrystal, when examined by multicrystal diffractometry and byx-ray topography, /I/, indicated a mosaic spread of 14 min. (FWHM)and an average particle size of 6 microns, which support theparameters resulting from primary extinction models.
2. L-glutamic acid.HCl
The data set was severely affected by extinction <0.06, A si.406A). The extinction parameters reslting fromvarious models are listed in Table 2.2.II below.
T%bl« 2.2.II: Extinction parameters corresponding to various models
. Model
(Zachariasen)
i) Primary11) Secondaryiii) Primary+Secondaryiv) -do-
R(on F)
(N0=639)
0.05420.05300.04780.0489
Mosaic spreadparameter*g x 10-4
17.1(1.3)9.5(1.0)0.29®
Particle radius(Microns)
178{8)-
24(1)133(4)
•> Constrained at this value.

- 34 -
A large crystal of the same crop when examined by multicrystaldiffractometry gave a mosaic width of 45 aec.(FWHM). The equi-valent mosaic spread of about 1 sec. indicated by extinctionparameters (model ill) is much small in comparison and so isthe resulting particle size. However, a constrained refinementfixing g at 0,29 (corresponding to the experimentally measuredmosaic width of 45 sec.) yields a particle radius of 133 micronswhich is fairly consistent with the x-ray topographs.
Reference
1. Krlshan Lai and Singh, B.P., NPL (Private Comm.).
2.3 The Crystal and Molecular Structure of W-Methyl-Crotananium Iodide, C^H^O-N-CHj I
(V.M. Padmanabhan, S.D. Sharma* and X. Qoswamy*)
The title compound crystallises in orthorhombie spacegroup P2^2i2i with cell dimensions a • 19.312(8), b«7.602(6)and c s 13.272(6)* with four molecules per unit cell. Thestructure was solved using heavy atom method from 1174 threedimensional x-ray intensity data. At the present stage ofrefinement , R(F) is 0.076% with anisotropic thermal parameters,n ORTEP plot of the molecule Is shown in fig. 2.3.1. The
Fig. 2.3.1; An OitTEP plot of the molecule C17H
* Physic* Department, Jaamu University, Janmu.

observed bond lengths and angles do not differ significantlyfrom those of alkaloids reported in literature. The pyrrolizi-dine nucleus exists in endo-puckered form and the dihedralangle between the two five-membered rings is 124.10. The macro*ring has eleven atoms and the two lactone planes of this ring•re roughly parallel with 15.2° between them. The dihedral anglesbetween the two lactone planes and the macro-ring are 99.4° and113.90.
2.4 The Crystal and Molecular Structure of Palladium-L-Hydroxy-prollne Trihydrate
(V.M. Padmanabhan, S. Sinn, T.N. Ranganathan9 and R.P.Patel")
The crystal .structure was investigated using 3D x-rayintensity data (2057 reflections) from Trombay Diffractometer.The coordination around the palladium ion is nearly square planarwith the carboxyl oxygen and the iminonltrogen atoms coordina-ting In the cis configuration. A projection of the structure ofthe molecule, viewed down the 'b> axis is shown in the fig. 2.4.1
S£tEa-AXlS:iCm-OIA
Fig. 2.4.1; Projection down the b-axis of a molecule— o f Palladium-L-Hydroxyproltne Trihydrate.

- 36 -
The angles around the palladium ion »r» close to the expected90O and 180O but there are some distortions due to slightstrain caused by chelation. The Nf-Pd-Oi and Ng-Pd-O* angles(63.8<> and 85*4°) are smaller than the Nj-Pd-Ng and Oi-Pd-0*angles (98.6 and 92,40). The 01-Pd-N2 and O4-Pd.N1 angles(173.9° and 175.3°) are smaller than expected. The Pd-N1
and Pd-Ng lengths are 2.01A while the Pd-O<i and Pd-O^ lengthsare 1.96A and 1.998 respectively. The water molecules are notcoordinated to the metal ion but tir* Involved in hydrogen bon-ding with the carboxyllc oxygen and lminonitrogen atoms. In thepyrrolidlne ring B, deviations from the expected geometry andlarge thermal parameters for atoms Cg and Cfo have been found.Further refinement by assuming a disordered state for the atomsis in progress.
2.5 Crystal Structure of a Substituted Bthylene ^1-Mothyl.[Hltro Methylene) Pyrrolidinej
CrysZ-[V.i
(V.H. Padmanabhan, K. Venkatesan* and L. Nlrupa*)
Ethylenes substituted with electron donating and elec-tron accepting groups in the vicinal positions are known as'push-pull' ethylenes and they exhibit interesting behaviour.The title compound, (Mol. formula CgNgOgHto) *• * pyrrolidinering attached to 'push-pull1 ethylene. It crystallises inmonoclinic system, space group PZ^/<t Z « 4, and with unit celldimensions a = 6.023, b * 15.851 c « 7.447A and fix 106.93°.Three dimensional x-ray Intensity data for 1200 reflections(Mo KQC radiation) waa .collected with the Trombay diffractometer.Structural analysis is under progress.
2.6 Structure of (HHj,)gCuClt.2H9O in its Ordered Phase
(Sandhys Bhakay-Tamhane and E,J. Oabe*)
Single crystal X-ray diffraction study of the titlecompound was carried out below the critical temperature (200.5K)to elucidate the structural changes occurring due to the order-disorder phase transition in this salt. The room temperatureneutron diffraction study of this salt carried out at Trombay*/if, indicated partial disorder of ammonium i o m in the ratio0.64(2)to.36. In the low temperature phase, the ammonium iondisorder disappears: the two non-equivalent MHt ions, hydrogenbonded alternately to 4xCl(1) atoms at 3.355MTX and *x C K 2 )
* Organic Chemistry Dept., Indian Institute of Science,Bangalore+ National Research Council, Ottawa, Canada.
Chemistry Division« BARCHas now left BARC.

- 37 -
atoms at 3.366(1)8 arc related by a simple Z • } translation.Th« co-ordination of all other atoms remains unchanged. Th«ordered structure, studied at Ottawa using single crystalX-ray diffraction at 115 K, has a space group F421nl which isa subgroup of the room temperature phase space group.
The structure has been refined to R(F) > 0.035 audweighted R(F) • 0.017 on 1630 observed reflections (I>2o*),within the limit 51ne/\« 1.0A-1 (X* 0.70932A). The cell dimen-sions, refined using 17 reflection* with 2C >60« are a *7.540(2),c • 7.915(2), DCalc *
2«°5 Mg/m3 and Z • 2. Further refinementis in progress.
Assigning a pseudo-spin variable (s • + 1) depictingspatial orientation of the ammonium ion, we noTe that in theordered phase, all pseudo-spins are parallel to each other; whilein the room tampersture disordered phase, the existence of ahorizontal mirror results in antiparallel alignment of pseudo-spins, in concurrence with NMR results /2/.
References
1. Bhakay-Tamhane, S.N., Sequeira, A, and Chidambaram, R.Acta Cryst B 36, 2925 (1980).
?. Looyestijn, W.J., Klaassen, T.0. and Poulls, M.J.Physics 2&B. 303 (1979). *
2.7 Refinement of the Structure of Human Erythrocyte CarbonicAnhydraae B
<M. Ramanadham, K.K. Kannan and A. Jones*)
The refinement of the structure of human erythroevtecarbonic anhydrase to 3X resolution was reported earlier /I/.
The structure was derived at Z% resolution by isomorphousreplacement method and improved by model fitting in an Interac-tive graphics display. The structure was then using Konnert-Hendrickson restrained l.east square method to 3A resolution onthe 1RIS-80 computer. The R factor or the discrepancy indexdropped from 42% to 36.5% /1/.
The structure has been further refined using 2,5% datawhen the R-factor fell from 48% to 26.5% using the restrainedleast squares method. The resolution limit was Increased to2.0A and the structure refined to an R-factor of 32.3% with
• Wallenberg Laboratory, Uppsala University, 'Uppsala , Sweden.

- 38 -
individual temperature factors and 39% with on* overall tempera-ture fitetor.
Tba atructura waa model-fitted to tha isomorphoua mapin an lntaraetiva 3D-graphica display system using tha programmesyatam FRODO, /?/, It was immediately evident that the struc-ture needed refitting In a number of regions. The electrondensity map was featureless in some places «a far as side-chainswere concerned. At this stage, about 350 side-chain or main-chain atoms of a total of about 2200 atoms could not be assignedany density and were left out of further calculation. PRO52 wasfitted in the cis configuration. Though the structure fittedthe density well, the B-factor went upto 45.5%.
Two cycles of constrained and restrained least squaresrefinement with one overall temperature factor(CORELS) broughtthe R-factor to 36% at 2.0* resolution.
A(2Fo-Fc) difference fourier was calculated and thestructure was model fitted In the interactive graphics display.The map clearly showed a number of groups that were left outof the calculation. Particularly residues TRP4, els PRO29residues 101-103 and 128-138, eis PR0200, residues 251-25*,SER 259 and PHE 260 were easily located in the electron densitymaps and could be included In further refinement, still abouttoo atoms could not be fitted in the electron density mapsproperly and were left out of further calculation. The fittingof the structure In the (2Fo-Fc) map waa constantly checked withthe iaomorphlca maps and found to be aatiafactory. ResidueCis-PRO52 could not be fitted in the cis configuration in thisnap and so was left out. Two more cycles of CORELS using oneoverall temperature factor brought the R-factor to 33%.
Another (2Fo-Fc) difference fourier was calculated andthe structure model fitted again. PR052 could be clearly fittedas trans-PRO and most of the unidentified atoms could be placedfrom this electron-density map. A number of forked residueswhich were found to be wrongly refined to local minima by therefinement programme were recorrected. It waa also clear thatsome carboxyl oxygens were pointing Into wrong densities andthe refinement programme wes incapable of correcting them.These were also refitted.
One more cycle of refinement with COBELS using overalltemperature factor followed by two cycles with group temperaturefactors I.e. one for main-chain and CB atoms and one for theaide-chain atoms of each residue, brought the R-factor to 26,7%.Fig. 2.7.1 gives the R-factor as a function of cycles.
A(2Fo-Fc) difference fourier was calculated and thestructure refitted to the electron-density. At this staisr allthe residues except for the first three amlno terminal ones couldbe placed in the electron density map. A(FO-Fc) differencefourier waa calculated and about 66 solvent molecules wereIdentified within hydrogen bonding distance to oxygen or nitrogen

-39-
atoaa of the ••in chain OP tha side chaina. Tha watar struc-tura loeatad In tbe vicinity of tha activa aita seeas to ba ofiaportanca in tha mechanisa of tha enzyae. Further work la inprogress.
• MPUUCWMHIln
1 trass.
Fig. 8»7»1t Changas in R-faetop •• a function of laaatsquara cyclaa.
' J 1 J ' i ' k ' ji ' u '' V« -*-i,IS-CYCH NUMWR
Hafarancaa
1. Kannan, K.K. and Rananadha*, M., Zntarnatlonal Journalof Ouantui Chaniatpy 20, 199 (t981).
2. Jonaa, T.A., J. Appl. Cryatallogr., U_, 268 (1978).
2.8 X-Hay Diffraction Study of Cu2* - Lyaoaywa Complex at zthaaolution
(M. Raaanadham, B.J. Blrknaaa**, L.C. Sl«kar> andL.H. Janaan*)
Tha structure of tha Cu2+ conplax of triclinic lyaozyma(1001 protain atona, 239 watar oxygana and 2Cu2+ poaitiona) wasrafinad by tha method of stereo-chemically raatrainad least-aquarea raflnaaant on DEC-10 at TZFR uaing about 6900 independentX-ray observations with d>1.97A, to an R-factor of 0.169 on Fvalues. Tha gaoaetry of tha nodal was analysed to look at thaCu2+ co-crdinatlon. One Cu2* ion la within the active site of
** (Jnirarslty of Bergen, Norway.
• Septs. Biological Structure and Blocheaistry, Universityof Waahington, Seattle, WA-98195, USA.
- 40 -
tto* enxyme in the vicinity of OLU-35, at distances of 2.1 and3.0* from OBI and 0B2 oxygens of the residues. The side-chaincerboxyl group of ASP-52 Is more than 4,5X away from thisCu** site. The other ion la bound to the enzyme in the vici-nity of HIS-15, ASP-87 and THR-89 residues. The closest proteinatoms to this site are NE2 of HIS-15 at 2.1* and 001 of TKH-89at 2.*I. In addition, both the Cu2+ sltetare surrounded by anumber of solvent atoms within the coordination distances, Adetailed analysis la in progress.
f.9 Magnetic Tape Controller for the TDC-312 Computer Control-led X-R*y~ Dlffracfcometer; Status Report
(S.K. Momln and P.e. Pandey)
In order to test the various logic cards (16 Mos.) ofthe controller, a test-jiff was designed and fabricated tosimulate all the necessary signals for individual card testing.The Individual performance of all the cards for Read logic ,Write logic, Control Register logic, Extension Control Register,Status Register logic, Data interrupt logic for Direct MemoryAccess (DMA) transfer, and Input/Output Interface logic forprogrammed data transfer etc has been tested using the off-linetest-jig.
The wiring and design defects were debugged and recti-fied wheresver necessary. The controller's back-panel wiring andfabrication of ail the I/O cables required to hook-up the control-ler to the TDC-312 computer have been completed. The M.T.transport unit <fertee-6840-75-25 model), its formatter,controller and the power supplies etc are assemblled in a special-ly designed rack. The functions of tape transport unit has beentested in manual mode and the system is now ready for on-linetesting. The necessary wiring on the TDC-312 back-panel forobtaining the I/O bus tlgnala from CPU for programmed datatransfer as well *» for dttta Interrupt transfer, is in progress.
t.10 Printout System for Double Crystal Dlffractometer (Pi)and Poaltron Angular Correlation (PAC) ExperimentsETe
(S.N. Komln)
The control systems for D1 and PAC experiments wereupdated by Incorporating 16-column printers "Seiko 310-model*,- 2.5 lines/second). New design features were Introduced inthe control systems to operate the printer under three differentmodes of printing viz. Manual, Auto-Synchronoun and Externalasynchronous mode. The flexibility of interfacing with twodifferent H-dlgit data sources (Sealers) snd printing themsimultaneously is also provided. Based on this design, thefabrication of an automation syetem for Positron annihilationangular correlation experimental setup at Nuclear Research

- 41 -
Laboratory, Srinagar, Kashmir, has been taken-up and it isin progress.
2.11 Computer Program for Thermal Motion Analysis
(H. Rajagopal)
The Oak Ridge Segmented Body Analysis (ORSBA) program dueto Dr. C.K. Johnson has been implemented and is available foruse on DEC-1077 computer at TIFR. Precise thermal-motion analysiscan be done by using this program which incorporates a modelconsidering restricted motion between rigid segments of a mole-cule /1/. The program allows upto 100 atoms and seven segmentswith seven Joints, one of which will be assigned the overallnotion of the complete segmented body. It also calculates theeffects of internal molecular vibrations on vibration ellip-soids and thence the observed-mlnun-calculated residuals for thetemperature factor ellipsoids.
Reference
1. Johnson, O.K., "Thermal Neutron Diffraction" Ed.B.T.M. Willis, Oxford Univ., Oxford, pp 132 (1970).
2.18 Computer Program HULTAN
(V.S. Yadava)
MOLTAH f fl system of computer programs for solving crystalstructures due to Dr. P. Main at al. /I/, has been implementedon the DEC-1077 computer. The program employs the multlsolutlontechnique to solve crystal structures. For equal-aton structurescontaining upto about 70 independent atoms, such a program systemis expected to reveal most of the structure in a single computerjob. Larger structures can be solved, but several attempts mayhave to be made.
Reference
1. Main, P., Fiske, S.J., Hull, S.6., Declercq, J-P.,Germain, 0. and Woolfson, M.M., MULTAN- a system ofcomputer programs for the automatic solution of crystalstructures (1Q80).
2.13 Computer Frograma Related to Biological Crystallography
(M. Ramanadham, S.C. Gupta, S. Cbakravarty, and K.K.Kannan)
1* The December-1978 versions of stereocheaically res-trained least-squares programs (W.A. Hendrickson, Personal

- 42 -
Communications) which were implemented on DEC1O77, DEC-1090and IRIS-80 during 1979-80 wart extanaivaly modified andimproved on DEC-1077 ayatem at TIFR, for rtfining the structuresof carbonic anhydrase B and C. Naw aubroutlnea for P2i waaaddad and tha programs wert also run in ovarlay mode, A numbarof calculations on Triclinic lyaozyme, copper-lyaozyme complex,HCAB and HCAC war* parformad on DEC-1077 ayatam uaing thaaaprograms•
This sat of programs was also implamantad on FRIMK-450at BARC and calculations including ona cyela of refinement waraparformad on HCAB.
2) Tha program FORDAP waa implamantad on DEC-1077. Tha DEC-10version of FORDAP can also do the peak search from a 3D Fouriermap. It waa uaad for triclinic lyaosyme.
3) A program, ANATOM, waa written for DEC-1077 toanalyse the atomic modal of a protein by comparing protein-protein , protein-solvent, solvent-solvent distances and distan-ces from ions to a deaired limit. Thia program waa extensivelyuaed to analyse the models of lyaozyme, Cu2+-lysosyme complexand HCAB.
k) A program to predict the positions of diffractionmaximum on oscillation filas from large cryatals of biologicalmacromoleculea has been Implemented on the PDP11/34 computer.The output of this program forma input for the program toevaluate the integrated intensity. This program is also beingImplemented.
5) A program ayatem for evaluating the integratedintensity of oscillation films has been compiled error forceusing the Fortran IV plus computer under the RSX-11M operatingsystem. The program is being tested with test data on a Notexinoscillation film.
6)A set of subroutines for graphic plotting on aTektronics-4010 terminal has been made operational and madeavailable as a library program package for the PDP11/34 . Thislibarary la essential for the film processing program and canalso be used for other general graphic requirements.
7) A set of programs have been made operational to ac-cess the data atored on the diac files, by the microdensitometersoftware handling routines. Some oscillation films have beenmeaaured and processed by these programs.

3. MATERIAL PHYSICS
3.1 Non-Thermalisation of Positrons in Alkali Metals: AnAlternative Interpretation in Terms of a Charge-Density- .Wave Ground State
(Surlnder M. Sharma and Satiah C. Gupta)
Pre-annihilatlon motion of positrons snows up as thesmearing of the profile near the Fermi momentum in angularcorrelation experiments. By comparing the theoretical profileconvoluted with Maxwell-Boltzmsnn momentum distribution ofpositrons with the experimental profile, one correlates thesmearing near the Fermi momentum with effective temperature ofpositrons. It is observed that as the temperature is reduced,the smearing reduces except in alkali metals /W where someMinimum smearing is retained. This is interpreted as minimumeffective temperature (m.e.t) of positrons. Experiment of Kimand Stewart /2/ shows that this m.e.t. is 160 + 50°K for Na,100 + 60°K for K and 60 + 50°K for Rb. Later,~Kubica &Stewart /1/ observed dlfTerent values viz. 50 + 3O°K for Na and25 ,• 25 °K for K.
The evidence of complete thQrmalization of positrons inMg and Al /"!/ makes it difficult to believe that above mentionedhigher m.e.t.*s are evidence of non-thermalizatlon, because thelife time is much shorter in Mg and Al. The other mechanisms ofshearing like defect trapping and. positron-phonon interactionare also ruled out /3/. We have proposed that this residualsmearing /2/ (and hence m.e.t.'s) is because of charge densitywave (CDW) being ground state of alkali metals /kf5/ instead ofnormal state. The existence of CDW distorts the Fermi surfacein approximately C110J direction to the extent that it touchesthe Q/2 planes ($ being the wavevector characterizing CDW).The profile of this state when fitted with inverted parabolaconvoluted for positron motion requires positrons to have somedefinite effective temperature. As Q is slightly off the E.110Jdirection /1/, there p.re 24 symmetry related Q domains in eachsample. So the theoretical profile of CDW state also dependsupon the Q-domain distribution in the sample. Depending uponthe treatment given to the sample, from single to completelyrandom distribution of Q-domainJ can be obtained. This problemof m.e.t. resulting from CDW ground state has been carefullyanalysed with the domain distribution as a parameter /3/. Thecalculation shows that if the sample is a single Q-domain thenm.e.t. required for positrons to give the best fit of profileis 525°K for Ha and 220°K for K. In case the domain distribu-tion is completely random, m.e.t.«s are 6°K for Ha and 2°K for K.A 10% preferential alignment of Q-domain along p_ results in30°K for Na and 11°K for K. Such a preferential alignment is
- 43 -

- 44 -
possible in alkali metals by recrystallizatJor at room temperature as it lowers the surface energy /7/, Therefore we cothat it is possible that a larpe part of observed m.e.t's maybe due to the fact thct the CDW ground state profile has beenanalysed in normal state (with spherical Fermi surface). Itis also possible that a lar#e variation of m.e.t.'s in twoexperiments is due to change of Q-domaln distribution. Thepresent interpretation points out the need to do more carefulexperiments with controlled Q-domain distribution on alkalimetals before concluding about the non-thermalization ofpositrons.
Deferences
1. Kubica, F. and Stewart, A.T., Phys. Rev. Lett. 34, 852(1975). ~~
2. Kim, S.H. and Stewart, A.T., Phys. Rev. B 21> 249(1975)
3. Sikka, S.K. and Sharma, Surinder M., Proc. SecondNational Symp. on Positron annihilation, 8.IV.1. (19821(To be published).
4. Overhauser, A.W., Adv. Phys. £7, 343 (197«).
5. Sharma, Surinder M.f J. Phys. F _1£ » *•*? (I960).
6. Giuliani, G.F. and Overhauser, A.W., Fhys. Rev. B 70,1328 (1979).
7. Overhauser, A.W., and Butler, N., Phys. Rev. B. 14,3371 (1976).
3.2 Valence Charge in a Solid at 0 K Viewed as a PressureIonlaatlon Effect
(B.K. Godwal, S.K. Sikka and R. Chidambaram)
Modified Saha ionisation theory has recently been used/I/ to obtain the dominant pressure and thermal ionisationefforts in the 'intermediate1 region (0.5 - 10 TPA) of theequation of state. The present work is aimed at providing thejustification for the use of this theory in the presence ofinteractions. As is well known, the ordinary Saha ionisationtheory /2/ assumes that the thermodynamic system is a mixtureof ideal gases with no interactions between then, so thistheory la not valid at high densities. The successful use ofSaha ionisation theory at hi*h density solely depends on theformulation of a model for mono-atomic matter that takes intoaccount the high density effects like lowering of the lonisation
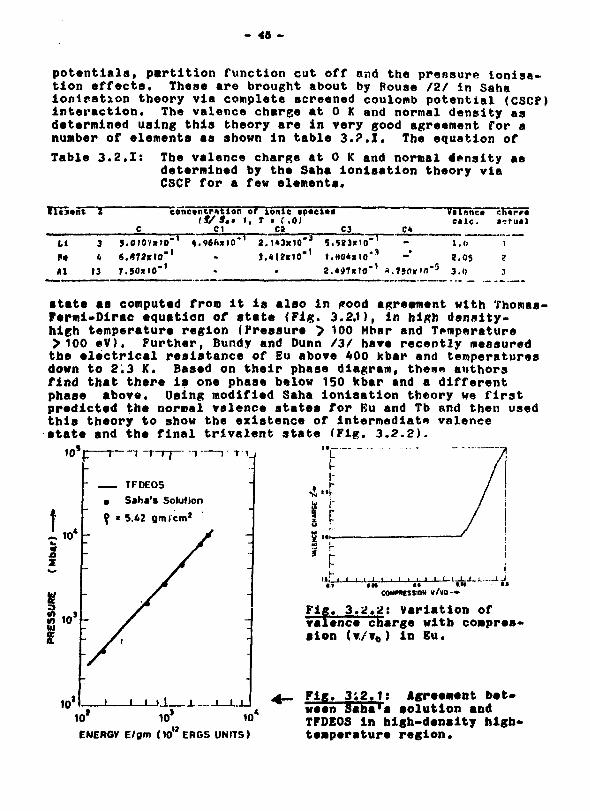
- 46 -
potentials, partition function cut off and the pressure lonisa-tion effects. These are brought about by Rouse /2/ in Sahaloniration theory via complete screened coulomb potential (CSCP)interaction. The valence charge at 0 K and normal density asdetermined using this theory are in very good agreement for anumber of elements as shown in table 3.?.I. The equation of
Table
fcltaant
It0*
3 .
z
3
13
2 .
5.6.7.
I : The valenc*determinedCSCP for a
conctntr«tlontt/3..
C C1
OlOVjetO"' 4.<)6ft*)0*
SO*IO"'
t charge at 0 K and normal density aaby the Saha ionisat ion theory viafew elements.
or ionic »p«el«il, T • CO!
C2 C31 2,1»3x10"3 5.M3x'0"'
3.412X10*' 1.HO«mo*3
vilane*ealc .
Ck1.0t. os
»75Oir">'"*> 3 . 0
charr*»-fual
I
?J
state aa computed from it is also in good agreement with Thomas-Permi-Dirac equation of state (Fig. 3.2.1), in high density-high temperature region (Pressure > 100 Mnar and Temperature>100 eV). Further, Bundy and Dunn /3/ have recently measuredthe electrical resistance of Eu above 400 kbar and temperaturesdown to 2.3 K. Based on their phase diagram, theee authorsfind that there is one phase below 150 kbar and a differentphase above. Using modified Saha ionisation theory we firstpredicted the normal valence states for Eu and Tb and then usedthis theory to show the existence of intermediate valencestate and the final trivalent state (Fig. 3.2.2).
_ TFDEOS
Saba's Solulion
» 5.42 grnfcm*
^ 10'
»103
!
10'
C0MMESSI0N » / v 0 -
Fig. 3.«i«2; Variation of
10' 10* 10
ENERGY E/gm (1OI2ERGS UNITS)
valence charge with coaprea<•ion (v./v0 ) in Eu.
Fig. j;2.1: Agreement bet-ween Saha'a solution andTFDEOS in high-density high-temperature region.

- 4fi -
References
1. Godwal, B.K., Sikka, S.K.f and Chidambaram, R.f Phys.Rev. Lett. 4J[, 1162 (19H1).
2. Rouse, C.A., Prog, in High Temp. Phys. and Chem.(Persamon Press), Vol. ±, 139 (1971).
3. Bundy, F.P., and Dunn, K.J., Phys. Rev. B24, 4136 (1981).
3.3 Positron Annihilation Studies in Thermal Cycled »ranium
(Surinder M. Sharma, S.K. Sikka and R. Chidambaram)
It is known that a polycrystalline sample of x-uraniumundergoes large dimensional changes when subjected to thermalcycling within «* -phase. There are also related changes inmicroscopic level like grain boundary flow, subgraining, voidformation etc. As positron annihilation technique is specificto vacancy-type defects, a detailed study has been undertakento understand the role played by vacancy-type defects in thesechanges. Samples prepared from R-5 rod have been subjected tovarying number of thermal cycles, between room temperature and550°C. Preliminary experiments show correlation, Studies on arolled sample show that the defects anneal initially , whilesubsequent cycling increases the peak counts at the cost ofhigh momentum components, thus pointing towards the increase•f vacancy type of defects. The initial annealing Is under-standable because uncycled and unannealed sample has a verylarge number of quenched defects which are not related tomechanism of dimensional change and these anneal out in the ini-tial cycling. Later increase in vacancy type defects must beresulting from the same mechanism which causes dimensional andmicroscopic changes. More detailed studies are in progress.
3.4 Single Crystal Neutron Diffraction Study of High PressureOmega Polymorph of Zr '
(S.C. Gupta, S.K. Sikka and R. Chidambaram)
Under high pressures, Tl and Zr undergo a phase changefromcC(hcp) to urstructure. to"-Phase also occurs from the hightemperature ^(bcc) structure by quenching in alloys of Ti, Zrand Hf with other d-rich transition elements. The structure ofthis metat table ur-phase has been investigated using x-rays byvarious workers. From these, ur phase la believed to occur in(a) hexagonal form (P6/mmm) in elemental Ti and Zr and low solute

- 47 -
concentration alloys and (b) triponal form <P3ini) in hiph soluteconcentration alloys. However, all theso studies were carriedout in crystals containing both p and ur phases, with the rwultthat fi phase reflections masked the abience'' for the two apacegroups. We have undertaken a neutron diffraction study ot ufphase in Zr on a crystnl prepared from oC phase by applicationof pressure, 30 that /3 phase is now absent. The computer-controlled diffractomoter at C1RUS reactor v>as used in thisstudy to record intensities at ,A = i.O3uJL Some results are asfollows:
(A) Space group: We found the neutron intensities forh-k t 3n and 1 = 0 were_zero but not for 1 = 8 . This indicatedthe apace group to be P3m1. However on analysis of intensitiesfor refinement it was discovered that many reflections from twograins were overlapping. In view of thin, we do not yet ruleout the space group P6/mmm.
(8) Texture: Houtron intensities with the original <0002)o<; at% =90° correspond to two prains viz M0T1 ) y. //(OOOk^ and(n2o)ur//(00O2)oc er. reflection (22A0) is observed both at% a 0° and % s 90°. The orientation relations as observed
by neutron diffraction am the R.UOP an found iiv us in earlierelectron-diTfraction stucli.cn.(C) Refinement: From eleven non overlapping refleetons, theleast squares refinement with isotropic temperature factor atthe present state is 8.3%. Further work is in progress.
3.5 A Semiemplrical Equation of State for Metallic Solids
(S.K. Sikka and B.K. Godwal)
The calculation of the equation of state of condensedmatter has been an ongoing, problem since the publication inopen literature of shot': pV data in the fifties. Upto 2-3 Mbars(the so-called 'experimental region') this is computed bywriting down the internal energy and pressure as the sum of-three terms viz. 0°K lattice contribution (0°K isotherm), ionicthermal vibration part and thermal excitation contribution ofelectrons. For the zero-do^rfle iostherm, two approaches havebeen followed. One is the empirical approach in which thetotal energy at 0°K, Ec, is written down as the sum of repulsiveand attractive contributions 'e.ft. in ionic solids). The otherla the first principle energy band method which has been recentlydemonstrated to be especially successful for metallic solids/I,2,3/. We have suggested a simple two term expression forthe total energy of metallic solids for computing the pV curves.
We write the total internal energy at 0°K (within an

- 4B -
additive constant) <xs :
(1)
where 1 =The first repulsive term is written following the hard corepseudo-potential formalism of Zunger and Cohen A / . The correctform of the kinetic energy of electrons for a highly compres-sed state ie:
*1'- C*)
The second term is based on the observation that all the attrac-tive terms (neglecting correlation contribution) in Heine andWesire /5/ expression have 1/Yws dependence. The constants A,b and C *VB fixed from the experimental values of the bulkmodulus, the Gruneisen coefficient and the (dE c/£n,)* 0 at n>1To test the above formalism, we have done shock Hugoniot pVcalculations for 14 elements: Cu, Be, Mg, V, Nb, Ta, Mo, W, Cr,Re, Rh, Ir, Pd and Pt, for which experimental pV data weremeasured by Mcqueen et al. /6/. The other two contributions topressure, as mentioned in the introduction, were computed by theOruneisen-Dugdale-MacDonald model and the Thomas-Fermi approxi-mation.Fig 3.5.1 shows the comparison of theoretical and experi-mental pV carves for four metals. The agreement is quite goodright up to the limit of experimental data. Similar agreementis found for other metals investigated.
Fig. 3.5.1; Comparison oftheoretical and experimentalpV curves for four aetals;Mo, Nb, Be and Mg.
V/V.
In conclusion, the expression (1) for B is quite adequatefor pV calculations. Also our calculations lend indirect support

to the view that the potential parameters fixed at normal pres-sure (i.e. via Vo, Bo end io) continue to hold at least uptopressures of 2 Mbars.
References
1. McMrfhan, A.K., Hord, B.L. and Ro»a, M., Phys. Rev. B15-786 (1977 ).
2. Godwp.l, B.K., Sikka, S.K. and Chidambaram, R., Phys. Rev.B20, 2363 (1980).
3. Sikka, 5.K. and Godwal, B.K., Solid State Comm. 3b,949 (1981). —
4. Zunger, A., and Cohen, M.L., Phya. Rev. EMjl, 5449(1978).
5. Heine, V., and Weaire, D., Solid State Phys. 2^,249(1970).
6. McOueen, R.O., Marsh, S.P., Taylor, J.W., Frita, J.N.and Carter, W.J., "In High Velocity Impact Phenomena",Ed. H. Kinslow (Acad. Press) N.Y. (1970).
3.6 Liquid Disorder and Shock Hugoniot of Lead
(B.K. Godwal)
The shock Hugoniot equation of state of lead has beencomputed in the 'experimental1 region (pressures < 5 Mbar) usingboth the solid state /1/ and liquid state theories/i/. In thesolid state model, the Krasko-C.urakii type of pseudo-potentialwas used (with a • 3.0 and Vc= 0.3775) to obtain the cold,lattice and the electronic excitation contributions. Thenuclear Gruneiaen parameters used in evaluating the latticethermal contributions, have been derived from the details ofphonon frequencies. The computed electronic Gruneisen para-meter values depart considerably from the value 0.5, which isoften used in analyzing the shock compression experiments. Theeffect of liquid disorder on melting was investigated usingAahcroft's liquid perturbation theory /?./. The Percus-Yevickstructure factor was used in evaluating the band structure,Madelung and entropy contributions. The variation of packingfraction \ >*as investigated *lonr the 300°K isotherm and alongthe shock ilugoniot of Pb. We found that 7| increased along the300°K isotherm, while it decreased alonp the shock Hugoniot ofPb as seen in Table 3.6.1. This is due to the temperaturerise resulting from the shock compression.
The shock Hugoniot equation of state obtained using

- 8 0 -
•olid state theory was in batter agreanant with tha experimentaldata of McQueen et al. /3/ aa compared to the liquid statetheory (aee Fig. 3.6.1).
Table 3.6.1: Variation ofqwith compression (V/Vo) for Pb
V/Vo
1.00.90.70.55
along 300OK Isotherm i^along Hugonlot
0.650.670.700.70
0.650.630.54
110
too
SO
• \
1
\
1
SolidLiquid
fS 0.C 0.7 0.1 0»
/
Fig. 3.6.1; Variation of prea-sure with conpraaalon (V/Vo)for Fb. Tha aolid state theoryshows better agreement with theexperimental data aa compared tothe liquid atate theory.
Keferences
1. Oodwal, B.K., Sifcka, S.K. and Chldaabaran, R., Fhys.Rev. B 20, 2362 (1979).
2. Ashcroft, N.W., and Stroud, D.t Solid State Phys. 33,1 (1978).
3. McQueen, H.G. and Marsh, S.P., J. Appl. Fhys. 31,,1253 (1960).

4. SEISMOLOOT
Introduction
(O.S. Murty)
Centred around the queetion of detection and identifica-tion of underground nuclear explosions, the R A D work of theSection progressed steadily toward* inproved methods of detec-tion of signals, and new algorithma for signal extraction.During the year 1981, over 4300 eeiamlc aignale from our•tatlona ware examined viaually by the fiald ataff. Thiareaulted in identifying the typical aignaturea aasoclated withunderground nuclear exploaiona. Table 4.1 aunaariaea the ata-tiatica of detection and identification of praauned undergroundnuclear exploaiona carried out by different countrlea.
Table 4.It Detection of preauned nuclear teata far the year 1981(Jan. - Dec.)
underground detected andteat conduc- identifiedted
2 P n o l . 3 9 ^ R t ; f l i J ; j K a J t ^ i l J d i i a i i ? , 7 J . ; ) a I , >rui ?bSouthwestern Ruaala 2 2Novaya Zealya 1 1Central ^fefflp fc^doslisflJS-JOD t« •1ni58^!-^ s AEuropean USSR t~ ~ " 1 .
FRANCE (-HWfWftfH *Aftj)i tbnn UP.BZ %\>Z,IR-; t *•*.-,»* 1h ?iAll the events that could not ba detected gave aignals belowthe detection threshold for thia region (body-wave Magnitude
t K ^ d f kn: [SVITI
i w sf«MAai»m**nJ»rpftW.oBjy|fird^ifeai.horfo«j. i9'X- .f»'i
, © n o l a eMBl on.!:.'!1 ev.nw ''3 •'> ; . | <-. n h $•>!•*.iris a e<i n^-i .:ft:-'w ,-rsrl? n\n ;• **• if-l J A i i f W > M ^ d ^ l ) " ;
b ifli
Oauribidanur da*te>ft»fc?plardingeescpeattftaJto noJjatoni.^jao:-. no-:":
- il -

- 68 -
Specific raqueat from rational apanelaa for aelsmiedata wepe mtt with aa and whan naad aroaa.
A ltrge part of tha dajr-ta-day Beiameiof,ie*l work dapandaen tha combined andeavoup of meat of tha ataff, which li diffi-cult to raport Individually. Neveptheleaa an ettampt la mad ato aummapiaa briefly tha scientific paaaareh undar differantheadings along with associate** ataff.
4.1 Valocity Variations in Kolar Oold Fialda (KOFI
(5.X. Arora and Tapas X. Baau)
Variation* in tha F-valoclty In tha North-South direction,parallel to the major axis of tha Kolar aehiaat bolt wereeetlmated from the inverted arrival•tin* data corresponding to2 deep-hole drilling blaats (at 2000 laval H 86/88 slope.)eonduetad in tha Nundydroog Block and 19 modarataly strong rock-burata that caused observed underground damages (known evente).Vaing the regional data, it was found that in tha high-velocityNundydroog region th.» velocity varlationa ara anall (nean valuala 93 m/aac), and in tha relatively low-velocity Chanplon Raaf.Mysore Mine region they ara alightly larger (135 n/aae). ThaP-velocity variations ar« ahown in Fig. 4.1.1. However, Iftha whole mining region is taken as one tectonic block(wldelydistributed 4ata), on* obtains rathar lar^a varistiona, aamuch aa 290 n/sec. These resulta indicate aignifieant hetero-fanatty of tha valoeity diatribution in tha KOP panion.
a.I Fpocaaaina of Cofa»t»aflactad P Phaaa
(I.K, APOPI, Tapai X. lifu and ft,tf, iharHhup)
Quite frequently it la required (to ppoeeaa at laaat ana•aaondapy arrival in tha array aela«aa;ram of an avant. In thiaraapaet, eare-rariaatad p phaaa, PaP, if faund to aa of iattrailwith rejtard to (i) oora aeeurata Maaurafiant «f apieantraldiatanoa than what ean ba achieved uaing P wava tina laia «l«M f(11) aatinata of magnitude of atrong avanta whsaa P aignalaaturataa tha recording ayatan having limited dynanic rang* and(ill) diagnoatic aid to aourfce diaeriainatlon using apactralratloa of P and PcF. Conpared to F, pcF is sfcroncly attenuated(abovt $ to 15 tiaeadepending on the magnitude of the event)whien makes It difficult to detect, especially in earthquakerecords tk*t trt complex and have large length of F coda. Inexplaalea aolamograma, FcP usually emergeaaa a aharp aaall-amplltude aitnal having tha nature of a transient» ainca it lafraa from contamination due to preceding aignala.

- M -
GR0UP3:WI0E DATA„ --. »•, , . . • ' " 704 230 5
693 350 170* 290 5
702 310 5- 702 210 5700 190 6
6-77 2W •6-91 280 5393 310 S
Ml 620 B640 190 4884 240 6
6-85 330 5681 270 7666 300 5
682 330 6682 170 4
GROUP t:RE6.1J XP1*—= 694 60 1j> xP2b»—• 699 50 1/2UJ Mb.r"-----""-*! 691 170 2z GROUP2:RE6.2
1 — • . - > . . j - — - 653 110 37—""»"»•...« 656 120 38 = — • •*= 651 80 2
10b '•»•- ~:--> -- 646 180 41 4 b -,....-•"- V . . . * - - - . 656 240 419 b -—; 651 60 1
X.SOUTHdOOOFT)
rig. 4.1.1; P-v«locity variations (broken lines) aa aFunction of South coordinate of the KOP region; base valueis the least-squares eatimate (solid line). Results underGroups 1 and 2 ars based on regional data while thoseunder Group 3 are based on widely distributed data* Solideirelea give source position along Horth-South. Numbers atleft are event identification numbers. On the right handSide, numbers in the first column give estimated P-velocity(km/sec), those in the second column give maximum velocityvariation (m/sec) over the whole rang* of diatanee and thelast colunn contains standard deviation (msec) of arrival-time residuals.

- 64 -
For processing PcP in array records, velocity and time-lag tables have been constructed. The lag tables are based onthe surface-focua Jeffreys-Bullen travel tines. These tables areparticularly useful in the inverse application, viz., when onewants to know what exactly should be the phase delay that willoptimally "beam" the PcP corresponding to P from a given source.The functional relationship between the direct and the reflectedphase employed by us is shown in Fig. 4.2.1.
Fig. *.a.V: PcP to P time-interval as a function ofepicentral distance (solidcircles), and PcP velocity asa function of P velocity(open circles).
*•^ Further Studies on Source Discrimination in "Difficult"Cases
(S.K. Arora, Tapas X. Basu and C.A. Krishnan)
In the so-called "difficult" cases which are associatedwith some ambiguity in source discrimination using single-station seismoftrams, the usefulness of depth estimate usingmulti-station data has been demonstrated in eleven typicalcases of seismic events recorded at Gauribldanur »rr»y.
It is found that, sometimes, the waveform correspondingto a presumed underground explosion does not resemble thesignals characteristic of known explosions of nearly the sameMagnitude and located in.the same region as the event understudy (test event). On the other hand, waveforms produced byknown explosions in a region are found, on occasions, to be moreor less similar to the test event which is actually a deepearthquake. This is one of the faetors that adds to the diffi-culty in the discrimination process. Here we illustrate this

- w -
Fig. 4.3.1: Typical example*or oauribidanur array P-waveatismograms showing generalsimilarity or dissimilarityof waveforms as the ease may
point by taking the first fewseconds of Oauribidanur arrayP-wave seianograms arranged innine different sets of records,a to 1 (Fig. 4.3.1). Therecords in each set-are the saneseismometer outputs, code nameof which la Indicated at thebeginning of each trace. Thetop traces, marked 1, arecompared with the lower onescorresponding to known explosionswhose regions and dates are asfollows:(a) 1: Off East Coast of Kamchatkaearthquake (8 Dec 75>; 2,3 and4: Aleutian IS explosions (29Oct 65, LONGSHOT; 2 Oct 69,MILROWf 6 Nov 71, CANNIKIN).
(b) 1: Afghanistan - USSR borderregion earthquake (1 Apr 76);2 and 3: Eastern Kazakh explo-sions VI Aug 75 and 15 Jan 76).
(c) U Afghanistan - USSR borderregion earthquake (2 Apr 77);2 and 3: Eastern Kazakh explo-sions (20 Feb 75 and 27 Apr 75).
<d) 1: Lop Nor underground explosion (14 Oct 78); 2 and 1: LopNor explosions (22 Sep 69 and 17 Oct. 76).
(e) 1: Western Kazakh explosion (18 Dec 78); 2 and 3: WesternKasakb explosions (29 July 76 and 17 Oct 78).
(f) 1: Hokkaido earthquake (22 Mar 79); 2 and 3: Central Siberiaexplosions (5 Nov 76 and 84 Aug 78).
(g) 1: Romanian earthquake (31 May 79); 2: Southwestern USSRexplosion ( 3 Oct 72).
(h) 1: Southwestern USSR explosion (A Oct 80); 2: Near CaspianSea explosion (30 Sep 77).(1) 1: Central Siberia explosion (1 Nov 80); 2 and 3: CentralSiberia explosions (20 Aug 77 and 6 Sep 79).
4.4 Synthesis of P-Wave Soiamograms from Earthquakes
(A.R. Banghar)Synthesis of P wave •elsmograms from earthquakes it
continued. A computer program is being developed for consider-ing the effect of propagating circular faults on P wave aeis-mograms. This program together with previously developed com-puter programs will enable us to study the differences, if any,In wave forms of P seismograms due to circular and rectangularpropagating faults.

- M -
4.5 Data Bequests for Research and Development Purposes
(lt.N. Bharthur and A.O.V, Frasad)
Special requests from national agencies often involvenew problems of data formatting to meet their coaputatonalrequirements. BHU was supplied with digital data of 120 eventsfor their H 4 D work, for which the programs ware developed atGauribidanur array station.
•.6 Automation of the Daily Calibration
(M.K, Bhat, V .S. Kamath and D.S. Rao)
Till recently, the daily calibration of the SF systemwas being done manually, selecting different field instrumentsand displaying on a monitoring unit using mechanical switches.To reduce the work load of the operating staff, an automaticcalibrating unit, as shown in Fig. 4.6.1, is built to carry outdaily calibration job «t the pre-selected times. The time pulses
TVWMN
LLTHIIft OCCOMR
MUCTMMtleilHMIATM
AN* M M TSEUCTOI
M M *CMCWT
TfMffte n PUT
TiMMO DIAGRAM
i_
f i g . 4 .6 .1 : Block diagram of automatic calibrating unit
from primary standard clock ar» gated in such a way that a sharppulse will be generated at time 08:40 Hours (GMT) to start thecalibration sequence. The same unit is used to generate 3pulses at 7:30, 8:30 and 15:30 Hours GMT to trigger the stationsiren too.
The stipulated time pulse triggers the pulae -detectorand hold circuit, and actuates the timer. The timer produces

- 67 -
timing pulses as shown in the timing diagram. These are counted,decoded and fed to channel selector. After sequentially calibra-ting all the twenty channels of the array (two at a time), theunit is made to reset. False trigger eliminator takes care elltypes of spurious triggers generated either during power failureor power resumption.
4.7 Magnetic Tape Controller
(S.S.R. Bora end A.O. Kulkarr.i)
A tape controller is developed for PT 7 track deck toacquire the data from the digital telemetry system.
The buffered tape control unit interfaces between digitaltelemetry system (described separately)'or any other digitaldata source, and PI 7 track deck fitted with formatter and dataelectronics.
The buffer contains a dual block storage of 2046 bytescapacity per block and permits simultaneous loading of oneblock while transferring the data from the second block to mag-netic tape.
While writing the data block on the tape, If an erroris encountered (either parity or ACK from the MT is not received),the error flag Is sot and the data transfer of that block laskipped. Rewriting logic is being developed to take care oftape error. The transport itself writes the LRCC character inbetween the records and this is done by delaying the stop commandby 25 msec immediately after the data transfer to MT Is over.
In addition to the buffer controller, MT controllerincludea the generation of write on* block, error checking,EOT detection and rewinding, ready, load commands.
The Timing diagram is shown in fig. 4.7.1.
The block time is variable (either 2.5 sec, 5 sec, 10 or20 sec ). At the start of the block time, 48 bytes corres-ponding to station Identification and timing Information areloaded into the buffer at the highest writing speed (600 nsec)and rest of 2000 bytes are loaded with the seismic data at thedesired writing speed.

*-». n n nn
u u
. 4.7.1; rising dlagraa for aagnetie tap* controller
4.8 Digital Teleaatry
(8.S.R. Bora and A.O. Kulkarnl)
Tha digital Taleaetry Syatea conaiata of an aneodarat tha pit and a decoder at tha lab and. Tha encoder conaiataOf an analog to digital eonvartar, a progranaar, a aync ganara-tor and a parallel to aarlal eonvartar. Tha aaiaaic signalla aaapled and eonvartad into 12 kita and thaaa ara aarialiaadwith a ajrnc pulaa for tranaaiaaion. Tha FH Carrier Is 5 Xffa.Th* daeodar eonaiata of a deaodulator, aync extractor, aaarlal to parallel converter and a digital to analog converter(DAC).
Tha 5 KH« aodulatad algnal la daaodulated and tha ayncpulae ia extracted for proper aynchroniiation with tha trana-altter. Tha aerial data ia converted into parallel data beforeit If given to a DAC.
In tha earlier report /I/ we had aantionad about arrorcoding and tha correction to ha carried out. Tha praaent ayateacoaprlaee of error coding , detection and a atatlon addraaa.The bit duration ia changed froa 3.3 aaae to 1.67 aaac toaccoaao6ate 30 bita inatead of 15 blta. Data bita are increaaedfroa 12 blta to 16 blta (aynchronlaatlon 3 blta, atation addreaa6 bita and arror coding 5 blta). Tha arror coding utiliaaa thafaaoua Boae-Chewdary Security code (BCS) with a polynoaiealX5+X4-1 and la iapleaenteii with aodulo 2 addition (XOR).
larllar, tha aignala wara tranaaitted by overhead eablaa.
- if-
A wireless telametry system is now developed. The formatis RZ and on-bit duration is 0.83 msec and offbit duration is.415 msec. The duration of these pulaas will modulate thaVHF transmitter. Tha synchronisation pulse is extracted byMissing pulse detection logic.
Reference
1. Bora, S.S.R. and Kulkarni, A.G., Neutron PhysicsDivision Report for the year 1980, BARC-1134,pp 70 (1981).
4.9 Rockburat Hesearch Project; Phase II Studies
(S.S.R. Bora, A.0. Kulkarni and K,R. Subbaraau)
Work on phase II of rockburnt research project in colla-boration with BGML has been started. In this phase the sensorswill be put close to actual mining areas. Plans have alreadybeen drawn for the fabrication of various electronic circuits.Preliminary nolae survey waa conducted with a prototype Instru-ment to measure the ambient noise in the phase II workinga:'eaa. Experiments were also conducted to assess the suitabilityof the existing cable to be used in this phase.
4.10 Some Examples of Detection of PcP Signal from Earthquakes
(V.G. Kolvankar, S.K. Arora and Tapes K. BasuJ
Unlike in the ease of explosions, it is observed thattha PcP signal in earthquake records is difficult to detectbecause it is masked by the P-wave coda. Since apparent velo-city of PcP is large (it varies from few tens of km/see atteleseiamic distances to few hundred km/aec at small epi-central distances), beaming this signal requires small samp-ling Interval of the order of about 10 milliseconds to Improve5/N of PcP. The digital data available from GBA is sampled•very 50 milliseconds, and it is found that this sampling rateIs not adequate to carry out S/N improvement by phase summation.Hence the beam forming unit (BFU) which was developed earlier/i/was employed to detect this phase. The BFU incorporates aprovision to write the digital output on a magnetic tape forfurther processing of the summed records, two typical examplesof PcP detection in earthquake records are presented inrig. 4.10.1 where the PeP algnal can be seen clearly above thebackground aa compared to the original signal.

- 10 -
MUM -II «-
•*
«*•*,«,(« M mm*
Fig. 4.10,1: PcF aignala phaa* aummtd ualng BFU.
1. Kolvankar, V .0. and Nadra, V.N., Neutron PhyaleaDivlaien Rapert for th« y«ar 1980, BABC-1134,p. 65 (1981).
4.11 Encoding and Decoding Circuitry for Modified Millar Coda.Manchester Coda and Biphase M Code
(V.O. Kolvankar and V.M. N*4re)
These three eodea are used in handling high densitydigital signals. The modified Miller code is the most recentlyavailable code suitable for recording digital signal on anultitrack analog tapedeck at high bit rate and also for multi-core cable telemetry applications. The other two codea a~eused mainly in wireless telemetry of digital data. These codeaare intended to be used for handling seismdloglcal data invarious applications.
The codes are illustrated in Fig. 4.11.1.
tit. 4.11.1: Illustration of codes
(1) Millar Coda: Logic '1' is represented by a transition atbit call. Logic '0* ia represented by a transition at and

of the call If followed by •0*. This transition is eliminatedlr next bit is 'I1.
<2) Modified Miller code (n2): This code ia similar to Millercode but with additional rules. All possible binary patternsfall into one of the following classes*Class A: 1,11,111, -—(i.e. any number of logic 'V In a row)Class B: 00,010,01110 -—(i.e. a pair of logic '0fs or a pairof logic 'O's separated by an odd number of 3ogle '1's)Class C: 0110, 011110 — — (i.e. a pair of logic '0's separatedby an even number of Logic M'a)
Rules for encoding m code are the same for claes A andclass B data pattern. In class C pattern, the transsition forlast logic '1*8 are eliminated.
(3) Manchester code (Split Phase): Transition occurs at thecentre of every bit period. Logic '1' is represented by '1'level with a transition to the '0' level. Logic '0' is repre-sented by a '0' level with a transition to the '1' level.
(4) Biphase M Code: Transition occurs at the beginning ofevery bit period. Logic '1* in represented by a transition atmid bit cell while Logic '0' has no transition at mid bit cell.
Encoding and decoding circuitry have been built for thecodes (2), (3; and (A).
4.12 Multichannel Analog Data Acquisition Syatem for Field Use
IV.Q. Kolvankar and V.N. Nadre)
This system comprises of a F. M. recording unit, a multi-channel tape unit and F.M. reproducing unit. P.M. record unitcontains a twenty-four channel pulse ahaper circuitry. Eachchannel provides 0 C power to remote sensor unit connected bya pair of cables and receives conditioned aenaor signal in F.M.form, shapes it and drives the tape head. The record unit alsocontains a twelve channel frequency modulator for modulationof time codec, error correction channels and the signal fromnear sensors which ant connected directly after signal condi-tioning. Reproduce unit comprises ot twenty-four channelpreamplifier which provides 80 to 100 db gain followed by F.M.demodulatora giving analog data. In the record unit, totalthree plug-in boaro? (two for pulae shapera and one for modula-tor) are incorporated. The reproduce unit consist of total fourplug-in boards. Theae few boards provide simplicity of opera-tion minimum lnterboard wiring and compactness.
Multichannel Low Frequency Analog Signal RecordingCommon Track of an Audio Tape Usiny Frequency Dlvlaand Multiplexing (F.D.M.) Technique '
(V.0. Kolvankar and. V.N. Nadre)

The recording of low frequency analog signal is usuallycarried out by frequency modulating the signal and recording iton a tape at a speed which accommodates the band of sign«l(P.M. carrier + deviation). The cboic* of centre frequency lamads on the frequency band of the data and generally chosen asfive times that of the maximum frequency present In the data.If an audio tape-recorder in used for recording this data, theentire band of frequencies (50 hz to 14 khz at normal speed)could be divided into different nub-bands in which differentF.M. data channels could be accommodated. The fie. 4,13.1
HttVUnfulHVOUtWI
.IM0flDWI.M0.0t-
MODIC N100hl
MOO II-
coivtme*
CONVtftltH
h m hiOCMOO
CPM)I)M
IITthtH i r r MHOOcrtMtu
M»f
_• ' Pr —
Ullihl1 "•'**» 1 « w >
HPF CKMOO I OK
4.13.1; Knltichannel an«)o,? data recording on asingle track us.iiip FOM technique
shows a block diagram of such a system where six F.M. carriersare linearly added and recorded on a corrmon track. In thissystem, the minimum carrier frequency chosen in 100 hz andother frequencies are in geometrical progression with commonratio 2.5. With this arrangement, upto *_ 30% deviation ofindividual channel is permitted without "any cross-talks withadjacent channels. The frequency band of each modulatingchannel can be DC to 1/5th of carrier frequency. Thus for thesix channela the signal bands vary from 0-20 hz to 0-2 KHz.
In reproduce mode the composite signal is passed throughdifferent 8th order band pass filter which separates out theseF.M. carriers (A>72 db. for two adjacent carrier frequencies)which are demodulated to piv* the actual data. The minimumdynamic ran^e over the signal band is 40 db.
For common signal band of DC to 20 hz for all six channelsthe demodulator low pass filter could be adjusted for 20 ha.In this application, the dynamic range of all channels can be

improved to 55 db with error correction technique.
A twelve channel record and reproduce system is builtwhich can be used with any stereo cassette or spool audio tape-recorder and is most ideal for field applications.
4.14 On the Problem of Enumeration of Hooted Trees
(O.S. Murty)
A novel approach to the understanding of earthquakefrequency-magnitude relation was introduced by Otsukft /1/ whostudied Monte-Carlo model of earthquake processes by simulationof a neutron chain reaction. In this theory, one faces a problemof enumeration of rooted trees characterised by n, the number ofnodes| and m, the number of branches at each node as shown intig. 4.14.1. The enumeration problem WAS solved by other
Fig. 4.14.1t A branching model forearthquakes. The number of distinctrooted trees with sane number ofnodes are enclosed in circles.
workers for the case of binary rooted trees (two branches at eachnode /2/. The general problem with m>2 at each node has notbeen solved. Using combinatorial argument a solution was obtain-ed. Later, the result was rigorously proved. The number ofrooted trees is given by
It can be verified that the number of distinct rooted trees in'the figure agrees with the above formula.
Keferencea
1. Otauka, M., J
2.
Phys. Earth. 20 35 '1972).
Reingold, E.K., Nievergelt, J.,Combinatorial Algorithms, Theory(Prentice Hall), 90 (1977).
Narsingh beo,id Practice
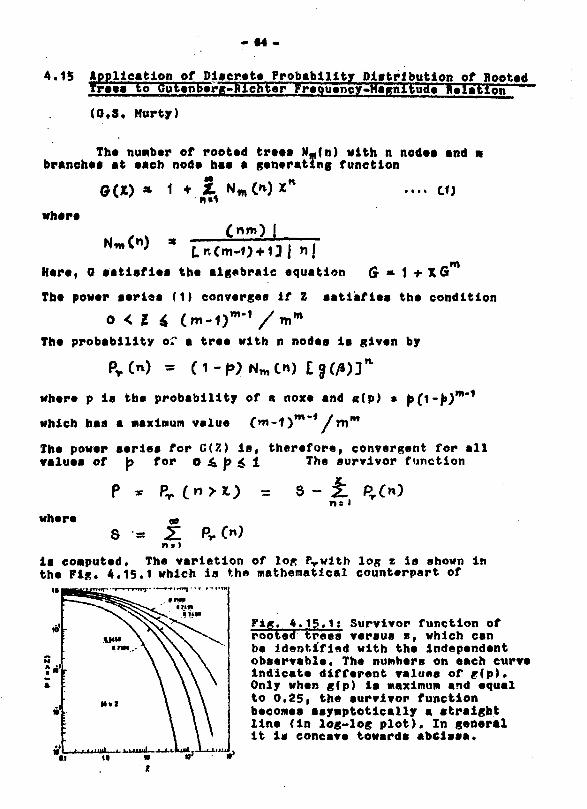
- «4 -
4.15 Application of Discrete Probability Distribution of BootedTrass to G u f nbarg^Blchter Frequency-Magnitude Halation
(0*3. Murty)
Tha numbtr of root act traaa N.(n) with n nodaa and nbranohaa at aaeh noda haa a generating function
Z. ctj
whereCnm) I
nlHare, 0 satisfies tha algebraic equation Q * 1 + X G
Tha powar sarlaa (1) converges if Z satisfies the condition
Tha probability or a traa with n nodaa ia glvan by
irhara p is tha probability of 8 nox* and «(p) s b(1-|»)m"1
which has a maximum value ( m - 1 ) m " f / m m
Tha powar sariaa for G(Z) is, therafora, convergsnt for allvaluaa of p for 0 4 H 1 Th« survivor function
n=whara 00
s = Xla conputad. The variation of lo* Fvwith log z is shown intha Fig. 4.15.1 which is the mathematical counterpart of
Fig. 4.15.1: Survivor function ofrooted trees versus z, which canbe Identified with the independentobservable. The numbers on each curveindicate different values of g{p)»Only when g(p) ia maximum and equalto 0.251 the survivor functionbecomes asymptotically a straightline (in log-log plot). In generalit is concave towarda abclssa*

- 65 -
Outenberg-Richter(G-R) frequency-magnitude relation if weidentify Z with the amplitude of seismic signals. It Is appa-rent in this figure that the usual linear form of G-R relationis obtained only in the limiting cases when g(p) is a maximumand equals 0.25 for m*2. In general, this relation is concavetowards X-axis. It is tentatively suggested that the ampli-tude distribution of Koyna tremors observed at OBA are slowlytending towards a distribution of lower concavity.
4.16 ^rther Studies >n » Statistics of Koyna Tremors
(O.S. Hurty snd H.S.-i ..irma)
The distribution of amplitudes of Koyna tremors recordedat GBA for the period 1968-80 was re-examined to find out thestationarity of the energy release pattern. This was done intwo ways: (1) by comparing the cumulative frequency distributionof the amplitudes in the .^riod 1968-1973 with that of theperiod for 1968-HO. The results are shown in Fig. 4.16.1,where it is seen that there Is a tendency for the distributionto become less concave as a function of time. In othar words,during the period 1973-80, there were relatively more tremorsin the low amplitude (1 mm) and high amplitude (100 mm) comparedto intermediate amplitude (20 mm). (2) The cumulative energyfor the period 1968-80 was computed and is shown in FIR. 4.16.2.
. m.tsm _ ... — J4.16.2; Cumulative
energy release pattern pfKoyns tremors from 1968
««••" as a function of time.fig. 4.16.1; Cumulative frequencydistribution of the amplitudesof Koyna tremors from 196ft to1973 and 1968 to 1980.
Here it Is seen that the detailed pattern of cumulative energyvariation for the period 1968-1973 is not the same as the patternfor the period 1973-80. Nevertheless the average behaviour,ofcumulative energy release pattern can be represented by a t*dependence.

The tentative conclusion of the study is that one canexpect large intervals of apparent quiescence (with minortremors) followed by a few large bursts, thus making the fre-quency-magnitude distribution less and less concave. Thisconfirms the theoretical deduction obtained In section 4.15by application of discrete probability distribution of rootedtreea to Gutenberg-RJenter frequency-magnitude relation.
4.17 Fracture as a Time Depending Topology of Inclusion*
(O.S. Murty and G.J. Nair)
Whether it is * minor earthquake in an underground mineor a disastrous earthquake somewhere in the earth, the sequenceof events proceeding this catastrophic manifestation is ofinterest both from the point of view of physics as well as fopdesign of shock-resistant structures. Premonitary indicationof impending fracture is of rreat practical value. A model ofhost medium and inclusion is developed to estimate the effectof void volume fraction on the microscopically observable para-meters like velocity and attenuation of acoustic waves. Varia-tions in the attenuation can in some cases be superior indica-tors of impending catastrophy as compared to velocity variations.
4.IB Depth Estimation Using Multistation Data
(Falguni Roy)
Depth as computed from the first arrival times (levelI depths) of the signals at teleseismlc stations remains anuncertain parameter for a large number of events. Therefore•n applicable procedure for better estimations of the sourcedepth will be desirable both for the discrimination betweenearthquakes and explosions as well as for the geophysical under-standing of earthquakes.
A depth estimation procedure using waveform data has beandeveloped to identify depth phases by analysing multistation dataIn various ways including' deconvolution, prediction errorfiltering and spectral analysis of the signals. In the absenceof such observable phases, other methods based on S~F, ScS-P,SKS-P traveltimes are tried, to get an estimate of the sourcedepth. A detailed description of the depth estimation procedure•long with results and discussions is given by F. Roy /I/.
The procedure was applied to waveform data collected fron•bout 30 globally distributed stations for a period of two weeks,from October 1 to 15, 1980. The digital data were analysed atthe National Defence Research Institute, Stockholm, a* a part

- »7 -
of CoMon Data Base Experiment (CDBS). During this period, 162events In tha magnitude rang* 3.5 to 6.2 were defined from lavelanalyaia. For 120 of these events, it was possible to estimatetha depths using this procedure as seen in rig. 4.18.1. Depthcould ba estimated in some casas for events with Magnitudesof 3.7. The applicability of the procedure was 100k for theevents with m b>4.8 and SB* for the evente with m D> 4. Theuncertainty of deptha obtained fro* the analysis of waveformdata is estimated to ba around 10% or less. A comparison ofU30S and CDBB level I depths with laval XI (aetual waveforms)depths indlcatea that it will be naeaaaary to have at least onelocal station ( A < 10°) among tba level I data to obtain gooddepth estimates from level I data alone. From the figurea4.18.2 and 4.16.3 , it becomns clear that USQ3 deptha ware ingood agreement with lavel IX depths. This was so, baeauae in
tin. 4.18.1: The number of eventsFor which level IX depth estimationswere possible as a function ofevent magnitude.
A-
Fig. 4.18.g; Comparisonor USOS and level IIdepth estimates.
Fig. 4.18.3* Comparison ofLevel II and Level Idepth estimates.

- 68 -
tli* e«*» of USOS, the local station condition was fulfilled•o*t of the time since it used a large number of stations, whereasCOBB level I estimates were based on a smaller number of stationsand on many occasions no station was at a local distance fromthe event. Data from a denser global network would thus berequired to obtain better level I depth estimation. It has beenseen that S waves can contribute significantly to improve esti-mations of source depths.
Reference
1. Roy, Falguni, Common Data Base Experiment-Depth estima-tion using multistation data, Forsvarets ForskringsanstaltStockholm, Report, 1982 (in press).
4.19 Data Compression by Auto Regression (AH) Method; Some CaseStudies •
(Falguni Roy and G.3, Murty)
In many geophysical applications, the problem of digitaldata preservation is frequently encountered. Large scale preser-vation of digital data poses problems of storage and of increa-sing cost.
A method based on AR modelling of time series has beenfound to be very successful, in solving this problem. This methodessentially attempts to reconstruct a given length of time seriesUsing much smaller number'of samples of the same time serieswhile retaining a high degree of correlation between ariglnaland reconstructed time series. Details of the method is givenby Roy and Murty /V.
Four examples have been illustrated in Fig. 4.19.1, toshow the effectiveness of the method. In each ease the reductionfactor (i.e. the number of samples in the original time seriesdivided by the number necessary to reconstruct the time series)and the correlation coefflcent of the original and the reconstruc-ted time series are indicated.
Reference
1, Roy, F, and Murty, G.S. , Ann. Inst. Stat. Math.,34, 181 (19S2).

JM.4KM.N9
M.tiO-0.997
•a9.tlOkO.9W
Fig. 4.19.1: Lower trace* are original tint* serins whereasupper tracts are reconstructed ones. Reduction factor (R)and the eorralation coefficient(c) In «ach east ara indicated.
4.20 Saiamotectonie Studlaa of the Peccan Plateau
(H.S.S. Sharma)
Seismic epicenters upto a distance of about 500 km fromOauribidanur for all the data recorded over 10 yeara from 1968onwards were plotted on the lineament map which was based on theLand Sat Imageries. Correlation of the lineaments with thetectonic structure and well-studied features of faults and fis-sure zones in various parts of the region is essential forinferring any correlation between the lineaments and the epi-centers. By the study of the distribution pattern of the epi-centres it may also be possible to discover some of the unknownor concealed faults.
A preliminary study in this direction reveals that thesel&nogenic regions in the southern part of the peninaula followan arcuate pattern demarcating the two main tectonic provinces,the cratonlc type green-atone faciea consisting of Dharwar meta-•edimenta associated with Peninsular gnelsaea to the north, andthe high grade granulite fades consisting of eharnockite-khondallte group of rocks to the south (Pig. 4.20.1). A similardemarcation continues along the Rastern Ghats, where seismicepicenters are observed. In these structural provinces, deepfaults and fractures with ultrabasics carbonatltea and alkalinecomplexes are reported by many worker*. It is poasible that•on* of these faults are selsmically active, which la significantla respect of many engineering prebleps.

- 70 -
^
•MM
. : , * >GBA ;,
•CH.;... -T-.'.1
•CfMttlM
V*"T<" *.-•«"*' »
4.20.1; Epicenters of earth tremora recordedat Gaurlbidanur between 1968 and 1977.
4.21 Siting Nuclear Power Planta
(Ran Datt Sharaia)
Conputer software for analysing earthquake data to deter-•In* earthquake occurrence aodela, which could be utilised forestimating design basis ground motions for candidate sites, wasdeveloped. The earthquake frequency-Magnitude relationship ofGutenberg and Richter namely: log N « A-bM was investigatedfrom the pont of view of estimating earthquake risk at a proposedconstruction site. Olobal earthquake data was subjected to •two alternative methods of analysis for estimating the A and bparameters In order to examine the aelsmicity of a region* Aprobabilistic approach or analysis to estimate the probableground motion (at a site mnder Investigation) with specifiedreturn period v*» formulated.

- 71 -
4.22 Beam Forcing Unit as an Aid to Study the Slowness of thefleisalc Signal* • ""'
(Raa Oatt Sharma,.V.O. Kolranlcar and V.N. Nadre)
B«aa forming unit which provided phase shifted arraysummed outputst corresponding to sight sets of ths "Red" and"Blu»" tias lags (TR and TB), thereby snhaneing ths signal tonoiss ratio by about 15 db for a twenty ehannsl sua, was addsdwith X " iZB(point to point product) feature to furthsr snhanesths signal to noiss ratio with diffsrsnt Tl, TB eoabina'tioa.Dlffsrsnt phass rsloeitlss ean bs prograaasd for spsclficaiiauths. Pig. 4.22.1 shows a typical processed rseord froa ths
Fig. 4.221; Processed record,obtained using the BFU, toillustrate its effectiveness indemonstrating ths complexityof the first arrival. The eventwas recorded at OBA on Oct 24,1979 from the Western Kazakhregion
Vestsrn Kazakh region. The pattern of ZB xXR traces forvarying apparent phass velocities indicates the complexity ofthe first arrival. The relative slowness of the arrivals inthe seismic wavetrain may also be assessed on the basia of theXR x£B pattern . Analysis of a large number of events onthe basis of 'the apparent velocity of the first and laterarrivals will be helpful In delineating the fine structure ofthe travel tiae curve.
4.23 Tripartite Microbarograph and Seismic Unit
(T.tf. Sridharan and P.C. Hitra)
Modifications were carried out in the Telemetry of thealcrobarograph and seismic units eliminating the intermediaterelay point . Solar panels installed at the field stationsatisfactorily energlseo all the field equipment at the stationand also resulted in overall improvement In the reliability

- 72 -
and noise-free operation of the data channels originating fromthat station.
The Microbarograph network with 3 sensors in the MPBand(3-110 seconds period) and one in the BF Band(30-500 secondsperiod) was continuously operated luring the year providingambient pressure fluctuation data in th« above bands withabsolute time information. The Seismic Unit, started initiallywith two sensors, was augmented with a third sensor point atan intermediate point.
4.24 Modification to r>iq Tape Deck
(K.R. Subbarantu, S.S.R. Bora and A.G. Kulkarni)
TD 10 tapedeck has been used for acquisition of dataas well as for transcription of event data in the 1st phase ofBOML Project. The tapedeck speed could originally be alteredusing a rotanoid switch, which is a mechanical contrivance. Ithas been observed that after several rounds of operation thebehaviour of the mechanical switch became erratic. Thisresulted in non-availability of certain speeds which wereessential for fast replay and transcription.
In order to overcome this, the problem was carefullystudied by observing the operation of rotanoid switch. It wasseen that at certain times, the switch loosened the mechanicalsynchronisation which resulted in the malfunctioning of thedeck. So a small electronic circuit was developed and wasInstalled on a trial basis on one of the decks. After observingits operation over a certain period, 2nd tapedeck was alsomodified. Now both the decks are functioning normally withoutany problem.•
4.25 Attenuation and Velocity of Waves Propagating Along aSteel-Steel Interface •
(Vijai Kumar)
An experimental set up was used to measure attenuationand velocity of the elastic waves propagating along a plane •steel-steel interface /I/. In these measurements the Interfacelength was 3 cms and the transducers were kept about 6 cms•part from each other. The bonding condition at the interfacewas varied by subjecting it to steadily increasing pressurefrom zero to about 100 tons of load and the correspondingtime shifts as well as the amplitude changes of the pulse weremeasured at various loads. The velocity of propagation could

be measured to an accuracy of 0.1% using a surface wave wedeetransducer of 5 MH* with this set up. The longitudiaal wavespeed, the shear wave speed and the density of the steel type.EM 24 used in thla experiment were 5.91 Kms /sec , 3.21 Kms/sec and 7.74 gins fe.c. respectively In the unstressed stats.Til* mating surfaces of both the steel blocks were groundpolished upto average surface finish of about 8 microns.
These velocity and attenuation measurement are plottedin Fig. 4.25.1 as a function of extern 1 load normal to the
interface. It was visuallyobserved that the materialof the blocks yielded whenthe load was increasedbeyond 25 tons thus distur-bing the physical configure-t.ion of the interface. Itis seen from the figurethat the interfacial wavespeed has a value of2.97 Kms/sec at zero load.The wave speed increaseswith load to a maximumvalue at 60 tons of load,after which it decreasestill the maximum load of
Fig. 4.25.1: Variation of experi-mentally observed interfacialwave velocity and the attenua-tion with external load atsteel-steel interface.
100 tons .. The attenua-tion curve shows a peakvalue at about P tons ofload.
These results wereinterpreted in the frame-work of a model /2/ whichpredicts the velocity and
attenuation behaviour as shown in Fig. 4.25.2. For thepurpose of comparison between theory and experiment, the
Fig. 4.25.2; Theoretical,variation of real (Re) andimaginary dm) parts of theinterfacial wave speed C, atsteel-steel interface withbonding parameter f .
M M * I

-74-
nuuvt m nmtHmV "I/M*
eurvea of rig. 4.25.1 and4.25.2 are plotted in Fig, 4.25.3thereby ellalnating the need of aneapiricsl relation between theload and the bonding paraaater.It la Man that the experiaentalvaluea of attenuation are anallapthan thoae predicted by thetheory by a factor of 6.2 thoughthe paak valua of attanuatonoccupa at about tha axpaetadvalua of raloclty. This indleataathat fopoaa pthap than viaeouaapa at play in tka axparimantsinoa wa hava ohangad tha bondingcondition at tha intapfaea byaxtapnal load* It aaama thattha fopcaa dua to Coulonb fpic-tlon ahould ilao ba takan 'intoaccount to axplain tha paaultaof thia axpariaant.
axpapinant U^J ragardingtha vapiation of attenua-tion with valocity ofIntapfaclal wavaa. Thacofpaaponding raluaF ofaxtapnal load and bondingpwamatar "f ara indicatadon an axia parallal tovalocity axia. APPOWindicataatha yield point.
Kafapancaa
1. Vijai Kumar, Nautpon Phyaica Diviaon Report fop the yaap1980 BARC-1134, pp72 M981).
2. Hupty. Ourajada S., rhyaios of Earth t PlanaaaryInteriora, JMf 65 (1975).
FiiLg. 4.25.3: Compariaonbetween theory (—•> and
4.26 Saiawic Inatruwentation
(Vijai. Kumar and H.L. Kotadia)
A couplete lndiganoua short pariod aelamic ayataalr olving a aelamometer, field aignal conditioning unit, Lab.aapllfiar unit alongwith indiganouHly available Helical druaraeordap baa baan developed. Thia ayataa will ba uaaful fopaatting up an independent aingle channel a»laaic aonitopingstation* Frequency Modulation aethoda are ua«d for the trana-

- w -mission of atlanlc algnala altbar through cablet or wiral«aa•quiptttnt, Tha •y*t«a provid«« narrow band (0.2 to 3cps),wld* band (0.2 to 30 cpa)( high gain and low gain independentchannels for multipurpoaa ••lanie aignal raeording.

- 7T -
5. APPENDIX
f i w n Published/Aecaptad fop Publication in SclantlficJournal! ate. .
1. Evaluation of Reactivity Bonus due to (n,2n) Multiplicationin Be/BeO H«fl«et«d 233u uranyl Nitrate Solution Systems,F.K. Job and M. Srinivaean,Accepted for Publication in Annals of Nuclear
2. Characterisation of Neutror. Leakage Probability, k«ff anaCritical Cora Surface Maaa Danaity of Snail RaaetorAsaambliaa Throufh trombay Crltieality Fornula,ki.il Kumar, M. Srinivnaan and K. Subba Rao,Aceaptad for Publication in Mucl. Scl. Eng.
3. Bubbla Worth Variation in Moltvn Pual Assanbliaa dua toNeutron Straaminr and Application of Trcmbay CritlcalityFormula,Anil Kuwar,Aecaptad for Publication in Nuclaar Taehnology.
4. A Modifiad Wignar Rational Approximation for Nautron Colli-aion Eacapa Probability from Bara Homogenaoua RaactorAaaembliaa^Anil Kumar,Accaptad for Publication in Nucl. Sci. Eng.
5. fualon Mautron Production from Low Energy Exploding Dautera-tad Flbraa,Anurag Shyam and M. Srinivaaan,Aecaptad for Publication in Atomkernenergie/Kerntechnik.
6. Nautrona and Hard X-Ray Emission from a Low Voltage PlasmaFocus,Anurag Shyam and P.K. Pal,Accaptad for Publication in Atomkarnonargia/Karntachnik.
7. Kinetic Stadias on a Repetitively Pulsed Past Reactor,S. Das,Accepted for Publication in Atomkernenergie/Kerntechnik.
8. An On-line Method for Tritium Breeding Studies in a Li-Blanket,O.P. Joneja, R. Hacker* and A. Mohsin*,Accaptad fc;> Publication in Nucl. Instrum. Methods.
* Institute for Reactor Development, Juelleh, Heat Germany.

- 78 -
9. Tritium Breeding Measurements in a Lithium Aluminate BlanketAssembly Using Thermoluminiscent Dosimeters.H. Sharabati*, R. Hecker* and O.P. Joneja,Accepted for Publication in Nucl. Inatrum. Methods.
10. A Neutron Diffraction Study of Glycyl-L-Threonine Dlhydrate,A. Sequeira, M, Ramanadham, H. Rajagopal and V.M. Padmanabhan,Acta Cryet. B37, 1839 11981),
11. Crystal and Molecular Structure of bis (4-Hydroxy-L-Prolinate)Palladium (II) Trihydrate,5. Sinn, V.M. Padmanabhan, Ft.P. Fatelf and T.N. Rar *nat . ,Accepted for Publication in Current Science.
•
12. Structure of Presynaptic Toxins: Crystallizatior . ?re-liminary X-Hay Diffraction Data on Notechis II-5. « resympticToxin Phoephalypaae,K.K. Kannan, S. Sinn, M. Ramanadhan and D, Eaker,J. Bioaciencea 3, 29 (1981).
13. Structure Refinement and Function of Human CarbonicAnhydrasa-B,K.K, Kannan and M. Ramanadham ,Int. J. Quantum Chen. XX, 199 (1981).
14. High Pressure Studies on a Prototype Omega Forming AlloySystem,Y.K. Vohra, E.S.K. Menon, S.K. Sikka and R. Krlshnan,Acta Met. 29 457 (19«D.
15. The Limiting Compression in Single Shocks for ap Metals.S.K. Sikka and B.K. Oodwal,Solid St. Conn. 38, 949 (1981).
16. Electron-Phonon Interaction and Deviations from Matthlessen'sRule at High Tempnratures,Surinder M. Sbarroa,J. Phys. F. Metal, Phys. J2» 2 3 6 7 (1981).
17. Evidence for a Tricritical Point in the Ferroelastic .Solid-Solution Series Pb3(F1 V 0.), ,V.K.Wadhawan and A.M.Glazer, x x * c
Phase Transitions 2, 75 (1981).
18. Studies of Quartz as a Secondary Ferroic >J.W. Laughner, V.K. Wadhawan and R.B. Newnham,Ferroelectrlcs 36, 439 (1981).
• Institute for Reactor Development, Juelich, Heat Germany
f Chemistry Division, BARC.

- 79 -
19. The Shape Memory Effect In PLZT Ceramics*V.X. Wadhatran, M.C. Kernion, T. Klmura and R.E. Newnhan.Ferroelectric* 37., 575 (1981). '
20. Model for the Equation of State of Condensed Hatter in the"Intermediate" Preaaure (about 0.5 - 10 TPA) Region.B.K. Godval, S.K. Slkka and R. Chidambaram*Phya. Rev. Lett. 47., 1144 (1981).
21. Structural Aapeeta of Alpha-Onega Transformation in Oroup IVTransition Metala and Alloys,T.K. Vohra, S.K. Sikka and R. Chidambaran,Bull, Mater. Sci. 3, 109 (1981).
22. High Pressure X-Fay Studies,S.K. Sikka,Trans. Indian Inst. Metala 34, 411 (1981).
23. Shock Hugonlot Equation of State of Thorium,B.X. Oodwal and S.K. Sikka,Accepted for Publication in J. Phya. P. Metal Pbys.
24. /S -to Transformation Under Pressure and Stacking SolitonModel for Diffuse Omega Phase in Ti-V Alloys,S.K. Sikka, Y.K. Vohra and R. Chidambaram,Accepted for Publication in Solid St. Comm.
25. Statistical Analysis of Positron Annihilation and ComptonProfile Experiments Using Normal Probability Plots,Surlnder M. Sharma. and S.K. Sikka,Accepted for Publication in Fhilos. Mag.
26. Omega Phase in Materials,S.X. Sikka , Y.K. Vohra am* R. Chidambaram,Accepted for Publication in Progress in Materials Science.
27. Ferroelasticity and Related Properties of Crystals,V.K. tfadhawan,Accepted for Publication in Phase Tranaitions.
28. A Study of Rockburats Inaide the Goldmines at Kolar inSouthern India,S.K. Arora,Ind. J. Rock Mech, (in .jnrass}.
29. Source Depth as an Useful Parameter in the Discriminationof Earthquakes and Underground Explosions, TectonophasicsS.K, Arora, T.K. Basu and C.A. Kriahnan,(Revised Manuscript sent after referees's comments)
30. Love-Wave Propagation in a Layer Imperfectly Welded toHalf Space,A.R, Banghar,Journal of Pure and Applied Ultrasonics, 2, 71 (1980).
- 80 -
31. Fracture as a Tine Dependant Topology of Inclusions,G.S. Murty and O.J. Nair,Ind. J. nock Mech., (in. f>rasft) •
32. Seismic Velocity structure uaing Array Data,Hamdatt >Phjrs. of the Earth and Planet Int. g£ (1981),35 .
33. Common Data Base Experiment • Depth Estimation using Multi-station Data,Falguni Roy,FtJrsvareta Forskningsanstalt, Stockholm, Rapport (in press).
3*• Common Data Base Experiment-Progress Report on -Data AnalysisG.Barkeby, N.Bergkvist, O.Dahlman, P.Johansson, H.Ohlssonand F. RoyF&Vsvarets furskningsansta.lt, Stockholm, C 20431-T1, Nov. 1981.
35. Application of FPE Based AR Model for Signal Detection andDigital Data Compression;Falguni Roy and G.S. Murty,Ann. Inst, Statist. Math., (in press).
36. Influence of External Pressure on Interracial Wave Propagationat a Loosely Bonded Solid-Solid Interface,Vijaikumar and Gurjada S. Murty,I.E.E.R. Trans, on Source and Ultrasonics, (in press).
37. Attenuation of Interfacial Waves,Vijai Kumar and Gurjada S. Murty,CSIO Communication, Oct.-Dec, 1981.
BARC Reports
1. Trombay Criticality Formula for the Characterization ofNeutron Leakage Variations from Small Reactor AssembliesPart 1: Basis>Anil Kumar, M. Srinivasan and K. Subba Rao,B.A.R.C.-1120 (1981).
2. Trombay Criticality Formula for the Characterization ofNeutron Leakage Variations from Small Reactor AssembliesPart 2: ApplicationjAnil Kumar, M. Srinivasan and K. Subba Rao,B.A.R.C-1121 (1981).
3. Synthetic Selsmograms-I: Transfer Functions for Synthesisof P-Wave Seismograms from Explosive Sources and TheirParametric Study,A.R. Banghar,B.A.R.C.-617(1980).

- u -
4. Synthetic Seismograits-Xl; Synthesis of Amplitude Spectraand Seiamograma of P-Wavaa from Underground Exploaiona,A.R. Banghar.;B.A.R.C.-1085 (1980).
5. Synthetic Selsaograms-III: F»Wave Seiamograms fromEarthquakes,A.R. Banghar,B.A.RC.-1093fi980).
ft. Velocity and Time Lag Tablaa for Processing Cor* RaflaetvdP«>Phaaa in Array Saianograaa,S.K, Arora, T.K. Baau and B.N. Bharthur.B.A.R,C.-693(1981).
7. Infraaonie Noli* lackground Oyar Delhi Ration,T.V. Srldharan, Vijal Kunar and P.C. Mitra .•.A.R.C.-1123 (1981).
fapara fraaantad/Aecaptad for fraaantatlon at Sywpoala. Sawinara.confarancaa Etc.
1. Masnatically Imploding Fuaion Davieas,Anurag Shyaaj,Vorkahop on Laaar Intaraction vith Hatter,B.A.R.C.(Jan. 1961)*
2. On th« Thaory of Stationary Charged Particle Enaaablaain Strongly NonhomoRenaoua Aaimuthally Syimnatrlc MagnatieFl«lds,S.K.H. Auluck,Papar praaantad at tba Spring Collaga of Fuaion Bnergjr atICTP, Triaata (Hay 1981).
3. Comments on "Ba(n,2n) Cross Section Data in the Context ofFlsaion and Fusion Systems,P.K. Job, T.K. Basu, K. Subba Rao and M. Srinlvaaan,Vorkabop on Nuclear Data Evaluation, rroceeeing and Testing,Reactor Research Centee, Kalpakkam (Aug. 1981).
4. Remarks on the Validation of Nuclear Data Sets ThroughIntegral Criticality Paranetere>Anil Kumar and M. Srinivaaan,Workshop on Nuclear Data Evaluation, Processing and Testing,Reactor Research Centre, Kalpakkam (Aug. 1981).
5. Fusion Blsnket Heucronies,V.R. Nargundkar land M.P. Naralkar,Vorkahop on Nuclear Data Evaluation, Processing and Teeting,Reactor Research Centre, Kalpakkam (Aug. 1961).
*. Trltittn Breeding Measuremants in a L1A1O* BlanketValnic Lie.«ld Scintillation Methea,
- 88 -
O.F. Joneja, A. Mohsin*, G.E. Elkhani* and R. Hecker*.IV N*tl. Symposium on Radiation Physics, Patiala (Oct. 1961).
7. Optimisation Studies for Tritiun Braiding in Fusion BlanketsUsing Monte Carlo Code Morse,V.R. Nargundkar,IV National Symposium on Radiation Physics, Patiala (Oct.1981).
8. I D Fuelled Reactor for Neutron Radiography,CSt Paaupathy, M. Srinlvaaan, V. Anand Kumar! and N.Kannani,World Conference on Neutron Radiography (Dee. 1981).
9. A Proposal for a National Synchrotron Radiation Facility,A. Sequeira,Presented at 12th National Conference on CryatallographyOamania University , Hyderabad (Feb. 1981).
10. Neutron Diffraction Study of a Subatituted Ethylene:0
Sandhya Bhakay-Tamhane, A. Sequeira and R. Chidambaram,Presented at 12th National Conference on CrystallographyOsmanla University, Hyderabad (Feb. 1981).
11. L.S. Refinement Program for Cell and Orientation ParametersUsing TDC-312 Minicomputer,H. Rajagopal and A. Sequeira*Presented at 12th National Conference on CrystallographyOeaania University, Hyderabad (Feb. 1981).
12. High Precision Studies of Hydrogen Bonds by NeutronDiffraction (Invited Talk),R. Chidambaram |12th National Conference on CrystallographyOsmania University, Hyderabad (Feb. 1981).
13. On the Crystal Structure of the Steroid Estra Sulfone,S. Sinn and V.K. Padmanabhan , Presented at the 12th Nati«con£Crystallography, Osmania University, Hyderabad (Feb. 1981).
14. The Crystal Structure of Palladium-L-Hydroxy Froline •Trihydrate,T.H. PadManabhan, S. Sinh, T.N. Ranganathan and R.P. Patel,12th National Conference on Crystallography, OsmaniaUniversity, Hyderabad (Feb. 1981). '
• Fro* Institute for Reactor Development, Juelich, West Germany• Freej ••actor Research Centre, Kalpakkaa

-83 -
15. The Crystal and Molecular Structure of L nethionyl-L-Prollne tV.S. Yadava»12th National Conference of Crystallography, OsmaniaUniversity , Hyderabad (Feb. 1981).
16. X-Ray Diffraction Study of Triclinic Lysoxyne(HBW) at2A Resolution,M. Ramanadham, L.C. Sieker and L.H. Jensen >12th National Conference on Crystallography, OsmaniaUniversity, Hyderabad (Feb. 19t1).
17. Structure and Function of Carbonic Anhydrase. RestrainedLeast-Squares Refinement of Human Carbonic AnhydraseIsozyne B at 2A Resolution,M. Ramanadham and K.K. Kannan,12th National Conference on Crystallography, OsmaniaUniversity, Hyderabad (Feb. 1981).
13. Refinement of the High Resolution Crystal Structure ofHunan Erytbrocyte Carbonic Anhydrase C ,A.K. Ohara, M. Ramanadham and K.K, Kannan ,12th National Conference on Crystallography, OsnanlaUniversity,.Hyderabad (Feb. 1981).
19. Structural Implications in the Denaturation of Proteins,K.K. Kannan,12th Natonal Conference on Crystallography, OsnanlaUniversity, Hyderabad (Feb. 1981).
20. The Three Dimensional Structure of Satellite TobaccoNecrosis Virus at U\,T. Unpie, L. Liljras, E. Strandber?, Ivaara, K. Fridborg,C.B. Nordman, P.J. Lentz and K.K. Karnan,12th National Conference on Crystallography, OsnaniaUniversity, Hyderabad (Feb. 1981).
21. Structural Study of the Phase Transition in (NH^>2CuCl4.2H_O»Sandhya Phakay-Tamhane and B.J. Gabe,Presented at XII International Congress.of Crystallography,Ottawa (Aug. 1981).
22. X-P«y and Neutron Study of LikSO^ at Room Temperature:Search for Disorder,Sandhya Bhakay-Tamhane, A. Sequeira and R. Chidambaram,Presented at XII Intl. Congress of Crystallography,Ottawa (Aug. 1981).

- 84 -
23. Neutron Diffraction Refinement of the Structure of • Push-Full Ethylen«-C13HUOSN2 ,
, Sandhya Bhakay-Tamhane, A. Sequelra and R. Chidambaram9
Accepted for praaantation at XII Intl. Conferees ofCrystallography, Ottawa (Aug. 19.81).
24• Structure of Triclinic Lysosyme and lta Cu2* Complex «t2a Resolution*H. Remanadham, L.C. Sieker, L.N. Jenaen and B.J. Blrknex,XIX Congreas and Oanaral Assembly of tha InternationalUnion of Crystsllography, Ottawa (Aug. 1981).
25* Refinement of Carbonic Anhydraaa Xsosymee Band C at2A Resolution*H- Rananadhan and K.K. Kannan«XII Conpraaa and Ranaral Aasenbly of tha InternationalUnion of Crystallography, Ottawa (Aug. 1981).
26. Structure and Function of Freeynaptlc Neurotoxina: Notexinand Notechie II-5»K.K. Kannan, Hilda Cid, M. Rananadhaii, S. Sinb and S.Raaakunar.XII Congreaa and General Aaaenbly of the InternationalUnion of Cryatallography, Ottawa (Aug. 1961).
27* Charactariaation of Materials by Neutron Scataaring,R. Chidambaram and A. Sequeira,PT O C . of Int. School on 'Synthaais, Crystal Orowth andCharactariaation, NPL (Oct. 1981).
28. Comparative Study of Mosaic Structure in Crystala by Refine-ment of Extinction Parameters from Neutron Data and byX-Ray Topography*A. Seqiieira, H. Rajagopal and R. Chidambaram,Accepted for publication in AIP Conference Proceedings Series.
29. Ferroelastlc Phase Transitions,T.X. Wadhawan,XII Congreaa and General assembly of the Internationalunion of crystallographyf Ottawa (Aug. 1981)
30* A Semi-Empirical Equation of State for Metallic Solids,S.K. Sikka and B.K. Godwal,Nucl. Phy. and Solid State Phys. (India) 240,19(1981).
31. On the Equation of State of Condenaed Matter in theIntermediate (0.5 TPA - 10 TPA) Region,B.K. Godwal, S.K. Sikka and R. Chidambaram,Nucl. Phya. and Solid State Phys. (India)2*C,21(1981).

- Si -
32. Positron Annihilation Angular Correlation Study of ThermalCycled Uranium-1: Thermal Cycled Between Room Temperatureand 55°C,S.M. Sharma, B.K. Godwal, S.K. Sikka and R. Chidambaram,Nucl. Phya. and Solid State Pbya. (India)24C, 55 (1981).
33. A Powder X-Ray Diffractometer fop High Preasure Studiea,S.C. Gupta, S.K. Sikka, V.K. Wadhawan and R. Chidambaram,Nucl. Phya. and Solid State Phya. (India)2*C, 551 (1981).
34. Structure-Property Relationships in Materials,S.K. Sikka,in Seminar on •Materials Research' Nucl. Phys. * Solid StateSymposium (1981).
35. A Method for Decoding Frequency Modulated IRIO Tine Codes,V.Q. Kolvankar and V.N. Nadre,Symposium on 'Time and Frequency* at National PhysicalLaboratory, N*w Delhi (Feb. 1981).
36. Development of Low Coat High Performance Timing Systemfor Seismographs,V.O. Kolvankar and V.N. Nadre,Symposium on 'Time and Frequency1 at National PhysicalLaboratory, New Delhi (Feb. 1981).
37. Some Recent Investigation* of Rockbursts in Kolar GoldFields Using Seismic Data,S.K. Arora,Indo-German Workshop on Rock Mechanics, NGRI, Hyderabad(Oct. 198D.
38. Fracture as a Time Dependent Topology of Inclusions,0.5. Murty and G.J. Nair,Indo-German Workshop on Rock Mechanics, NGRI, Hyderabad(Oct. 1981).

Lectures Qiwn in Training Schoal Course. Workshop on Laaar~t'Xna»a Interaction andBomber tfnirersity
A. Training School Course
SI.No.
1.2.3.
B.
Name
S.C. GuptaV.K. WarfhawanB.K. Godwal
Workshop on Laser Plasma
Topic
Solid State ScienceSolid State ScienceStatistical Physics
Interaction (DAE, Feb. 1981)
No. ofLectures
14820
Batch
25th25th9.4 th
1.2.
S.K. SikkaB.K. Godwal
3. B.K. Godwal
C. Bosibay Onivrs i ty
1. T.M. fadaanabhan
Equation of State and Shock WavesEnergy Transport in Laser Produced
FlaaaasLaser Driven Shock Wave Experiments
Crystallography
32
8 (H.Sc.,(Biophysics))
i
s

Awards and Degree*
sirNo.
Mane Degree/Awarda title Research Guide
1. Anil Kumar
2. S. Das
3. Anurag Shyaa
. Raadatt Sharma
5* B.S.S. Rao
Ph.D.(Bombay University)
Ph.D.(Bombay University)
(Thesis submitted toBoabay University)
Studies on theVyoteaatics ofKeutron Multiplica-tion and Leakage InSnail ReactorAsaeablies.
Core Dynasties andSafety Analysis ofExperiaental neutronMultiplying Syst«sta.
Studies <m a LowEnergy Plasna FocusDevice.
Dr. R. Chidaabaran
Dr. f.K. Iyengar
Dr. R. Chldaabaraa
ISET Award for the On Znversioh of Slownessyear 1979 by Indian and Travel Tlae Data fromSociety of Earthquake Arrays" Bull. ISET,Technology,Roorkee Vol t£,(3)95, 1979.
H.S.dlT, Madras) A Multichannel Seisaic Dr. P.K. Iyengar •Data Acquisition Systea, Dr. T.C.T. Pi.Reddy

-88 -
NEUTROH FHrsiCS DIVISION STAFF
Dr. P.K. lyengar
Dr. B. Chidambaram
Director, Physics Group
Head, Neutron Physics Diyiaion
Purniaa Laboratories
1.i.3.4.5.6.7.8.9.10.It.12.13.14.15.16.17.18.19.20.21.22.
Dr.ShriDr.ShriShriShriShriDr.ShriDr.Dr.ShriShriShriDr.ShriShriShriShriShriShriShri
Neutron i
P.K. IyengarM. SrinivasanV.R. NcrgundkarK. Subba RaoK. ChandramoleshwarC.S. PasupathyD.V.S. Ramakrlshna
S. DasO.V. Acharya
O.P. JonejaTajcn X. BasuS.X. Sadavart*Jagir SinghP.K, JobAnil KumarAmirag ShyamJ.S. CoachmanM.R. Phisk*S.K.H. AuluckPrabir Kumar PalL.V. KulkarnlB.B. Oaikwad
( X-Ray Crystallography
1. Dr. R. Chidambaram2. Dr. V.M.- Padtnanabhan3. Dr. A. Sequeira4. Dr. K.K. Kannan5. Dr. M. Ramanadhan6. Dr. V.S. Yadavae7. Shri S.N. Momin8. Shri H. Rajagopal9. Smt. Sandhya Bhakay-Tamhane10. Shri S. Chakravarty11. Shri Vinay Kumar Bhatla12. Shri P.C. Fandey
Materials Physics
1. Dr. R. Chidambaram2. Dr. S.K. Sikka3. Dr. V.K. WadhaMan

- M-
4. Dr. B.K. Qodwal5. Dr. S.C. Oupta6. Dr. Y.K. Vohra*7. Shri S.H. Sharma
8. Shri M.S. Somayazulu
Ssiamology Section
Htad: Dr. G.3. Murty
Staff baaad at Bombay
1. Dr.-0.3. Hurty2. Shri H.S.si. Sharna3. Dr. S.K. Arora4. Or, Ramdatt Sharma5. Shri A.R. Banghar6. Shri Vljai Kumar Jain7. Shri G.J. HairB. Shri V.G. Kolvankar9. Shri ralguni Roy*10. Shri C.A. Krlahnan11. Shri Y.N. Nadre12. Shri Tapaa X. Baau13. Sbri H.L. Kot«din
14. Shri S.V. Sharma
Staff baaad owtaide Bombay
Delhi
1. Shri T.V. Srldharan2. Shri r.C. Mttm3. Shri Mahandra Singh
Oaurlbldanur1. Shri K.B, Subbarsmu2. Shri R.N. Bharthur3. Shri B.S.S. Rao4. Shri M.K. Ph»t5. Shri V.S. Kamath6. Shri A.G. Kulkarnl7. Shri A.G.V. Praaad8. Shri D.S. Rao9. Shri Moddurama10. Shri.T.J. Thoaas11. Shri N. Chowdappa,

- 90 -
Adminiatrativ Staff
1. ShPi K.W.W. Filial2. Smt, Santha Nair3. Shri ft.P. Rajaaakharan4. Shri P. Divakaran
On laava for poat-doetoral raaaarch work at Unlvarsityof Oxford, England from 30.3.1981
On laave for poat-doetoral raaaareh work at tha Univaraitataaaamthoehflchula-Padarborn, PRO from 1.2.1981
On laava to Hagfora Saiaale Obaarratory, NDRX.Stockholm, Swadan, froa 8.1.1981.