basin overview opics - north carolina quality/planning/bpu/bpu/catawba... · as they had in the...
TRANSCRIPT

1
NC
DW
Q C
ATAW
BA R
IVER
BA
SIN
PLA
N:
BA
SIN
OVE
RVIE
W
2010
RiveR Basin DescRiption
The Catawba River Basin, along with the Broad River Basin, forms the headwaters of the Santee-Cooper River system. This river system begins on the eastern slopes of the Blue Ridge Mountains in NC, flows through the NC piedmont to the NC-SC border near Charlotte, and continues to flow through South Carolina to the Atlantic Ocean.
The mainstem of the Catawba River is regulated by a series of seven hydropower reservoirs: Lake James, Lake Rhodhiss, Lake Hickory, Lookout Shoals Lake, Lake Norman, Mountain Island Lake, and Lake Wylie. Lake Wylie crosses the border of NC and SC. There are 3,005 miles of named and classified freshwater streams and over 60,000 freshwater impoundment acres within the NC portion of the Basin.
WateR Quality Data oveRvieW
Bi o l o g i c a l Mo n i to R i n g
Biological samples were collected during the spring and summer months from 2003 and 2007 by the DWQ-Environmental Sciences Section as part of the five-year basinwide sampling cycle. Overall, 91 biological sampling sites were monitored within the Catawba River Watershed. Of those 91 sites, 47 were benthic stations and 44 were fish community stations. Twenty-one of the biological sites were sampled for the first time during this cycle. Each site is given a rating or bioclassification of Excellent, Good, Good-Fair, Fair, Poor or Not Rated. Excellent, Good, Good-Fair, and Not Rated are ratings given to streams that are Supporting aquatic life. Streams that are given a Fair or Poor rating are Impaired and do not support aquatic life. A table listing each biological monitoring station and its respective ratings for the current cycle (2003-2007) and the previous sampling cycle (1998-2002) can be found in each Subbasin Chapter.
Figure 10 shows a comparison of biological ratings for sites monitored during both the current and past sampling cycles. The majority (43%) of biological sites were given the same rating during the current cycle as they had in the past cycle. Thirty-six percent of the biological sites improved their rating by one or more level(s) (e.g.: Poor to Fair or Good-Fair to Good) and 21% decreased in rating between cycles. The last row of pie charts in Figure 1 gives a comparison of the percent of sites that were deemed Supporting or Impaired based on the biological rating for each of the two cycles. The only sites compared for this analysis were ones sampled during both cycles.
chapteR topics £ Water Quality Data £ Basin Water Quality
Assessment £ Basin Issues £ Population & Land Cover £ Recommendations £ Impaired Waters List
Basin oveRvieW
Of The CaTawba RiveR basin

2
NC D
WQ
CATAWBA RIVER BA
SIN PLA
N: BA
SIN O
VERVIEW 2010
figuRe 1: biOlOgiCal RaTing shifTs fOR siTes MOniTORed duRing This saMpling CyCle & The pReviOus
Impaired23%
Supporting77%
2002 Benthic
Impaired17%
Supporting83%
2002 Fish
Impaired19%
Supporting81%
2007 Benthic
Impaired22%
Supporting78%
2007 Fish
Improved44%
No Change42%
Declined14%
Benthic Community Rating Shift Between 2002 & 2007
Improved36%
No Change43%
Declined21%
Biological Community Rating Shifts Between 2002 & 2007
Improved22%
No Change43%
Declined35%
Fish Community Rating Shifts Between 2002 & 2007
st R e a M Fl o W & DR o u g h t
The rate at which a volume of water moves through a stream (the flow rate) can have a negative impact on water quality. In particular, droughts can have major effects on water quality parameters such as dissolved oxygen, turbidity, pH, and other parameters due to extremely low stream flow. Therefore, it is useful to track changes in stream flow over the course of the assessment period to see when drought or high flow events might be present. A significant drought affected the Catawba River Basin from spring 2007 to fall 2008.
Figure 2 shows the yearly averages for the USGS gage stations spread through the basin between 1997 and 2007. It can be seen in this graph how the 1999 to 2002 drought, heavy rain events in 2003 and the three hurricanes that occurred from 2004 to 2005 effected streams across the Catawba River Basin during this time period.

3
NC
DW
Q C
ATAW
BA R
IVER
BA
SIN
PLA
N:
BA
SIN
OVE
RVIE
W
2010
ch e M i c a l/ph y s i c a l Mo n i to R i n g
Chemical and physical samples are taken by DWQ throughout the basin once a month. A majority of the ambient stations are associated with waterbody locations where potential pollution could occur from known land use activities. Parameters collected at each site depend on the waterbody classification, but typically include conductivity, dissolved oxygen, pH, temperature, turbidity, nutrient measurements, metals, and fecal coliform bacteria. Each classification has an associated set of standards the parameters must meet in order to be considered as supporting its designated uses. For more information on waterbody classifications, see Section 2.2 of the Supplemental Guide to North Carolina’s Basinwide Planning. Ten sample results are required within the five-year data collection window in order to evaluate a water quality parameter and compare it to the water quality standards. For more information about ambient monitoring and seasonal variation in this basin, see the Catawba River Basin Ambient Monitoring System Report.
In the present sampling cycle (2004 - 2008), 32 Ambient Monitoring System (AMS) stations collected ten or more samples and were used for use support assessment. Six of those stations were discontinued at the beginning of 2007 to allow for the addition of Random Ambient Monitoring System (RAMS) stations. There were four RAMS stations sampled within the basin between 2007 and 2008, two located in subbasin 03050103, one in 03050102 and one in 03050101.
Twenty-one of the ambient stations are rated Impaired for exceedances of state standards (See Figure 16 through Figure 21 at the end of this Chapter). A station is rated Impaired if 10.1% of the samples collected in a given sampling cycle are over the State’s standards for any given parameter. For example, if 10.3% of samples taken between 2004 and 2008 are over the 50 NTU standard for turbidity, that stream segment is then rated as Impaired and placed on the 303(d) Impaired Waters List.
Three major parameters of concern for the Catawba River Basin are turbidity, low pH, and copper. Each of these parameters as well as dissolved oxygen (DO), temperature, and fecal coliform bacteria (FCB) are discussed below to show changes over the course of 12 years. Each parameter discussion includes graphs showing the median and mean concentration values for all ambient stations in the basin from 1997 to 2008. These graphs are not intended to provide statistically significant trend information, but rather to demonstrate how changes in land use conditions or climate conditions can impact parameters over the long term. The difference between median and mean results indicate the presence of outliers in the data set. Box and whisker plots of individual ambient stations were completed by parameter for data between 2002 and 2007 by DWQ and can be found in the Ambient Monitoring Report.
figuRe 2: yeaRly aveRage flOw RaTes Of usgs gage sTaTiOns in The CaTawba RiveR basin, 1997 - 2007
0
200
400
600
800
1000
1200
1400
1997 1998 1999 2000 2001 2002 2003 2004 2005 2006 2007
Flow
(cf
s)
213903612 2138500 2137727 2140991 2142000 21430402143000 214269560 214266000 2142900 214291555 2142956002146300 2146700 2146600 2146750
Station Locations:213903612: Catawba River at Calvin NC2138500: Linville River near Nebo, NC2137727: Catawba River near Pleasant Gardens, NC2140991: Johns River at Arneys Store, NC2142000: Lower Little River near All Healing Springs, NC2143040: Jacobs Fork at Ramsey2143000: Henry Fork near Henry River214269560: Killian Creek near Mariposa214266000: McDowell Creek near Charlotte2142900: Long Creek near Paw Creek214291555: Long Creek near Rhyne214295600: Paw Creek at Wilkinson Blvd near Charlotte2146300: Irwin Creek near Charlotte2146700: McMullen Creek at Sharon View Rd.2146600: McAlpine Creek at Sardis Rd near Charlotte2146750: McAlpine Creek Below McMullen Creek near Pineville
4
NC D
WQ
CATAWBA RIVER BA
SIN PLA
N: BA
SIN O
VERVIEW 2010
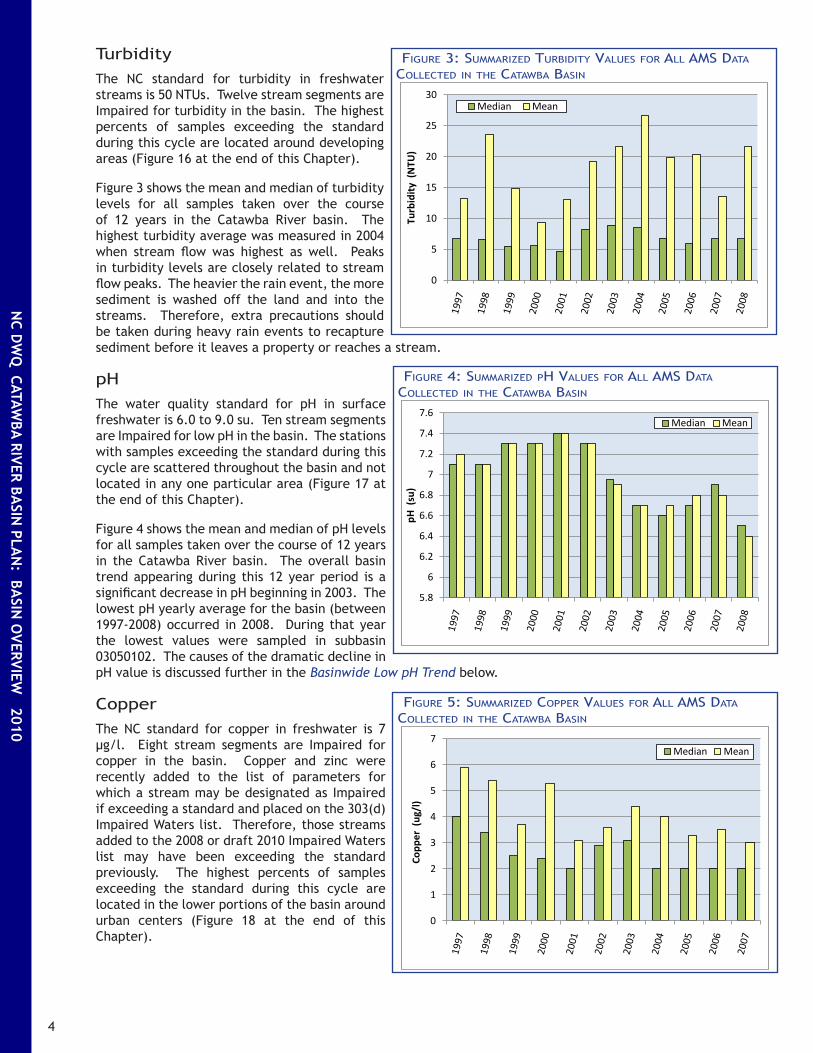
TurbidityThe NC standard for turbidity in freshwater streams is 50 NTUs. Twelve stream segments are Impaired for turbidity in the basin. The highest percents of samples exceeding the standard during this cycle are located around developing areas (Figure 16 at the end of this Chapter).
Figure 3 shows the mean and median of turbidity levels for all samples taken over the course of 12 years in the Catawba River basin. The highest turbidity average was measured in 2004 when stream flow was highest as well. Peaks in turbidity levels are closely related to stream flow peaks. The heavier the rain event, the more sediment is washed off the land and into the streams. Therefore, extra precautions should be taken during heavy rain events to recapture sediment before it leaves a property or reaches a stream.
pHThe water quality standard for pH in surface freshwater is 6.0 to 9.0 su. Ten stream segments are Impaired for low pH in the basin. The stations with samples exceeding the standard during this cycle are scattered throughout the basin and not located in any one particular area (Figure 17 at the end of this Chapter).
Figure 4 shows the mean and median of pH levels for all samples taken over the course of 12 years in the Catawba River basin. The overall basin trend appearing during this 12 year period is a significant decrease in pH beginning in 2003. The lowest pH yearly average for the basin (between 1997-2008) occurred in 2008. During that year the lowest values were sampled in subbasin 03050102. The causes of the dramatic decline in pH value is discussed further in the Basinwide Low pH Trend below.
CopperThe NC standard for copper in freshwater is 7 µg/l. Eight stream segments are Impaired for copper in the basin. Copper and zinc were recently added to the list of parameters for which a stream may be designated as Impaired if exceeding a standard and placed on the 303(d) Impaired Waters list. Therefore, those streams added to the 2008 or draft 2010 Impaired Waters list may have been exceeding the standard previously. The highest percents of samples exceeding the standard during this cycle are located in the lower portions of the basin around urban centers (Figure 18 at the end of this Chapter).
figuRe 3: suMMaRized TuRbidiTy values fOR all aMs daTa COlleCTed in The CaTawba basin
0
5
10
15
20
25
30
Turb
idit
y (N
TU)
Median Mean
figuRe 4: suMMaRized ph values fOR all aMs daTa COlleCTed in The CaTawba basin
5.8
6
6.2
6.4
6.6
6.8
7
7.2
7.4
7.6pH
(su
)Median Mean
figuRe 5: suMMaRized COppeR values fOR all aMs daTa COlleCTed in The CaTawba basin
0
1
2
3
4
5
6
7
Copp
er (
ug/l
)
Median Mean

5
NC
DW
Q C
ATAW
BA R
IVER
BA
SIN
PLA
N:
BA
SIN
OVE
RVIE
W
2010
Figure 5 shows the mean and median of copper levels for all samples taken over the course of 11 years in the Catawba River basin. The highest copper average was in 1997. The levels of exceedances between 1997 and 2007 have almost been cut in half. In September of 2000, metals sampling decreased in frequency from monthly to quarterly and the use of a more sensitive instrument to measure copper was implemented which may explain the downward trend between 1999 and 2001. Metals sampling was temporarily suspended in May 2007. When comparing this graph to the stream flow averages for these 11 years, copper appears to be closely linked to stream flow. The trend seen in Figure 5 shows the average copper levels throughout the basin have declined over time.
Dissolved OxygenThe NC standard for DO in freshwater is no less than a daily average of 5.0 mg/l with a minimum instantaneous value of no less than 4 mg/l. No stream segments are Impaired for DO in the basin. The stations with only a few samples not meeting the standard during this cycle are seen around the major urban centers in the lower parts of the basin (Figure 19 at the end of this Chapter).
Figure 6 shows the mean and median of DO levels for all samples taken over 12 years in the Catawba River basin. The lowest DO average was recorded in 2007. When comparing this graph to the stream flow averages for these 12 years, DO appears to be closely linked to stream flow. The trend in this graph shows the average DO levels in the basin are normal.
TemperatureNC water quality standards state that discharge from permitted facilities should not exceed the natural temperature of the water by more than 2.8°C (5.04°F) and that waters should never exceed 29°C (84.2°F) for the mountain and upper piedmont regions. The discharge of heated liquids to trout waters (Tr) should not increase the natural water temperature by more than 0.5°C (0.9°F), and in no case, exceed 20°C (68°F). The only station in this watershed to exceed state standards during this cycle was C7000000 - South Fork Catawba River. The stations with samples exceeding the standard during this cycle are mostly seen in the lower portion of the basin (Figure 20 at the end of this Chapter).
Figure 7 shows the mean and median of temperature levels for all samples taken over 12 years in the Catawba River basin. The highest temperature average is seen in 2007, which was a year of severe drought. During years with severe drought and high summer air temperatures, standard exceedances are to be expected.
figuRe 6: suMMaRized dO values fOR all aMs daTa COlleCTed in The CaTawba basin
7.8
8
8.2
8.4
8.6
8.8
9
9.2
9.4
9.6
9.8
DO
(m
g/l)
Median Mean
figuRe 7: suMMaRized TeMpeRaTuRe values fOR all aMs daTa COlleCTed in The CaTawba basin
14
14.5
15
15.5
16
16.5
17
17.5
Tem
pera
ture
(Ce
lciu
s)
Median Mean

6
NC D
WQ
CATAWBA RIVER BA
SIN PLA
N: BA
SIN O
VERVIEW 2010
Fecal Coliform BacteriaThe FCB standard for freshwater streams is not to exceed the geometric mean of 200 colonies/100 ml or 400 colonies/100 ml in 20% of the samples where five samples have been taken over a span of 30 days. Only results from five samples in 30 days (5-in-30) are to be used to indicate whether the stream is Impaired or Supporting. Fifteen out of the 32 ambient monitoring stations in the basin recorded FCB levels above a geometric mean of 200 colonies/100 ml or 400 colonies/100 ml in 20% of AMS samples taken between 2004 and 2008 (not based on 5-in-30’s). The stations with the highest percentage of samples exceeding the standard during this cycle are scattered throughout the basin and are not localized to any one particular area (Figure 21 at the end of this Chapter).
Figure 8 shows the geometric mean of FCB levels each year for all samples taken over 12 years in the Catawba River basin. The highest FCB geometric mean is seen in 2004 which was a year with above average flows. Peaks in FCB levels are closely related to stream flow peaks, as was the case in 2004.
suBBasin oveRvieW
cataW B a R i v e R he a D Wat e R s - 03050101Water quality within this subbasin is influenced by land use and population. Water quality is generally better in the upper non-developed regions and more impacted in the lower portion of this subbasin near urban centers. Due to its large size, there are multiple overall water quality issues impacting this subbasin. The upper headwaters are facing development pressure from the increasing demand for second homes and golf club communities. The Lake Rhodhiss and Hickory watersheds are experiencing impacts mostly from converting
agricultural lands to urban areas, livestock operations, row crop and ornamental nurseries, stormwater runoff, and point source pollutants. The lower portions of this subbasin are impacted by stormwater runoff from densely populated areas, failing septic systems, and out-dated wastewater treatment facilities.
Local governments, watershed groups, natural resource agencies and local stakeholders have been actively working throughout this subbasin to assess the extent of certain issues, developing implementation plans as well as making necessary upgrades to out-of-date WWTP’s. Many of these efforts are currently on-going; however, others have already resulted in measurable water quality improvements. Refer to the Chain of Lakes Chapter for information about the past and present water quality of the lakes and current management strategies.
figuRe 8: suMMaRized fCb geOMeTRiC Means fOR all aMs daTa COlleCTed in The CaTawba basin
0
20
40
60
80
100
120
140
FCB
(per
100
ml)
Success Story
The Left Prong Catawba River [AU#: 11-6] was being threatened by sediment-laden runoff from two large home construction projects during the 2004 plan assessment period. One project was found to be operating without the proper permits. As recommended in the 2004 plan, DWQ and Division of Land Resources (DLR) worked with the land owners to bring both properties into compliance with proper permits and properly constructed erosion control measures. The Left Prong was given an Excellent benthic rating in 2007.
7
NC
DW
Q C
ATAW
BA R
IVER
BA
SIN
PLA
N:
BA
SIN
OVE
RVIE
W
2010
so u t h Fo R k cataW B a R i v e R - 03050102Water quality within the South Fork Catawba River Subbasin is influenced by population and land use. Water quality is generally better in the upper non-developed regions and degraded in the lower portion of this subbasin near the urban centers. The major water quality issues in this subbasin include urban development, excess nutrient loading and nonpoint source runoff. The subbasin headwaters are experiencing impacts from urban and agricultural stormwater runoff, excess fecal coliform bacteria levels and low pH. These impacts accumulate as water flows downstream with additional impacts from WWTPs as well as failing septic systems. The lower South Fork Catawba River, as it flows into Lake Wylie, receives nutrient enriched discharge from point sources and agricultural runoff. Fecal coliform bacteria and turbidity levels increase in the lower portion of the subbasin where urban sprawl consumes agricultural and forested areas.
Local governments, watershed groups, natural resource agencies and local stakeholders have been actively working throughout this subbasin to assess certain watersheds and develop implementation plans to deal with these issues. Many of these efforts are currently on-going and others are already resulting in measurable water quality improvements. The Soil & Water Conservation Districts have installed numerous best management practices mostly between NC-10 and NC-150 to address many of the agricultural impacts. The Ecosystem Enhancement Program has also focused efforts in that area on monitoring and restoration projects.
cataW B a R i v e R - 03050103Water quality within the Catawba River Subbasin is influenced by land use practices and densely populated areas with large amounts of impervious surfaces which are focused in the upper portion of this subbasin. This subbasin had the highest levels of nutrients and fecal coliform bacteria measured within the Catawba River basin. These impacts as well as high turbidity levels are common for large urban areas. The lower portion of this subbasin had high levels of turbidity due to increasing development. This portion also includes the Waxhaw Creek watershed which DWQ has recognized as one of the most biologically important aquatic habitats in the basin due to the presences of the endangered Carolina Heel Splitter mussel.
Local governments, watershed groups, natural resource agencies and local stakeholders have been actively working throughout this subbasin to assess some of these issues and develop implementation plans to deal with these impacts. Many of these efforts are currently on-going and others have been completed and resulted in measurable water quality improvements.
cataW B a ch a i n o F la k e s
Five lakes (James, Rhodhiss, Hickory, Norman and Wylie) out of the seven within the chain of lakes were sampled by DWQ-ESS in 2007 as per the regular five year lake sampling cycle. The entire chain is located within the 03050101 Catawba River Headwater Subbasin. Water quality within the chain of lakes is influenced by land use practices in each of the watersheds draining to the lake as well as point sources near the lakes. The 2007 drought also had an effect on water quality in the small lakes along the chain. Parameters of concern in three out of five of the lakes include pH and chlorophyll a. Elevated nutrient levels from point and nonpoint sources are impacting Lakes Rhodhiss, Hickory and Wylie.
Recommendations for the Chain of Lakes includes increased educational efforts about the Catawba River basin buffers, additional agricultural BMPs for nearby farms, and voluntary nutrient monitoring for point sources with discharge pipes in or near the lakes. A monitoring coalition, similar to the Upper Cape Fear, would be beneficial to this area. Action plans were developed for Lake Rhodhiss and Lake Wylie to assist with the reduction of nutrients reaching the lakes. More detailed information about water quality in the chain can be found in the Chain of Lakes Chapter.
Success Story
Little Sugar Creek, which runs through downtown Charlotte, once was covered by parking lots, but has steadily been uncapped and daylighted by Charlotte-Mecklenburg’s Stormwater Services and EEP. The section that has been uncapped is now lined with trees and native grasses to create a buffer effect, preventing erosion and filtering pollution. Once this project is completed, Little Sugar Creek will be daylighted from 7th Street to Morehead Street and will include a new greenway which will follow the entire portion of the newly restored creek.

8
NC D
WQ
CATAWBA RIVER BA
SIN PLA
N: BA
SIN O
VERVIEW 2010
Basin issues
This section contains discussion of issues impacting water quality across the Catawba River Basin. Topics presented here are intended to stimulate discussion among environmental professionals and other interested parties as to what additional studies (if any) need to be done and to begin planning restoration efforts, if possible. These issues are also presented to inform those within the basin of the big-picture impacts that effect basinwide water quality. This should assist local stakeholders and champions in focusing efforts on what will not only improve water quality in their area but throughout the basin. (Some recommendations are included but most topics are informational items at this time.)
Ba s i n W i D e lo W phThroughout the basin, pH levels have noticeably dropped, beginning in 2002 (see Figure 9). This decrease might have been caused by one or more factors or a combination of factors such as stream flows, atmospheric deposition, development impacts, or decreased buffering capacity. Figure 10 shows this drop in pH for each ambient monitoring station in the Catawba River basin over a 12 year period. Equipment malfunctions are currently being evaluated by DWQ and are not expected to be the cause for all observed low measurements. Other State and Federal agencies have also found low pH levels throughout the western portion of the state and Tennessee. This indicates the issue is not basin specific and may be a larger scale concern.
DWQ has recently formed a partnership with Tennessee, the National Park Service (NPS) and the US Forest Service (USFS) to begin discussions of low pH levels emerging in the southeast. The National Park Service is working with the Tennessee Department of Environment & Conservation and the EPA to develop a TMDL for pH impaired streams in the Great Smoky Mountains National Park. The Great Smoky Mountains Air & Water Quality Program has established a baseline of air and water conditions using 20 to 30 years of monitoring data that will be compiled and used for model development and implementation plans. The Program will be determining status and trends of the data, compliance with air and water quality standards, and identifying any links to biological effects. Through this process the Program hopes to determine the sources of pollution and provide early warning signs of abnormal conditions or trends. Analysis thus far has shown that areas with higher elevations typically have the lowest pH averages and the highest nitrogen and sulfur deposition levels. Over 50% of the park’s streams have an average pH of less than 6.5 su. Levels in streams above 3,500 feet are projected to continue to decline in the future based on early modeling.
USFS has been evaluating sulfur deposition for three national forests in the southern Appalachians. Areas with the most risk from sulfur deposition are based on: 1) geology which influences the amount of bases available in the soil; 2) elevation which determines microbial activity levels, soil depth and amount of cloud deposition; and 3) if sulfur is present in the rock that is being weathered into soil or if sulfur is being retained in soils as it is deposited from the atmosphere. USFS has collected data along the western edge of North Carolina. The data trends have shown, like the NPS’ findings, that the chronically acidic streams are in the higher elevations.
figuRe 9: ph annual Means (lefT) & Medians (RighT) by subbasin beTween 1997 & 2008
Mean
6.0
6.2
6.4
6.6
6.8
7.0
7.2
7.4
7.6
7.8
8.0
1997 1998 1999 2000 2001 2002 2003 2004 2005 2006 2007 2008
pH (
su)
3050101 3050102 3050103
Median
6
6.2
6.4
6.6
6.8
7
7.2
7.4
7.6
7.8
8
1997 1998 1999 2000 2001 2002 2003 2004 2005 2006 2007 2008
pH (s
u)
3050101 3050102 3050103

9
NC
DW
Q C
ATAW
BA R
IVER
BA
SIN
PLA
N:
BA
SIN
OVE
RVIE
W
2010
DWQ will continue working with Tennessee, EPA, NPS and the USFS in efforts to find sources of the low pH and develop an implementation plan. Tennessee’s Acid Neutralizing Capacity TMDL will be on public notice April – June 2010. The NPS is funding air modeling to aid in the TMDL implementation. Both the NPS and USFS will be submitting data for DWQ to consider for use support assessments for the 2012 303(d) Impaired Waters list.
figuRe 10: ph yeaRly Medians fOR eaCh aMs sTaTiOn wiThin The CaTawba RiveR basin beTween 1997 & 2008
5.5
6
6.5
7
7.5
8
8.5
1997 1998 1999 2000 2001 2002 2003 2004 2005 2006 2007 2008
pH (s
u)CTB pH 12 Yr for each AMS site C025
C055
C100
C123
C175
C260
C2818
C342
C3699
C386
C390
C404
C422
C430
C436
C437
C438
C480
C517
C590
C650
C700
C740
C750
C88965
C905
C921
C937
C98195
Additional ambient monitoring station information can be found in the back of each subbasin chapter of this document.
eF F e c t s o F sto R M Wat e R vo l u M e & ve l o c i t y
It is widely known that stormwater can have severe impacts on surface water quality; however, the impacts that most focus on are pollutants and excess nutrients that the stormwater transports. DWQ Regional Office staff have become increasingly concerned with the volume of stormwater within receiving streams and the increased stream flow velocity the extra volume can cause.
figuRe 11:iMpaCTs Of high vOluMe & velOCiTy sTORMwaTeR On uRban sTReaMs (MCdOwell CReek)
As impervious surface coverage increases with development, the amount of stormwater quickly begins to increase as well. In many areas of the state, stormwater flows directly off the land and into stormwater drainage pipes, which diverts the runoff through the pipes and into the nearest stream. This can cause the volume and velocity of some receiving streams to double within a matter of minutes after the start of a rain event. The high volume can increase the chances of flooding and when combined with a faster flow can cause severe streambank and aquatic life damage. High velocities can strip streambanks of vegetation, critical habitat and large amounts of sediment.
When stormwater is captured on site through a rain garden, stormwater runoff ponds or other methods and is allowed to drain into

10
NC D
WQ
CATAWBA RIVER BA
SIN PLA
N: BA
SIN O
VERVIEW 2010
the soil, the amount that reaches the stream nearest to that site is decreased and is that much less likely to cause further damage. Reducing stormwater runoff in this way not only helps reduce volume and velocity during storm events, it also assists in keeping the pollutants and excess nutrients out of the surface water.
iM pa c t s FR o M po u lt Ry Fa R M co n s t R u c t i o n
As seen in Section A: Chapter 2 of the 2004 Catawba River Basinwide Water Quality Plan, there has been a shift in animal operations from cattle to poultry within the basin since the mid 1990’s. Impacts being seen by biologist, environmental professionals and local citizens from this shift to poultry farms is sediment filling in nearby streams. Agricultural practices are exempt from having to complete a sediment and erosion control plan which is a state requirement for any land disturbing activity over an acre; however, if the operation participates in any federal farm government program, they may be required to meet soil erosion control goals or lose their program benefits. Poultry houses that are not participating in federal farm programs are not required to implement sediment and erosion controls and some are being constructed without proper controls in place to trap sediment on the property before it reaches the stream. Many of these poultry houses are located in the headwaters of the Catawba River Basin where high quality waters (HQW), outstanding resource waters (ORW) and trout waters (Tr) are also found. These water are usually very sensitive to the impacts of sedimentation.
At the urging of the NC Agriculture Task Force and NC Soil & Water Conservation Commission, the NC Poultry Federation is establishing operating guidelines and standards to address setbacks, site stabilization and other environmental concerns related to the construction of new poultry production facilities. It is recommended that poultry farmers voluntarily install sediment and erosion controls on the property during construction activities to reduce impacts from sedimentation. For more information about agricultural in the Catawba River Basin, see the Agriculture Chapter.
se p t i c sy s t e M s
In 2007, North Carolina Agricultural Research Service completed a report concerning nitrogen contributions from on-site wastewater systems for each river basin (Pradhan et al., 2007). In 1990, the Catawba River basin had the highest septic system density average (53 systems/mi2) on a river basin scale of all other basins (Figure 12). This is the only basin in NC exceeding the EPA suggested threshold of 40 systems/mi2. The portion of subbasin 03050101 on the western side of the South Fork Catawba River had the highest septic system density of 96 septic systems per square mile. The study projected that the septic system density basinwide will continue to increase mostly around the fringes of large urban areas, major highways, waterfronts, and active recreational areas. Even though the amount of systems per square mile is high, the number of houses with systems verses houses connected to municipal treatment plants in the same area is relatively low.
The potential nitrogen loading has a particular importance to watersheds with elevated nutrient levels. The study found the basin to have the lowest percentage of septic systems per housing units (39%) of all 17 basins, it has the highest cumulative potential nitrogen loading on a unit area basis (lb N/yr/mi2) of any other basin.
figuRe 12: densiTy Of sepTiC sysTeMs fOR 17 nC RiveR basins, 1990 Census blOCk gROup daTa.
figuRe 13: CuMulaTive pOTenTial niTROgen lOading fOR 134 nC subbasins, 1990 Census blOCk gROup daTa.

11
NC
DW
Q C
ATAW
BA R
IVER
BA
SIN
PLA
N:
BA
SIN
OVE
RVIE
W
2010
The results for this basin, based on 1990 census data, indicate a population of 406,797 people using septic systems resulting in a nitrogen loading of 4,067,971 lbs/yr and nitrogen loading rate of 1,272 lbs/mi2/yr. These numbers reflect the total nitrogen discharged to the soil from the septic system and does not account for nitrogen used because of soil processes and plant uptake. For more information about this study on a subbasin scale, see the Subbasin Chapter related to your area of concern. The full study (Potential Nitrogen Contributions from On-site Wastewater Treatment Systems to North Carolina’s River Basins and Sub-basins) can be viewed on the North Carolina State University website or the link above.
Bu F F e R s i n t h e cataW B a R i v e R Ba s i n
There are many different types of buffers within the Catawba River Basin, but they all have the same purpose: to reduce the amount of pollutants and excess nutrients running off the land and into surface waters. The types of buffers include trout, water supply, High Quality Waters, Outstanding Resource Waters and the Chain of Lakes buffers. The first four are based off of Primary and Secondary Use Classification. The Chain of Lakes buffers were initiated by the Environmental Management Commission to help protect the lakes against sedimentation and excess nutrients. These buffer types vary in width and have differing rules and regulations. These differences are described in their respective sections along with maps indicating locations within the basin.
DWQ recommends local governments take voluntary action to increase buffer requirements, as appropriate for that area; local requirements should be assessed with long term plans. As a community grows and the demand on water increases, whether for recreation, drinking or aesthetic purposes, the quality of the water will become more critical. By reducing the pollutants and nutrients entering a waterbody, municipalities will be able to spend less on filtering drinking water and keeping aquatic weeds from clogging intake pipes. Reducing nutrients will also reduce the chances of algal blooms which can impact recreational uses and discourage return visits. Another essential element of implementing successful buffers is public education. DWQ highly recommends and supports (where possible) educational efforts by local watershed groups and governments and agencies. For more information on buffers in the basin and further recommendation information, see the Buffer Rules Chapter.
co a l as h po n D s
In June of 2009, EPA posted a list of potential “high hazard” impoundments containing coal combustion residuals (coal ash). These impoundments (ponds or basins) are used by electric utility facilities to hold power plant residuals. Of the 44 power plants on EPA’s list as having a high hazard potential, three facilities with a total of five ponds are in the Catawba River basin. This designation indicates these facilities have the potential of causing human and environmental harm if the dams fail. Criteria for this designation include being near densely populated areas, downstream water supplies, or important public utilities, or primary highways.
The structures of these ponds has been previously regulated by the NC Utility Commission; however due to changes in regulations, the dams are now regulated and inspected by the DLR – Dam Safety Section. Now, the high hazard dams are inspected by the State every two years and low hazard dams are inspected every five years (Senate Bill 1004). DLR recently reported the findings of their most current inspection of the dams to the Environmental Management Commission. DLR inspected three facilities in the Catawba River basin which include the Allen Steam Station, Marshall Steam Station, and the Riverbend Steam Station; none of these facilities or any others in the state showed any signs of failure. Recommendations were made for voluntary actions that the facilities could take to ensure safety of the ponds. When DLR returned for a second round of inspections, the majority of recommendations had been completed and plans were made for further implementation of State recommendations.
In terms of water quality protection, DWQ regulates discharges from power company fly ash disposal ponds through the National Pollutant Discharge Elimination System (NPDES) permitting program. In addition, DWQ has gathered facility site information form the 14 power company locations in the state that have fly ash ponds. Included in the information are disposal areas for fly ash and other waste products, the location of compliance boundaries associated with activities that have the potential to impact groundwater, and proposed and existing groundwater monitoring well locations. DWQ is in the process of assessing the information received to determine what additional actions, if any are appropriate to ensure the protection of surface and groundwater resources at these sites.

12
NC D
WQ
CATAWBA RIVER BA
SIN PLA
N: BA
SIN O
VERVIEW 2010
so u t h ca R o l i n a’s iM pa i R e D Wat e R s l i s t
The Catawba River basin begins in NC but ends in South Carolina. It is not only important to know what is on North Carolina’s 303(d) Impaired Waters list but also surrounding states which share our water. There is one major distinction between NC’s Impaired Waters list and SC’s, which is that SC impairs monitoring stations where NC impairs waterbodies based on monitoring station results. Table 1 lists each station, location, use and cause of Impairment for waters with significant portions in NC. Some of the SC stream segments have similar causes of Impairment as the corresponding NC segments; however, some are quite different. Please note that the table only lists a portion of the SC Catawba River Basin 2008 Impaired Waters List. The complete list can be found on the SC Department of Health and Environmental Control.
Table 1: sOuTh CaROlina’s 2008 iMpaiRed waTeRs lisT Of sTReaMs wiThin The CaTawba RiveR basin ThaT aRe MOniTORed in nORTh CaROlina
sTReaM naMe lOCaTiOn sTaTiOn id use1 Cause2
Lake Wylie Above Mill Cr at end of S-46-557 CW-197 AL Copper
Beaverdam Cr At S-46-152, 8 miles east of Clover CW-153 AL Turbidity
Crowders Cr at S-46-564 northeast of Clover CW-023 AL Copper
Crowders Cr at S-46-1104 CW-024 AL Biological
Lake Wylie Crowders Cr arm at SC-49 and SC-274 CW-027 REC Fecal Coliform Bacteria
Sugar Cr Upstream of its confluence with McAlpine Cr CW-246 AL Biological
McAlpine Cr at S-49-64 CW-064 AL Biological
McAlpine Cr at S-49-64 CW-064 REC Fecal Coliform Bacteria
1. Use: use support category. AL - Aquatic Life; REC - Recreational. 2. Cause: is referred to in NC as Parameter of Impairment or POI.
population & lanD coveR
Urbanization poses one of the greatest threats to aquatic resources. Small towns and communities are usually not considered urban centers, but even small concentrations of urbanization can have significant impacts on local waterways. For example, a one-acre parking lot produces 16 times more runoff than a one-acre meadow (Schueler and Holland, 2000). A wide variety of studies over the past decade converge on a central point: when more than 10 percent of the acreage in a watershed is covered in roads, parking lots, rooftops, and other impervious surfaces, the rivers and streams within the watershed become seriously degraded. Studies show that if urbanized areas cover more than 25 percent of a watershed, there is a point where the decline in the health of the ecosystem is irreversible (Beach, 2002; Galli, 1991).

13
NC
DW
Q C
ATAW
BA R
IVER
BA
SIN
PLA
N:
BA
SIN
OVE
RVIE
W
2010
po p u l at i o n
The 2000 census estimated population for this basin is 1,314,897 and this number is estimated to increase to 1,912,098 (18%) by 2020 (Pate, 2009). As population increases, so does the demand for clean water from aquifer and surface water sources and for the land and water to assimilate wastes. Figure 14 shows how population per square mile changed on the 12-Digit subwatershed scale between 1990 and 2000. This figure also shows most growth is occurring around urban centers. For more information on how population impacts water quality, see Chapter 12 of the Supplemental Guide to NC’s Basinwide Planning. A full page basin population map can be seen in the Maps Chapter.
figuRe 14: pOpulaTiOn densiTy in The CaTawba RiveR basin in 1990 (lefT) & 2000 (RighT)
1990 2000
la n D co v e R
Land cover across this basin is diverse in nature. The mountainous headwater region of the basin, which includes 223,500 acres of the Pisgah National Forest, is dominated by forested land. Moving south, the percent of agricultural land increases and urban areas are dominant in the lower portions of the basin. Overall, 55% of the basin is forested, 21% is developed, 19% is used for agriculture and 0.5% of the land cover is wetland area. The last 4.5% of land cover is scrub/shrub, grasslands or bare earth. Figure 15 shows the clustering of developed and forested areas and the scattered nature of agricultural areas within the basin (Homer, 2004). More information on land cover by subbasin can be found in each subbasin chapter. A full page basin land cover map can be seen in Maps Chapter.
figuRe 15: 2001 land COveR in The CaTawba RiveR basin

14
NC D
WQ
CATAWBA RIVER BA
SIN PLA
N: BA
SIN O
VERVIEW 2010
RecoMMenDations & goals Stream or watershed specific recommendations can be found in the respective Subbasin Chapters.
Table 2: ReCOMMendaTiOns & gOals fOR The upCOMing CaTawba RiveR basinwide planning CyCle in whiCh dwQ will aCT as The lead agenCy
ReCOMMendaTiOns/gOals RespOnsible paRTies aCTiOn by when
Source Study for Nutrients in the South Fork
ESS, MRO, BPU, etc. DWQ will be working with other agencies to reevaluate the nutrient loading on the South Fork Catawba River to determine if the Lake Wylie TMDL should be altered.
November 2012
Additional Lake Monitoring ESS DWQ will continue current lake monitoring which consists of five sampling events per lake per cycle. When resources become available, DWQ will obtain an additional five samples starting with Lake Wylie and Rhodhiss.
October 2012
Investigate occurrence and cause(s) of low pH in Catawba River Basin.
Planning Section – Modeling & Basinwide, ESS, Regional Offices
Continue partnership with Tennessee, National Park Service & US Forest Service in efforts to find sources of low pH levels in the southeast and develop an implementation plan.
June 2013
Use fecal coliform bacteria exceedances to target management strategies including BMPs to reduce stream access by livestock and proper maintenance of septic systems
Planning Section – Basinwide & Regional Offices
Work with Soil and Water Conservation Districts and the Division of Environmental Health on identification and implementation.
July 2013
Implementation of the Lake Rhodhiss (Point source side) Nutrient Management Action Plan
NPDES, MTU, BPU, ARO, & specific WWTPs
DWQ will implement weekly effluent nutrient monitoring in the NPDES permits of the Morganton, Lenoir and Marion WWTPs within this permitting cycle. These facilities with addition of the Valdese WWTP should make all efforts to reduce nutrient loading to the lake.
DWQ will then re-sample the lake for pH and nutrients to develop a TMDL for high pH if needed.
Summer 2011
December 2013
Evaluate need for additional protection of Lake Norman
CSU, BPU DWQ will evaluated whether Lake Norman need additional protection to prevent degradation of the States largest lake or determine if local efforts are sufficient.
April 2011
Additional Sampling of Mountain Island Lake
ESS DWQ will conduct additional sampling within the lake to determine the severity of the low pH impairment.
December 2010
Update implementation strategy for Lake Wylie Chlorophyll-a TMDL
Planning Section – Basinwide & Modeling along with ESS, Permitting & Regional Offices
Review status of Lake Wylie water quality and determine how implementation strategy is working and any modification that might be appropriate
December 2013
Assign Permit Limits per Lake Wylie TMDL
NPDES The Mount Holly and Belmont WWTP’s will be receiving NPDES permit limits as per the TMDL during the next permitting cycle.
Next Permitting Cycle
Consider expansion of Lake Wylie TMDL Management Area
MTU, BPU, NPDES DWQ will consider whether the management area of the Lake Wylie TMDL should be expended to include Long Creek which flows into the South Fork Catawba River.
December 2013
Improve implementation of buffer rules through education and enforcement
Planning Basinwide Section & Regional Offices
Continued targeting of education efforts towards buffer rule implementation and understanding along with response to buffer violations.
On-going

15
NC
DW
Q C
ATAW
BA R
IVER
BA
SIN
PLA
N:
BA
SIN
OVE
RVIE
W
2010
Table 3: nOn-dwQ ReCOMMendaTiOns & gOals fOR The upCOMing CaTawba RiveR basinwide planning CyCle in whiCh dwQ will pROvide suppORT effORTs as needed
ReCOMMendaTiOns/gOalsRespOnsible
paRTiesaCTiOn
Lower Creek TMDL Implementation Lower Creek Advisory Team,EEP, DWQ
DWQ will work with parties involved to ensure implementation of BMPs which include educational efforts, sediment and nutrient reductions, erosion reductions, stream restorations, as well as many others to address reductions required in 2005 Turbidity TMDL.
Reduce high levels of fecal coliform bacteria in Lower Creek
EEP, ARO, Caldwell County SWCD, BPU, City of Lenoir
DWQ’s Asheville Regional Office will be conducting a routine inspection of the City of Lenoir’s wastewater collection system in coordinated efforts with the city to assist in finding leaks and pipe failures. DWQ, along with EEP and the City of Lenoir, will also be working with Caldwell County SWCD to find additional solutions for excess FCB within this system.
Organize stakeholder group with a purpose of reducing high levels of fecal coliform bacteria in Crowders Creek
Local Agencies,BPU
DWQ will work with local governments to organize a stakeholder group to begin implementation efforts and assist in finding additional sources of FCB.
Gaston County Water Quality Recovery Program
Gaston County The City of Gastonia will be required to develop a Water Quality Recovery Program as a result of the Gastonia’s Crowders Creek WWTP (NC0074268) being listed in the TMDL as a major source contributor.
Gaston County On-site Wastewater Treatment Analysis
Gaston County Health Department
The Gaston County Health Department should do a full assessment of septic systems throughout the Crowders Creek watershed to locate failing systems and assist with making necessary repairs in efforts to reduce sources of excess FCB.
Develop a Watershed Restoration Plan for Clark Creek
Local Agencies, BPU-URW
The Clark Creek Watershed Restoration Plan will confirm sources of impairment as well as design an implementation plan. DWQ will assist with this restoration effort and supports the need for funding to develop and implement the Watershed Restoration Plan.
Implementation of the Indian/Howard Creek Watershed Management Plan
EEP, Lincoln and Gaston County Stakeholders
Implementation of the Indian/Howard Creek Watershed Management Plan is critical to began addressing the sources of impairment in these two creeks.
Implement the Lake Rhodhiss Watershed Restoration Plan (Nonpoint source side of nutrient management action plan)
WPCOG, Stakeholders, BPU
DWQ will work with the WPCOG and other active watershed partners to ensure practices identified in the restoration plan are implemented where they will be most effective during the upcoming planning cycle. DWQ supports the need for funding of this implementation restoration plan.
Development of a Lake Hickory Watershed Management Plan
Local Agencies A Watershed Management Plan, similar to the Lake Rhodhiss plan, should be developed in preparation for possible nutrient problems. DWQ supports the need for funding of this plan development.
Formation of a Catawba River Basin Discharger Coalition
The formation of a Catawba River basin coalition is recommended to assist NPDES Dischargers in collecting more valuable instream data at specific locations in a more cost efficient manner. There are many benefits of a coalition such as reduction in sampling costs, networking/collaboration between facilities, more reliable data, monitoring flexibility, permit benefits and environmental stewardship.

16
NC D
WQ
CATAWBA RIVER BA
SIN PLA
N: BA
SIN O
VERVIEW 2010
Re c o M M e n D at i o n s F o R Fu Rt h e R Ba s i n W i D e st u D y £ A watershed stressor study is needed in Gunpowder Creek to determine the cause of a significant decline in
the biological community. This study should be conducted on a local level; however, DWQ will also support other agency’s efforts to identify the cause.
£ Further study is needed on Lower Little River to identify sources of excess fecal coliform bacteria. Even though Lower Little River is not a primary recreational waterbody, it flows into Lookout Shoals Lake which is used for recreation and is classified as such.
£ A watershed stressor study should be conducted on Middle Little River to identify sources of habitat degradation to assist in restoration planning. Proper restoration could prevent this creek from being listed as impaired.
£ Further study is needed on Lyle Creek to determine the sources of the chlorine odor and other in-stream pollutants.
£ Watershed stressor study for Gar Creek and urban restoration efforts are needed to keep the creek from becoming impaired.
£ Toxics Review/Stressor Study: It is suggested that a watershed stressor study be conducted to not only determine if copper is negatively impacting the South Fork Catawba River and its tributaries, but also to help pinpoint the source of the excessive levels.
£ The impacts of multiple small dams located throughout the basin on water quality and aquatic life conditions during periods of drought.
£ Effects of large number of septic systems on groundwater and surface water nutrient levels within a lake watershed.
£ Coal Ash Ponds: Determining the effects on ground and surface water.
£ Better understanding of impact to water quality due to proliferation of poultry operations throughout the state.
£ Identification of nutrient sources which drain into the chain of lakes below Lake James.
stat e W i D e Re c o M M e n D at i o n s £ It is important that 7Q10 flow values be updated to include changing climatic conditions and water withdrawals
that impact stream flow conditions. All NPDES permitted facilities use 7Q10’s as critical flow in determining permit limits for toxicants. These critical flow values used to determine permit limits for all NPDES facilities may need to be reviewed as the permits come up for renewal. Currently, a 7Q10 is only evaluated in the initial application of the permit and upon expansion. Low flow conditions induced by drought impacts the health of aquatic life as demonstrated in this basin for roughly seven of the ten years between 1997 and 2007 (see Figure 2: stream flow graph). Droughts as well as the demand on water resources are very likely to increase; therefore, the reevaluation of stream flow will become more critical to water quality within the next decade or so. DWQ will work with Division of Water Resources and other divisions and agencies to discuss the need and resource availability to update 7Q10 values.

17
NC
DW
Q C
ATAW
BA R
IVER
BA
SIN
PLA
N:
BA
SIN
OVE
RVIE
W
2010
The table below lists all waterbodies discussed within this plan and includes the 2010 DRAFT Integrated Report category and which section (Restoration, Protection and/or Success) each waterbody discussion can be found.
Table 4: CuRRenT waTeR QualiTy COndiTiOns Of waTeRs MOniTORed wiThin The CaTawba RiveR basin
sTReaM naMe au# 10-digiT huC iR CaTegORy1 ResTORaTiOn/pROTeCTiOn/suCCess2
03050101 - CATAWBA RIVER HEADWATER SUBBASIN
Catawba R 11-(8) 0305010101 3a Protection/Success
Crooked Cr 11-12 0305010101 2 Protection
Left Prong Catawba R 11-6 0305010101 2 Success
Mackey Cr 11-15-(3.5)b 0305010101 2 Success
Catawba R 11-(1) 0305010101 2 Success
N Fk Catawba R 11-24-(1), (2.5)a, (2.5)b, & (13) 0305010102 2 Protection
Pepper Cr 11-24-10 0305010102 2 Protection
Honeycutt Cr 11-24-8 0305010102 2 Protection
White Cr 11-30 0305010103 5 Restoration
Paddy Cr 11-28 0305010103 2 Protection
Linville R 11-29-(4.5) & (19) 0305010103 2 Protection
Irish Cr 11-35-3-(2)b 0305010104 2 Success
Parks Cr 11-38-35 0305010105 5 Restoration
Wilson Cr 11-38-34 0305010105 2 Protection
Stack Rock Cr 11-38-34-5 0305010105 2 Protection
Franklin Br 11-38-31 0305010105 2 Protection
Johns R 11-38-(1), (28), & (35.5) 0305010105 2 Success
Youngs Fk/Corpening Cr 11-32-1-4a & b 0305010106 5 Restoration
Canoe Cr 11-33-(2) 0305010106 5 Restoration
Hunting Cr 11-36-(0.7) 0305010106 5 Restoration
N Muddy Cr 11-32-(0.5) 0305010106 2 Protection
Jacktown Cr 11-32-1-4-1 0305010106 3a Protection
Silver Cr 11-34-(0.5) 0305010106 2 Protection/Success
Catawba R 11-(32.7) 0305010106 2 Protection
S Muddy Cr 11-32-2 0305010106 2 Success
Lower Cr 11-39-(0.5)b, (6.5) & (9) 0305010107 4 Restoration
Spainhour Cr 11-39-3 0305010107 5 Restoration
Blair Fk 11-39-3-1 0305010107 3a Restoration
Greasy Cr 11-39-4b 0305010107 5 Restoration
Bristol Cr 11-39-8 0305010107 5 Restoration
Lower Cr 11-39-(0.5)a 0305010107 2 Protection
Zacks Fk 11-39-1 0305010107 2 Protection
Greasy Cr 11-39-4a 0305010107 2 Protection
McGalliard Cr 11-44-(3) 0305010108 5 Restoration
Gunpowder Cr 11-55-(1.5) 0305010108 5 Restoration
Horseford Cr 11-54-(0.5) 0305010108 5 Restoration
Smoke Cr 11-41-(1) 0305010108 2 Protection
1. The Integrated Report category noted in this table refers to the category given on the DRAFT 2010 Integrated Report.2. Waters monitored in the Catawba River basin are given a designation of Restoration Opportunities, Protection Priorities or Success Stories within this Plan to provide a broad indication of current water quality.

18
NC D
WQ
CATAWBA RIVER BA
SIN PLA
N: BA
SIN O
VERVIEW 2010
sTReaM naMe au# 10-digiT huC iR CaTegORy1 ResTORaTiOn/pROTeCTiOn/suCCess2
Silver Cr 11-56-(2) 0305010108 2 Protection
Drowning Cr 11-52-(1) 0305010108 2 Protection
Upper Little R 11-58 & 11-58-(5.5) 0305010109 2 Protection
Middle Little R 11-62a & b 0305010109 2 Protection
Duck Cr 11-62-(1) & (4) 0305010109 2 Protection
Lower Little R 11-69-(0.5) 0305010110 5 Restoration
Muddy Fk 11-69-4 0305010110 5 Restoration
Lambert Fk 11-69-3 0305010110 2 Protection
Elk Shoal Cr 11-73-(0.5) 0305010110 2 Protection
McLin Cr 11-76-5-(0.7) 0305010111 5 Restoration
Lyle Cr 11-76-(4.5) 0305010111 2 Protection
Forney Cr 11-119-2-3 0305010113 5 Restoration
Dutchmans Cr 11-119-(0.5) 0305010113 5 Restoration
Leepers Cr 11-119-1-(1) 0305010113 2 Protection
Killians Cr 11-119-2-(0.5)a & b 0305010113 2 Protection
McDowell Cr 11-115-(1), (1.5)a, (1.5)b & (5) 0305010114 4 Restoration
Long Cr 11-120-(2.5) 0305010114 5 Restoration
Gar Cr 11-116-(1) 0305010114 2 Protection
McGill Cr 11-135-2 0305010115 5 Restoration
Crowders Cr 11-135a-f 0305010115 5 Restoration
Crowders Cr 11-135g 0305010115 4t Restoration
Catawba Cr 11-130a-c 0305010115 5 Restoration
S Crowders Cr 11-135-10-1 0305010115 5 Restoration
S Fk Catawba Cr 11-135-10 0305010115 2 Protection
Abernethy Cr 11-135-4b 0305010115 2 Success
03050102 - SOUTH FORK CATAWBA RIVER SUBBASIN
Henry Fk 11-129-1-(12.5)b & c 0305010201 5 Restoration
Henry Fk 11-129-1-(12.5)a 0305010201 2 Success
Jacobs Fk 11-129-2-(4) 0305010202 2 Protection
Maiden Cr 11-129-5-7-2-(1) 0305010203 5 Restoration
Clark Cr 11-129-5-(0.3)b & (9.5) 0305010203 5 Restoration
Town Cr 11-129-5-4 0305010203 2 Protection
Potts Cr 11-129-3-(0.3) & (0.7) 0305010204 5 Restoration
S Fk Catawba R 11-129-(0.5) 0305010204 5 Restoration
Howard Cr 11-129-4 0305010204 2 Protection
Indian Cr 11-129-8-(6.5) 0305010205 5 Restoration
Beaverdam Cr 11-129-9-(0.7) 0305010205 2 Protection
Hoyle Cr 11-129-15-(6) 0305010206 5 Restoration
Mauney Cr 11-129-15-5 0305010206 5 Restoration
Long Cr 11-129-16-(4) 0305010206 5 Restoration
Dallas Br 11-129-16-7b 0305010206 5 Restoration
1. The Integrated Report category noted in this table refers to the category given on the DRAFT 2010 Integrated Report.2. Waters monitored in the Catawba River basin are given a designation of Restoration Opportunities, Protection Priorities or Success Stories within this Plan to provide a broad indication of current water quality.

19
NC
DW
Q C
ATAW
BA R
IVER
BA
SIN
PLA
N:
BA
SIN
OVE
RVIE
W
2010
sTReaM naMe au# 10-digiT huC iR CaTegORy1 ResTORaTiOn/pROTeCTiOn/suCCess2
S Fk Catawba R 11-129-(10.5) & (14.5) 0305010206 5 Restoration
S Fk Catawba R 11-129-(15.5) 0305010206 5 Restoration
03050103 - CATAWBA RIVER SUBBASIN
Irwin Cr 11-137-1 0305010301 5 Restoration
Little Sugar Cr 11-137-8a, b, & c 0305010301 5 Restoration
Sugar Cr 11-137a, b, & c 0305010301 5 Restoration
McCullough Br 11-137-7 0305010301 5 Restoration
McAlpine Cr 11-137-9a, b, c, & d 0305010301 5 Restoration
Sixmile Cr 11-138-3 0305010302 5 Restoration
Twelvemile Cr 11-138 0305010302 5 Restoration
Waxhaw Cr 11-139 0305010303 2 Protection
1. The Integrated Report category noted in this table refers to the category given on the DRAFT 2010 Integrated Report.2. Waters monitored in the Catawba River basin are given a designation of Restoration Opportunities, Protection Priorities or Success Stories within this Plan to provide a broad indication of current water quality.
figuRe 16: TuRbidiTy exCeedanCes beTween 2004 & 2008
!(
!(
!(
!(
!(
!(
!(
!(!(
!(
!(
!(!(
!(!(
!(
!(!(
!(
!(
!(
!(
!(
!(
!(!(
!(
!(
!(!(
!(
!(
Ambient Monitoring Site!( No Exceedance!( < 10 %!( 10% - 20%!( > 20%
8-Digit Hydrologic Units030501010305010203050103
Turbidity Exceedances2004 - 2008

20
NC D
WQ
CATAWBA RIVER BA
SIN PLA
N: BA
SIN O
VERVIEW 2010
figuRe 17: ph exCeedanCes beTween 2004 & 2008
!(
!(
!(
!(
!(!(
!(!(
!(!(!(
!(
!(
!(!(
!(!(
!(
!(!(
!(
!(
!(!(
!(
!(
!(
!(!(
!(
!(!(
!(!(!(!(
!(
!(
!(
!(
!(
!(
!( !(
!(
!(
!(
!(!(
!(!(
!(
!(
!(
!(
!(
!(
!(
!(
!(
!(
!(
Ambient Monitoring Site!( No Exceedance!( < 10 %!( 10% - 20%!( > 20%
8-Digit Hydrologic Units030501010305010203050103
Low pH Exceedances2004 - 2008
figuRe 18: COppeR exCeedanCes beTween 2004 & 2008
!(
!(
!(
!(
!(
!(
!(!(
!(
!(
!(!(
!(!(
!(
!(!(
!(
!(
!(
!(
!(
!(
!(!(
!(
!(
!(
!(!(
!(
!(!(
!(
Ambient Monitoring Site!( No Exceedance!( < 10 %!( 10% - 20%!( > 20%
8-Digit Hydrologic Units030501010305010203050103
Copper Exceedances2004 - 2008

21
NC
DW
Q C
ATAW
BA R
IVER
BA
SIN
PLA
N:
BA
SIN
OVE
RVIE
W
2010
figuRe 19: dO exCeedanCes beTween 2004 & 2008
!(
!(
!(
!(
!(
!(
!(
!(!(
!(
!(
!(!(
!(!(
!(
!(!(
!(
!(
!(
!(
!(
!(
!(!(
!(
!(
!(!(
!(
!(
Ambient Monitoring Site!( No Exceedance!( < 10 %!( 10% - 20%!( > 20%
8-Digit Hydrologic Units030501010305010203050103
Dissolved Oxygen Exceedances2004 - 2008
figuRe 20: TeMpeRaTuRe exCeedanCes beTween 2004 & 2008
!(
!(
!(
!(
!(
!(
!(
!(!(
!(
!(
!(!(
!(!(
!(
!(!(
!(
!(
!(
!(
!(
!(
!(!(
!(
!(
!(!(
!(
!(
Ambient Monitoring Site!( No Exceedance!( < 10 %!( 10% - 20%!( > 20%
8-Digit Hydrologic Units030501010305010203050103
Temperature Exceedances2004 - 2008

22
NC D
WQ
CATAWBA RIVER BA
SIN PLA
N: BA
SIN O
VERVIEW 2010
figuRe 21: fCb exCeedanCes beTween 2004 & 2008
!(
!(
!(
!(
!(
!(
!(
!(!(
!(
!(
!(!(
!(!(
!(
!(!(
!(
!(
!(
!(
!(
!(
!(!(
!(
!(
!(!(
!(
!(
Ambient Monitoring Site!( No Exceedance!( < 10 %!( 10% - 20%!( > 20%
8-Digit Hydrologic Units030501010305010203050103
Fecal Coliform Bacteria Exceedances2004 - 2008

23
NC
DW
Q C
ATAW
BA R
IVER
BA
SIN
PLA
N:
BA
SIN
OVE
RVIE
W
2010
ReFeRences
Beach, D. 2002. Coastal Sprawl: The Effects of Urban Design on Aquatic Ecosystems in the United States. Pew Oceans Commission, Arlington, VA.
Galli, J. 1991. Thermal Impacts Associated with Urbanization and Stormwater Management Best Management Practices. Metropolitan Washington Council of Governments, Maryland Department of Environment: Washington, D.C.
Homer, C., C. Huang, L. Yang, B. Wylie and M. Coan, 2004. Development of a 2001 National Land Cover Database for the United States. Photogrammetric Engineering and Remote Sensing Vol.70, No.7, pp 829-840. www.mrlc.gov.
Pate, Travis. 2009. Watershed Assessment in North Carolina: Building a Watershed Database with Population, Land Cover, and Impervious Cover Information. Master Theses, University of North Carolina at Chapel Hill.
Pradhan, S. S., M. T. Hoover, R. E. Austin, and H. A. Devine. May 2007. Potential Nitrogen Contributions from On-site Wastewater Treatment Systems to North Carolina’s River Basins and Sub-basins. North Carolina State University, Raleigh, North Carolina. North Carolina Agricultural Research Service. Technical Bulletin 324.
Schueler, T., and H.K. Holland. 2000. The Practice of Watershed Protection. Center for Watershed Protection, Ellicott City, Maryland.

24
NC D
WQ
CATAWBA RIVER BA
SIN PLA
N: BA
SIN O
VERVIEW 2010