b&b usd #451 - ksde.org finance/budget/budget_at_a_glance/09-10... · miles away in...
TRANSCRIPT

B&B USD #451
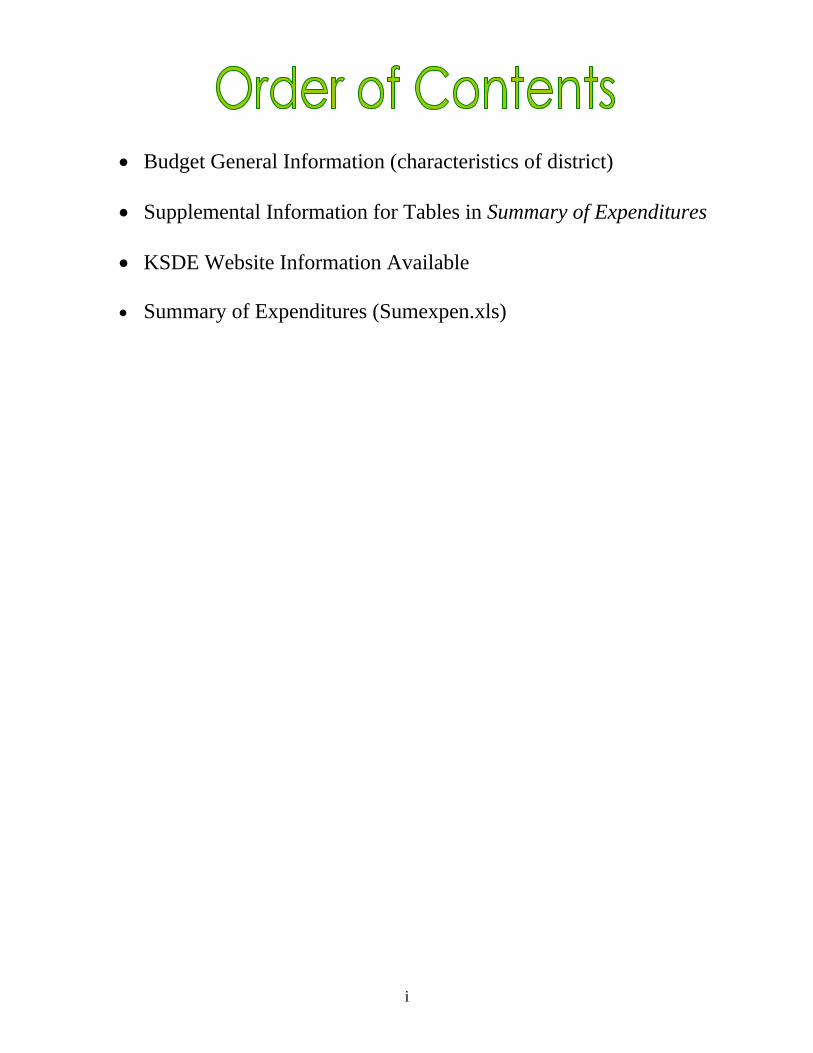
• Budget General Information (characteristics of district)
• Supplemental Information for Tables in Summary of Expenditures
• KSDE Website Information Available
• Summary of Expenditures (Sumexpen.xls)
i

1
2009-2010 Budget General Information USD #: 451 .
Introduction USD 451 is compromised of B&B Elementary, K-6, located in St. Benedicts, Kansas. About 8 miles away in Baileyville, Kansas, is the location of B&B Jr./Sr. High School, grades 7-12. The district is located in the northwest part of Nemaha County. We are compromised mainly of rural families and agriculture is the mainstay of our economy. We are a proud and very successful community both academically and in extracurricular activities.
Board Members Dale Sudbeck Jim Dalinghaus Nick Holthaus John V. Haug Alan Schmitz Martin Haug Steve Sudbeck
Key Staff Superintendent: Jerry Turner Administrative Assistants: Shirley Claas, Ben Scism Business Office Staff: Carol Hunninghake Curriculum & Instruction Staff: Laurie Neihues and Sandy Bartkoski
The District’s Accomplishments and Challenges Accomplishments: USD #451 has achieved “AYP” as a district and at both the elementary and secondary attendance centers for the 2008-2009 school year. The district has maintained a 100% graduation rate for over 17 years. Our excellent and dedicated staff along with our solid and stable families are the main contributing factors to the students who achieve these accomplishments. Challenges: The single biggest challenge our district faces is financial. As our enrollment decreases, shrinking our budget, we have, and will continue to embrace the concept of efficiency. It is our hope that the state legislature will continue to fund us such that we can remain an academically prosperous and successful school. Our students deserve those opportunities at B&B schools.

2
Supplemental Information for the Following Tables 1. Summary of Total Expenditures by Function (All Funds) 2. Summary of General Fund Expenditures by Function 3. Summary of Supplemental General Fund Expenditures by Function 4. Summary of General and Supplemental General Fund Expenditures by Function 5. Summary of Special Education Fund by Function 6. Instruction Expenditures (1000) 7. Student and Instructional Support Expenditures (2100 & 2200) 8. General Administration Expenditures (2300) 9. School Administration Expenditures (2400) 10. Operations and Maintenance Expenditures (2600) 11. Other Costs (2500 & 2900: Other Supplemental Services) (3000: Non-Instruction Services) 12. Capital Improvements (4000) 13. Debt Services (5000) 14. Miscellaneous Information Unencumbered Cash Balance by Fund 15. Reserve Funds Unencumbered Cash Balance 16. Other Information - FTE 17. Miscellaneous Information Mill Rates by Fund 18. Other Information – Assessed Valuation and Bonded Indebtedness Note: The FTE (full time equivalency) used in this report to calculate the “Amount Per Pupil” is defined as following: Enrollment (FTE) includes the enrollment of the district used for state aid and budget authority, and all other preschool enrollment and kindergarten students attending full time.

3
KSDE Website Information Available K-12 Statistics (Building, District or State Totals) http://www.ksde.org/Default.aspx?tabid=223
• Attendance / Enrollment Reports • Staff Reports • Graduates / Dropouts Reports • Crime / Violence Reports
School Finance Reports and Publications http://www.ksde.org/Default.aspx?tabid=1870
• Certified Personnel • Enrollment • Dropouts • Graduates • Salary Reports
Kansas Building Report Card (listed on the right under Data Portal sections) http://www.ksde.org/Default.aspx?tabid=229
• Attendance Rate • Graduation Rate • Dropout Rate • School Violence • Assessments
o Reading o Mathematics o Writing
• Graduates Passing Adv. Science Courses • Graduates Passing Adv. Math Courses
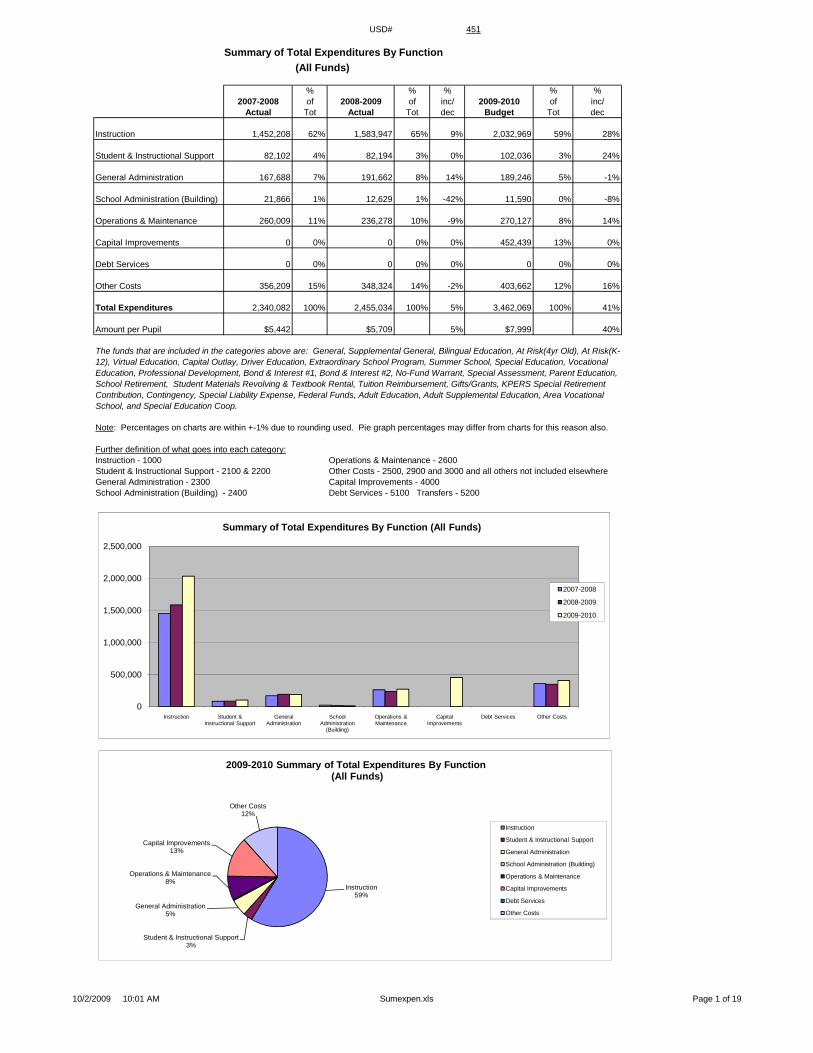
USD# 451
Summary of Total Expenditures By Function(All Funds)
% % % % %2007-2008 of 2008-2009 of inc/ 2009-2010 of inc/
Actual Tot Actual Tot dec Budget Tot dec
Instruction 1,452,208 62% 1,583,947 65% 9% 2,032,969 59% 28%
Student & Instructional Support 82,102 4% 82,194 3% 0% 102,036 3% 24%
General Administration 167,688 7% 191,662 8% 14% 189,246 5% -1%
School Administration (Building) 21,866 1% 12,629 1% -42% 11,590 0% -8%
Operations & Maintenance 260,009 11% 236,278 10% -9% 270,127 8% 14%
Capital Improvements 0 0% 0 0% 0% 452,439 13% 0%
Debt Services 0 0% 0 0% 0% 0 0% 0%
Other Costs 356,209 15% 348,324 14% -2% 403,662 12% 16%
Total Expenditures 2,340,082 100% 2,455,034 100% 5% 3,462,069 100% 41%
Amount per Pupil $5,442 $5,709 5% $7,999 40%
Note: Percentages on charts are within +-1% due to rounding used. Pie graph percentages may differ from charts for this reason also.
Further definition of what goes into each category:Instruction - 1000 Operations & Maintenance - 2600Student & Instructional Support - 2100 & 2200 Other Costs - 2500, 2900 and 3000 and all others not included elsewhereGeneral Administration - 2300 Capital Improvements - 4000School Administration (Building) - 2400 Debt Services - 5100 Transfers - 5200
The funds that are included in the categories above are: General, Supplemental General, Bilingual Education, At Risk(4yr Old), At Risk(K-12), Virtual Education, Capital Outlay, Driver Education, Extraordinary School Program, Summer School, Special Education, Vocational Education, Professional Development, Bond & Interest #1, Bond & Interest #2, No-Fund Warrant, Special Assessment, Parent Education, School Retirement, Student Materials Revolving & Textbook Rental, Tuition Reimbursement, Gifts/Grants, KPERS Special Retirement Contribution, Contingency, Special Liability Expense, Federal Funds, Adult Education, Adult Supplemental Education, Area Vocational School, and Special Education Coop.
0
500,000
1,000,000
1,500,000
2,000,000
2,500,000
Instruction Student & Instructional Support
General Administration
School Administration
(Building)
Operations & Maintenance
Capital Improvements
Debt Services Other Costs
Summary of Total Expenditures By Function (All Funds)
2007-2008
2008-2009
2009-2010
Instruction59%
Student & Instructional Support3%
General Administration5%
Operations & Maintenance8%
Capital Improvements13%
Other Costs12%
2009-2010 Summary of Total Expenditures By Function(All Funds)
Instruction
Student & Instructional Support
General Administration
School Administration (Building)
Operations & Maintenance
Capital Improvements
Debt Services
Other Costs
10/2/2009 10:01 AM Sumexpen.xls Page 1 of 19

USD# 451
Summary of General Expendituresby Function
% % % % %2007-2008 of 2008-2009 of inc/ 2009-2010 of inc/
Actual Tot Actual Tot dec Budget Tot dec
Instruction 1,005,904 61% 1,051,300 64% 5% 995,571 63% -5%
Student & Instructional Support 67,107 4% 63,124 4% -6% 64,191 4% 2%
General Administration 147,736 9% 136,246 8% -8% 136,246 9% 0%
School Administration (Building) 19,036 1% 10,690 1% -44% 7,590 0% -29%
Operations & Maintenance 195,210 12% 156,107 10% -20% 142,457 9% -9%
Capital Improvements 0 0% 0 0% 0% 0 0% 0%
Other Costs 226,995 14% 214,183 13% -6% 230,074 15% 7%
Total Expenditures 1,661,988 100% 1,631,650 100% -2% 1,576,129 100% -3%
Amount per Pupil $3,865 $3,795 -2% $3,642 -4%
The Summary of General Fund Expenditures chart information comes from pages 6-13 and only uses the 'General Fund' line items.
600,000
800,000
1,000,000
1,200,000
Summary of General Fund Expendituresby Function
2007-2008
2008-2009
2009-2010
0
200,000
400,000
600,000
800,000
1,000,000
1,200,000
Instruction Student & Instructional
Support
General Administration
School Administration
(Building)
Operations & Maintenance
Capital Improvements
Other Costs
Summary of General Fund Expendituresby Function
2007-2008
2008-2009
2009-2010
Instruction63%
Student & Instructional Support
4%
General Administration9%
Operations & Maintenance9%
Other Costs15%
2009-2010 Summary of General Fund Expendituresby Function
Instruction
Student & Instructional Support
General Administration
School Administration (Building)
Operations & Maintenance
Capital Improvements
Other Costs
10/2/2009 10:01 AM Sumexpen.xls Page 2 of 19
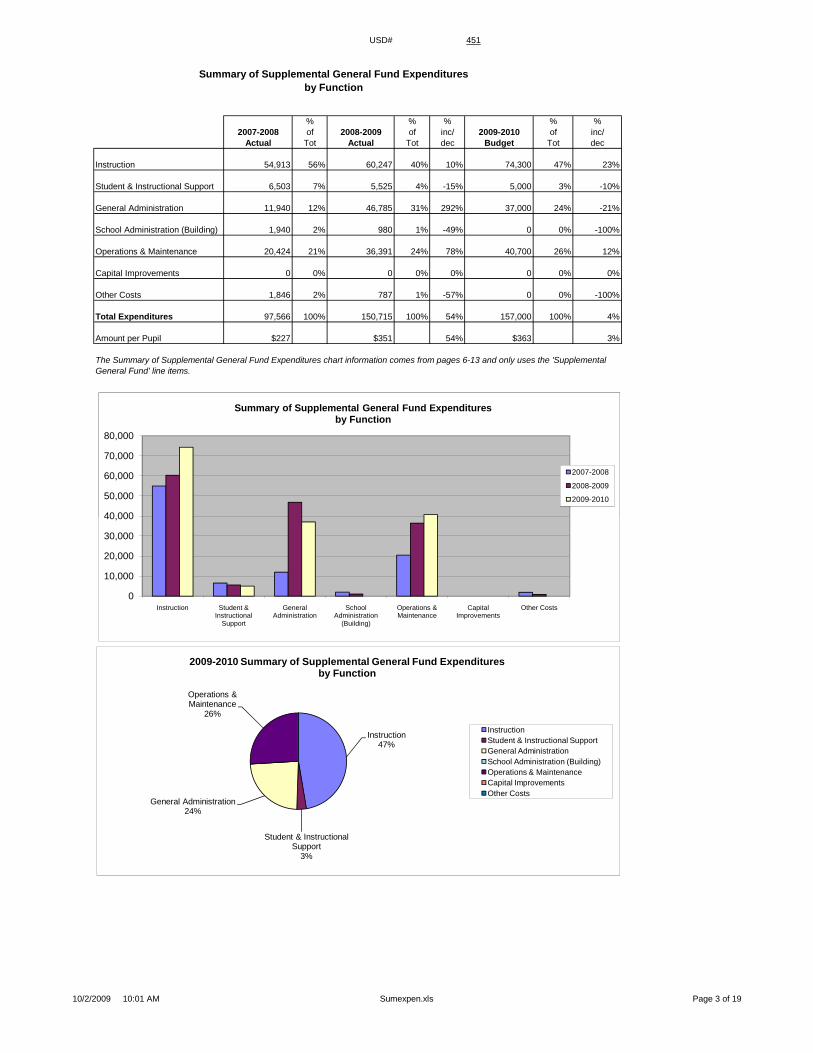
USD# 451
Summary of Supplemental General Fund Expendituresby Function
% % % % %2007-2008 of 2008-2009 of inc/ 2009-2010 of inc/
Actual Tot Actual Tot dec Budget Tot dec
Instruction 54,913 56% 60,247 40% 10% 74,300 47% 23%
Student & Instructional Support 6,503 7% 5,525 4% -15% 5,000 3% -10%
General Administration 11,940 12% 46,785 31% 292% 37,000 24% -21%
School Administration (Building) 1,940 2% 980 1% -49% 0 0% -100%
Operations & Maintenance 20,424 21% 36,391 24% 78% 40,700 26% 12%
Capital Improvements 0 0% 0 0% 0% 0 0% 0%
Other Costs 1,846 2% 787 1% -57% 0 0% -100%
Total Expenditures 97,566 100% 150,715 100% 54% 157,000 100% 4%
Amount per Pupil $227 $351 54% $363 3%
The Summary of Supplemental General Fund Expenditures chart information comes from pages 6-13 and only uses the 'Supplemental General Fund' line items.
40 000
50,000
60,000
70,000
80,000
Summary of Supplemental General Fund Expendituresby Function
2007-2008
2008-2009
2009-2010
Instruction47%
Student & Instructional Support
3%
General Administration24%
Operations & Maintenance
26%
2009-2010 Summary of Supplemental General Fund Expendituresby Function
InstructionStudent & Instructional SupportGeneral AdministrationSchool Administration (Building)Operations & MaintenanceCapital ImprovementsOther Costs
0
10,000
20,000
30,000
40,000
50,000
60,000
70,000
80,000
Instruction Student & Instructional
Support
General Administration
School Administration
(Building)
Operations & Maintenance
Capital Improvements
Other Costs
Summary of Supplemental General Fund Expendituresby Function
2007-2008
2008-2009
2009-2010
10/2/2009 10:01 AM Sumexpen.xls Page 3 of 19

USD# 451Summary of General and Supplemental General Fund
Expenditures by Function
% % % % %2007-2008 of 2008-2009 of inc/ 2009-2010 of inc/
Actual Tot Actual Tot dec Budget Tot dec
Instruction 1,060,817 60% 1,111,547 62% 5% 1,069,871 62% -4%
Student & Instructional Support 73,610 4% 68,649 4% -7% 69,191 4% 1%
General Administration 159,676 9% 183,031 10% 15% 173,246 10% -5%
School Administration (Building) 20,976 1% 11,670 1% -44% 7,590 0% -35%
Operations & Maintenance 215,634 12% 192,498 11% -11% 183,157 11% -5%
Capital Improvements 0 0% 0 0% 0% 0 0% 0%
Other Costs 228,841 13% 214,970 12% -6% 230,074 13% 7%
Total Expenditures 1,759,554 100% 1,782,365 100% 1% 1,733,129 100% -3%
Amount per Pupil $4,092 $4,145 1% $4,004 -3%
The Summary of General and Supplemental General Fund Expenditures chart information comes from pages 6-13 and adds togetherthe 'General Fund' and 'Supplemental General Fund' line items.
400,000
600,000
800,000
1,000,000
1,200,000
Summary of General and Supplemental General FundExpenditures by Function
2007-2008
2008-2009
2009-2010
0
200,000
400,000
600,000
800,000
1,000,000
1,200,000
Instruction Student & Instructional
Support
General Administration
School Administration
(Building)
Operations & Maintenance
Capital Improvements
Other Costs
Summary of General and Supplemental General FundExpenditures by Function
2007-2008
2008-2009
2009-2010
Instruction62%
Student & Instructional Support
4%
General Administration10%
Operations & Maintenance11%
Other Costs13%
2009-2010 Summary of General and Supplemental General Fund Expenditures by Function
Instruction
Student & Instructional Support
General Administration
School Administration (Building)
Operations & Maintenance
Capital Improvements
Other Costs
10/2/2009 10:01 AM Sumexpen.xls Page 4 of 19

USD# 451
Summary of Special Education Fundby Function
% % % % %2007-2008 of 2008-2009 of inc/ 2009-2010 of inc/
Actual Tot Actual Tot dec Budget Tot dec
Instruction 148,966 99% 163,557 100% 10% 240,679 99% 47%
Student & Instructional Support 0 0% 0 0% 0% 0 0% 0%
General Administration 0 0% 0 0% 0% 0 0% 0%
School Administration (Building) 0 0% 0 0% 0% 0 0% 0%
Operations & Maintenance 0 0% 0 0% 0% 0 0% 0%
Capital Improvements 0 0% 0 0% 0% 0 0% 0%
Other Costs 2,004 1% 768 0% -62% 2,500 1% 226%
Total Expenditures 150,970 100% 164,325 100% 9% 243,179 100% 48%
Amount per Pupil $351 $382 9% $562 47%
The Summary of Special Education Fund Expenditures chart information comes from pages 6-13 and only uses the 'Special Education Fund'line items. (Total expenditures excludes Special Ed Coop Fund because it would include expenditures for all schools participating in the Coop.)
100,000
150,000
200,000
250,000
300,000
Summary of Special Education Fund Expendituresby Function
2007-2008
2008-2009
2009-2010
0
50,000
100,000
150,000
200,000
250,000
300,000
Instruction Student & Instructional
Support
General Administration
School Administration
(Building)
Operations & Maintenance
Capital Improvements
Other Costs
Summary of Special Education Fund Expendituresby Function
2007-2008
2008-2009
2009-2010
Instruction99%
Other Costs1%
2009-2010 Summary of Special Education Fundby Function
Instruction
Student & Instructional Support
General Administration
School Administration (Building)
Operations & Maintenance
Capital Improvements
Other Costs
10/2/2009 10:01 AM Sumexpen.xls Page 5 of 19

USD# 451Instruction Expenditures (1000)
% %2007-2008 2008-2009 inc/ 2009-2010 inc/
Actual Actual dec Budget dec
General 1,005,904 1,051,300 5% 995,571 -5%Federal Funds 39,254 36,803 -6% 47,017 28%Supplemental General 54,913 60,247 10% 74,300 23%At Risk (4yr Old) 0 0 0% 0 0%At Risk (K-12) 46,500 48,154 4% 71,325 48%Bilingual Education 0 0 0% 0 0%Virtual Education 0 0 0%Capital Outlay 5,229 67,259 1186% 431,845 542%Driver Education 3,063 2,288 -25% 24,884 988%Declining Enrollment 0 0 0% 0 0%Extraordinary School Program 0 0 0% 0 0%Food Service 0 0 0% 0 0%Professional Development 0 0 0% 0 0%Parent Education Program 0 0 0% 0 0%Summer School 0 0 0% 0 0%Special Education 148,966 163,557 10% 240,679 47%Cost of Living 0 0 0% 0 0%Vocational Education 79,243 72,819 -8% 76,353 5%Gifts/Grants 0 0 0% 0 0%Special Liability 0 0 0% 0 0%School Retirement 0 0 0% 0 0%Extraordinary Growth Facilities 0 0 0% 0 0%Special Reserve 0 0 0%KPERS Spec. Ret. Contribution 65,876 70,965 8% 70,995 0%Contingency Reserve 0 0 0%Text Book & Student Material 3,260 10,555 224%Bond & Interest #1 0 0 0% 0 0%Bond & Interest #2 0 0 0% 0 0%No-Fund Warrant 0 0 0% 0 0%Special Assessment 0 0 0% 0 0%Temporary Note 0 0 0% 0 0%
SUBTOTAL 1,452,208 1,583,947 9% 2,032,969 28%Enrollment (FTE)* 430.0 430.0 0% 432.8 1%Amount per Pupil 3,377 3,684 9% 4,697 28%
Adult Education 0 0 0% 0 0%Adult Supplemental Education 0 0 0% 0 0%A V i l S h l 0 0 0%Area Vocational School 0 0 0%Tuition Reimbursement 0 0 0% 0 0%Special Education Coop 0 0 0% 0 0%TOTAL 1,452,208 1,583,947 9% 2,032,969 28%
NOTE: Gifts/Grants includes private grants and grants from nonfederal sources.
Amount per pupil excludes the following funds: Area Vocational School, Adult Education, Adult Supplemental Education,Special Education Coop and Tuition Reimbursement.
*Enrollment (FTE) includes the enrollment of the district used for state aid and budget authority, and all other preschool enrollmentand kindergarten students attending full time.
0
500,000
1,000,000
1,500,000
2,000,000
2,500,000
2007-2008 2008-2009 2009-2010
Instruction Expenditures
0
200,000
400,000
600,000
800,000
1,000,000
1,200,000
2007-2008 2008-2009 2009-2010
Instruction Expenditures
General
Supplemental General
Special Education
10/2/2009 10:01 AM Sumexpen.xls Page 6 of 19

USD# 451
Student and Instructional Support Expenditures (2100 & 2200)
% %2007-2008 2008-2009 inc/ 2009-2010 inc/
Actual Actual dec Budget dec
General 67,107 63,124 -6% 64,191 2%Federal Funds 0 0 0% 0 0%Supplemental General 6,503 5,525 -15% 5,000 -10%At Risk (4yr Old) 0 0 0% 0 0%At Risk (K-12) 0 0 0% 0 0%Bilingual Education 0 0 0% 0 0%Virtual Education 0 0 0%Capital Outlay 0 0 0% 0 0%Driver Training 10 0 -100% 0 0%Declining Enrollment 0 0 0% 0 0%Extraordinary School Program 0 0 0% 0 0%Food Service 0 0 0% 0 0%Professional Development 4,236 9,268 119% 22,845 146%Parent Education Program 0 0 0% 0 0%Summer School 0 0 0% 0 0%Special Education 0 0 0% 0 0%Cost of Living 0 0 0% 0 0%Vocational Education 0 0 0% 0 0%Gifts/Grants 0 0 0% 0 0%Special Liability 0 0 0% 0 0%School Retirement 0 0 0% 0 0%Extraordinary Growth Facilities 0 0 0% 0 0%Special Reserve 0 0 0%KPERS Spec. Ret. Contribution 3,561 3,836 8% 10,000 161%Contingency Reserve 0 0 0%Text Book & Student Material 685 441 -36%Bond & Interest #1 0 0 0% 0 0%Bond & Interest #2 0 0 0% 0 0%No-Fund Warrant 0 0 0% 0 0%Special Assessment 0 0 0% 0 0%Temporary Note 0 0 0% 0 0%
SUBTOTAL 82,102 82,194 0% 102,036 24%Enrollment (FTE)* 430.0 430.0 0% 432.8 1%Amount per Pupil 191 191 0% 236 23%
Adult Education 0 0 0% 0 0%Adult Supplemental Education 0 0 0% 0 0%Area Vocational School 0 0 0%Tuition Reimbursement 0 0 0% 0 0%Special Education Coop 0 0 0% 0 0%TOTAL 82,102 82,194 0% 102,036 24%Amount per Pupil $411 $427 4% $546 28%
NOTE: Gifts/Grants includes private grants and grants from nonfederal sources.
Amount per pupil excludes the following funds: Area Vocational School, Adult Education, Adult Supplemental Education,Special Education Coop and Tuition Reimbursement.
*Enrollment (FTE) includes the enrollment of the district used for state aid and budget authority, and all other preschool enrollmentand kindergarten students attending full time.
0
20,000
40,000
60,000
80,000
100,000
120,000
2007-2008 2008-2009 2009-2010
Student and Instructional Support Expenditures
10/2/2009 10:01 AM Sumexpen.xls Page 7 of 19

USD# 451
General Administration Expenditures (2300)
% %2007-2008 2008-2009 inc/ 2009-2010 inc/
Actual Actual dec Budget dec
General 147,736 136,246 -8% 136,246 0%Federal Funds 0 0 0% 0 0%Supplemental General 11,940 46,785 292% 37,000 -21%At Risk (4yr Old) 0 0 0% 0 0%At Risk (K-12) 0 0 0% 0 0%Bilingual Education 0 0 0% 0 0%Virtual Education 0 0 0%Capital Outlay 0 0 0% 0 0%Driver Training 0 0 0% 0 0%Declining Enrollment 0 0 0% 0 0%Extraordinary School Program 0 0 0% 0 0%Food Service 0 0 0% 0 0%Professional Development 0 0 0% 0 0%Parent Education Program 0 0 0% 0 0%Summer School 0 0 0% 0 0%Special Education 0 0 0% 0 0%Cost of Living 0 0 0% 0 0%Vocational Education 0 0 0% 0 0%Gifts/Grants 0 0 0% 0 0%Special Liability Expense 0 0 0% 0 0%School Retirement 0 0 0% 0 0%Extraordinary Growth Facilities 0 0 0% 0 0%Special Reserve 0 0 0%KPERS Spec. Ret. Contribution 8,012 8,631 8% 16,000 85%Contingency Reserve 0 0 0%Text Book & Student Material 0 0 0%Bond & Interest #1 0 0 0% 0 0%Bond & Interest #2 0 0 0% 0 0%No-Fund Warrant 0 0 0% 0 0%Special Assessment 0 0 0% 0 0%Temporary Note 0 0 0% 0 0%
SUBTOTAL 167,688 191,662 14% 189,246 -1%Enrollment (FTE)* 430.0 430.0 0% 432.8 1%Amount per Pupil 390 446 14% 437 -2%
Adult Education 0 0 0% 0 0%Adult Education 0 0 0% 0 0%Adult Supplemental Education 0 0 0% 0 0%Area Vocational School 0 0 0%Tuition Reimbursement 0 0 0% 0 0%Special Education Coop 0 0 0% 0 0%TOTAL 167,688 191,662 14% 189,246 -1%
NOTE: Gifts/Grants includes private grants and grants from nonfederal sources.
Amount per pupil excludes the following funds: Area Vocational School, Adult Education, Adult Supplemental Education,Special Education Coop and Tuition Reimbursement.
*Enrollment (FTE) includes the enrollment of the district used for state aid and budget authority, and all other preschool enrollmentand kindergarten students attending full time.
0
50,000
100,000
150,000
200,000
250,000
2007-2008 2008-2009 2009-2010
General Administration Expenditures
10/2/2009 10:01 AM Sumexpen.xls Page 8 of 19

USD# 451
School Administration Expenditures (2400)
% %2007-2008 2008-2009 inc/ 2009-2010 inc/
Actual Actual dec Budget dec
General 19,036 10,690 -44% 7,590 -29%Federal Funds 0 0 0% 0 0%Supplemental General 1,940 980 -49% 0 -100%At Risk (4yr Old) 0 0 0% 0 0%At Risk (K-12) 0 0 0% 0 0%Bilingual Education 0 0 0% 0 0%Virtual Education 0 0 0%Capital Outlay 0 0 0% 0 0%Driver Training 0 0 0% 0 0%Declining Enrollment 0 0 0% 0 0%Extraordinary School Program 0 0 0% 0 0%Food Service 0 0 0% 0 0%Professional Development 0 0 0% 0 0%Parent Education Program 0 0 0% 0 0%Summer School 0 0 0% 0 0%Special Education 0 0 0% 0 0%Cost of Living 0 0 0% 0 0%Vocational Education 0 0 0% 0 0%Gifts/Grants 0 0 0% 0 0%Special Liability Expense 0 0 0% 0 0%School Retirement 0 0 0% 0 0%Extraordinary Growth Facilities 0 0 0% 0 0%Special Reserve 0 0 0%KPERS Spec. Ret. Contribution 890 959 8% 4,000 317%Contingency Reserve 0 0 0%Text Book & Student Material 0 0 0%Bond & Interest #1 0 0 0% 0 0%Bond & Interest #2 0 0 0% 0 0%No-Fund Warrant 0 0 0% 0 0%Special Assessment 0 0 0% 0 0%Temporary Note 0 0 0% 0 0%
SUBTOTAL 21,866 12,629 -42% 11,590 -8%Enrollment (FTE)* 430.0 430.0 0% 432.8 1%Amount per Pupil 51 29 -42% 27 -9%
Adult Education 0 0 0% 0 0%Adult Education 0 0 0% 0 0%Adult Supplemental Education 0 0 0% 0 0%Area Vocational School 0 0 0%Tuition Reimbursement 0 0 0% 0 0%Special Education Coop 0 0 0% 0 0%TOTAL 21,866 12,629 -42% 11,590 -8%
NOTE: Gifts/Grants includes private grants and grants from nonfederal sources.
Amount per pupil excludes the following funds: Area Vocational School, Adult Education, Adult Supplemental Education,Special Education Coop and Tuition Reimbursement.
*Enrollment (FTE) includes the enrollment of the district used for state aid and budget authority, and all other preschool enrollmentand kindergarten students attending full time.
0
5,000
10,000
15,000
20,000
25,000
2007-2008 2008-2009 2009-2010
School Administration Expenditures
10/2/2009 10:01 AM Sumexpen.xls Page 9 of 19

USD# 451
Operations and Maintenance Expenditures (2600)
% %2007-2008 2008-2009 inc/ 2009-2010 inc/
Actual Actual dec Budget dec
General 195,210 156,107 -20% 142,457 -9%Federal Funds 0 0 0% 0 0%Supplemental General 20,424 36,391 78% 40,700 12%At Risk (4yr Old) 0 0 0% 0 0%At Risk (K-12) 0 0 0% 0 0%Bilingual Education 0 0 0% 0 0%Virtual Education 0 0 0%Capital Outlay 38,985 38,985 0% 77,970 100%Driver Training 939 0 -100% 4,000 0%Declining Enrollment 0 0 0% 0 0%Extraordinary School Program 0 0 0% 0 0%Food Service 0 0 0% 0 0%Professional Development 0 0 0% 0 0%Parent Education Program 0 0 0% 0 0%Summer School 0 0 0% 0 0%Special Education 0 0 0% 0 0%Cost of Living 0 0 0% 0 0%Vocational Education 0 0 0% 0 0%Gifts/Grants 0 0 0% 0 0%Special Liability 0 0 0% 0 0%School Retirement 0 0 0% 0 0%Extraordinary Growth Facilities 0 0 0% 0 0%Special Reserve 0 0 0%KPERS Spec. Ret. Contribution 4,451 4,795 8% 5,000 4%Contingency Reserve 0 0 0%Text Book & Student Material 0 0 0%Bond & Interest #1 0 0 0% 0 0%Bond & Interest #2 0 0 0% 0 0%No-Fund Warrant 0 0 0% 0 0%Special Assessment 0 0 0% 0 0%Temporary Note 0 0 0% 0 0%
SUBTOTAL 260,009 236,278 -9% 270,127 14%Enrollment (FTE)* 430.0 430.0 0% 432.8 1%Amount per Pupil 605 549 -9% 624 14%
Adult Education 0 0 0% 0 0%Adult Education 0 0 0% 0 0%Adult Supplemental Education 0 0 0% 0 0%Area Vocational School 0 0 0%Tuition Reimbursement 0 0 0% 0 0%Special Education Coop 0 0 0% 0 0%TOTAL 260,009 236,278 -9% 270,127 14%
NOTE: Gifts/Grants includes private grants and grants from nonfederal sources.
Amount per pupil excludes the following funds: Area Vocational School, Adult Education, Adult Supplemental Education,Special Education Coop and Tuition Reimbursement.
*Enrollment (FTE) includes the enrollment of the district used for state aid and budget authority, and all other preschool enrollmentand kindergarten students attending full time.
0
50,000
100,000
150,000
200,000
250,000
300,000
2007-2008 2008-2009 2009-2010
Operations and Maintenance Expenditures
10/2/2009 10:01 AM Sumexpen.xls Page 10 of 19

USD# 451
Other Costs(2500 & 2900: Other Supplemental Services)
(2700: Transportation)(3000: Non-Instruction Services)
% %2007-2008 2008-2009 inc/ 2009-2010 inc/
Actual Actual dec Budget dec
General 226,995 214,183 -6% 230,074 7%Federal Funds 0 0 0% 0 0%Supplemental General 1,846 787 -57% 0 -100%At Risk (4yr Old) 0 0 0% 0 0%At Risk (K-12) 0 0 0% 0 0%Bilingual Education 0 0 0% 0 0%Virtual Education 0 0 0%Capital Outlay 0 0 0% 0 0%Driver Training 0 0 0% 0 0%Declining Enrollment 0 0 0% 0 0%Extraordinary School Program 0 0 0% 0 0%Food Service 119,132 125,875 6% 160,088 27%Professional Development 0 0 0% 0 0%Parent Education Program 0 0 0% 0 0%Summer School 0 0 0% 0 0%Special Education 2,004 768 -62% 2,500 226%Cost of Living 0 0 0% 0 0%Vocational Education 0 0 0% 0 0%Gifts/Grants 0 0 0% 0 0%Special Liability 0 0 0% 0 0%School Retirement 0 0 0% 0 0%Extraordinary Growth Facilities 0 0 0% 0 0%Special Reserve 0 0 0%KPERS Spec. Ret. Contribution 6,232 6,711 8% 11,000 64%Contingency Reserve 0 0 0%Text Book & Student Material 0 0 0%Bond & Interest #1 0 0 0% 0 0%Bond & Interest #2 0 0 0% 0 0%No-Fund Warrant 0 0 0% 0 0%Special Assessment 0 0 0% 0 0%Temporary Note 0 0 0% 0 0%
SUBTOTAL 356,209 348,324 -2% 403,662 16%Enrollment (FTE)* 430 0 430 0 0% 432 8 1%Enrollment (FTE)* 430.0 430.0 0% 432.8 1%Amount per Pupil 828 810 -2% 933 15%
Adult Education 0 0 0% 0 0%Adult Supplemental Education 0 0 0% 0 0%Area Vocational School 0 0 0%Tuition Reimbursement 0 0 0% 0 0%Special Education Coop 0 0 0% 0 0%TOTAL 356,209 348,324 -2% 403,662 16%
NOTE: Gifts/Grants includes private grants and grants from nonfederal sources.
Amount per pupil excludes the following funds: Area Vocational School, Adult Education, Adult Supplemental Education,Special Education Coop and Tuition Reimbursement.
*Enrollment (FTE) includes the enrollment of the district used for state aid and budget authority, and all other preschool enrollmentand kindergarten students attending full time.
0
50,000
100,000
150,000
200,000
250,000
300,000
350,000
400,000
450,000
2007-2008 2008-2009 2009-2010
Other Costs
10/2/2009 10:01 AM Sumexpen.xls Page 11 of 19

USD# 451
Capital Improvements Expenditures (4000)
% %2007-2008 2008-2009 inc/ 2009-2010 inc/
Actual Actual dec Budget dec
General 0 0 0% 0 0%Federal Funds 0 0 0% 0 0%Supplemental General 0 0 0% 0 0%At Risk (4yr Old) 0 0 0% 0 0%At Risk (K-12) 0 0 0% 0 0%Bilingual Education 0 0 0% 0 0%Virtual Education 0 0 0%Capital Outlay 0 0 0% 452,439 0%Driver Training 0 0 0% 0 0%Declining Enrollment 0 0 0% 0 0%Extraordinary School Program 0 0 0% 0 0%Food Service 0 0 0% 0 0%Professional Development 0 0 0% 0 0%Parent Education Program 0 0 0% 0 0%Summer School 0 0 0% 0 0%Special Education 0 0 0% 0 0%Cost of Living 0 0 0% 0 0%Vocational Education 0 0 0% 0 0%Gifts/Grants 0 0 0% 0 0%Special Liability 0 0 0% 0 0%School Retirement 0 0 0% 0 0%Extraordinary Growth Facilities 0 0 0% 0 0%Special Reserve 0 0 0%KPERS Spec. Ret. Contribution 0 0 0% 0 0%Contingency Reserve 0 0 0%Text Book & Student Material 0 0 0%Bond & Interest #1 0 0 0% 0 0%Bond & Interest #2 0 0 0% 0 0%No-Fund Warrant 0 0 0% 0 0%Special Assessment 0 0 0% 0 0%Temporary Note 0 0 0% 0 0%
SUBTOTAL 0 0 0% 452,439 0%Enrollment (FTE)* 430.0 430.0 0% 432.8 1%Amount per Pupil 0 0 0% 1,045 0%
Adult Education 0 0 0% 0 0%Ad lt S l t l Ed ti 0 0 0% 0 0%Adult Supplemental Education 0 0 0% 0 0%Area Vocational School 0 0 0%Tuition Reimbursement 0 0 0% 0 0%Special Education Coop 0 0 0% 0 0%TOTAL 0 0 0% 452,439 0%
NOTE: Gifts/Grants includes private grants and grants from nonfederal sources.
Amount per pupil excludes the following funds: Area Vocational School, Adult Education, Adult Supplemental Education,Special Education Coop and Tuition Reimbursement.
*Enrollment (FTE) includes the enrollment of the district used for state aid and budget authority, and all other preschool enrollmentand kindergarten students attending full time.
0
50,000
100,000
150,000
200,000
250,000
300,000
350,000
400,000
450,000
500,000
2007-2008 2008-2009 2009-2010
Capital Improvements (4000)
10/2/2009 10:01 AM Sumexpen.xls Page 12 of 19

USD# 451
Debt Services Expenditures (5100)
% %2007-2008 2008-2009 inc/ 2009-2010 inc/
Actual Actual dec Budget dec
General 0 0 0% 0 0%Federal Funds 0 0 0% 0 0%Supplemental General 0 0 0% 0 0%At Risk (4yr Old) 0 0 0% 0 0%At Risk (K-12) 0 0 0% 0 0%Bilingual Education 0 0 0% 0 0%Virtual Education 0 0 0%Capital Outlay 0 0 0% 0 0%Driver Training 0 0 0% 0 0%Declining Enrollment 0 0 0% 0 0%Extraordinary School Program 0 0 0% 0 0%Food Service 0 0 0% 0 0%Professional Development 0 0 0% 0 0%Parent Education Program 0 0 0% 0 0%Summer School 0 0 0% 0 0%Special Education 0 0 0% 0 0%Cost of Living 0 0 0% 0 0%Vocational Education 0 0 0% 0 0%Gifts/Grants 0 0 0% 0 0%Special Liability 0 0 0% 0 0%School Retirement 0 0 0% 0 0%Extraordinary Growth Facilities 0 0 0% 0 0%Special Reserve 0 0 0%KPERS Spec. Ret. Contribution 0 0 0% 0 0%Contingency Reserve 0 0 0%Text Book & Student Material 0 0 0%Bond & Interest #1 0 0 0% 0 0%Bond & Interest #2 0 0 0% 0 0%No-Fund Warrant 0 0 0% 0 0%Special Assessment 0 0 0% 0 0%Temporary Note 0 0 0% 0 0%
SUBTOTAL 0 0 0% 0 0%Enrollment (FTE)* 430.0 430.0 0% 432.8 1%Amount per Pupil 0 0 0% 0 0%
Adult Education 0 0 0% 0 0%Adult Education 0 0 0% 0 0%Adult Supplemental Education 0 0 0% 0 0%Area Vocational School 0 0 0%Tuition Reimbursement 0 0 0% 0 0%Special Education Coop 0 0 0% 0 0%TOTAL 0 0 0% 0 0%
NOTE: Gifts/Grants includes private grants and grants from nonfederal sources.
Amount per pupil excludes the following funds: Area Vocational School, Adult Education, Adult Supplemental Education,Special Education Coop and Tuition Reimbursement.
*Enrollment (FTE) includes the enrollment of the district used for state aid and budget authority, and all other preschool enrollmentand kindergarten students attending full time.
00000111111
2007-2008 2008-2009 2009-2010
Debt Services (5100)
10/2/2009 10:01 AM Sumexpen.xls Page 13 of 19

USD# 451
Transfers (5200)
% %2007-2008 2008-2009 inc/ 2009-2010 inc/
Actual Actual dec Budget dec
General 290,344 299,639 3% 224,113 -25%Federal Funds 0 0 0% 0 0%Supplemental General 102,434 146,535 43% 140,250 -4%At Risk (4yr Old) 0 0 0% 0 0%At Risk (K-12) 0 0 0% 0 0%Bilingual Education 0 0 0% 0 0%Virtual Education 0 0 0%Capital OutlayDriver Training 0 0 0% 0 0%Declining Enrollment 0 0 0% 0 0%Extraordinary School Program 0 0 0% 0 0%Food Service 0 0 0% 0 0%Professional Development 0 0 0% 0 0%Parent Education Program 0 0 0% 0 0%Summer School 0 0 0% 0 0%Special Education 0 0 0% 0 0%Cost of Living 0 0 0% 0 0%Vocational Education 0 0 0% 0 0%Gifts/Grants 0 0 0% 0 0%Special Liability 0 0 0% 0 0%School Retirement 0 0 0% 0 0%Extraordinary Growth Facilities 0 0 0% 0 0%Special Reserve 0 0 0%KPERS Spec. Ret. Contribution 0 0 0% 0 0%Contingency Reserve 0 0 0%Text Book & Student Material 0 0 0%Bond & Interest #1 0 0 0% 0 0%Bond & Interest #2 0 0 0% 0 0%No-Fund Warrant 0 0 0% 0 0%Special Assessment 0 0 0% 0 0%Temporary Note 0 0 0% 0 0%
SUBTOTAL 392,778 446,174 14% 364,363 -18%Enrollment (FTE)* 430.0 430.0 0% 432.8 1%Amount per Pupil 913 1,038 14% 842 -19%
Adult Education 0 0 0% 0 0%Adult Education 0 0 0% 0 0%Adult Supplemental Education 0 0 0% 0 0%Area Vocational School 0 0 0%Tuition Reimbursement 0 0 0% 0 0%Special Education Coop 0 0 0% 0 0%TOTAL 392,778 446,174 14% 364,363 -18%
NOTE: Gifts/Grants includes private grants and grants from nonfederal sources.
Amount per pupil excludes the following funds: Area Vocational School, Adult Education, Adult Supplemental Education,Special Education Coop and Tuition Reimbursement.
*Enrollment (FTE) includes the enrollment of the district used for state aid and budget authority, and all other preschool enrollmentand kindergarten students attending full time.
0
50,000
100,000
150,000
200,000
250,000
300,000
350,000
400,000
450,000
500,000
2007-2008 2008-2009 2009-2010
Transfers (5200)
10/2/2009 10:01 AM Sumexpen.xls Page 14 of 19
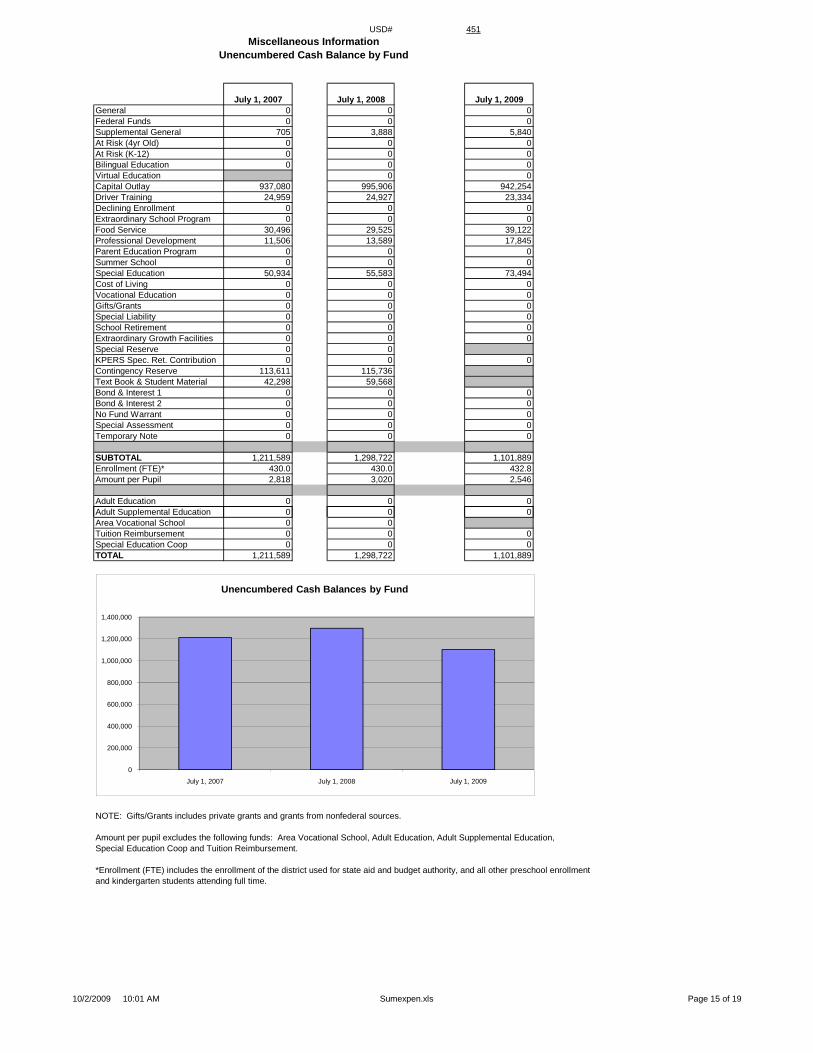
USD# 451Miscellaneous Information
Unencumbered Cash Balance by Fund
July 1, 2007 July 1, 2008 July 1, 2009General 0 0 0Federal Funds 0 0 0Supplemental General 705 3,888 5,840At Risk (4yr Old) 0 0 0At Risk (K-12) 0 0 0Bilingual Education 0 0 0Virtual Education 0 0Capital Outlay 937,080 995,906 942,254Driver Training 24,959 24,927 23,334Declining Enrollment 0 0 0Extraordinary School Program 0 0 0Food Service 30,496 29,525 39,122Professional Development 11,506 13,589 17,845Parent Education Program 0 0 0Summer School 0 0 0Special Education 50,934 55,583 73,494Cost of Living 0 0 0Vocational Education 0 0 0Gifts/Grants 0 0 0Special Liability 0 0 0School Retirement 0 0 0Extraordinary Growth Facilities 0 0 0Special Reserve 0 0KPERS Spec. Ret. Contribution 0 0 0Contingency Reserve 113,611 115,736Text Book & Student Material 42,298 59,568Bond & Interest 1 0 0 0Bond & Interest 2 0 0 0No Fund Warrant 0 0 0Special Assessment 0 0 0Temporary Note 0 0 0
SUBTOTAL 1,211,589 1,298,722 1,101,889Enrollment (FTE)* 430.0 430.0 432.8Amount per Pupil 2,818 3,020 2,546
Adult Education 0 0 0Adult Supplemental Education 0 0 0du t Supp e e ta ducat o 0 0 0Area Vocational School 0 0Tuition Reimbursement 0 0 0Special Education Coop 0 0 0TOTAL 1,211,589 1,298,722 1,101,889
NOTE: Gifts/Grants includes private grants and grants from nonfederal sources.
Amount per pupil excludes the following funds: Area Vocational School, Adult Education, Adult Supplemental Education,Special Education Coop and Tuition Reimbursement.
*Enrollment (FTE) includes the enrollment of the district used for state aid and budget authority, and all other preschool enrollmentand kindergarten students attending full time.
0
200,000
400,000
600,000
800,000
1,000,000
1,200,000
1,400,000
July 1, 2007 July 1, 2008 July 1, 2009
Unencumbered Cash Balances by Fund
10/2/2009 10:01 AM Sumexpen.xls Page 15 of 19

USD# 451
Reserve FundsUnencumbered Cash Balance
July 1, 2007 July 1, 2008Special Reserve 0 0TOTAL OTHER 0 0Amount per Pupil $0 $0
*School districts are authorized by law to self insure rather than purchase insurance for the following categories: Worker's Comp,Health Insurance, Life Insurance, Property and Casualty (Risk Management) and Disability Income Insurance. Monies are placedin the Self Insured Fund to pay for claims which may arise from the categories listed above.
0
0
0
0
0
1
1
1
1
1
1
July 1, 2007 July 1, 2008
Unencumbered Cash Balances by Fund (Reserve Funds Only)
10/2/2009 10:01 AM Sumexpen.xls Page 16 of 19

USD# 451Other Information
2005-2006 2006-2007 % 2007-2008 % 2008-2009 % 2009-2010 %Actual Actual inc/ Actual inc/ Actual inc/ Budget inc/
dec dec dec dec
Enrollment (FTE)* 208.0 210.5 1% 200.0 -5% 192.5 -4% 187.0 -3%
Enrollment (FTE)** 470.5 430.0 -9% 430.0 0% 430.0 0% 432.8 1%Number of Students - Free Meals 29 29 0% 27 -7% 24 -11% 24 0%Number of Students - Reduced Meals 24 24 0% 13 -46% 16 23% 15 -6%
0.0
50.0
100.0
150.0
200.0
250.0
2005-2006 2006-2007 2007-2008 2008-2009 2009-2010
Enrollment (FTE)* for Budget Authority
440.0
450.0
460.0
470.0
480.0
Enrollment (FTE)** Used for Calculating "Amount Per Pupil"
*FTE for state aid and budget authority purposes for general fund (excludes 4 yr old at-risk).
** FTE includes 9/20 enrollment used for state aid purposes and adding the additional FTE for preschool programs, headstart, and all-daykindergarten. For example, preschool students attending half days on September 20th would be counted as .5 FTE. Kindergartenstudents attending full time every day would be counted as 1.0 FTE.
0.0
50.0
100.0
150.0
200.0
250.0
2005-2006 2006-2007 2007-2008 2008-2009 2009-2010
Enrollment (FTE)* for Budget Authority
0
5
10
15
20
25
30
35
2005-2006 2006-2007 2007-2008 2008-2009 2009-2010
Low Income Students
Free Meals
Reduced Meals
400.0
410.0
420.0
430.0
440.0
450.0
460.0
470.0
480.0
2005-2006 2006-2007 2007-2008 2008-2009 2009-2010
Enrollment (FTE)** Used for Calculating "Amount Per Pupil"
10/2/2009 10:01 AM Sumexpen.xls Page 17 of 19

USD# 451
Miscellaneous InformationMill Rates by Fund
2007-2008 2008-2009 2009-2010Actual Actual Budget
General 20.000 20.000 20.000Supplemental General 9.066 9.015 14.572Adult Education 0.000 0.000 0.000Capital Outlay 0.000 0.000 0.000Declining Enrollment 0.000 0.000 0.000Cost of Living 0.000 0.000 0.000Special Liability 0.000 0.000 0.000School Retirement 0.000 0.000 0.000Extraordinary Growth Facilities 0.000 0.000 0.000Bond & Interest 1 0.000 0.000 0.000Bond & Interest 2 0.000 0.000 0.000No Fund Warrant 0.000 0.000 0.000Special Assessment 0.000 0.000 0.000Temporary Note 0.000 0.000 0.000TOTAL USD 29.066 29.015 34.572Historical Museum 0.000 0.000 0.000Public Library Board 0.000 0.000 0.000Public Library Brd & Emp Benf 0.000 0.000 0.000Recreation Commission 0.000 0.000 0.000Recreation Commission Employee Benefit 0.000 0.000 0.000TOTAL OTHER 0.000 0.000 0.000
5.000
10.000
15.000
20.000
25.000
30.000
35.000
40.000
Total USD Mill Rates
General58%
Supplemental General42%
2009-2010 Miscellaneous InformationMill Rates by Fund (Total USD)
General
Supplemental General
Adult Education
Capital Outlay
Special Liability
School Retirement
Declining Enrollment
Cost of Living
Bond & Interest 1
Bond & Interest 2
Extraordinary Growth Facilities
No Fund Warrant
Special Assessment
Temporary Note
0.000
5.000
10.000
15.000
20.000
25.000
30.000
35.000
40.000
2007-2008 2008-2009 2009-2010
Total USD Mill Rates
10/2/2009 10:01 AM Sumexpen.xls Page 18 of 19
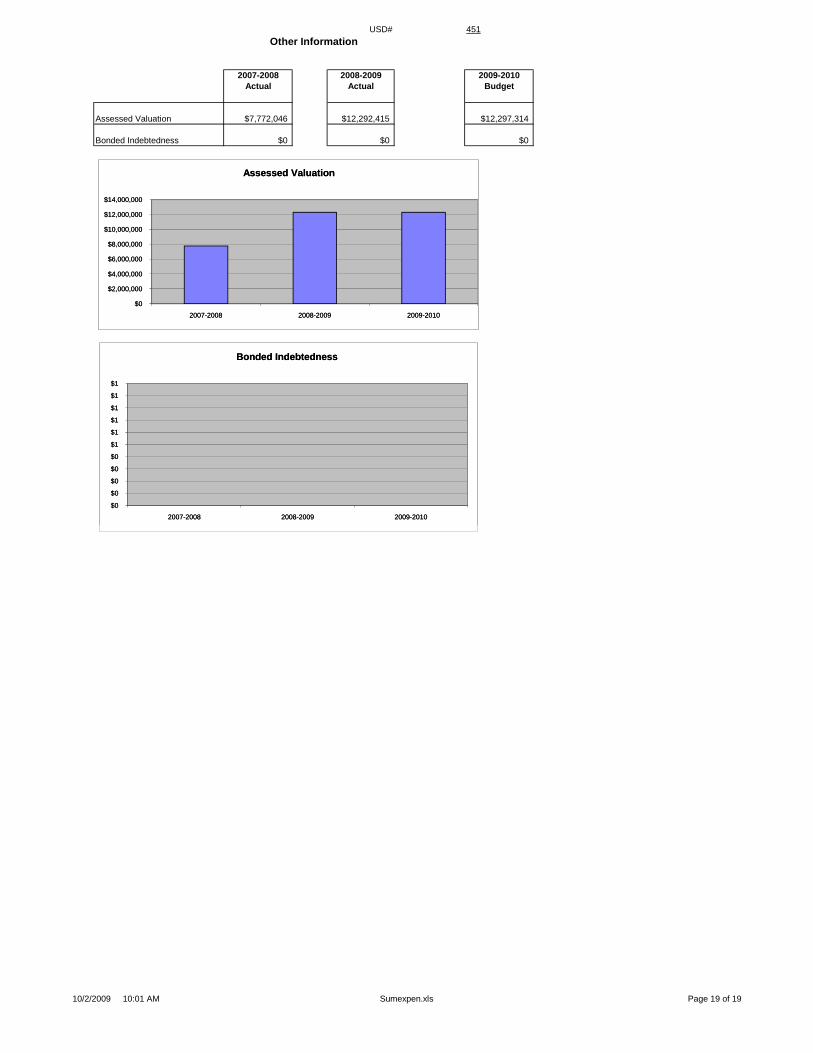
USD# 451Other Information
2007-2008 2008-2009 2009-2010Actual Actual Budget
Assessed Valuation $7,772,046 $12,292,415 $12,297,314
Bonded Indebtedness $0 $0 $0
$0
$2,000,000
$4,000,000
$6,000,000
$8,000,000
$10,000,000
$12,000,000
$14,000,000
2007-2008 2008-2009 2009-2010
Assessed Valuation
$0
$0
$0
$0
$0
$1
$1
$1
$1
$1
$1
2007-2008 2008-2009 2009-2010
Bonded Indebtedness
$0
$2,000,000
$4,000,000
$6,000,000
$8,000,000
$10,000,000
$12,000,000
$14,000,000
2007-2008 2008-2009 2009-2010
Assessed Valuation
$0
$0
$0
$0
$0
$1
$1
$1
$1
$1
$1
2007-2008 2008-2009 2009-2010
Bonded Indebtedness
10/2/2009 10:01 AM Sumexpen.xls Page 19 of 19