benthic cyanobacteria and anatoxin-a and homanatoxin-a ... library/research and reports... ·...
TRANSCRIPT
© Copyright: Apart from any fair dealing for the purpose of study, research, criticism, or review, as permitted under the Copyright Act, this publication must not be reproduced in whole or in part without the written permission of the Copyright Holder, who, unless other authorship is cited in the text or acknowledgements, is the commissioner of the report.
Benthic Cyanobacteria and
Anatoxin-a and Homanatoxin-a
Concentrations in Five Southland
Rivers
Mark W Heath
Susie A Wood
Prepared for
Environment Southland
Cawthron Institute 98 Halifax Street East, Private Bag 2,
Nelson, New Zealand. Ph. +64 3 548 2319, Fax. + 64 3 546 9464 www.cawthron.org.nz
Reviewed by: Approved for release by:
Jeannie Kuhajek Danette Olsen
Recommended citation: Heath MW, Wood SA 2010. Benthic Cyanobacteria and Anatoxin-a and Homanatoixn-a Concentrations in Five Southland Rivers. Cawthron Report No. 1841. 15pp plus appendices

Cawthron Report No. 1841 1 October 2010
1. INTRODUCTION
Benthic, mat-forming cyanobacteria are widespread throughout New Zealand rivers (Briggs &
Kilroy 2000); the most common genus in New Zealand is Phormidium. During stable flow
conditions, Phormidium can proliferate, forming expansive black/brown leathery mats across
large areas of river substrate. Several Phormidium species are known to produce natural
toxins, known as cyanotoxins. These toxins are a health threat to humans and animals when
consumed or when there is contact with contaminated water.
The potential risks to human health and impacts to aquatic ecosystems in New Zealand from
Phormidium are largely unknown. However, over the last decade more than 30 dog
poisonings associated with benthic Phormidium have been reported (Hamill 2001, Wood et al.
2007, Heath et al. 2010a,b). In most instances the dog poisonings were linked with exposure
to Phormidium mats containing the neurotoxins anatoxin-a (ATX) and homoanatoxin-a
(HTX). Both ATX and HTX are powerful neuromuscular blocking agents that act through the
nicotinic acetylcholine receptor. In affected animals ATX and HTX can cause convulsions,
coma, rigors, cyanosis, limb twitching, hypersalvation and death (Carmichael 1994). Benthic
cyanobacteria in New Zealand are also known to produce microcystins (heptatoxin) (Hamill
2001, Wood et al. 2010a), saxitoxins (neurotoxin) (Smith et al. 2010), cytotoxic compounds
affecting mammalian cells (Wood, Froscio & Campbell, unpub data) and skin irritants.
Monitoring and research on Phormidium mats has shown that the occurrence of ATX/HTX is
variable. Using multiple strains of cultured Phormidium sourced from rivers throughout New
Zealand, Heath et al. (2010a) showed that toxic and non-toxic genotypes co-occur in
Phormidium mats. This co-occurrence may at least partially explain the variability in
ATX/HTX concentrations reported for Phormidium mats collected within and among rivers.
In 2009, New Zealand guidelines for managing cyanobacterial risk in water used for
recreational purposes were released (Ministry for the Environment & Ministry of Health
2009). The aim of the guidelines was to help agencies responsible for managing
cyanobacteria develop monitoring protocols appropriate for local conditions and
circumstances, and to encourage the adoption of a nationally unified approach. The guidelines
set out a monitoring framework for establishing the public health risk from cyanobacteria in
lakes (mainly planktonic) and rivers (mainly benthic). A multi-tiered framework is used that
incorporates a monitoring and management action sequence, which regulators can use for a
graduated response to the onset and progress of a cyanobacterial bloom or benthic
proliferation. The guidelines incorporate a specific section and alert level framework for
benthic cyanobacteria. This section provides information on a transect system for monitoring
the percentage cover of cyanobacterial mats at a sampling site, and includes a three-tier alert
level framework that uses cyanobacterial abundance and the occurrence of mats visibly
detaching from the substrate to determine the alert level status.
2 Cawthron Report No. 1841 October 2010
In 1998 benthic cyanobacteria were associated with the death of six dogs on the Mataura
River in Southland (Hamill 2001). Since this incident samples have been collected
sporadically and ATX/HTX have been detected (Environment Southland, unpub. data),
underlining the need for further monitoring of cyanobacterial mats in Southland rivers.
The specific aims of this study were:
• To compare the site survey method given in the cyanobacterial guidelines to a visual
assessment method.
• To investigate spatial and temporal changes in ATX/HTX concentrations at one site in
each of five Southland rivers.
• To improve knowledge on the environmental parameters regulating cyanobacterial mat
formation at the investigated sites.
Cawthron Report No. 1841 3 October 2010
2. METHODS
2.1. Sample locations
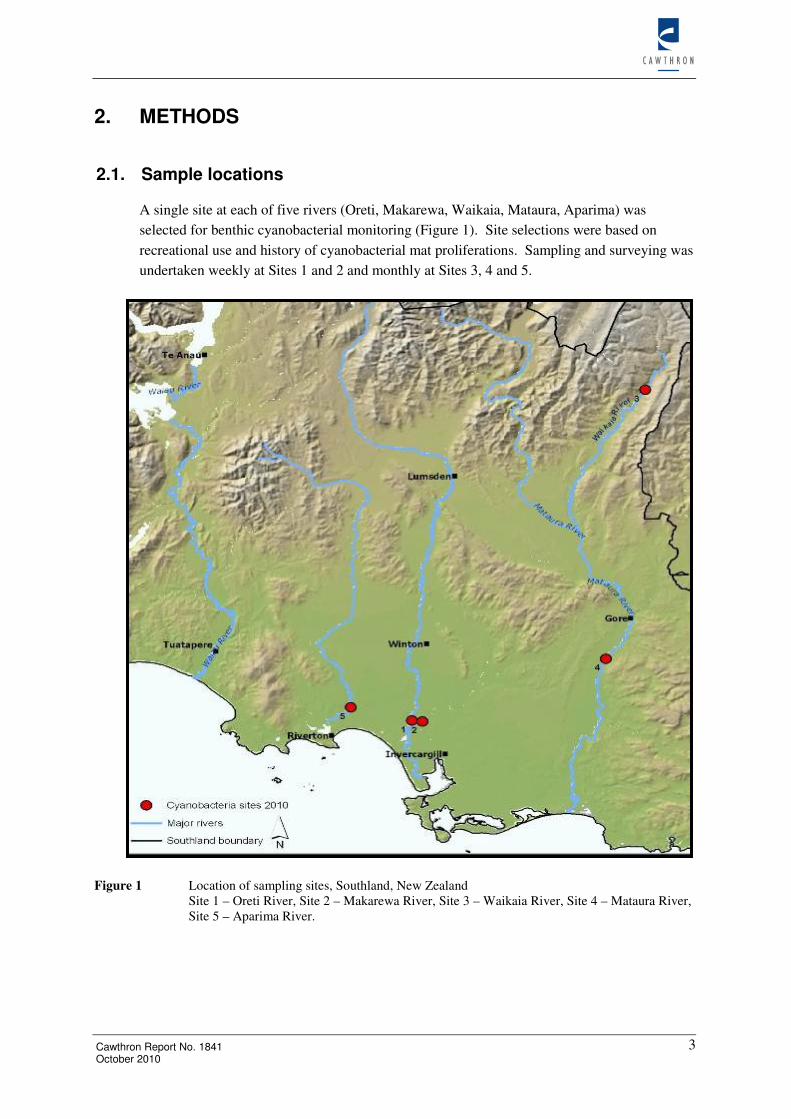
A single site at each of five rivers (Oreti, Makarewa, Waikaia, Mataura, Aparima) was
selected for benthic cyanobacterial monitoring (Figure 1). Site selections were based on
recreational use and history of cyanobacterial mat proliferations. Sampling and surveying was
undertaken weekly at Sites 1 and 2 and monthly at Sites 3, 4 and 5.
Figure 1 Location of sampling sites, Southland, New Zealand Site 1 – Oreti River, Site 2 – Makarewa River, Site 3 – Waikaia River, Site 4 – Mataura River, Site 5 – Aparima River.
4 Cawthron Report No. 1841 October 2010
Both Site 1, on the Oreti River, and Site 2, on the Makarewa River, were located in a densely
populated areas and experience high recreational use. Site 3, on the Waikaia River, is also
used extensively for recreational activities but is less populated. Site 4, located 200 metres
downstream of Mataura Township on the Mataura River, has a long history of dense
periphyton mats. Site 5, on the Aparima River near Thornbury, is also used for recreational
activities and has previously experienced moderate cyanobacterial proliferations. Further in-
depth site profiles are given in Appendix 1.
2.2. Site surveys
All site surveys and samplings were undertaken by Environment Southland staff. Two
methods were used to determine the percentage of the river substrate covered by
cyanobacterial mats.
Method 1. Visual Method
The surveyor wades through the river at the area where cyanobacterial mat cover is highest at
each site and makes a visual prediction of percentage cover of cyanobacterial mats.
Method 2. Transect Method
This is the method outlined in the New Zealand guidelines for managing cyanobacteria in
recreational fresh waters (Ministry for the Environment & Ministry of Health 2009). The
surveys conducted in this study were primarily based in riffles, but also included some run and
pool habitat. The length of the river surveyed varied from 26 metres (Site 2) to 100 metres
(Site 1). At each site four transects at right angles to the water’s edge and going out to a depth
of 0.6 metres were surveyed. The cyanobacterial mat cover was assessed at five points along
each transect using an underwater viewer. The 20 data points were averaged to obtain an
overall cyanobacterial percentage mat cover at each site.
2.3. Sample collection and preparation
At each site 10 cyanobacterial mat samples were collected by scraping mat material from one
rock into separate sterile plastic tubes. On arrival to the laboratory, samples were frozen
(-20°C) until further analysis.
Samples were thawed and a sub-sample (0.25 g) from each of the 10 samples from each site
were combined, homogenised and lyophilized (FreeZone6, Labconco, USA). The remaining
material was pooled per site and preserved in Lugol’s iodine solution for later morphological
identification.
Cawthron Report No. 1841 5 October 2010
2.4. Morphological identification
The dominant cyanobacterium in each pooled sample was identified by microscopy (BX51,
Olympus, Wellington, New Zealand).
2.5. Toxin extraction and analysis
Lypholized material (100 mg) was resuspended in 10 mL of double distilled water (DDW)
containing 0.1% formic acid and sonicated (Cole Parmer 8890, Biolab, Auckland, New
Zealand) for 15 minutes. Samples were centrifuged (4000 × g, 10 minutes) and the
supernatants analysed for ATX, HTX and their degradation products dihydroanatoxin-a
(dhATX) and dihydrohomoanatoxin-a (dhHTX), using liquid chromatography-mass
spectrometry (LC-MS) as described in Heath et al. 2010a.
2.6. River flow and water temperature
Continuous river flow and water temperature data were measured at, or close to, each
sampling site using data loggers. The data loggers were 10-15 kilometres upstream at Site 2,
2.5 kilometres downstream at Site 3 and 8 kilometres downstream at Site 4. Nutrient data was
only available for six individual data points from four different sites. This lack of data meant
that statistical analysis of associations between water quality and cyanobacterial abundance
was not possible.
3. RESULTS
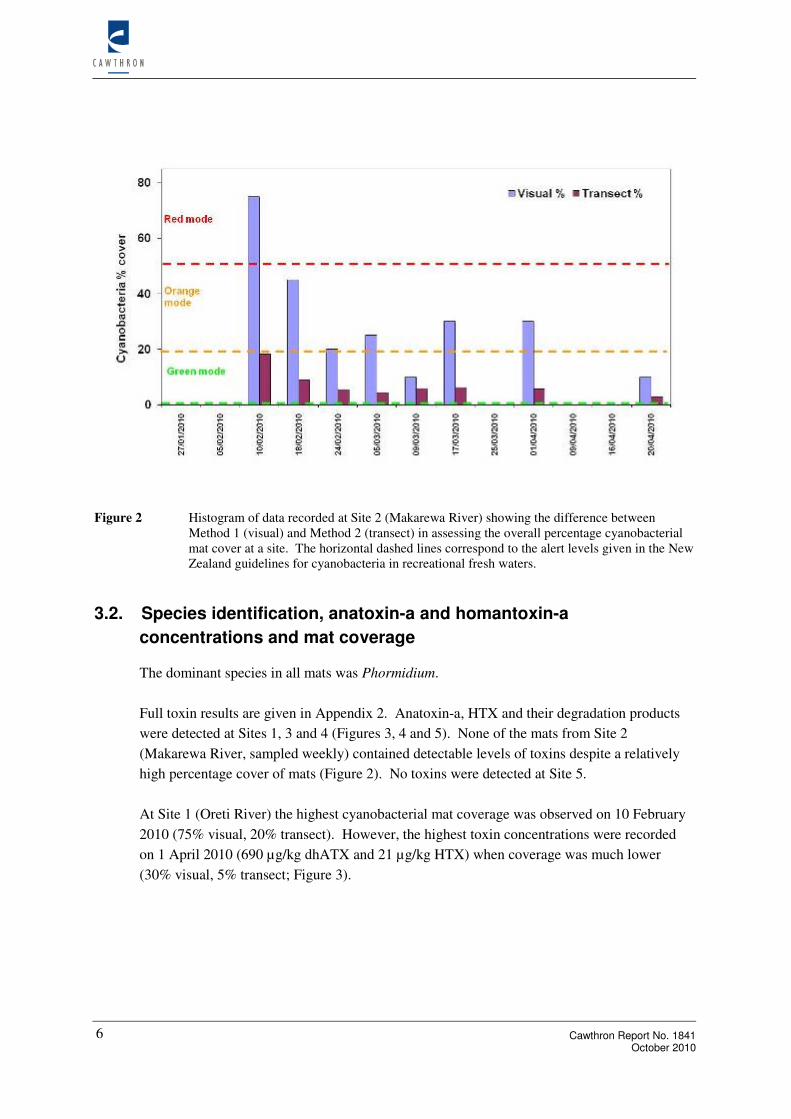
3.1. Comparison of site survey methods
At all five sites sampled Method 1 (visual) gave higher cyanobacterial abundances than
Method 2 (transect; Figure 2). On average the percentage cover measured using Method 1
was 3.3 times higher than that measured using Method 2. On four occasions low
cyanobacterial mat cover detected using Method 1 was not detected using Method 2. Of the
33 occasions where cyanobacterial mats were detected, 19 occasions had large enough
discrepancies between the two assessment methods to result in different alert levels. Across
all sites, Method 1 gave 15 green modes, 9 orange modes and 8 red modes whereas Method 2
resulted in 26 green modes, 3 orange modes and no red modes.
6 Cawthron Report No. 1841 October 2010
Figure 2 Histogram of data recorded at Site 2 (Makarewa River) showing the difference between
Method 1 (visual) and Method 2 (transect) in assessing the overall percentage cyanobacterial mat cover at a site. The horizontal dashed lines correspond to the alert levels given in the New Zealand guidelines for cyanobacteria in recreational fresh waters.
3.2. Species identification, anatoxin-a and homantoxin-a
concentrations and mat coverage
The dominant species in all mats was Phormidium.
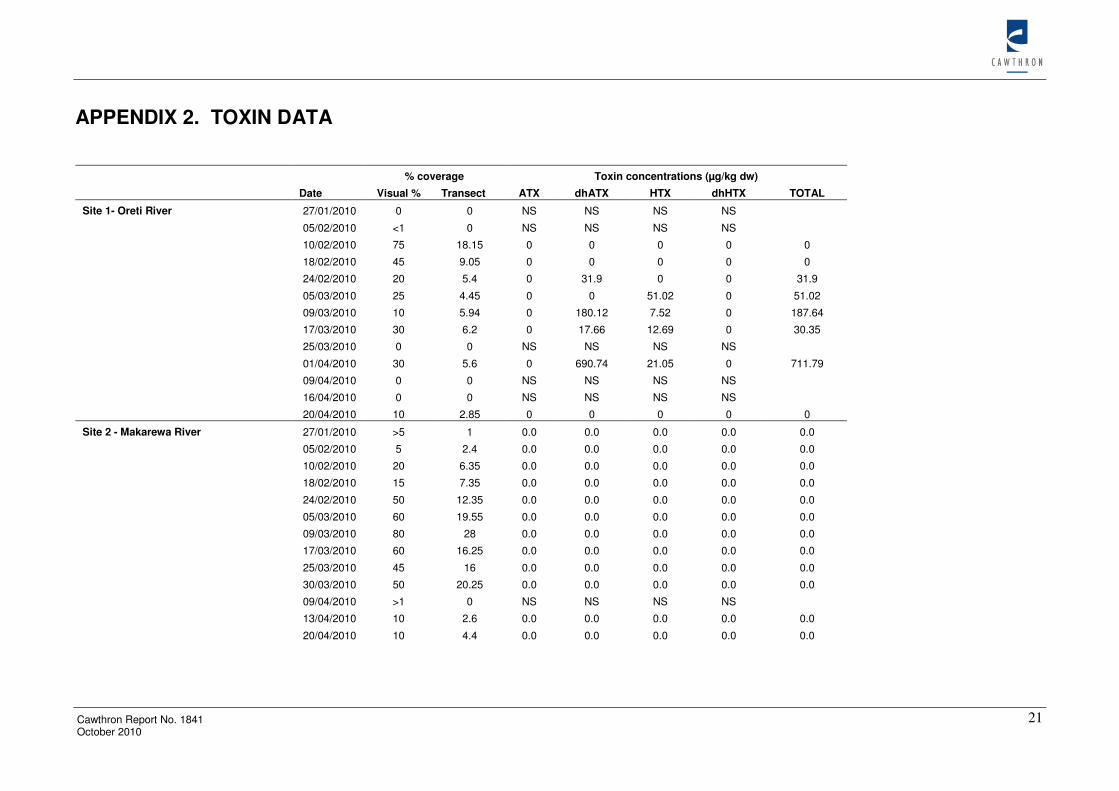
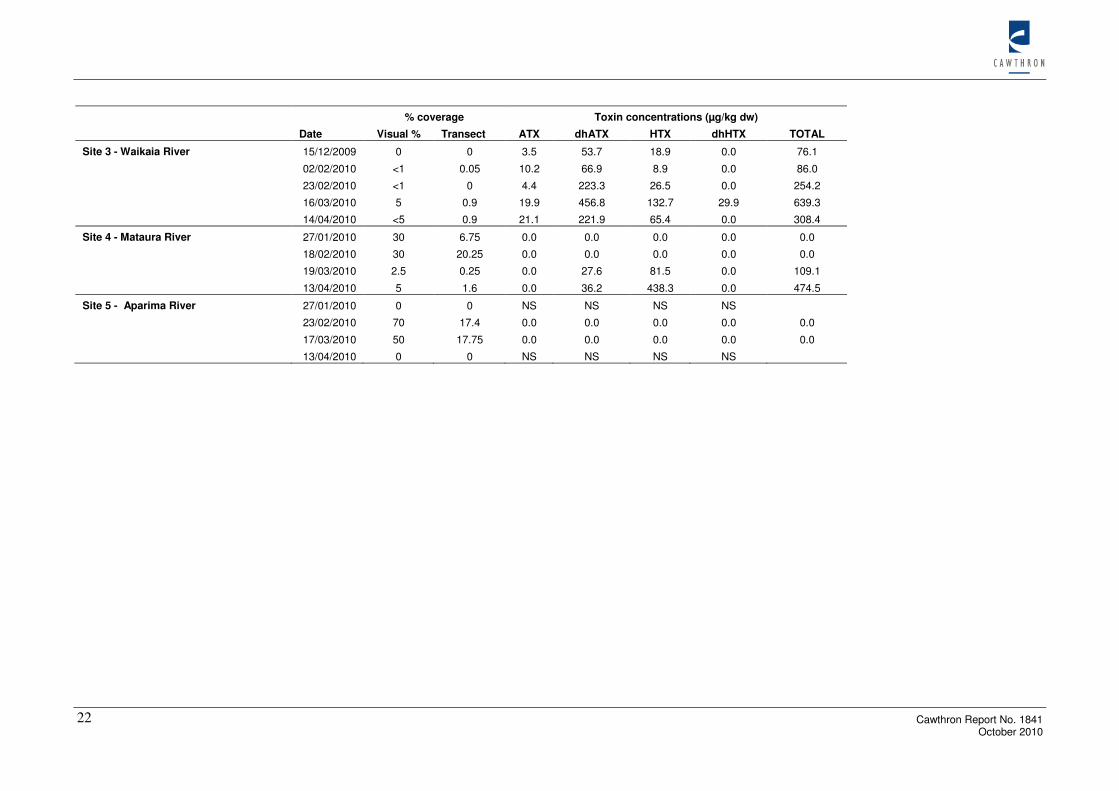
Full toxin results are given in Appendix 2. Anatoxin-a, HTX and their degradation products
were detected at Sites 1, 3 and 4 (Figures 3, 4 and 5). None of the mats from Site 2
(Makarewa River, sampled weekly) contained detectable levels of toxins despite a relatively
high percentage cover of mats (Figure 2). No toxins were detected at Site 5.
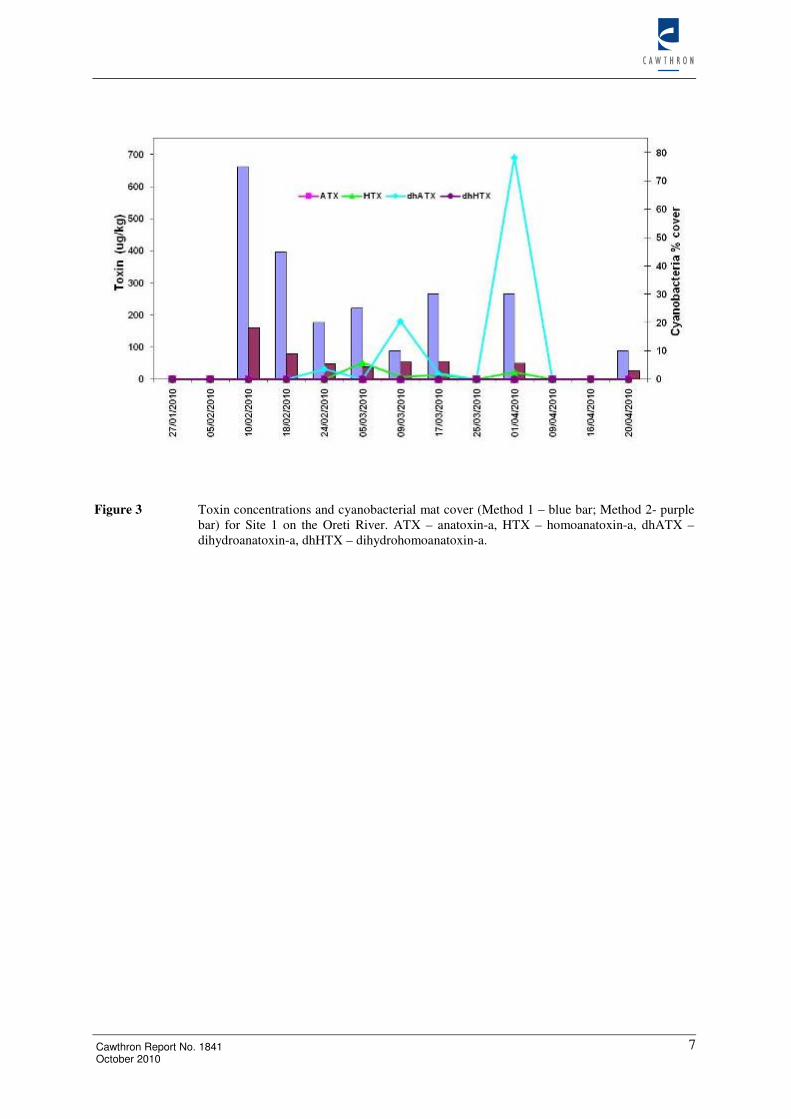
At Site 1 (Oreti River) the highest cyanobacterial mat coverage was observed on 10 February
2010 (75% visual, 20% transect). However, the highest toxin concentrations were recorded
on 1 April 2010 (690 µg/kg dhATX and 21 µg/kg HTX) when coverage was much lower
(30% visual, 5% transect; Figure 3).
Cawthron Report No. 1841 7 October 2010
Figure 3 Toxin concentrations and cyanobacterial mat cover (Method 1 – blue bar; Method 2- purple
bar) for Site 1 on the Oreti River. ATX – anatoxin-a, HTX – homoanatoxin-a, dhATX – dihydroanatoxin-a, dhHTX – dihydrohomoanatoxin-a.
8 Cawthron Report No. 1841 October 2010
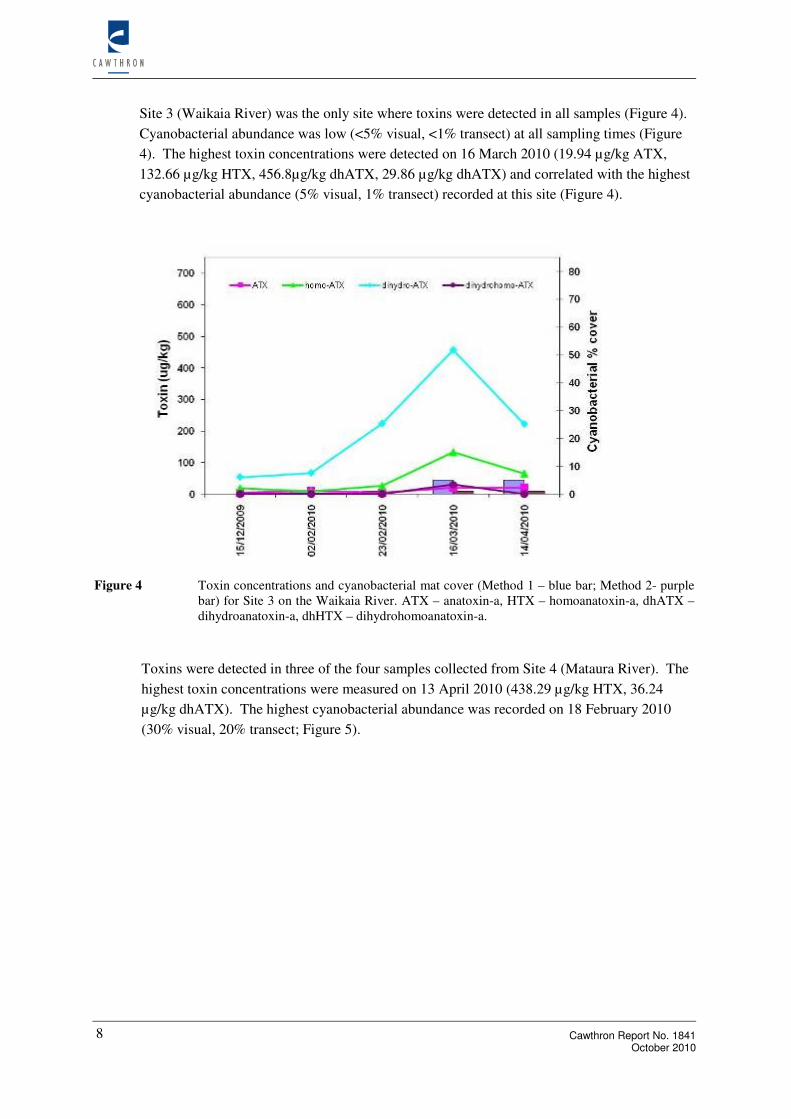
Site 3 (Waikaia River) was the only site where toxins were detected in all samples (Figure 4).
Cyanobacterial abundance was low (<5% visual, <1% transect) at all sampling times (Figure
4). The highest toxin concentrations were detected on 16 March 2010 (19.94 µg/kg ATX,
132.66 µg/kg HTX, 456.8µg/kg dhATX, 29.86 µg/kg dhATX) and correlated with the highest
cyanobacterial abundance (5% visual, 1% transect) recorded at this site (Figure 4).
Figure 4 Toxin concentrations and cyanobacterial mat cover (Method 1 – blue bar; Method 2- purple bar) for Site 3 on the Waikaia River. ATX – anatoxin-a, HTX – homoanatoxin-a, dhATX – dihydroanatoxin-a, dhHTX – dihydrohomoanatoxin-a.
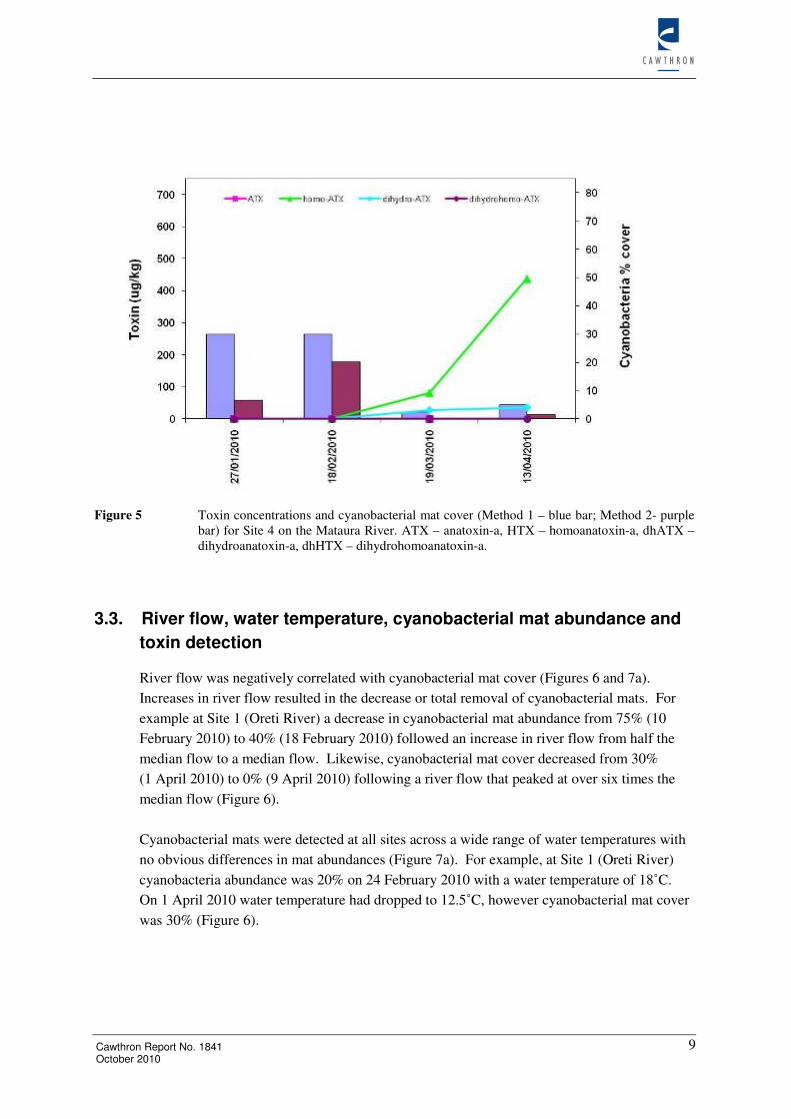
Toxins were detected in three of the four samples collected from Site 4 (Mataura River). The
highest toxin concentrations were measured on 13 April 2010 (438.29 µg/kg HTX, 36.24
µg/kg dhATX). The highest cyanobacterial abundance was recorded on 18 February 2010
(30% visual, 20% transect; Figure 5).
Cawthron Report No. 1841 9 October 2010
Figure 5 Toxin concentrations and cyanobacterial mat cover (Method 1 – blue bar; Method 2- purple bar) for Site 4 on the Mataura River. ATX – anatoxin-a, HTX – homoanatoxin-a, dhATX – dihydroanatoxin-a, dhHTX – dihydrohomoanatoxin-a.
3.3. River flow, water temperature, cyanobacterial mat abundance and
toxin detection
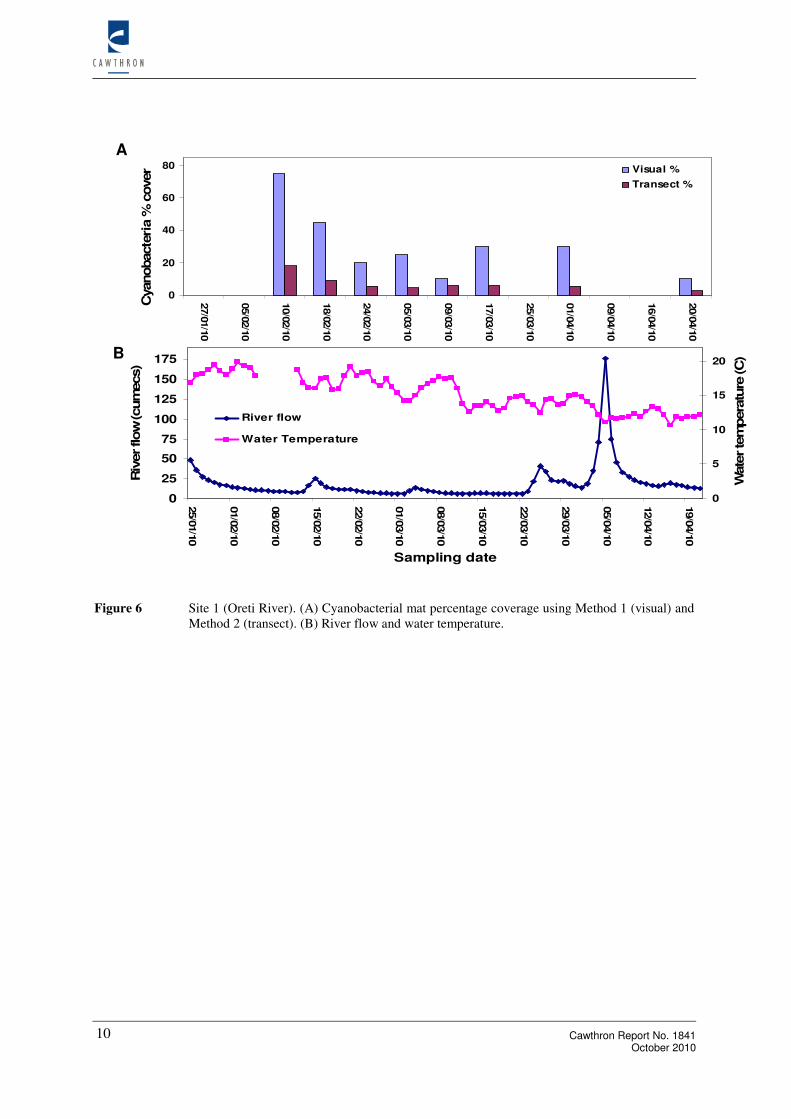
River flow was negatively correlated with cyanobacterial mat cover (Figures 6 and 7a).
Increases in river flow resulted in the decrease or total removal of cyanobacterial mats. For
example at Site 1 (Oreti River) a decrease in cyanobacterial mat abundance from 75% (10
February 2010) to 40% (18 February 2010) followed an increase in river flow from half the
median flow to a median flow. Likewise, cyanobacterial mat cover decreased from 30%
(1 April 2010) to 0% (9 April 2010) following a river flow that peaked at over six times the
median flow (Figure 6).
Cyanobacterial mats were detected at all sites across a wide range of water temperatures with
no obvious differences in mat abundances (Figure 7a). For example, at Site 1 (Oreti River)
cyanobacteria abundance was 20% on 24 February 2010 with a water temperature of 18˚C.
On 1 April 2010 water temperature had dropped to 12.5˚C, however cyanobacterial mat cover
was 30% (Figure 6).
10 Cawthron Report No. 1841 October 2010
Figure 6 Site 1 (Oreti River). (A) Cyanobacterial mat percentage coverage using Method 1 (visual) and Method 2 (transect). (B) River flow and water temperature.
0
20
40
60
80
27/0
1/1
0
05/0
2/1
0
10/0
2/1
0
18/0
2/1
0
24/0
2/1
0
05/0
3/1
0
09/0
3/1
0
17/0
3/1
0
25/0
3/1
0
01/0
4/1
0
09/0
4/1
0
16/0
4/1
0
20/0
4/1
0
Sampling date
Cyanobacte
ria %
cover Visual %
Transect %
0
25
50
75
100
125
150
175
25/0
1/1
0
01/0
2/1
0
08/0
2/1
0
15/0
2/1
0
22/0
2/1
0
01/0
3/1
0
08/0
3/1
0
15/0
3/1
0
22/0
3/1
0
29/0
3/1
0
05/0
4/1
0
12/0
4/1
0
19/0
4/1
0
Sampling date
Riv
er flow
(cum
ecs)
0
5
10
15
20
Wate
r te
mpera
ture
(C
)
River flow
Water Temperature
A
B
Cawthron Report No. 1841 11 October 2010
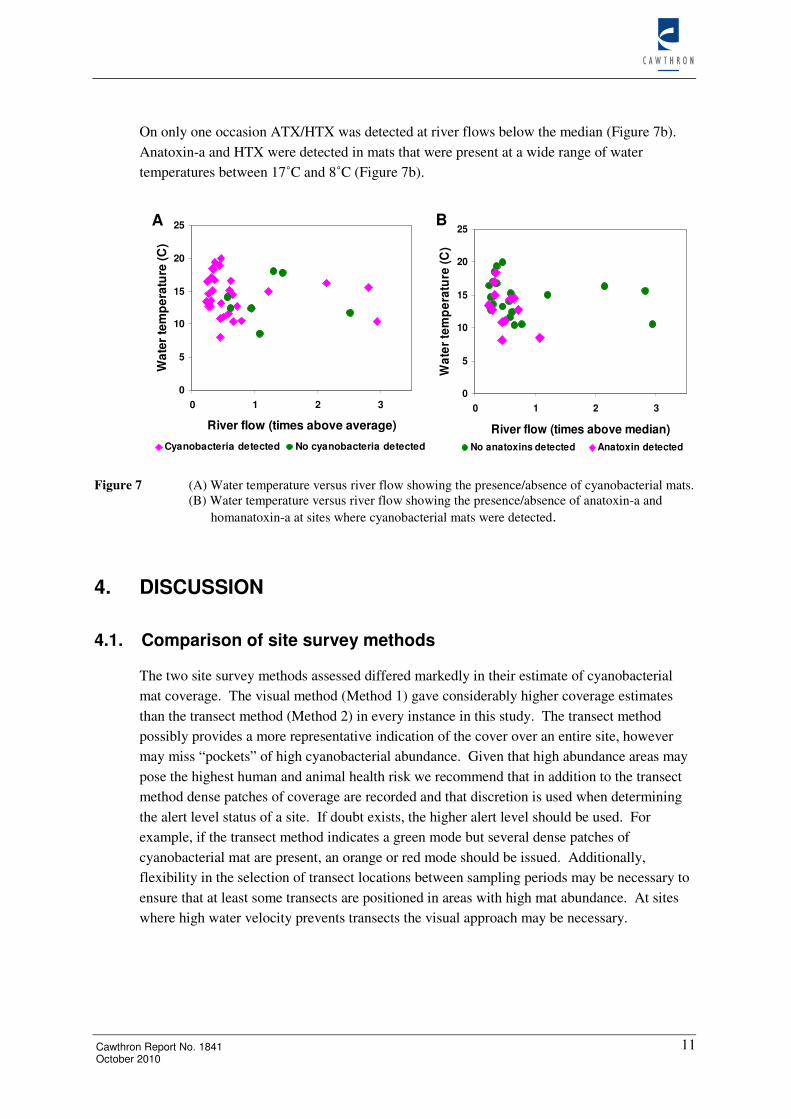
On only one occasion ATX/HTX was detected at river flows below the median (Figure 7b).
Anatoxin-a and HTX were detected in mats that were present at a wide range of water
temperatures between 17˚C and 8˚C (Figure 7b).
Figure 7 (A) Water temperature versus river flow showing the presence/absence of cyanobacterial mats.
(B) Water temperature versus river flow showing the presence/absence of anatoxin-a and
homanatoxin-a at sites where cyanobacterial mats were detected.
4. DISCUSSION
4.1. Comparison of site survey methods
The two site survey methods assessed differed markedly in their estimate of cyanobacterial
mat coverage. The visual method (Method 1) gave considerably higher coverage estimates
than the transect method (Method 2) in every instance in this study. The transect method
possibly provides a more representative indication of the cover over an entire site, however
may miss “pockets” of high cyanobacterial abundance. Given that high abundance areas may
pose the highest human and animal health risk we recommend that in addition to the transect
method dense patches of coverage are recorded and that discretion is used when determining
the alert level status of a site. If doubt exists, the higher alert level should be used. For
example, if the transect method indicates a green mode but several dense patches of
cyanobacterial mat are present, an orange or red mode should be issued. Additionally,
flexibility in the selection of transect locations between sampling periods may be necessary to
ensure that at least some transects are positioned in areas with high mat abundance. At sites
where high water velocity prevents transects the visual approach may be necessary.
0
5
10
15
20
25
0 1 2 3
River flow (times above average)
Wa
ter
tem
pe
ratu
re (
C)
Cyanobacteria detected No cyanobacteria detected
0
5
10
15
20
25
0 1 2 3
River flow (times above median)W
ate
r te
mp
era
ture
(C
)No anatoxins detected Anatoxin detected
A B
12 Cawthron Report No. 1841 October 2010
4.2. Variability in anatoxin-a and homanatoxin-a concentrations
Toxin concentrations varied between rivers and among sampling times within rivers. This
result is consistent with several recent studies. During research on Phormidium mats in the
Hutt River (Lower Hutt) ATX and HTX concentrations varied markedly among sampling sites
and over short time frames, e.g., a week (Heath et al. 2010b). In a second study Wood et al.
(2010b) sampled seven rivers in New Zealand and showed fine-scale spatial variability of
ATX and HTX within 10 × 10 metre grids. Of the seven sites sampled, there was only one
site where all samples contained detectable levels of ATX and HTX. At three sites, both toxic
and non-toxic samples co-occurred and mats less than 1 metre apart varied in ATX and HTX
content. This finding has led to the suggestion that at least ten samples are collected to
determine the approximate ATX/HTX concentrations at a site. Although no toxins were
detected at two sites in this study we recommend that toxin testing be continued at these sites,
or that mats at these sites are regarded as potentially toxic. Our recent research has shown that
the presence of toxins at a site can vary from one year to the next (Wood, unpub. data).
The results of this study showed that there was no correlation between the percentage cover of
Phormidium mats and presence/absence of ATX and HTX or the concentrations of these
toxins. These results are consistent with other recent studies (Heath et al. 2010b, Wood et al.
2010b).
The recent New Zealand cyanobacterial guidelines (Ministry for the Environment & Ministry
of Health 2009) uses a three-tier alert level framework that uses cyanobacterial abundance and
the occurrence of mats visibly detaching from the substrate to determine the alert level status.
Anatoxin-a and HTX detection is not currently included as part of the rationale for
determining alert level. Our recent research suggests the presence of cytotoxic compounds
affecting mammalian cells in multiple Phormidium species collected around New Zealand
(Wood, Froscio & Campbell, unpublished data). Therefore, we recommend that health
warnings should not rely solely on the presence of known cyanotoxins and that the percentage
cover of benthic mats within a river should used as a predictor of human health risk.
Additionally, under certain environmental conditions e.g., prolonged periods of low and stable
flow, or as mats become thicker (and bubbles of oxygen become entrapped within the mats),
cyanobacteria detach from the substrate and may accumulate along river edges.
Cyanobacterial accumulations along river edges result in higher risk to human and animal
health due to the increased probability of river users coming into contact with cyanobacterial
material. If protecting animal health, i.e., dogs, is an important consideration then some
monitoring of ATX/HTX concentrations is recommended.
The toxin concentrations in this study were relatively low compared to those from a survey of
seven rivers throughout New Zealand (Wood et al. 2010b). Wood et al. (2010b) measured a
maximum total anatoxin concentration of 12 800 µg/kg compared with 640 µg/kg in this
study. The lower result in this study may be because 10 samples were pooled at each site; for
example, if five samples from a site contained no toxins, the pooled average would be
reduced. In Wood et al. (2010b) all samples were analysed individually.
Cawthron Report No. 1841 13 October 2010
4.3. River flow, water temperature, cyanobacterial mat abundance and
toxin detection
Previous investigations of benthic cyanobacterial proliferations in New Zealand have shown
that proliferations generally occur in the summer months when water temperatures are
elevated and river flows are low (Biggs 1990, Wood et al. 2007, Heath et al. 2010a, b). In this
study winter data was not collected therefore it was not possible to determine if this trend also
occurs in Southland. However, all five sites surveyed had high abundances of Phormidium
mat cover for at least several weeks during the summer.
River flow had a major influence on the cyanobacterial percentage cover at all five sites.
Heath et al. (2010b) showed that in the Hutt River (Wellington) mats were present
predominantly when river flows were below the yearly mean. This is consistent with the
current study where cyanobacterial mats were found in the most part below the median flow.
The ability of river flow to flush Phormidium sp. mats has led the Wellington Regional
Council to designate river flow as one of the factors used to predict Phormidium mat
abundance (Milne & Watts 2006). Two weeks without a river flow of three times the median
is used as an early warning indicator of the strong likelihood of benthic Phormidium mat
proliferation. A similar system may prove useful for Environment Southland. Further
information on substrate stability and an in-depth analysis of hydrographs would be required
for each river.
In this study Phormidium mats were detected at water temperatures between 7.5˚C and 20˚C,
consistent with the findings of Heath et al. (2010b) who reported cyanobacterial mats between
8˚C and 21˚C. Phormidium mats are generally assumed to grow fastest at higher
temperatures. For example, following a flushing flow, mats will grow back faster in 20˚C
water as opposed to 10˚C water. Further studies are required to determine these temperature
thresholds, however, water temperature effects on growth of cyanobacterial mats should be
considered when developing early warning or management strategies.
The relationship between water temperature and ATX/HTX presence is variable. In a year-
long study of the Hutt River ATX/HTX-containing mats were found primarily in waters above
15˚C (Heath et al 2010b). In contrast, ATX/HTX-containing mats in this study were usually
detected in temperatures below 15˚C. This difference may indicate that the strain(s) of
Phormidium present in Southland rivers differ from those found in the Hutt River. Heath
et al. (2010b) suggested that the toxin-producing strains in the Hutt River “outcompeted” non-
toxic Phormidium strains at temperatures above 15˚C. The strain(s) present in Southland
rivers appear to dominate at lower temperatures.
14 Cawthron Report No. 1841 October 2010
5. RECOMMENDATIONS
We recommend that Environment Southland:
• Continue to monitor the five sites sampled in this study, along with any other sites
that have high recreational use, using a combination of the transect and visual
methods.
• Continue to use cyanobacterial percentage cover to determine the recreational use
alert level (as per the national guidelines). This study has shown that ATX and HTX
concentrations can vary rapidly and it is safest to presume that all Phormidium mats
are potentially toxic.
• Develop an early warning system based on river flow and possibly temperature. This
would require further analysis of hydrological data and may need to be specific for
each river.
• Undertake further analysis of the effect of nutrients, e.g., nitrogen and phosphorus, on
mat growth at selected sites.
6. ACKNOWLEDGEMENTS
Michael Boundy (Cawthron) for assistance with LC-MS analysis.
7. REFERENCES
Biggs BJ 1990. Periphyton communities and their environments in New Zealand rivers.
New Zealand Journal of Marine and Freshwater Research 24:367-386.
Biggs BJ, Kilroy C 2000. Stream periphyton monitoring manual. National Institute of Water
and Atmospheric Research. Christchurch, New Zealand.
Carmichael WW 1994. The toxins of cyanobacteria. The Scientific American 13:64-72.
Hamill KD 2001. Toxicity in benthic freshwater cyanobacteria (blue-green algae): first
observations in New Zealand. New Zealand Journal of Marine and Freshwater
Research 35:1057-1059.
Heath MW, Wood SA, Ryan KG 2010a. Polyphasic assessment of fresh-water benthic mat
forming cyanobacteria in New Zealand. FEMS Microbiology Ecology 73:95-109
Cawthron Report No. 1841 15 October 2010
Heath MW, Wood SA, Ryan KG 2010b. Spatial and temporal variability in Phormidium and
associated anatoxin-a and homoanatoxin-a production in two New Zealand rivers.
Aquatic Microbial Ecology (Submitted).
Milne JR, Watts LF 2006. Toxic benthic cyanobacteria proliferations in Wellington's rivers
in 2005/06. Greater Wellington Regional Council.
Ministry for the Environment and Ministry of Health 2009. New Zealand Guidelines for
Managing Cyanobacteria in Recreational Fresh Waters – Interim Guidelines.
Prepared for the Ministry for the Environment and the Ministry of Health by SA
Wood, DP Hamilton, WJ Paul, KA Safi, WM Williamson. Wellington: Ministry for
the Environment. 89 p.
Smith F, Wood SA, Ginkel Rv, Broady P, Gaw S 2010. First report of saxitoxin production
by a species of the freshwater benthic cyanobacterium, Scytonema Agardh. Toxicon
(Submitted)
Wood SA, Heath MW, McGregor G, Holland PT, Munday R, Ryan KG 2010a. Identification
of a benthic microcystin producing Planktothrix sp. and an associated dog poisoning
in New Zealand. Toxicon 55:897-903.
Wood SA, Heath M, Ryan KG 2010b. Fine scale spatial variability of anatoxin-a and
homoanatoxin-a production in benthic cyanobacteria; implication for monitoring and
management. Journal of Applied Microbial Ecology. DOI: 10.1111/j.1365-
2672.2010.04831.x
Wood SA, Selwood AI, Rueckert A, Holland PT, Milne JR, Smith KF, Smits B, Watts LF,
Cary CS 2007. First report of homoanatoxin-a and associated dog neurotoxicosis in
New Zealand. Toxicon 50:292-301.
16 Cawthron Report No. 1841 October 2010
APPENDIX 1. IN-DEPTH SITE DESCRIPTIONS
These site notes and descriptions were prepared by Environment Southland staff.
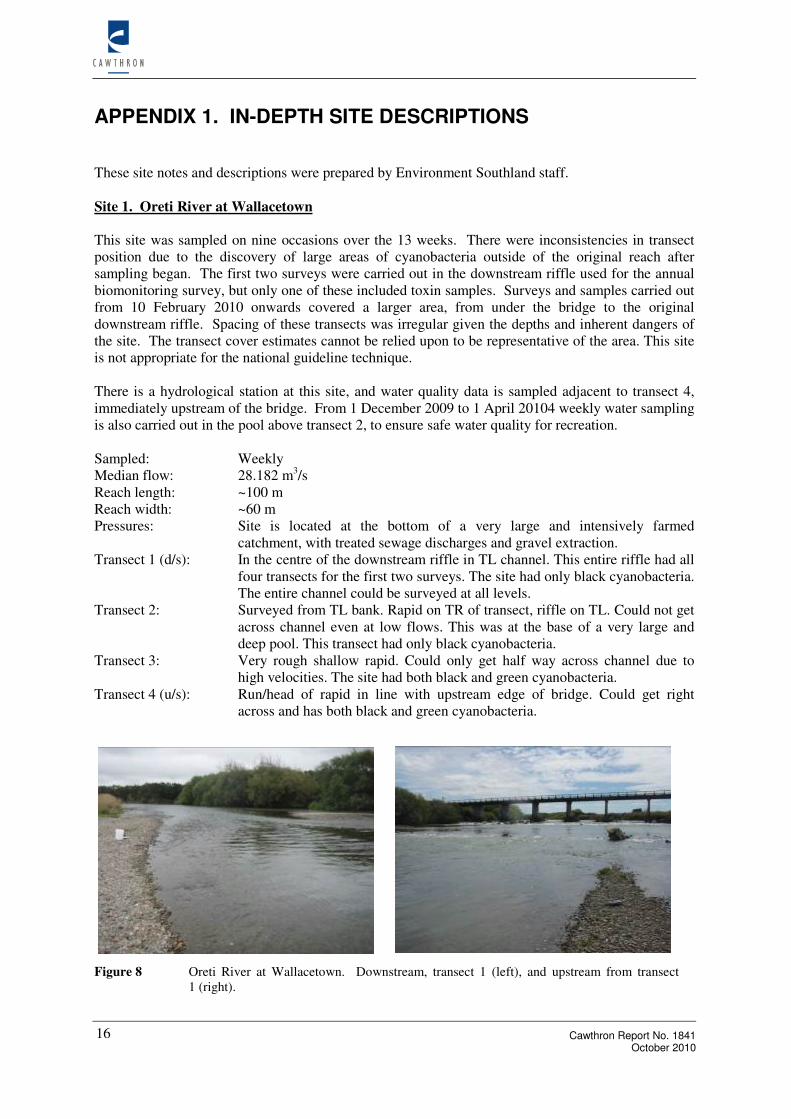
Site 1. Oreti River at Wallacetown
This site was sampled on nine occasions over the 13 weeks. There were inconsistencies in transect position due to the discovery of large areas of cyanobacteria outside of the original reach after sampling began. The first two surveys were carried out in the downstream riffle used for the annual biomonitoring survey, but only one of these included toxin samples. Surveys and samples carried out from 10 February 2010 onwards covered a larger area, from under the bridge to the original downstream riffle. Spacing of these transects was irregular given the depths and inherent dangers of the site. The transect cover estimates cannot be relied upon to be representative of the area. This site is not appropriate for the national guideline technique. There is a hydrological station at this site, and water quality data is sampled adjacent to transect 4, immediately upstream of the bridge. From 1 December 2009 to 1 April 20104 weekly water sampling is also carried out in the pool above transect 2, to ensure safe water quality for recreation. Sampled: Weekly Median flow: 28.182 m3/s Reach length: ~100 m Reach width: ~60 m Pressures: Site is located at the bottom of a very large and intensively farmed
catchment, with treated sewage discharges and gravel extraction. Transect 1 (d/s): In the centre of the downstream riffle in TL channel. This entire riffle had all
four transects for the first two surveys. The site had only black cyanobacteria. The entire channel could be surveyed at all levels.
Transect 2: Surveyed from TL bank. Rapid on TR of transect, riffle on TL. Could not get across channel even at low flows. This was at the base of a very large and deep pool. This transect had only black cyanobacteria.
Transect 3: Very rough shallow rapid. Could only get half way across channel due to high velocities. The site had both black and green cyanobacteria.
Transect 4 (u/s): Run/head of rapid in line with upstream edge of bridge. Could get right across and has both black and green cyanobacteria.
Figure 8 Oreti River at Wallacetown. Downstream, transect 1 (left), and upstream from transect
1 (right).
Cawthron Report No. 1841 17 October 2010
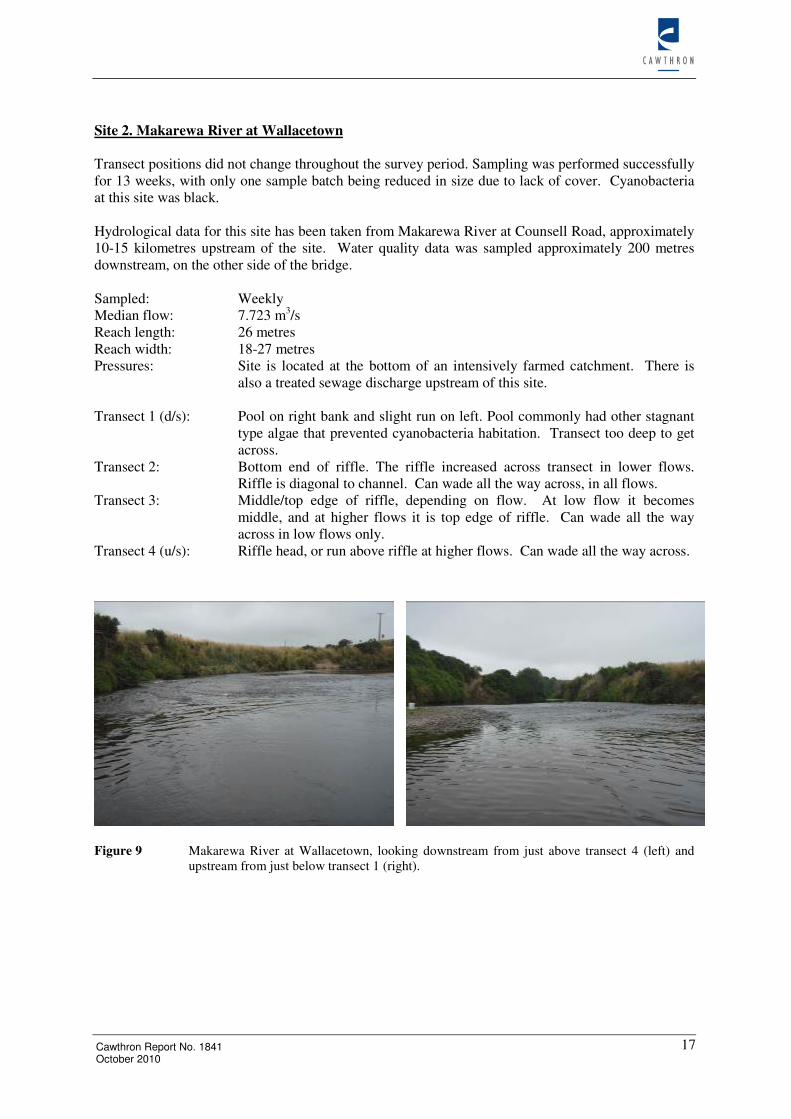
Site 2. Makarewa River at Wallacetown Transect positions did not change throughout the survey period. Sampling was performed successfully for 13 weeks, with only one sample batch being reduced in size due to lack of cover. Cyanobacteria at this site was black. Hydrological data for this site has been taken from Makarewa River at Counsell Road, approximately 10-15 kilometres upstream of the site. Water quality data was sampled approximately 200 metres downstream, on the other side of the bridge. Sampled: Weekly Median flow: 7.723 m3/s Reach length: 26 metres Reach width: 18-27 metres Pressures: Site is located at the bottom of an intensively farmed catchment. There is
also a treated sewage discharge upstream of this site. Transect 1 (d/s): Pool on right bank and slight run on left. Pool commonly had other stagnant
type algae that prevented cyanobacteria habitation. Transect too deep to get across.
Transect 2: Bottom end of riffle. The riffle increased across transect in lower flows. Riffle is diagonal to channel. Can wade all the way across, in all flows.
Transect 3: Middle/top edge of riffle, depending on flow. At low flow it becomes middle, and at higher flows it is top edge of riffle. Can wade all the way across in low flows only.
Transect 4 (u/s): Riffle head, or run above riffle at higher flows. Can wade all the way across.
Figure 9 Makarewa River at Wallacetown, looking downstream from just above transect 4 (left) and
upstream from just below transect 1 (right).
18 Cawthron Report No. 1841 October 2010
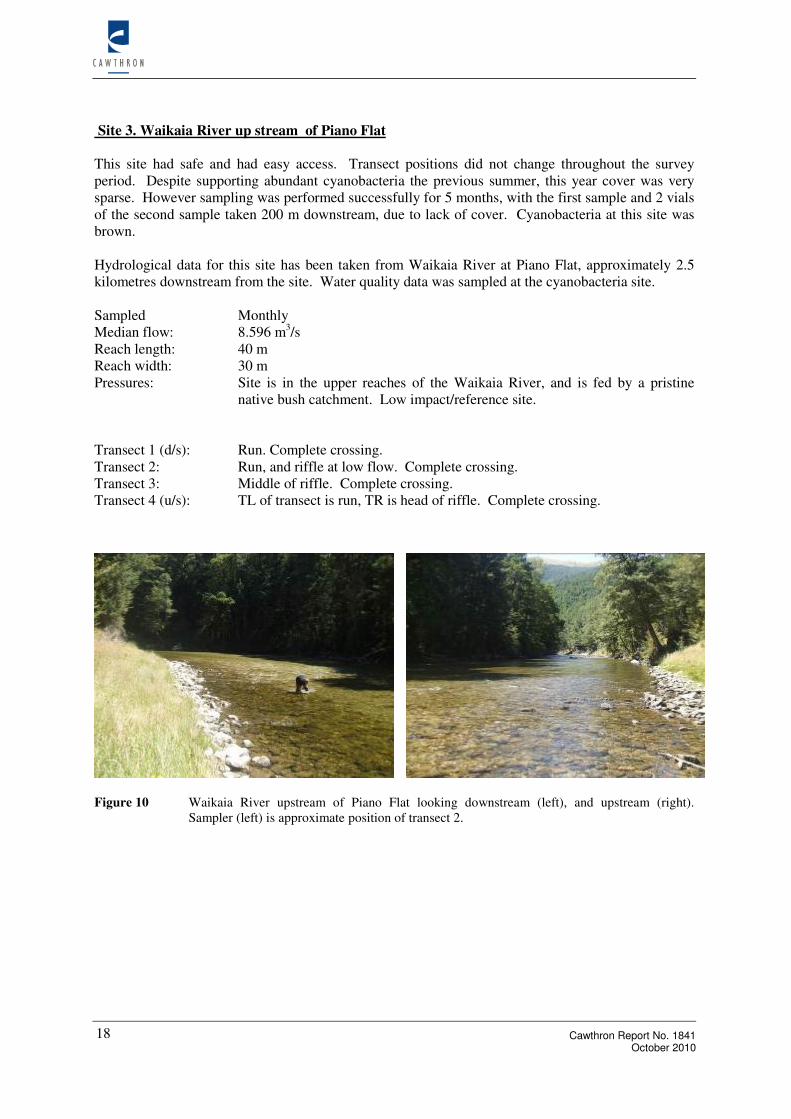
Site 3. Waikaia River up stream of Piano Flat This site had safe and had easy access. Transect positions did not change throughout the survey period. Despite supporting abundant cyanobacteria the previous summer, this year cover was very sparse. However sampling was performed successfully for 5 months, with the first sample and 2 vials of the second sample taken 200 m downstream, due to lack of cover. Cyanobacteria at this site was brown. Hydrological data for this site has been taken from Waikaia River at Piano Flat, approximately 2.5 kilometres downstream from the site. Water quality data was sampled at the cyanobacteria site. Sampled Monthly Median flow: 8.596 m3/s Reach length: 40 m Reach width: 30 m Pressures: Site is in the upper reaches of the Waikaia River, and is fed by a pristine
native bush catchment. Low impact/reference site. Transect 1 (d/s): Run. Complete crossing. Transect 2: Run, and riffle at low flow. Complete crossing. Transect 3: Middle of riffle. Complete crossing. Transect 4 (u/s): TL of transect is run, TR is head of riffle. Complete crossing.
Figure 10 Waikaia River upstream of Piano Flat looking downstream (left), and upstream (right).
Sampler (left) is approximate position of transect 2.
Cawthron Report No. 1841 19 October 2010
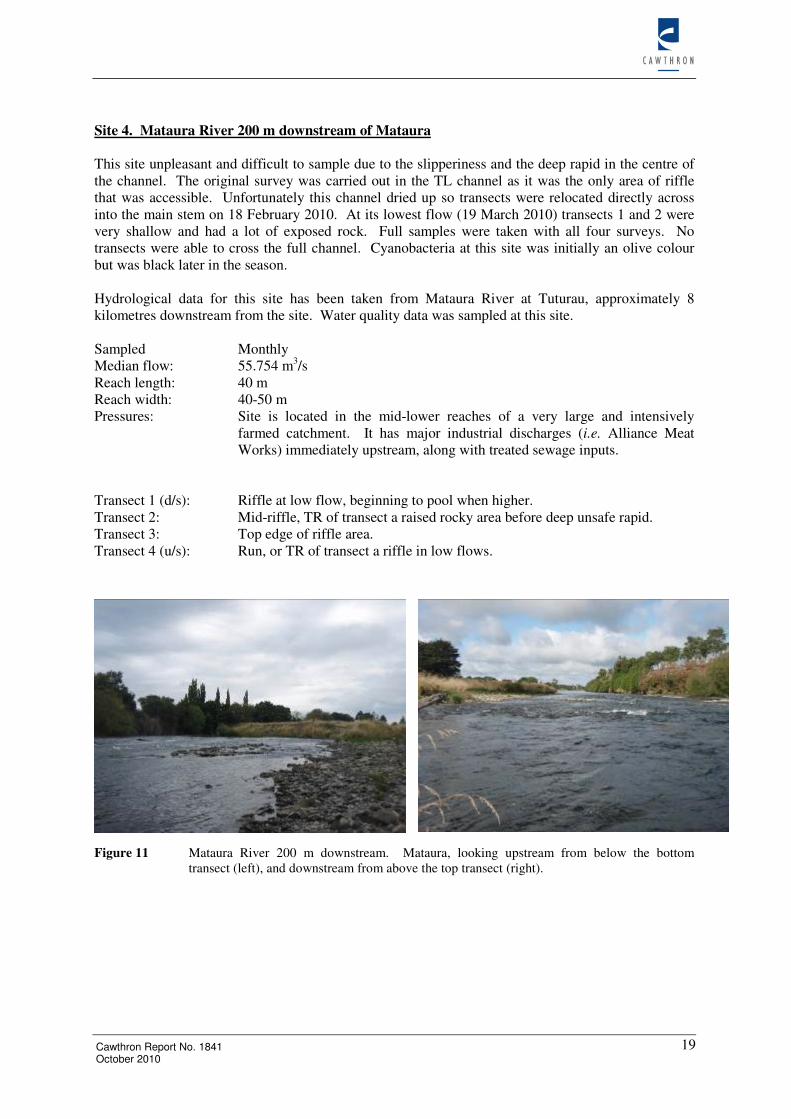
Site 4. Mataura River 200 m downstream of Mataura
This site unpleasant and difficult to sample due to the slipperiness and the deep rapid in the centre of the channel. The original survey was carried out in the TL channel as it was the only area of riffle that was accessible. Unfortunately this channel dried up so transects were relocated directly across into the main stem on 18 February 2010. At its lowest flow (19 March 2010) transects 1 and 2 were very shallow and had a lot of exposed rock. Full samples were taken with all four surveys. No transects were able to cross the full channel. Cyanobacteria at this site was initially an olive colour but was black later in the season. Hydrological data for this site has been taken from Mataura River at Tuturau, approximately 8 kilometres downstream from the site. Water quality data was sampled at this site. Sampled Monthly Median flow: 55.754 m3/s Reach length: 40 m Reach width: 40-50 m Pressures: Site is located in the mid-lower reaches of a very large and intensively
farmed catchment. It has major industrial discharges (i.e. Alliance Meat Works) immediately upstream, along with treated sewage inputs.
Transect 1 (d/s): Riffle at low flow, beginning to pool when higher. Transect 2: Mid-riffle, TR of transect a raised rocky area before deep unsafe rapid. Transect 3: Top edge of riffle area. Transect 4 (u/s): Run, or TR of transect a riffle in low flows. Figure 11 Mataura River 200 m downstream. Mataura, looking upstream from below the bottom
transect (left), and downstream from above the top transect (right).
20 Cawthron Report No. 1841 October 2010
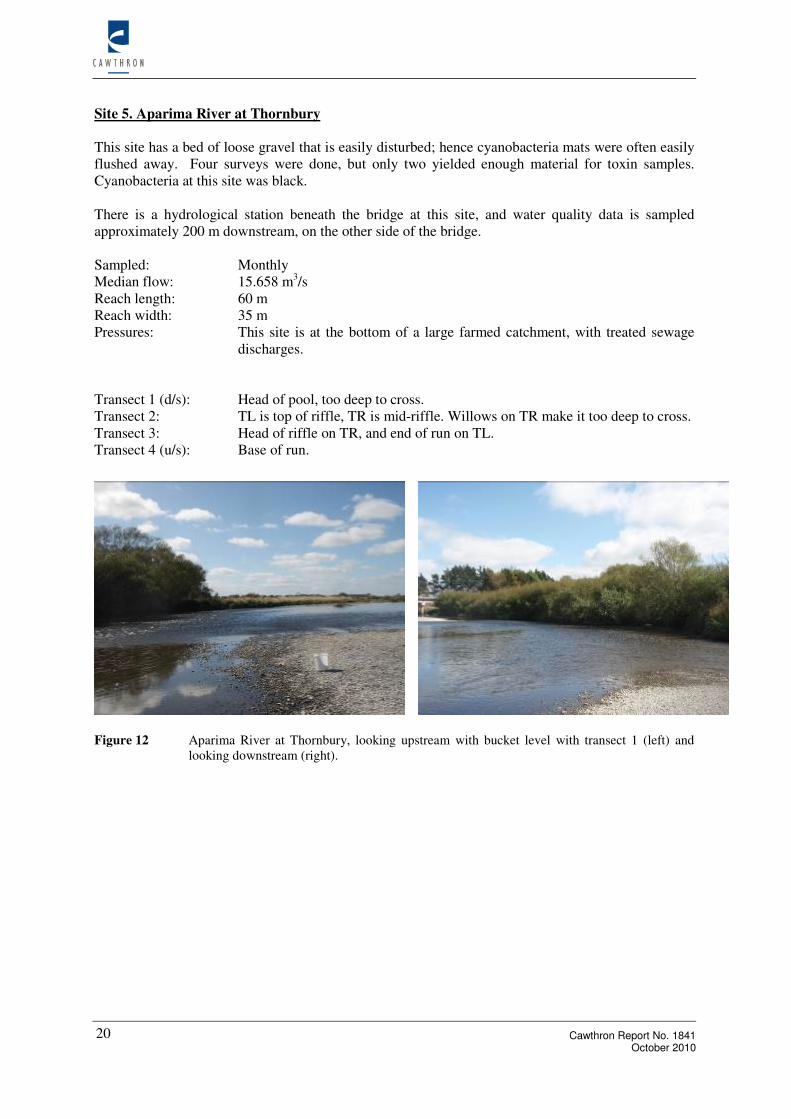
Site 5. Aparima River at Thornbury This site has a bed of loose gravel that is easily disturbed; hence cyanobacteria mats were often easily flushed away. Four surveys were done, but only two yielded enough material for toxin samples. Cyanobacteria at this site was black. There is a hydrological station beneath the bridge at this site, and water quality data is sampled approximately 200 m downstream, on the other side of the bridge. Sampled: Monthly Median flow: 15.658 m3/s Reach length: 60 m Reach width: 35 m Pressures: This site is at the bottom of a large farmed catchment, with treated sewage
discharges. Transect 1 (d/s): Head of pool, too deep to cross. Transect 2: TL is top of riffle, TR is mid-riffle. Willows on TR make it too deep to cross. Transect 3: Head of riffle on TR, and end of run on TL. Transect 4 (u/s): Base of run.
Figure 12 Aparima River at Thornbury, looking upstream with bucket level with transect 1 (left) and
looking downstream (right).
Cawthron Report No. 1841 21 October 2010
APPENDIX 2. TOXIN DATA
% coverage Toxin concentrations (µg/kg dw)
Date Visual % Transect ATX dhATX HTX dhHTX TOTAL
Site 1- Oreti River 27/01/2010 0 0 NS NS NS NS
05/02/2010 <1 0 NS NS NS NS
10/02/2010 75 18.15 0 0 0 0 0
18/02/2010 45 9.05 0 0 0 0 0
24/02/2010 20 5.4 0 31.9 0 0 31.9
05/03/2010 25 4.45 0 0 51.02 0 51.02
09/03/2010 10 5.94 0 180.12 7.52 0 187.64
17/03/2010 30 6.2 0 17.66 12.69 0 30.35
25/03/2010 0 0 NS NS NS NS
01/04/2010 30 5.6 0 690.74 21.05 0 711.79
09/04/2010 0 0 NS NS NS NS
16/04/2010 0 0 NS NS NS NS
20/04/2010 10 2.85 0 0 0 0 0
Site 2 - Makarewa River 27/01/2010 >5 1 0.0 0.0 0.0 0.0 0.0
05/02/2010 5 2.4 0.0 0.0 0.0 0.0 0.0
10/02/2010 20 6.35 0.0 0.0 0.0 0.0 0.0
18/02/2010 15 7.35 0.0 0.0 0.0 0.0 0.0
24/02/2010 50 12.35 0.0 0.0 0.0 0.0 0.0
05/03/2010 60 19.55 0.0 0.0 0.0 0.0 0.0
09/03/2010 80 28 0.0 0.0 0.0 0.0 0.0
17/03/2010 60 16.25 0.0 0.0 0.0 0.0 0.0
25/03/2010 45 16 0.0 0.0 0.0 0.0 0.0
30/03/2010 50 20.25 0.0 0.0 0.0 0.0 0.0
09/04/2010 >1 0 NS NS NS NS
13/04/2010 10 2.6 0.0 0.0 0.0 0.0 0.0
20/04/2010 10 4.4 0.0 0.0 0.0 0.0 0.0
22 Cawthron Report No. 1841 October 2010
% coverage Toxin concentrations (µg/kg dw)
Date Visual % Transect ATX dhATX HTX dhHTX TOTAL
Site 3 - Waikaia River 15/12/2009 0 0 3.5 53.7 18.9 0.0 76.1
02/02/2010 <1 0.05 10.2 66.9 8.9 0.0 86.0
23/02/2010 <1 0 4.4 223.3 26.5 0.0 254.2
16/03/2010 5 0.9 19.9 456.8 132.7 29.9 639.3
14/04/2010 <5 0.9 21.1 221.9 65.4 0.0 308.4
Site 4 - Mataura River 27/01/2010 30 6.75 0.0 0.0 0.0 0.0 0.0
18/02/2010 30 20.25 0.0 0.0 0.0 0.0 0.0
19/03/2010 2.5 0.25 0.0 27.6 81.5 0.0 109.1
13/04/2010 5 1.6 0.0 36.2 438.3 0.0 474.5
Site 5 - Aparima River 27/01/2010 0 0 NS NS NS NS
23/02/2010 70 17.4 0.0 0.0 0.0 0.0 0.0
17/03/2010 50 17.75 0.0 0.0 0.0 0.0 0.0
13/04/2010 0 0 NS NS NS NS
Filename: Southland Cyanobacteria Report 2010.doc Directory: \\esfile\dianew Template: V:\Cawthron-Wide\Project Management-
Contracts\Forms and Templates\Cawthron Short Report Template.dot Title: Right click and select Update field to insert report title Subject: Author: administrator Keywords: Cawthron Report No. 1841 Comments: Creation Date: 29/10/2010 1:35:00 p.m. Change Number: 3 Last Saved On: 4/04/2011 4:12:00 p.m. Last Saved By: Diane Williams Total Editing Time: 2 Minutes Last Printed On: 4/04/2011 4:13:00 p.m. As of Last Complete Printing Number of Pages: 24 Number of Words: 5,073 (approx.) Number of Characters: 28,921 (approx.)