best practices in data access, tracking, and...
TRANSCRIPT
Best Practices in Data Access, Tracking, and Analysis: Workshop for the Public Sector 5/29/2015
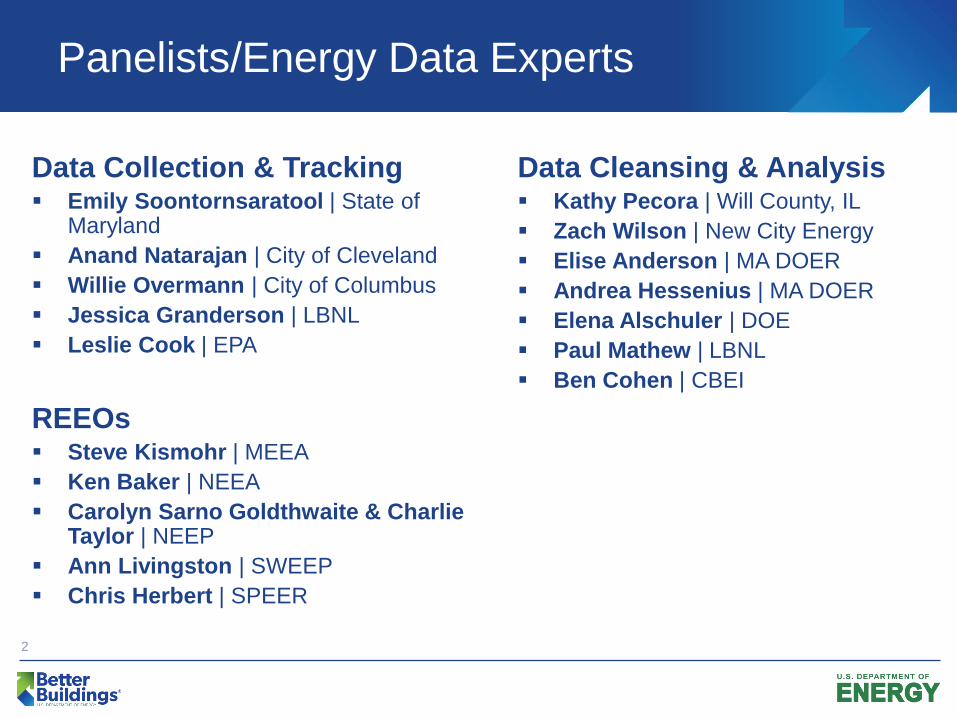
Panelists/Energy Data Experts
Data Collection & Tracking Emily Soontornsaratool | State of
Maryland Anand Natarajan | City of Cleveland Willie Overmann | City of Columbus Jessica Granderson | LBNL Leslie Cook | EPA REEOs Steve Kismohr | MEEA Ken Baker | NEEA Carolyn Sarno Goldthwaite & Charlie
Taylor | NEEP Ann Livingston | SWEEP Chris Herbert | SPEER
Data Cleansing & Analysis Kathy Pecora | Will County, IL Zach Wilson | New City Energy Elise Anderson | MA DOER Andrea Hessenius | MA DOER Elena Alschuler | DOE Paul Mathew | LBNL Ben Cohen | CBEI
2
Data Collection & Tracking Emily Soontornsaratool Maryland Department of General Services
State of Maryland Energy Data Tracking
Emily Soontornsaratool Maryland Department of General Services
Office of Energy Performance & Conservation
• Energy Performance Contracting
• Energy Planning
• Electricity & Natural Gas Purchasing
• Renewable Energy Purchasing
• Measurement & Verification
• Demand Response
• Tracking State Government
Energy Usage & Cost
LEGISLATION
2006 - SB267 • Leading By Example • DGS must track and report on energy reduction across all
State government facilities
2008 - EmPOWER Maryland Energy Efficiency Act • Mandates a 15% in per capita electricity consumption and
peak demand by 2015 • Leading by Example
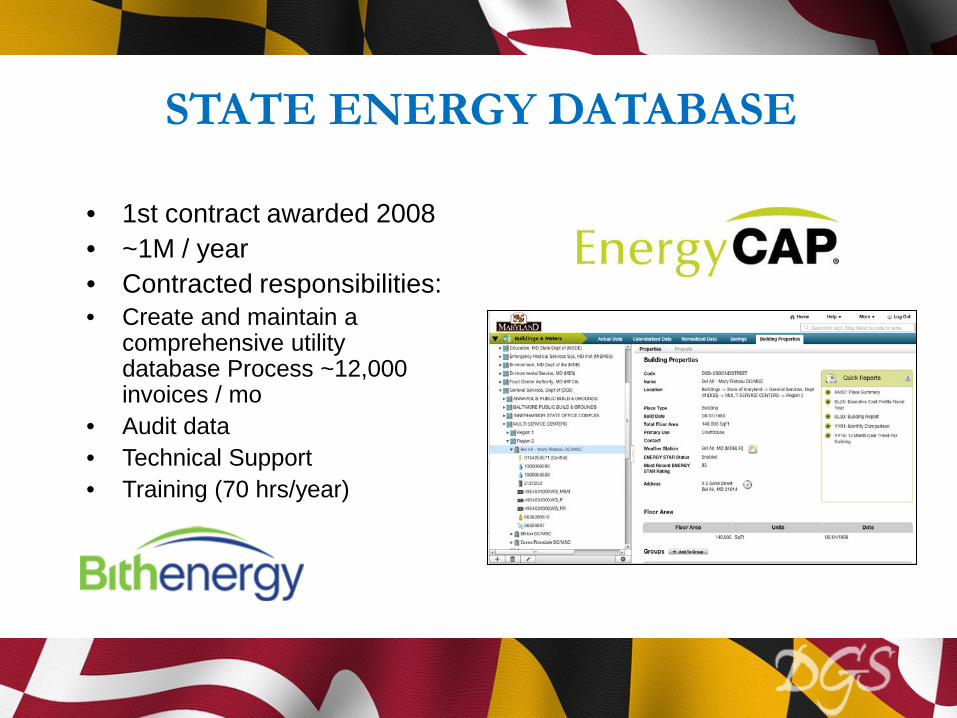
STATE ENERGY DATABASE
• 1st contract awarded 2008 • ~1M / year • Contracted responsibilities: • Create and maintain a
comprehensive utility database Process ~12,000 invoices / mo
• Audit data • Technical Support • Training (70 hrs/year)
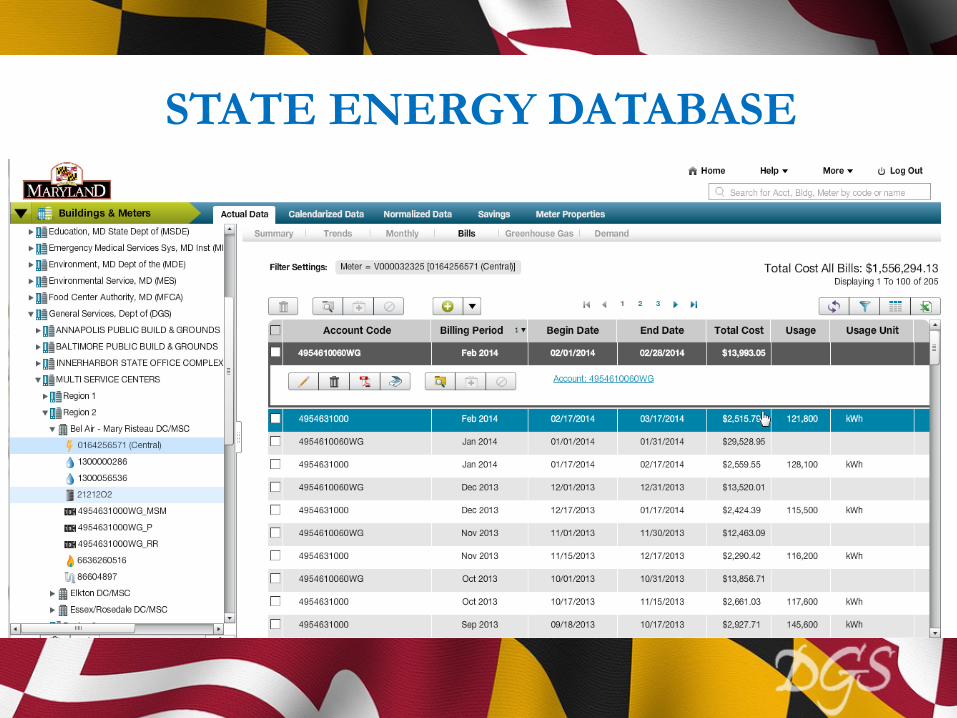
STATE ENERGY DATABASE • Tracks all commodities:
electricity, gas, oil, propane, water, sewer, steam, and chilled water
• All energy using facilities (buildings, traffic lights, stadiums, hospitals, fisheries, university campuses, etc.)
• 58 State Agencies (including the University System of Maryland)
• Includes over 22,000 accounts (16,000 active)
• Gather data from 120 accounts payable offices
• Bills are from 124 vendors • Over 1 million invoices in the
database • Comprehensive utility
database services contract (~ 1.1M /yr)
• Runs on EnergyCAP software
STATE ENERGY DATABASE
STATE ENERGY DATABASE
T k ll d
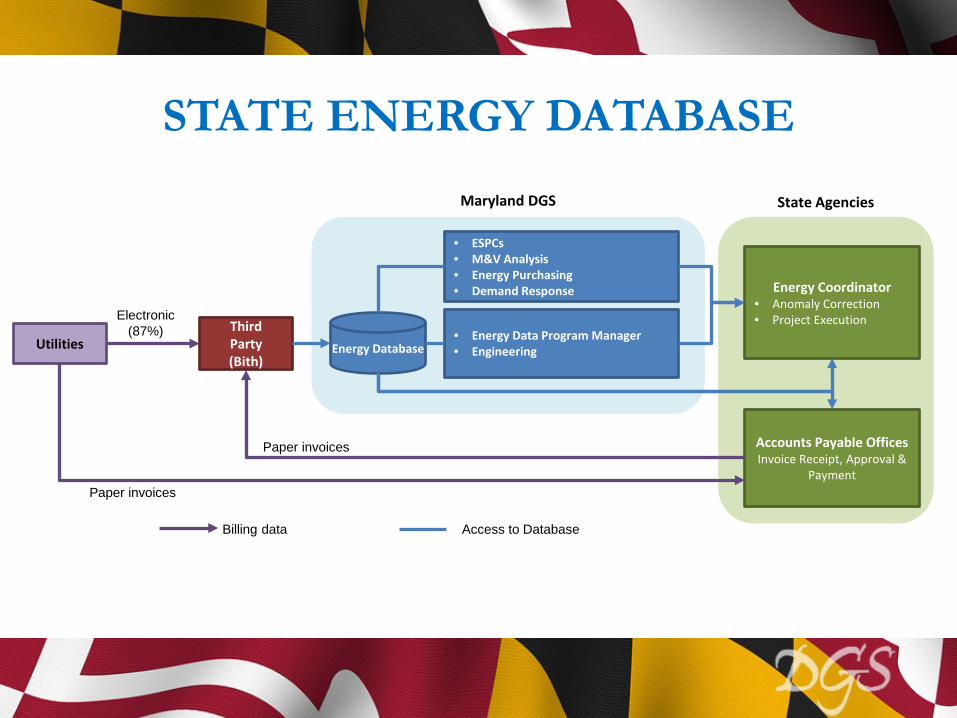
Third Party (Bith)
Energy Database • Energy Data Program Manager • Engineering
Energy Coordinator • Anomaly Correction • Project Execution
• ESPCs • M&V Analysis • Energy Purchasing • Demand Response
Accounts Payable Offices Invoice Receipt, Approval &
Payment
State Agencies Maryland DGS
Utilities
Electronic (87%)
Paper invoices
Paper invoices
Access to Database Billing data
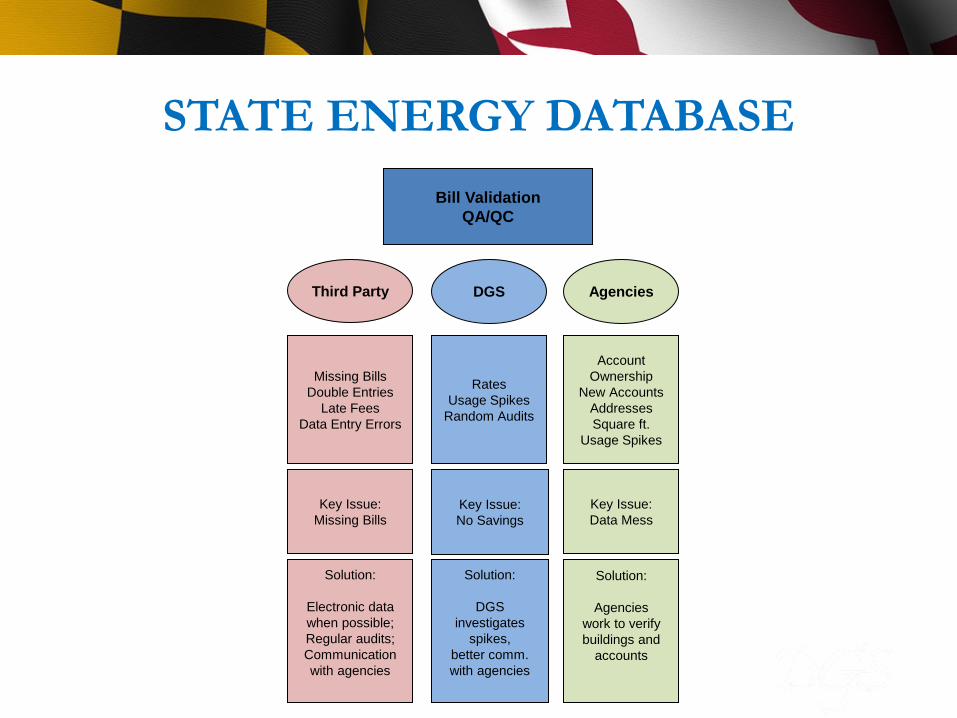
Bill Validation QA/QC
Third Party DGS Agencies
Missing Bills Double Entries
Late Fees Data Entry Errors
Rates Usage Spikes
Random Audits
Account Ownership
New Accounts Addresses Square ft.
Usage Spikes
Key Issue: Missing Bills
Key Issue: No Savings
Key Issue: Data Mess
Solution:
Electronic data when possible; Regular audits; Communication with agencies
Solution:
DGS investigates
spikes, better comm. with agencies
Solution:
Agencies work to verify buildings and
accounts
STATE ENERGY DATABASE
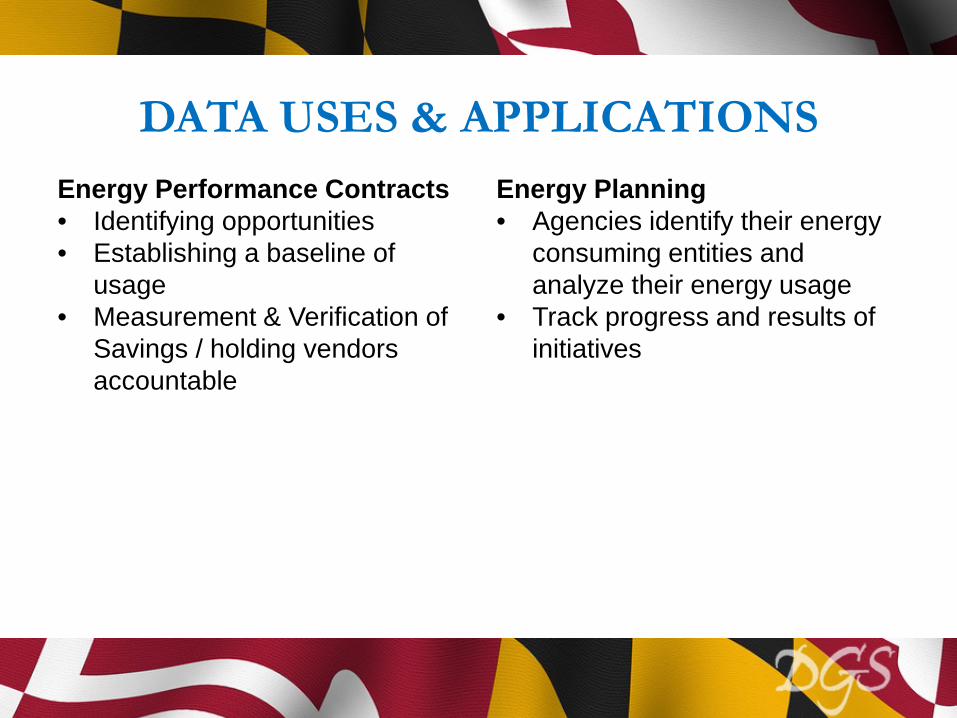
DATA USES & APPLICATIONS Energy Performance Contracts • Identifying opportunities • Establishing a baseline of
usage • Measurement & Verification of
Savings / holding vendors accountable
Energy Planning • Agencies identify their energy
consuming entities and analyze their energy usage
• Track progress and results of initiatives
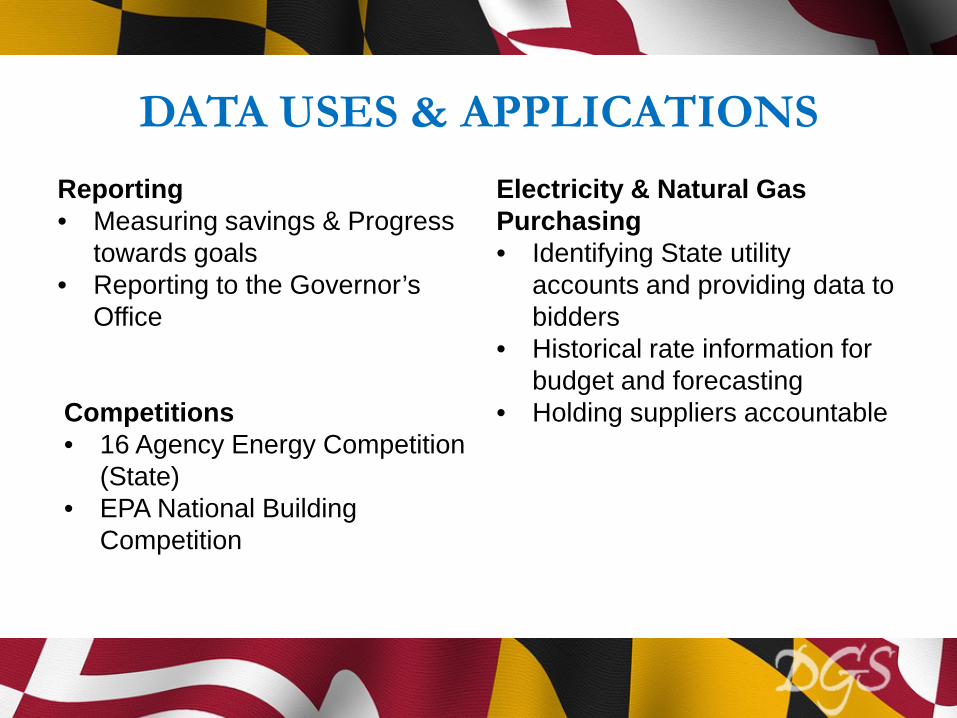
DATA USES & APPLICATIONS Reporting • Measuring savings & Progress
towards goals • Reporting to the Governor’s
Office
Electricity & Natural Gas Purchasing • Identifying State utility
accounts and providing data to bidders
• Historical rate information for budget and forecasting
• Holding suppliers accountable
Competitions • 16 Agency Energy Competition
(State) • EPA National Building
Competition

Public Facing Database: http://www.dgs.maryland.gov/Energy/Database/EnergyDatabasePublic.html
QUESTIONS?
Emily Soontornsaratool Energy Data Program Manager
Office of Energy Performance & Conservation MD Dept. of General Services
[email protected] (410) 767-3061

Anand Natarajan City of Cleveland, OH
Energy Data Access & Tracking
Leveraging Resources
Public Sector Data Workshop
Better Buildings Summit May 29, 2015
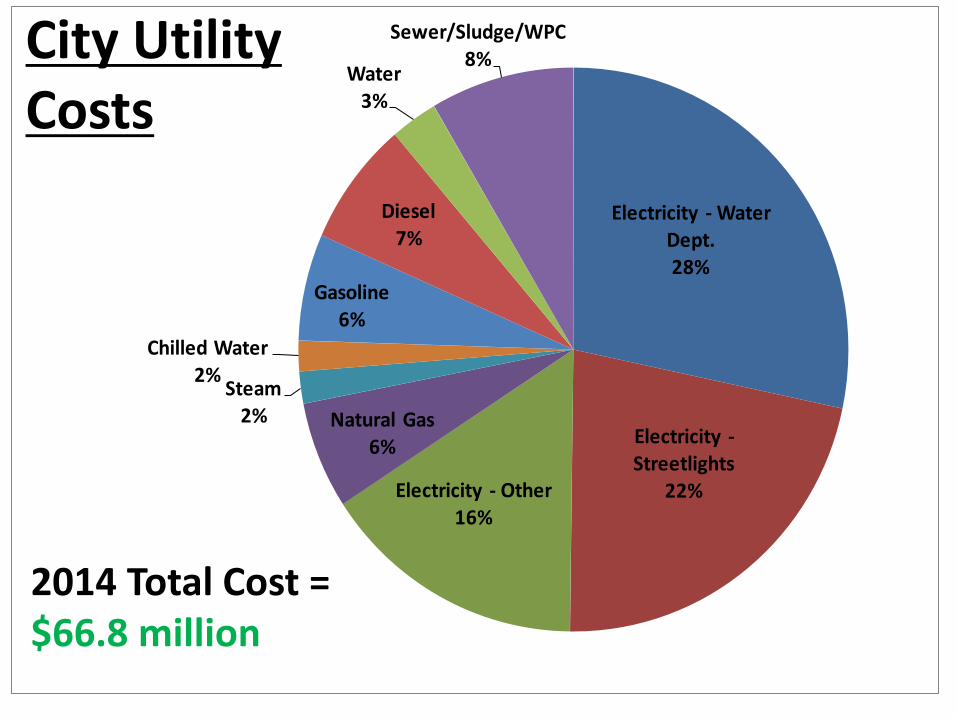
Electricity - Water Dept.28%
Electricity -Streetlights
22%Electricity - Other16%
Natural Gas6%
Steam2%
Chilled Water2%
Gasoline6%
Diesel7%
Water3%
Sewer/Sludge/WPC8%City Utility
Costs
2014 Total Cost = $66.8 million
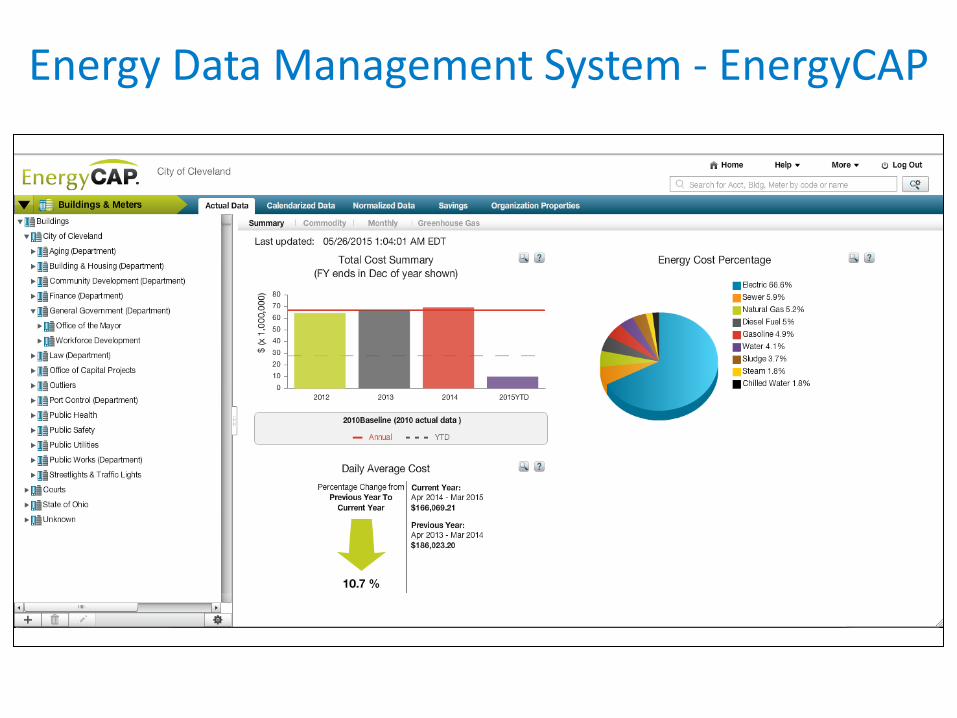
Energy Data Management System - EnergyCAP
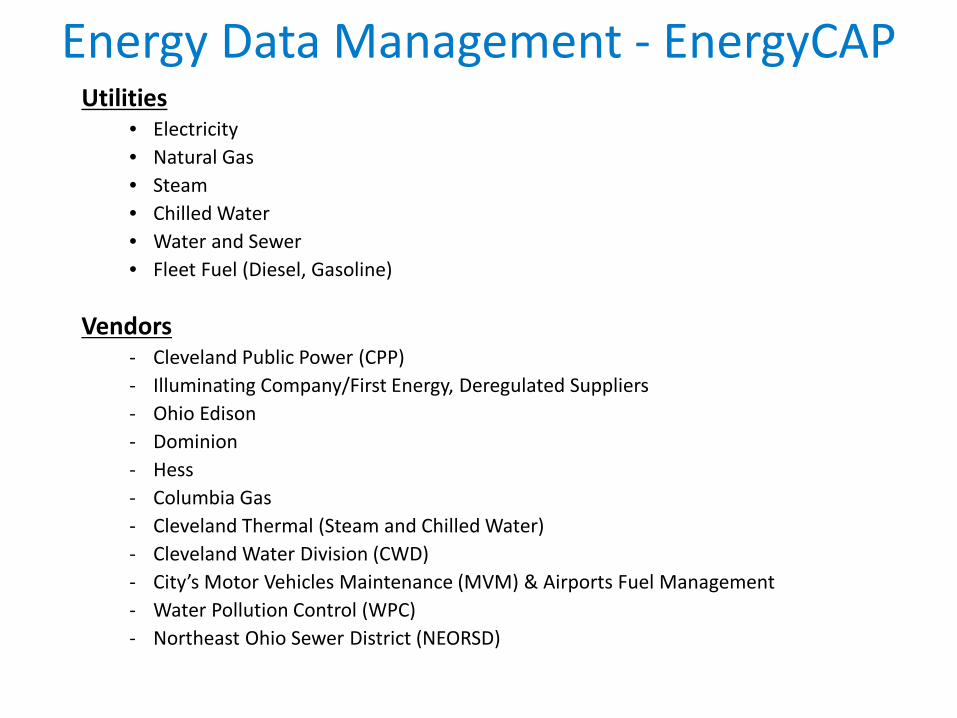
Energy Data Management - EnergyCAP Utilities
• Electricity • Natural Gas • Steam • Chilled Water • Water and Sewer • Fleet Fuel (Diesel, Gasoline)
Vendors - Cleveland Public Power (CPP) - Illuminating Company/First Energy, Deregulated Suppliers - Ohio Edison - Dominion - Hess - Columbia Gas - Cleveland Thermal (Steam and Chilled Water) - Cleveland Water Division (CWD) - City’s Motor Vehicles Maintenance (MVM) & Airports Fuel Management - Water Pollution Control (WPC) - Northeast Ohio Sewer District (NEORSD)
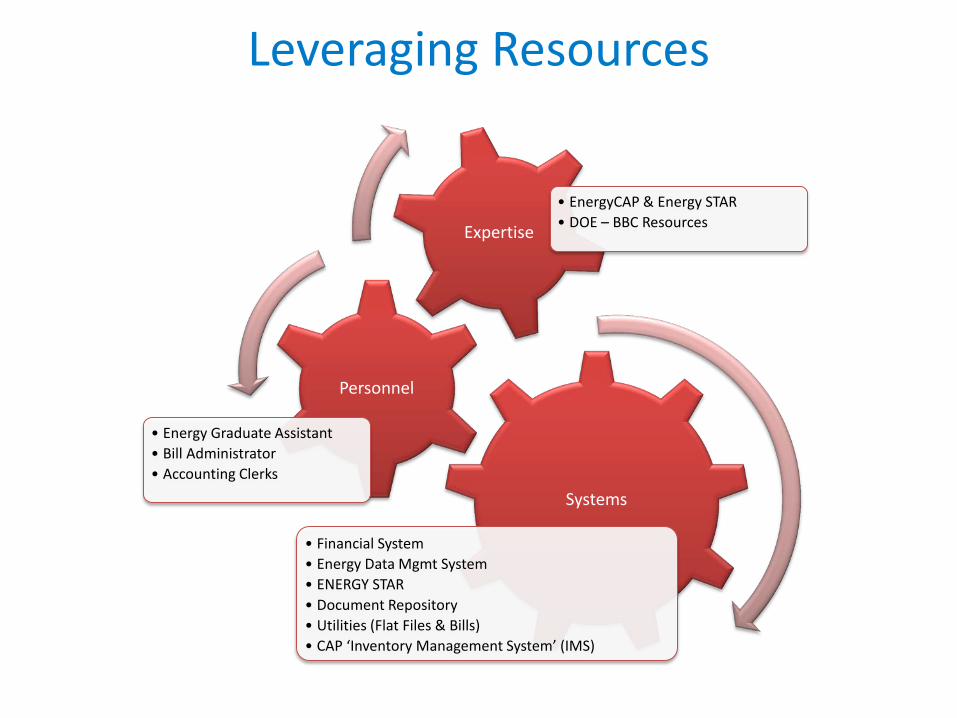
Leveraging Resources
Systems
• Financial System • Energy Data Mgmt System • ENERGY STAR • Document Repository • Utilities (Flat Files & Bills) • CAP ‘Inventory Management System’ (IMS)
Personnel
• Energy Graduate Assistant • Bill Administrator • Accounting Clerks
Expertise
• EnergyCAP & Energy STAR • DOE – BBC Resources
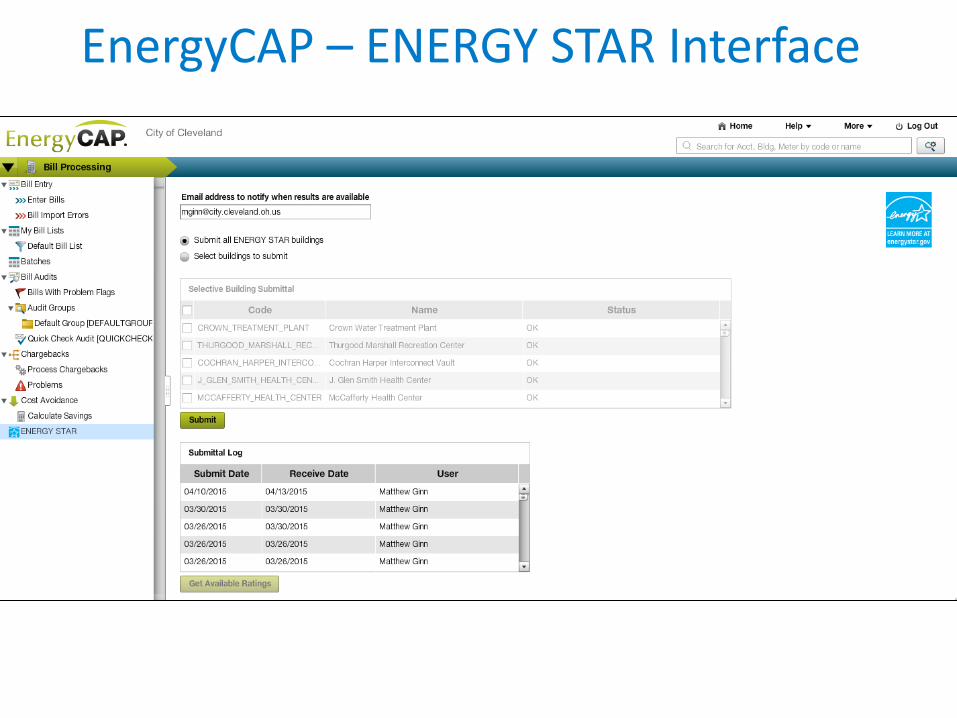
EnergyCAP – ENERGY STAR Interface
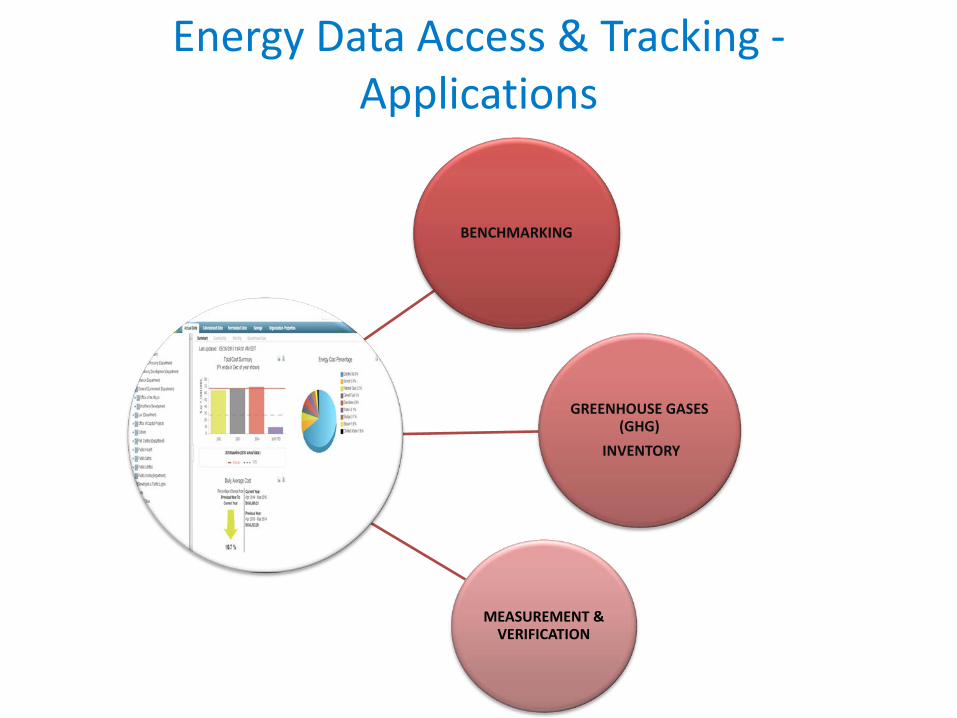
Energy Data Access & Tracking - Applications
BENCHMARKING
GREENHOUSE GASES (GHG)
INVENTORY
MEASUREMENT & VERIFICATION
Thank You!
Anand Natarajan, Energy Manager
City of Cleveland, Mayor’s Office of Sustainability [email protected]
Join us at :
www.SustainableCleveland.org
Jessica Granderson Lawrence Berkeley National Laboratory
Energy Management and Information Systems: Performance Monitoring, Analytics, Diagnostics
Jessica Granderson
Lawrence Berkeley National Laboratory
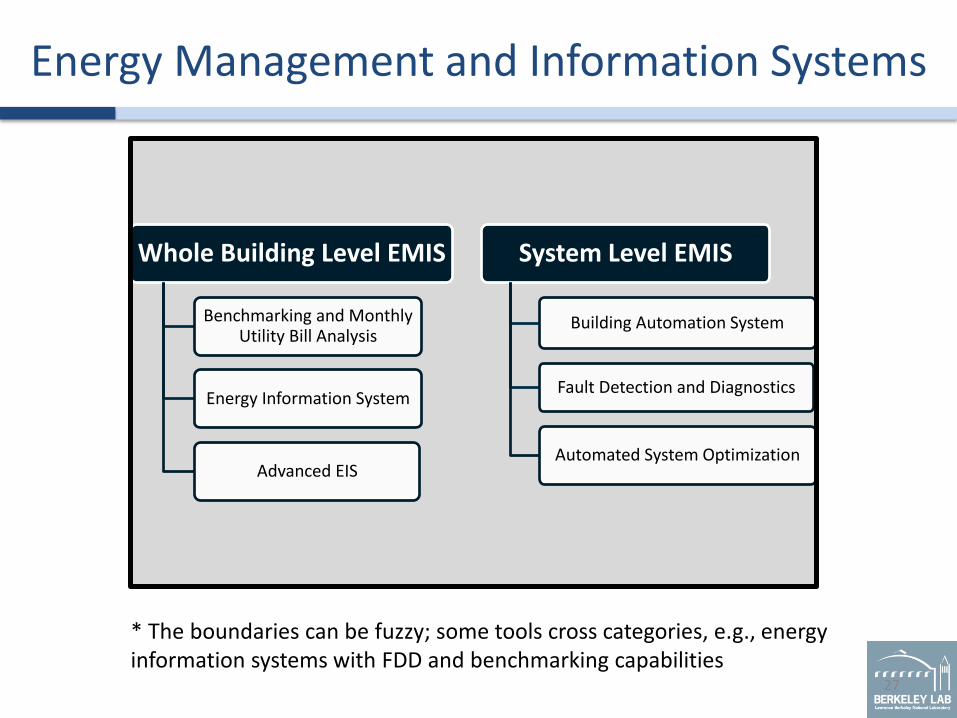
Energy Management and Information Systems
27
Whole Building Level EMIS
Benchmarking and Monthly Utility Bill Analysis
Energy Information System
Advanced EIS
System Level EMIS
Building Automation System
Fault Detection and Diagnostics
Automated System Optimization
* The boundaries can be fuzzy; some tools cross categories, e.g., energy information systems with FDD and benchmarking capabilities
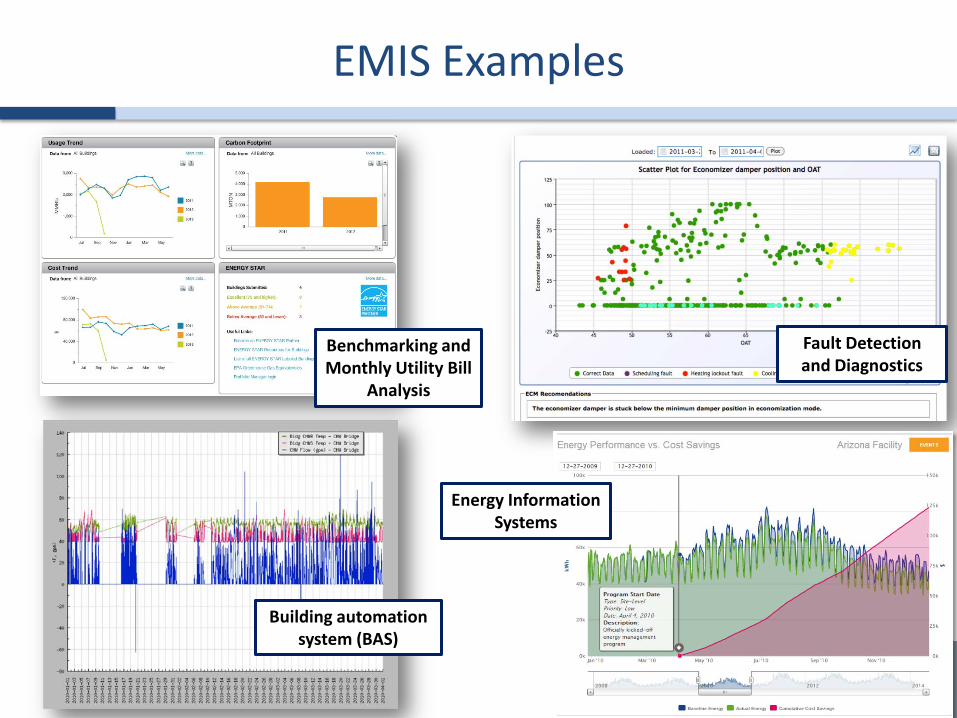
EMIS Examples
Building automation system (BAS)
Fault Detection and Diagnostics
Benchmarking and Monthly Utility Bill
Analysis
Energy Information Systems
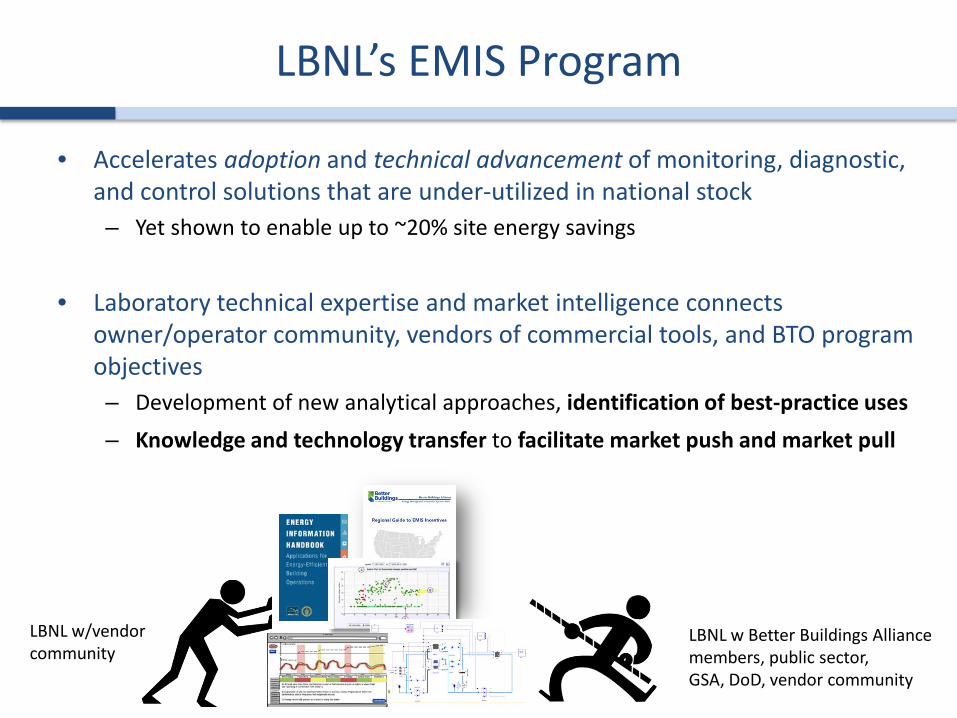
LBNL’s EMIS Program
• Accelerates adoption and technical advancement of monitoring, diagnostic, and control solutions that are under-utilized in national stock – Yet shown to enable up to ~20% site energy savings
• Laboratory technical expertise and market intelligence connects
owner/operator community, vendors of commercial tools, and BTO program objectives – Development of new analytical approaches, identification of best-practice uses – Knowledge and technology transfer to facilitate market push and market pull
LBNL w Better Buildings Alliance members, public sector, GSA, DoD, vendor community
LBNL w/vendor community
BBA EMIS Project Team Overview
• Activity: adopt or expand use of EMIS in your organization
• Members from public and private sector, retail, hospital, real estate
• Existing and ongoing resources
– Peer learning, public/private/utility pilots and demos – Technology costs and benefits, business value proposition – Synthesis of existing EMIS resources, “Cliff’s Notes” – Regional guide to EMIS utility incentives – Vendor overviews and guest login access – Procurement support materials: master spec and RFP, selection
guidance
30

Small Group Discussions Round 1

Discussion Format
Step 1: Pick a topic table Step 2. Write down a question for the facilitator Step 3: Facilitator reviews all questions and uses them as a guide for ensuing discussion Step 4: Report Out (1 min each) Barriers discussed Solutions/successes discussed Connections/contributions made, concrete action items or
next steps Remaining questions
32
Small Group Discussions: Data Access and Tracking
33
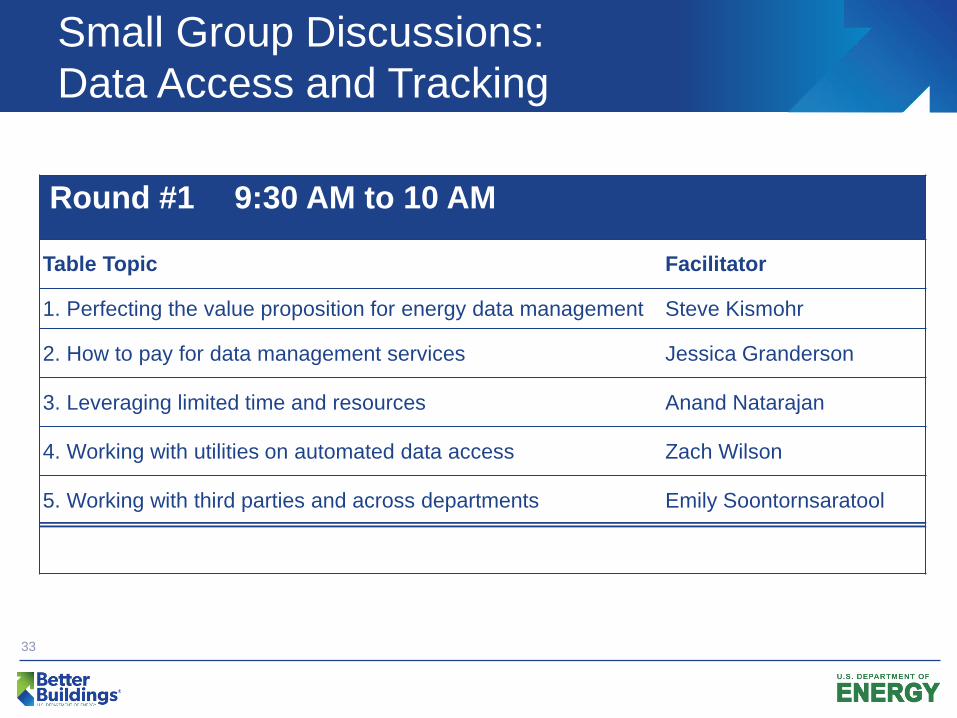
Round #1 9:30 AM to 10 AM
Table Topic Facilitator
1. Perfecting the value proposition for energy data management Steve Kismohr
2. How to pay for data management services Jessica Granderson
3. Leveraging limited time and resources Anand Natarajan
4. Working with utilities on automated data access Zach Wilson
5. Working with third parties and across departments Emily Soontornsaratool

Kathy Pecora, Will County, IL

Zach Wilson District of Columbia/New City Energy

Elena Alschuler DOE
37 | Energy Efficiency and Renewable Energy eere.energy.gov
Data Tools Overview
Elena Alschuler [email protected]
Building Technologies Office U.S. Department of Energy
May 2015
38
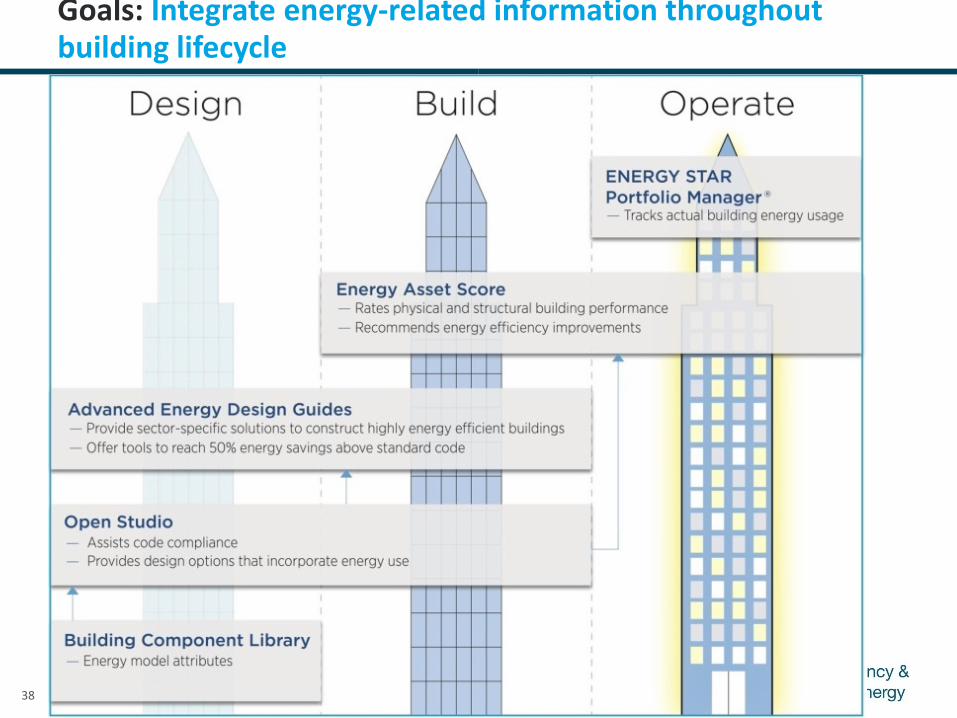
Goals: Integrate energy-related information throughout building lifecycle
39
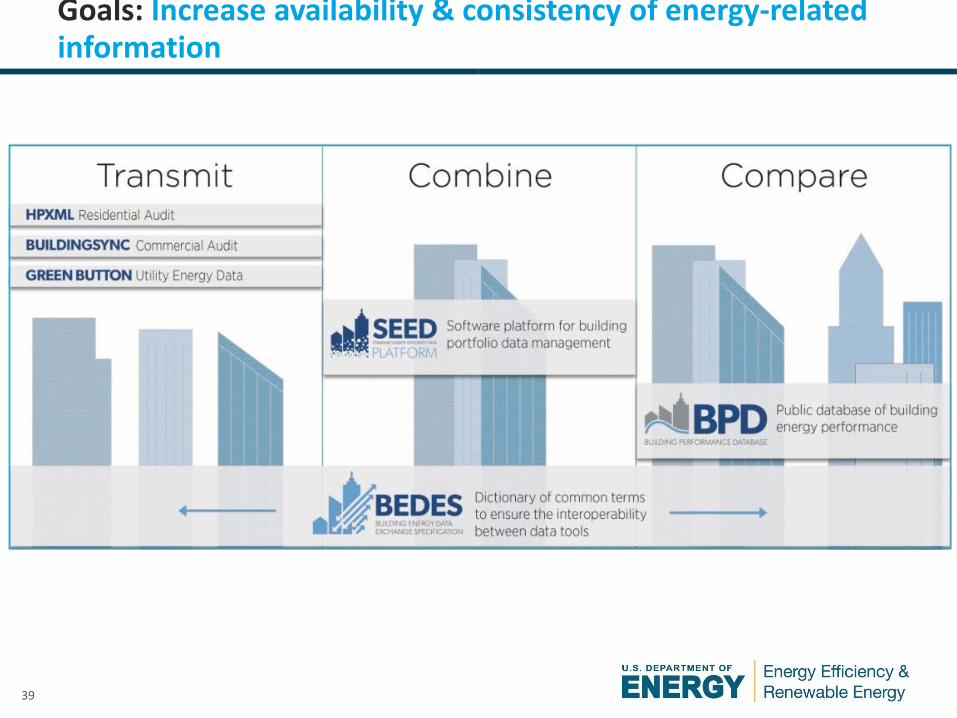
Goals: Increase availability & consistency of energy-related information
40
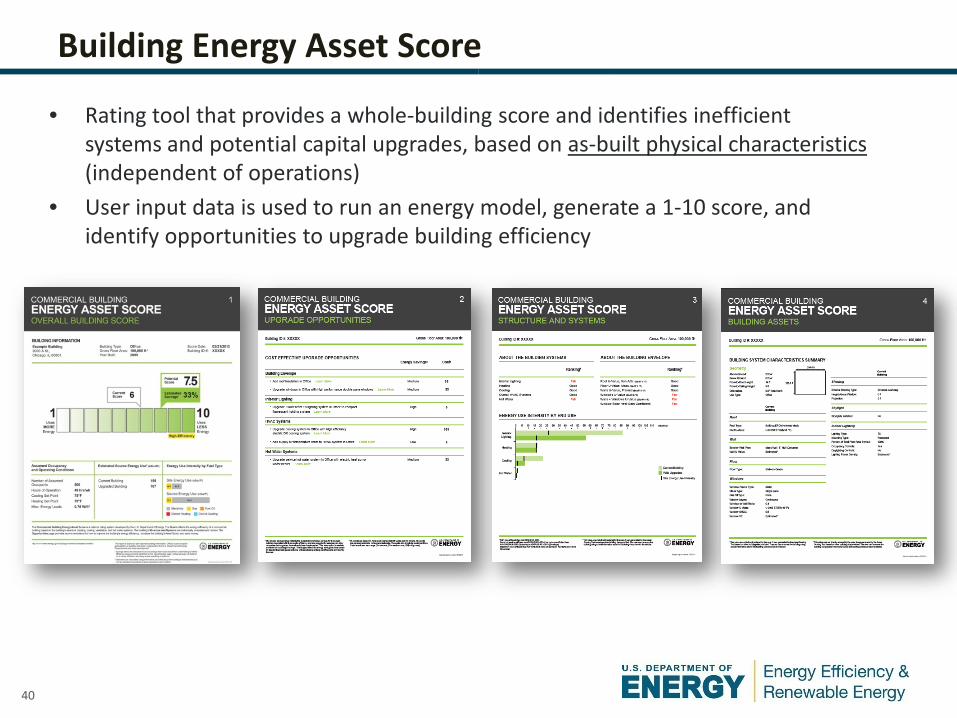
Building Energy Asset Score
• Rating tool that provides a whole-building score and identifies inefficient systems and potential capital upgrades, based on as-built physical characteristics (independent of operations)
• User input data is used to run an energy model, generate a 1-10 score, and identify opportunities to upgrade building efficiency
41
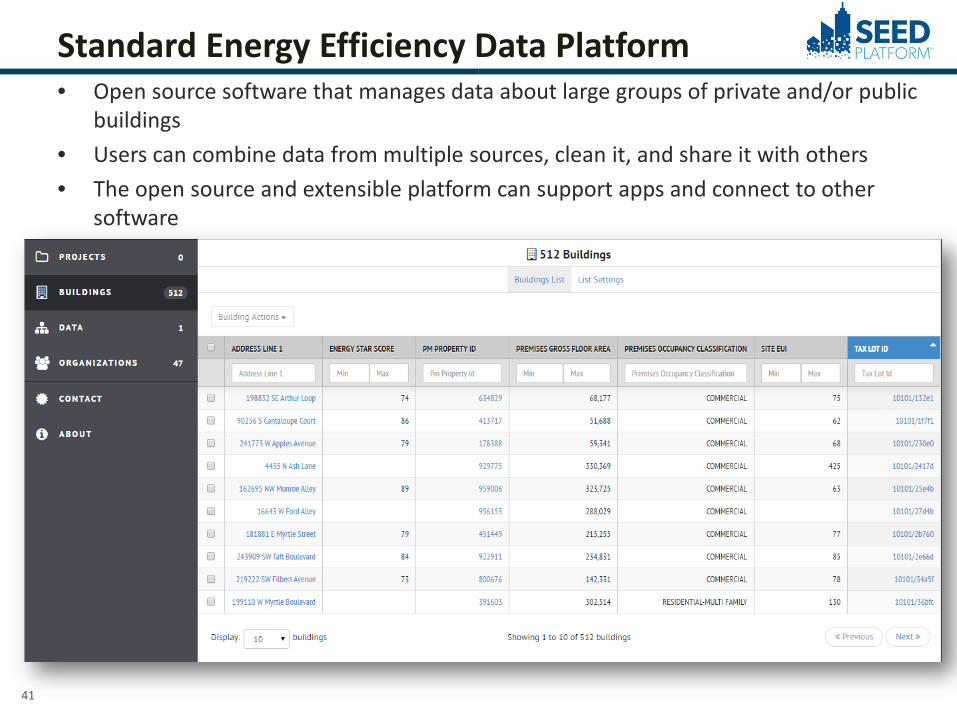
Standard Energy Efficiency Data Platform • Open source software that manages data about large groups of private and/or public
buildings • Users can combine data from multiple sources, clean it, and share it with others • The open source and extensible platform can support apps and connect to other
software
42
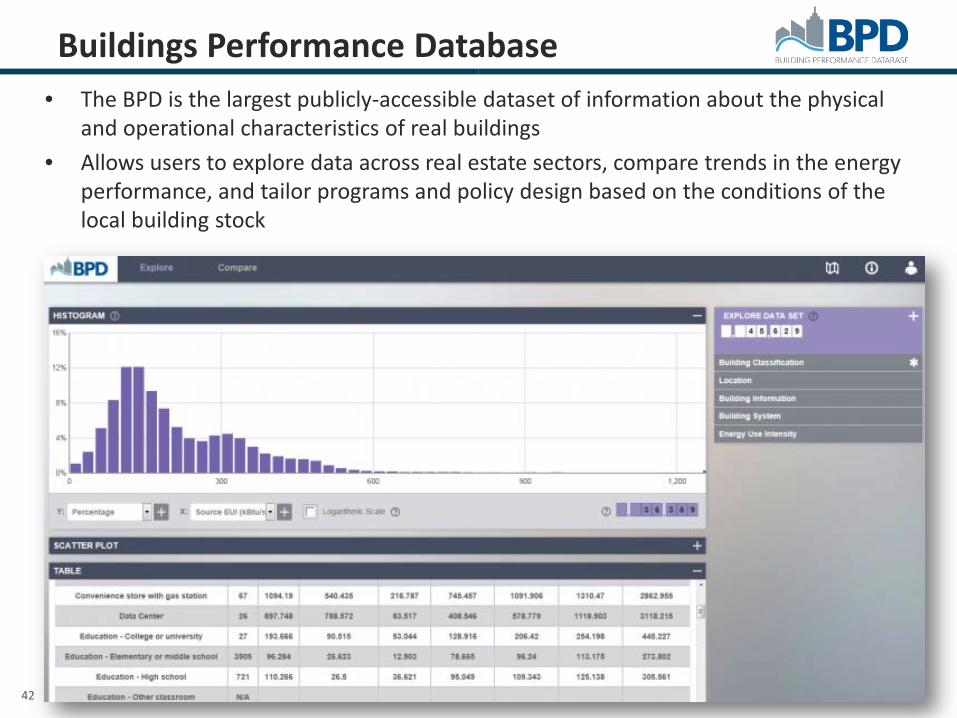
Buildings Performance Database • The BPD is the largest publicly-accessible dataset of information about the physical
and operational characteristics of real buildings • Allows users to explore data across real estate sectors, compare trends in the energy
performance, and tailor programs and policy design based on the conditions of the local building stock
43
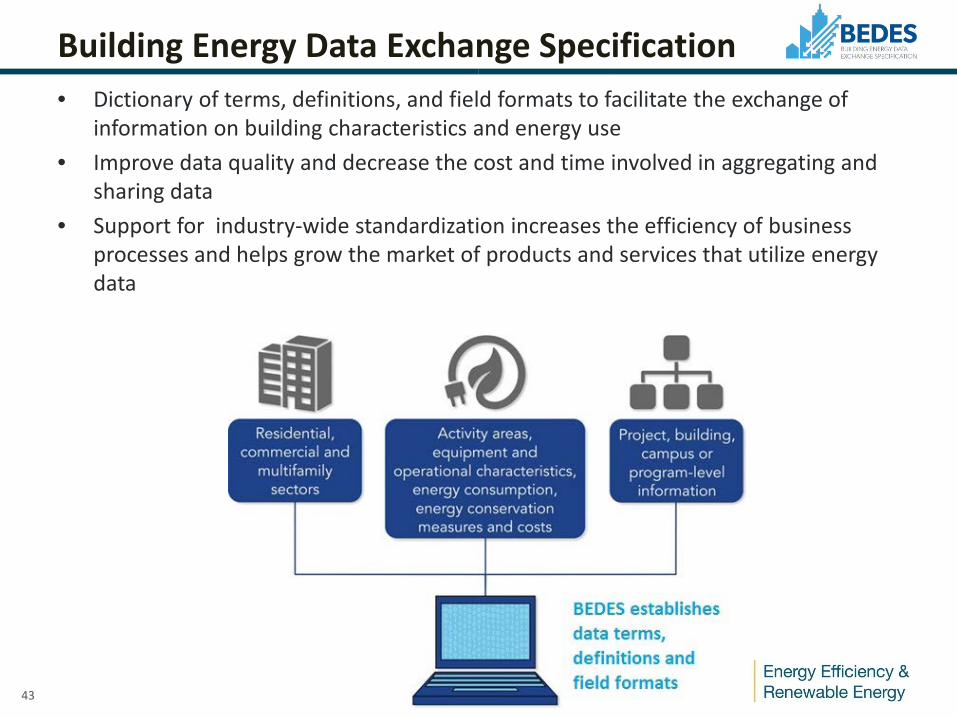
Building Energy Data Exchange Specification • Dictionary of terms, definitions, and field formats to facilitate the exchange of
information on building characteristics and energy use • Improve data quality and decrease the cost and time involved in aggregating and
sharing data • Support for industry-wide standardization increases the efficiency of business
processes and helps grow the market of products and services that utilize energy data

44
Paul Mathew LBNL
45 | Energy Efficiency and Renewable Energy eere.energy.gov
Paul Mathew Lawrence Berkeley National Lab
Data Cleansing: Lessons from the BPD
46
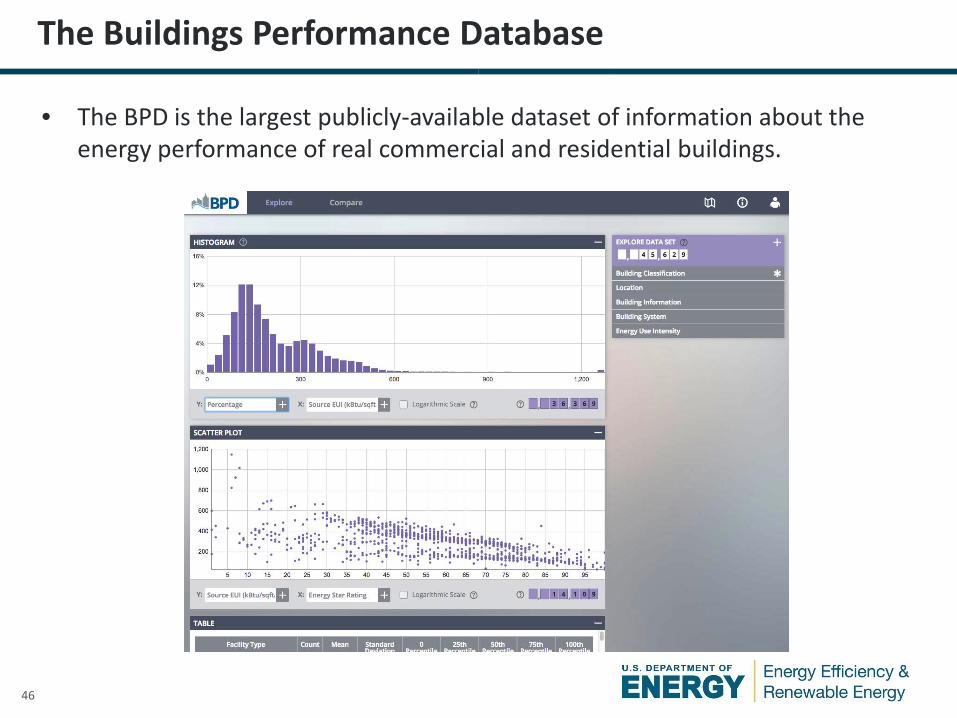
The Buildings Performance Database
• The BPD is the largest publicly-available dataset of information about the energy performance of real commercial and residential buildings.
47
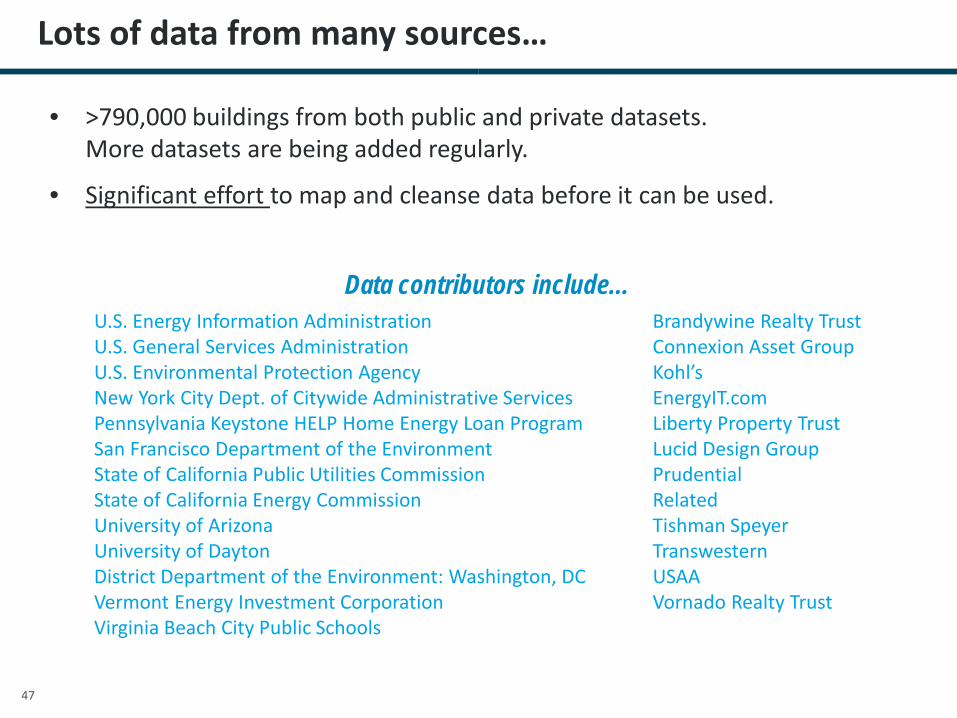
Lots of data from many sources…
• >790,000 buildings from both public and private datasets. More datasets are being added regularly.
• Significant effort to map and cleanse data before it can be used.
U.S. Energy Information Administration U.S. General Services Administration U.S. Environmental Protection Agency New York City Dept. of Citywide Administrative Services Pennsylvania Keystone HELP Home Energy Loan Program San Francisco Department of the Environment State of California Public Utilities Commission State of California Energy Commission University of Arizona University of Dayton District Department of the Environment: Washington, DC Vermont Energy Investment Corporation Virginia Beach City Public Schools
Brandywine Realty Trust Connexion Asset Group Kohl’s EnergyIT.com Liberty Property Trust Lucid Design Group Prudential Related Tishman Speyer Transwestern USAA Vornado Realty Trust
Data contributors include…
48
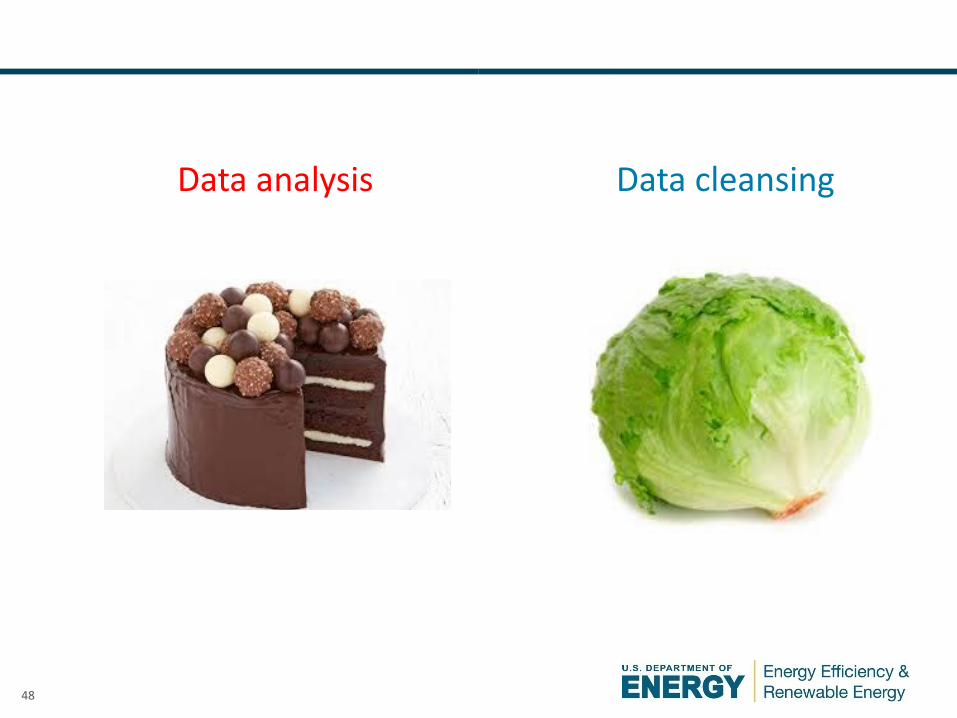
Data analysis Data cleansing
49
Data Cleansing: Why Do It?
• Bad data happens! – Errors in collection, collation, transmission, transformation…
• Bad data “contaminates” the data set and can lead to inaccurate
analysis and erroneous decisions.
• Bad data can lead to lack of confidence in results, potentially undermining the credibility of the underlying program or policy.
50
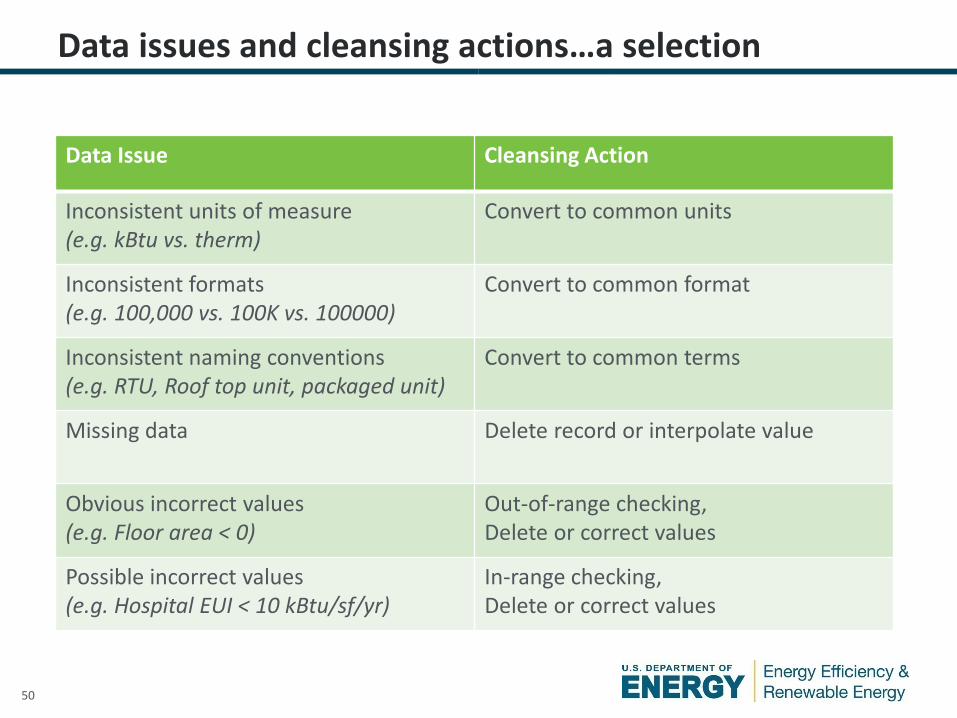
Data issues and cleansing actions…a selection
Data Issue Cleansing Action
Inconsistent units of measure (e.g. kBtu vs. therm)
Convert to common units
Inconsistent formats (e.g. 100,000 vs. 100K vs. 100000)
Convert to common format
Inconsistent naming conventions (e.g. RTU, Roof top unit, packaged unit)
Convert to common terms
Missing data Delete record or interpolate value
Obvious incorrect values (e.g. Floor area < 0)
Out-of-range checking, Delete or correct values
Possible incorrect values (e.g. Hospital EUI < 10 kBtu/sf/yr)
In-range checking, Delete or correct values
51
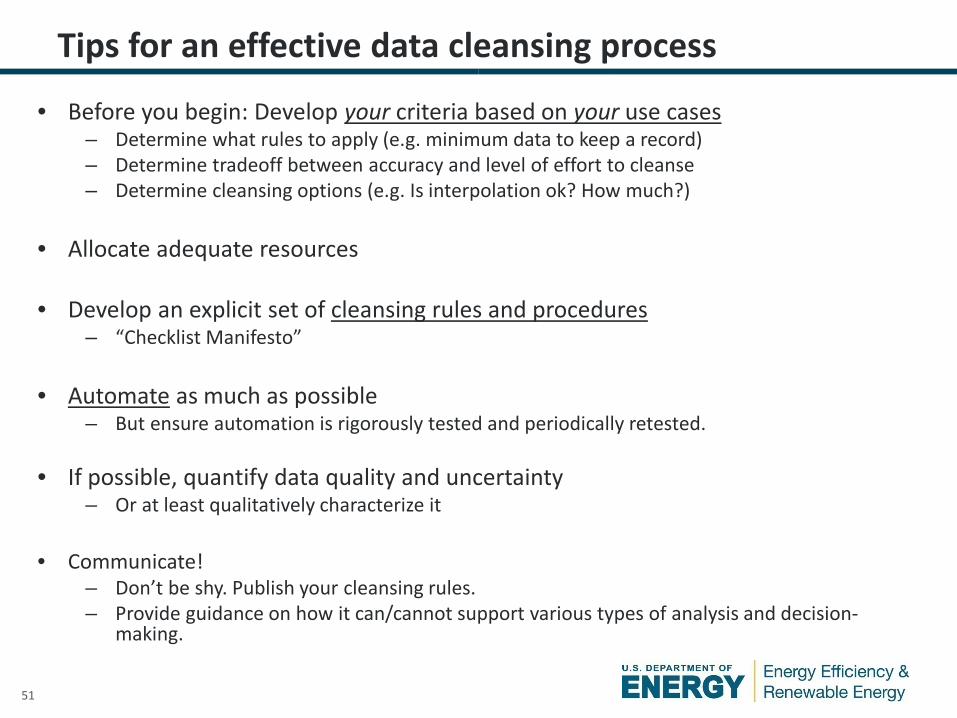
Tips for an effective data cleansing process
• Before you begin: Develop your criteria based on your use cases – Determine what rules to apply (e.g. minimum data to keep a record) – Determine tradeoff between accuracy and level of effort to cleanse – Determine cleansing options (e.g. Is interpolation ok? How much?)
• Allocate adequate resources • Develop an explicit set of cleansing rules and procedures
– “Checklist Manifesto”
• Automate as much as possible – But ensure automation is rigorously tested and periodically retested.
• If possible, quantify data quality and uncertainty
– Or at least qualitatively characterize it
• Communicate! – Don’t be shy. Publish your cleansing rules. – Provide guidance on how it can/cannot support various types of analysis and decision-
making.
52
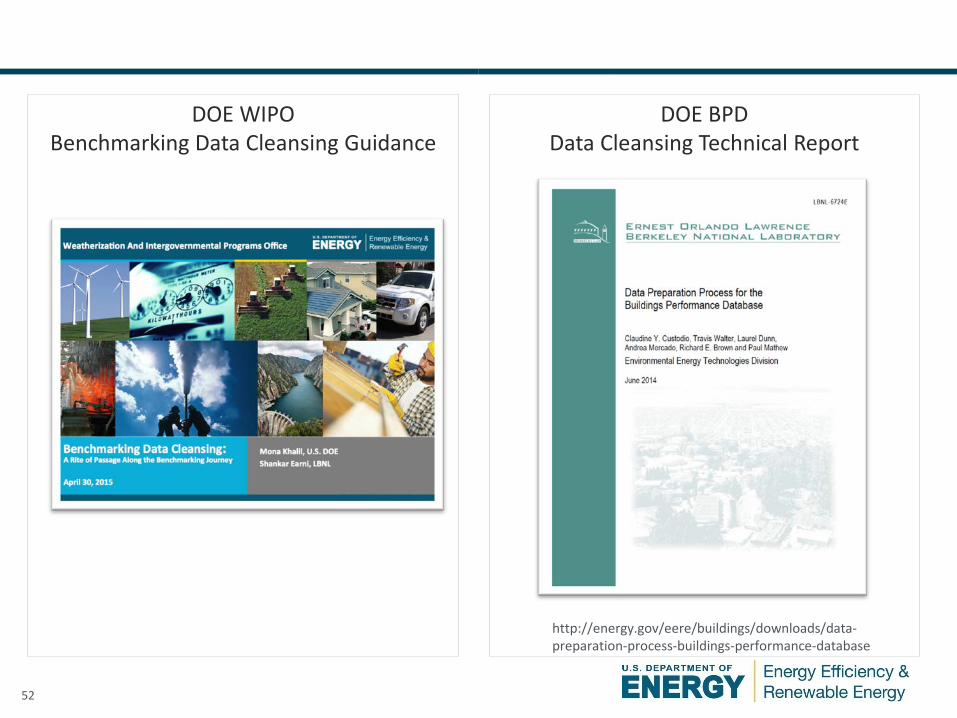
DOE WIPO Benchmarking Data Cleansing Guidance
DOE BPD Data Cleansing Technical Report
http://energy.gov/eere/buildings/downloads/data-preparation-process-buildings-performance-database
54
Andrea Hessenius Massachusetts Dept. of Energy Resources

55
Creating A Cleaner Energy Future For the Commonwealth
Data-Based Program Design Better Buildings Challenge Summit May 29, 2015 Elise Anderson Andrea Hessenius Massachusetts Dept. of Energy Resources

56 Creating A Cleaner Energy Future For the Commonwealth
Key Discussion Points
• State Policy Drivers Green Communities Division Leading by Example Program
• Data Requirements • MassEnergyInsight
An example of how DOER collects data
• DOER Data-Based Opportunity Design Case Studies
56
57 Creating A Cleaner Energy Future For the Commonwealth
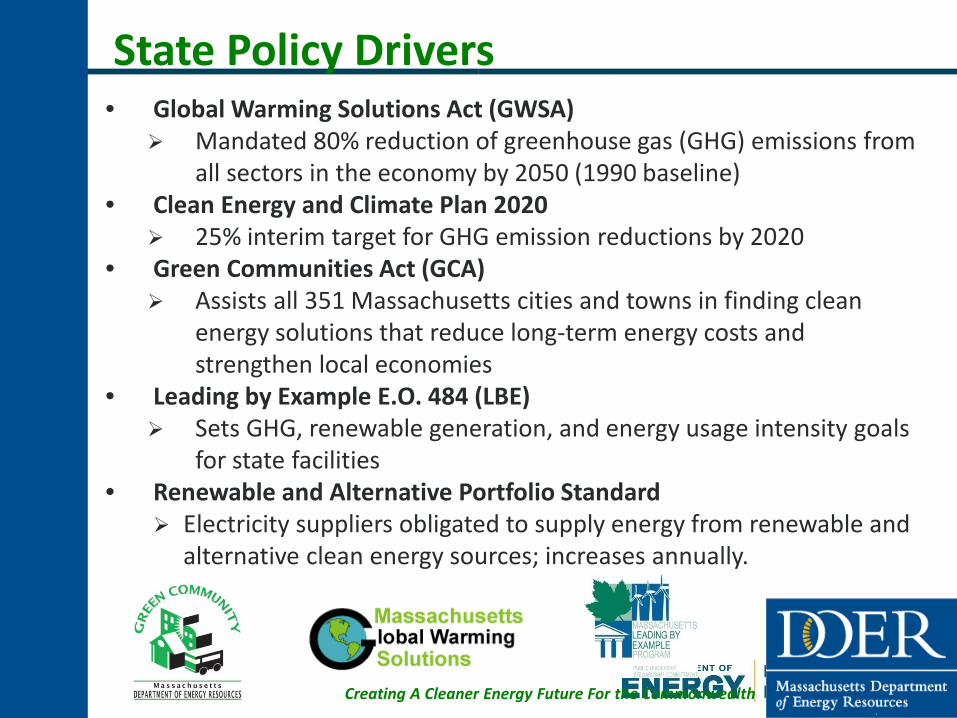
State Policy Drivers • Global Warming Solutions Act (GWSA)
Mandated 80% reduction of greenhouse gas (GHG) emissions from all sectors in the economy by 2050 (1990 baseline)
• Clean Energy and Climate Plan 2020 25% interim target for GHG emission reductions by 2020
• Green Communities Act (GCA) Assists all 351 Massachusetts cities and towns in finding clean
energy solutions that reduce long-term energy costs and strengthen local economies
• Leading by Example E.O. 484 (LBE) Sets GHG, renewable generation, and energy usage intensity goals
for state facilities • Renewable and Alternative Portfolio Standard
Electricity suppliers obligated to supply energy from renewable and alternative clean energy sources; increases annually.
58
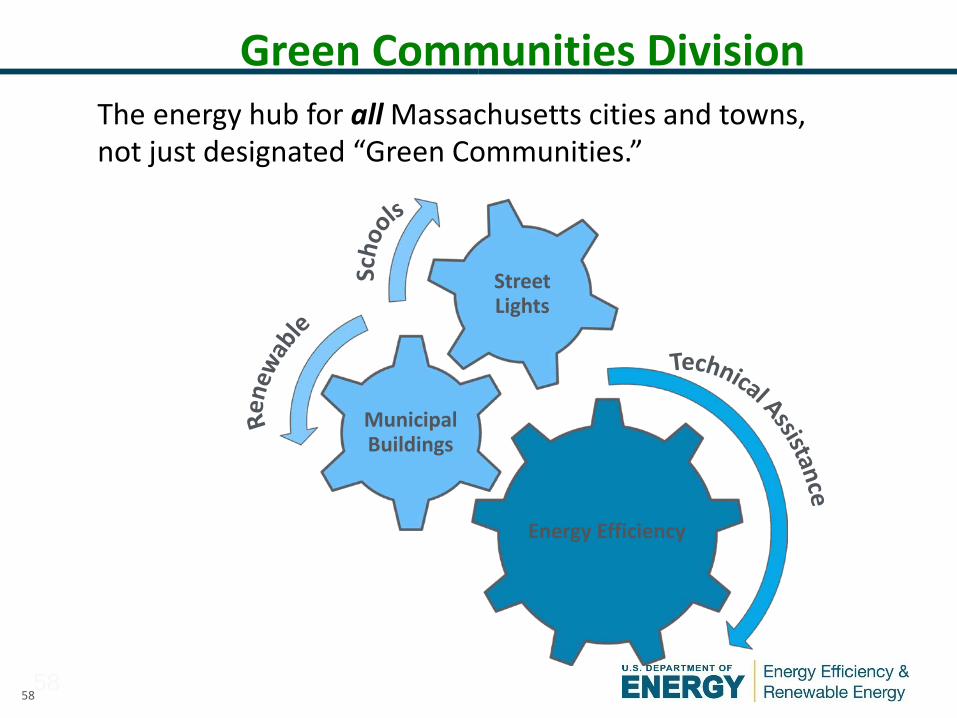
The energy hub for all Massachusetts cities and towns, not just designated “Green Communities.”
58
Green Communities Division
Energy Efficiency
Municipal Buildings
Street Lights
59
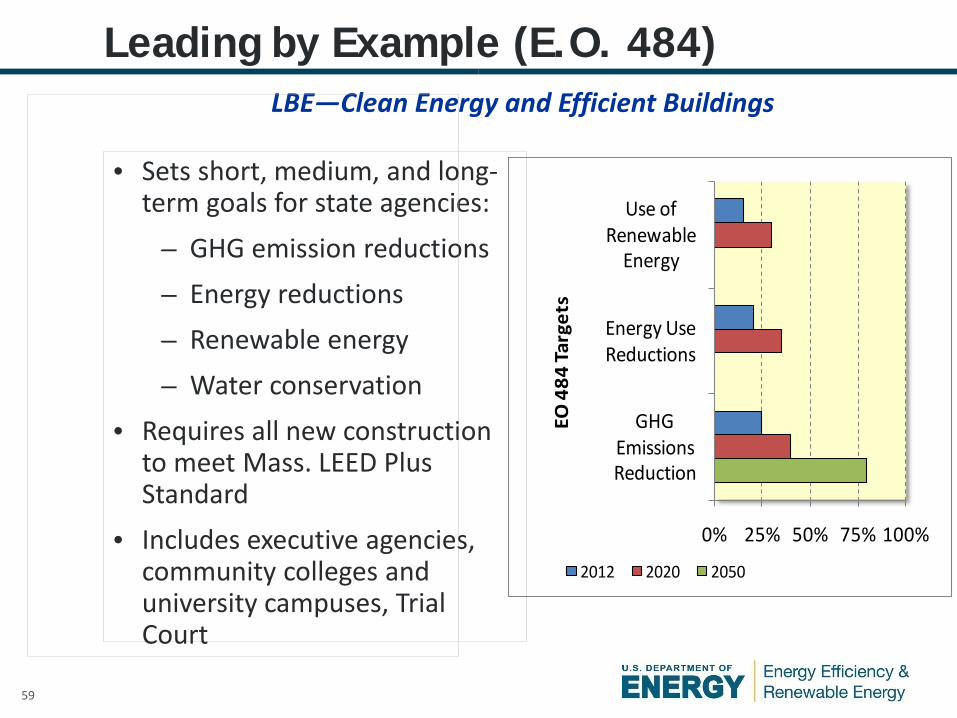
Leading by Example (E.O. 484)
• Sets short, medium, and long-term goals for state agencies:
– GHG emission reductions – Energy reductions – Renewable energy – Water conservation
• Requires all new construction to meet Mass. LEED Plus Standard
• Includes executive agencies, community colleges and university campuses, Trial Court
LBE—Clean Energy and Efficient Buildings
0% 25% 50% 75% 100%
GHG EmissionsReduction
Energy UseReductions
Use ofRenewable
Energy
EO 4
84 Ta
rget
s2012 2020 2050
60 Creating A Cleaner Energy Future For the Commonwealth
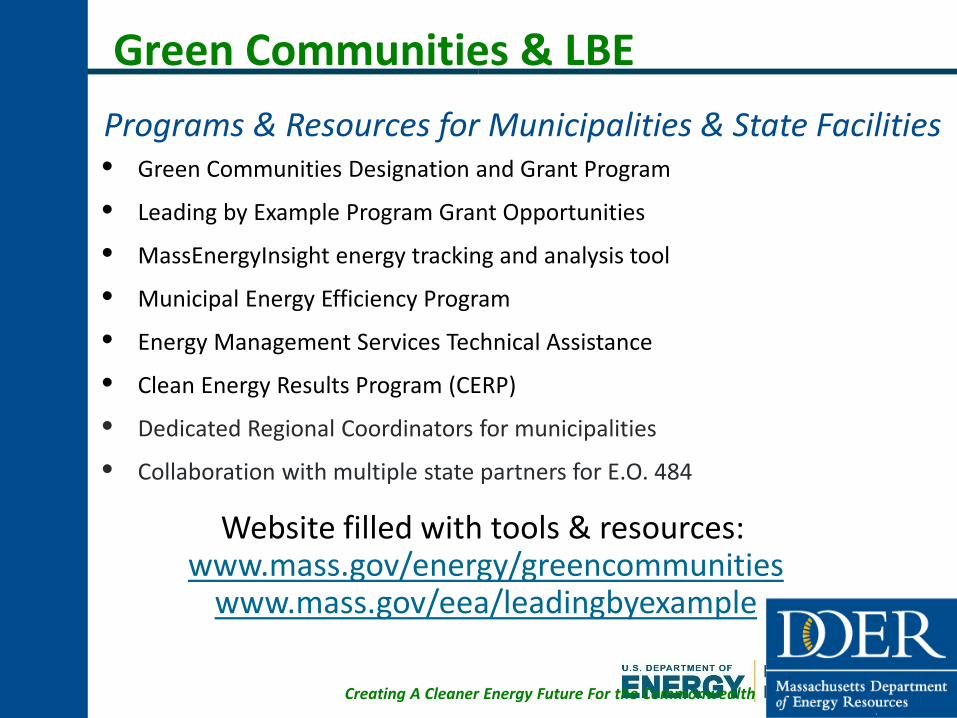
Green Communities & LBE
• Green Communities Designation and Grant Program
• Leading by Example Program Grant Opportunities
• MassEnergyInsight energy tracking and analysis tool
• Municipal Energy Efficiency Program
• Energy Management Services Technical Assistance
• Clean Energy Results Program (CERP)
• Dedicated Regional Coordinators for municipalities
• Collaboration with multiple state partners for E.O. 484
Website filled with tools & resources: www.mass.gov/energy/greencommunities
www.mass.gov/eea/leadingbyexample
Programs & Resources for Municipalities & State Facilities
61
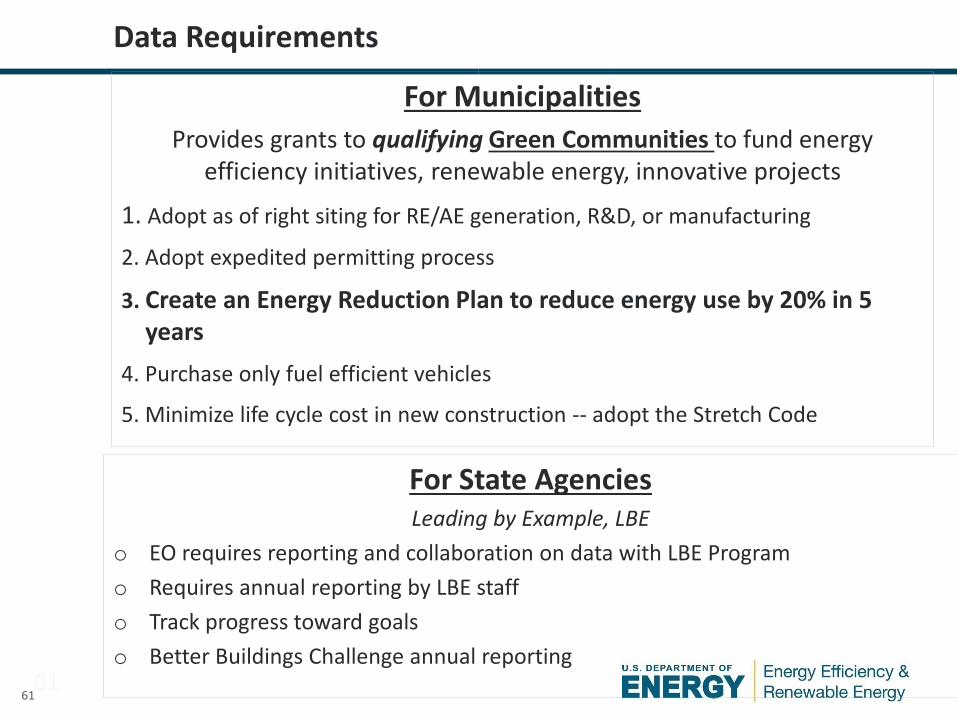
For State Agencies Leading by Example, LBE
o EO requires reporting and collaboration on data with LBE Program o Requires annual reporting by LBE staff o Track progress toward goals o Better Buildings Challenge annual reporting
For Municipalities Provides grants to qualifying Green Communities to fund energy
efficiency initiatives, renewable energy, innovative projects
1. Adopt as of right siting for RE/AE generation, R&D, or manufacturing
2. Adopt expedited permitting process
3. Create an Energy Reduction Plan to reduce energy use by 20% in 5 years
4. Purchase only fuel efficient vehicles
5. Minimize life cycle cost in new construction -- adopt the Stretch Code
61
Data Requirements
62
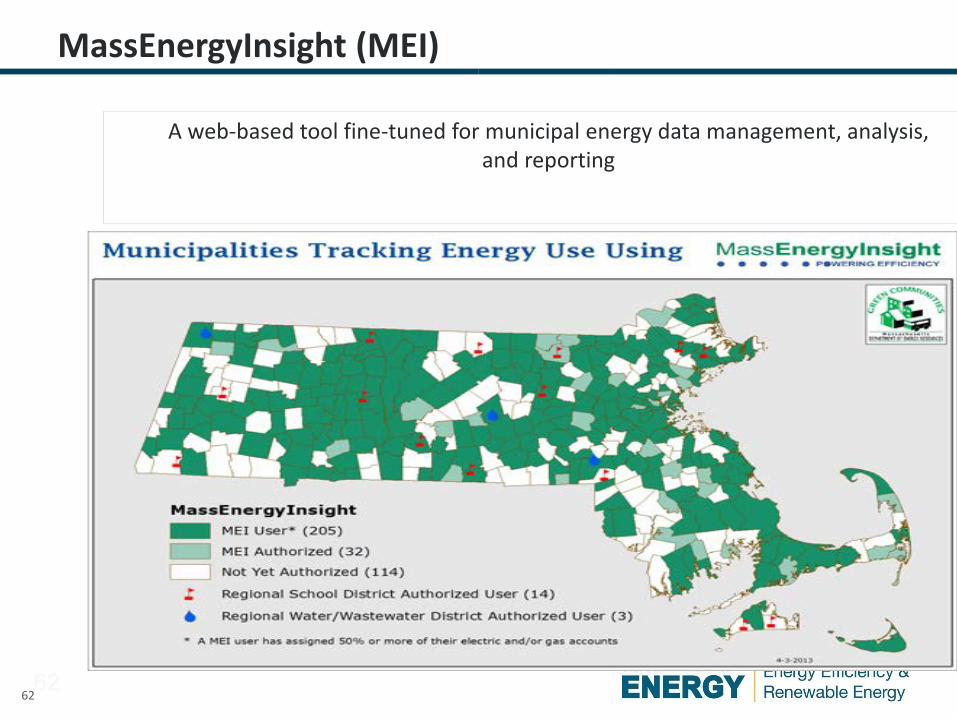
MassEnergyInsight (MEI)
A web-based tool fine-tuned for municipal energy data management, analysis, and reporting
62
63
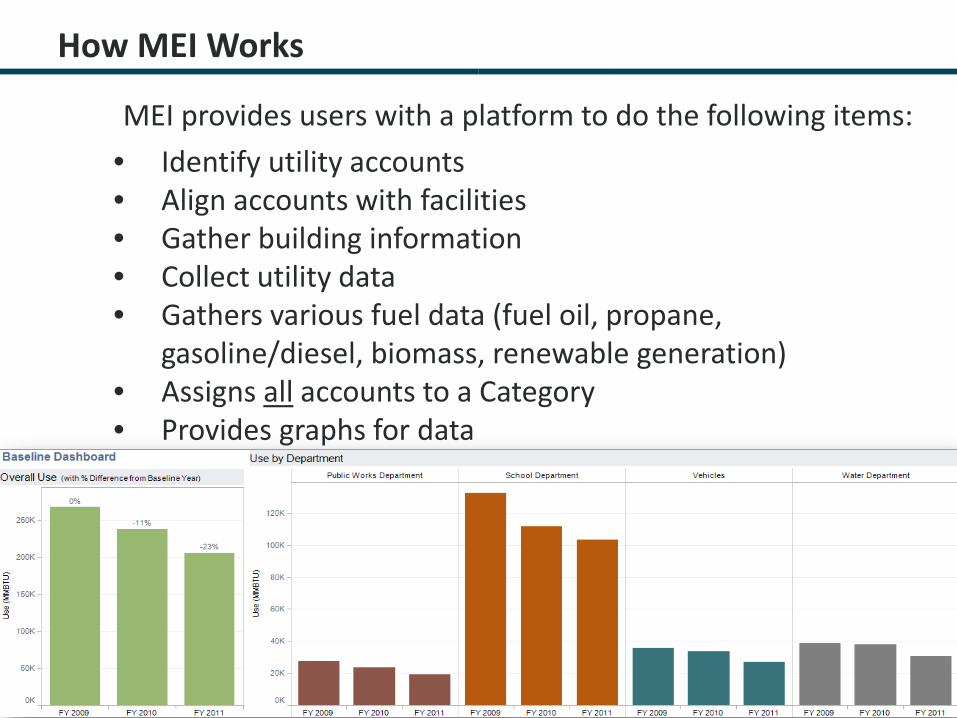
How MEI Works
MEI provides users with a platform to do the following items: • Identify utility accounts • Align accounts with facilities • Gather building information • Collect utility data • Gathers various fuel data (fuel oil, propane,
gasoline/diesel, biomass, renewable generation) • Assigns all accounts to a Category • Provides graphs for data
64
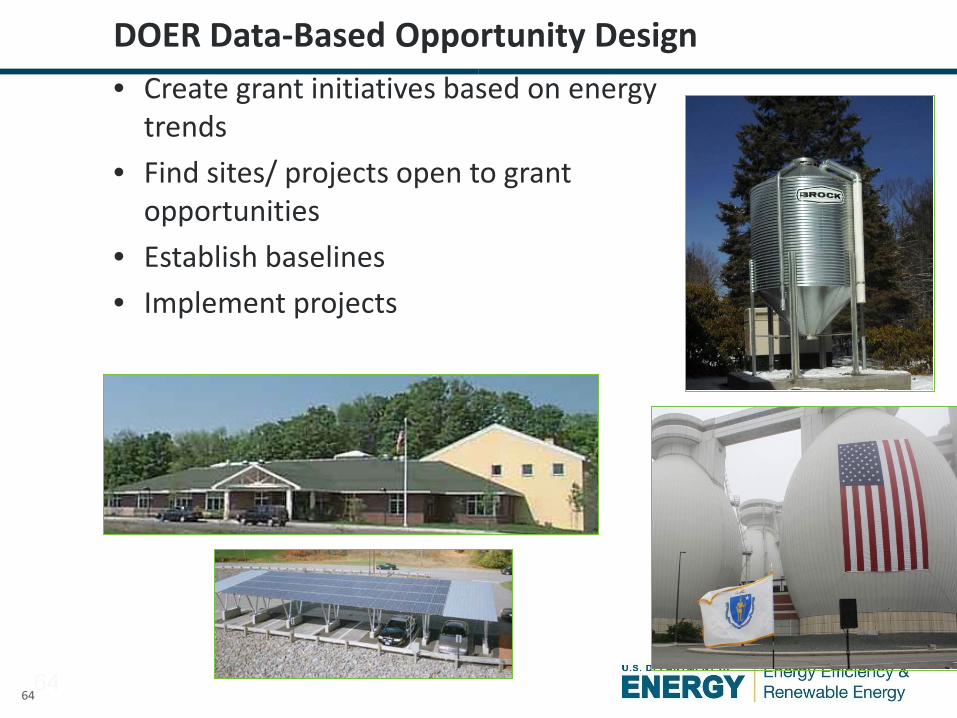
DOER Data-Based Opportunity Design • Create grant initiatives based on energy
trends • Find sites/ projects open to grant
opportunities • Establish baselines • Implement projects
64
65
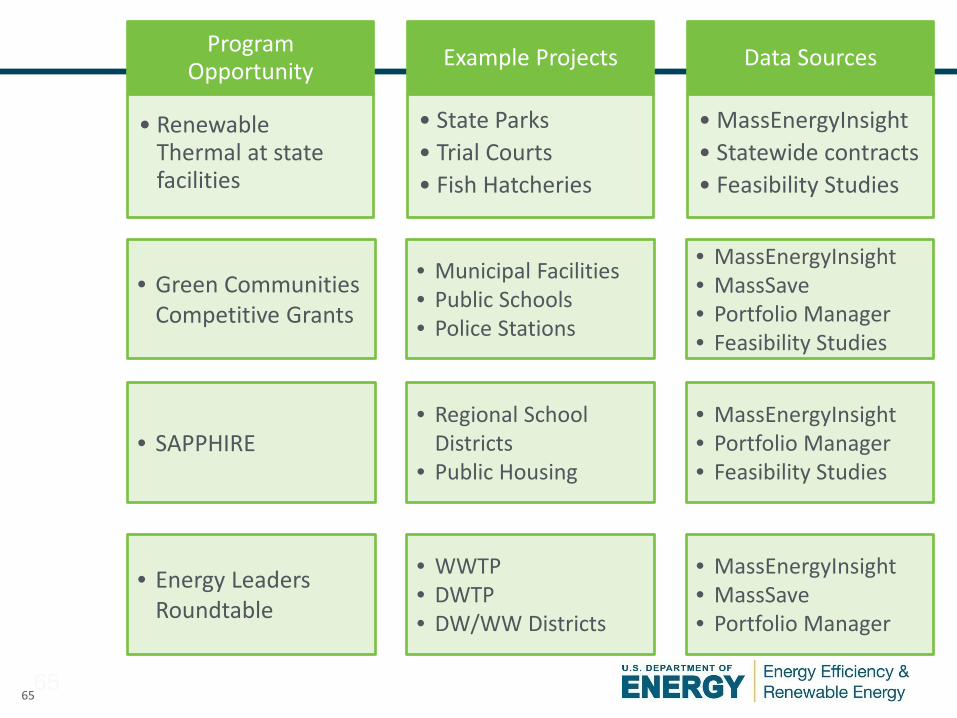
Program Opportunity
• Renewable Thermal at state facilities
Example Projects
• State Parks • Trial Courts • Fish Hatcheries
Data Sources
• MassEnergyInsight • Statewide contracts • Feasibility Studies
65
• Energy Leaders Roundtable
• WWTP • DWTP • DW/WW Districts
• MassEnergyInsight • MassSave • Portfolio Manager
• SAPPHIRE • Regional School
Districts • Public Housing
• MassEnergyInsight • Portfolio Manager • Feasibility Studies
• Green Communities Competitive Grants
• Municipal Facilities • Public Schools • Police Stations
• MassEnergyInsight • MassSave • Portfolio Manager • Feasibility Studies
66 Creating A Cleaner Energy Future For the Commonwealth
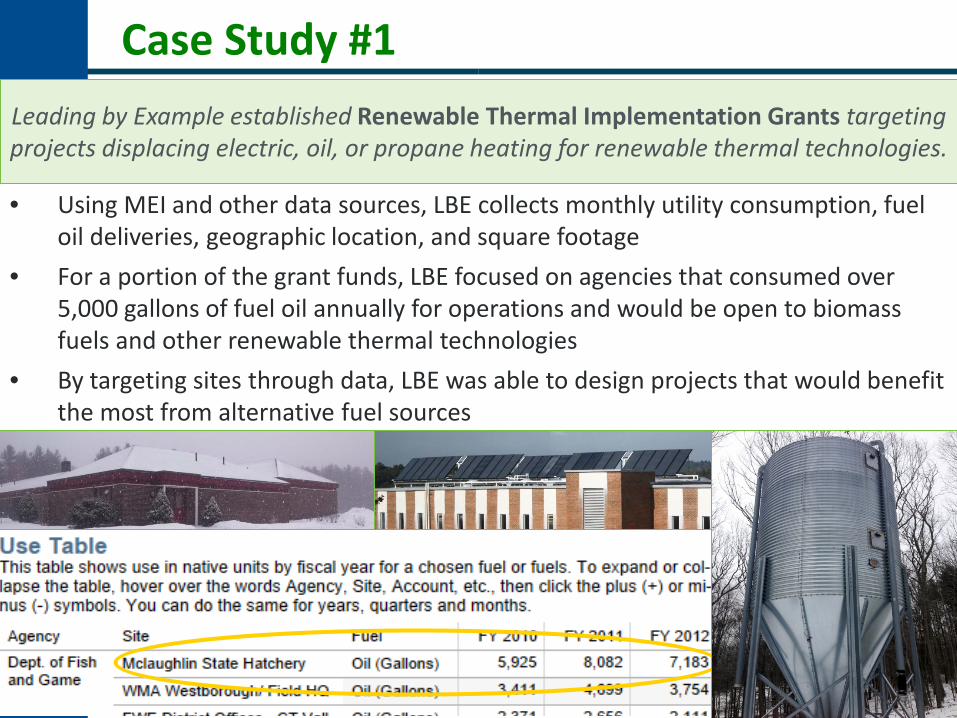
Case Study #1
• Using MEI and other data sources, LBE collects monthly utility consumption, fuel oil deliveries, geographic location, and square footage
• For a portion of the grant funds, LBE focused on agencies that consumed over 5,000 gallons of fuel oil annually for operations and would be open to biomass fuels and other renewable thermal technologies
• By targeting sites through data, LBE was able to design projects that would benefit the most from alternative fuel sources
66
Leading by Example established Renewable Thermal Implementation Grants targeting projects displacing electric, oil, or propane heating for renewable thermal technologies.
67 Creating A Cleaner Energy Future For the Commonwealth
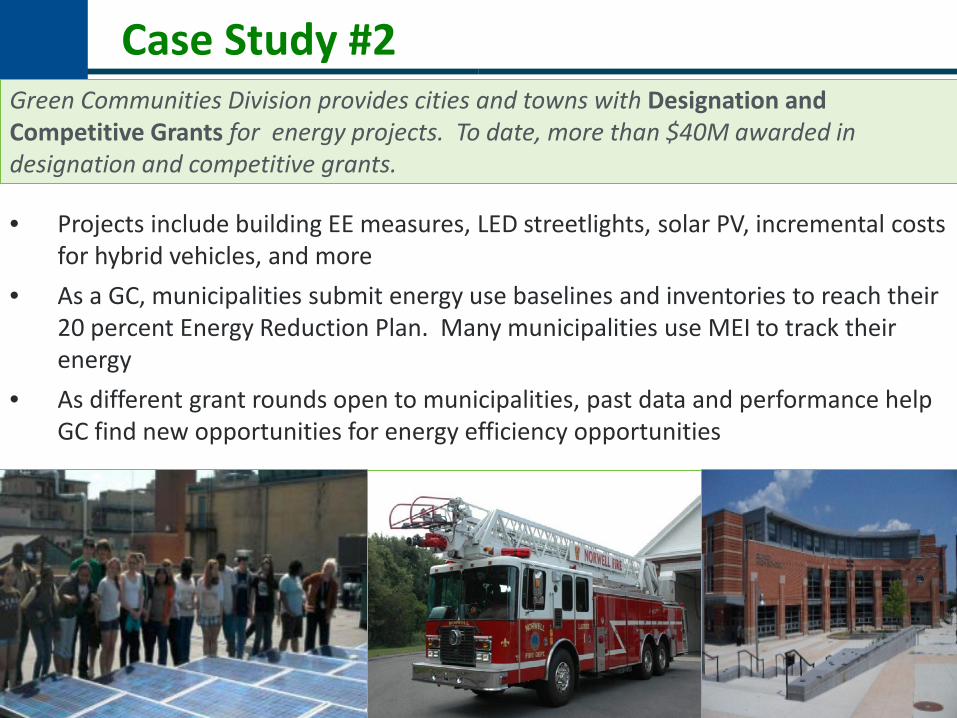
Case Study #2
• Projects include building EE measures, LED streetlights, solar PV, incremental costs for hybrid vehicles, and more
• As a GC, municipalities submit energy use baselines and inventories to reach their 20 percent Energy Reduction Plan. Many municipalities use MEI to track their energy
• As different grant rounds open to municipalities, past data and performance help GC find new opportunities for energy efficiency opportunities
67
Green Communities Division provides cities and towns with Designation and Competitive Grants for energy projects. To date, more than $40M awarded in designation and competitive grants.
68 Creating A Cleaner Energy Future For the Commonwealth
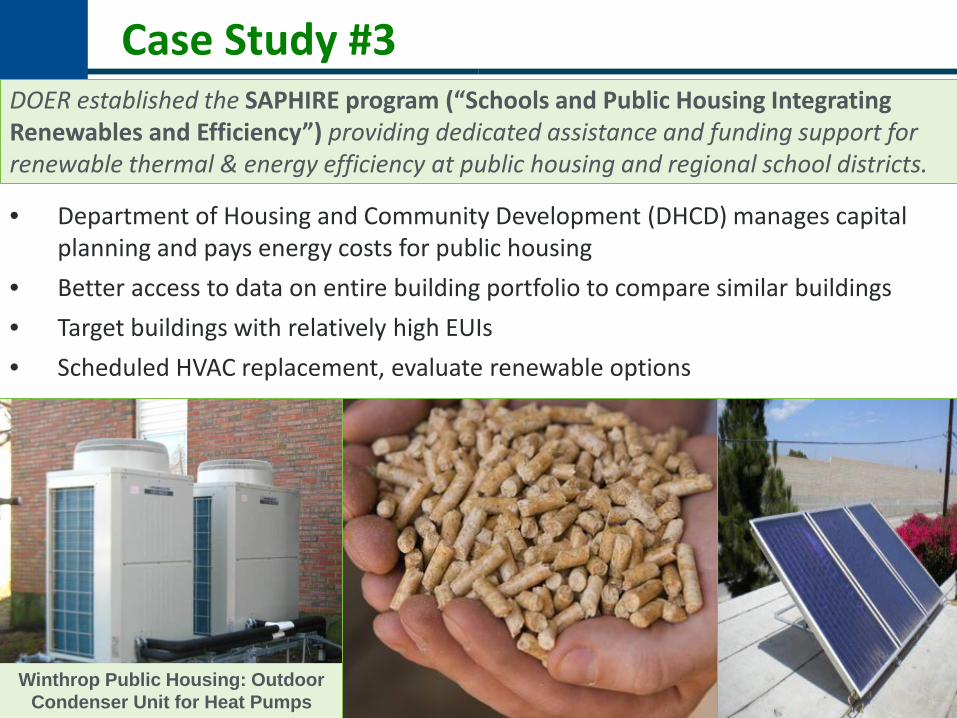
Case Study #3
• Department of Housing and Community Development (DHCD) manages capital planning and pays energy costs for public housing
• Better access to data on entire building portfolio to compare similar buildings • Target buildings with relatively high EUIs • Scheduled HVAC replacement, evaluate renewable options
68
DOER established the SAPHIRE program (“Schools and Public Housing Integrating Renewables and Efficiency”) providing dedicated assistance and funding support for renewable thermal & energy efficiency at public housing and regional school districts.
Winthrop Public Housing: Outdoor Condenser Unit for Heat Pumps
69 Creating A Cleaner Energy Future For the Commonwealth
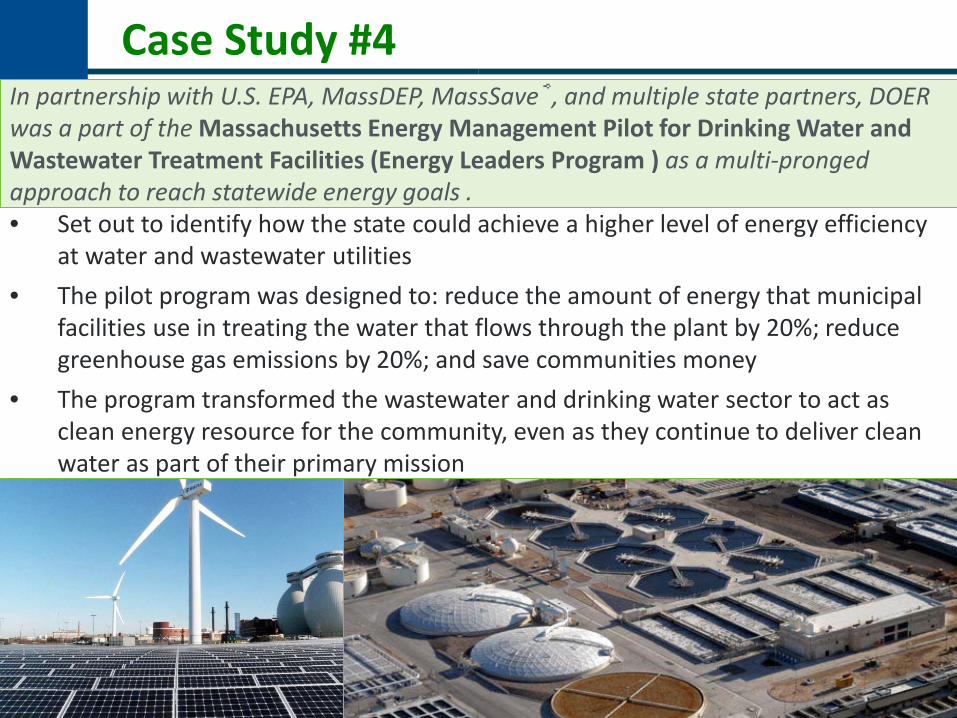
Case Study #4
• Set out to identify how the state could achieve a higher level of energy efficiency at water and wastewater utilities
• The pilot program was designed to: reduce the amount of energy that municipal facilities use in treating the water that flows through the plant by 20%; reduce greenhouse gas emissions by 20%; and save communities money
• The program transformed the wastewater and drinking water sector to act as clean energy resource for the community, even as they continue to deliver clean water as part of their primary mission
69
In partnership with U.S. EPA, MassDEP, MassSave®, and multiple state partners, DOER was a part of the Massachusetts Energy Management Pilot for Drinking Water and Wastewater Treatment Facilities (Energy Leaders Program ) as a multi-pronged approach to reach statewide energy goals .

70
Ben Cohen Consortium for Building Energy Innovation
Better Buildings Summit Benchmarking Data Analysis
From Broad to Narrow
May 29, 2015
71
Benchmarking Data Analysis Better Buildings Summit
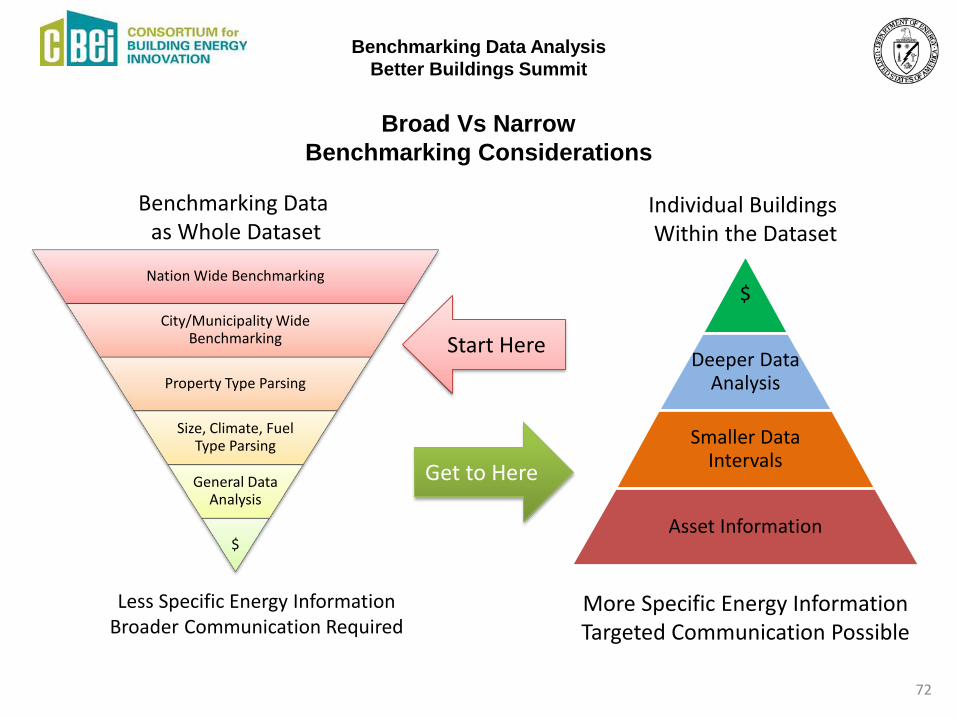
Broad Vs Narrow
Benchmarking Considerations
Nation Wide Benchmarking
City/Municipality Wide Benchmarking
Property Type Parsing
Size, Climate, Fuel Type Parsing
General Data Analysis
$
72
$
Deeper Data Analysis
Smaller Data Intervals
Asset Information
Benchmarking Data as Whole Dataset
Individual Buildings Within the Dataset
Less Specific Energy Information Broader Communication Required
More Specific Energy Information Targeted Communication Possible
Start Here
Get to Here
Benchmarking Data Analysis Better Buildings Summit
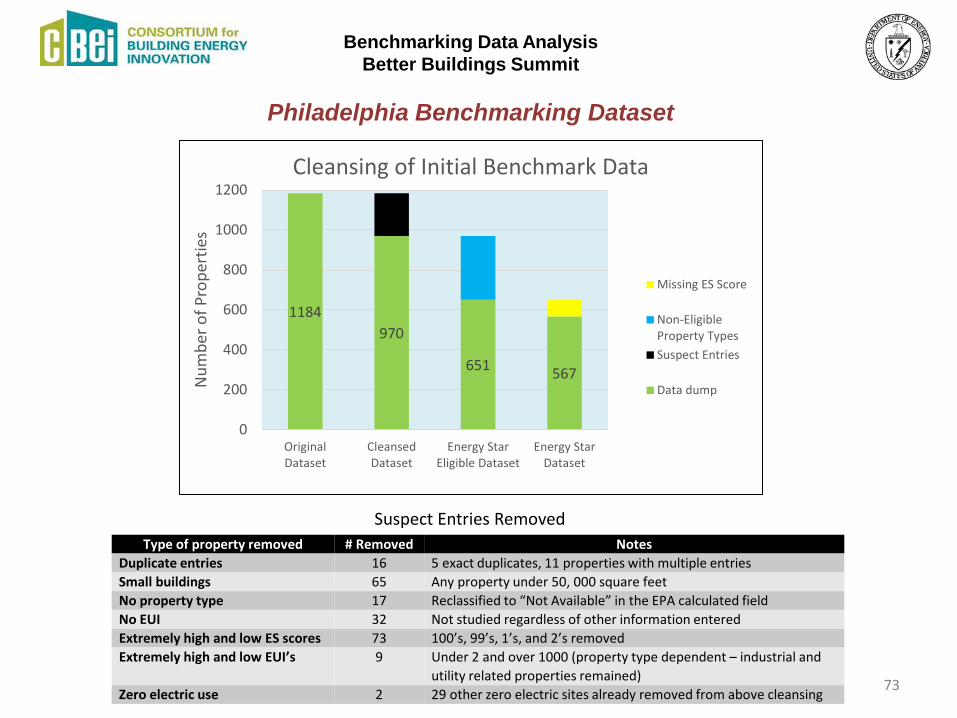
Philadelphia Benchmarking Dataset
73
1184 970
651 567
0
200
400
600
800
1000
1200
OriginalDataset
CleansedDataset
Energy StarEligible Dataset
Energy StarDataset
Num
ber o
f Pro
pert
ies
Cleansing of Initial Benchmark Data
Missing ES Score
Non-EligibleProperty TypesSuspect Entries
Data dump
Type of property removed # Removed Notes Duplicate entries 16 5 exact duplicates, 11 properties with multiple entries Small buildings 65 Any property under 50, 000 square feet No property type 17 Reclassified to “Not Available” in the EPA calculated field No EUI 32 Not studied regardless of other information entered Extremely high and low ES scores 73 100’s, 99’s, 1’s, and 2’s removed Extremely high and low EUI’s 9 Under 2 and over 1000 (property type dependent – industrial and
utility related properties remained) Zero electric use 2 29 other zero electric sites already removed from above cleansing
Suspect Entries Removed
- 10,000,000 20,000,000 30,000,000
1800 and earlier
1910's
1930's
1950's
1970's
1990's
2010's
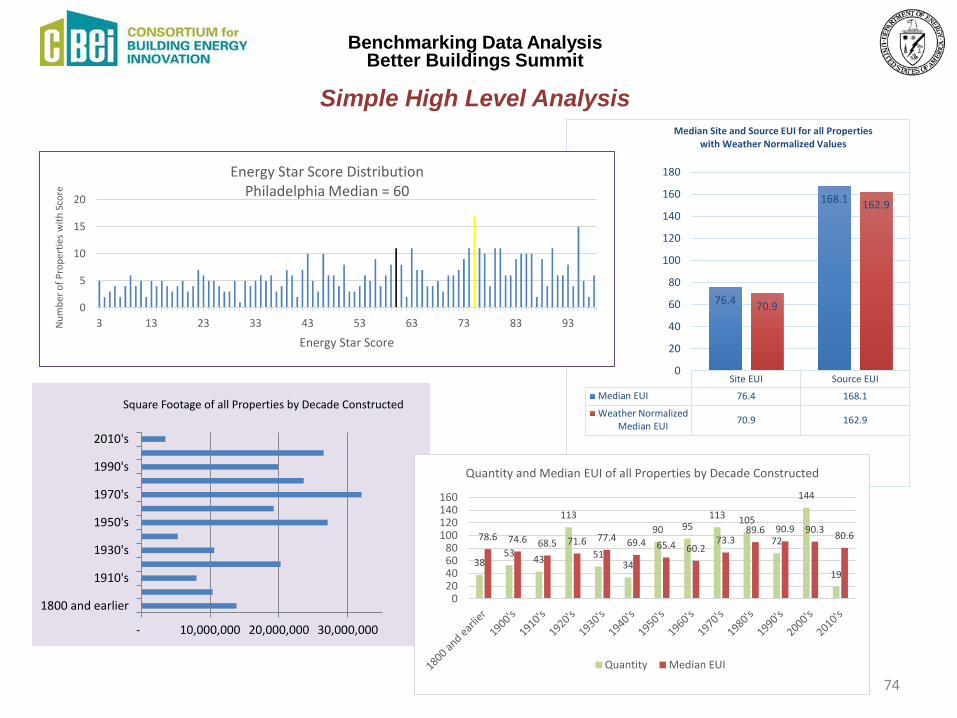
Square Footage of all Properties by Decade Constructed
Site EUI Source EUIMedian EUI 76.4 168.1
Weather NormalizedMedian EUI 70.9 162.9
76.4
168.1
70.9
162.9
0
20
40
60
80
100
120
140
160
180
Median Site and Source EUI for all Properties with Weather Normalized Values
74
Benchmarking Data Analysis Better Buildings Summit
Simple High Level Analysis
0
5
10
15
20
3 13 23 33 43 53 63 73 83 93Num
ber o
f Pro
pert
ies
with
Sco
re
Energy Star Score
Energy Star Score Distribution Philadelphia Median = 60
38 53 43
113
51 34
90 95 113 105
72
144
19
78.6 74.6 68.5 71.6 77.4 69.4 65.4 60.2 73.3
89.6 90.9 90.3 80.6
020406080
100120140160
Quantity and Median EUI of all Properties by Decade Constructed
Quantity Median EUI
Benchmarking Data Analysis Better Buildings Summit
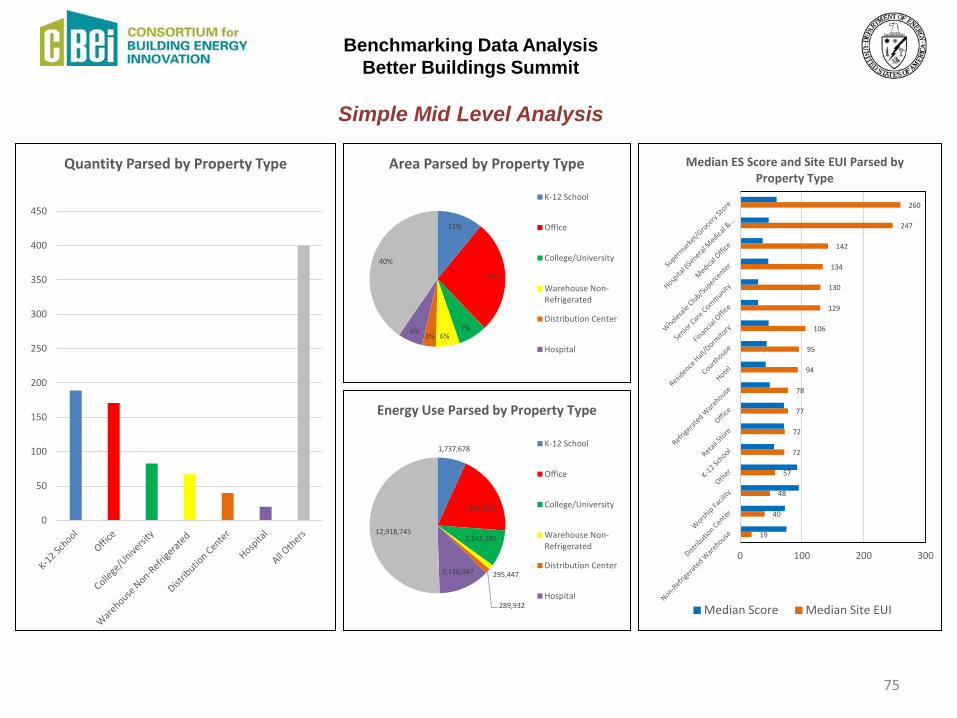
Simple Mid Level Analysis
75
0
50
100
150
200
250
300
350
400
450
Quantity Parsed by Property Type
11%
27%
7% 6% 3% 6%
40%
Area Parsed by Property Type
K-12 School
Office
College/University
Warehouse Non-Refrigerated
Distribution Center
Hospital
1,737,678
4,963,628
2,243,185
295,447
289,932
3,136,047
12,918,745
Energy Use Parsed by Property Type
K-12 School
Office
College/University
Warehouse Non-Refrigerated
Distribution Center
Hospital
29
29
37
42
43
46
46
46
48
55
59
71
71
73
75
92
95
0 100 200 300
Median ES Score and Site EUI Parsed by Property Type
Median Score Median Site EUI
19
40
48
57
72
72
77
78
94
95
106
129
130
134
142
247
260
0 100 200 300
Median ES Score and Site EUI Parsed by Property Type
Median Score Median Site EUI
76
Benchmarking Data Analysis Better Buildings Summit
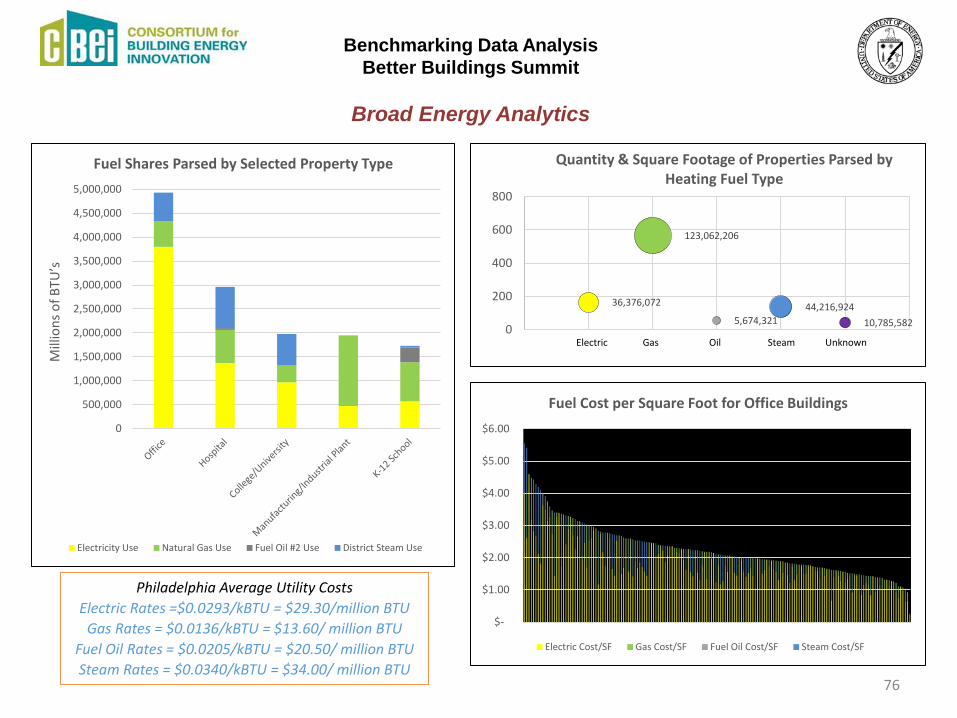
Broad Energy Analytics
0
500,000
1,000,000
1,500,000
2,000,000
2,500,000
3,000,000
3,500,000
4,000,000
4,500,000
5,000,000
Mill
ions
of B
TU’s
Fuel Shares Parsed by Selected Property Type
Electricity Use Natural Gas Use Fuel Oil #2 Use District Steam Use
Philadelphia Average Utility Costs Electric Rates =$0.0293/kBTU = $29.30/million BTU
Gas Rates = $0.0136/kBTU = $13.60/ million BTU Fuel Oil Rates = $0.0205/kBTU = $20.50/ million BTU Steam Rates = $0.0340/kBTU = $34.00/ million BTU
36,376,072
123,062,206
5,674,321 44,216,924
10,785,582 0
200
400
600
800
Quantity & Square Footage of Properties Parsed by Heating Fuel Type
Electric Gas Oil Steam Unknown
$-
$1.00
$2.00
$3.00
$4.00
$5.00
$6.00
Fuel Cost per Square Foot for Office Buildings
Electric Cost/SF Gas Cost/SF Fuel Oil Cost/SF Steam Cost/SF
77
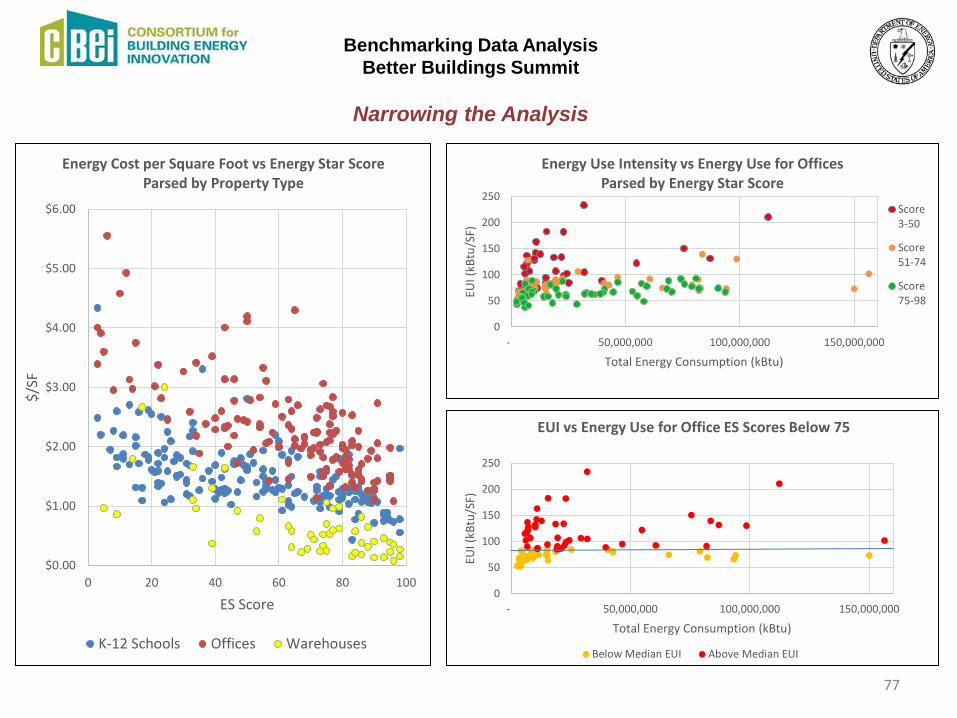
Benchmarking Data Analysis Better Buildings Summit
Narrowing the Analysis
$0.00
$1.00
$2.00
$3.00
$4.00
$5.00
$6.00
0 20 40 60 80 100
$/SF
ES Score
Energy Cost per Square Foot vs Energy Star Score Parsed by Property Type
K-12 Schools Offices Warehouses
0
50
100
150
200
250
- 50,000,000 100,000,000 150,000,000
EUI (
kBtu
/SF)
Total Energy Consumption (kBtu)
Energy Use Intensity vs Energy Use for Offices Parsed by Energy Star Score
Score3-50
Score51-74
Score75-98
0
50
100
150
200
250
- 50,000,000 100,000,000 150,000,000
EUI (
kBtu
/SF)
Total Energy Consumption (kBtu)
EUI vs Energy Use for Office ES Scores Below 75
Below Median EUI Above Median EUI
78
Benchmarking Data Analysis Better Buildings Summit
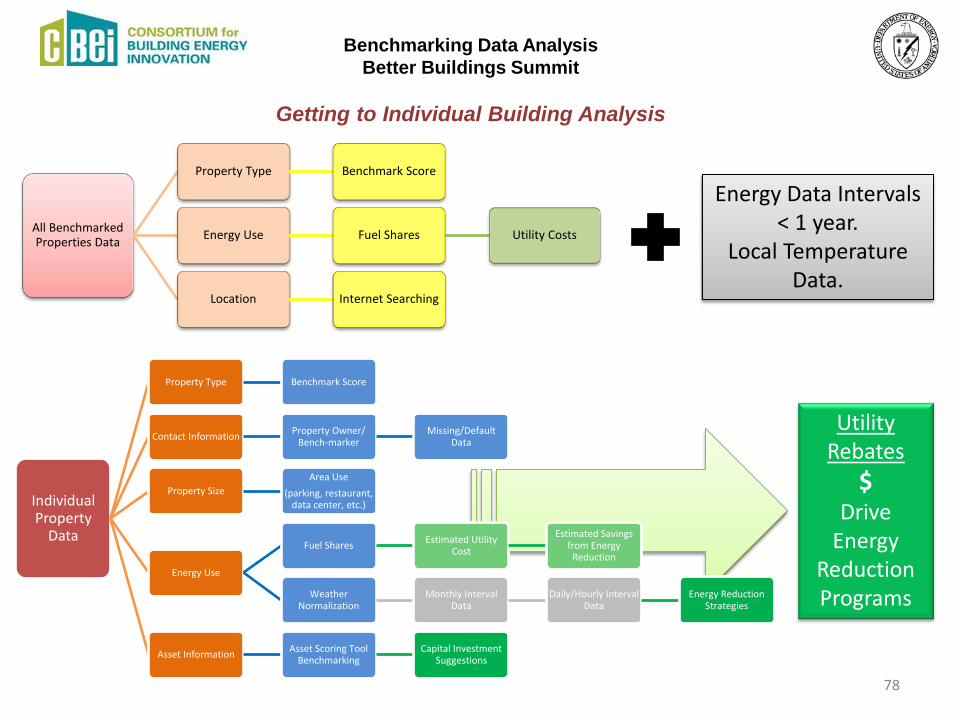
Getting to Individual Building Analysis
All Benchmarked Properties Data
Property Type Benchmark Score
Energy Use Fuel Shares Utility Costs
Location Internet Searching
Individual Property
Data
Property Type Benchmark Score
Contact Information Property Owner/ Bench-marker
Missing/Default Data
Property Size Area Use
(parking, restaurant, data center, etc.)
Energy Use
Fuel Shares Estimated Utility Cost
Estimated Savings from Energy Reduction
Weather Normalization
Monthly Interval Data
Daily/Hourly Interval Data
Energy Reduction Strategies
Asset Information Asset Scoring Tool Benchmarking
Capital Investment Suggestions
Utility Rebates
$ Drive
Energy Reduction Programs
Energy Data Intervals < 1 year.
Local Temperature Data.
79
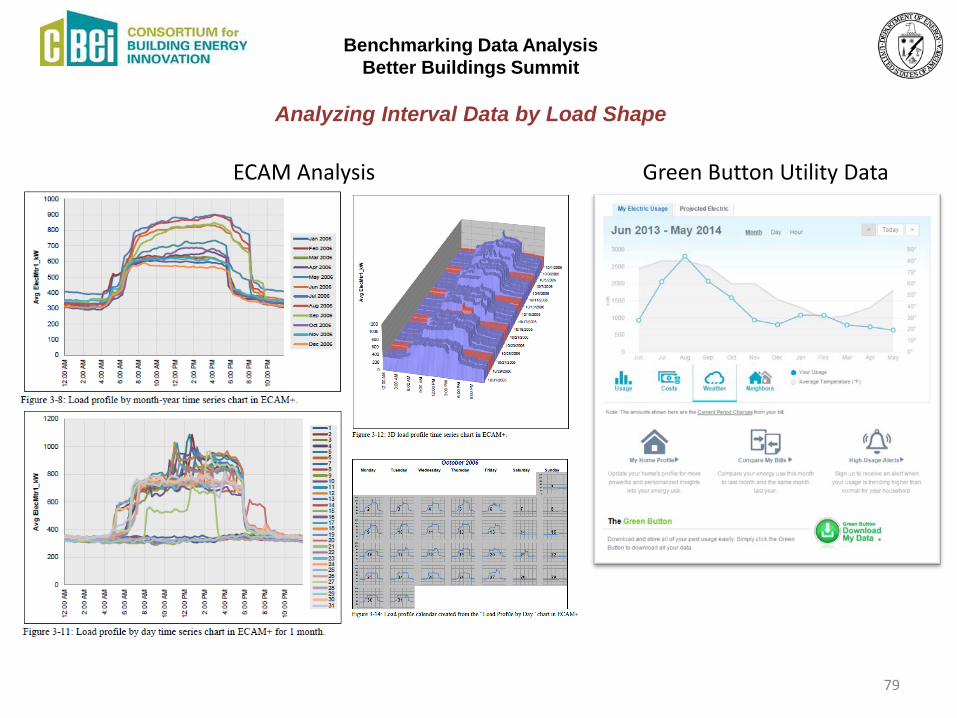
Benchmarking Data Analysis Better Buildings Summit
Analyzing Interval Data by Load Shape
ECAM Analysis Green Button Utility Data
80
Benchmarking Data Analysis Better Buildings Summit
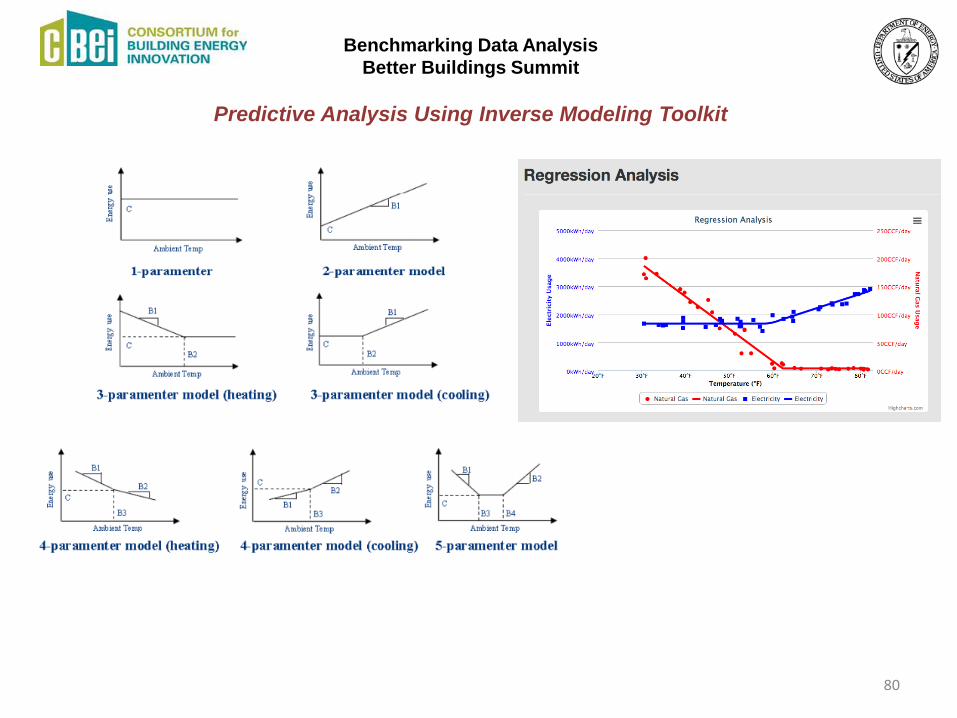
Predictive Analysis Using Inverse Modeling Toolkit
81
Benchmarking Data Analysis Better Buildings Summit
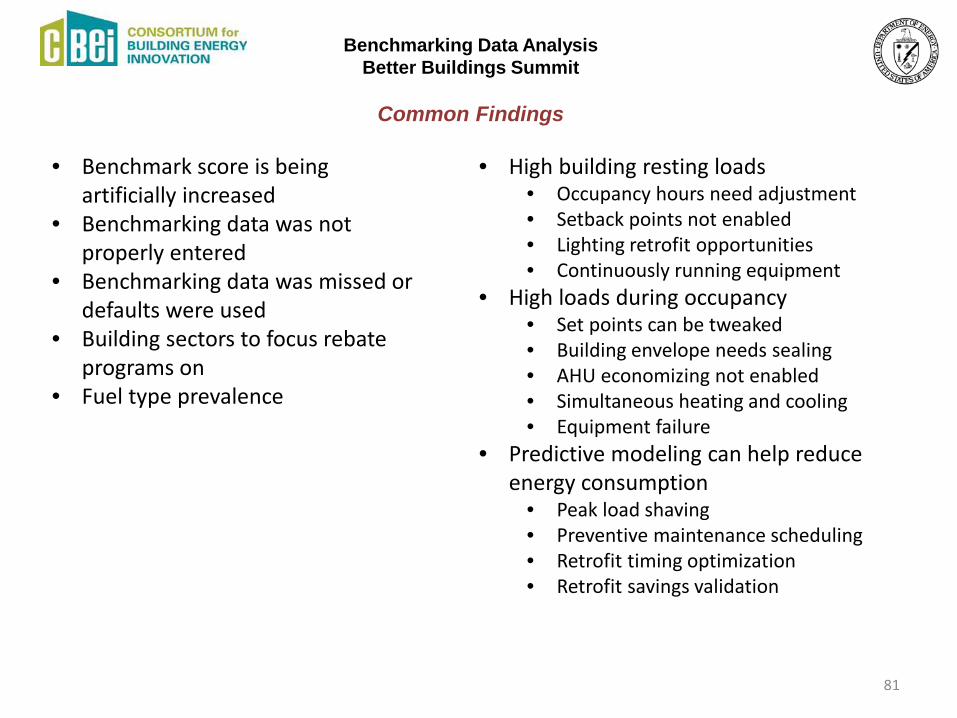
Common Findings
• Benchmark score is being artificially increased
• Benchmarking data was not properly entered
• Benchmarking data was missed or defaults were used
• Building sectors to focus rebate programs on
• Fuel type prevalence
• High building resting loads • Occupancy hours need adjustment • Setback points not enabled • Lighting retrofit opportunities • Continuously running equipment
• High loads during occupancy • Set points can be tweaked • Building envelope needs sealing • AHU economizing not enabled • Simultaneous heating and cooling • Equipment failure
• Predictive modeling can help reduce energy consumption
• Peak load shaving • Preventive maintenance scheduling • Retrofit timing optimization • Retrofit savings validation

Small Group Discussions Round 2
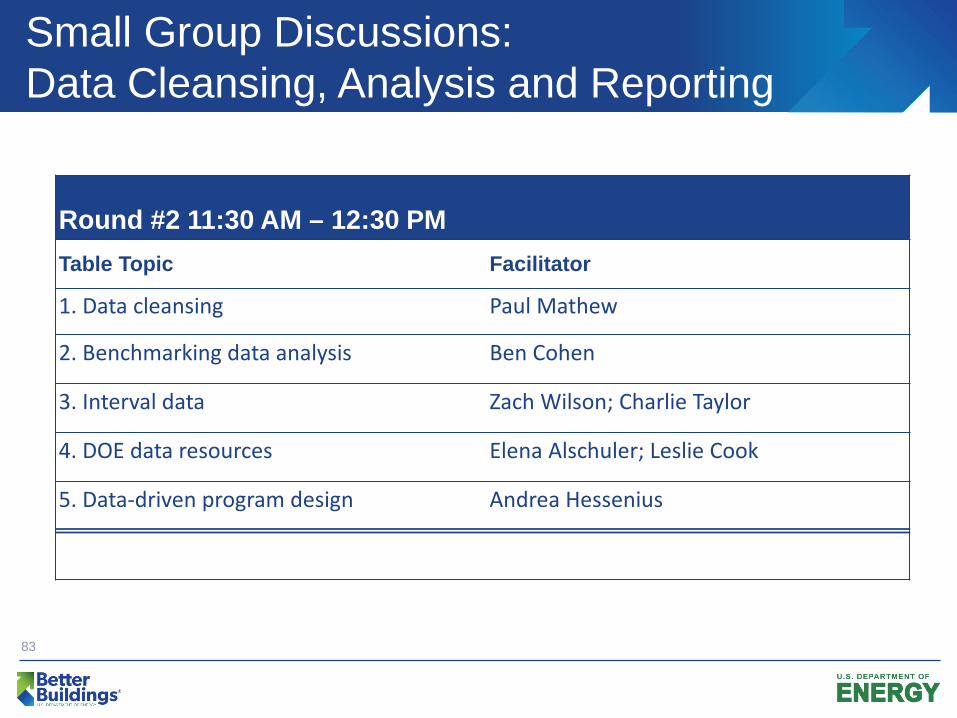
Small Group Discussions: Data Cleansing, Analysis and Reporting
83
Round #2 11:30 AM – 12:30 PM
Table Topic Facilitator
1. Data cleansing Paul Mathew
2. Benchmarking data analysis Ben Cohen
3. Interval data Zach Wilson; Charlie Taylor
4. DOE data resources Elena Alschuler; Leslie Cook
5. Data-driven program design Andrea Hessenius
Buildings Performance Database Live Demo Paul Mathew LBNL