can japan compete? new findings from the global ... files/japan_12-04-2002_568237d7... · 21...
TRANSCRIPT

1HBS Japan Research Center 12-04-02 CK Copyright © 2002 Professor Michael E. Porter
Can Japan Compete?New Findings from the Global Competitiveness Report 2002
Professor Michael E. PorterInstitute for Strategy and Competitiveness
Harvard Business School
HBS Japan Research OfficeTokyo, Japan.
December 4 , 2002
This presentation draws on ideas from Professor Porter’s articles and books, in particular, The Competitive Advantage of Nations (The Free Press, 1990), “Building the Microeconomic Foundations of Competitiveness,” in The Global Competitiveness Report 2002/03, (World Economic Forum, 2002), “Clusters and the New Competitive Agenda for Companies and Governments” in On Competition (Harvard Business School Press, 1998), and the Clusters of Innovation Initiative (www.compete.org), a joint effort of the Council on Competitiveness, Monitor Group, and Professor Porter and ongoing research at the Institute for Strategy and Competitiveness. Additional information may be found at the website of the Institute for Strategy and Competitiveness, www.isc.hbs.eduNo part of this publication may be reproduced, stored in a retrieval system, or transmitted in any form or by any means - electronic, mechanical, photocopying, recording, or otherwise - without the permission of Michael E. Porter.

2HBS Japan Research Center 12-04-02 CK Copyright © 2002 Professor Michael E. Porter
What is Competitiveness?• Competitiveness is determined by the productivity with which a nation uses its
human, capital, and natural resources. Productivity sets a nations standard of living (wages, returns on capital, returns on natural resources)
– Productivity depends both on the value of products and services (e.g. uniqueness, quality) as well as the efficiency with which they are produced.
– It is not what industries a nation competes in that matters for prosperity, but howfirms compete in those industries
– Productivity in a nation is a reflection of what both domestic and foreign firms choose to do in that location. The location of ownership is secondary for national prosperity.
– The productivity of “local” industries is of fundamental importance to competitiveness, not just that of traded industries
– Devaluation does not make a country more “competitive”
• Nations compete in offering the most productive environment for business
• The public and private sectors play different but interrelated roles in creating a productive economy

3HBS Japan Research Center 12-04-02 CK Copyright © 2002 Professor Michael E. Porter
Innovation and Prosperity
ProductivityProductivity
Innovative CapacityInnovative CapacityInnovative Capacity
“Competitiveness”
• Innovation is more than just scientific discovery• There are no low-tech industries, only low-tech firms
ProsperityProsperity

4HBS Japan Research Center 12-04-02 CK Copyright © 2002 Professor Michael E. Porter
Context for Firm
Strategy and Rivalry
Context for Firm
Strategy and Rivalry
Related and Supporting Industries
Related and Supporting Industries
Factor(Input)
Conditions
Factor(Input)
ConditionsDemand
ConditionsDemand
Conditions
Productivity and the Business Environment
• The microeconomic business environment is comprised of the array of skills, knowledge, rules, policies, supporting industries, and institutions surrounding competition
A core of sophisticated and demanding local customer(s)Local customer needs that anticipate those elsewhereUnusual local demand in specialized segments that can be served nationally and globally
Presence of high quality, specialized inputs available to firms
–Human resources–Capital resources–Physical infrastructure–Administrative infrastructure–Information infrastructure–Scientific and technological
infrastructure–Natural resources
Access to capable, locally based suppliers and firms in related fieldsPresence of clusters instead of isolated industries
A local context and rules that encourage investment and sustained upgrading
–e.g., Intellectual property protection
Open and vigorous competition among locally based rivals

5HBS Japan Research Center 12-04-02 CK Copyright © 2002 Professor Michael E. Porter
The California Wine Cluster
Educational, Research, & Trade Organizations (e.g. Wine Institute,
UC Davis, Culinary Institutes)
Educational, Research, & Trade Organizations (e.g. Wine Institute,
UC Davis, Culinary Institutes)
Growers/VineyardsGrowers/Vineyards
Sources: California Wine Institute, Internet search, California State Legislature. Based on research by MBA 1997 students R. Alexander, R. Arney, N. Black, E. Frost, and A. Shivananda.
Wineries/ProcessingFacilities
Wineries/ProcessingFacilities
GrapestockGrapestock
Fertilizer, Pesticides, Herbicides
Fertilizer, Pesticides, Herbicides
Grape Harvesting Equipment
Grape Harvesting Equipment
Irrigation TechnologyIrrigation Technology
Winemaking EquipmentWinemaking Equipment
BarrelsBarrels
LabelsLabels
BottlesBottles
Caps and CorksCaps and Corks
Public Relations and Advertising
Public Relations and Advertising
Specialized Publications (e.g., Wine Spectator, Trade
Journal)
Specialized Publications (e.g., Wine Spectator, Trade
Journal)
Food ClusterFood Cluster
Tourism ClusterTourism ClusterCalifornia Agricultural Cluster
California Agricultural Cluster
State Government Agencies(e.g., Select Committee on Wine
Production and Economy)

Institutions for CollaborationSelected Institutions for Collaboration, San Diego
Source: Clusters of Innovation project (www.compete.org)
GeneralGeneral
San Diego Chamber of Commerce
San Diego MIT Enterprise Forum
Corporate Director’s Forum
San Diego Dialogue
Service Corps of Retired Executives, San Diego
San Diego Regional Economic Development Corporation
Center for Applied Competitive Technologies
San Diego World Trade Center
UCSD Alumni
San Diego Regional Technology Alliance
San Diego Science and Technology Council
Office of Trade and Business Development
Cluster-SpecificCluster-Specific
Linkabit Alumni
Hybritech Alumni
Scripps Research Institute Alumni
BIOCOMM
UCSD Connect
Linkabit Alumni
Hybritech Alumni
Scripps Research Institute Alumni
BIOCOMM
UCSD Connect

7HBS Japan Research Center 12-04-02 CK Copyright © 2002 Professor Michael E. Porter
Patents by OrganizationCommonwealth of Massachusetts
Note: Shading indicates universities, research institutions, and other government agencies Source: Cluster Mapping Project, Institute for Strategy and Competitiveness, Harvard Business School
Organization Patents Issued from 1995 to 1998 1 DIGITAL EQUIPMENT CORPORATION 382 2 MASSACHUSETTS INSTITUTE OF TECHNOLOGY 369 3 POLAROID CORPORATION 220 4 MASSACHUSETTS GENERAL HOSPITAL 138 5 ANALOG DEVICES, INC. 136 6 HARVARD COLLEGE, PRESIDENT AND FELLOWS 105 7 GENETICS INSTITUTE, INC. 82 8 EMC CORPORATION 82 9 GENERAL ELECTRIC COMPANY 79
10 MOTOROLA, INC. 79 11 QUANTUM CORP. (CA) 79 12 BOSTON SCIENTIFIC CORPORATION 77 13 HEWLETT-PACKARD COMPANY 69 14 CHARLES STARK DRAPER LABORATORY, INC. 66 15 SAINT GOBAIN/NORTON IND. CERAMICS CORP. 65 16 RAYTHEON COMPANY 64 17 BOSTON UNIVERSITY 63 18 BRIGHAM AND WOMEN'S HOSPITAL 62 19 DANA-FARBER CANCER INSTITUTE, INC. 60 20 TEXAS INSTRUMENTS, INCORPORATED 59 21 GILLETTE COMPANY 57 22 SHIPLEY COMPANY INC. 52 23 UNITED STATES OF AMERICA, AIR FORCE 52 24 LISCO, INC. 50 25 HYBRIDON, INC. 48

8HBS Japan Research Center 12-04-02 CK Copyright © 2002 Professor Michael E. Porter
Geographic Influences on Competitiveness
Broad Economic AreasBroad Economic Areas
Groups of Neighboring Nations
Groups of Neighboring Nations
RegionsRegions
ClustersClusters
NationsNations
World EconomyWorld Economy

9HBS Japan Research Center 12-04-02 CK Copyright © 2002 Professor Michael E. Porter
Shifting Responsibilities for Economic Development
Old ModelOld Model
• Government drives economic development through policy decisions and incentives
• Government drives economic development through policy decisions and incentives
New ModelNew Model
• Economic development is a collaborative process involving government at multiple levels, companies, teaching and research institutions, and institutions for collaboration
• Economic development is a collaborative process involving government at multiple levels, companies, teaching and research institutions, and institutions for collaboration

10HBS Japan Research Center 12-04-02 CK Copyright © 2002 Professor Michael E. Porter
Comparative Economic Performance, Selected Countries
0%
25%
50%
75%
100%
-3.0% -2.0% -1.0% 0.0% 1.0% 2.0% 3.0% 4.0% 5.0%
Korea
Netherlands Finland
New Zealand
Germany
Italy
Japan
Source: World Development Indicators 2002
ArgentinaEstonia
Spain
LatviaPoland
Singapore
Switzerland
UK
GDP per Capita, 2001, US=100
CAGR of GDP per Capita Relative to the US, 1995-2001
Russia
Slovenia
Bolivia
Czech Rep.
Croatia
Hungary
Canada
Chile
ChinaIndonesiaMalaysia
South AfricaThailand
Vietnam
Taiwan
Philippines
NigeriaIndia
United States
Hong Kong
100%

11HBS Japan Research Center 12-04-02 CK Copyright © 2002 Professor Michael E. Porter
Total Factor Productivity PerformanceSelected OECD Countries
50
55
60
65
70
75
80
85
90
95
100
0.0% 0.5% 1.0% 1.5% 2.0% 2.5% 3.0% 3.5% 4.0%
Ireland
Level of Total Factor Productivity, 1995-97,
US = 100
Total Factor Productivity Growth, 1990-98
Australia
Finland
US
Germany
UK
New Zealand
JapanSpain
CanadaFrance
Netherlands*
Italy*
Denmark*
Norway
* Data for 1995 - 1998Source: IMF, 2001

12HBS Japan Research Center 12-04-02 CK Copyright © 2002 Professor Michael E. PorterSource: UNCTAD Trade Data. Author’s analysis.
Change in Japan’s World Export Share, 1990 - 2000
Japan’s Export Performance By Broad Sector, 1990-2000
0%
5%
10%
15%
20%
-10% -8% -6% -4% -2% 0% 2%
Semiconductors/ Computers
Housing/HouseholdForest Products
Health Care
Food/Beverages
Entertainment
Defense
Materials/Metals
Office
PersonalPetroleum/Chemicals
Power
Textiles/Apparel
Transportation
Multiple Business
Japan’s average export share: 8.46%
Japan’s change in world average export share:
-2.6%
Telecommunications(7.5%, -23.1%)
World Export Share, 2000
DD = $25 billion export volume in 2000
+

13HBS Japan Research Center 12-04-02 CK Copyright © 2002 Professor Michael E. PorterSource: UNCTAD Trade Data. Author’s analysis.
Change in Japan’s World Export Share, 1995 - 2000
Japan’s Export Performance By Broad Sector, 1995-2000
0%
5%
10%
15%
20%
-3% 0% 3% 5% 8%
Semiconductors/ Computers
Housing/Household Forest Products
Health Care
Food/Beverages
Entertainment
Defense
Materials/Metals
Office
Personal Petroleum/Chemicals
Power
Textiles/Apparel
Transportation
Multiple Business
Japan’s average export share: 8.46%
Japan’s change in world average export share:
+1.3%
Telecommunications(7.5%, -8.4%)
World Export Share, 2000
DD = $25 billion export volume in 2000
+

14HBS Japan Research Center 12-04-02 CK Copyright © 2002 Professor Michael E. Porter
Business Environment Quality Relative to Company Sophistication
Global Competitiveness Report 2002
Company Sophistication
Business Environment
Quality
Finland
Germany
Japan
Dominican Republic
Portugal
SingaporeAustralia
FranceNew Zealand
Italy
Costa RicaBotswana
Philippines
Haiti
EcuadorGuatemala
LOW HIGH
LOW
HIGH US
TaiwanHong Kong
Malaysia
China
Source: Global Competitiveness Report 2002/03

15HBS Japan Research Center 12-04-02 CK Copyright © 2002 Professor Michael E. Porter
Absolute Patenting Output by Asian Countries and the U.S.Patents Filed in the U.S.
13.8%0.15195China
33.8%72.20296Singapore
28.5%74.203,538South Korea
19.9%240.105,371Taiwan
4.7%259.8032,924Japan
5.7%308.0787,610United States
Annual Growth Rate of Patents,
1990-2001
Patents per 1 Million Population
Number of Patents, 2001
Source: US Patent and Trademark Office (www.uspto.gov). Author’s analysis.

16HBS Japan Research Center 12-04-02 CK Copyright © 2002 Professor Michael E. PorterSource: US Patent and Trademark Office (www.uspto.gov). Author’s analysis.
Annual U.S. patents per 1 million
population, 2001
Compound annual growth rate of US-registered patents, 1990 - 2001
International Patenting Output
0
50
100
150
200
250
300
350
400
0% 10% 20% 30% 40%
Australia
Canada
Germany
Japan
South Korea
New Zealand
Singapore
Sweden
Taiwan
UK
Israel
= 10,000 patents granted in 2001
USA
Finland
China

17HBS Japan Research Center 12-04-02 CK Copyright © 2002 Professor Michael E. Porter
National Business EnvironmentJapan Relative Position 2002
Local Availability of Process 1 Machinery
Local Supplier Quantity 1
Railroad Infrastructure Quality 1
Extent of Locally Based Competitors 1
Extent of Product and Process 2Collaboration
Decentralization of Corporate Activity 3
Extent of Bureaucratic Red Tape 3
Local Supplier Quality 3
Local Availability of Specialized 4Research and Training Services
Cooperation in Labor-Employer 5 Relations
Note: Rank by countries; overall Japan ranks 11 out of 80 countries (17 on National Business Environment, 10 on GDP pc 2001)Source: Global Competitiveness Report 2002
Efficacy of Corporate Boards 80
Extent of Distortive Government 68Subsidies
Ease of Access to Loans 64
Hidden Trade Barrier Liberalization 56
Quality of Management Schools 51
Administrative Burden for Start-Ups 45
Venture Capital Availability 44
Adequacy of Public Sector Legal 38 Recourse
Air Transport Infrastructure Quality 36
Financial Market Sophistication 33
Intellectual Property Protection 32
Competitive Disadvantages Relative to GDP per Capita
Competitive Advantages Relative to GDP per Capita
Country RankingCountry Ranking
18HBS Japan Research Center 12-04-02 CK Copyright © 2002 Professor Michael E. Porter
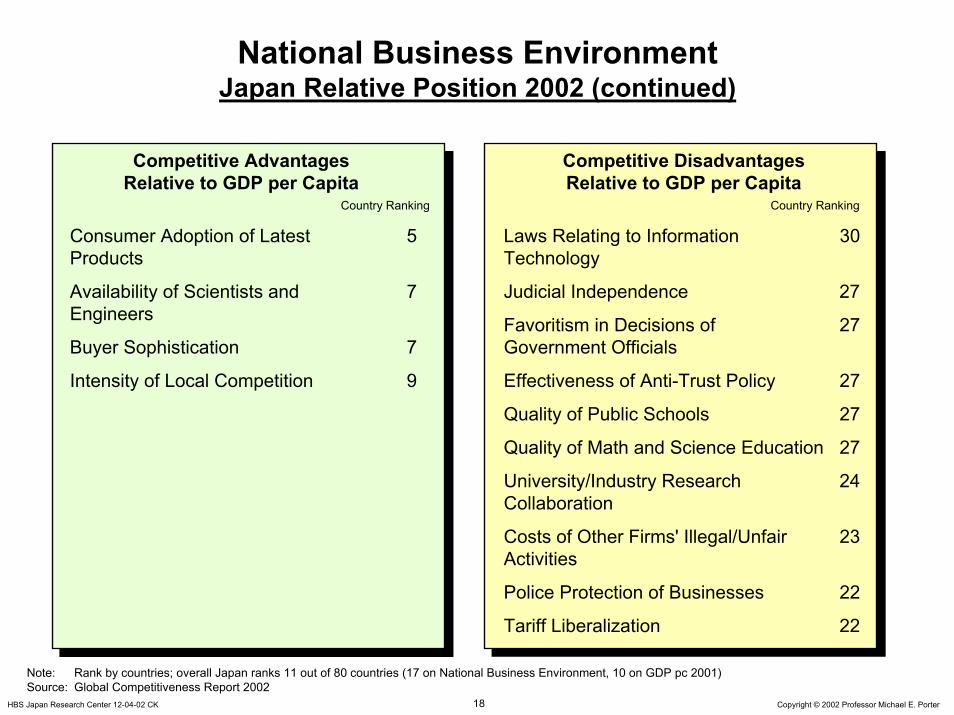
National Business EnvironmentJapan Relative Position 2002 (continued)
Consumer Adoption of Latest 5 Products
Availability of Scientists and 7Engineers
Buyer Sophistication 7
Intensity of Local Competition 9
Laws Relating to Information 30 Technology
Judicial Independence 27
Favoritism in Decisions of 27 Government Officials
Effectiveness of Anti-Trust Policy 27
Quality of Public Schools 27
Quality of Math and Science Education 27
University/Industry Research 24 Collaboration
Costs of Other Firms' Illegal/Unfair 23 Activities
Police Protection of Businesses 22
Tariff Liberalization 22
Competitive Disadvantages Relative to GDP per Capita
Competitive Advantages Relative to GDP per Capita
Country RankingCountry Ranking
Note: Rank by countries; overall Japan ranks 11 out of 80 countries (17 on National Business Environment, 10 on GDP pc 2001)Source: Global Competitiveness Report 2002

19HBS Japan Research Center 12-04-02 CK Copyright © 2002 Professor Michael E. Porter
GCR Innovative Capacity Index2002 Rankings
Source: Global Competitiveness Report 2002
1234567891011121314151617181920
1234567891011121314151617181920
United StatesUnited KingdomFinlandGermanyJapanSwitzerlandSwedenTaiwanCanadaSingaporeNetherlandsDenmarkFranceAustriaIsraelBelgiumAustraliaIcelandNorwayIreland
IcelandJapanSwedenUnited StatesNorwayDenmarkFinlandAustraliaGermanySwitzerlandCanadaBelgiumFranceUKTaiwanSingaporeNetherlandsAustriaNew ZealandKorea
SingaporeIsraelCanadaFinlandTaiwanGermanyUnited StatesAustraliaUKAustriaNetherlandsJapanIrelandFrancePortugalSwitzerlandBelgiumKoreaDenmarkNorway
RankRank Innovative Capacity Index
United StatesUKItalyTaiwanFinlandJapanGermanyHong KongNetherlandsKoreaSwedenSingaporeCanadaSwitzerlandAustraliaNorwayAustriaFranceIrelandPortugal
Cluster Environment Index
United StatesUKFinlandIsraelBelgiumSwedenGermanyCanadaNetherlandsFranceDenmarkSwitzerlandIrelandAustriaTaiwanNorwayJapanAustraliaHong KongItaly
United StatesUKSwitzerlandGermanyHong KongDenmarkJapanAustriaFinlandSingaporeFranceIsraelSwedenTaiwanBelgiumItalyNetherlandsCanadaIcelandIreland
CompanyInnovationIndex
Scientists & Engineers Index
Innovation Policy Index
Linkages Index

20HBS Japan Research Center 12-04-02 CK Copyright © 2002 Professor Michael E. Porter
U.S. Patenting by Top 25 Japanese Universities, Institutes, and Government Agencies
Note: Shading indicates universities, research institutions, and other government agencies; rank among Japanese institutions Source: US Patent and Trademark Office (www.uspto.gov). Author’s analysis.
Rank Organization Patents Issued from 1997 to 2001
65 AGENCY OF INDUSTRIAL SCIENCE & TECHNOLOGY 334 257 INSTITUTE OF PHYSICAL AND CHEMICAL RESEARCH 62 335 JAPAN ATOMIC ENERGY RESEARCH INSTITUTE 43 473 NATIONAL RESEARCH INSTITUTE FOR METALS 24 532 NATIONAL FOOD RESEARCH INSTITUTE 20 550 SUPER SILICON CRYSTAL RESEARCH INSTITUTE 19 569 JAPAN NUCLEAR CYCLE DEVELOPMENT INSTITUTE 18 892 CANCER INSTITUTE 8 892 HIROSHIMA UNIVERSITY 8 892 RAILWAY TECHNICAL RESEARCH INSTITUTE 8 892 TOHOKU UNIVERSITY 8 892 TOKYO UNIVERSITY 8 965 BIOMOLECULAR ENGINEERING RESEARCH INS. 7 965 INSTITUTE FOR ADVANCED SKIN RESEARCH, INC. 7
1054 FORESTRY AND FOREST PRODUCTS RESEARCH INS. 6 1054 KYUSHU UNIVERSITY 6 1054 NATIONAL AEROSPACE LABORATORY 6 1054 INSTITUTE OF AGROBIOLOGICAL RESOURCES 6 1054 INS. OF SERICULTURAL AND ENTOMOLOGICAL SCIE. 6 1054 INSTITUTE OF ADV. MATERIAL GAS-GENERATOR CO. 6 1161 NATIONAL INSTITUTE OF HEALTH 5 1161 KANSAI RESEARCH INSTITUTE (KRI) 5 1161 INSTITUTE OF SPACE AND ASTRONAUTICAL SCIENCE 5 1161 THE KITASATO INSTITUTE 5 1161 TOKYO INSTITUTE OF TECHNOLOGY 5 1161 INSTITUTE OF TECHNOLOGY PRECISION ELECTRICAL 5

21HBS Japan Research Center 12-04-02 CK Copyright © 2002 Professor Michael E. Porter
Note: Shading indicates universities, research institutions, and other government agencies; rank among U.S. institutions Source: US Patent and Trademark Office (www.uspto.gov). Author’s analysis.
Rank Organization Patents Issued from 1997 to 2001
14 UNIVERSITY OF CALIFORNIA, THE REGENTS OF 1904 16 UNITED STATES OF AMERICA, NAVY 1640 37 UNITED STATES OF AMERICA, ARMY 772 50 UNITED STATES OF AMERICA, HEALTH & HUMAN S. 636 55 MASSACHUSETTS INSTITUTE OF TECHNOLOGY 595 76 UNITED STATES OF AMERICA, NASA 469 79 CALIFORNIA INSTITUTE OF TECHNOLOGY 454 82 UNIVERSITY OF TEXAS 442 87 UNITED STATES OF AMERICA, AIR FORCE 427 94 STANFORD UNIVERSITY 401
108 JOHNS HOPKINS UNIVERSITY 363 130 UNITED STATES OF AMERICA, DEP. OF AGRICULTURE 309 133 MASSACHUSETTS GENERAL HOSPITAL CORP. 306 138 UNITED STATES OF AMERICA, DEP. OF ENERGY 300 150 UNIVERSITY OF MICHIGAN 272 152 UNIVERSITY OF PENNSYLVANIA 263 158 COLUMBIA UNIVERSITY 252 166 STATE UNIVERSITY OF NEW YORK 239 173 MICHIGAN STATE UNIVERSITY 228 173 UNIVERSITY OF WASHINGTON 228 186 GAS RESEARCH INSTITUTE 216 188 THE SCRIPPS RESEARCH INSTITUTE 213 196 UNIVERSITY OF MINNESOTA, THE REGENTS OF 201 198 IOWA STATE UNIVERSITY 195 212 WASHINGTON UNIVERSITY 183
U.S. Patenting by Top 25 U.S. Universities, Institutes, and Government Agencies

22HBS Japan Research Center 12-04-02 CK Copyright © 2002 Professor Michael E. Porter
Share of Global Inward FDI FlowsSelected Countries
22.0%
8.2%7.1%
4.8% 4.4% 4.3%2.9%
1.7% 1.0% 0.8% 0.8% 0.7% 0.3%0%
5%
10%
15%
20%
25%
United
States
United
Kingdo
mGerm
any
China
France
Netherl
ands
Brazil
Mexico
Singap
oreAus
tralia
Japa
n
Korea
Taiwan
Source: UNCTAD World Investment Report 2002. Author’s analysis.
Country Inward FDI as Share of World
Inward FDI, 1997-2001

23HBS Japan Research Center 12-04-02 CK Copyright © 2002 Professor Michael E. Porter
0%
10%
20%
30%
40%
50%
60%
-10% 0% 10% 20% 30% 40%
Source: UNCTAD World Investment Report 2002. Author’s analysis.
Change of Inward FDI as Share of Gross Fixed Capital Formation, 1997 - 2000
Inward FDI Flows1997 - 2000
China
Singapore
DD = $20 billion inward FDI in 2000
United States
Brazil
Change in World FDI as a Share of Gross Fixed Capital Formation: +14.6%
Average World Inward FDI as Share of Gross
Fixed Capital Formation: 22.0%
Mexico
KoreaTaiwan
Japan
Australia
United Kingdom
+ + + +
Inward FDI as Share of Gross Fixed Capital
Formation, 2000

24HBS Japan Research Center 12-04-02 CK Copyright © 2002 Professor Michael E. Porter
New Role of the Private Sector in Economic Development
• A company’s competitive advantage is partly the result of the local environment
• Company membership in a cluster offers collective benefits
• Private investment in “public goods” is justified
• Take an active role in upgrading the local infrastructure
• Nurture local suppliers and attract new supplier investments
• Work closely with local educational and research institutions
• Provide government with information and substantive input on regulatory issues and constraints to cluster development
• An important role for trade associations
– Influence and cost sharing