capital punishment, 2019 - statistical tables
TRANSCRIPT
U.S. Department of Justice Office of Justice Programs Bureau of Justice Statistics
Bureau of Justice Statistics · Statistical Tables
June 2021, NCJ 300381
Capital Punishment, 2019 – Statistical Tables Tracy L. Snell, BJS Statistician
At year-end 2019, a total of 29 states and the Federal Bureau of Prisons (BOP) held 2,570 prisoners under sentence of
death, which was 56 (2%) fewer than at year-end 2018. During 2019, the number of prisoners under sentence of death declined for the 19th consecutive year. California (28%), Florida (13%), and Texas (8%) held about half of the prisoners under sentence of death in the United States on December 31, 2019. Te BOP held 61 prisoners under sentence of death at year-end.
Seven states executed a total of 22 prisoners in 2019. Texas executed 9 prisoners, which accounted for 41% of the executions carried out in 2019.
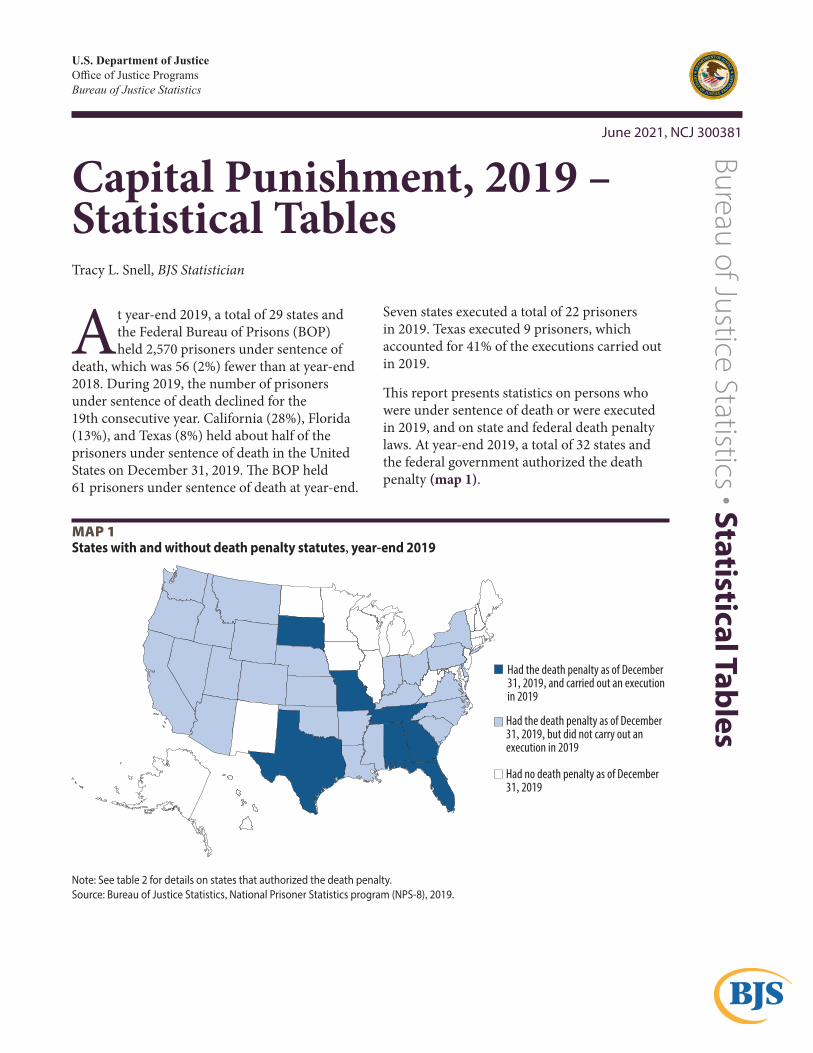
Tis report presents statistics on persons who were under sentence of death or were executed in 2019, and on state and federal death penalty laws. At year-end 2019, a total of 32 states and the federal government authorized the death penalty (map 1).
MAP 1 States with and without death penalty statutes, year-end 2019
Note: See table 2 for details on states that authorized the death penalty. Source: Bureau of Justice Statistics, National Prisoner Statistics program (NPS-8), 2019.
Had the death penalty as of December 31, 2019, and carried out an execution in 2019
Had the death penalty as of December 31, 2019, but did not carry out an execution in 2019
Had no death penalty as of December 31, 2019
Capital Punishment, 2019 – Statistical Tables | June 2021 2
Highlights ��Eleven states and the BOP received a total of
31 prisoners under sentence of death in 2019.
��Twenty-one states and the BOP removed a total of 65 prisoners from under sentence of death by means other than execution.
��The New Hampshire legislature repealed the death penalty provision of the capital murder statute, but the repeal was prospective, leaving one male prisoner under a previously imposed sentence of death.
��The New Mexico Supreme Court declared the state capital statute unconstitutional, and the two prisoners under sentence of death were resentenced to life.
��The largest decline in the number of prisoners under sentence of death in 2019 occurred in California (down 11 prisoners), followed by Pennsylvania (down 8), Texas (down 7), and Tennessee (down 6).
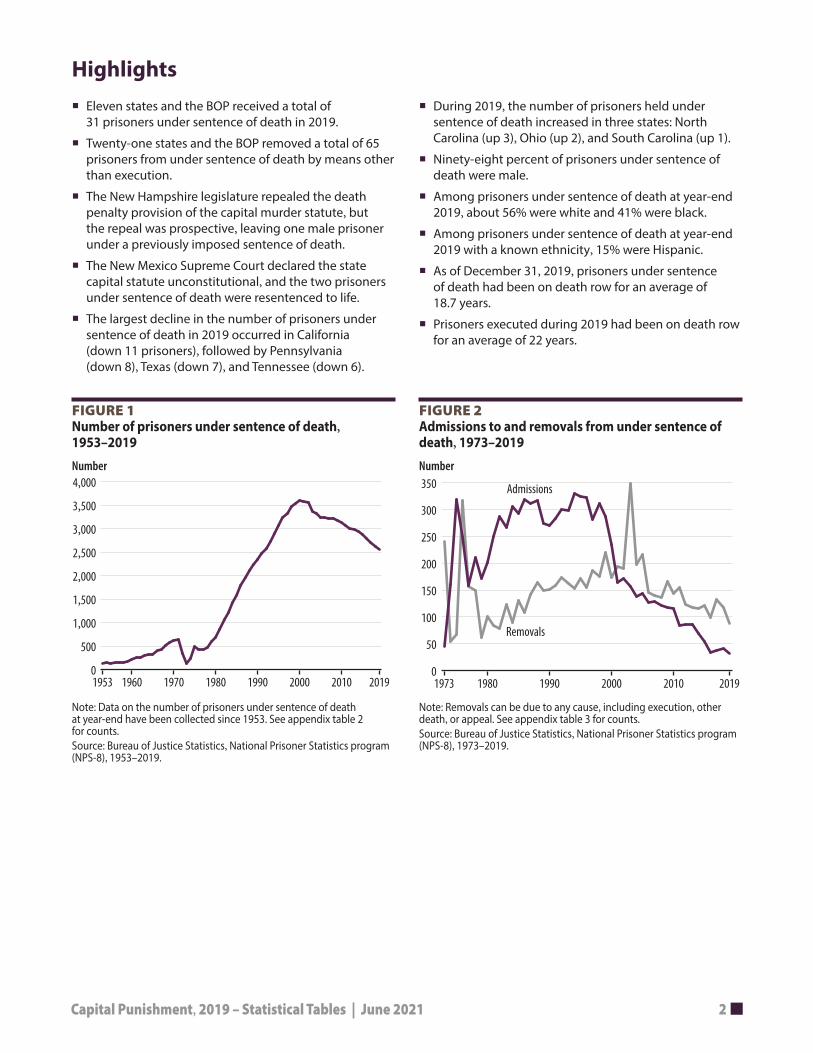
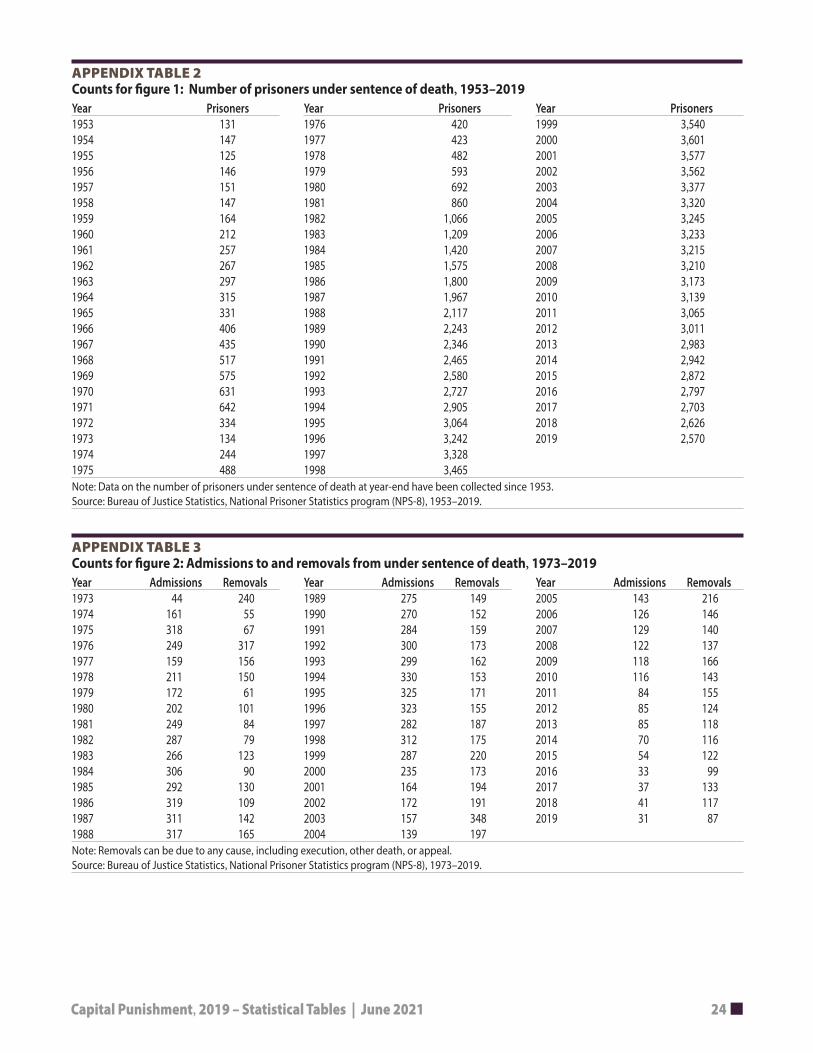
FIGURE 1 Number of prisoners under sentence of death, 1953–2019
Number 4,000
3,500
3,000
2,500
2,000
1,500
1,000
500
0 1953 1960 1970 1980 1990 2000 2010 2019
Note: Data on the number of prisoners under sentence of death at year-end have been collected since 1953. See appendix table 2 for counts. Source: Bureau of Justice Statistics, National Prisoner Statistics program (NPS-8), 1953–2019.
��During 2019, the number of prisoners held under sentence of death increased in three states: North Carolina (up 3), Ohio (up 2), and South Carolina (up 1).
��Ninety-eight percent of prisoners under sentence of death were male.
��Among prisoners under sentence of death at year-end 2019, about 56% were white and 41% were black.
��Among prisoners under sentence of death at year-end 2019 with a known ethnicity, 15% were Hispanic.
��As of December 31, 2019, prisoners under sentence of death had been on death row for an average of 18.7 years.
��Prisoners executed during 2019 had been on death row for an average of 22 years.
FIGURE 2 Admissions to and removals from under sentence of death, 1973–2019
Number 350
300
250
200
150
100
50
0 1973 1980 1990 2000 2010 2019
Removals
Admissions
Note: Removals can be due to any cause, including execution, other death, or appeal. See appendix table 3 for counts. Source: Bureau of Justice Statistics, National Prisoner Statistics program (NPS-8), 1973–2019.
Capital Punishment, 2019 – Statistical Tables | June 2021 3
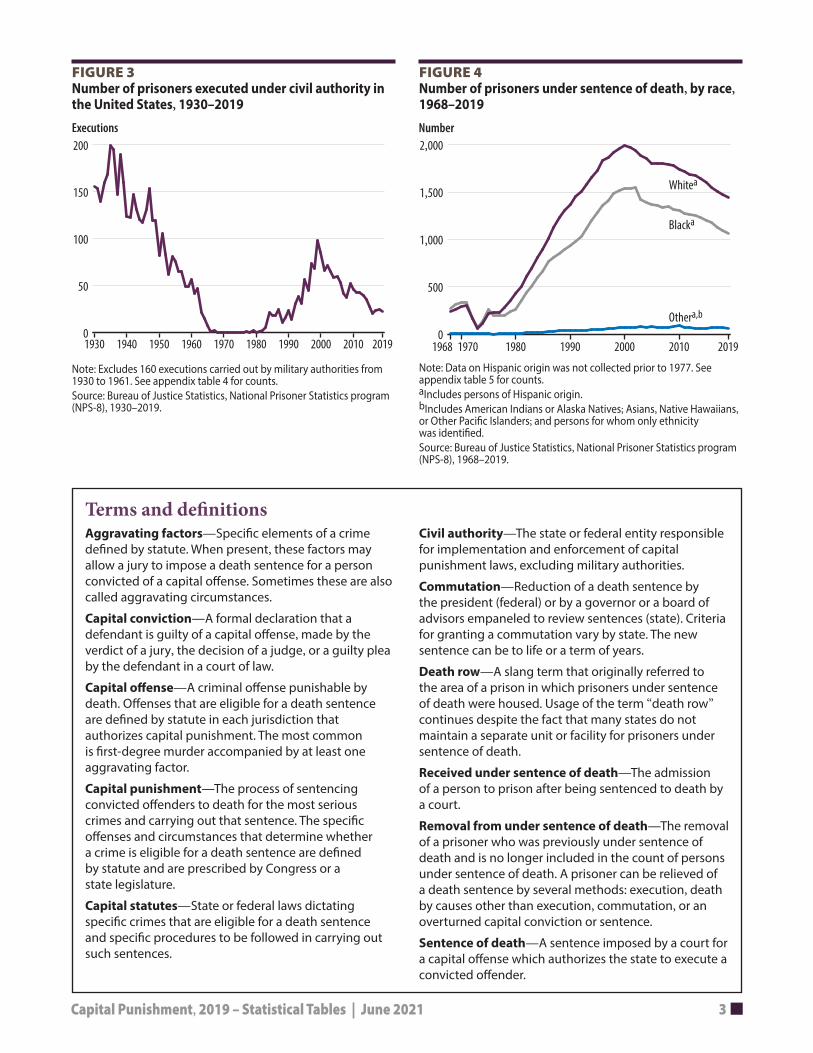
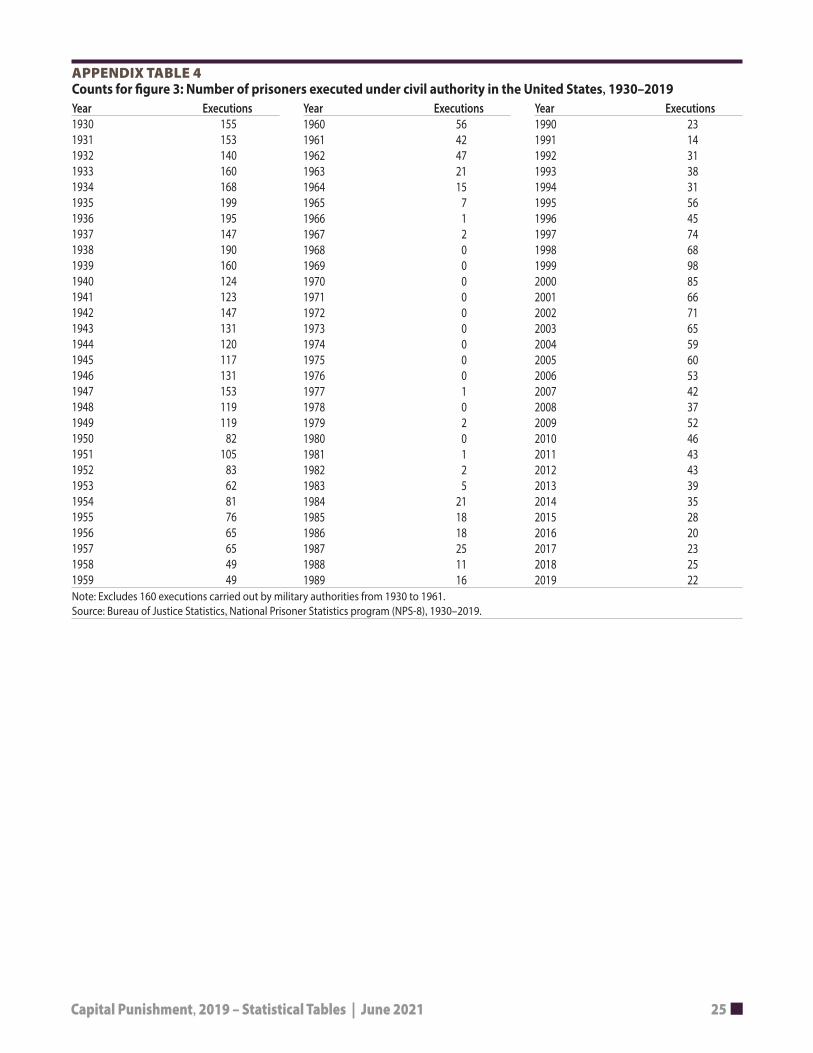
FIGURE 3 Number of prisoners executed under civil authority in the United States, 1930–2019
Executions 200
150
100
50
0
Note: Excludes 160 executions carried out by military authorities from 1930 to 1961. See appendix table 4 for counts. Source: Bureau of Justice Statistics, National Prisoner Statistics program (NPS-8), 1930–2019.
1930 1940 1950 1960 1970 1980 1990 2000 2010 2019
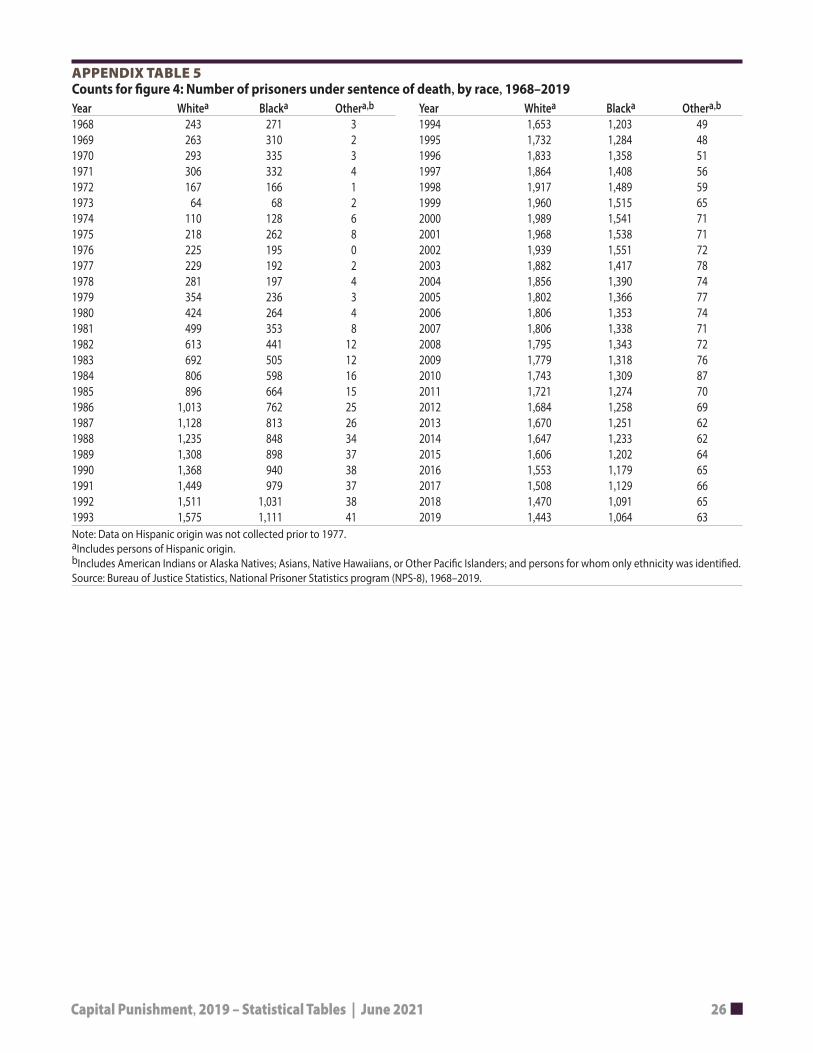
FIGURE 4 Number of prisoners under sentence of death, by race, 1968–2019
Number 2,000
1,500
1,000
500
0
Note: Data on Hispanic origin was not collected prior to 1977. See appendix table 5 for counts. aIncludes persons of Hispanic origin. bIncludes American Indians or Alaska Natives; Asians, Native Hawaiians, or Other Pacifc Islanders; and persons for whom only ethnicity was identifed. Source: Bureau of Justice Statistics, National Prisoner Statistics program (NPS-8), 1968–2019.
Othera,b
Blacka
Whitea
1968 1970 1980 1990 2000 2010 2019
Terms and defnitions Aggravating factors—Specifc elements of a crime Civil authority—The state or federal entity responsible defned by statute. When present, these factors may for implementation and enforcement of capital allow a jury to impose a death sentence for a person punishment laws, excluding military authorities. convicted of a capital ofense. Sometimes these are also Commutation—Reduction of a death sentence by called aggravating circumstances. the president (federal) or by a governor or a board of Capital conviction—A formal declaration that a advisors empaneled to review sentences (state). Criteria defendant is guilty of a capital ofense, made by the for granting a commutation vary by state. The new verdict of a jury, the decision of a judge, or a guilty plea sentence can be to life or a term of years. by the defendant in a court of law. Death row—A slang term that originally referred to Capital ofense—A criminal ofense punishable by the area of a prison in which prisoners under sentence death. Ofenses that are eligible for a death sentence of death were housed. Usage of the term “death row” are defned by statute in each jurisdiction that continues despite the fact that many states do not authorizes capital punishment. The most common maintain a separate unit or facility for prisoners under is frst-degree murder accompanied by at least one sentence of death. aggravating factor. Received under sentence of death—The admission Capital punishment—The process of sentencing of a person to prison after being sentenced to death by convicted ofenders to death for the most serious a court. crimes and carrying out that sentence. The specifc Removal from under sentence of death—The removal ofenses and circumstances that determine whether of a prisoner who was previously under sentence of a crime is eligible for a death sentence are defned death and is no longer included in the count of persons by statute and are prescribed by Congress or a under sentence of death. A prisoner can be relieved of state legislature. a death sentence by several methods: execution, death Capital statutes—State or federal laws dictating by causes other than execution, commutation, or an specifc crimes that are eligible for a death sentence overturned capital conviction or sentence. and specifc procedures to be followed in carrying out Sentence of death—A sentence imposed by a court for such sentences. a capital ofense which authorizes the state to execute a
convicted ofender.

Capital Punishment, 2019 – Statistical Tables | June 2021 4
List of tables TABLE 1. Status of the death penalty, December 31, 2019
TABLE 2. Capital ofenses, by state, 2019
TABLE 10. Prisoners under sentence of death on December 31, 2019, by year of sentencing
TABLE 11. Prisoners removed from under sentence of death, by region, jurisdiction, and method of
TABLE 3. Federal capital ofenses, 2019
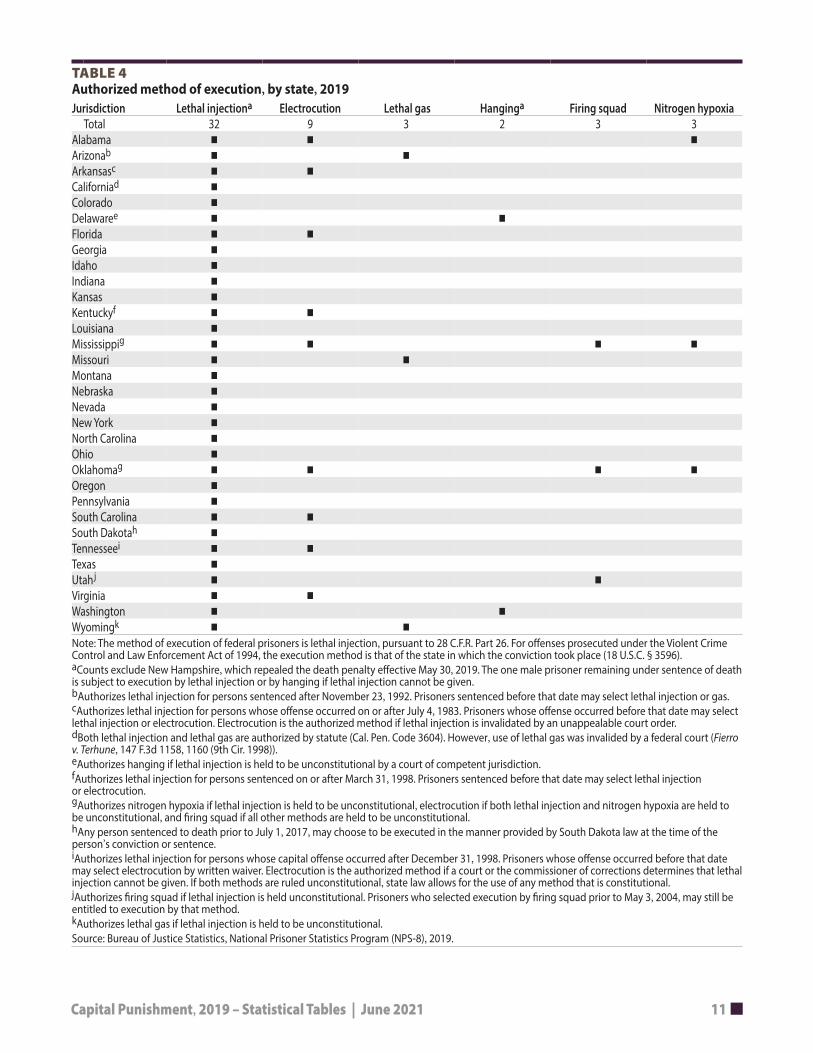
TABLE 4. Authorized method of execution, by state, 2019
TABLE 5. Prisoners under sentence of death, by region, jurisdiction, and race, 2018 and 2019
TABLE 6. Demographic characteristics of prisoners under sentence of death, 2019
TABLE 7. Female prisoners under sentence of death, by region, jurisdiction, and race, 2018 and 2019
TABLE 8. Hispanic prisoners under sentence of death, by region and jurisdiction, 2018 and 2019
TABLE 9. Criminal history of prisoners under sentence of death, by race or ethnicity, 2019
removal, 2019
TABLE 12. Average elapsed time between sentencing and execution, 1977–2019
TABLE 13. Number of prisoners executed, by race or ethnicity, 1977–2019
TABLE 14. Number of executions, by method and jurisdiction, 1977–2019
TABLE 15. Number of executions, by jurisdiction, 1930–2019 and 1977–2019
List of fgures MAP 1. States with and without death penalty statutes, year-end 2019
FIGURE 1. Number of prisoners under sentence of death, 1953–2019
FIGURE 2. Admissions to and removals from under sentence of death, 1973–2019
FIGURE 3. Number of prisoners executed under civil authority in the United States, 1930–2019
FIGURE 4. Number of prisoners under sentence of death, by race, 1968–2019
FIGURE 5. Advance count of executions, January 1, 2020–December 31, 2020
Continued on next page
Capital Punishment, 2019 – Statistical Tables | June 2021 5
List of appendix tables APPENDIX TABLE 1. Demographic characteristics for prisoners under sentence of death, 2019
APPENDIX TABLE 2. Counts for fgure 1: Number of prisoners under sentence of death, 1953–2019
APPENDIX TABLE 3. Counts for fgure 2: Admissions to and removals from under sentence of death, 1973–2019
APPENDIX TABLE 4. Counts for fgure 3: Number of prisoners executed under civil authority in the United States, 1930–2019
APPENDIX TABLE 5. Counts for fgure 4: Number of prisoners under sentence of death, by race, 1968–2019
Capital Punishment, 2019 – Statistical Tables | June 2021 6
Status of the death penalty in 2019 As of December 31, 2019, a total of 32 states and the federal government authorized the death penalty (tables 1, 2, and 3). While the Washington Supreme Court declared the state death penalty statute unconstitutional, as applied, on October 11, 2018 (State v. Gregory, 192 Wash. 2d 1, 427 P.3d 621 (2018)), the Washington state legislature has neither revised nor repealed the statute. During 2019, one state repealed its death penalty statute, one had its statute ruled unconstitutional by the state’s highest court, and fve revised statutes related to the death penalty.
In 2019, the New Hampshire legislature repealed the death penalty (HB 455), efective May 30, 2019. Because the repeal was prospective, it did not afect the previously imposed death sentence of one male prisoner.
Te New Mexico Supreme Court invalidated the state’s death penalty statute on June 28, 2019. Te court found in Fry v. Lopez (2019-NMSC-013, 447 P.3d 1086) that, by allowing the death penalty for murders committed prior to the enactment date but not for similar murders committed afer the enactment date, imposition of a death sentence conficted with the proportionality provision of the same statute. Te ruling efectively removed the state’s two remaining prisoners from under sentence of death.
During 2019, Alabama revised statutory provisions relating to its death penalty. Te legislature added murder of any frst responder operating in an ofcial capacity (Ala. Code § 13A-5-40(a)(21)) to the list of ofenses eligible for the death penalty. It also added two aggravating circumstances: the victim was a law enforcement or correctional ofcer murdered while on duty or for reasons related to their job; and the victim was a frst responder who was operating in an ofcial capacity (Ala. Code § 13A-5-49 (13), (14)). Tese changes became efective October 1, 2019.
Arizona amended the list of aggravating circumstances required to make a murder eligible for the death penalty (A.R.S. § 13-751(F)). Te state’s legislature removed elements from the statute: that the defendant
knowingly created a grave risk of death to persons other than the murder victim (A.R.S. § 13-751(F)(3)); committed the ofense in a cold, calculated manner without pretense of moral or legal justifcation (A.R.S. § 13-751(F)(13)); or used a stun gun (A.R.S. § 13-751(F)(14)). Te changes resulted in a total of 10 possible aggravating circumstances and became efective on August 27, 2019.
Arkansas revised its code of criminal procedure to prohibit disclosure of information or documents related to the execution process and participants (Ark. Code Ann. § 5-4-617), efective July 24, 2019.
Te Oregon legislature revised several elements of the statute related to the state’s death penalty (SB 1013 (2019)), which became efective September 29, 2019. Oregon revised the defnition of aggravated murder. Te changes allow for the death penalty in only the following circumstances: murder of two or more persons for the purpose of infuencing the public or government through intimidation or coercion; murder committed by an inmate or someone with a prior conviction for aggravated murder; premeditated murder of a child age 13 or younger; and murder of police, correctional, probation, or parole ofcers when the murder was related to their ofcial duties. Te changes also added a new ofense: frst-degree murder, which encompasses elements previously classifed as aggravated murder, which is punishable by life without the possibility of parole.
Tennessee revised two statutory provisions related to the death penalty. Te specifed aggravating circumstances were amended to include knowingly selling or distributing fentanyl or other opiates with the intent to commit murder (Tenn. Code Ann. § 39-13-204(i)(18)). Te state also revised the code of criminal procedure to provide that when a judgment has become fnal in trial court, the conviction and the sentence of death will be automatically reviewed by the Tennessee Supreme Court instead of requiring the defendant to fle a direct appeal from the trial court to the state’s Court of Criminal Appeals (Tenn. Code Ann. § 39-13-206(a)-(c)). Te changes became efective July 1, 2019.

Capital Punishment, 2019 – Statistical Tables | June 2021 7
TABLE 1 Status of the death penalty, December 31, 2019
Executions in 2019 Number of prisoners under sentence of death Jurisdictions with no death penalty (19) Texas 9 California 724 Alaska Alabama 3 Florida 340 Connecticut Georgia 3 Texas 216 District of Columbia Tennessee 3 Alabama 175 Hawaii Florida 2 North Carolina 143 Illinois Missouri 1 Ohio 139 Iowa South Dakota 1 Pennsylvania 134 Maine
Arizona 116 Maryland Nevada 71 Massachusetts Louisiana 68 Michigan Federal Bureau of Prisons 61 Minnesota Tennessee 52 New Hampshire Georgia 46 New Jersey Oklahoma 46 New Mexico Mississippi 40 North Dakota South Carolina 36 Rhode Island Arkansas 30 Vermont Oregon 29 West Virginia Kentucky 27 Wisconsin Missouri 22 Nebraska 12 Kansas 10 Idaho 9 Indiana 8 Utah 7 Colorado 3 Virginia 2 Montana 2 New Hampshirea 1 South Dakota 1
Total 22 Totalb 2,570 Note: While the Washington Supreme Court has declared the state’s death penalty statute unconstitutional as applied (State v. Gregory, 192 Wash. 2d 1, 427 P.3d 621 (2018)), no legislative action has been taken to revise or repeal the statute. The state continues to report that the death penalty is authorized. See table 2 for information on statutes. aNew Hampshire repealed its death penalty statute, efective May 30, 2019. As of December 31, 2019, one male prisoner remained under a previously imposed sentence of death. bNew York, Delaware, Washington, and Wyoming held no inmates under sentence of death on December 31, 2019. Source: Bureau of Justice Statistics, National Prisoner Statistics program (NPS-8), 2019.
Capital Punishment, 2019 – Statistical Tables | June 2021 8
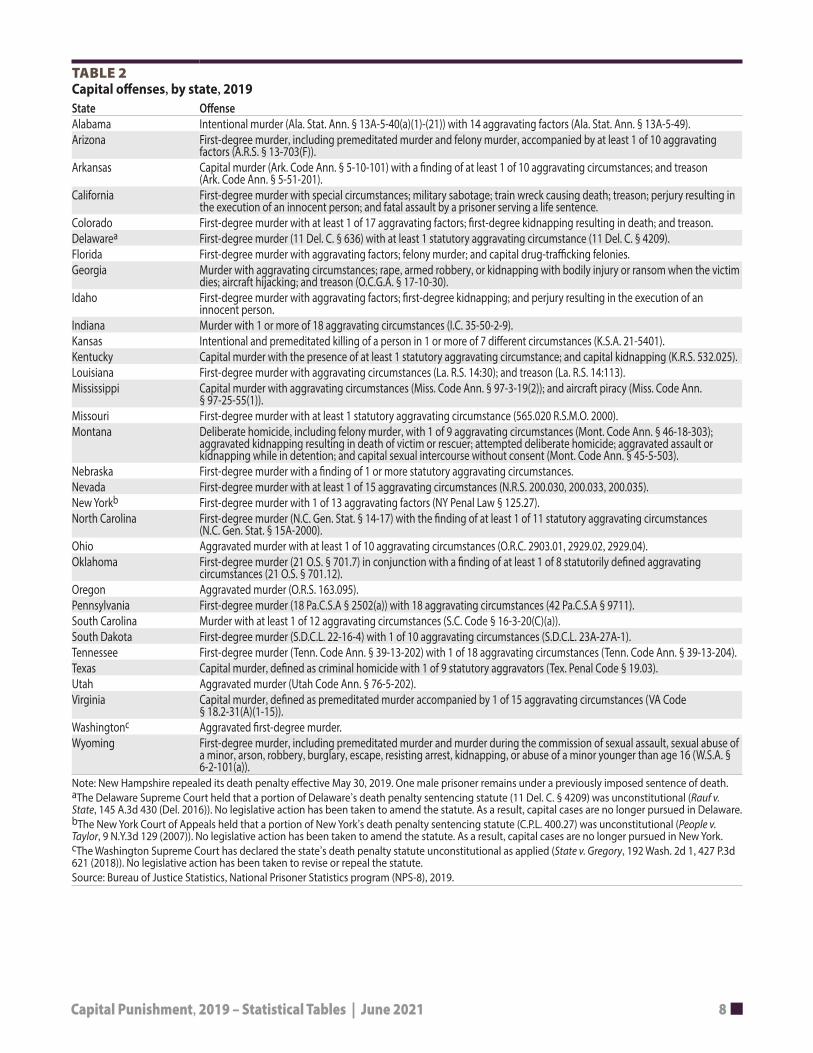
TABLE 2 Capital ofenses, by state, 2019 State Ofense Alabama Intentional murder (Ala. Stat. Ann. § 13A-5-40(a)(1)-(21)) with 14 aggravating factors (Ala. Stat. Ann. § 13A-5-49). Arizona First-degree murder, including premeditated murder and felony murder, accompanied by at least 1 of 10 aggravating
factors (A.R.S. § 13-703(F)). Arkansas Capital murder (Ark. Code Ann. § 5-10-101) with a fnding of at least 1 of 10 aggravating circumstances; and treason
(Ark. Code Ann. § 5-51-201). California First-degree murder with special circumstances; military sabotage; train wreck causing death; treason; perjury resulting in
the execution of an innocent person; and fatal assault by a prisoner serving a life sentence. Colorado First-degree murder with at least 1 of 17 aggravating factors; frst-degree kidnapping resulting in death; and treason. Delawarea First-degree murder (11 Del. C. § 636) with at least 1 statutory aggravating circumstance (11 Del. C. § 4209). Florida First-degree murder with aggravating factors; felony murder; and capital drug-trafcking felonies. Georgia Murder with aggravating circumstances; rape, armed robbery, or kidnapping with bodily injury or ransom when the victim
dies; aircraft hijacking; and treason (O.C.G.A. § 17-10-30). Idaho First-degree murder with aggravating factors; frst-degree kidnapping; and perjury resulting in the execution of an
innocent person. Indiana Murder with 1 or more of 18 aggravating circumstances (I.C. 35-50-2-9). Kansas Intentional and premeditated killing of a person in 1 or more of 7 diferent circumstances (K.S.A. 21-5401). Kentucky Capital murder with the presence of at least 1 statutory aggravating circumstance; and capital kidnapping (K.R.S. 532.025). Louisiana First-degree murder with aggravating circumstances (La. R.S. 14:30); and treason (La. R.S. 14:113). Mississippi Capital murder with aggravating circumstances (Miss. Code Ann. § 97-3-19(2)); and aircraft piracy (Miss. Code Ann.
§ 97-25-55(1)). Missouri First-degree murder with at least 1 statutory aggravating circumstance (565.020 R.S.M.O. 2000). Montana Deliberate homicide, including felony murder, with 1 of 9 aggravating circumstances (Mont. Code Ann. § 46-18-303);
aggravated kidnapping resulting in death of victim or rescuer; attempted deliberate homicide; aggravated assault or kidnapping while in detention; and capital sexual intercourse without consent (Mont. Code Ann. § 45-5-503).
Nebraska First-degree murder with a fnding of 1 or more statutory aggravating circumstances. Nevada First-degree murder with at least 1 of 15 aggravating circumstances (N.R.S. 200.030, 200.033, 200.035). New Yorkb First-degree murder with 1 of 13 aggravating factors (NY Penal Law § 125.27). North Carolina First-degree murder (N.C. Gen. Stat. § 14-17) with the fnding of at least 1 of 11 statutory aggravating circumstances
(N.C. Gen. Stat. § 15A-2000). Ohio Aggravated murder with at least 1 of 10 aggravating circumstances (O.R.C. 2903.01, 2929.02, 2929.04). Oklahoma First-degree murder (21 O.S. § 701.7) in conjunction with a fnding of at least 1 of 8 statutorily defned aggravating
circumstances (21 O.S. § 701.12). Oregon Aggravated murder (O.R.S. 163.095). Pennsylvania First-degree murder (18 Pa.C.S.A § 2502(a)) with 18 aggravating circumstances (42 Pa.C.S.A § 9711). South Carolina Murder with at least 1 of 12 aggravating circumstances (S.C. Code § 16-3-20(C)(a)). South Dakota First-degree murder (S.D.C.L. 22-16-4) with 1 of 10 aggravating circumstances (S.D.C.L. 23A-27A-1). Tennessee First-degree murder (Tenn. Code Ann. § 39-13-202) with 1 of 18 aggravating circumstances (Tenn. Code Ann. § 39-13-204). Texas Capital murder, defned as criminal homicide with 1 of 9 statutory aggravators (Tex. Penal Code § 19.03). Utah Aggravated murder (Utah Code Ann. § 76-5-202). Virginia Capital murder, defned as premeditated murder accompanied by 1 of 15 aggravating circumstances (VA Code
§ 18.2-31(A)(1-15)). Washingtonc Aggravated frst-degree murder. Wyoming First-degree murder, including premeditated murder and murder during the commission of sexual assault, sexual abuse of
a minor, arson, robbery, burglary, escape, resisting arrest, kidnapping, or abuse of a minor younger than age 16 (W.S.A. § 6-2-101(a)).
Note: New Hampshire repealed its death penalty efective May 30, 2019. One male prisoner remains under a previously imposed sentence of death. aThe Delaware Supreme Court held that a portion of Delaware’s death penalty sentencing statute (11 Del. C. § 4209) was unconstitutional (Rauf v. State, 145 A.3d 430 (Del. 2016)). No legislative action has been taken to amend the statute. As a result, capital cases are no longer pursued in Delaware. bThe New York Court of Appeals held that a portion of New York’s death penalty sentencing statute (C.P.L. 400.27) was unconstitutional (People v. Taylor, 9 N.Y.3d 129 (2007)). No legislative action has been taken to amend the statute. As a result, capital cases are no longer pursued in New York. cThe Washington Supreme Court has declared the state’s death penalty statute unconstitutional as applied (State v. Gregory, 192 Wash. 2d 1, 427 P.3d 621 (2018)). No legislative action has been taken to revise or repeal the statute. Source: Bureau of Justice Statistics, National Prisoner Statistics program (NPS-8), 2019.
Capital Punishment, 2019 – Statistical Tables | June 2021 9
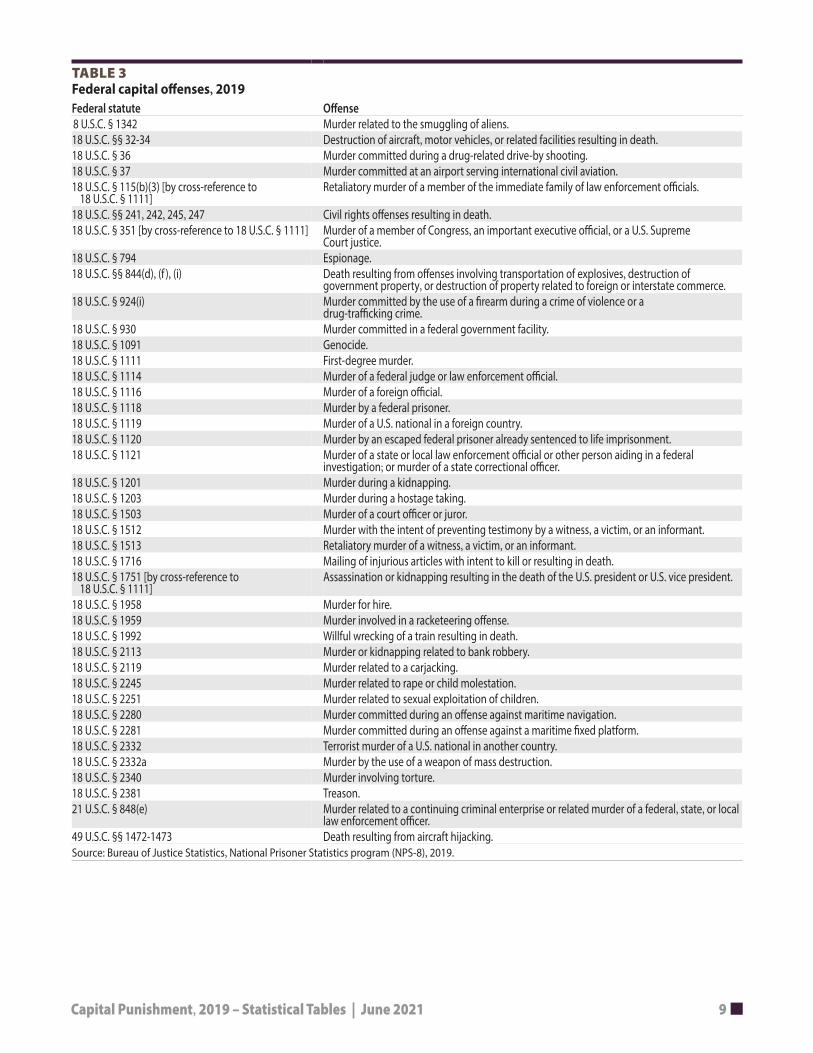
TABLE 3 Federal capital ofenses, 2019 Federal statute Ofense 8 U.S.C. § 1342 Murder related to the smuggling of aliens. 18 U.S.C. §§ 32-34 Destruction of aircraft, motor vehicles, or related facilities resulting in death. 18 U.S.C. § 36 Murder committed during a drug-related drive-by shooting. 18 U.S.C. § 37 Murder committed at an airport serving international civil aviation. 18 U.S.C. § 115(b)(3) [by cross-reference to Retaliatory murder of a member of the immediate family of law enforcement ofcials.
18 U.S.C. § 1111] 18 U.S.C. §§ 241, 242, 245, 247 Civil rights ofenses resulting in death. 18 U.S.C. § 351 [by cross-reference to 18 U.S.C. § 1111] Murder of a member of Congress, an important executive ofcial, or a U.S. Supreme
Court justice. 18 U.S.C. § 794 Espionage. 18 U.S.C. §§ 844(d), (f ), (i) Death resulting from ofenses involving transportation of explosives, destruction of
government property, or destruction of property related to foreign or interstate commerce. 18 U.S.C. § 924(i) Murder committed by the use of a frearm during a crime of violence or a
drug-trafcking crime. 18 U.S.C. § 930 Murder committed in a federal government facility. 18 U.S.C. § 1091 Genocide. 18 U.S.C. § 1111 First-degree murder. 18 U.S.C. § 1114 Murder of a federal judge or law enforcement ofcial. 18 U.S.C. § 1116 Murder of a foreign ofcial. 18 U.S.C. § 1118 Murder by a federal prisoner. 18 U.S.C. § 1119 Murder of a U.S. national in a foreign country. 18 U.S.C. § 1120 Murder by an escaped federal prisoner already sentenced to life imprisonment. 18 U.S.C. § 1121 Murder of a state or local law enforcement ofcial or other person aiding in a federal
investigation; or murder of a state correctional ofcer. 18 U.S.C. § 1201 Murder during a kidnapping. 18 U.S.C. § 1203 Murder during a hostage taking. 18 U.S.C. § 1503 Murder of a court ofcer or juror. 18 U.S.C. § 1512 Murder with the intent of preventing testimony by a witness, a victim, or an informant. 18 U.S.C. § 1513 Retaliatory murder of a witness, a victim, or an informant. 18 U.S.C. § 1716 Mailing of injurious articles with intent to kill or resulting in death. 18 U.S.C. § 1751 [by cross-reference to Assassination or kidnapping resulting in the death of the U.S. president or U.S. vice president.
18 U.S.C. § 1111] 18 U.S.C. § 1958 Murder for hire. 18 U.S.C. § 1959 Murder involved in a racketeering ofense. 18 U.S.C. § 1992 Willful wrecking of a train resulting in death. 18 U.S.C. § 2113 Murder or kidnapping related to bank robbery. 18 U.S.C. § 2119 Murder related to a carjacking. 18 U.S.C. § 2245 Murder related to rape or child molestation. 18 U.S.C. § 2251 Murder related to sexual exploitation of children. 18 U.S.C. § 2280 Murder committed during an ofense against maritime navigation. 18 U.S.C. § 2281 Murder committed during an ofense against a maritime fxed platform. 18 U.S.C. § 2332 Terrorist murder of a U.S. national in another country. 18 U.S.C. § 2332a Murder by the use of a weapon of mass destruction. 18 U.S.C. § 2340 Murder involving torture. 18 U.S.C. § 2381 Treason. 21 U.S.C. § 848(e) Murder related to a continuing criminal enterprise or related murder of a federal, state, or local
law enforcement ofcer. 49 U.S.C. §§ 1472-1473 Death resulting from aircraft hijacking. Source: Bureau of Justice Statistics, National Prisoner Statistics program (NPS-8), 2019.
Capital Punishment, 2019 – Statistical Tables | June 2021 10
Authorized methods of execution in 2019 sentencing. Five states authorized alternative methods Methods of execution are defned by statute and vary by jurisdiction. In 2019, all 32 states with a death penalty statute authorized lethal injection as a method of execution (table 4). Fifeen states also authorized an alternative method of execution: electrocution (9 states), lethal gas (3), hanging (2), fring squad (3), and nitrogen hypoxia (3).
In states that authorized multiple methods of execution, the condemned prisoner usually selected the method. Five states (Arizona, Arkansas, Kentucky, Tennessee, and Utah) stipulated which method must be used depending on the date of either the ofense or
if lethal injection was ruled to be unconstitutional: Delaware authorized hanging; Mississippi and Oklahoma authorized electrocution, fring squad, or nitrogen hypoxia; Utah authorized fring squad; and Wyoming authorized lethal gas.
Federal prisoners are executed by lethal injection, pursuant to 28 CFR Part 26. For ofenses prosecuted under the federal Violent Crime Control and Law Enforcement Act of 1994, the law of the state in which the conviction took place determines the method used (18 U.S.C. § 3596).
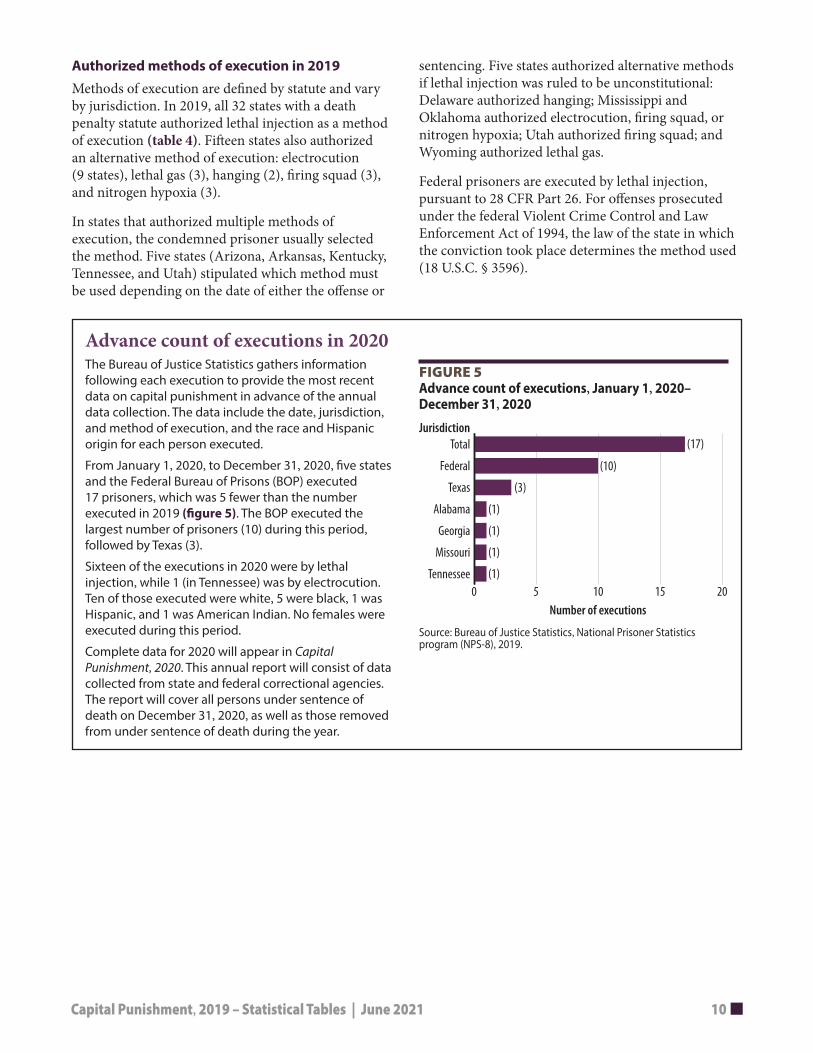
Advance count of executions in 2020 The Bureau of Justice Statistics gathers information following each execution to provide the most recent data on capital punishment in advance of the annual data collection. The data include the date, jurisdiction,
FIGURE 5 Advance count of executions, January 1, 2020– December 31, 2020
and method of execution, and the race and Hispanic Jurisdiction origin for each person executed.
From January 1, 2020, to December 31, 2020, fve states and the Federal Bureau of Prisons (BOP) executed 17 prisoners, which was 5 fewer than the number executed in 2019 (fgure 5). The BOP executed the largest number of prisoners (10) during this period, followed by Texas (3).
Sixteen of the executions in 2020 were by lethal injection, while 1 (in Tennessee) was by electrocution. Ten of those executed were white, 5 were black, 1 was Hispanic, and 1 was American Indian. No females were executed during this period.
Complete data for 2020 will appear in Capital Punishment, 2020. This annual report will consist of data collected from state and federal correctional agencies. The report will cover all persons under sentence of death on December 31, 2020, as well as those removed from under sentence of death during the year.
Total
Federal
Texas
Alabama
Georgia
Missouri
Tennessee
(17)
0 5 10 15 20
(10)
(3)
(1)
(1)
(1)
(1)
Number of executions
Source: Bureau of Justice Statistics, National Prisoner Statistics program (NPS-8), 2019.
Capital Punishment, 2019 – Statistical Tables | June 2021 11
TABLE 4 Authorized method of execution, by state, 2019 Jurisdiction Lethal injectiona Electrocution Lethal gas Hanginga Firing squad Nitrogen hypoxia
Total 32 9 3 2 3 3 Alabama Arizonab
Arkansasc
Californiad Colorado Delawaree Florida Georgia Idaho Indiana Kansas Kentuckyf Louisiana Mississippig
Missouri
Montana Nebraska Nevada New York North Carolina Ohio Oklahomag Oregon Pennsylvania South Carolina South Dakotah Tennesseei Texas Utahj Virginia Washington Wyomingk Note: The method of execution of federal prisoners is lethal injection, pursuant to 28 C.F.R. Part 26. For ofenses prosecuted under the Violent Crime Control and Law Enforcement Act of 1994, the execution method is that of the state in which the conviction took place (18 U.S.C. § 3596). aCounts exclude New Hampshire, which repealed the death penalty efective May 30, 2019. The one male prisoner remaining under sentence of death is subject to execution by lethal injection or by hanging if lethal injection cannot be given. bAuthorizes lethal injection for persons sentenced after November 23, 1992. Prisoners sentenced before that date may select lethal injection or gas. cAuthorizes lethal injection for persons whose ofense occurred on or after July 4, 1983. Prisoners whose ofense occurred before that date may select lethal injection or electrocution. Electrocution is the authorized method if lethal injection is invalidated by an unappealable court order. dBoth lethal injection and lethal gas are authorized by statute (Cal. Pen. Code 3604). However, use of lethal gas was invalided by a federal court (Fierro v. Terhune, 147 F.3d 1158, 1160 (9th Cir. 1998)). eAuthorizes hanging if lethal injection is held to be unconstitutional by a court of competent jurisdiction. fAuthorizes lethal injection for persons sentenced on or after March 31, 1998. Prisoners sentenced before that date may select lethal injection or electrocution. gAuthorizes nitrogen hypoxia if lethal injection is held to be unconstitutional, electrocution if both lethal injection and nitrogen hypoxia are held to be unconstitutional, and fring squad if all other methods are held to be unconstitutional. hAny person sentenced to death prior to July 1, 2017, may choose to be executed in the manner provided by South Dakota law at the time of the person’s conviction or sentence. iAuthorizes lethal injection for persons whose capital ofense occurred after December 31, 1998. Prisoners whose ofense occurred before that date may select electrocution by written waiver. Electrocution is the authorized method if a court or the commissioner of corrections determines that lethal injection cannot be given. If both methods are ruled unconstitutional, state law allows for the use of any method that is constitutional. jAuthorizes fring squad if lethal injection is held unconstitutional. Prisoners who selected execution by fring squad prior to May 3, 2004, may still be entitled to execution by that method. kAuthorizes lethal gas if lethal injection is held to be unconstitutional. Source: Bureau of Justice Statistics, National Prisoner Statistics Program (NPS-8), 2019.
Capital Punishment, 2019 – Statistical Tables | June 2021 12
Methodology Te Bureau of Justice Statistics (BJS) collects information about capital punishment each year through the National Prisoner Statistics program (NPS-8). BJS collects this data series in two parts:
��Data on persons under sentence of death areobtained from the department of corrections in eachjurisdiction that authorizes capital punishment.
��Te status of death penalty statutes is obtainedfrom the Ofce of the Attorney General in each ofthe 50 states, the Ofce of the U.S. Attorney in theDistrict of Columbia, and the Federal Bureau ofPrisons for the federal government.
Data collection forms are available on the BJS website at www.bjs.ojp.gov.
Te NPS-8 covers all persons under sentence of death at any time during the year who were held in a state or federal nonmilitary correctional facility. Tis includes capital ofenders transferred from prison to
a mental institution and those who may have escaped from custody. It excludes persons sentenced to death under the Uniform Code of Military Justice and those whose death sentences have been overturned by a court or an executive action, regardless of their current incarceration status.
Statistics in this report may difer from data collected by other organizations for various reasons:
��Te NPS-8 adds prisoners to the population undersentence of death at the time they are admitted to astate or federal correctional facility, not at the timethey are sentenced.
��If prisoners entered prison under a death sentence orwere reported as being relieved of a death sentencein one year but the admission or removal occurredin a previous year, counts are adjusted to refect theactual date of sentence or removal.
��NPS-8 counts are for the last day of the calendar yearand will difer from counts for more recent periods.
Capital Punishment, 2019 – Statistical Tables | June 2021 13
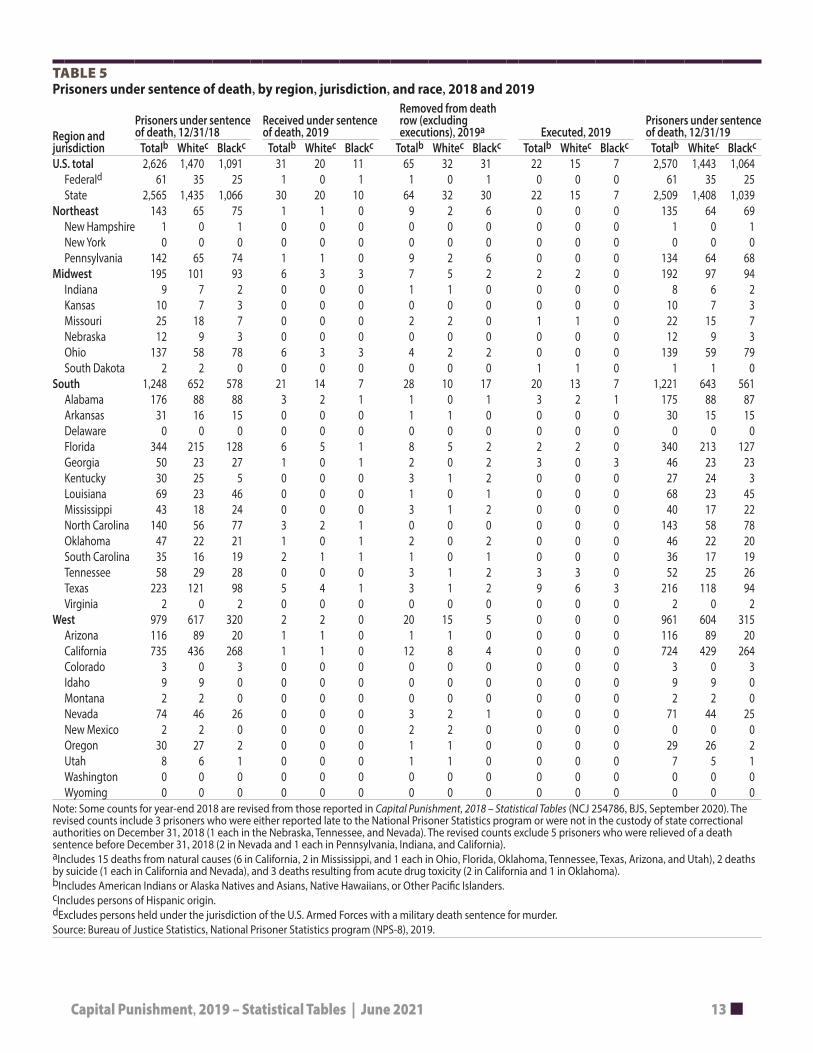
TABLE 5 Prisoners under sentence of death, by region, jurisdiction, and race, 2018 and 2019
Removed from death
Region and jurisdiction
Prisoners under sentence of death, 12/31/18
Totalb Whitec Blackc
Received under sentence of death, 2019
Totalb Whitec Blackc
row (excluding executions), 2019a
Totalb Whitec Blackc Executed, 2019
Totalb Whitec Blackc
Prisoners under sentence of death, 12/31/19
Totalb Whitec Blackc
U.S. total 2,626 1,470 1,091 31 20 11 65 32 31 22 15 7 2,570 1,443 1,064 Federald 61 35 25 1 0 1 1 0 1 0 0 0 61 35 25 State 2,565 1,435 1,066 30 20 10 64 32 30 22 15 7 2,509 1,408 1,039
Northeast 143 65 75 1 1 0 9 2 6 0 0 0 135 64 69 New Hampshire 1 0 1 0 0 0 0 0 0 0 0 0 1 0 1 New York 0 0 0 0 0 0 0 0 0 0 0 0 0 0 0 Pennsylvania 142 65 74 1 1 0 9 2 6 0 0 0 134 64 68
Midwest 195 101 93 6 3 3 7 5 2 2 2 0 192 97 94 Indiana 9 7 2 0 0 0 1 1 0 0 0 0 8 6 2 Kansas 10 7 3 0 0 0 0 0 0 0 0 0 10 7 3 Missouri 25 18 7 0 0 0 2 2 0 1 1 0 22 15 7 Nebraska 12 9 3 0 0 0 0 0 0 0 0 0 12 9 3 Ohio 137 58 78 6 3 3 4 2 2 0 0 0 139 59 79 South Dakota 2 2 0 0 0 0 0 0 0 1 1 0 1 1 0
South 1,248 652 578 21 14 7 28 10 17 20 13 7 1,221 643 561 Alabama 176 88 88 3 2 1 1 0 1 3 2 1 175 88 87 Arkansas 31 16 15 0 0 0 1 1 0 0 0 0 30 15 15 Delaware 0 0 0 0 0 0 0 0 0 0 0 0 0 0 0 Florida 344 215 128 6 5 1 8 5 2 2 2 0 340 213 127 Georgia 50 23 27 1 0 1 2 0 2 3 0 3 46 23 23 Kentucky 30 25 5 0 0 0 3 1 2 0 0 0 27 24 3 Louisiana 69 23 46 0 0 0 1 0 1 0 0 0 68 23 45 Mississippi 43 18 24 0 0 0 3 1 2 0 0 0 40 17 22 North Carolina 140 56 77 3 2 1 0 0 0 0 0 0 143 58 78 Oklahoma 47 22 21 1 0 1 2 0 2 0 0 0 46 22 20 South Carolina 35 16 19 2 1 1 1 0 1 0 0 0 36 17 19 Tennessee 58 29 28 0 0 0 3 1 2 3 3 0 52 25 26 Texas 223 121 98 5 4 1 3 1 2 9 6 3 216 118 94 Virginia 2 0 2 0 0 0 0 0 0 0 0 0 2 0 2
West 979 617 320 2 2 0 20 15 5 0 0 0 961 604 315 Arizona 116 89 20 1 1 0 1 1 0 0 0 0 116 89 20 California 735 436 268 1 1 0 12 8 4 0 0 0 724 429 264 Colorado 3 0 3 0 0 0 0 0 0 0 0 0 3 0 3 Idaho 9 9 0 0 0 0 0 0 0 0 0 0 9 9 0 Montana 2 2 0 0 0 0 0 0 0 0 0 0 2 2 0 Nevada 74 46 26 0 0 0 3 2 1 0 0 0 71 44 25 New Mexico 2 2 0 0 0 0 2 2 0 0 0 0 0 0 0 Oregon 30 27 2 0 0 0 1 1 0 0 0 0 29 26 2 Utah 8 6 1 0 0 0 1 1 0 0 0 0 7 5 1 Washington 0 0 0 0 0 0 0 0 0 0 0 0 0 0 0 Wyoming 0 0 0 0 0 0 0 0 0 0 0 0 0 0 0
Note: Some counts for year-end 2018 are revised from those reported in Capital Punishment, 2018 – Statistical Tables (NCJ 254786, BJS, September 2020). The revised counts include 3 prisoners who were either reported late to the National Prisoner Statistics program or were not in the custody of state correctional authorities on December 31, 2018 (1 each in the Nebraska, Tennessee, and Nevada). The revised counts exclude 5 prisoners who were relieved of a death sentence before December 31, 2018 (2 in Nevada and 1 each in Pennsylvania, Indiana, and California). aIncludes 15 deaths from natural causes (6 in California, 2 in Mississippi, and 1 each in Ohio, Florida, Oklahoma, Tennessee, Texas, Arizona, and Utah), 2 deaths by suicide (1 each in California and Nevada), and 3 deaths resulting from acute drug toxicity (2 in California and 1 in Oklahoma). bIncludes American Indians or Alaska Natives and Asians, Native Hawaiians, or Other Pacifc Islanders. cIncludes persons of Hispanic origin. dExcludes persons held under the jurisdiction of the U.S. Armed Forces with a military death sentence for murder. Source: Bureau of Justice Statistics, National Prisoner Statistics program (NPS-8), 2019.
Capital Punishment, 2019 – Statistical Tables | June 2021 14
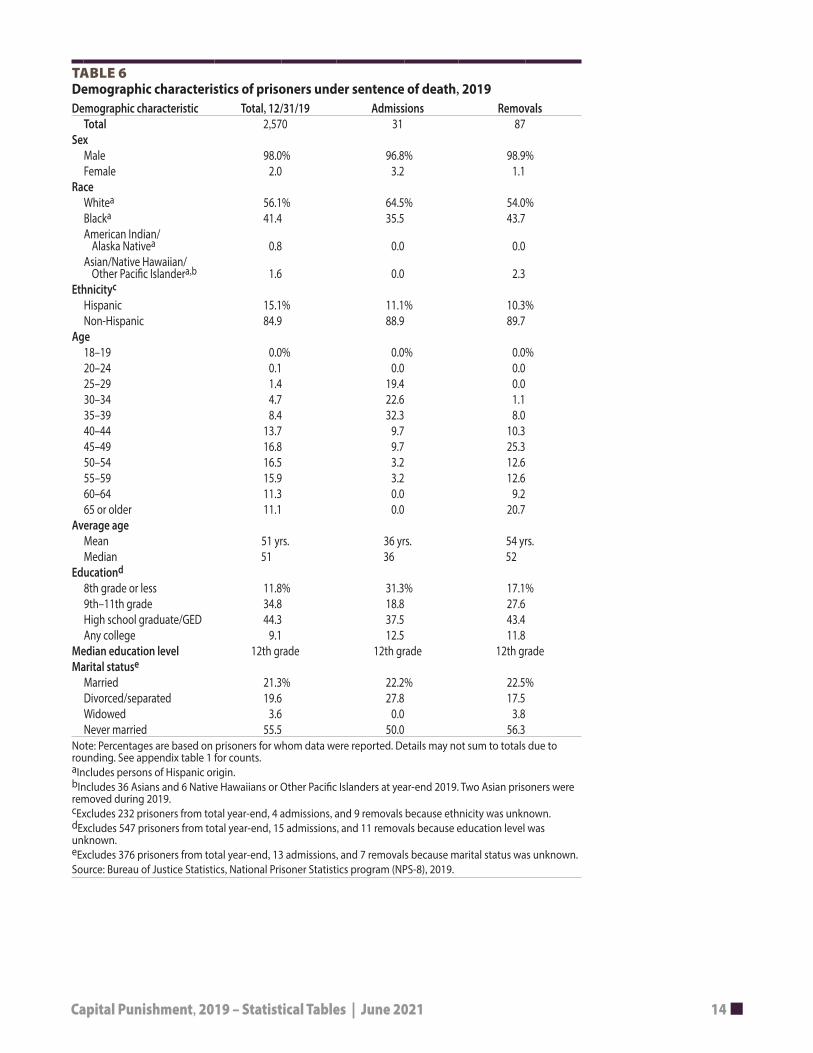
TABLE 6 Demographic characteristics of prisoners under sentence of death, 2019 Demographic characteristic Total, 12/31/19 Admissions Removals
Total 2,570 31 87 Sex
Male 98.0% 96.8% 98.9% Female 2.0 3.2 1.1
Race Whitea 56.1% 64.5% 54.0% Blacka 41.4 35.5 43.7 American Indian/
Alaska Nativea 0.8 0.0 0.0 Asian/Native Hawaiian/
Other Pacifc Islandera,b 1.6 0.0 2.3 Ethnicityc
Hispanic 15.1% 11.1% 10.3% Non-Hispanic 84.9 88.9 89.7
Age 18–19 0.0% 0.0% 0.0% 20–24 0.1 0.0 0.0 25–29 1.4 19.4 0.0 30–34 4.7 22.6 1.1 35–39 8.4 32.3 8.0 40–44 13.7 9.7 10.3 45–49 16.8 9.7 25.3 50–54 16.5 3.2 12.6 55–59 15.9 3.2 12.6 60–64 11.3 0.0 9.2 65 or older 11.1 0.0 20.7
Average age Mean 51 yrs. 36 yrs. 54 yrs. Median 51 36 52
Educationd
8th grade or less 11.8% 31.3% 17.1% 9th–11th grade 34.8 18.8 27.6 High school graduate/GED 44.3 37.5 43.4 Any college 9.1 12.5 11.8
Median education level 12th grade 12th grade 12th grade Marital statuse
Married 21.3% 22.2% 22.5% Divorced/separated 19.6 27.8 17.5 Widowed 3.6 0.0 3.8 Never married 55.5 50.0 56.3
Note: Percentages are based on prisoners for whom data were reported. Details may not sum to totals due to rounding. See appendix table 1 for counts. aIncludes persons of Hispanic origin. bIncludes 36 Asians and 6 Native Hawaiians or Other Pacifc Islanders at year-end 2019. Two Asian prisoners were removed during 2019. cExcludes 232 prisoners from total year-end, 4 admissions, and 9 removals because ethnicity was unknown. dExcludes 547 prisoners from total year-end, 15 admissions, and 11 removals because education level was unknown. eExcludes 376 prisoners from total year-end, 13 admissions, and 7 removals because marital status was unknown. Source: Bureau of Justice Statistics, National Prisoner Statistics program (NPS-8), 2019.
Capital Punishment, 2019 – Statistical Tables | June 2021 15
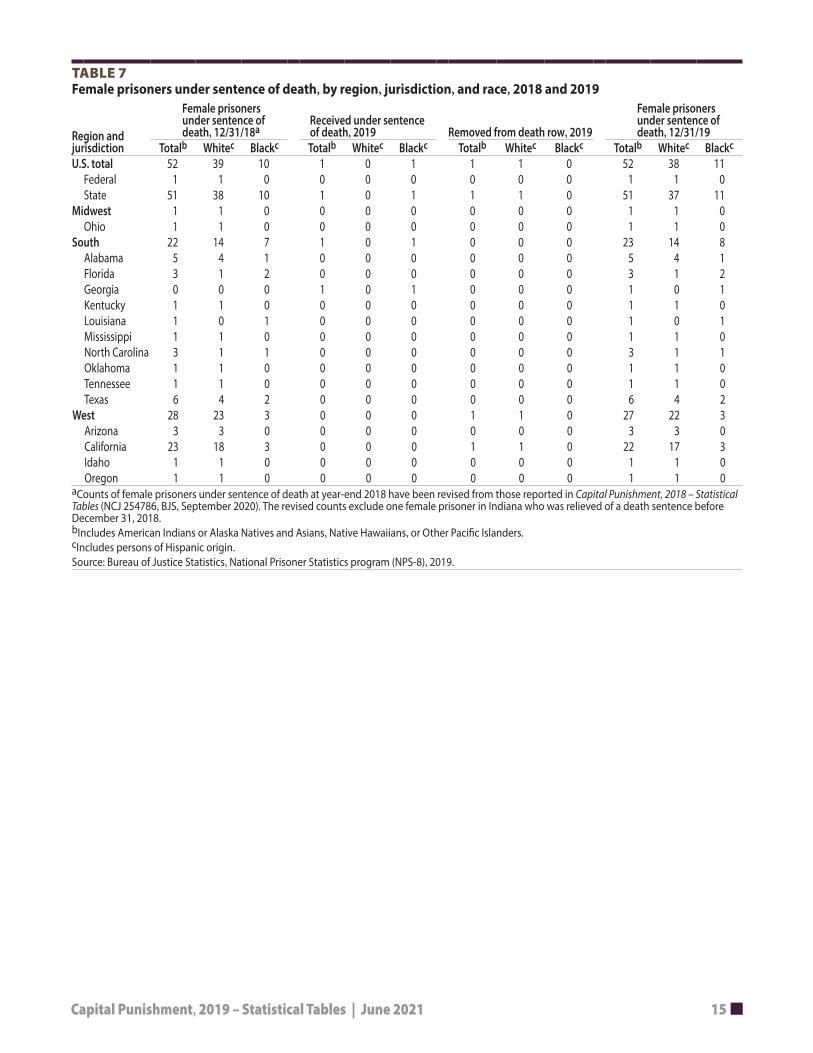
TABLE 7 Female prisoners under sentence of death, by region, jurisdiction, and race, 2018 and 2019
Female prisoners Female prisoners under sentence of Received under sentence under sentence of death, 12/31/18a of death, 2019 Removed from death row, 2019 death, 12/31/19Region and
jurisdiction Totalb Whitec Blackc Totalb Whitec Blackc Totalb Whitec Blackc Totalb Whitec Blackc
U.S. total 52 39 10 1 0 1 1 1 0 52 38 11 Federal 1 1 0 0 0 0 0 0 0 1 1 0 State 51 38 10 1 0 1 1 1 0 51 37 11
Midwest 1 1 0 0 0 0 0 0 0 1 1 0 Ohio 1 1 0 0 0 0 0 0 0 1 1 0
South 22 14 7 1 0 1 0 0 0 23 14 8 Alabama 5 4 1 0 0 0 0 0 0 5 4 1 Florida 3 1 2 0 0 0 0 0 0 3 1 2 Georgia 0 0 0 1 0 1 0 0 0 1 0 1 Kentucky 1 1 0 0 0 0 0 0 0 1 1 0 Louisiana 1 0 1 0 0 0 0 0 0 1 0 1 Mississippi 1 1 0 0 0 0 0 0 0 1 1 0 North Carolina 3 1 1 0 0 0 0 0 0 3 1 1 Oklahoma 1 1 0 0 0 0 0 0 0 1 1 0 Tennessee 1 1 0 0 0 0 0 0 0 1 1 0 Texas 6 4 2 0 0 0 0 0 0 6 4 2
West 28 23 3 0 0 0 1 1 0 27 22 3 Arizona 3 3 0 0 0 0 0 0 0 3 3 0 California 23 18 3 0 0 0 1 1 0 22 17 3 Idaho 1 1 0 0 0 0 0 0 0 1 1 0 Oregon 1 1 0 0 0 0 0 0 0 1 1 0
aCounts of female prisoners under sentence of death at year-end 2018 have been revised from those reported in Capital Punishment, 2018 – Statistical Tables (NCJ 254786, BJS, September 2020). The revised counts exclude one female prisoner in Indiana who was relieved of a death sentence before December 31, 2018. bIncludes American Indians or Alaska Natives and Asians, Native Hawaiians, or Other Pacifc Islanders. cIncludes persons of Hispanic origin. Source: Bureau of Justice Statistics, National Prisoner Statistics program (NPS-8), 2019.
Capital Punishment, 2019 – Statistical Tables | June 2021 16
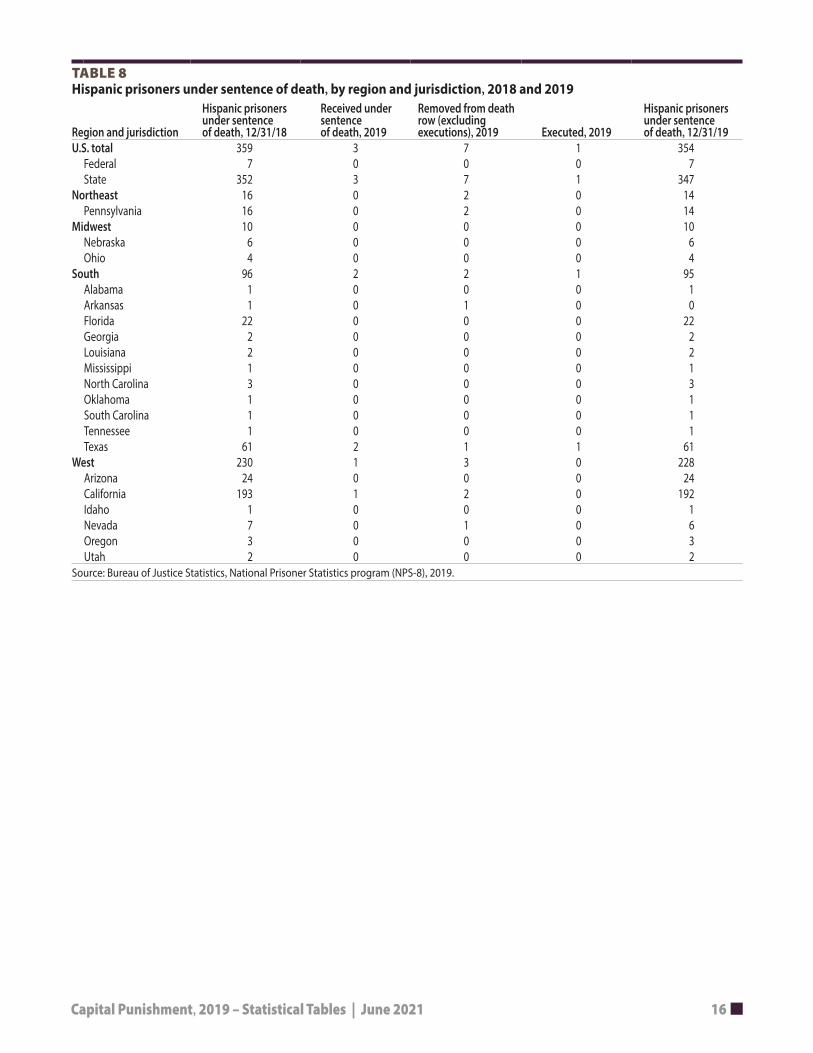
TABLE 8 Hispanic prisoners under sentence of death, by region and jurisdiction, 2018 and 2019
Hispanic prisoners Received under Removed from death under sentence sentence row (excluding
Region and jurisdiction of death, 12/31/18 of death, 2019 executions), 2019 Executed, 2019
Hispanic prisoners under sentence of death, 12/31/19
U.S. total 359 3 7 1 354 Federal 7 0 0 0 7 State 352 3 7 1 347
Northeast 16 0 2 0 14 Pennsylvania 16 0 2 0 14
Midwest 10 0 0 0 10 Nebraska 6 0 0 0 6 Ohio 4 0 0 0 4
South 96 2 2 1 95 Alabama 1 0 0 0 1 Arkansas 1 0 1 0 0 Florida 22 0 0 0 22 Georgia 2 0 0 0 2 Louisiana 2 0 0 0 2 Mississippi 1 0 0 0 1 North Carolina 3 0 0 0 3 Oklahoma 1 0 0 0 1 South Carolina 1 0 0 0 1 Tennessee 1 0 0 0 1 Texas 61 2 1 1 61
West 230 1 3 0 228 Arizona 24 0 0 0 24 California 193 1 2 0 192 Idaho 1 0 0 0 1 Nevada 7 0 1 0 6 Oregon 3 0 0 0 3 Utah 2 0 0 0 2
Source: Bureau of Justice Statistics, National Prisoner Statistics program (NPS-8), 2019.
Capital Punishment, 2019 – Statistical Tables | June 2021 17
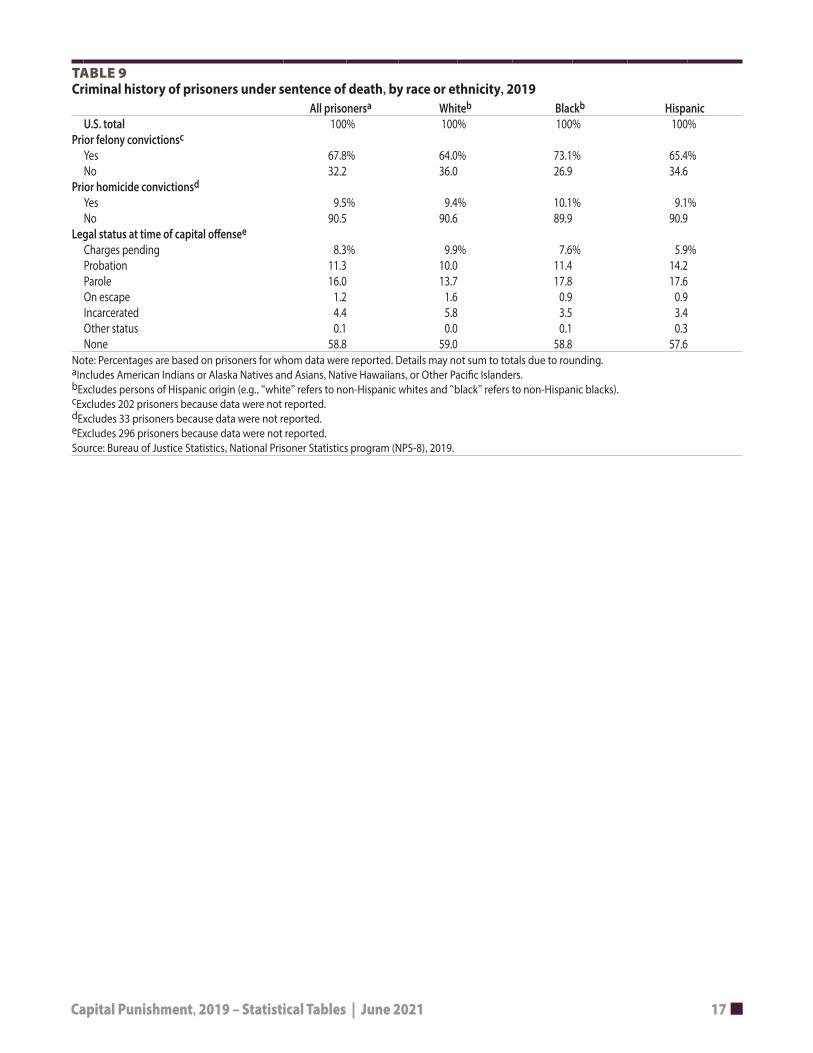
TABLE 9 Criminal history of prisoners under sentence of death, by race or ethnicity, 2019
All prisonersa Whiteb Blackb Hispanic U.S. total 100% 100% 100% 100%
Prior felony convictionsc
Yes 67.8% 64.0% 73.1% 65.4% No 32.2 36.0 26.9 34.6
Prior homicide convictionsd
Yes 9.5% 9.4% 10.1% 9.1% No 90.5 90.6 89.9 90.9
Legal status at time of capital ofensee
Charges pending 8.3% 9.9% 7.6% 5.9% Probation 11.3 10.0 11.4 14.2 Parole 16.0 13.7 17.8 17.6 On escape 1.2 1.6 0.9 0.9 Incarcerated 4.4 5.8 3.5 3.4 Other status 0.1 0.0 0.1 0.3 None 58.8 59.0 58.8 57.6
Note: Percentages are based on prisoners for whom data were reported. Details may not sum to totals due to rounding. aIncludes American Indians or Alaska Natives and Asians, Native Hawaiians, or Other Pacifc Islanders. bExcludes persons of Hispanic origin (e.g., “white” refers to non-Hispanic whites and “black” refers to non-Hispanic blacks). cExcludes 202 prisoners because data were not reported. dExcludes 33 prisoners because data were not reported. eExcludes 296 prisoners because data were not reported. Source: Bureau of Justice Statistics, National Prisoner Statistics program (NPS-8), 2019.
Capital Punishment, 2019 – Statistical Tables | June 2021 18
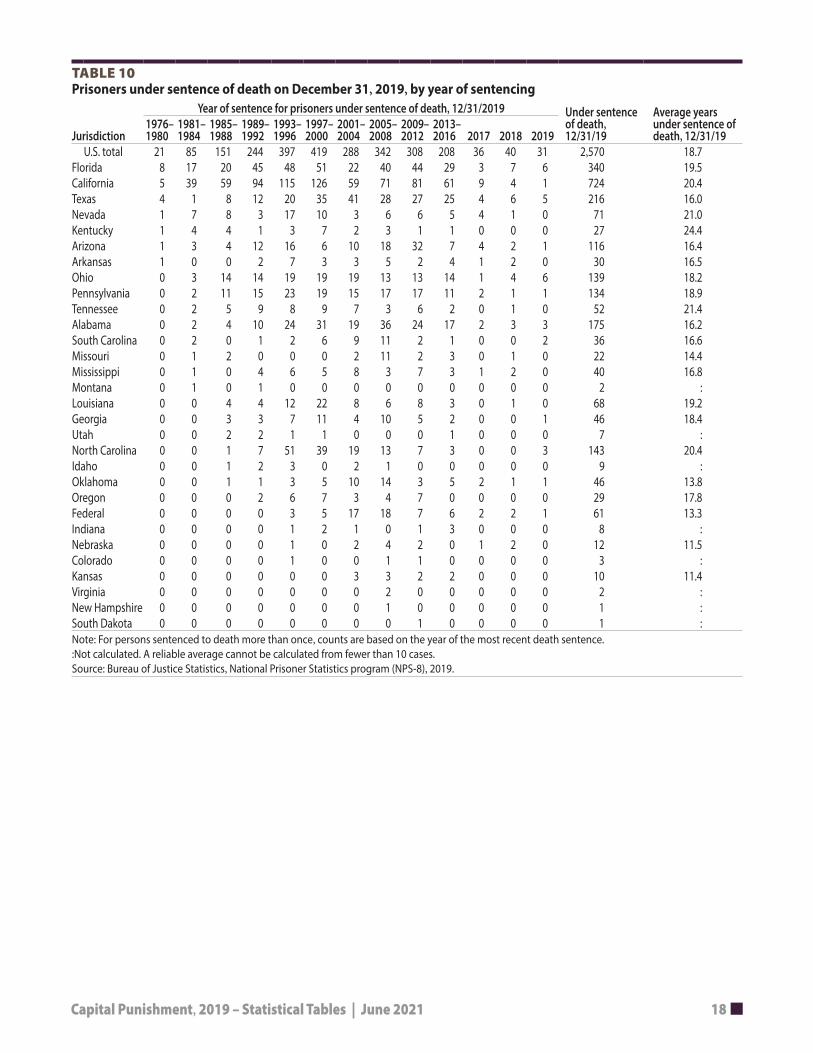
TABLE 10 Prisoners under sentence of death on December 31, 2019, by year of sentencing
Jurisdiction 1976– 1980
Year of sentence for prisoners under sentence of death, 12/31/2019 1981– 1985– 1989– 1993– 1997– 2001– 2005– 2009– 2013– 1984 1988 1992 1996 2000 2004 2008 2012 2016 2017 2018 2019
Under sentence of death,12/31/19
Average years under sentence of death, 12/31/19
U.S. total 21 85 151 244 397 419 288 342 308 208 36 40 31 2,570 18.7 Florida 8 17 20 45 48 51 22 40 44 29 3 7 6 340 19.5 California 5 39 59 94 115 126 59 71 81 61 9 4 1 724 20.4 Texas 4 1 8 12 20 35 41 28 27 25 4 6 5 216 16.0 Nevada 1 7 8 3 17 10 3 6 6 5 4 1 0 71 21.0 Kentucky 1 4 4 1 3 7 2 3 1 1 0 0 0 27 24.4 Arizona 1 3 4 12 16 6 10 18 32 7 4 2 1 116 16.4 Arkansas 1 0 0 2 7 3 3 5 2 4 1 2 0 30 16.5 Ohio 0 3 14 14 19 19 19 13 13 14 1 4 6 139 18.2 Pennsylvania 0 2 11 15 23 19 15 17 17 11 2 1 1 134 18.9 Tennessee 0 2 5 9 8 9 7 3 6 2 0 1 0 52 21.4 Alabama 0 2 4 10 24 31 19 36 24 17 2 3 3 175 16.2 South Carolina 0 2 0 1 2 6 9 11 2 1 0 0 2 36 16.6 Missouri 0 1 2 0 0 0 2 11 2 3 0 1 0 22 14.4 Mississippi 0 1 0 4 6 5 8 3 7 3 1 2 0 40 16.8 Montana 0 1 0 1 0 0 0 0 0 0 0 0 0 2 : Louisiana 0 0 4 4 12 22 8 6 8 3 0 1 0 68 19.2 Georgia 0 0 3 3 7 11 4 10 5 2 0 0 1 46 18.4 Utah 0 0 2 2 1 1 0 0 0 1 0 0 0 7 : North Carolina 0 0 1 7 51 39 19 13 7 3 0 0 3 143 20.4 Idaho 0 0 1 2 3 0 2 1 0 0 0 0 0 9 : Oklahoma 0 0 1 1 3 5 10 14 3 5 2 1 1 46 13.8 Oregon 0 0 0 2 6 7 3 4 7 0 0 0 0 29 17.8 Federal 0 0 0 0 3 5 17 18 7 6 2 2 1 61 13.3 Indiana 0 0 0 0 1 2 1 0 1 3 0 0 0 8 : Nebraska 0 0 0 0 1 0 2 4 2 0 1 2 0 12 11.5 Colorado 0 0 0 0 1 0 0 1 1 0 0 0 0 3 : Kansas 0 0 0 0 0 0 3 3 2 2 0 0 0 10 11.4 Virginia 0 0 0 0 0 0 0 2 0 0 0 0 0 2 : New Hampshire 0 0 0 0 0 0 0 1 0 0 0 0 0 1 : South Dakota 0 0 0 0 0 0 0 0 1 0 0 0 0 1 : Note: For persons sentenced to death more than once, counts are based on the year of the most recent death sentence. :Not calculated. A reliable average cannot be calculated from fewer than 10 cases. Source: Bureau of Justice Statistics, National Prisoner Statistics program (NPS-8), 2019.
Capital Punishment, 2019 – Statistical Tables | June 2021 19
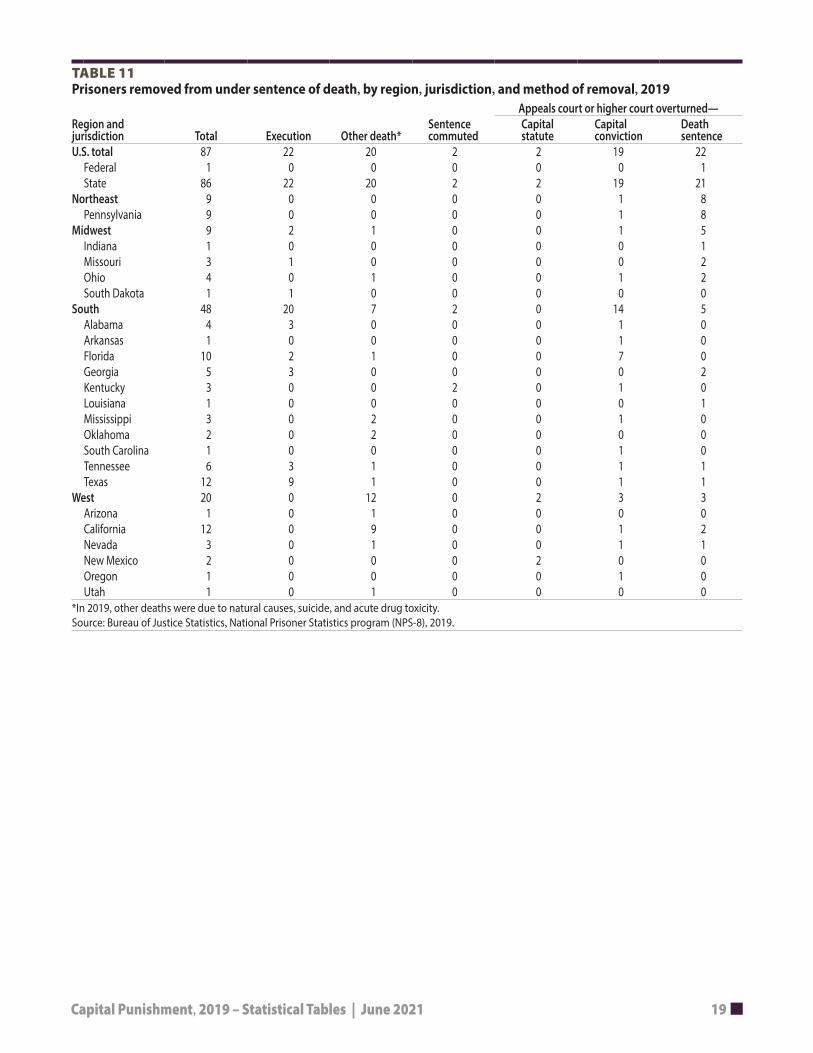
TABLE 11 Prisoners removed from under sentence of death, by region, jurisdiction, and method of removal, 2019
Appeals court or higher court overturned— Region and Sentence jurisdiction Total Execution Other death* commuted
Capital Capital Death statute conviction sentence
U.S. total 87 22 20 2 2 19 22 Federal 1 0 0 0 0 0 1 State 86 22 20 2 2 19 21
Northeast 9 0 0 0 0 1 8 Pennsylvania 9 0 0 0 0 1 8
Midwest 9 2 1 0 0 1 5 Indiana 1 0 0 0 0 0 1 Missouri 3 1 0 0 0 0 2 Ohio 4 0 1 0 0 1 2 South Dakota 1 1 0 0 0 0 0
South 48 20 7 2 0 14 5 Alabama 4 3 0 0 0 1 0 Arkansas 1 0 0 0 0 1 0 Florida 10 2 1 0 0 7 0 Georgia 5 3 0 0 0 0 2 Kentucky 3 0 0 2 0 1 0 Louisiana 1 0 0 0 0 0 1 Mississippi 3 0 2 0 0 1 0 Oklahoma 2 0 2 0 0 0 0 South Carolina 1 0 0 0 0 1 0 Tennessee 6 3 1 0 0 1 1 Texas 12 9 1 0 0 1 1
West 20 0 12 0 2 3 3 Arizona 1 0 1 0 0 0 0 California 12 0 9 0 0 1 2 Nevada 3 0 1 0 0 1 1 New Mexico 2 0 0 0 2 0 0 Oregon 1 0 0 0 0 1 0 Utah 1 0 1 0 0 0 0
*In 2019, other deaths were due to natural causes, suicide, and acute drug toxicity. Source: Bureau of Justice Statistics, National Prisoner Statistics program (NPS-8), 2019.
Capital Punishment, 2019 – Statistical Tables | June 2021 20
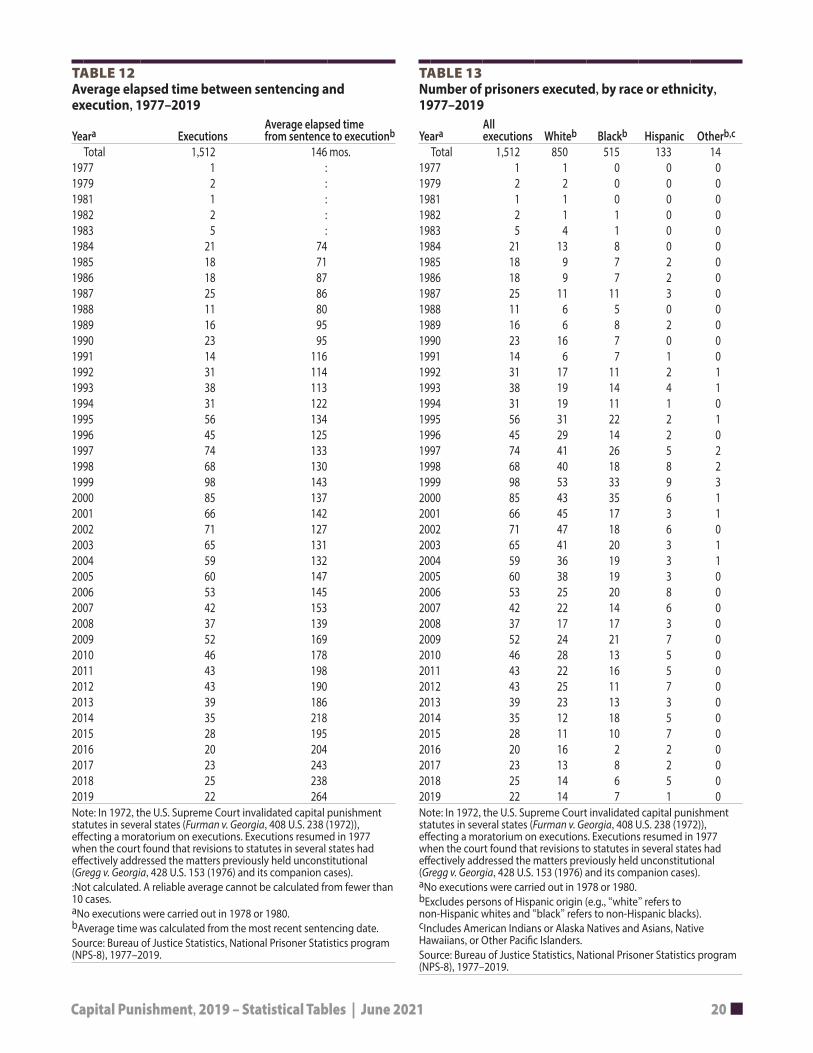
TABLE 12 TABLE 13 Average elapsed time between sentencing and Number of prisoners executed, by race or ethnicity, execution, 1977–2019 1977–2019
Average elapsed time All Yeara Executions from sentence to executionb Yeara executions Whiteb Blackb Hispanic Otherb,c
Total 1,512 146 mos. Total 1,512 850 515 133 14 1977 1 : 1977 1 1 0 0 0 1979 2 : 1979 2 2 0 0 0 1981 1 : 1981 1 1 0 0 0 1982 2 : 1982 2 1 1 0 0 1983 5 : 1983 5 4 1 0 0 1984 21 74 1984 21 13 8 0 0 1985 18 71 1985 18 9 7 2 0 1986 18 87 1986 18 9 7 2 0 1987 25 86 1987 25 11 11 3 0 1988 11 80 1988 11 6 5 0 0 1989 16 95 1989 16 6 8 2 0 1990 23 95 1990 23 16 7 0 0 1991 14 116 1991 14 6 7 1 0 1992 31 114 1992 31 17 11 2 1 1993 38 113 1993 38 19 14 4 1 1994 31 122 1994 31 19 11 1 0 1995 56 134 1995 56 31 22 2 1 1996 45 125 1996 45 29 14 2 0 1997 74 133 1997 74 41 26 5 2 1998 68 130 1998 68 40 18 8 2 1999 98 143 1999 98 53 33 9 3 2000 85 137 2000 85 43 35 6 1 2001 66 142 2001 66 45 17 3 1 2002 71 127 2002 71 47 18 6 0 2003 65 131 2003 65 41 20 3 1 2004 59 132 2004 59 36 19 3 1 2005 60 147 2005 60 38 19 3 0 2006 53 145 2006 53 25 20 8 0 2007 42 153 2007 42 22 14 6 0 2008 37 139 2008 37 17 17 3 0 2009 52 169 2009 52 24 21 7 0 2010 46 178 2010 46 28 13 5 0 2011 43 198 2011 43 22 16 5 0 2012 43 190 2012 43 25 11 7 0 2013 39 186 2013 39 23 13 3 0 2014 35 218 2014 35 12 18 5 0 2015 28 195 2015 28 11 10 7 0 2016 20 204 2016 20 16 2 2 0 2017 23 243 2017 23 13 8 2 0 2018 25 238 2018 25 14 6 5 0 2019 22 264 2019 22 14 7 1 0 Note: In 1972, the U.S. Supreme Court invalidated capital punishment Note: In 1972, the U.S. Supreme Court invalidated capital punishment statutes in several states (Furman v. Georgia, 408 U.S. 238 (1972)), statutes in several states (Furman v. Georgia, 408 U.S. 238 (1972)), efecting a moratorium on executions. Executions resumed in 1977 efecting a moratorium on executions. Executions resumed in 1977 when the court found that revisions to statutes in several states had when the court found that revisions to statutes in several states had efectively addressed the matters previously held unconstitutional efectively addressed the matters previously held unconstitutional (Gregg v. Georgia, 428 U.S. 153 (1976) and its companion cases). (Gregg v. Georgia, 428 U.S. 153 (1976) and its companion cases). :Not calculated. A reliable average cannot be calculated from fewer than aNo executions were carried out in 1978 or 1980. 10 cases. bExcludes persons of Hispanic origin (e.g., “white” refers to aNo executions were carried out in 1978 or 1980. non-Hispanic whites and “black” refers to non-Hispanic blacks). bAverage time was calculated from the most recent sentencing date. cIncludes American Indians or Alaska Natives and Asians, Native Source: Bureau of Justice Statistics, National Prisoner Statistics program Hawaiians, or Other Pacifc Islanders. (NPS-8), 1977–2019. Source: Bureau of Justice Statistics, National Prisoner Statistics program
(NPS-8), 1977–2019.

Capital Punishment, 2019 – Statistical Tables | June 2021 21
TABLE 14 Number of executions, by method and jurisdiction, 1977–2019 Jurisdiction All methods Lethal injection Electrocution Lethal gas Hanging Firing squad
U.S. total 1,512 1,333 162 11 3 3 Federal 3 3 0 0 0 0 Alabama 66 42 24 0 0 0 Arizona 37 35 0 2 0 0 Arkansas 31 30 1 0 0 0 California 13 11 0 2 0 0 Colorado 1 1 0 0 0 0 Connecticut 1 1 0 0 0 0 Delaware 16 15 0 0 1 0 Florida 99 55 44 0 0 0 Georgia 75 52 23 0 0 0 Idaho 3 3 0 0 0 0 Illinois 12 12 0 0 0 0 Indiana 20 17 3 0 0 0 Kentucky 3 2 1 0 0 0 Louisiana 28 8 20 0 0 0 Maryland 5 5 0 0 0 0 Mississippi 21 17 0 4 0 0 Missouri 89 89 0 0 0 0 Montana 3 3 0 0 0 0 Nebraska 4 1 3 0 0 0 Nevada 12 11 0 1 0 0 New Mexico 1 1 0 0 0 0 North Carolina 43 41 0 2 0 0 Ohio 56 56 0 0 0 0 Oklahoma 112 112 0 0 0 0 Oregon 2 2 0 0 0 0 Pennsylvania 3 3 0 0 0 0 South Carolina 43 36 7 0 0 0 South Dakota 5 5 0 0 0 0 Tennessee 12 7 5 0 0 0 Texas 567 567 0 0 0 0 Utah 7 4 0 0 0 3 Virginia 113 82 31 0 0 0 Washington 5 3 0 0 2 0 Wyoming 1 1 0 0 0 0 Note: In 1972, the U.S. Supreme Court invalidated capital punishment statutes in several states (Furman v. Georgia, 408 U.S. 238 (1972)), efecting a moratorium on executions. Executions resumed in 1977 when the court found that revisions to statutes in several states had efectively addressed the matters previously held unconstitutional (Gregg v. Georgia, 428 U.S. 153 (1976) and its companion cases). Source: Bureau of Justice Statistics, National Prisoner Statistics program (NPS-8), 1977–2019.
Capital Punishment, 2019 – Statistical Tables | June 2021 22
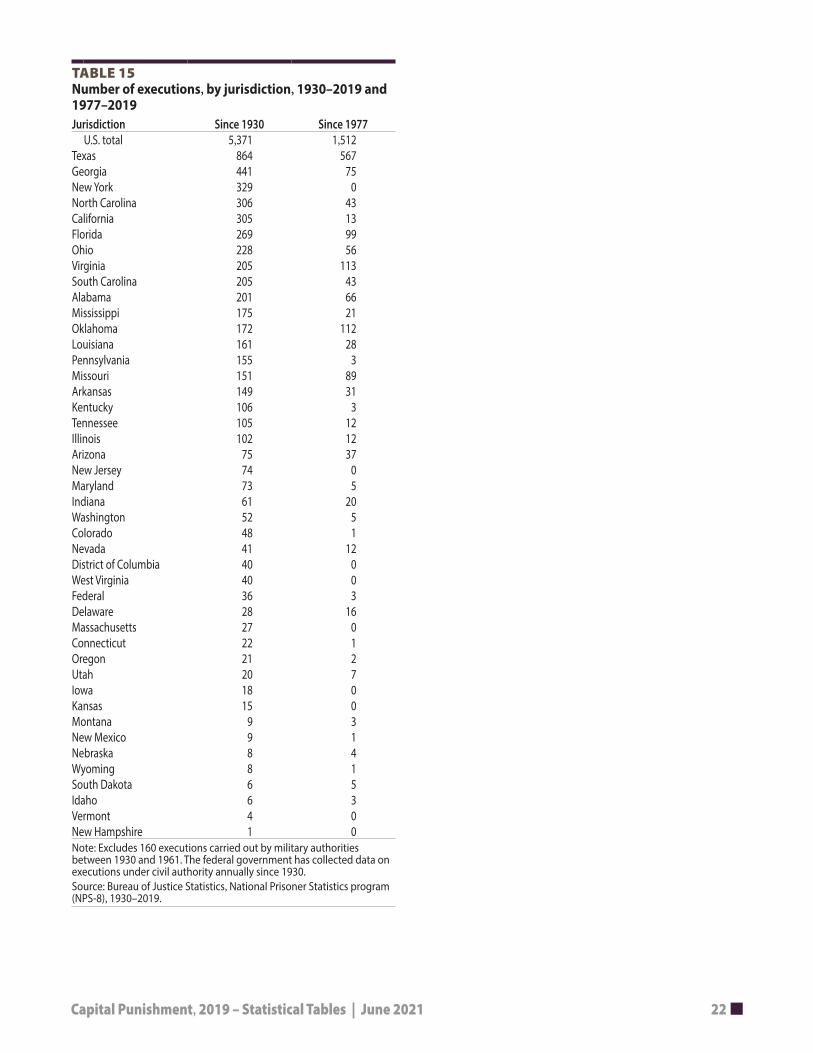
TABLE 15 Number of executions, by jurisdiction, 1930–2019 and 1977–2019 Jurisdiction Since 1930 Since 1977
U.S. total 5,371 1,512 Texas 864 567 Georgia 441 75 New York 329 0 North Carolina 306 43 California 305 13 Florida 269 99 Ohio 228 56 Virginia 205 113 South Carolina 205 43 Alabama 201 66 Mississippi 175 21 Oklahoma 172 112 Louisiana 161 28 Pennsylvania 155 3 Missouri 151 89 Arkansas 149 31 Kentucky 106 3 Tennessee 105 12 Illinois 102 12 Arizona 75 37 New Jersey 74 0 Maryland 73 5 Indiana 61 20 Washington 52 5 Colorado 48 1 Nevada 41 12 District of Columbia 40 0 West Virginia 40 0 Federal 36 3 Delaware 28 16 Massachusetts 27 0 Connecticut 22 1 Oregon 21 2 Utah 20 7 Iowa 18 0 Kansas 15 0 Montana 9 3 New Mexico 9 1 Nebraska 8 4 Wyoming 8 1 South Dakota 6 5 Idaho 6 3 Vermont 4 0 New Hampshire 1 0 Note: Excludes 160 executions carried out by military authorities between 1930 and 1961. The federal government has collected data on executions under civil authority annually since 1930. Source: Bureau of Justice Statistics, National Prisoner Statistics program (NPS-8), 1930–2019.
Capital Punishment, 2019 – Statistical Tables | June 2021 23
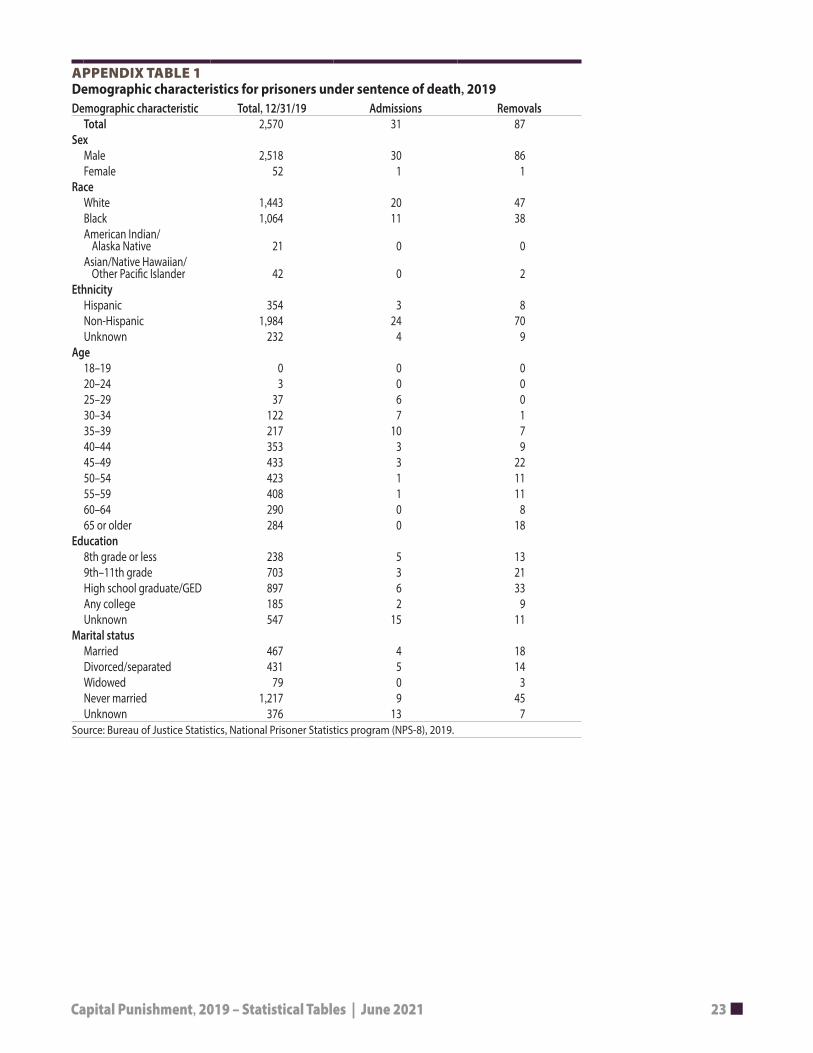
APPENDIX TABLE 1 Demographic characteristics for prisoners under sentence of death, 2019 Demographic characteristic Total, 12/31/19 Admissions Removals
Total Sex
Male Female
Race White Black American Indian/
Alaska Native Asian/Native Hawaiian/
Other Pacifc Islander Ethnicity
Hispanic Non-Hispanic Unknown
Age 18–19 20–24 25–29 30–34 35–39 40–44 45–49 50–54 55–59 60–64 65 or older
Education 8th grade or less 9th–11th grade High school graduate/GED Any college Unknown
Marital status Married Divorced/separated Widowed Never married Unknown
2,570
2,518 52
1,443 1,064
21
42
354 1,984
232
0 3
37 122 217 353 433 423 408 290 284
238 703 897 185 547
467 431
79 1,217
376
31 87
30 86 1 1
20 47 11 38
0 0
0 2
3 8 24 70
4 9
0 0 0 0 6 0 7 1
10 7 3 9 3 22 1 11 1 11 0 8 0 18
5 13 3 21 6 33 2 9
15 11
4 18 5 14 0 3 9 45
13 7 Source: Bureau of Justice Statistics, National Prisoner Statistics program (NPS-8), 2019.
Capital Punishment, 2019 – Statistical Tables | June 2021 24
APPENDIX TABLE 2 Counts for fgure 1: Number of prisoners under sentence of death, 1953–2019 Year Prisoners Year Prisoners Year Prisoners 1953 131 1976 420 1999 3,540 1954 147 1977 423 2000 3,601 1955 125 1978 482 2001 3,577 1956 146 1979 593 2002 3,562 1957 151 1980 692 2003 3,377 1958 147 1981 860 2004 3,320 1959 164 1982 1,066 2005 3,245 1960 212 1983 1,209 2006 3,233 1961 257 1984 1,420 2007 3,215 1962 267 1985 1,575 2008 3,210 1963 297 1986 1,800 2009 3,173 1964 315 1987 1,967 2010 3,139 1965 331 1988 2,117 2011 3,065 1966 406 1989 2,243 2012 3,011 1967 435 1990 2,346 2013 2,983 1968 517 1991 2,465 2014 2,942 1969 575 1992 2,580 2015 2,872 1970 631 1993 2,727 2016 2,797 1971 642 1994 2,905 2017 2,703 1972 334 1995 3,064 2018 2,626 1973 134 1996 3,242 2019 2,570 1974 244 1997 3,328 1975 488 1998 3,465 Note: Data on the number of prisoners under sentence of death at year-end have been collected since 1953. Source: Bureau of Justice Statistics, National Prisoner Statistics program (NPS-8), 1953–2019.
APPENDIX TABLE 3 Counts for fgure 2: Admissions to and removals from under sentence of death, 1973–2019 Year Admissions Removals Year Admissions Removals Year Admissions Removals 1973 44 240 1989 275 149 2005 143 216 1974 161 55 1990 270 152 2006 126 146 1975 318 67 1991 284 159 2007 129 140 1976 249 317 1992 300 173 2008 122 137 1977 159 156 1993 299 162 2009 118 166 1978 211 150 1994 330 153 2010 116 143 1979 172 61 1995 325 171 2011 84 155 1980 202 101 1996 323 155 2012 85 124 1981 249 84 1997 282 187 2013 85 118 1982 287 79 1998 312 175 2014 70 116 1983 266 123 1999 287 220 2015 54 122 1984 306 90 2000 235 173 2016 33 99 1985 292 130 2001 164 194 2017 37 133 1986 319 109 2002 172 191 2018 41 117 1987 311 142 2003 157 348 2019 31 87 1988 317 165 2004 139 197 Note: Removals can be due to any cause, including execution, other death, or appeal. Source: Bureau of Justice Statistics, National Prisoner Statistics program (NPS-8), 1973–2019.
Capital Punishment, 2019 – Statistical Tables | June 2021 25
1930
1935
1940
1945
1950
1955
1960
1965
1970
1975
1980
1985
1990
1995
2000
2005
2010
2015
APPENDIX TABLE 4 Counts for fgure 3: Number of prisoners executed under civil authority in the United States, 1930–2019 Year Executions Year Executions Year Executions
155 56 23 1931 153 1961 42 1991 14 1932 140 1962 47 1992 31 1933 160 1963 21 1993 38 1934 168 1964 15 1994 31
199 7 56 1936 195 1966 1 1996 45 1937 147 1967 2 1997 74 1938 190 1968 0 1998 68 1939 160 1969 0 1999 98
124 0 85 1941 123 1971 0 2001 66 1942 147 1972 0 2002 71 1943 131 1973 0 2003 65 1944 120 1974 0 2004 59
117 0 60 1946 131 1976 0 2006 53 1947 153 1977 1 2007 42 1948 119 1978 0 2008 37 1949 119 1979 2 2009 52
82 0 46 1951 105 1981 1 2011 43 1952 83 1982 2 2012 43 1953 62 1983 5 2013 39 1954 81 1984 21 2014 35
76 18 28 1956 65 1986 18 2016 20 1957 65 1987 25 2017 23 1958 49 1988 11 2018 25 1959 49 1989 16 2019 22 Note: Excludes 160 executions carried out by military authorities from 1930 to 1961. Source: Bureau of Justice Statistics, National Prisoner Statistics program (NPS-8), 1930–2019.
Capital Punishment, 2019 – Statistical Tables | June 2021 26
APPENDIX TABLE 5 Counts for fgure 4: Number of prisoners under sentence of death, by race, 1968–2019 Year Whitea Blacka Othera,b Year Whitea Blacka Othera,b
1968 243 271 3 1994 1,653 1,203 49 1969 263 310 2 1995 1,732 1,284 48 1970 293 335 3 1996 1,833 1,358 51 1971 306 332 4 1997 1,864 1,408 56 1972 167 166 1 1998 1,917 1,489 59 1973 64 68 2 1999 1,960 1,515 65 1974 110 128 6 2000 1,989 1,541 71 1975 218 262 8 2001 1,968 1,538 71 1976 225 195 0 2002 1,939 1,551 72 1977 229 192 2 2003 1,882 1,417 78 1978 281 197 4 2004 1,856 1,390 74 1979 354 236 3 2005 1,802 1,366 77 1980 424 264 4 2006 1,806 1,353 74 1981 499 353 8 2007 1,806 1,338 71 1982 613 441 12 2008 1,795 1,343 72 1983 692 505 12 2009 1,779 1,318 76 1984 806 598 16 2010 1,743 1,309 87 1985 896 664 15 2011 1,721 1,274 70 1986 1,013 762 25 2012 1,684 1,258 69 1987 1,128 813 26 2013 1,670 1,251 62 1988 1,235 848 34 2014 1,647 1,233 62 1989 1,308 898 37 2015 1,606 1,202 64 1990 1,368 940 38 2016 1,553 1,179 65 1991 1,449 979 37 2017 1,508 1,129 66 1992 1,511 1,031 38 2018 1,470 1,091 65 1993 1,575 1,111 41 2019 1,443 1,064 63 Note: Data on Hispanic origin was not collected prior to 1977. aIncludes persons of Hispanic origin. bIncludes American Indians or Alaska Natives; Asians, Native Hawaiians, or Other Pacifc Islanders; and persons for whom only ethnicity was identifed. Source: Bureau of Justice Statistics, National Prisoner Statistics program (NPS-8), 1968–2019.
Ofce of Justice Programs Building Solutions • Supporting Communities • Advancing Justice
www.ojp.gov
Te Bureau of Justice Statistics of the U.S. Department of Justice is the principal federal agency responsible for measuring crime, criminal victimization, criminal ofenders, victims of crime, correlates of crime, and the operation of criminal and civil justice systems at the federal, state, tribal, and local levels. BJS collects, analyzes, and disseminates reliable statistics on crime and justice systems in the United States, supports improvements to state and local criminal justice information systems, and participates with national and international organizations to develop and recommend national standards for justice statistics. Doris J. James is the acting director.
Tis report was written by Tracy L. Snell. Todd D. Minton, Lauren G. Beatty, and Stephanie Mueller verifed the report.
Eric Hendrixson edited the report. Carrie Epps-Carey produced the report.
June 2021, NCJ 300381