statistical tables from the 1999 unesco statistical yearbook
TRANSCRIPT

Statistical tables from the 1999 UNESCO Statistical Yearbook
Notes and explanations on country tables - Notes et explications sur les tableaux parpays - Notas y explicaciones sobre tablas de los países
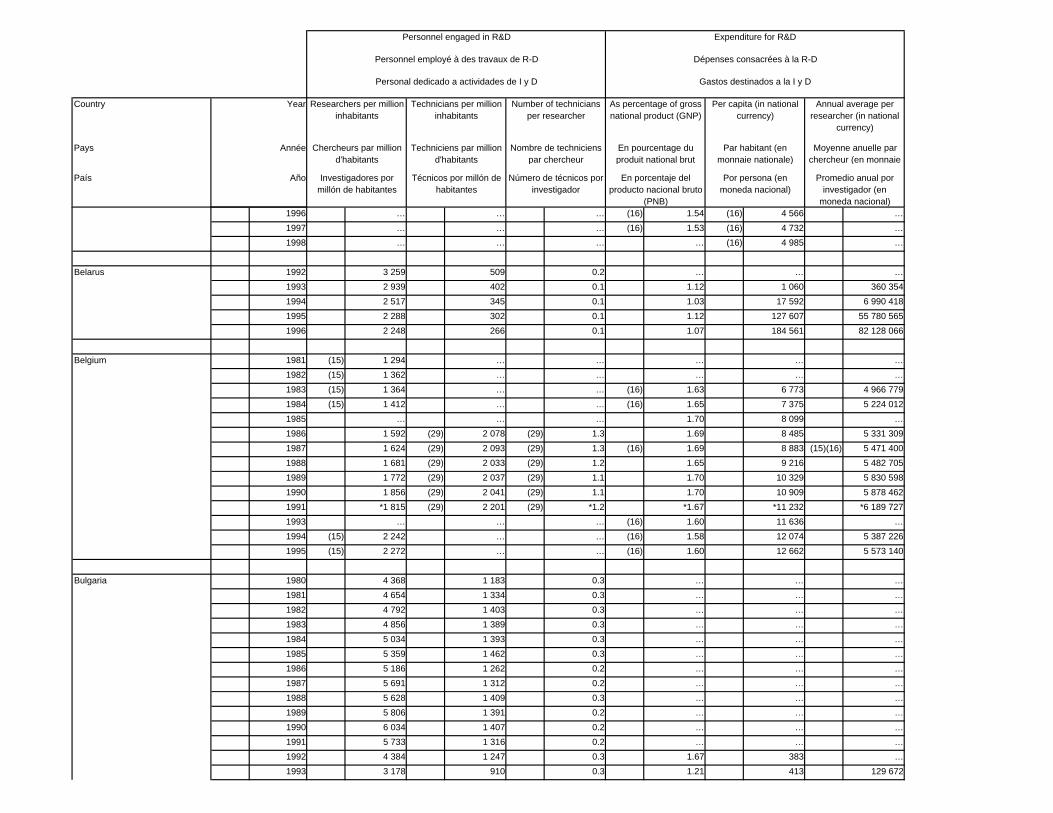
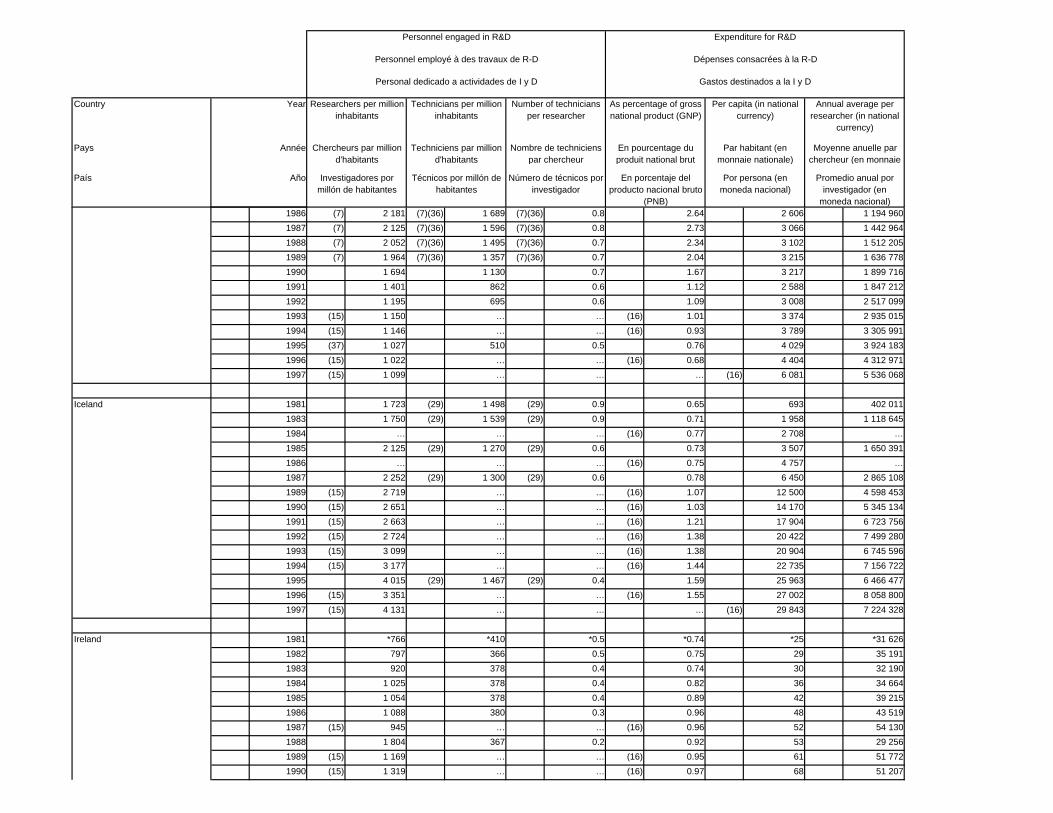
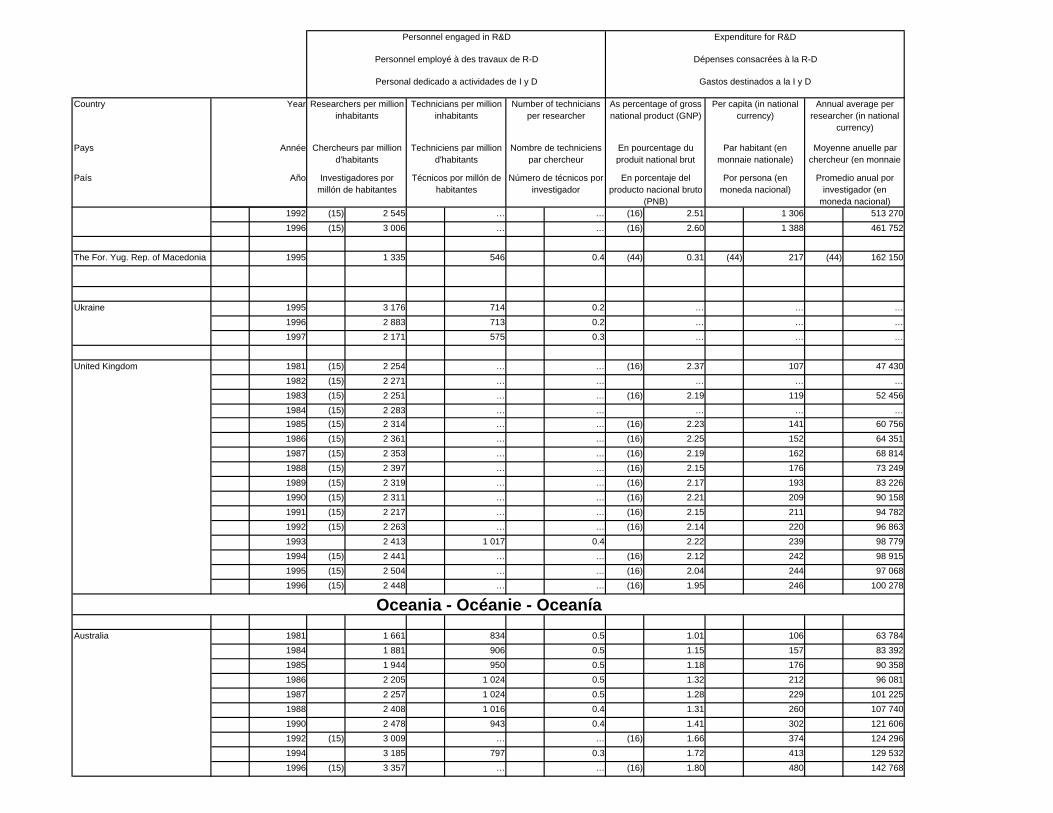
Table III.1 Selected R&D indicators - Indicateurs sélectionnés de R-D - Indicadores seleccionados de I y D
This table presents selected R&D indicators including the number of researchers and R&D technicians per million inhabitants, number of R&Dtechnicians per researcher, R&D expenditure as percentage of GNP, and R&D expenditure per capita and per researcher in national currency. For the indication of national currencies please refer to Table III.3.
Researchers are professionals engaged in the conception or creation of new knowledge, products, processes, methods and systems, and in theplanning and management of R&D projects. Post-graduate students engaged in R&D are considered as researchers.
Technicians (and equivalent staff) comprise persons whose main tasks require technical knowledge and experience in one or more fields ofengineering, physical and life sciences, or social sciences and humanities. They participate in R&D by performing scientific and technical tasksinvolving the application of concepts and operational methods, normally under the supervision of researchers. As distinguished from technicians participating in R&D under the supervision of researchers in engineering, physical and life sciences, equivalent staff perform the corresponding R&Dtasks in the social sciences and humanities.
Other supporting staff includes skilled and unskilled craftsmen, secretarial and clerical staff participating in or directly associated with R&D projects.Included in this category are all managers and administrators dealing mainly with financial and personnel matters and general administration, insofaras their activities are a direct service to R&D.
III.2 Personnel engaged in R&D by category of personnel - Personnel employé dans la R-D par catégoriede personnel - Personal empleado en I y D por categoría de personal
This table gives the total number of researchers, R&D technicians, and other supporting staff as defined above. Data on female R&D personnel bycategory are also shown when available.
Table III.3 Percentage distribution of gross domestic expenditure on R&D by source of funds - Répartitionen pourcentage des dépenses intérieures brutes de R-D par source de fonds - Distribución porcentual delgasto interior bruto en I y D por origen de fondos
Gross domestic expenditure on R&D (GERD) is total intramural expenditure on R&D performed on the national territory during a given period. Itincludes R&D performed within a country and funded from abroad but excludes payments made abroad for R&D.
The sources of funds for GERD are classified according to the following five categories:
Business enterprise funds include funds allocated to R&D by all firms, organizations and institutions whose primary activity is the market productionof goods and services (other than the higher education sector) for sale to the general public at an economically significant price, and those privatenon-profit institutes mainly serving these firms, organizations and institutions.
Government funds refer to funds allocated to R&D by the central (federal), state or local government authorities. These includes all departments,offices and other bodies which furnish but normally do not sell to the community those common services, other than higher education, which cannotbe conveniently and economically provided and administer the state and the economic and social policy of the community. Public enterprises fundsare included in the business enterprise funds sector. These authorities also include private non-profit institutes controlled and mainly financed bygovernment.
Higher education funds include funds allocated to R&D by institutions of higher education comprising all universities, colleges of technology, otherinstitutes of post-secondary education, and all research institutes, experimental stations and clinics operating under the direct control of oradministered by or associated with higher educational establishments.
Private non-profit funds are funds allocated to R&D by non-market, private non-profit institutions serving the general public, as well as by privateindividuals and households.
Funds from abroad refer to funds allocated to R&D by institutions and individuals located outside the political frontiers of a country except forvehicles, ships, aircraft and space satellites operated by domestic organisations and testing grounds acquired by such organisations, and by allinternational organizations (except business enterprises) including their facilities and operations within the frontiers of a country.

Statistical tables from the 1999 UNESCO Statistical Yearbook
Selected R&D indicators
Indicateurs sélectionnés de R-D
Indicadores seleccionados de I y D
Country
Pays
País
Benin 1989 176 54 0.3 … … …
1993 … … … 0.13 100 …
1994 … … … 0.07 67 …
1995 … … … 0.08 81 …
1996 16 15 1.0 0.17 196 12 932 444
1997 17 16 0.9 0.19 240 14 695 807
1984 (1)(2) 25 (1)(2) 20 (1)(2) 0.8 0.15 38 1 519 272
1989 (1)(2) 33 (1)(2) 32 (1)(2) 1.0 0.31 101 3 154 042
1984 78 66 0.8 0.25 268 3 473 424
1990 56 32 0.6 … … …
1983 (3) 435 … … (4) 0.01 (4) 19 (4) 42 718
1984 (1) 462 (1) 789 (1) 1.7 0.01 14 29 618
1982 434 146 0.3 … … …
1983 423 142 0.3 … … …
1986 410 132 0.3 … … …
1990 437 305 0.7 … … …
1991 459 341 0.7 … … …
1992 … … … 0.20 5 …
1993 … … … 0.20 6 …
1994 … … … 0.22 7 …
1995 … … … 0.22 7 …
1996 … … … 0.22 8 …
1983 (1) 231 (1)(5) 31 0.1 … … …
Burkina Faso
Burundi
Central African Republic
Congo
Egypt
Gabon
Année
Año
Year
(1)
Por persona (en moneda nacional)
Annual average per researcher (in national
currency)
Moyenne anuelle par chercheur (en monnaie
Promedio anual por investigador (en
moneda nacional)
Per capita (in national currency)
Par habitant (en monnaie nationale)
Número de técnicos por investigador
En pourcentage du produit national brut
As percentage of gross national product (GNP)
En porcentaje del producto nacional bruto
(PNB)
Number of technicians per researcher
Nombre de techniciens par chercheur
Investigadores por millón de habitantes
Technicians per million inhabitants
Techniciens par million d'habitants
Técnicos por millón de habitantes
Chercheurs par million d'habitants
Gastos destinados a la I y D
Expenditure for R&D
Dépenses consacrées à la R-D
Personnel engaged in R&D
Personnel employé à des travaux de R-D
Personal dedicado a actividades de I y D
III.1
Africa - Afrique - África
Researchers per million inhabitants

Country
Pays
País
Année
Año
Year
Por persona (en moneda nacional)
Annual average per researcher (in national
currency)
Moyenne anuelle par chercheur (en monnaie
Promedio anual por investigador (en
moneda nacional)
Per capita (in national currency)
Par habitant (en monnaie nationale)
Número de técnicos por investigador
En pourcentage du produit national brut
As percentage of gross national product (GNP)
En porcentaje del producto nacional bruto
(PNB)
Number of technicians per researcher
Nombre de techniciens par chercheur
Investigadores por millón de habitantes
Technicians per million inhabitants
Techniciens par million d'habitants
Técnicos por millón de habitantes
Chercheurs par million d'habitants
Gastos destinados a la I y D
Expenditure for R&D
Dépenses consacrées à la R-D
Personnel engaged in R&D
Personnel employé à des travaux de R-D
Personal dedicado a actividades de I y D
Researchers per million inhabitants
1984 (1) 221 (1)(5) 30 0.1 (2) 0.01 (2) 1 (2) 2 413
1985 (1) 235 (1)(5) 28 0.1 (2) 0.01 (2) 1 (2) 2 256
1986 (1) 255 (1)(5) 25 0.1 (2) 0.01 (2) 1 (2) 1 801
1987 (1) 234 (1)(5) 22 0.1 … … …
Libyan Arab Jamahiriya 1980 362 493 1.4 0.22 8 20 796
1980 (1)(7) 13 (1)(7) 42 (1)(7) 3.3 0.17 157 12 427 492
1985 16 67 4.4 … … …
1986 17 64 3.9 … … …
1987 20 65 3.4 … … …
1988 21 67 3.2 … … …
1989 24 85 3.6 … … …
1994 12 37 3.0 … … …
1995 … … … 0.18 1 636 …
1980 158 112 0.7 0.43 38 240 132
1981 187 109 0.6 0.54 54 287 913
1982 175 171 1.0 0.51 57 325 434
1983 212 166 0.8 0.32 39 180 569
1984 262 175 0.7 0.29 39 147 149
1985 263 188 0.7 0.17 26 97 379
1986 298 177 0.6 0.28 52 173 443
1987 227 167 0.7 0.53 122 535 043
1988 223 112 0.5 0.21 56 249 351
1989 185 165 0.9 (44) 0.32 (44) 100 (44) 540 415
1992 361 158 0.4 … … …
1983 24 140 5.8 0.24 2 77 857
1984 23 132 5.9 0.17 2 60 371
1985 19 87 4.6 0.12 2 58 335
1986 20 78 4.0 0.12 2 53 582
1987 15 76 5.3 0.09 2 75 809
1980 10 7 0.8 … … …
1982 12 8 0.7 0.21 48 4 228 549
1983 12 10 0.9 0.21 51 4 436 250
1984 12 11 0.9 0.17 45 3 778 986
1985 … … … 0.54 152 12 937 465
Nigeria (10)
Rwanda
Madagascar
Mauritius
(9)
(9)
(6)
(1)(8)

Country
Pays
País
Année
Año
Year
Por persona (en moneda nacional)
Annual average per researcher (in national
currency)
Moyenne anuelle par chercheur (en monnaie
Promedio anual por investigador (en
moneda nacional)
Per capita (in national currency)
Par habitant (en monnaie nationale)
Número de técnicos por investigador
En pourcentage du produit national brut
As percentage of gross national product (GNP)
En porcentaje del producto nacional bruto
(PNB)
Number of technicians per researcher
Nombre de techniciens par chercheur
Investigadores por millón de habitantes
Technicians per million inhabitants
Techniciens par million d'habitants
Técnicos por millón de habitantes
Chercheurs par million d'habitants
Gastos destinados a la I y D
Expenditure for R&D
Dépenses consacrées à la R-D
Personnel engaged in R&D
Personnel employé à des travaux de R-D
Personal dedicado a actividades de I y D
Researchers per million inhabitants
1995 35 8 0.2 (11) 0.04 (11) 20 (11) 555 564
1993 3 5 1.6 0.02 29 11 450 550
1994 3 4 1.7 0.02 35 14 852 632
1995 3 4 1.5 0.02 55 24 105 264
1996 3 4 1.5 0.02 48 21 587 369
1997 … … … 0.01 … …
1980 32 16 0.5 … … …
1981 32 16 0.5 … … …
1983 282 94 0.3 … … …
1991 58 143 2.5 … … …
1983 270 164 0.6 0.88 27 96 919
1985 324 197 0.6 0.93 36 108 316
1987 359 175 0.5 0.84 42 115 889
1989 298 138 0.5 0.77 54 178 894
1991 349 145 0.4 0.93 81 230 217
1993 1 031 315 0.3 0.70 72 69 750
1989 81 54 0.7 0.79 974 11 985 560
1994 98 63 0.6 0.48 627 6 395 349
1993 111 56 0.5 0.30 5 42 303
1994 115 61 0.5 0.32 6 46 656
1995 117 58 0.5 0.33 6 51 010
1996 120 58 0.5 0.33 7 53 550
1997 125 57 0.5 0.30 7 52 415
1992 … … … 0.58 887 …
1993 17 13 0.7 0.60 1 267 76 003 725
1994 19 14 0.7 0.66 1 553 83 044 826
1995 20 16 0.8 0.60 1 660 86 802 293
1996 20 15 0.7 0.57 1 792 90 327 798
1997 21 14 0.6 … … …
1981 (15) 1 573 … … (16) 1.30 178 113 032Canada
South Africa
Togo
Tunisia
Uganda
Senegal (45)
Seychelles
North America - Amérique du Nord - América del Norte

Country
Pays
País
Année
Año
Year
Por persona (en moneda nacional)
Annual average per researcher (in national
currency)
Moyenne anuelle par chercheur (en monnaie
Promedio anual por investigador (en
moneda nacional)
Per capita (in national currency)
Par habitant (en monnaie nationale)
Número de técnicos por investigador
En pourcentage du produit national brut
As percentage of gross national product (GNP)
En porcentaje del producto nacional bruto
(PNB)
Number of technicians per researcher
Nombre de techniciens par chercheur
Investigadores por millón de habitantes
Technicians per million inhabitants
Techniciens par million d'habitants
Técnicos por millón de habitantes
Chercheurs par million d'habitants
Gastos destinados a la I y D
Expenditure for R&D
Dépenses consacrées à la R-D
Personnel engaged in R&D
Personnel employé à des travaux de R-D
Personal dedicado a actividades de I y D
Researchers per million inhabitants
1982 1 794 909 0.5 *1.42 *203 *113 086
1983 1 819 894 0.5 1.37 211 115 984
1984 1 919 945 0.5 1.41 235 122 281
1985 2 047 996 0.5 1.46 259 126 347
1986 2 151 1 013 0.5 1.49 275 127 765
1987 2 196 1 047 0.5 1.43 284 128 946
1988 2 246 1 042 0.5 1.39 299 132 795
1989 2 265 1 056 0.5 1.41 321 141 596
1990 2 301 1 004 0.4 1.51 347 150 493
1991 2 320 977 0.4 1.55 356 153 390
1992 … … … 1.57 361 …
1993 2 648 1 070 0.4 *1.55 *366 *137 950
1994 (15) 2 660 … … (16) 1.69 411 154 213
1995 (15) 2 719 … … (16) 1.68 421 154 838
1996 … … … 1.65 420 …
1997 … … … (16) 1.66 446 …
1998 … … … … (16) 455 …
1988 532 … … … … …
1989 … … … 0.18 238 …
1990 … … … 0.17 275 …
1991 … … … 0.21 439 …
1980 581 676 1.2 0.55 10 17 011
1981 699 814 1.2 0.51 12 16 333
1982 761 819 1.1 0.57 14 17 483
1983 830 846 1.0 0.59 15 17 363
1984 953 883 0.9 0.64 17 17 198
1985 1 019 914 0.9 0.68 19 17 708
1986 986 851 0.9 0.78 21 20 348
1987 1 088 869 0.8 0.93 23 …
1988 … … … 0.81 21 …
1989 1 145 839 0.7 0.84 22 18 421
1991 1 535 893 0.6 … 18 11 337
1992 1 370 878 0.6 … 23 16 786
1995 1 612 1 121 0.7 … 18 10 683
1980 (20) 117 338 2.9 … … …
1981 (20) 122 425 3.5 … … …
Costa Rica
Cuba
(17)
(17)
(17)
(17)
(17)
(17)
(17)
(17)
(17)
(17)
(17)
(1)
(19)
(19)
(19)
El Salvador

Country
Pays
País
Année
Año
Year
Por persona (en moneda nacional)
Annual average per researcher (in national
currency)
Moyenne anuelle par chercheur (en monnaie
Promedio anual por investigador (en
moneda nacional)
Per capita (in national currency)
Par habitant (en monnaie nationale)
Número de técnicos por investigador
En pourcentage du produit national brut
As percentage of gross national product (GNP)
En porcentaje del producto nacional bruto
(PNB)
Number of technicians per researcher
Nombre de techniciens par chercheur
Investigadores por millón de habitantes
Technicians per million inhabitants
Techniciens par million d'habitants
Técnicos por millón de habitantes
Chercheurs par million d'habitants
Gastos destinados a la I y D
Expenditure for R&D
Dépenses consacrées à la R-D
Personnel engaged in R&D
Personnel employé à des travaux de R-D
Personal dedicado a actividades de I y D
Researchers per million inhabitants
1986 … … … (21) 1.94 (21) 70 …
1987 (20) 39 356 9.2 (21) 1.79 (21) 74 (21) 1 886 725
1992 (21) 20 … … (8) 2.20 (8) 204 (8) 10 623 128
1983 … … … 0.51 7 16 598
1988 104 112 1.1 (22) 0.16 (22) 4 (22) 37 132
1982 11 6 0.5 0.06 2 131 125
1983 12 9 0.7 0.07 2 149 539
1984 11 10 0.9 0.07 3 218 827
1985 10 14 1.5 0.04 2 171 667
1986 8 7 0.8 0.04 2 223 112
1984 226 399 1.8 0.58 2 156 9 552 791
1985 … … … 0.44 2 582 …
1986 … … … 0.34 3 183 …
1987 … … … 0.31 7 228 …
1988 … … … 0.22 10 926 …
1993 161 108 0.7 0.23 32 196 038
1994 191 106 0.6 0.31 47 244 339
1995 214 74 0.3 0.33 63 292 645
1985 191 63 0.3 … … …
1987 204 85 0.4 … … …
1986 … … … 0.01 1 …
1981 252 … … … … …
1980 2 859 … … (27) 2.32 (27) 277 (27) 96 873
1981 2 973 … … (27) 2.40 (27) 317 (27) 106 649
1982 2 993 … … (27) 2.54 (27) 345 (27) 115 255
1983 3 047 … … (27) 2.58 (27) 375 (27) 123 172
1984 3 332 … … 2.72 435 130 497
1985 3 512 … … 2.87 483 137 537
1986 3 671 … … 2.87 503 137 090
1987 3 744 … … 2.88 531 141 785
1988 3 811 … … 2.84 *559 *146 708
1989 (15) 3 675 … … (16) 2.72 572 155 460
1990 … … … (16) 2.77 608 …
Guatemala
Jamaica (23)
Mexico
Nicaragua
Panama
United States
(4)(5)
(1)
(26)
(26)
(26)
(26)
(26)
(26)
(26)
(26)
(26)

Country
Pays
País
Année
Año
Year
Por persona (en moneda nacional)
Annual average per researcher (in national
currency)
Moyenne anuelle par chercheur (en monnaie
Promedio anual por investigador (en
moneda nacional)
Per capita (in national currency)
Par habitant (en monnaie nationale)
Número de técnicos por investigador
En pourcentage du produit national brut
As percentage of gross national product (GNP)
En porcentaje del producto nacional bruto
(PNB)
Number of technicians per researcher
Nombre de techniciens par chercheur
Investigadores por millón de habitantes
Technicians per million inhabitants
Techniciens par million d'habitants
Técnicos por millón de habitantes
Chercheurs par million d'habitants
Gastos destinados a la I y D
Expenditure for R&D
Dépenses consacrées à la R-D
Personnel engaged in R&D
Personnel employé à des travaux de R-D
Personal dedicado a actividades de I y D
Researchers per million inhabitants
1991 (15) 3 743 … … (16) 2.81 626 167 259
1992 … … … (16) 2.74 639 …
1993 3 676 … … (16) 2.61 633 172 042
1994 … … … (16) 2.52 639 …
1995 … … … (16) 2.61 688 …
1996 … … … (16) 2.64 720 …
1997 … … … (16) 2.63 … …
1982 363 … … … … …
1985 *357 *235 *0.7 … … …
1988 *351 *198 *0.6 … … …
1995 660 147 0.2 0.38 30 44 915
1990 … … … 1.30 27 …
1991 (12) 250 (12) 154 (12) 0.6 1.67 43 168 293
1992 158 … … … … …
1993 159 … … … … …
1994 164 … … … … …
1995 162 … … … … …
1996 172 … … … … …
1981 175 … … … … …
1982 256 … … … … …
1983 299 … … … … …
1984 362 … … … … …
1985 391 … … … … …
1994 … … … 0.82 18 …
1995 (14) 168 (14) 59 (14) 0.3 0.84 33 194 140
1996 … … … 0.81 37 …
1980 358 … … … … …
1985 429 … … … … …
1987 435 … … … … …
1988 366 233 0.6 … … …
1989 412 … … … … …
1990 423 … … … … …
Bolivia
Chile
Brazil
(1)
(1)
(1)
(1)
(1)
(1)
(1)(13)
(1)(13)
(1)(13)
(1)(13)
(1)(13)
South America - Amérique du Sud - América del Sur
Argentina

Country
Pays
País
Année
Año
Year
Por persona (en moneda nacional)
Annual average per researcher (in national
currency)
Moyenne anuelle par chercheur (en monnaie
Promedio anual por investigador (en
moneda nacional)
Per capita (in national currency)
Par habitant (en monnaie nationale)
Número de técnicos por investigador
En pourcentage du produit national brut
As percentage of gross national product (GNP)
En porcentaje del producto nacional bruto
(PNB)
Number of technicians per researcher
Nombre de techniciens par chercheur
Investigadores por millón de habitantes
Technicians per million inhabitants
Techniciens par million d'habitants
Técnicos por millón de habitantes
Chercheurs par million d'habitants
Gastos destinados a la I y D
Expenditure for R&D
Dépenses consacrées à la R-D
Personnel engaged in R&D
Personnel employé à des travaux de R-D
Personal dedicado a actividades de I y D
Researchers per million inhabitants
1991 430 … … … … …
1992 433 … … … … …
1993 438 … … 0.90 11 584 26 465 080
1994 445 … … 0.83 12 538 28 193 782
1995 … … … 0.67 12 017 …
1996 … … … 0.68 13 879 …
Colombia 1982 37 35 0.9 0.12 93 2 543 189
1990 102 … … … … …
1993 … … … 0.01 69 …
1994 … … … 0.01 171 …
1995 133 42 0.3 0.02 387 2 921 490
1996 … … … 0.01 461 …
1997 146 … … 0.02 1 318 9 273 748
1980 124 330 2.7 0.06 2 8 766
1982 115 230 2.0 0.23 4 31 461
1981 … … … 0.30 2 3 954
1982 … … … 0.27 3 …
1983 … … … 0.29 5 …
1984 … … … 0.25 9 …
1994 *631 *189 *0.3 … … …
1996 232 10 … … … …
1997 233 … … … … …
Uruguay 1987 687 … … … … …
1980 … … … 0.29 57 (1) 231 767
1981 … … … 0.30 65 …
1982 … … … 0.35 73 …
1983 … … … 0.36 74 (1) 261 931
1984 … … … 0.34 82 …
1985 … … … 0.32 83 …
1986 … … … 0.28 74 …
1987 … … … (28) 0.37 (28) 137 …
1988 … … … (28) 0.39 (28) 176 …
1989 … … … (28) 0.27 (28) 205 …
Peru
Venezuela (19)
Ecuador
Guyana (3)
(18)
(1)
(24)
(24)
(24)
(24)
(25)
(25)

Country
Pays
País
Année
Año
Year
Por persona (en moneda nacional)
Annual average per researcher (in national
currency)
Moyenne anuelle par chercheur (en monnaie
Promedio anual por investigador (en
moneda nacional)
Per capita (in national currency)
Par habitant (en monnaie nationale)
Número de técnicos por investigador
En pourcentage du produit national brut
As percentage of gross national product (GNP)
En porcentaje del producto nacional bruto
(PNB)
Number of technicians per researcher
Nombre de techniciens par chercheur
Investigadores por millón de habitantes
Technicians per million inhabitants
Techniciens par million d'habitants
Técnicos por millón de habitantes
Chercheurs par million d'habitants
Gastos destinados a la I y D
Expenditure for R&D
Dépenses consacrées à la R-D
Personnel engaged in R&D
Personnel employé à des travaux de R-D
Personal dedicado a actividades de I y D
Researchers per million inhabitants
1990 … … … (28) 0.54 (28) 608 …
1991 *214 *33 *0.2 (28) 0.49 (28) 717 (28) *3 361 555
1992 *209 *32 *0.2 (28) 0.49 (28) 960 …
Armenia 1997 1 485 177 0.1 … … …
1993 3 302 268 0.1 0.55 127 38 379
1994 3 103 197 0.1 0.32 886 285 316
1995 2 850 180 0.1 0.19 3 138 1 101 267
1996 2 791 188 0.1 0.21 4 226 1 514 223
1993 51 32 0.6 0.01 1 7 072
1994 47 18 0.4 0.04 3 57 981
1995 52 33 0.6 0.03 3 45 036
1988 … … … 0.67 9 …
1989 … … … 0.67 10 …
1990 … … … 0.68 11 …
1991 … … … 0.68 … …
1992 … … … 0.64 … …
1993 … … … 0.75 22 …
1994 349 … … 0.67 26 73 473
1995 347 (29) 200 (29) 0.6 0.61 29 82 589
1996 454 … … 0.61 33 72 416
1997 … … … 0.66 … …
1991 196 222 1.1 0.18 7 35 815
1992 209 235 1.1 0.18 8 37 946
1980 … … … 0.56 12 117 229
1981 … … … 0.59 14 …
1982 *131 85 *0.6 *0.68 *17 *128 715
1983 … … … 0.67 19 …
1984 *134 97 *0.7 0.78 24 *177 914
1985 … … … 0.80 27 …
1986 *137 90 *0.7 0.84 32 *226 741
1987 … … … 0.87 36 …
Cyprus
India
Bangladesh
China
Azerbaijan
Asia - Asie - Asia

Country
Pays
País
Année
Año
Year
Por persona (en moneda nacional)
Annual average per researcher (in national
currency)
Moyenne anuelle par chercheur (en monnaie
Promedio anual por investigador (en
moneda nacional)
Per capita (in national currency)
Par habitant (en monnaie nationale)
Número de técnicos por investigador
En pourcentage du produit national brut
As percentage of gross national product (GNP)
En porcentaje del producto nacional bruto
(PNB)
Number of technicians per researcher
Nombre de techniciens par chercheur
Investigadores por millón de habitantes
Technicians per million inhabitants
Techniciens par million d'habitants
Técnicos por millón de habitantes
Chercheurs par million d'habitants
Gastos destinados a la I y D
Expenditure for R&D
Dépenses consacrées à la R-D
Personnel engaged in R&D
Personnel employé à des travaux de R-D
Personal dedicado a actividades de I y D
Researchers per million inhabitants
1988 *146 100 *0.7 0.86 41 *281 219
1989 … … … 0.83 45 …
1990 *151 114 *0.8 0.80 50 *326 973
1991 … … … 0.75 53 …
1992 133 112 0.8 0.73 57 425 616
1993 … … … 0.77 68 …
1994 *149 108 *0.7 0.73 75 *499 698
1980 … … … (19) 0.35 (19) 1 064 …
1981 … … … (19) 0.36 (19) 1 302 …
1982 (1) 110 (1) 21 (1) 0.2 (19) *0.50 (19) *1 877 (19) *17 092 671
1983 … … … (19) 0.37 (19) 1 682 (19) 14 585 497
1984 (1) 152 (1) 26 (1) 0.2 (19) 0.33 (19) 1 701 (19) 11 207 070
1985 (1) 127 (1) 24 (1) 0.2 (19) 0.27 (19) 1 447 (19) 11 442 345
1986 (1) 174 … … (19) 0.25 (19) 1 418 (19) 8 161 440
1987 (1) 176 … … (19) 0.16 (19) 1 031 …
1988 (1) 182 … … (19) 0.19 (19) 1 467 (19) 8 092 984
1994 … … … 0.07 1 259 …
1985 68 39 0.6 … … …
1994 560 166 0.3 0.48 9 722 17 372 181
1984 4 828 1 033 0.2 … … …
1989 … … … 2.23 430 …
1990 … … … 2.15 499 …
1992 … … … 2.17 733 …
1993 … … … 2.21 831 …
1994 … … … 2.25 971 …
1995 … … … 2.14 1 050 …
1996 … … … … *1 169 …
1997 … … … 2.35 … …
1980 3 778 745 0.2 2.19 44 914 11 891 239
1981 3 934 769 0.2 2.33 50 824 12 919 126
1982 4 048 769 0.2 2.42 55 063 13 602 762
1983 4 156 782 0.2 2.55 60 150 14 473 153
1984 4 425 809 0.2 2.63 65 706 14 849 046
1985 4 538 822 0.2 2.77 73 573 16 215 806
1986 4 737 839 0.2 2.74 75 680 15 979 593
Iran, Islamic Republic of
Israel
Japan
Indonesia
(4)
(12)(17)
(12)(17)
(12)(17)
(12)(17)
(12)(17)
(12)(17)
(12)(17)

Country
Pays
País
Année
Año
Year
Por persona (en moneda nacional)
Annual average per researcher (in national
currency)
Moyenne anuelle par chercheur (en monnaie
Promedio anual por investigador (en
moneda nacional)
Per capita (in national currency)
Par habitant (en monnaie nationale)
Número de técnicos por investigador
En pourcentage du produit national brut
As percentage of gross national product (GNP)
En porcentaje del producto nacional bruto
(PNB)
Number of technicians per researcher
Nombre de techniciens par chercheur
Investigadores por millón de habitantes
Technicians per million inhabitants
Techniciens par million d'habitants
Técnicos por millón de habitantes
Chercheurs par million d'habitants
Gastos destinados a la I y D
Expenditure for R&D
Dépenses consacrées à la R-D
Personnel engaged in R&D
Personnel employé à des travaux de R-D
Personal dedicado a actividades de I y D
Researchers per million inhabitants
1987 4 840 840 0.2 2.80 80 596 16 653 078
1988 5 016 840 0.2 2.83 86 700 17 284 709
1989 5 175 857 0.2 2.94 96 004 18 553 968
1990 5 395 844 0.2 3.03 105 866 19 625 529
1991 5 558 916 0.2 2.99 111 081 19 987 873
1992 5 671 869 0.2 … … …
1993 (15) 5 138 … … (16) 2.86 109 864 21 384 344
1994 6 293 827 0.1 2.82 108 644 17 266 949
1995 (15) 5 368 … … (16) 2.96 114 833 21 395 584
1996 (15) 4 909 … … (16) 2.80 112 549 22 928 184
1981 … … … *0.11 *1 …
1982 … … … *0.14 *1 *1 898
1983 … … … *0.17 *1 …
1984 *108 *8 *0.1 *0.28 *2 *13 115
1985 *98 *8 *0.1 *0.28 *2 *13 753
1986 … … … 0.27 2 13 367
1987 *97 *7 *0.1 *0.26 *2 *13 249
1988 *96 *9 *0.1 *0.26 *2 *13 222
1989 94 10 0.1 *0.26 *2 *13 230
1993 … … … 0.37 7 …
1994 … … … 0.36 92 …
1995 … … … 0.30 181 …
1996 … … … 0.35 299 …
1997 … … … 0.32 327 …
1980 484 195 0.4 0.57 5 554 11 485 660
1981 536 228 0.4 0.64 7 579 14 148 638
1982 725 298 0.4 0.87 11 664 16 088 600
1983 808 490 0.6 1.00 15 626 19 358 886
1984 921 624 0.7 1.19 20 685 22 475 110
1985 1 017 592 0.6 1.46 28 309 27 853 206
1986 1 141 739 0.6 1.64 36 921 32 381 256
1987 1 267 790 0.6 … … …
1988 1 344 849 0.6 … … …
1989 1 560 911 0.6 1.91 66 337 …
Jordan (30)
Kazakstan
Korea, Republic of (1)(31)
(12)(17)
(12)(17)
(12)(17)
(12)(17)
(12)(17)
(12)(17)
(12)(17)

Country
Pays
País
Année
Año
Year
Por persona (en moneda nacional)
Annual average per researcher (in national
currency)
Moyenne anuelle par chercheur (en monnaie
Promedio anual por investigador (en
moneda nacional)
Per capita (in national currency)
Par habitant (en monnaie nationale)
Número de técnicos por investigador
En pourcentage du produit national brut
As percentage of gross national product (GNP)
En porcentaje del producto nacional bruto
(PNB)
Number of technicians per researcher
Nombre de techniciens par chercheur
Investigadores por millón de habitantes
Technicians per million inhabitants
Techniciens par million d'habitants
Técnicos por millón de habitantes
Chercheurs par million d'habitants
Gastos destinados a la I y D
Expenditure for R&D
Dépenses consacrées à la R-D
Personnel engaged in R&D
Personnel employé à des travaux de R-D
Personal dedicado a actividades de I y D
Researchers per million inhabitants
1990 1 645 1 000 0.6 1.88 78 142 47 513 780
1991 1 762 250 0.1 1.95 96 081 54 535 501
1992 2 032 350 0.2 2.10 114 163 56 205 568
1993 … … … (16) 2.32 139 451 …
1994 2 637 318 0.1 2.60 177 247 67 220 221
1995 (15) 2 235 … … (16) 2.71 210 030 93 977 523
1996 (15) 2 193 … … (16) 2.82 239 896 109 400 803
1993 205 63 0.3 0.27 11 53 292
1994 227 70 0.3 0.23 11 44 791
1995 232 72 0.3 0.20 10 42 855
1996 236 73 0.3 0.16 10 42 353
1997 230 71 0.3 0.16 11 45 928
1993 847 93 0.1 … … …
1994 722 72 0.1 0.26 7 9 233
1995 718 71 0.1 0.31 11 14 123
1996 573 56 0.1 0.22 11 17 787
1997 584 50 0.1 0.20 13 22 148
1983 182 … … … … …
1988 327 69 0.2 … … …
1992 88 89 1.0 0.40 30 337 233
1994 117 42 0.4 0.35 32 267 367
1996 93 32 0.3 0.24 27 290 069
Mongolia 1995 910 176 0.2 … … …
1981 59 74 1.3 … … …
1982 60 79 1.3 0.77 28 456 075
1983 … … … 0.77 33 …
1984 … … … 0.84 40 …
1985 … … … 0.83 42 …
1986 90 134 1.5 0.95 51 562 981
1987 … … … 0.92 52 …
1988 60 83 1.4 … … …
1990 56 79 1.4 … … …
1997 72 13 0.2 … … …
Kyrgyzstan
Malaysia
Kuwait
Pakistan (32)
(33)
(1)(31)
(31)

Country
Pays
País
Année
Año
Year
Por persona (en moneda nacional)
Annual average per researcher (in national
currency)
Moyenne anuelle par chercheur (en monnaie
Promedio anual por investigador (en
moneda nacional)
Per capita (in national currency)
Par habitant (en monnaie nationale)
Número de técnicos por investigador
En pourcentage du produit national brut
As percentage of gross national product (GNP)
En porcentaje del producto nacional bruto
(PNB)
Number of technicians per researcher
Nombre de techniciens par chercheur
Investigadores por millón de habitantes
Technicians per million inhabitants
Techniciens par million d'habitants
Técnicos por millón de habitantes
Chercheurs par million d'habitants
Gastos destinados a la I y D
Expenditure for R&D
Dépenses consacrées à la R-D
Personnel engaged in R&D
Personnel employé à des travaux de R-D
Personal dedicado a actividades de I y D
Researchers per million inhabitants
1980 (1) 112 (1) 51 (1) 0.5 … … (1) …
1981 (1) 152 (1) 68 (1) 0.5 0.19 11 (1) 70 615
1982 (1) 156 (1) 69 (1) 0.4 … … (1) …
1983 (1) 85 (1) 36 (1) 0.4 0.15 10 (1) 117 112
1984 (1) 91 (1) 35 (1) 0.4 0.13 12 (1) 127 000
1992 157 22 0.1 *0.22 *47 *295 236
1982 … … … 0.05 50 …
1983 … … … 0.07 59 …
1984 … … … 0.06 43 421 516
1985 … … … 0.03 20 …
1986 (1) 594 (1) 159 (1) 0.3 (34) 0.04 (34) 18 (1)(34) 29 040
1981 485 328 0.7 (31) 0.30 (31) 34 (1) 68 651
1984 908 514 0.6 (31) 0.53 (31) 82 (1) 89 255
1987 1 187 539 0.5 (31) 0.87 (31) 133 (1) 111 485
1990 1 426 … … (31) 0.94 (31) 212 (1) 148 442
1995 2 318 301 0.1 (31) 1.13 (31) 412 (1) 177 592
1983 … … … 0.18 14 112 227
1984 166 38 0.2 0.18 17 98 053
1985 174 44 0.2 … … …
1996 191 47 0.2 0.19 78 408 933
Syrian Arab Republic 1997 30 25 0.8 0.20 92 3 109 091
1992 722 … … … … …
1993 666 … … … … …
1980 … … … 0.39 55 …
1982 … … … 0.40 68 …
1983 … … … 0.24 44 …
1984 … … … 0.34 66 …
1985 … … … 0.34 68 …
1987 105 53 0.5 0.21 51 481 022
1989 87 33 0.4 0.16 54 613 973
1990 … … … 0.18 68 …
Tajikistan
Thailand
Qatar
Singapore (31)
Sri Lanka
Philippines
(8)

Country
Pays
País
Année
Año
Year
Por persona (en moneda nacional)
Annual average per researcher (in national
currency)
Moyenne anuelle par chercheur (en monnaie
Promedio anual por investigador (en
moneda nacional)
Per capita (in national currency)
Par habitant (en monnaie nationale)
Número de técnicos por investigador
En pourcentage du produit national brut
As percentage of gross national product (GNP)
En porcentaje del producto nacional bruto
(PNB)
Number of technicians per researcher
Nombre de techniciens par chercheur
Investigadores por millón de habitantes
Technicians per million inhabitants
Techniciens par million d'habitants
Técnicos por millón de habitantes
Chercheurs par million d'habitants
Gastos destinados a la I y D
Expenditure for R&D
Dépenses consacrées à la R-D
Personnel engaged in R&D
Personnel employé à des travaux de R-D
Personal dedicado a actividades de I y D
Researchers per million inhabitants
1991 … … … 0.16 70 402 795
1993 114 45 0.4 0.15 78 686 844
1995 118 41 0.3 0.13 89 749 999
1996 103 39 0.4 0.13 94 915 558
1984 202 128 0.6 0.59 2 624 13 000 303
1985 224 147 0.7 0.55 3 823 17 068 553
1990 221 … … 0.34 23 501 106 610 303
1991 210 … … 0.53 58 252 278 711 668
1992 (15) 217 … … (16) 0.49 92 037 426 056 924
1993 (15) 230 … … (16) 0.44 148 194 645 067 196
1994 (15) 241 … … (16) 0.36 232 259 967 584 385
1995 259 … … 0.38 481 582 1 861 321 749
1996 (15) 291 … … (16) 0.45 1 070 526 3 688 259 065
Uzbekistan 1992 1 763 314 0.2 … … …
1983 … … … … 6 …
1984 … … … … 9 …
1985 334 … … … 9 (3) 24 900
1981 890 815 0.9 1.15 1 635 1 837 162
1982 … … … *1.20 *1 830 …
1983 … … … *1.21 *1 964 …
1984 1 009 904 0.9 *1.26 *2 148 *2 130 464
1985 … … … 1.27 2 274 …
1986 … … … *1.31 *2 468 …
1987 … … … *1.32 *2 571 …
1988 … … … *1.31 *2 662 …
1989 1 147 1 101 1.0 1.38 2 998 2 615 226
1990 … … … *1.35 *3 152 …
1991 … … … (16) 1.50 (16) 3 734 …
1992 … … … (16) 1.49 (16) 3 880 …
1993 1 627 812 0.5 1.50 4 022 2 472 058
1994 … … … (16) 1.56 (16) 4 362 …
1995 … … … (16) 1.56 (16) 4 500 …
Viet Nam (19)
Austria
Turkey
Europe - Europa - Europa
Country
Pays
País
Année
Año
Year
Por persona (en moneda nacional)
Annual average per researcher (in national
currency)
Moyenne anuelle par chercheur (en monnaie
Promedio anual por investigador (en
moneda nacional)
Per capita (in national currency)
Par habitant (en monnaie nationale)
Número de técnicos por investigador
En pourcentage du produit national brut
As percentage of gross national product (GNP)
En porcentaje del producto nacional bruto
(PNB)
Number of technicians per researcher
Nombre de techniciens par chercheur
Investigadores por millón de habitantes
Technicians per million inhabitants
Techniciens par million d'habitants
Técnicos por millón de habitantes
Chercheurs par million d'habitants
Gastos destinados a la I y D
Expenditure for R&D
Dépenses consacrées à la R-D
Personnel engaged in R&D
Personnel employé à des travaux de R-D
Personal dedicado a actividades de I y D
Researchers per million inhabitants
1996 … … … (16) 1.54 (16) 4 566 …
1997 … … … (16) 1.53 (16) 4 732 …
1998 … … … … (16) 4 985 …
1992 3 259 509 0.2 … … …
1993 2 939 402 0.1 1.12 1 060 360 354
1994 2 517 345 0.1 1.03 17 592 6 990 418
1995 2 288 302 0.1 1.12 127 607 55 780 565
1996 2 248 266 0.1 1.07 184 561 82 128 066
1981 (15) 1 294 … … … … …
1982 (15) 1 362 … … … … …
1983 (15) 1 364 … … (16) 1.63 6 773 4 966 779
1984 (15) 1 412 … … (16) 1.65 7 375 5 224 012
1985 … … … 1.70 8 099 …
1986 1 592 (29) 2 078 (29) 1.3 1.69 8 485 5 331 309
1987 1 624 (29) 2 093 (29) 1.3 (16) 1.69 8 883 (15)(16) 5 471 400
1988 1 681 (29) 2 033 (29) 1.2 1.65 9 216 5 482 705
1989 1 772 (29) 2 037 (29) 1.1 1.70 10 329 5 830 598
1990 1 856 (29) 2 041 (29) 1.1 1.70 10 909 5 878 462
1991 *1 815 (29) 2 201 (29) *1.2 *1.67 *11 232 *6 189 727
1993 … … … (16) 1.60 11 636 …
1994 (15) 2 242 … … (16) 1.58 12 074 5 387 226
1995 (15) 2 272 … … (16) 1.60 12 662 5 573 140
1980 4 368 1 183 0.3 … … …
1981 4 654 1 334 0.3 … … …
1982 4 792 1 403 0.3 … … …
1983 4 856 1 389 0.3 … … …
1984 5 034 1 393 0.3 … … …
1985 5 359 1 462 0.3 … … …
1986 5 186 1 262 0.2 … … …
1987 5 691 1 312 0.2 … … …
1988 5 628 1 409 0.3 … … …
1989 5 806 1 391 0.2 … … …
1990 6 034 1 407 0.2 … … …
1991 5 733 1 316 0.2 … … …
1992 4 384 1 247 0.3 1.67 383 …
1993 3 178 910 0.3 1.21 413 129 672
Belarus
Belgium
Bulgaria

Country
Pays
País
Année
Año
Year
Por persona (en moneda nacional)
Annual average per researcher (in national
currency)
Moyenne anuelle par chercheur (en monnaie
Promedio anual por investigador (en
moneda nacional)
Per capita (in national currency)
Par habitant (en monnaie nationale)
Número de técnicos por investigador
En pourcentage du produit national brut
As percentage of gross national product (GNP)
En porcentaje del producto nacional bruto
(PNB)
Number of technicians per researcher
Nombre de techniciens par chercheur
Investigadores por millón de habitantes
Technicians per million inhabitants
Techniciens par million d'habitants
Técnicos por millón de habitantes
Chercheurs par million d'habitants
Gastos destinados a la I y D
Expenditure for R&D
Dépenses consacrées à la R-D
Personnel engaged in R&D
Personnel employé à des travaux de R-D
Personal dedicado a actividades de I y D
Researchers per million inhabitants
1994 1 476 897 0.6 0.88 539 364 928
1995 1 647 906 0.6 … … …
1996 1 747 967 0.6 0.57 1 083 620 162
1988 2 156 1 064 0.5 … … …
1989 2 224 1 041 0.5 … … …
1990 2 056 988 0.5 … … …
1991 1 920 874 0.5 … … …
1992 1 979 847 0.4 1.06 7 3 052
1993 2 005 739 0.4 0.99 91 45 010
1994 1 959 684 0.3 0.87 164 83 396
1995 1 984 698 0.4 1.00 210 105 531
1996 1 916 714 0.4 1.03 238 123 813
1991 … … … (16) 2.13 1 476 …
1992 (15) 1 947 … … (16) 1.84 1 406 721 918
1993 (15) 1 320 … … (16) 1.36 1 194 904 088
1994 (15) 1 291 … … (16) 1.26 1 258 974 334
1995 1 156 693 0.6 1.12 1 355 1 171 563
1996 (15) 1 252 … … (16) 1.11 1 576 1 258 762
1997 (15) 1 222 … … (16) 1.20 1 891 1 548 283
1981 (15) 1 324 … … (16) 1.14 872 658 571
1982 1 417 (29) 1 949 (29) 1.4 1.19 1 034 729 566
1983 1 500 (29) 2 045 (29) 1.4 1.24 1 192 794 294
1984 1 589 (29) 2 133 (29) 1.3 1.28 1 349 848 948
1985 1 676 (29) 2 219 (29) 1.3 1.31 1 505 897 864
1986 1 794 (29) 2 301 (29) 1.3 1.38 1 724 961 069
1987 1 911 (29) 2 380 (29) 1.2 1.48 1 942 1 016 164
1988 2 025 (29) 2 495 (29) 1.2 1.55 2 131 1 052 465
1989 2 138 (29) 2 609 (29) 1.2 1.62 2 319 1 084 839
1990 2 239 (29) 2 635 (29) 1.2 1.70 2 529 1 129 596
1991 2 338 (29) 2 660 (29) 1.1 1.78 2 736 1 170 222
1992 (15) 2 488 … … (16) 1.81 2 882 1 158 309
1993 2 635 (29) 2 644 (29) 1.0 1.86 3 025 1 147 883
1995 (15) 3 054 … … (16) 1.97 3 549 1 162 280
1996 (15) 3 122 … … (16) 2.08 3 893 1 246 825
1997 (15) 3 190 … … (16) 1.95 4 121 1 291 650
1998 (15) 3 259 … … … (16) 4 348 1 333 972
Croatia
Czech Republic
Denmark

Country
Pays
País
Année
Año
Year
Por persona (en moneda nacional)
Annual average per researcher (in national
currency)
Moyenne anuelle par chercheur (en monnaie
Promedio anual por investigador (en
moneda nacional)
Per capita (in national currency)
Par habitant (en monnaie nationale)
Número de técnicos por investigador
En pourcentage du produit national brut
As percentage of gross national product (GNP)
En porcentaje del producto nacional bruto
(PNB)
Number of technicians per researcher
Nombre de techniciens par chercheur
Investigadores por millón de habitantes
Technicians per million inhabitants
Techniciens par million d'habitants
Técnicos por millón de habitantes
Chercheurs par million d'habitants
Gastos destinados a la I y D
Expenditure for R&D
Dépenses consacrées à la R-D
Personnel engaged in R&D
Personnel employé à des travaux de R-D
Personal dedicado a actividades de I y D
Researchers per million inhabitants
1993 2 494 452 0.2 0.60 86 34 144
1994 2 153 563 0.3 0.73 144 66 727
1995 … … … 0.61 169 80 606
1996 2 079 372 0.2 0.57 204 98 344
1997 2 017 391 0.2 0.57 247 122 382
1991 1 180 526 0.4 … … …
1995 1 099 515 0.5 … … …
1981 2 025 (29) 1 726 (29) 0.9 … … …
1983 2 257 (29) 1 910 (29) 0.8 … … …
1984 … … … *1.52 *922 …
1985 … … … *1.61 *1 064 …
1986 … … … *1.72 *1 208 …
1987 (15) 2 146 … … (16) 1.80 1 376 641 169
1988 … … … *1.83 *1 568 …
1989 (8) 2 278 (29)(8) 1 988 (29)(8) 0.9 *1.88 *1 797 *788 725
1990 … … … (16) 1.97 1 975 …
1991 (8) 2 282 (29)(8) 2 093 (29)(8) 0.9 2.15 2 031 890 095
1992 … … … (16) 2.28 2 064 …
1993 (15) 3 010 … … (16) 2.33 2 110 701 104
1994 … … … (16) 2.44 2 348 …
1995 2 799 (29)(8) 1 996 (29) 0.7 2.46 2 529 903 526
1996 … … … (16) 2.70 2 905 …
1997 … … … (16) 2.78 3 280 …
1980 1 391 (29) 2 994 (29) 2.2 … … …
1981 1 580 (29) 3 024 (29) 1.9 1.97 1 155 730 667
1982 1 658 (29) 3 108 (29) 1.9 2.07 1 377 830 589
1983 1 698 (29) 3 086 (29) 1.8 2.12 1 551 913 388
1984 1 790 (29) 3 129 (29) 1.7 2.22 1 753 979 614
1985 1 855 (29) 3 095 (29) 1.7 2.27 1 920 1 035 357
1986 1 893 (29) 3 054 (29) 1.6 2.25 2 042 1 079 150
1987 1 961 (29) 3 022 (29) 1.5 2.28 2 176 1 109 777
1988 2 053 (29) 2 994 (29) 1.5 2.29 2 329 1 134 314
1989 2 135 (29) 2 993 (29) 1.4 2.34 2 545 1 192 004
1990 2 186 (29) 2 981 (29) 1.4 2.43 2 771 1 267 706
1991 2 267 (29) 2 972 (29) 1.3 2.43 2 862 1 262 176
Estonia (35)
Federal Republic of Yugoslavia
Finland
France

Country
Pays
País
Année
Año
Year
Por persona (en moneda nacional)
Annual average per researcher (in national
currency)
Moyenne anuelle par chercheur (en monnaie
Promedio anual por investigador (en
moneda nacional)
Per capita (in national currency)
Par habitant (en monnaie nationale)
Número de técnicos por investigador
En pourcentage du produit national brut
As percentage of gross national product (GNP)
En porcentaje del producto nacional bruto
(PNB)
Number of technicians per researcher
Nombre de techniciens par chercheur
Investigadores por millón de habitantes
Technicians per million inhabitants
Techniciens par million d'habitants
Técnicos por millón de habitantes
Chercheurs par million d'habitants
Gastos destinados a la I y D
Expenditure for R&D
Dépenses consacrées à la R-D
Personnel engaged in R&D
Personnel employé à des travaux de R-D
Personal dedicado a actividades de I y D
Researchers per million inhabitants
1992 (15) 2 475 … … (16) 2.44 2 958 1 195 237
1993 (15) 2 536 … … (16) 2.48 3 020 1 190 702
1994 2 583 (29) 2 873 (29) 1.1 2.40 3 039 1 176 751
1995 (15) 2 607 … … (16) 2.35 3 087 1 184 090
1996 (15) 2 659 … … (16) 2.33 3 135 1 179 212
1997 … … … (16) 2.25 3 140 …
1981 (15) 1 596 … … … (16) 478 299 195
1982 … … … … (16) 515 …
1983 (15) 1 684 … … … (16) 542 321 782
1984 … … … … (16) 567 …
1985 (15) 1 850 … … … (16) 638 344 778
1986 … … … … (16) 676 …
1987 (15) 2 121 … … … (16) 733 345 620
1988 … … … … (16) 765 …
1989 (15) 2 236 … … … (16) 810 362 081
1990 … … … … (16) 841 …
1991 (15) 3 029 … … (16) 2.59 934 308 090
1992 (15) 2 916 … … (16) 2.47 949 325 276
1993 2 843 1 472 0.5 2.43 949 333 804
1994 … … … (16) 2.34 950 …
1995 (15) 2 831 … … (16) 2.31 974 344 051
1996 … … … (16) 2.30 989 …
1997 … … … (16) 2.41 1 061 …
1998 … … … … (16) 1 102 …
1981 … … … (16) 0.18 441 …
1986 … … … (16) 0.28 1 836 …
1988 … … … (16) 0.31 2 731 …
1989 (15) 538 … … (16) 0.38 4 035 7 507 435
1991 (15) 607 … … (16) 0.37 5 790 9 551 044
1993 773 314 0.4 0.47 9 669 12 510 586
1980 (7) 2 390 (7)(36) 2 215 (7)(36) 0.9 … … …
1981 (7) 2 081 (7)(36) 2 029 (7)(36) 1.0 2.59 1 815 872 368
1982 (7) 2 056 (7)(36) 1 718 (7)(36) 0.8 2.63 1 986 965 635
1983 (7) 2 077 (7)(36) 1 734 (7)(36) 0.8 2.37 1 917 922 601
1984 (7) 2 121 (7)(36) 1 737 (7)(36) 0.8 2.42 2 137 1 007 461
1985 (7) 2 125 (7)(36) 1 690 (7)(36) 0.8 2.44 2 276 1 071 089
Germany
Greece
Hungary
Country
Pays
País
Année
Año
Year
Por persona (en moneda nacional)
Annual average per researcher (in national
currency)
Moyenne anuelle par chercheur (en monnaie
Promedio anual por investigador (en
moneda nacional)
Per capita (in national currency)
Par habitant (en monnaie nationale)
Número de técnicos por investigador
En pourcentage du produit national brut
As percentage of gross national product (GNP)
En porcentaje del producto nacional bruto
(PNB)
Number of technicians per researcher
Nombre de techniciens par chercheur
Investigadores por millón de habitantes
Technicians per million inhabitants
Techniciens par million d'habitants
Técnicos por millón de habitantes
Chercheurs par million d'habitants
Gastos destinados a la I y D
Expenditure for R&D
Dépenses consacrées à la R-D
Personnel engaged in R&D
Personnel employé à des travaux de R-D
Personal dedicado a actividades de I y D
Researchers per million inhabitants
1986 (7) 2 181 (7)(36) 1 689 (7)(36) 0.8 2.64 2 606 1 194 960
1987 (7) 2 125 (7)(36) 1 596 (7)(36) 0.8 2.73 3 066 1 442 964
1988 (7) 2 052 (7)(36) 1 495 (7)(36) 0.7 2.34 3 102 1 512 205
1989 (7) 1 964 (7)(36) 1 357 (7)(36) 0.7 2.04 3 215 1 636 778
1990 1 694 1 130 0.7 1.67 3 217 1 899 716
1991 1 401 862 0.6 1.12 2 588 1 847 212
1992 1 195 695 0.6 1.09 3 008 2 517 099
1993 (15) 1 150 … … (16) 1.01 3 374 2 935 015
1994 (15) 1 146 … … (16) 0.93 3 789 3 305 991
1995 (37) 1 027 510 0.5 0.76 4 029 3 924 183
1996 (15) 1 022 … … (16) 0.68 4 404 4 312 971
1997 (15) 1 099 … … … (16) 6 081 5 536 068
1981 1 723 (29) 1 498 (29) 0.9 0.65 693 402 011
1983 1 750 (29) 1 539 (29) 0.9 0.71 1 958 1 118 645
1984 … … … (16) 0.77 2 708 …
1985 2 125 (29) 1 270 (29) 0.6 0.73 3 507 1 650 391
1986 … … … (16) 0.75 4 757 …
1987 2 252 (29) 1 300 (29) 0.6 0.78 6 450 2 865 108
1989 (15) 2 719 … … (16) 1.07 12 500 4 598 453
1990 (15) 2 651 … … (16) 1.03 14 170 5 345 134
1991 (15) 2 663 … … (16) 1.21 17 904 6 723 756
1992 (15) 2 724 … … (16) 1.38 20 422 7 499 280
1993 (15) 3 099 … … (16) 1.38 20 904 6 745 596
1994 (15) 3 177 … … (16) 1.44 22 735 7 156 722
1995 4 015 (29) 1 467 (29) 0.4 1.59 25 963 6 466 477
1996 (15) 3 351 … … (16) 1.55 27 002 8 058 800
1997 (15) 4 131 … … … (16) 29 843 7 224 328
1981 *766 *410 *0.5 *0.74 *25 *31 626
1982 797 366 0.5 0.75 29 35 191
1983 920 378 0.4 0.74 30 32 190
1984 1 025 378 0.4 0.82 36 34 664
1985 1 054 378 0.4 0.89 42 39 215
1986 1 088 380 0.3 0.96 48 43 519
1987 (15) 945 … … (16) 0.96 52 54 130
1988 1 804 367 0.2 0.92 53 29 256
1989 (15) 1 169 … … (16) 0.95 61 51 772
1990 (15) 1 319 … … (16) 0.97 68 51 207
Iceland
Ireland

Country
Pays
País
Année
Año
Year
Por persona (en moneda nacional)
Annual average per researcher (in national
currency)
Moyenne anuelle par chercheur (en monnaie
Promedio anual por investigador (en
moneda nacional)
Per capita (in national currency)
Par habitant (en monnaie nationale)
Número de técnicos por investigador
En pourcentage du produit national brut
As percentage of gross national product (GNP)
En porcentaje del producto nacional bruto
(PNB)
Number of technicians per researcher
Nombre de techniciens par chercheur
Investigadores por millón de habitantes
Technicians per million inhabitants
Techniciens par million d'habitants
Técnicos por millón de habitantes
Chercheurs par million d'habitants
Gastos destinados a la I y D
Expenditure for R&D
Dépenses consacrées à la R-D
Personnel engaged in R&D
Personnel employé à des travaux de R-D
Personal dedicado a actividades de I y D
Researchers per million inhabitants
1991 (15) 1 470 … … (16) 1.07 79 53 622
1992 (15) 1 572 … … (16) 1.19 93 58 879
1993 1 855 506 0.3 1.37 113 60 711
1994 (15) 2 040 … … (16) 1.52 134 65 569
1995 (15) 2 319 … … (16) 1.61 155 66 669
1980 833 490 0.6 0.76 51 340 61 645 440
1981 921 520 0.6 0.89 71 724 77 897 331
1982 1 002 496 0.5 0.92 86 819 86 685 560
1983 1 112 507 0.5 0.97 106 338 95 634 868
1984 1 093 538 0.5 1.02 129 094 118 152 133
1985 1 124 583 0.5 1.14 160 873 143 240 986
1986 1 195 579 0.5 1.15 179 333 150 184 822
1987 1 241 637 0.5 1.20 205 688 165 769 531
1988 1 315 673 0.5 1.23 233 366 177 478 974
1989 1 336 704 0.5 1.26 259 821 194 556 209
1990 1 366 742 0.5 1.32 298 147 218 311 431
1991 (15) 1 318 … … (16) 1.26 309 294 234 685 518
1992 (15) 1 302 … … (16) 1.22 314 171 241 299 052
1993 (15) 1 301 … … (16) 1.16 307 757 236 628 947
1994 1 322 798 0.6 1.08 303 513 229 640 765
1995 (15) 1 318 … … (16) 1.03 311 555 236 495 195
1996 … … … (16) 1.05 335 543 …
1997 … … … (16) 2.21 358 271 …
1993 1 531 408 0.3 0.49 3 1 786
1994 1 169 367 0.3 0.43 4 2 878
1995 1 211 398 0.3 0.53 5 4 007
1996 1 137 341 0.3 0.48 6 4 601
1997 1 049 351 0.3 0.43 6 5 323
1995 … … … 0.70 45 …
1996 2 028 631 0.3 … … …
1994 493 1 924 3.9 1.10 12 3 091 328
1995 416 1 554 3.7 1.10 17 4 429 295
1996 250 1 632 6.5 0.90 16 2 388 144
1997 330 1 641 5.0 0.90 16 3 299 377
Italy
Latvia
Lithuania
Moldova

Country
Pays
País
Année
Año
Year
Por persona (en moneda nacional)
Annual average per researcher (in national
currency)
Moyenne anuelle par chercheur (en monnaie
Promedio anual por investigador (en
moneda nacional)
Per capita (in national currency)
Par habitant (en monnaie nationale)
Número de técnicos por investigador
En pourcentage du produit national brut
As percentage of gross national product (GNP)
En porcentaje del producto nacional bruto
(PNB)
Number of technicians per researcher
Nombre de techniciens par chercheur
Investigadores por millón de habitantes
Technicians per million inhabitants
Techniciens par million d'habitants
Técnicos por millón de habitantes
Chercheurs par million d'habitants
Gastos destinados a la I y D
Expenditure for R&D
Dépenses consacrées à la R-D
Personnel engaged in R&D
Personnel employé à des travaux de R-D
Personal dedicado a actividades de I y D
Researchers per million inhabitants
1980 1 869 (29) 1 919 (29) 1.0 1.87 449 240 182
1981 2 084 (29) 1 968 (29) 0.9 1.98 495 237 328
1982 2 112 (29) 1 911 (29) 0.9 1.96 510 241 512
1983 2 128 (29) 1 889 (29) 0.9 1.99 537 252 179
1984 2 173 (29) 1 879 (29) 0.9 1.95 545 250 703
1985 2 320 (29) 1 917 (29) 0.8 2.06 604 260 203
1986 2 419 (29) 1 893 (29) 0.8 2.19 655 270 440
1987 2 507 (29) 1 827 (29) 0.7 2.29 685 273 198
1988 2 544 (29) 1 824 (29) 0.7 2.24 689 270 869
1989 2 633 (29) 1 843 (29) 0.7 2.12 692 262 737
1990 2 693 (29) 1 867 (29) 0.7 2.03 699 259 563
1991 2 657 (29) 1 358 (29) 0.5 1.92 690 259 525
1992 … … … (16) 1.99 738 …
1993 (15) 2 110 … … (16) 2.01 763 361 709
1994 … … … 2.04 813 …
1995 (15) 2 202 … … (16) 2.09 857 388 889
1996 (15) 2 219 … … (16) 2.08 900 405 458
1980 1 818 (29) 1 855 (29) 1.0 1.20 889 488 731
1981 1 830 (29) 1 792 (29) 1.0 1.22 1 029 561 990
1982 1 887 (29) 1 816 (29) 1.0 *1.30 *1 205 *638 703
1983 2 009 (29) 1 864 (29) 0.9 1.35 1 380 687 070
1984 2 168 (29) 1 997 (29) 0.9 *1.43 *1 651 *761 427
1985 2 334 (29) 2 189 (29) 0.9 1.52 1 953 836 763
1986 2 429 (29) 2 285 (29) 0.9 *1.71 *2 251 *926 878
1987 2 740 (29) 2 013 (29) 0.7 1.70 2 438 889 900
1989 2 880 (29) 1 910 (29) 0.7 1.74 2 732 948 725
1991 3 159 (29) 1 594 (29) 0.5 1.71 2 958 936 330
1993 (15) 3 431 … … (16) 1.78 3 314 966 105
1995 3 664 (29) 1 842 (29) 0.5 1.74 3 658 998 532
1997 … … … (16) 1.58 … …
1980 2 615 (39) 1 603 (39) 0.6 … … …
1981 2 479 (39) 1 421 (39) 0.6 … … …
1982 2 179 (39) 1 131 (39) 0.5 … … …
1983 2 050 (39) 1 011 (39) 0.5 … … …
1984 2 032 (39) 949 (39) 0.5 … … …
1985 1 533 (39) 1 452 (39) 0.9 1.00 2 699 1 761 350
Netherlands
Norway
Poland
(17)
(17)
(17)
(17)
(17)
(17)
(17)
(17)
(17)
(17)
(17)
(17)

Country
Pays
País
Année
Año
Year
Por persona (en moneda nacional)
Annual average per researcher (in national
currency)
Moyenne anuelle par chercheur (en monnaie
Promedio anual por investigador (en
moneda nacional)
Per capita (in national currency)
Par habitant (en monnaie nationale)
Número de técnicos por investigador
En pourcentage du produit national brut
As percentage of gross national product (GNP)
En porcentaje del producto nacional bruto
(PNB)
Number of technicians per researcher
Nombre de techniciens par chercheur
Investigadores por millón de habitantes
Technicians per million inhabitants
Techniciens par million d'habitants
Técnicos por millón de habitantes
Chercheurs par million d'habitants
Gastos destinados a la I y D
Expenditure for R&D
Dépenses consacrées à la R-D
Personnel engaged in R&D
Personnel employé à des travaux de R-D
Personal dedicado a actividades de I y D
Researchers per million inhabitants
1986 (38) 1 202 (38)(39) 1 656 (38)(39) 1.4 1.25 4 146 3 449 520
1987 (38) 1 143 (38)(39) 1 700 (38)(39) 1.5 … … …
1988 … … … (40) 1.37 (40) 10 215 (40) 11 363 615
1989 … … … (40) 1.15 (40) 34 236 (40) 40 007 631
1990 … … … (40)(41) 1.63 (40)(41) 225 346 (40)(41) 286 331 167
1991 … … … (40)(41) 1.10 (40)(41) 222 507 (40)(41) 291 445 343
1992 1 081 1 377 1.3 (40) 0.85 (40) 249 135 (40) 230 624 132
1994 (15) 1 231 … … (16) 0.84 45 36 283
1995 (15) 1 307 … … (16) 0.75 56 42 297
1996 (15) 1 358 … … (16) 0.77 72 52 625
1980 273 294 1.1 0.30 422 1 546 565
1982 306 314 1.0 0.34 662 2 166 678
1984 351 309 0.9 0.38 1 142 3 253 986
1986 453 346 0.8 0.41 2 007 4 435 723
1988 507 362 0.7 0.45 3 026 5 977 379
1990 599 381 0.6 0.55 5 273 8 807 076
1992 (15) 959 … … (16) 0.65 8 157 8 506 804
1995 1 182 167 0.1 0.62 9 347 7 908 706
1987 2 553 1 837 0.7 … … …
1988 2 550 1 835 0.7 … … …
1989 2 575 1 853 0.7 … … …
1991 1 222 486 0.4 0.79 750 613 703
1994 1 387 581 0.4 … … …
1995 … … … 0.72 22 631 …
1989 7 576 1 835 0.2 … … …
1990 6 697 1 581 0.2 … … …
1991 5 911 1 340 0.2 … … …
1994 4 192 880 0.2 0.86 34 693 8 276 270
1995 3 503 685 0.2 0.76 82 037 23 423 352
1996 3 801 656 0.2 0.88 131 150 34 504 406
1997 3 587 600 0.2 … … …
1992 2 016 1 058 0.5 … … …
1993 1 678 852 0.5 … … …
1994 1 920 795 0.4 … … …
1995 1 814 763 0.4 1.05 1 004 553 394
Russian Federation
Slovakia
Portugal
Romania
(1)
(1)
(1)

Country
Pays
País
Année
Año
Year
Por persona (en moneda nacional)
Annual average per researcher (in national
currency)
Moyenne anuelle par chercheur (en monnaie
Promedio anual por investigador (en
moneda nacional)
Per capita (in national currency)
Par habitant (en monnaie nationale)
Número de técnicos por investigador
En pourcentage du produit national brut
As percentage of gross national product (GNP)
En porcentaje del producto nacional bruto
(PNB)
Number of technicians per researcher
Nombre de techniciens par chercheur
Investigadores por millón de habitantes
Technicians per million inhabitants
Techniciens par million d'habitants
Técnicos por millón de habitantes
Chercheurs par million d'habitants
Gastos destinados a la I y D
Expenditure for R&D
Dépenses consacrées à la R-D
Personnel engaged in R&D
Personnel employé à des travaux de R-D
Personal dedicado a actividades de I y D
Researchers per million inhabitants
1996 1 866 792 0.4 … … …
1992 2 972 2 370 0.8 1.49 7 727 2 599 849
1993 1 906 1 190 0.6 1.61 11 699 6 138 318
1994 2 408 1 174 0.5 1.75 16 475 6 842 879
1995 2 461 1 097 0.4 1.69 18 922 7 689 198
1996 2 251 1 027 0.5 1.46 18 454 8 201 159
1981 (15) 510 … … (16) 0.44 1 927 3 778 960
1982 (15) 495 … … (16) 0.50 2 527 5 111 384
1983 (15) 510 … … (16) 0.49 2 822 5 535 425
1984 536 162 0.3 (42) 0.51 (42) 3 294 (42) 6 154 248
1985 558 183 0.3 (42) 0.56 (42) 4 038 (42) 7 240 317
1986 635 197 0.3 (42) 0.62 (42) 5 115 (42) 8 060 184
1987 682 212 0.3 (42) 0.65 (42) 5 937 (42) 8 710 944
1988 799 255 0.3 (42) 0.73 (42) 7 375 (42) 9 229 665
1989 838 285 0.3 (42) 0.76 (42) 8 662 (42) 10 341 476
1990 955 299 0.3 (42) 0.86 (42) 10 776 (42) 11 283 147
1991 (15) 1 032 … … (16) 0.89 12 168 11 794 993
1992 (15) 1 057 … … (16) 0.93 13 681 12 953 600
1993 (15) 1 098 … … (16) 0.93 14 109 12 853 138
1994 1 211 343 0.3 *0.87 *13 863 *11 451 597
1995 (15) 1 197 … … (16) 0.86 14 929 12 477 046
1996 (15) 1 305 … … (16) 0.89 16 191 12 415 012
1997 … … … (16) 0.90 … …
1981 2 128 (29) 2 948 (29) 1.4 (43) 2.33 (43) 1 602 (43) 752 713
1983 2 211 (29) 3 287 (29) 1.5 (43) 2.62 (43) 2 185 (43) 988 533
1985 2 539 (29) 3 402 (29) 1.3 (43) 2.96 (43) 2 993 (43) 1 178 727
1987 2 701 (29) 3 457 (29) 1.3 (43) 3.04 (43) 3 631 (43) 1 344 467
1989 3 007 (29) 3 473 (29) 1.2 3.02 4 263 1 417 706
1991 3 080 (29) 3 147 (29) 1.0 2.95 4 803 1 559 571
1993 3 706 (29) 3 166 (29) 0.9 3.43 5 448 1 470 299
1995 (15) 3 826 … … (16) 3.76 6 739 1 761 385
1981 … … … (16) 2.11 667 …
1983 … … … (16) 2.11 723 …
1986 2 262 1 625 0.7 … … …
1989 2 408 1 374 0.6 … … …
Sweden
Switzerland
Slovenia
Spain
Country
Pays
País
Année
Año
Year
Por persona (en moneda nacional)
Annual average per researcher (in national
currency)
Moyenne anuelle par chercheur (en monnaie
Promedio anual por investigador (en
moneda nacional)
Per capita (in national currency)
Par habitant (en monnaie nationale)
Número de técnicos por investigador
En pourcentage du produit national brut
As percentage of gross national product (GNP)
En porcentaje del producto nacional bruto
(PNB)
Number of technicians per researcher
Nombre de techniciens par chercheur
Investigadores por millón de habitantes
Technicians per million inhabitants
Techniciens par million d'habitants
Técnicos por millón de habitantes
Chercheurs par million d'habitants
Gastos destinados a la I y D
Expenditure for R&D
Dépenses consacrées à la R-D
Personnel engaged in R&D
Personnel employé à des travaux de R-D
Personal dedicado a actividades de I y D
Researchers per million inhabitants
1992 (15) 2 545 … … (16) 2.51 1 306 513 270
1996 (15) 3 006 … … (16) 2.60 1 388 461 752
The For. Yug. Rep. of Macedonia 1995 1 335 546 0.4 (44) 0.31 (44) 217 (44) 162 150
1995 3 176 714 0.2 … … …
1996 2 883 713 0.2 … … …
1997 2 171 575 0.3 … … …
1981 (15) 2 254 … … (16) 2.37 107 47 430
1982 (15) 2 271 … … … … …
1983 (15) 2 251 … … (16) 2.19 119 52 456
1984 (15) 2 283 … … … … …
1985 (15) 2 314 … … (16) 2.23 141 60 756
1986 (15) 2 361 … … (16) 2.25 152 64 351
1987 (15) 2 353 … … (16) 2.19 162 68 814
1988 (15) 2 397 … … (16) 2.15 176 73 249
1989 (15) 2 319 … … (16) 2.17 193 83 226
1990 (15) 2 311 … … (16) 2.21 209 90 158
1991 (15) 2 217 … … (16) 2.15 211 94 782
1992 (15) 2 263 … … (16) 2.14 220 96 863
1993 2 413 1 017 0.4 2.22 239 98 779
1994 (15) 2 441 … … (16) 2.12 242 98 915
1995 (15) 2 504 … … (16) 2.04 244 97 068
1996 (15) 2 448 … … (16) 1.95 246 100 278
1981 1 661 834 0.5 1.01 106 63 784
1984 1 881 906 0.5 1.15 157 83 392
1985 1 944 950 0.5 1.18 176 90 358
1986 2 205 1 024 0.5 1.32 212 96 081
1987 2 257 1 024 0.5 1.28 229 101 225
1988 2 408 1 016 0.4 1.31 260 107 740
1990 2 478 943 0.4 1.41 302 121 606
1992 (15) 3 009 … … (16) 1.66 374 124 296
1994 3 185 797 0.3 1.72 413 129 532
1996 (15) 3 357 … … (16) 1.80 480 142 768
Ukraine
United Kingdom
Australia
Oceania - Océanie - Oceanía

Country
Pays
País
Année
Año
Year
Por persona (en moneda nacional)
Annual average per researcher (in national
currency)
Moyenne anuelle par chercheur (en monnaie
Promedio anual por investigador (en
moneda nacional)
Per capita (in national currency)
Par habitant (en monnaie nationale)
Número de técnicos por investigador
En pourcentage du produit national brut
As percentage of gross national product (GNP)
En porcentaje del producto nacional bruto
(PNB)
Number of technicians per researcher
Nombre de techniciens par chercheur
Investigadores por millón de habitantes
Technicians per million inhabitants
Techniciens par million d'habitants
Técnicos por millón de habitantes
Chercheurs par million d'habitants
Gastos destinados a la I y D
Expenditure for R&D
Dépenses consacrées à la R-D
Personnel engaged in R&D
Personnel employé à des travaux de R-D
Personal dedicado a actividades de I y D
Researchers per million inhabitants
1983 158 132 0.8 (5) 0.06 (5) 4 (5) 21 334
1984 154 129 0.8 (5) 0.07 (5) 4 (5) 23 945
1985 160 93 0.6 (5) 0.06 (5) 4 (5) 22 000
1986 156 91 0.6 … (5) 5 (5) 26 422
1987 152 88 0.6 … … …
1989 161 84 0.5 … (5) *15 (5) *91 715
1991 168 81 0.5 … (5) 17 (5) 96 305
1989 (15) 1 450 … … (16) 0.95 187 128 996
1990 (15) 1 457 … … (16) 1.07 216 148 090
1991 (15) 1 393 … … (16) 1.06 210 150 358
1992 (15) 1 699 … … (16) 1.06 218 127 952
1993 1 749 809 0.5 1.09 233 133 140
1995 (15) 1 663 … … (16) 1.04 243 145 700
For general explanations and definitions, please refer to the Notes and Explanations on country tables.
Notes(1) Data refer to full-time plus part-time personnel.
(2) Not including data for the productive sector.
(3) Not including data for the general service sector.
(4) Data refer to the productive sector only.
(5) Data refer to the higher education sector only.
(6) Data refer to 4 research institutes only.
(7) Not including personnel engaged in the administration of R&D.
(8) Not including data for the higher education sector.
(9) Data refer to the Ministry of Scientific Research only.
(10) Data relate only to 23 out of 26 national research institutes under the Federal Ministry of Science and Technology.
(11) Data refer to the National University of Rwanda only.
(12) Data refer to full-time personnel.
(13) Not including private productive enterprises.
Guam
New Zealand

Country
Pays
País
Année
Año
Year
Por persona (en moneda nacional)
Annual average per researcher (in national
currency)
Moyenne anuelle par chercheur (en monnaie
Promedio anual por investigador (en
moneda nacional)
Per capita (in national currency)
Par habitant (en monnaie nationale)
Número de técnicos por investigador
En pourcentage du produit national brut
As percentage of gross national product (GNP)
En porcentaje del producto nacional bruto
(PNB)
Number of technicians per researcher
Nombre de techniciens par chercheur
Investigadores por millón de habitantes
Technicians per million inhabitants
Techniciens par million d'habitants
Técnicos por millón de habitantes
Chercheurs par million d'habitants
Gastos destinados a la I y D
Expenditure for R&D
Dépenses consacrées à la R-D
Personnel engaged in R&D
Personnel employé à des travaux de R-D
Personal dedicado a actividades de I y D
Researchers per million inhabitants
(14) Data for scientists and engineers refer to researchers listed in the directory of research groups in Brazil compiled by the Conselho Nacional de Desenvolvimento Cientifico e Tecnologico (CNPq).
(15) Data for researchers refers to full-time equivalent. Data are from OECD.
(16) Data on R&D expenditure are from OECD.
(17) Not including data for social sciences and humanities in the productive sector (integrated R&D).
(18) Not including data for the productive sector (non-integrated R&D).
(19) Data refer to government funds or expenditure.
(20) Data refer to full-time plus part-time researchers in public enterprises.
(21) Data refer to R&D in public enterprises.
(22) Not including data for the productive sector (non-integrated R&D) and the general service sector.
(23) Data refer to the Scientific Research Council only.
(24) Data are the budget allotment for science and technology.
(25) Data refer only to the institutions: CONCYTEC, IMARPE, INICTEL, INIA, UNMSR, and UP.
(26) Not including data for law, humanities and education.
(27) Not including capital expenditure in the productive sector.
(28) Data refer to scientific and technological activities (STA).
(29) Including other supporting personnel.
(30) Data refer to the East Bank only.
(31) Not including data for social sciences and humanities.
(32) Data refer to R&D activities concentrated mainly in government-financed research establishments; social sciences and humanities in the higher education and general service sectors are excluded; not including military and defence R&D.
(33) Data refer to the general service sector only.
(34) Not including social sciences and humanities in the higher education sector.
(35) Not including business enterprise sector.
(36) Skilled workers are included with technicians and equivalent staff rather than with other supporting staff.
(37) Not including scientists and engineers engaged in the administration of R&D; data for technicians include skilled workers; of military R&D, only that part carried out in civil establishments is included.

Country
Pays
País
Année
Año
Year
Por persona (en moneda nacional)
Annual average per researcher (in national
currency)
Moyenne anuelle par chercheur (en monnaie
Promedio anual por investigador (en
moneda nacional)
Per capita (in national currency)
Par habitant (en monnaie nationale)
Número de técnicos por investigador
En pourcentage du produit national brut
As percentage of gross national product (GNP)
En porcentaje del producto nacional bruto
(PNB)
Number of technicians per researcher
Nombre de techniciens par chercheur
Investigadores por millón de habitantes
Technicians per million inhabitants
Techniciens par million d'habitants
Técnicos por millón de habitantes
Chercheurs par million d'habitants
Gastos destinados a la I y D
Expenditure for R&D
Dépenses consacrées à la R-D
Personnel engaged in R&D
Personnel employé à des travaux de R-D
Personal dedicado a actividades de I y D
Researchers per million inhabitants
(38) Due to methodological changes, "managerial personnel in the technical section" previously classified as researchers are now included with technicians.
(39) Not including data for technicians and equivalent staff as well as other supporting staff in the higher education sector.
(40) Not including capital expenditure in the productive sector (integrated R&D) and in the higher education sector.
(41) Not including data for the productive sector (integrated R&D).
(42) Not including data for private non-profit organizations.
(43) Not including social sciences and humanities in the productive and general service sectors.
(44) Data refer to current expenditure only.
(45) Data relate to one research institute only.

Statistical tables from the 1999 UNESCO Statistical Yearbook
Personnel engaged in R&D by category of personnel
Personnel employé dans la R-D par catégorie de personnel
Personal empleado en I y D por categoría de personal
Country
Pays
País
Benin (1) 1989 2 687 794 100 242 64 1 651 339
1996 738 162 32 158 13 418 …
1997 780 176 34 165 16 439 …
1984 515 114 10 90 … 311 …
1989 814 170 17 168 … 476 …
1984 1 290 196 … 166 … 928 …
1990 … 162 16 92 5 … …
Congo (3) 1984 2 335 862 … 1 473 … … …
1982 46 796 19 939 (3) 11 503 6 678 (3) 3 947 20 179 (3) 13 487
1983 46 797 19 941 … 6 678 … 20 178 …
1986 47 970 20 893 … 6 733 … 20 344 …
1990 89 154 24 599 8 055 17 150 1 200 47 405 25 471
1991 102 296 26 415 … 19 607 … 56 274 …
Libyan Arab Jamahiriya 1980 3 600 1 100 … 1 500 … 1 000 …
Madagascar (4) 1994 1 047 159 45 483 175 405 85
1980 1 069 152 … 108 … 809 …
1981 1 318 182 … 106 … 1 030 …
1982 1 388 173 … 169 … 1 046 …
1983 1 191 211 (3) 13 165 (3) 16 815 (3) 108
1984 1 224 263 20 176 26 785 96
1985 1 113 267 25 191 22 655 80
1986 1 145 305 26 181 29 659 99
1987 995 234 23 172 29 589 70
1988 962 231 24 116 33 615 79
1989 1 021 193 33 172 46 656 97
1992 1 162 389 … 170 … 603 …
1983 18 741 1 702 … 9 947 … 7 092 …
1984 18 345 1 650 … 9 696 … 6 999 …
1985 13 924 1 422 … 6 565 … 5 937 …
Los datos se expresan en equivalente de jornada completa (EJC)
Les données sont exprimées en équivalent plein temps (EPT)Data are expressed in full-time equivalent (FTE)
MF F MF FMF F
Técnicos y personal asimilado
Other supporting staff
Autre personnel de soutien
Otro personal de apoyo
Techniciens et personnel assimilé
Technicians andequivalent staff
Année
Todo el personal de I y D
Researchers
Chercheurs
Investigadores
Year All R&D personnel
Tout le personnel de R-D
Nigeria (5)
Africa - Afrique - África
Año
III.2
Burkina Faso
Egypt
Mauritius
Central African Republic (3)
Burundi (2)(3)

Country
Pays
País
Los datos se expresan en equivalente de jornada completa (EJC)
Les données sont exprimées en équivalent plein temps (EPT)Data are expressed in full-time equivalent (FTE)
MF F MF FMF F
Técnicos y personal asimilado
Other supporting staff
Autre personnel de soutien
Otro personal de apoyo
Techniciens et personnel assimilé
Technicians andequivalent staff
Année
Todo el personal de I y D
Researchers
Chercheurs
Investigadores
Year All R&D personnel
Tout le personnel de R-D
Año
1986 12 845 1 499 … 6 005 … 5 341 …
1987 12 880 1 338 … 6 042 … 5 500 …
1980 111 48 … 36 … 27 …
1982 130 62 … 41 … 27 …
1983 149 64 … 55 … 30 …
1984 164 69 … 60 … 35 …
1995 315 181 18 40 31 94 33
1993 84 20 5 32 9 32 …
1994 83 19 6 32 8 32 …
1995 76 19 5 28 7 29 …
1996 78 19 5 29 7 30 …
1983 15 995 7 939 … 4 819 … 3 237 …
1985 19 510 9 946 … 6 044 … 3 520 …
1987 20 557 11 469 … 5 600 … 3 488 …
1989 18 175 9 919 … 4 584 … 3 672 …
1991 22 223 12 102 … 5 006 … 5 115 …
1993 60 464 37 192 … 11 343 … 11 929 …
1989 1 200 277 … 183 … 740 …
1994 1 473 387 … 249 … 837 …
1993 3 130 953 … 480 … 1 697 …
1994 3 324 1 003 … 528 … 1 793 …
1995 3 476 1 043 … 510 … 1 923 …
1996 3 589 1 085 … 524 … 1 980 …
1997 3 680 1 145 … 524 … 2 011 …
1993 708 298 94 215 25 195 …
1994 800 344 122 244 18 212 …
1995 860 362 136 298 23 200 …
1996 890 386 149 285 27 219 …
1997 950 422 162 272 34 256 …
(8) 1981 78 180 39 060 … … … … …
(6) 1982 *87 570 *45 010 … *22 790 … *19 770 …
(6) 1983 89 820 46 110 … 22 670 … 21 040 …
(6) 1984 94 200 49 190 … 24 210 … 20 800 …
(6) 1985 99 840 53 100 … 25 830 … 20 910 …
(6) 1986 103 740 56 510 … (7) 26 600 … 20 630 …
(8) 1986 105 420 56 750 … … … … …
(6) 1987 107 680 58 490 … 27 870 … 21 320 …
(8) 1988 111 440 61 540 … … … … …
(6) 1989 112 020 62 050 … (7) 28 940 … 21 030 …
Uganda
Canada
Senegal (40)
South Africa
Togo
Tunisia
Rwanda
North America - Amérique du Nord - América del Norte

Country
Pays
País
Los datos se expresan en equivalente de jornada completa (EJC)
Les données sont exprimées en équivalent plein temps (EPT)Data are expressed in full-time equivalent (FTE)
MF F MF FMF F
Técnicos y personal asimilado
Other supporting staff
Autre personnel de soutien
Otro personal de apoyo
Techniciens et personnel assimilé
Technicians andequivalent staff
Année
Todo el personal de I y D
Researchers
Chercheurs
Investigadores
Year All R&D personnel
Tout le personnel de R-D
Año
(6) 1990 113 550 63 930 … (7) 27 890 … 21 730 …
(6) 1991 114 500 65 350 … (7) 27 520 … 21 630 …
(8) 1992 117 330 70 050 … … … … …
(6) 1993 126 910 76 550 … 30 920 … 19 440 …
(8) 1994 126 660 77 860 … … … … …
(8) 1995 129 750 80 510 … … … … …
(3) 1988 1 528 1 528 … … … … …
1996 1 866 1 866 … … … … …
1980 21 521 5 637 … 6 556 … 9 328 …
1981 25 249 6 834 … 7 959 … 10 456 …
1982 26 574 7 497 … 8 066 … 11 011 …
1983 29 064 8 247 (3) 5 089 8 408 … 12 409 …
1984 32 937 9 548 … 8 843 … 14 546 …
1985 34 150 10 305 … 9 238 … 14 607 …
1986 32 192 10 068 … 8 687 … 13 437 …
1987 33 287 11 225 … 8 962 … 13 100 …
1989 32 614 12 052 … 8 830 … 11 732 …
1991 37 829 16 433 … 9 558 … 11 838 …
1992 35 996 14 770 6 383 9 465 5 251 11 761 4 892
1995 44 119 17 667 … 12 288 … 14 164 …
El Salvador 1992 1 775 (9) 102 … (9) 1 612 … 61 …
Guatemala (10) 1988 2 575 858 … 925 … 792 …
1982 86 24 … 13 … 49 …
1983 104 26 … 19 … 59 …
1984 100 23 … 21 … 56 …
1985 121 21 … 31 … 69 …
1986 104 18 10 15 3 71 40
1984 68 972 16 679 4 319 29 467 7 631 22 826 5 911
1993 26 932 14 103 … 9 441 … 3 388 …
1994 30 501 17 061 … 9 437 … 4 003 …
1995 33 297 19 434 … 6 675 … 7 188 …
1985 1 803 650 … 212 … 941 …
1987 2 005 725 … 302 … 978 …
1980 658 700 658 700 … … … … …
1981 691 400 691 400 … … … … …
1982 702 800 702 800 … … … … …
1983 722 500 722 500 … … … … …
1984 797 800 797 800 … … … … …
1985 849 200 849 200 … … … … …
1986 896 500 896 500 … … … … …
Jamaica (11)
Mexico
United States (12) (13)
Nicaragua (3)
Costa Rica (13)
Cuba

Country
Pays
País
Los datos se expresan en equivalente de jornada completa (EJC)
Les données sont exprimées en équivalent plein temps (EPT)Data are expressed in full-time equivalent (FTE)
MF F MF FMF F
Técnicos y personal asimilado
Other supporting staff
Autre personnel de soutien
Otro personal de apoyo
Techniciens et personnel assimilé
Technicians andequivalent staff
Année
Todo el personal de I y D
Researchers
Chercheurs
Investigadores
Year All R&D personnel
Tout le personnel de R-D
Año
1987 *923 300 *923 300 … … … … …
1988 *949 200 *949 200 … … … … …
1993 *962 700 *962 700 … … … … …
1980 *22 800 *9 500 (3) *5 400 *13 300 … … …
1982 35 144 10 486 (3) 6 705 8 124 … 16 534 …
1985 *28 900 *10 800 … *7 100 … *11 000 …
1988 *22 855 *11 088 *4 798 *6 241 … *5 526 …
1995 32 510 22 927 10 655 5 092 … 4 491 …
(3) 1991 … 1 681 700 1 039 500 … …
1992 … 1 088 … … … … …
1993 … 1 120 … … … … …
1994 … 1 180 … … … … …
1995 … 1 200 … … … … …
1996 … 1 300 … … … … …
Brazil 1995 ,,, (14) 26 754 … 9 327 … … …
Chile (3) 1988 8 740 4 630 … 2 940 … 1 170 …
Colombia 1982 (1) 3 709 1 083 … 1 024 … 1 602 …
1990 1 415 1 043 240 (15) 372 … (15) ./. …
1995 … 1 517 472 … … … …
1997 1 874 1 676 250 (15) 198 … (15) ./. …
Paraguay (3) 1981 ... 807 … … … 1 545 …
1996 ... 5 551 … 234 … … …
1997 ... 5 576 … 34 … … …
Uruguay (3) 1987 … 2 093 720 … … … …
Venezuela 1992 *5 333 *4 258 *1 490 *650 *205 *425 *179
Armenia 1997 7 716 5 492 2 509 653 321 1 571 …
1993 30 555 24 519 10 448 1 989 … 4 047 …
1994 27 478 23 276 10 177 1 477 … 2 725 …
1995 25 629 21 547 8 813 1 356 … 2 726 …
1996 25 556 21 234 8 889 1 428 … 2 894 …
1993 16 496 5 843 664 3 645 61 7 008 …
1994 15 010 5 418 568 2 055 404 7 537 …
1995 16 629 6 097 851 3 825 728 6 707 …
Argentina
Bolivia
South America - Amérique du Sud - América del Sur
Peru
Azerbaijan
Bangladesh
Asia - Asie - Asia
Ecuador

Country
Pays
País
Los datos se expresan en equivalente de jornada completa (EJC)
Les données sont exprimées en équivalent plein temps (EPT)Data are expressed in full-time equivalent (FTE)
MF F MF FMF F
Técnicos y personal asimilado
Other supporting staff
Autre personnel de soutien
Otro personal de apoyo
Techniciens et personnel assimilé
Technicians andequivalent staff
Année
Todo el personal de I y D
Researchers
Chercheurs
Investigadores
Year All R&D personnel
Tout le personnel de R-D
Año
1994 655 100 420 700 … (15) 234 400 … (15) ./. …
1995 665 600 422 700 … (15) 242 900 … (15) ./. …
1996 787 000 559 000 … (15) 228 000 … (15) ./. …
China, Hong Kong SAR (36) 1995 1 627 574 … 613 … 440 …
1991 341 135 … 153 … 53 …
1992 366 147 … 165 … 54 …
(16) 1982 *218 995 *93 698 3 276 60 887 … 64 410 …
(16) 1984 *244 049 *100 136 3 653 72 233 … 71 680 …
(16) 1986 *256 735 *107 409 … *70 233 … *79 093 …
(16) 1988 *286 381 *119 027 *5 552 *80 956 *4 233 *86 398 *8 214
(16) 1990 *322 977 *128 036 (18) 7 710 96 737 6 138 98 204 13 140
(17) 1992 315 448 117 586 7 737 98 202 7 096 99 660 …
(16) 1994 *336 589 *136 503 10 505 98 769 9 333 101 317 17 411
1982 28 464 17 287 … 3 234 … 7 943 …
1984 36 185 24 895 … 4 125 … 7 165 …
1985 … 21 160 … 3 888 … … …
1985 (19) 5 048 3 194 … 1 854 … … …
1994 50 326 34 256 … 10 104 … 5 966 …
Israel 1984 26 800 20 100 (3) 10 400 4 300 1 400 2 400 2 100
(20)(6) 1980 601 192 441 186 33 734 86 970 (15) 51 924 73 036 …
(20)(6) 1981 629 172 463 062 34 007 90 426 (15) 54 733 75 684 …
(20)(6) 1982 648 977 479 954 … 91 169 … 77 854 …
(20)(6) 1983 668 939 496 145 37 891 93 326 17 858 79 468 41 865
(20)(6) 1984 710 872 531 612 41 496 97 074 18 314 82 186 42 580
(20)(6) 1985 730 432 548 249 43 490 99 280 19 294 82 903 43 665
(20)(6) 1986 761 650 575 292 46 187 101 861 19 453 84 497 45 167
(20)(6) 1987 778 501 590 680 48 765 102 486 20 250 85 335 45 212
(20)(6) 1988 803 833 614 854 55 384 102 950 20 410 86 029 46 242
(20)(6) 1989 830 855 636 817 45 040 105 430 20 364 88 608 47 770
(20)(6) 1990 863 382 666 393 … 104 190 … 92 799 …
(20)(6) 1991 899 286 688 994 … 113 562 … 96 730 …
(20)(6) 1992 910 051 705 346 … 108 014 … 96 691 …
(8) 1993 947 455 641 083 … … … … …
(20)(6) 1994 994 622 787 402 … 103 400 … 103 820 …
(8) 1995 948 088 673 421 … … … … …
(8) 1996 891 783 617 365 … … … … …
1984 *610 *421 … *29 … *160 …
1985 *585 *400 … *29 … *156 …
1987 *602 *422 … *30 … *150 …
Indonesia (3)
Iran, Islamic Republic of
Japan
Jordan (21)
India
China
Cyprus

Country
Pays
País
Los datos se expresan en equivalente de jornada completa (EJC)
Les données sont exprimées en équivalent plein temps (EPT)Data are expressed in full-time equivalent (FTE)
MF F MF FMF F
Técnicos y personal asimilado
Other supporting staff
Autre personnel de soutien
Otro personal de apoyo
Techniciens et personnel assimilé
Technicians andequivalent staff
Année
Todo el personal de I y D
Researchers
Chercheurs
Investigadores
Year All R&D personnel
Tout le personnel de R-D
Año
1988 *609 *423 … *36 … *150 …
1989 (19) 463 422 … 41 … … …
(3)(22) 1980 30 473 18 434 … 7 417 … 4 622 …
(3)(22) 1981 35 805 20 718 … 8 815 … 6 272 …
(3)(22) 1982 46 390 28 448 … 11 663 … 6 279 …
(3)(22) 1983 58 720 32 117 1 816 19 493 (15) 5 195 7 110 …
(3)(22) 1984 70 524 37 103 … 25 153 … 8 268 …
(3)(22) 1985 73 516 41 473 … 24 152 … 7 891 …
(3)(22) 1986 87 430 47 042 2 743 30 465 4 806 9 923 3 275
(3)(22) 1987 96 288 52 783 … 32 923 … 10 582 …
(3)(22) 1988 104 737 56 545 3 670 35 720 … 12 472 …
(3)(22) 1989 119 357 66 220 … 38 655 … 14 482 …
(3)(22) 1990 125 512 70 503 … 42 841 … 12 168 …
(3)(22) 1991 131 983 76 252 … 10 782 … 44 949 …
(3)(22) 1992 148 947 88 764 5 512 15 253 … 44 930 …
(3)(22) 1994 190 298 117 446 … 14 141 … 58 711 …
(8) 1995 152 247 100 456 … … … … …
(8) 1996 135 703 99 433 … … … … …
1993 733 381 … 117 … 235 …
1994 763 397 … 122 … 244 …
1995 753 392 … 120 … 241 …
1996 763 397 … 122 … 244 …
1997 742 387 … 118 … 237 …
1993 5 897 3 826 … 417 … 1 654 …
1994 4 552 2 912 … 559 … 1 081 …
1995 4 558 3 279 … 323 … 956 …
1996 4 126 2 629 … 256 … 1 241 …
1997 4 161 2 685 1 249 226 … 1 250 …
1992 4 563 1 633 501 1 655 507 1 275 …
1994 6 675 2 286 597 811 198 3 577 …
1996 4 436 1 893 509 654 146 1 888 …
Mongolia 1995 3 599 2 228 939 431 237 940 554
1981 22 922 5 144 … 6 476 … 11 302 …
1982 24 723 5 397 … 7 138 … 12 188 …
1986 40 076 9 325 … 14 028 … 16 723 …
1988 28 990 6 641 … 9 286 … 13 063 …
1990 29 040 6 626 464 9 314 … 13 100 …
1997 36 706 9 977 859 1 749 27 24 980 …
Philippines 1992 14 578 9 960 5 260 1 399 374 3 219 1 338
Qatar (3)(24) 1986 290 229 58 61 2 … …
Pakistan (23)
Korea, Republic of
Kuwait
Kyrgyzstan
Malaysia

Country
Pays
País
Los datos se expresan en equivalente de jornada completa (EJC)
Les données sont exprimées en équivalent plein temps (EPT)Data are expressed in full-time equivalent (FTE)
MF F MF FMF F
Técnicos y personal asimilado
Other supporting staff
Autre personnel de soutien
Otro personal de apoyo
Techniciens et personnel assimilé
Technicians andequivalent staff
Année
Todo el personal de I y D
Researchers
Chercheurs
Investigadores
Year All R&D personnel
Tout le personnel de R-D
Año
(3) 1981 2 741 1 193 … 807 … 741 …
(3) 1984 4 886 2 401 *384 1 359 … 1 126 …
(3) 1987 5 876 3 361 649 1 526 … 989 …
1995 9 497 7 695 … 997 … 805 …
1984 (19) 3 211 2 619 … 592 … … …
1985 (19) 3 483 2 790 667 693 188 … …
1996 (19) 4 281 3 448 1 103 833 … … …
Syrian Arab Republic 1997 804 440 … 364 … … …
1992 … 3 974 1 144 … … … …
… 3 722 … … … … …
1987 10 621 5 539 … 2 785 … 2 297 …
1989 8 200 4 738 … 1 763 … 1 699 …
1993 12 064 6 513 … 2 535 … 3 016 …
1995 12 802 6 899 1 639 2 346 1 113 3 557 1 973
1996 10 209 6 038 … 2 303 … 1 868 …
1984 27 007 9 914 … 6 284 … 10 809 …
1985 29 241 11 276 … 7 367 … 10 598 …
1990 (16) 16 019 12 366 … 1 226 … (17) 2 427 …
1991 (16) 14 969 11 948 … 1 329 … (17) 1 692 …
(8) 1992 15 701 12 573 … … … … …
(8) 1993 16 087 13 605 … … … … …
(8) 1994 16 899 14 460 … … … … …
1995 (16) 18 498 15 854 … 1 606 … (17) 1 038 …
(8) 1996 21 995 18 092 … … … … …
Uzbekistan 1992 … *37 625 *17 005 *6 687 … … …
Viet Nam (37) 1995 … 20 000 … … … … …
1981 18 599 6 712 … 6 145 … 5 742 …
1984 20 161 7 609 … 6 817 … 5 735 …
(8) 1985 20 161 7 609 … … … … …
1989 23 083 8 782 (25) 868 8 434 … 5 867 …
1993 24 458 12 821 2 008 6 397 1 945 5 240 2 119
1992 52 728 33 685 … 5 254 … 13 789 …
1993 47 524 30 474 … 4 164 … 12 886 …
1994 39 819 26 141 … 3 579 … 10 099 …
1995 35 858 23 771 … 3 131 … 8 956 …
1996 34 898 23 324 … 2 758 … 8 816 …
(8) 1981 32 531 12 747 … … … … …
Turkey
Austria
Belarus
Europe - Europa - Europa
Belgium
Singapore (22)
Sri Lanka
Thailand
Tajikistan (3)

Country
Pays
País
Los datos se expresan en equivalente de jornada completa (EJC)
Les données sont exprimées en équivalent plein temps (EPT)Data are expressed in full-time equivalent (FTE)
MF F MF FMF F
Técnicos y personal asimilado
Other supporting staff
Autre personnel de soutien
Otro personal de apoyo
Techniciens et personnel assimilé
Technicians andequivalent staff
Année
Todo el personal de I y D
Researchers
Chercheurs
Investigadores
Year All R&D personnel
Tout le personnel de R-D
Año
(8) 1982 33 042 13 410 … … … … …
(8) 1983 33 032 13 431 … … … … …
(8) 1984 33 390 13 906 … … … … …
(8) 1985 34 859 14 759 … … … … …
1986 36 203 15 705 … (15) 20 498 … (15) ./. …
1987 36 727 16 045 … (15) 20 682 … (15) ./. …
1988 36 770 16 646 … (15) 20 124 … (15) ./. …
1989 37 795 17 583 … (15) 20 212 … (15) ./. …
1990 38 773 18 465 … (15) 20 308 … (15) ./. …
1991 *40 063 *18 105 … (15) 21 958 … (15) ./. …
(8) 1994 37 703 22 552 … … … … …
(8) 1995 38 449 22 918 … … … … …
1980 (16) 72 335 38 706 16 829 (16) 10 483 7 295 (16) 23 146 8 335
1981 (16) 78 477 41 378 19 187 (16) 11 856 7 999 (16) 25 243 11 550
1982 (16) 81 207 42 756 19 697 (16) 12 519 8 385 (16) 25 932 12 074
1983 (16) 83 291 43 462 19 890 (16) 12 429 8 186 (16) 27 400 12 894
1984 (16) 87 329 45 125 21 070 (16) 12 484 8 347 (16) 29 720 14 022
1985 (16) 90 308 48 008 22 769 (16) 13 099 8 514 (16) 29 201 13 589
1986 (16) 91 168 46 329 20 289 (16) 11 271 6 724 (16) 33 568 16 346
1987 (16) 96 471 50 585 22 268 (16) 11 662 6 774 (16) 34 224 17 443
1988 100 731 49 703 … 12 444 … 38 584 …
1989 107 301 50 932 … 12 201 … 44 168 …
1990 112 158 52 597 … 12 266 … 47 295 …
1991 88 733 49 705 23 592 11 407 6 409 27 621 14 319
1992 (26) 57 655 37 825 17 362 10 752 6 555 9 078 5 606
1993 41 606 27 292 12 120 7 811 4 994 6 503 …
1994 23 729 12 608 5 220 7 665 5 184 3 456 …
1995 25 055 13 990 5 723 7 697 5 298 3 368 …
1996 26 158 14 751 6 114 8 169 5 462 3 238 …
1988 20 818 9 716 … 4 795 … 6 307 …
1989 21 008 10 039 … 4 699 … 6 270 …
1990 19 000 9 286 … 4 461 … 5 253 …
1991 17 216 8 670 … 3 943 … 4 603 …
1992 17 233 8 928 3 339 3 818 2 332 4 487 3 069
1993 16 369 9 032 … 3 328 … 4 009 …
1994 15 713 8 812 … 3 075 … 3 826 …
1995 15 953 8 911 3 418 3 134 1 903 3 908 2 634
1996 15 787 8 597 3 364 3 204 2 033 3 986 …
(8) 1991 81 895 … … … … … …
(8) 1992 60 292 20 084 … … … … …
(8) 1993 40 793 13 627 … … … … …
(8) 1994 37 779 13 325 … … … … …
1995 22 678 11 935 … 7 153 … 3 590 …
(8) 1996 23 373 12 915 … … … … …
Bulgaria
Croatia
Czech Republic

Country
Pays
País
Los datos se expresan en equivalente de jornada completa (EJC)
Les données sont exprimées en équivalent plein temps (EPT)Data are expressed in full-time equivalent (FTE)
MF F MF FMF F
Técnicos y personal asimilado
Other supporting staff
Autre personnel de soutien
Otro personal de apoyo
Techniciens et personnel assimilé
Technicians andequivalent staff
Année
Todo el personal de I y D
Researchers
Chercheurs
Investigadores
Year All R&D personnel
Tout le personnel de R-D
Año
(8) 1997 23 230 12 580 … … … … …
(8) 1981 16 476 6 785 … … … … …
1982 17 235 7 255 … (15) 9 980 … (15) ./. …
1983 18 142 7 676 … (15) 10 466 … (15) ./. …
1984 19 029 8 123 … (15) 10 906 … (15) ./. …
1985 19 914 8 567 … (15) 11 347 … (15) ./. …
1986 20 934 9 171 … (15) 11 763 … (15) ./. …
1987 21 953 9 775 … (15) 12 178 … (15) ./. …
1988 23 146 10 369 … (15) 12 777 … (15) ./. …
1989 24 339 10 962 … (15) 13 377 … (15) ./. …
1990 25 047 11 505 … (15) 13 542 … (15) ./. …
1991 25 756 12 049 … (15) 13 707 … (15) ./. …
(8) 1992 26 573 12 861 … … … … …
1993 27 390 13 673 … (15) 13 717 … (15) ./. …
(8) 1995 30 213 15 954 … … … … …
(8) 1996 30 841 16 361 … … … … …
(8) 1997 31 467 16 766 … … … … …
(8) 1998 32 107 17 173 … … … … …
1996 4 689 3 047 1 252 545 390 1 097 …
1997 4 605 2 956 1 155 573 398 1 076 …
1991 26 559 12 082 … 5 377 … 9 100 …
1995 25 392 11 611 4 150 5 436 2 950 8 345 4 713
1981 18 004 9 722 … (15) 8 282 … (15) ./. …
1983 20 218 10 951 … (15) 9 267 … (15) ./. …
(8) 1985 23 550 … … … … … …
(8) 1987 26 227 10 593 … … … … …
(8) 1989 28 516 … … … … … …
(8) 1991 29 575 14 030 … … … … …
(8) 1993 30 527 15 229 … … … … …
(8) 1994 32 331 … … … … … …
(8) 1995 33 634 16 863 … … … … …
1980 236 200 74 900 … (15) 161 300 … … …
1981 249 100 85 500 … (15) 163 600 … … …
1982 259 000 90 100 … (15) 168 900 … … …
1983 261 200 92 700 … (15) 168 500 … … …
1984 269 900 98 200 … (15) 171 700 … … …
1985 273 000 102 300 … (15) 170 700 … … …
1986 274 301 104 953 … (15) 169 348 … … …
1987 277 921 109 359 … (15) 168 562 … … …
1988 283 099 115 163 … (15) 167 936 … … …
1989 289 282 120 430 … (15) 168 852 … … …
1990 293 031 123 961 … (15) 169 070 … … …
Denmark
Estonia (27)
Federal Republic of Yugoslavia
Finland
France

Country
Pays
País
Los datos se expresan en equivalente de jornada completa (EJC)
Les données sont exprimées en équivalent plein temps (EPT)Data are expressed in full-time equivalent (FTE)
MF F MF FMF F
Técnicos y personal asimilado
Other supporting staff
Autre personnel de soutien
Otro personal de apoyo
Techniciens et personnel assimilé
Technicians andequivalent staff
Année
Todo el personal de I y D
Researchers
Chercheurs
Investigadores
Year All R&D personnel
Tout le personnel de R-D
Año
1991 298 592 129 215 … (15) 169 377 … … …
(8) 1992 311 234 141 710 … … … … …
(8) 1993 314 170 145 898 … … … … …
1994 315 159 149 193 … (15) 165 966 … … …
(8) 1995 318 384 151 249 … … … … …
(8) 1996 320 805 154 839 … … … … …
(8) 1981 359 419 124 678 … … … … …
(8) 1983 368 995 130 843 … … … … …
(8) 1985 398 328 143 627 … … … … …
(8) 1987 419 207 165 616 … … … … …
(8) 1988 422 500 … … … … … …
(8) 1989 426 447 176 401 … … … … …
(8) 1990 431 100 … … … … … …
(8) 1991 516 331 241 869 … … … … …
(8) 1992 487 695 234 280 … … … … …
1993 475 018 229 839 … 118 985 … 126 194 …
(8) 1995 459 138 231 128 … … … … …
(8) 1989 9 586 5 461 … … … … …
(8) 1991 11 059 6 230 … … … … …
1993 14 549 8 030 … 3 257 … 3 262 …
1981 (28) 51 512 22 267 (3) 10 334 (29) 21 719 … (30) 7 526 …
1982 (28) 49 236 21 970 (3) 10 354 (29) 18 354 … (30) 8 912 …
1983 (28) 48 740 22 132 … (29) 18 477 … (30) 8 131 …
1984 (28) 49 360 22 518 (3) 10 528 (29) 18 438 … (30) 8 404 …
1985 (28) 48 745 22 479 … (29) 17 869 … (30) 8 397 …
1986 (28) 49 148 22 974 (3) 10 668 (29) 17 795 … (30) 8 379 …
1987 (28) 47 227 22 284 (3) 11 122 (29) 16 735 … (30) 8 208 …
1988 (28) 45 069 21 427 (3) 10 281 (29) 15 612 … (30) 8 030 …
1989 (28) 42 276 20 431 … (29) 14 113 … (30) 7 732 …
1990 36 384 17 550 … 11 711 … 7 123 …
1991 29 397 14 471 … 8 903 … (30) 6 023 …
1992 24 192 12 311 … 7 152 … 4 729 …
(8) 1993 22 609 11 818 … … … … …
(8) 1994 22 008 11 752 … … … … …
1995 19 585 10 499 … 5 207 … 3 879 …
(8) 1996 19 776 10 408 … … … … …
(8) 1997 20 758 11 154 … … … … …
1981 744 398 … (15) 346 … (15) ./. …
1983 776 413 … (15) 363 … (15) ./. …
1985 818 512 … (15) 306 … (15) ./. …
1987 877 556 … (15) 321 … (15) ./. …
1989 1 177 773 … (15) 404 … (15) ./. …
(8) 1990 1 188 676 … … … … …
Germany
Hungary
Greece
Iceland

Country
Pays
País
Los datos se expresan en equivalente de jornada completa (EJC)
Les données sont exprimées en équivalent plein temps (EPT)Data are expressed in full-time equivalent (FTE)
MF F MF FMF F
Técnicos y personal asimilado
Other supporting staff
Autre personnel de soutien
Otro personal de apoyo
Techniciens et personnel assimilé
Technicians andequivalent staff
Année
Todo el personal de I y D
Researchers
Chercheurs
Investigadores
Year All R&D personnel
Tout le personnel de R-D
Año
(8) 1991 1 197 687 … … … … …
(8) 1992 1 244 708 … … … … …
(8) 1993 1 363 815 … … … … …
(8) 1994 1 412 845 … … … … …
1995 1 694 1 076 … 393 … 225 …
(8) 1996 1 516 908 … … … … …
(8) 1997 1 779 1 130 … … … … …
1981 *5 474 *2 635 … *1 408 … *1 431 …
1982 5 449 2 773 … 1 271 … 1 405 …
1983 5 819 3 232 … 1 326 … 1 261 …
1984 6 193 3 626 … 1 336 … 1 231 …
1985 6 264 3 741 … 1 340 … 1 183 …
1986 6 343 3 861 … 1 348 … 1 134 …
(8) 1987 5 704 3 344 … … … … …
(8) 1988 8 590 6 351 … 1 291 … 948 …
(8) 1989 6 328 4 098 … … … … …
(8) 1990 6 846 4 618 … … … … …
(8) 1991 8 002 5 161 … … … … …
(8) 1992 8 488 5 547 … … … … …
1993 9 534 6 592 … 1 797 … 1 145 …
(8) 1994 10 681 7 307 … … … … …
(8) 1995 12 206 8 368 … … … … …
1980 95 803 46 999 … 27 605 … 21 199 …
1981 102 836 52 060 … 29 385 … 21 391 …
1982 105 927 56 707 … 28 027 … 21 193 …
1983 112 743 63 021 … 28 694 … 21 028 …
1984 112 884 61 979 … 30 480 … 20 425 …
1985 117 887 63 759 … 33 058 … 21 070 …
1986 122 352 67 844 … 32 892 … 21 616 …
1987 128 175 70 556 … 36 219 … 21 400 …
1988 135 665 74 833 … 38 287 … 22 545 …
1989 140 496 76 074 … 40 067 … 24 355 …
1990 144 917 77 876 … 42 304 … 24 737 …
(8) 1991 143 641 75 238 … … … … …
(8) 1992 142 855 74 422 … … … … …
(8) 1993 142 171 74 434 … … … … …
1994 143 823 75 722 … 45 701 … 22 400 …
(8) 1995 141 789 75 536 … … … … …
1993 6 552 3 999 1 593 1 066 729 1 487 …
1994 5 239 3 010 1 359 944 557 1 285 …
1995 5 238 3 072 1 413 1 008 603 1 158 704
1996 4 744 2 839 1 324 850 512 1 055 …
1997 4 437 2 610 1 197 872 470 955 …
Latvia
Italy
Ireland

Country
Pays
País
Los datos se expresan en equivalente de jornada completa (EJC)
Les données sont exprimées en équivalent plein temps (EPT)Data are expressed in full-time equivalent (FTE)
MF F MF FMF F
Técnicos y personal asimilado
Other supporting staff
Autre personnel de soutien
Otro personal de apoyo
Techniciens et personnel assimilé
Technicians andequivalent staff
Année
Todo el personal de I y D
Researchers
Chercheurs
Investigadores
Year All R&D personnel
Tout le personnel de R-D
Año
Lithuania 1996 12 569 7 532 3 129 2 344 1 546 2 693 …
Malta (36) 1988 46 34 … 5 .. 7 …
1994 13 142 2 158 … 8 421 3 702 2 563 …
1995 10 645 1 821 … 6 802 2 989 2 022 …
1996 10 697 1 096 … 7 142 3 118 2 459 …
1997 10 667 1 442 … 7 181 3 250 2 044 …
(6) 1980 53 560 26 430 … (15) 27 130 … (15) ./. …
(6) 1981 57 610 29 630 … (15) 27 980 … (15) ./. …
(6) 1982 57 450 30 160 … (15) 27 290 … (15) ./. …
(6) 1983 57 630 30 530 … (15) 27 100 … (15) ./. …
(6) 1984 58 400 31 320 … (15) 27 080 … (15) ./. …
(6) 1985 61 400 33 620 … (15) 27 780 … (15) ./. …
(6) 1986 62 830 35 250 … (15) 27 580 … (15) ./. …
(6) 1987 63 520 36 750 … (15) 26 770 … (15) ./. …
(6) 1988 64 420 37 520 … (15) 26 900 … (15) ./. …
(6) 1989 66 460 39 100 … (15) 27 360 … (15) ./. …
(6) 1990 68 170 40 260 … (15) 27 910 … (15) ./. …
(6) 1991 66 710 40 000 … 20 440 … 6 270 …
(8) 1992 72 310 … … … … … …
(8) 1993 74 420 32 200 … … … … …
(8) 1994 78 980 34 200 … … … … …
(8) 1995 79 256 34 038 … … … … …
(8) 1996 80 789 34 482 … … … … …
1981 14 843 7 498 … (15) 7 345 … (15) ./. …
1982 15 218 7 754 … (15) 7 464 … (15) ./. …
1983 15 969 8 283 … (15) 7 686 … (15) ./. …
1984 17 230 8 970 … (15) 8 260 … (15) ./. …
1985 18 781 9 692 … (15) 9 089 … (15) ./. …
1986 19 640 10 120 … (15) 9 520 … (15) ./. …
1987 19 888 11 465 … (15) 8 423 … (15) ./. …
1989 20 217 12 156 … (15) 8 061 … (15) ./. …
1991 20 252 13 460 … (15) 6 792 … (15) ./. …
(8) 1993 22 091 14 763 … … … … …
1995 23 938 15 931 … (15) 8 007 … (15) ./. …
(8) 1997 24 000 … … … … … …
1980 (16) 240 000 93 000 … (31) 57 000 … 90 000 …
1981 (16) 221 000 89 000 … (31) 51 000 … 81 000 …
1982 (16) 188 000 79 000 … (31) 41 000 … 68 000 …
1983 (16) 176 000 75 000 … (31) 37 000 … 64 000 …
1984 (16) 174 000 75 000 … (31) 35 000 … 64 000 …
1985 (16) 181 000 57 000 … (31) 54 000 … 70 000 …
1986 (16) 177 000 45 000 … (31)(32) 62 000 … 70 000 …
Poland
Moldova
Netherlands
Norway

Country
Pays
País
Los datos se expresan en equivalente de jornada completa (EJC)
Les données sont exprimées en équivalent plein temps (EPT)Data are expressed in full-time equivalent (FTE)
MF F MF FMF F
Técnicos y personal asimilado
Other supporting staff
Autre personnel de soutien
Otro personal de apoyo
Techniciens et personnel assimilé
Technicians andequivalent staff
Année
Todo el personal de I y D
Researchers
Chercheurs
Investigadores
Year All R&D personnel
Tout le personnel de R-D
Año
1987 (16) 174 000 43 000 … (31)(32) 64 000 … 67 000 …
(8) 1994 79 248 47 433 … … … … …
1995 82 852 49 787 *17 695 19 553 *8 628 13 512 *7 381
(8) 1996 83 348 52 474 … … … … …
1980 7 711 2 663 … 2 867 … 2 181 …
1982 8 552 3 019 … 3 100 … 2 433 …
1984 9 267 3 475 … 3 059 … 2 733 …
1986 10 570 4 479 … 3 419 … 2 672 …
1988 10 883 5 004 … 3 571 … 2 308 …
1990 12 043 5 908 … 3 755 … 2 380 …
(8) 1992 13 448 9 451 … … … … …
1995 15 589 11 648 … 1 645 … 2 296 …
1987 167 049 58 647 … 42 195 … 66 207 …
1988 167 711 58 879 … 42 362 … 66 470 …
1989 169 964 59 670 24 582 42 931 28 204 67 363 29 563
1991 60 712 28 302 (26) 12 675 11 248 (26) 6 085 (26) 21 162 (26) 11 616
1994 59 102 31 672 14 048 13 272 7 991 14 158 …
1994 1 264 138 621 790 256 328 130 452 … 511 896 …
1996 1 113 244 562 070 229 959 96 922 … 454 252 …
1997 1 053 013 532 469 210 662 89 003 … 431 541 …
1992 30 284 10 681 … 5 605 … 13 998 …
1993 25 094 8 927 … 4 532 … 11 635 …
1994 17 256 10 249 3 540 4 244 2 270 2 763 …
1995 16 182 9 711 3 420 4 081 2 198 2 390 1 325
1996 16 613 10 010 7 164 4 244 3 601 2 359 …
1992 12 653 5 789 1 745 4 615 2 197 2 249 1 557
1993 8 866 3 745 1 253 2 337 1 281 2 784 …
1994 9 924 4 767 1 544 2 323 1 158 2 834 …
1995 9 879 4 897 1 569 2 183 1 107 2 799 1 374
1996 8 882 4 489 1 486 2 048 961 2 345 …
(8) 1981 36 221 19 268 … … … … …
(8) 1982 35 530 18 782 … … … … …
(8) 1983 36 169 19 450 … … … … …
1984 (16) 39 287 20 506 2 747 6 181 615 12 600 3 489
1985 (16) 40 653 21 455 2 918 7 024 698 12 174 3 465
1986 (16) 44 947 24 525 3 852 7 596 839 12 826 3 923
1987 (16) 48 103 26 462 4 474 8 196 1 020 13 445 4 296
1988 (16) 54 337 31 170 (26) 7 585 9 914 1 448 13 253 4 101
1989 (16) 58 025 32 812 (26) 8 174 11 150 1 683 14 063 4 703
1990 (16) 64 582 37 534 (26) 9 907 11 735 2 007 15 313 5 210
(8) 1991 72 406 40 642 … … … … …
(8) 1992 73 320 41 681 … … … … …
Slovakia
Slovenia
Spain
Portugal
Romania
Russian Federation

Country
Pays
País
Los datos se expresan en equivalente de jornada completa (EJC)
Les données sont exprimées en équivalent plein temps (EPT)Data are expressed in full-time equivalent (FTE)
MF F MF FMF F
Técnicos y personal asimilado
Other supporting staff
Autre personnel de soutien
Otro personal de apoyo
Techniciens et personnel assimilé
Technicians andequivalent staff
Année
Todo el personal de I y D
Researchers
Chercheurs
Investigadores
Year All R&D personnel
Tout le personnel de R-D
Año
(8) 1993 75 734 43 367 … … … … …
1994 80 399 47 867 … 13 532 … (34) 19 000 …
(8) 1995 79 988 47 342 … … … … …
(8) 1996 87 263 51 633 … … … … …
(8) 1997 89 029 … … … … … …
1981 (35) 42 214 17 696 … (15) 24 518 … (15) ./. …
1983 (35) 45 758 18 400 … (15) 27 358 … (15) ./. …
1985 (35) 49 599 21 200 … (15) 28 399 … (15) ./. …
1987 (35) 51 811 22 725 … (15) 29 086 … (15) ./. …
1989 (35) *55 129 *25 585 … (15) *29 544 … (15) ./. …
1991 53 604 26 515 … (15) 27 089 … (15) ./. …
1993 59 876 32 288 … (15) 27 588 … (15) ./. …
(8) 1995 62 635 33 665 … … … … …
1986 45 200 14 910 … 10 710 … 19 580 …
1989 51 000 16 300 … 9 300 … 25 400 …
(8) 1992 47 870 17 710 … … … … …
(8) 1996 50 265 21 635 … … … … …
The Former Yugoslav Rep. of Macedonia
1995 5 043 2 620 1 081 1 070 794 1 353 898
1995 263 730 163 299 … 36 687 … 63 744 …
1996 240 709 147 732 … 36 524 … 56 453 …
1997 193 397 112 327 … 29 725 … 51 345 …
(8) 1981 312 000 127 000 … … … … …
(8) 1982 308 000 128 000 … … … … …
(8) 1983 303 000 127 000 … … … … …
(8) 1984 296 000 129 000 … … … … …
(8) 1985 289 000 131 000 … … … … …
(8) 1986 291 000 134 000 … … … … …
(8) 1987 288 000 134 000 … … … … …
(8) 1988 290 000 137 000 … … … … …
(8) 1989 281 000 133 000 … … … … …
(8) 1990 280 000 133 000 … … … … …
(8) 1991 261 000 128 000 … … … … …
(8) 1992 264 000 131 000 … … … … …
1993 279 000 140 000 … 59 000 … 80 000 …
1981 45 211 24 486 … 12 284 … 8 441 …
1984 51 255 28 967 … 13 947 … 8 341 …
1985 53 798 30 406 … 14 848 … 8 544 …
1986 60 109 35 029 … 16 255 … 8 825 …
1987 62 442 36 424 … 16 526 … 9 492 …
1988 66 042 39 471 … 16 647 … 9 924 …
United Kingdom
Switzerland
Ukraine
Australia
Oceania - Océanie - Oceanía
Sweden

Country
Pays
País
Los datos se expresan en equivalente de jornada completa (EJC)
Les données sont exprimées en équivalent plein temps (EPT)Data are expressed in full-time equivalent (FTE)
MF F MF FMF F
Técnicos y personal asimilado
Other supporting staff
Autre personnel de soutien
Otro personal de apoyo
Techniciens et personnel assimilé
Technicians andequivalent staff
Année
Todo el personal de I y D
Researchers
Chercheurs
Investigadores
Year All R&D personnel
Tout le personnel de R-D
Año
1990 67 796 41 837 … 15 922 … 10 037 …
1994 86 161 56 520 … 14 133 … (34) 15 508 …
(8) 1996 90 519 60 890 … … … … …
Fiji (38) 1986 156 36 4 90 10 30 …
1985 (36) 46 19 … 11 … 16 …
1986 (36) 47 19 … 11 … 17 …
1987 (36) 48 19 … 11 … 18 …
1989 (36) *52 *21 *4 *11 *4 *20 *2
1991 (36) 55 23 5 11 5 21 1
New Caledonia (39) 1985 334 77 7 71 11 186 37
(8) 1989 9 148 4 818 … … … … …
(8) 1990 8 808 4 893 … … … … …
(8) 1991 8 706 4 752 … … … … …
(8) 1992 9 932 5 903 … … … … …
1993 10 488 6 198 … 2 866 … 1 424 …
(8) 1995 10 547 6 104 … … …
For general explanations and definitions, please refer to the Notes and Explanations on country tables.
Notes(1) Not including data for the productive sector (non-integrated R&D)
(2) Not including data for the productive sector.
(3) Data refer to full-time plus part-time personnel.
(4) Data refer to the Ministry of Scientific Research only
(5) Data relate only to 23 out of 26 national research institutes under the Federal Ministry of Science and Technology
(6) Not including data for social sciences and humanities in the productive sector (integrated R&D)
(7) Technicians and equivalent staff engaged in social sciences and humanities are included with other supporting staf
(8) Data for researchers refers to full-time-equivalent Data are from OECD.
(9) Data refer to researchers and technicians and equivalent staff in public enterprises only
(10) Data relate to the productive sector (integrated R&D) and the higher education sector only
(11) Data relate to the Scientific Research Council only
(12) Not including data for law, humanities and education
(13) Data refer to researchers only.
(14) Data refer to researchers listed in the directory of research group in Brazil by the Conselho Nacional de Desenvolvimento Cientifico e Tecnologica (CNPq
(15) Technicians and equivalent staff and other supporting staff are counted together
Guam
New Zealand

Country
Pays
País
Los datos se expresan en equivalente de jornada completa (EJC)
Les données sont exprimées en équivalent plein temps (EPT)Data are expressed in full-time equivalent (FTE)
MF F MF FMF F
Técnicos y personal asimilado
Other supporting staff
Autre personnel de soutien
Otro personal de apoyo
Techniciens et personnel assimilé
Technicians andequivalent staff
Année
Todo el personal de I y D
Researchers
Chercheurs
Investigadores
Year All R&D personnel
Tout le personnel de R-D
Año
(16) Not including technicians and equivalent staff and other supporting staff in the higher education secto
(17) Not including data for the higher education sector
(18) Data relating to women researchers do not include the higher education secto
(19) Not including data for other supporting staff
(20) Data refer to full-time personnel.
(21) Data relate to the East Bank only.
(22) Not including data for social sciences and humanities
(23) Data relate to R&D activities concentrated mainly in government-financed research establishments
(24) Not including social sciences and humanities in the higher education sector
(25) Not including data for the productive sector (integrated R&D)
(26) Due to methodological changes, data are not comparable with earlier years
(27) Not including business enterprise sector
(28) Not including personnel engaged in the administration of R&D
(29) Skilled workers are included with technicians and equivalent staff rather than with other supporting staf
(30) Data for other supporting staff do not include skilled workers but include security, maintenance and repair personne
(31) Data relating to technicians and equivalent staff refer only to those persons with a vocational education at the second level of education
(32) Due to methodological changes "managerial personnel in the technical section" previously classified as scientists and engineers are now included with technicians and equivalent sta
(33) not used
(34) Including technicians and equivalent staff in higher education sector
(35) Not including social sciences and humanities in the productive and general service sectors
(36) Data refer to the higher education sector only
(37) Not including general service sector.
(38) Data relate to one research institute only
(39) Data refer only to 6 out of 11 research institutes
(40) Data relate to one research institute only

Statistical tables from the 1999 UNESCO Statistical Yearbook
Percentage distribution of gross domestic expenditure on R&D by source of funds
Répartition en pourcentage des dépenses intérieures brutes de R-D par source de fonds
Distribución porcentual del gasto interior bruto en I y D por origen de fondos
Not distributed
Non répartis
Country Currency
Sin distribución
Pays Monnaie
(%)
País Moneda
Burundi (1)(2) 1989 Franc 536 187 - 39.4 - - 60.6 -
Central African Republic 1996 Franc C.F.A. (3) 130 899 - 100.0 - - - -
Congo 1984 Franc C.F.A. 25 530 25.5 68.8 - - 5.7 -
Madagascar (4) 1995 Franc 22 477 000 - 8.7 1.7 - 89.7 -
1980 36 500 20.5 34.0 45.5 ––> - -
1981 52 400 40.8 24.6 34.2 ––> 0.4 -
1982 56 300 39.1 29.5 30.9 ––> 0.5 -
1983 38 100 1.3 49.6 48.0 ––> 1.0 -
1984 38 700 1.6 41.3 53.2 ––> 3.9 -
1985 ... … 86.2 5.0 ––> 8.8 -
1986 52 900 1.5 39.5 53.1 ––> 5.9 -
1987 125 200 0.6 14.7 23.9 ––> 60.8 -
1988 57 600 1.9 26.4 63.7 ––> 8.0 -
(5) 1989 54 300 2.4 35.0 62.6 ––> … -
(6) 1997 ... … 94.7 … … 5.3 -
Nigeria (7) 1987 Naira 86 270 … 100.0 … … … -
Rwanda 1984 Franc 260 750 … 72.5 … … 17.8 9.7
1983 12 854 - 48.8 - - 51.2 -
(7) 1991 4 593 - 100.0 - - - -
1983 769 439 50.5 32.1 17.5 - - -
1985 1 077 305 41.3 35.4 23.3 ––> - -
1987 1 329 126 41.3 38.3 20.5 ––> - -
1989 1 774 447 41.9 34.6 23.5 ––> - -
1991 2 786 086 46.8 32.4 20.8 ––> - -
1993 2 594 107 54.4 42.7 1.8 ––> 1.0 -
Togo (8) 1995 Franc C.F.A. 52 737 405 - - - - 100.0 -
Tunisia 1997 Dinar 60 015 … 55.5 32.3 … 4.0 8.2
Uganda 1996 Shilling 34 866 530 2.2 6.6 0.6 0.3 90.3 -
(9) 1981 *4 334 000 *36.6 *38.7 *16.0 … *3.0 *5.7
(9) 1982 5 090 000 38.3 40.8 15.4 … 4 1.4
(9) 1983 5 365 000 38.6 *43.9 *13,4 … 4.2 -
(9) 1984 6 015 000 38.5 44.6 11.9 … 4.2 0.8
(9) 1985 6 709 000 40.6 40.5 11.8 … 4.4 2.7
(9) 1986 7 220 000 40.5 39.5 12.2 … 7.3 0.5
(9) 1987 7 542 000 40.9 37 11.2 … 9 1.9
(9) 1989 *8 786 000 *40.8 *36.1 *10.3 … *10.3 *2.5
(9) 1990 9 621 000 41.9 35.8 12.6 ––> 9.8 -
(9) 1991 10 024 000 41.3 35.3 13.4 ––> 10 -
1992 10 289 000 41.1 35.5 13.4 ––> 9.9 -
(9) 1993 *10 560 000 *41.2 *35.5 *13.3 ––> *10.0 -
1996 12 564 000 50.7 30.1 8.4 ––> 10.8 -
1989 703 100 … 100 … … … -
1990 838 400 … 100 … … … -
1991 1 378 600 … 100 … … … -
1981 111 614 … (5) 74.4 … … (5) 5.9 19.6
1982 131 064 … (5) 74.9 … … (5) 3.7 21.3
1983 143 188 - 98.4 - - 1.6 -
Rand
North America - Amérique du Nord - América del Norte
Fonds de l’etrangerInstitutions privées sans but lucratif
Seychelles Rupee
Peso
South Africa
(%)
Fondos del extranjeroInstituciones privadas sin fines de lucro
(%)
Enseñanza superior
Higher education
Enseignement supérieur
Sector de la administración
(%) (%)
Etat
Sector de empresas
Entreprises
Source of funds / Source de fonds / Origen de fondos
Business enterprise Funds from abroadGovernment Private non-profit
Año de referencia
Mauritius Rupee
Canada Dollar
Costa Rica (7) Colon
Dépenses intérieures brutes totales de R-D
Année de référence
(%)
Cuba
III.3
Reference year
Africa - Afrique - África
Total gross domestic expenditure on R&D
Gasto interior bruto total en I y D

Not distributed
Non répartis
Country Currency
Sin distribución
Pays Monnaie
(%)
País Moneda
Fonds de l’etrangerInstitutions privées sans but lucratif
(%)
Fondos del extranjeroInstituciones privadas sin fines de lucro
(%)
Enseñanza superior
Higher education
Enseignement supérieur
Sector de la administración
(%) (%)
Etat
Sector de empresas
Entreprises
Source of funds / Source de fonds / Origen de fondos
Business enterprise Funds from abroadGovernment Private non-profit
Año de referencia
Dépenses intérieures brutes totales de R-D
Année de référence
(%)
Reference year Total gross domestic expenditure on R&D
Gasto interior bruto total en I y D
1984 164 202 - 96.4 - - 3.6 -
1985 182 478 - 96.9 - - 3.1 -
(7) 1987 236 268 - 100 - - - -
(7) 1988 212 796 - 100 - - - -
(7) 1989 222 000 - 100 - - - -
(7) 1991 186 291 - 100 - - - -
(7) 1992 247 925 - 100 - - - -
(7) 1995 188 731 - 100 - - - -
1980 202 694 - 56.9 - - 43.1 -
1986 335 174 - 84.8 - - 15.2 -
1987 356 591 - 92.1 - - 7.9 -
(7) 1989 290 881 - 100 - - - -
1992 1 083 559 - 47.4 - - 52.6 -
Guatemala 1988 Quetzal (11) 31 859 0.5 36.7 45.7 ––> 17 -
Jamaica 1986 Dollar (12) 4 016 - 100 - - - -
1989 (36) 1 050 283 (13) 5 95 … … (13) ./. -
1995 5 622 597 17.6 66.2 8.4 1.1 6.7 -
Nicaragua 1987 Cordoba (5) *988 970 - *80.8 - - *19.2 -
Panama 1986 Balboa (14) 173 - 100 - - - -
1980 (15) 63 810 000 (5) 47.6 (5) 46.5 (5) 3.5 … … 2.4
1983 (15) 88 992 000 48.1 45.4 3.4 … … 3.1
1986 (15) 122 900 900 48.4 (5) 45 3.2 … … 3.5
1988 (15) 139 255 000 48.7 (5) 44.6 3.8 … … 2.9
1995 *171 000 000 *59.4 *35.5 *5.1 ––> … -
1988 3 466 700 8.0 85.0 5.0 ––> 2.0 -
1995 1 029 748 11.3 84.7 0.6 ––> 3.4 -
(14)(16)
1982 *305 500 000 *19.8 *66.9 *8.1 ––> *5.3 -
1995 (17) 5 770 830 20.8 43.9 … … - 35.3
1996 (17) 5 905 020 40.0 57.2 2.8 - - -
1986 14 263 900 27.1 68.3 4.6 … … -
1987 19 979 500 26.0 69.0 5.0 ––> … -
1988 23 161 300 18.2 70.4 8.1 ––> 3.3 -
1995 170 760 000 20.2 68.5 - - 11.3 -
1997 207 506 800 15.2 70.7 - 7.6 6.5 -
Colombia (18) 1982 Peso 2 754 273 … … … … 10.5 89.5
1984 Inti (19) 159 024 27.2 48.0 3.8 - 21.0 -
1995 Sol 756 877 - 81.9 18.1 ––> - -
1980 851 280 … 98.8 … … … 1.2
1981 1 012 170 - 100.0 - - - -
1982 1 151 820 - 100.0 - - - -
1983 1 196 500 - 100.0 - - - -
1984 1 361 820 - 100.0 - - - -
1985 1 411 720 - 100.0 - - - -
1986 1 294 930 - 100.0 - - - -
(20) 1987 2 458 200 - 100.0 - - - -
(20) 1988 3 249 900 - 100.0 - - - -
(20) 1989 3 890 200 - 100.0 - - - -
(20) 1990 11 847 000 - 100.0 - - - -
(20) 1991 14 313 500 - 100.0 - - - -
(20) 1992 19 622 000 - 100.0 - - - -
China, Hong Kong SAR 1995 Dollar (21) 2 742 000 2.8 91 5.7 - 0.5 -
(7) 1980 707 - 100 - - - -
(7) 1981 802 - 100 - - - -
(7) 1982 937 - 100 - - - -
Cyprus Pound
Chile Peso
Brazil Cruzeiro
South America - Amérique du Sud - América del Sur
United States Dollar
El Salvador (10) Colon
Asia - Asie - Asia
Mexico Peso
Argentina Peso
Peru
Venezuela (7) Bolivar

Not distributed
Non répartis
Country Currency
Sin distribución
Pays Monnaie
(%)
País Moneda
Fonds de l’etrangerInstitutions privées sans but lucratif
(%)
Fondos del extranjeroInstituciones privadas sin fines de lucro
(%)
Enseñanza superior
Higher education
Enseignement supérieur
Sector de la administración
(%) (%)
Etat
Sector de empresas
Entreprises
Source of funds / Source de fonds / Origen de fondos
Business enterprise Funds from abroadGovernment Private non-profit
Año de referencia
Dépenses intérieures brutes totales de R-D
Année de référence
(%)
Reference year Total gross domestic expenditure on R&D
Gasto interior bruto total en I y D
(7) 1983 1 044 - 100 - - - -
1984 1 173 - 98.8 - - 1.2 -
1991 4 835 14.7 75.5 7.3 - 2.5 -
1992 6 037 13.1 76.4 8.8 ––> 1.7 -
1982 (36) 12 060 300 13.4 82.7 … … … 3.9
1984 (36) 18 143 200 13 87 … … … -
1986 (36) 26 675 300 11.9 88.1 … … … -
1988 (36) 34 718 100 10.5 89.5 … … … -
1990 (36) 41 864 300 12.6 87.4 … … … -
1994 75 063 500 24 75 1 ––> - -
(7)(22) 1984 279 000 000 - 100 - - - -
(7)(22) 1985 242 120 000 - 100 - - - -
(7)(22) 1986 241 750 000 - 100 - - - -
1994 (23) 244 843 000 76.4 15.8 0.5 - 7.2 -
(7) 1984 21 527 000 - 100 - - - -
(7) 1985 22 010 713 - 100 - - - -
1994 620 849 320 - 86.8 13.2 ––> - -
1981 (24) 7 485 22.1 65.2 12.7 ––> - -
1982 (24) 19 217 23.2 66.5 10.3 ––> - -
1983 (24) 56 300 21.7 63.8 14.5 ––> - -
1990 2 323 400 38 37.6 16.9 ––> 7.5 -
1992 3 663 100 37.2 37.1 18 ––> 7.6 -
1995 5 842 000 35.7 40.7 10.2 7 6.5 -
1980 5 246 248 000 72 27.9 - - 0.1 -
1981 5 982 356 000 72.9 27 - - 0.1 -
1982 6 528 700 000 74.4 25.5 - - 0.1 -
1983 7 180 782 000 75.9 24 - - 0.1 -
1984 7 893 931 000 77.4 22.5 - - 0.1 -
1985 8 890 299 000 78.9 21 - - 0.1 -
1986 9 192 932 000 78.6 21.3 - - 0.1 -
1987 9 836 640 000 78.4 21.5 - - 0.1 -
1988 10 627 572 000 80 19.9 - - 0.1 -
1991 13 771 524 000 81.7 18.2 - - 0.1 -
Kazakstan 1997 Tenge 5 369 900 1 40.2 … 5.7 11.8 41.3
1980 211 726 652 48.4 49.8 - - 1.8 -
1981 293 131 465 56.4 41.5 - - 2.1 -
1982 457 688 485 58.7 41.1 - - 0.2 -
1983 621 749 314 72.5 27.3 - - 0.2 -
1986 1 523 279 000 80.9 19 - - 0.1 -
1988 2 454 152 000 78.3 17 0.4 … … 4.4
1990 3 349 864 000 80.6 15.2 … … … 4.2
1992 4 989 031 000 82.4 17.2 - - 0.4 -
1994 7 894 746 000 84 15.9 - - - -
Kuwait 1984 Dinar (20) 71 163 64.3 34.3 1.4 - - -
1995 46 309 29.4 67.3 1.8 ––> 1.5 -
1997 59 467 24.8 63.3 3.5 ––> 8.5 -
1988 (7) 87 100 - 100 - - - -
1989 (7) 97 200 - 100 - - - -
1992 550 700 43 53.1 2.1 ––> 1.8 -
1996 549 100 8.3 13.5 … … 1.6 76.6
1984 (26)(7) 3 834 287 - 100 - - - -
1987 (26)(7) 5 582 081 - 100 - - - -
1984 614 080 23.6 60.8 2.4 … 13 0.1
1992 *2 940 549 *1.9 *3.2 *70.2 ––> *24.7 -
Qatar 1986 Riyal 6 650 - 100 - - - -
1984 (25) 214 300 43 49 - - 8 -
1987 (25)(27)
374 700 59.6 38.8 1.6 - - -
1995 (25) 1 366 570 62.5 31.4 2.4 ––> 3.7 -
Philippines Peso
Singapore Dollar
Malaysia Ringgit
Pakistan Rupee
Korea, Republic of (25) Won
Kyrgyzstan Som
Israel Shekel
Japan (9) Yen
Indonesia Rupiah
Iran, Islamic Republic of Rial
India Rupee

Not distributed
Non répartis
Country Currency
Sin distribución
Pays Monnaie
(%)
País Moneda
Fonds de l’etrangerInstitutions privées sans but lucratif
(%)
Fondos del extranjeroInstituciones privadas sin fines de lucro
(%)
Enseñanza superior
Higher education
Enseignement supérieur
Sector de la administración
(%) (%)
Etat
Sector de empresas
Entreprises
Source of funds / Source de fonds / Origen de fondos
Business enterprise Funds from abroadGovernment Private non-profit
Año de referencia
Dépenses intérieures brutes totales de R-D
Année de référence
(%)
Reference year Total gross domestic expenditure on R&D
Gasto interior bruto total en I y D
1983 (6) 217 608 ./. (28) 91.2 … … 8.8 -
1984 (6) 256 799 … 83.7 … … 16.3 -
1985 3 473 000 13.8 69.6 - - 16.6 -
1987 2 664 380 9.7 68.5 7.2 ––> 14.5 -
1995 5 174 240 12.2 79.7 5.1 ––> 3.1 -
1996 (29) 5 528 135 … 61.1 6.8 8.7 5 18.4
1990 1 318 343 000 27.6 71.3 0.9 - 0.2 -
1991 3 330 047 000 28.5 70.1 1.3 - 0.2 -
1995 29 509 395 000 32.9 62.4 2.7 - 2 -
1983 331 000 - 100 - - - -
1984 516 000 - 100 - - - -
1985 498 000 - 100 - - - -
1981 12 331 026 50.2 46.9 0.4 ––> 2.5 -
1982 *13 798 400 *48.4 *48.8 *0.4 ––> *2.4 -
1983 *14 808 500 *48.7 *48.6 *0.4 ––> *2.3 -
1984 *16 210 700 *48.0 *49.3 *0.4 ––> *2.3 -
1985 17 182 272 49.1 48.1 0.3 ––> 2.5 -
1986 *18 691 700 *48.3 *49.1 *0.3 ––> *2.4 -
1987 *19 524 800 *48.8 *48.5 *0.3 ––> *2.4 -
1988 *20 797 700 *49.8 *47.5 *0.3 ––> *2.4 -
1989 22 966 910 53 43.4 0.3 ––> 3.2 -
1990 *24 281 600 *50.9 *46.5 *0.3 ––> 2.3 -
1993 31 694 247 49 47.9 0.4 ––> 2.6 -
1992 8 392 900 57.5 42.2 0.3 ––> … -
1995 1 325 959 800 59.5 40.1 0.4 ––> … -
1997 2 098 170 700 27.9 67.2 0.1 ––> 4.8 -
(30) 1987 91 323 600 67.9 26.5 0.7 ––> 1 3.9
(30) 1988 91 265 100 71.6 26.7 0.7 ––> 1 -
(31) 1990 108 545 800 70.4 27.6 0.7 ––> 1.3 -
1991 *112 065 000 *64.8 *31.3 *0.9 ––> *3.0 -
1980 470 800 62.8 37.2 - - - -
1981 537 000 65.8 34.2 - - - -
1982 631 800 62.4 37.6 - - - -
1983 669 800 62.5 37.5 - - - -
1984 696 900 63.2 36.8 - - - -
1985 812 300 64.2 35.8 - - - -
1986 856 100 64.4 35.6 - - - -
1987 923 800 59.8 40.2 - - - -
1989 1 042 400 58.4 41.6 - - - -
1991 1 874 800 65.7 34.3 - - - -
1996 9 148 000 60.5 35.1 3.8 0.4 0.1 -
1992 27 242 365 31.7 37.2 30.2 ––> 0.8 -
1995 1 159 331 19 63.3 17.3 ––> 0.4 -
Czech Republic 1995 C.Koruny 13 982 600 63.1 32.3 1.3 … 3.3 -
1983 6 097 000 45.6 48.8 1.5 ––> 2 2.1
1985 7 692 000 48.9 46 3.1 ––> 2.1 -
1987 9 933 000 47.6 45.9 3.8 ––> 2.7 -
1989 11 892 000 46.9 45.5 4.6 ––> 3.1 -
1991 14 100 000 51.4 39.7 4.6 ––> 4.4 -
1993 15 695 000 49.8 37.9 5 ––> 7.4 -
(32) 1995 250 604 12.9 71.3 6.2 - 9.6 -
1997 369 751 7.7 67.4 4.7 5.2 14.9 -
1995 (5) 424 831 28.2 54.1 16.8 - 0.8 -
1996 871 670 33.6 48.6 16.2 ––> 1.6 -
1981 2 595 000 54.5 39.4 0.8 … 1 4.3
1983 3 626 730 55.6 42.3 1.2 ––> 0.9 -
1987 6 792 000 58.8 39.4 0.7 ––> 1 -
Croatia Kuna
Denmark Krone
Estonia Krooni
Federal Republic of Yugoslavia Dinar
Finland
Austria Schilling
Belarus B.Rouble
Belgium Franc
Bulgaria Lev
Markka
Turkey Lira
Viet Nam (7) Dong
Sri lanka Rupee
Thailand Baht
Europe - Europa - Europa

Not distributed
Non répartis
Country Currency
Sin distribución
Pays Monnaie
(%)
País Moneda
Fonds de l’etrangerInstitutions privées sans but lucratif
(%)
Fondos del extranjeroInstituciones privadas sin fines de lucro
(%)
Enseñanza superior
Higher education
Enseignement supérieur
Sector de la administración
(%) (%)
Etat
Sector de empresas
Entreprises
Source of funds / Source de fonds / Origen de fondos
Business enterprise Funds from abroadGovernment Private non-profit
Año de referencia
Dépenses intérieures brutes totales de R-D
Année de référence
(%)
Reference year Total gross domestic expenditure on R&D
Gasto interior bruto total en I y D
1991 10 172 000 53.8 44.3 0.6 ––> 1.3 -
1995 12 915 000 57.7 37.4 0.4 ––> 4.5 -
1987 121 364 000 41.8 51.9 0.3 ––> 5.9 -
1988 130 631 000 43.3 49.9 0.6 ––> 6.2 -
1989 143 553 000 43.9 48.1 0.6 ––> 7.3 -
1990 157 146 000 43.5 48.3 0.7 ––> 7.5 -
1991 163 092 000 42.5 48.8 0.7 ––> 8 -
1994 175 563 000 48.7 41.6 1.4 ––> 8.3 -
Germany 1993 Deutsche Mark 76 721 000 61.4 36.7 0.3 ––> 1.6 -
1986 18 331 000 23.2 74.4 - - 2.4 -
1993 100 460 000 20.2 45.8 3.7 ––> 30.3 -
1981 19 425 000 79.3 20.3 - - 0.4 -
1982 21 215 000 80.2 19.4 - - 0.4 -
1983 20 419 000 78.5 21.2 - - 0.3 -
1984 22 686 000 78.2 21.4 - - 0.4 -
1985 24 077 000 78.6 20.9 - - 0.4 -
1986 27 453 000 79.6 19.5 - - 0.9 -
1987 32 155 000 79.1 19.8 - - 1.1 -
1988 32 402 000 76.6 21.1 1.3 ––-> 0.9 -
1989 33 441 000 72.5 25.3 1.5 ––-> 0.7 -
1991 26 731 000 56 40 2.1 ––-> 1.8 -
1995 43 767 000 36.3 49.3 4 ––-> 4.6 5.9
1981 160 100 19.4 76.1 0.2 ––> 4.3 -
1983 462 000 31.1 65.7 3 ––> 0.2 -
1985 845 000 22.5 74.5 - - 3 -
1987 1 593 000 31 66 - - 3 -
1989 3 123 000 23 70 4 ––> 3 -
1995 6 957 929 34.6 57.3 3.7 ––> 4.4 -
1981 83 332 34.3 51.7 1.4 ––> 5.7 6.9
1982 97 582 37.7 56.5 1.1 ––> 4.8 -
1984 125 691 43.3 48.5 1.5 ––> 6.7 -
1986 168 025 48.1 43.8 1.5 ––> 6.6 -
1993 400 201 63.4 27.8 0.9 ––> 7.8 -
1980 2 897 274 000 52.1 45.3 - - 2.6 -
1981 4 055 335 000 50.1 47.2 - - 2.7 -
1982 4 915 678 000 48.5 48.5 - - 3 -
1985 9 132 902 000 44.6 51.7 - - 3.6 -
1986 10 189 139 000 40.3 55.3 - - 4.4 -
1987 11 696 035 000 41.7 54 - - 4.3 -
1988 13 281 284 000 43.9 51.8 - - 4.2 -
1990 17 001 221 000 43.7 51.5 - - 4.8 -
1994 17 388 858 000 43.7 50.2 - - 6.1 -
1995 12 307 20.5 53 3.7 ––> 22.8 -
1996 13 060 … 56.1 2.3 ––> 24 17.7
1997 13 893 … 59 … … 26.9 14.1
Malta 1988 Lira (21) 10 - 100 - - - -
1995 72 357 0.8 23.2 63.8 ––> 4.1 8.2
1997 71 941 51.4 47.8 0.2 - 0.6 -
1980 (9) 6 348 000 45.2 48.3 1 - 5.6 -
1982 (9) 7 284 000 44.9 48.6 1.2 - 5.2 -
1983 (9) 7 699 000 46.4 47.4 1.2 - 5 -
1984 (9) 7 852 000 48.3 47 1.3 - 3.4 -
1985 (9) 8 748 000 51.7 44.3 1.4 - 2.6 -
1986 (9) 9 533 000 52.5 43.9 1.4 - 2.2 -
1987 (9) 10 040 000 52.1 43.9 2 - 2 -
1988 (9) 10 163 000 53.4 42.6 1.7 - 2.3 -
1990 (9) 10 450 000 51.2 45 1.7 - 2.1 -
1991 (9) 10 381 000 51.3 44.8 1.9 - 2 -
1994 12 486 000 44.7 43.9 2.6 - 8.8 -
Greece Drachma
Iceland Krona
Hungary Forint
Lat
Italy Lira
Ireland Pound
France Franc
Netherlands Guilder
Moldova Lei
Latvia

Not distributed
Non répartis
Country Currency
Sin distribución
Pays Monnaie
(%)
País Moneda
Fonds de l’etrangerInstitutions privées sans but lucratif
(%)
Fondos del extranjeroInstituciones privadas sin fines de lucro
(%)
Enseñanza superior
Higher education
Enseignement supérieur
Sector de la administración
(%) (%)
Etat
Sector de empresas
Entreprises
Source of funds / Source de fonds / Origen de fondos
Business enterprise Funds from abroadGovernment Private non-profit
Año de referencia
Dépenses intérieures brutes totales de R-D
Année de référence
(%)
Reference year Total gross domestic expenditure on R&D
Gasto interior bruto total en I y D
1980 3 629 800 35.6 58.6 4.2 - 1.6 -
1981 4 213 800 39.4 57 2.2 - 1.4 -
1982 *4 952 500 *41.6 *53.5 *2.3 - *2.5 -
1983 *5 691 000 *44.0 *51.0 *2.8 - *2.2 -
1984 *6 830 000 47.5 48.2 2.4 … 1.9 0.1
1985 8 109 900 50.2 45.6 2.1 - 2.1 -
1986 9 380 000 50.9 44.5 2.1 - 2.6 -
1987 10 202 700 48.6 47.1 2.6 - 1.7 -
1989 11 532 700 45.6 50.8 1.3 - 2.3 -
1995 15 907 600 49.9 43.5 1.6 ––> 4.9 -
Poland 1995 Zloty 2 113 000 31.8 64.4 2.1 - 1.7 -
1980 4 118 500 26.6 66.8 4.7 ––> 1.9 -
1982 6 541 200 30 61.9 4.8 ––> 3.3 -
1984 11 307 600 30.8 60.2 6.6 ––> 2.4 -
1986 19 867 600 26.8 61.3 9 ––> 2.9 -
1988 29 910 800 27.4 63.5 6.4 ––> 2.7 -
1990 52 032 200 27 58.1 10.2 ––> 4.6 -
1995 92 120 600 18.9 65.2 3.9 ––> 11.9 -
1989 20 866 000 94.7 5.3 - - - -
(33) 1991 17 369 000 (5) 54.3 (5) 22.9 (5) 8.1 … (5) 0.7 14
1995 514 420 000 23.1 63.4 10.4 - 3.2 -
Russian Federation 1997 Rouble 24 449 691 200 15.5 59.6 0.1 … 7.4 17.4
Slovakia 1995 S.Koruny 5 374 000 60.4 37.8 0.1 - 1.6 -
1992 15 050 524 51.1 35.9 8.4 ––> 4.7 -
1995 37 654 000 45.5 40.9 10.3 ––> 3.3 -
1996 36 816 000 49.1 43.4 4.5 0.4 2.7 -
1981 67 938 006 45.9 51.7 0.1 ––> 1.2 1.2
1983 100 697 093 49.1 49.6 0.1 ––> 1.2 -
1984 126 199 000 48.9 44.6 … … 0.7 5.8
1985 155 341 000 47.2 43 0.2 ––> 4.8 4.7
1986 197 676 000 49.3 44.1 0.9 ––> 1.7 4.1
1987 230 509 000 46.8 46.6 1.1 ––> 1.5 4.1
1988 287 688 658 47.5 48.8 1.1 ––> 2.5 -
1989 339 324 489 47.8 46.7 0.8 ––> 4.7 -
1990 (34) 423 501 631 47.7 45.3 0.2 ––> 6.8 -
1994 *548 153 562 *40.3 *52.4 *1.0 ––> *6.4 -
1983 (35) 18 189 000 59 39.3 0.2 - 1.5 -
1985 (35) 24 989 000 60.9 37.1 0.8 - 1.2 -
1987 (35) 30 553 000 61.1 37 0.4 - 1.6 -
1991 41 352 000 60.6 35.7 2.2 ––> 1.5 -
1993 47 473 000 62.9 31.4 2.4 ––> 2.4 0.9
1980 (5) 3 611 100 76.7 23.3 - - - -
1981 (5) 3 789 100 76.2 23.8 - - - -
1983 (5) 4 643 000 78.1 21.9 - - - -
1986 (36) 7 015 000 78.9 21.1 - - - -
1992 9 090 000 67.4 28.4 2.3 ––> 1.9 -
The For. Yug. Rep. of Macedonia 1995 Dinar (5) 876 244 48.4 41.9 7.5 ––> 2.2 -
1995 651 963 46.3 37.6 0.5 - 15.6 -
1997 1 113 189 … 41.9 … … 24.6 33.5
(25)(37)
1981 5 921 200 42.7 47.7 2.6 - (37) 6.9 -
(25)(37)
1983 6 583 000 43.6 48.9 2.2 - (37) 5.3 -
(37) 1985 8 198 100 45.8 40.7 2.2 … (37) 7.9 3.4
(37) 1986 8 945 500 48.6 37.8 2.3 … (37) 9.4 1.9
(37) 1989 11 531 800 50.4 36.5 3.2 ––> (37) 9.9 -
(37) 1990 12 136 500 49.4 35.8 3.3 ––> (37) 11.5 -
(37) 1991 11 905 000 50.2 34.2 3.8 ––> (37) 11.7 -
1993 13 829 000 51.9 32.7 3.7 ––> (37) 11.7 -
Pound Sterling
Norway Krone
Portugal
Ukraine Hryvnais
Slovenia Tolar
Krona
Switzerland Franc
Sweden
Escudo
Spain Peseta
Romania Leu
United Kingdom
Oceania - Océanie - Oceanía

Not distributed
Non répartis
Country Currency
Sin distribución
Pays Monnaie
(%)
País Moneda
Fonds de l’etrangerInstitutions privées sans but lucratif
(%)
Fondos del extranjeroInstituciones privadas sin fines de lucro
(%)
Enseñanza superior
Higher education
Enseignement supérieur
Sector de la administración
(%) (%)
Etat
Sector de empresas
Entreprises
Source of funds / Source de fonds / Origen de fondos
Business enterprise Funds from abroadGovernment Private non-profit
Año de referencia
Dépenses intérieures brutes totales de R-D
Année de référence
(%)
Reference year Total gross domestic expenditure on R&D
Gasto interior bruto total en I y D
1981 1 561 800 20.5 73.9 2.1 ––> 1.0 2.5
1984 2 415 600 27.9 68.9 1.7 ––> 1.1 0.3
1985 2 747 400 31.7 64.1 1.9 ––> 1.3 1.0
1986 3 365 600 34.8 59.5 1.6 ––> 0.9 3.3
1987 3 687 000 36.1 56.4 2.7 ––> 1.0 3.8
1988 4 252 600 40.5 54.4 2.2 ––> 1.3 1.5
1990 5 087 600 39.6 55.3 3.8 ––> 1.3 -
1994 7 321 100 45.7 48.1 4.2 ––> 2.0 -
Fiji (38) 1986 Dollar 3 800 - 73.7 - - 26.3 -
1989 *1 926 - *88.6 *11.4 - - -
1991 2 215 - 87.7 12.3 - - -
New Zealand 1993 Dollar 825 200 33.9 54.7 8.9 - 2.4 -
For general explanations and definitions, please refer to the Notes and Explanations on country tables.
Notes(1) Not including data for the productive sector.
(2) Not including labour costs at the Ministry of Public Health.
(3) Figures in millions.
(4) Data refer to the Ministry of Scientific Research only.
(5) Data refer to current expenditure only.
(6) Data refer to government funds and funds from abroad.
(7) Data refer to government funds only.
(8) Data refer to funds from abroad only.
(9) Not including data for social sciences and humanities in the productive sector (integrated R&D).
(10) Data refer to R&D activites performed in public enterprises.
(11) Not including data for the productive sector (non-integrated R&D) and the general service sector.
(12) Data relate to the Scientific Research Council only.
(13) Business enterprise funds and funds from abroad are counted together.
(14) Data refer to the central government only.
(15) Not including data for law, humanities and education.
(16) Not including private productive enterprises.
(17) In Reais.
(18) Not including data for the productive sector (non-integrated R&D).
(19) Data are the budget allotment for science and technology.
(20) Data refer to scientific and technological activities (STA).
(21) Data refer to the higher education sector only.
(22) Data refer to the general service sector only.
(23) Data refer to the productive sector only.
(24) Not including data for humanities and law financed by the universities' current budgets.
(25) Not including data for social sciences and humanities.
(26) Data refer to R&D activities which are concentrated mainly in government-financed research establishments. Social sciences and humanities in the higher education and general service sectors are not included.
(27) Not including funds from abroad.
(28) Business enterprise funds and government fund are counted together.
(29) Not including business enterprise funds
(30) Not including data from communities and regions.
(31) Including data from communities and regions.
(32) Not including business enterprise sector.
(33) Due to methodological changes in 1991 data are not comparable with previous years.
(34) Not including private non-profit organizations.
(35) Not including social sciences and humanities in the productive and general service sectors.
(36) Data refer to business enterprise and government funds only.
(37) Not including funds for R&D performed abroad.
(38) Data relate to one research institute only
Australia
Guam (5)(21)
Dollar
U.S.Dollar