statistical yearbook 2005 - aseanstats
TRANSCRIPT
ASEAN Statistical Yearbook
The ASEAN SecretariatJakarta
2005
ASEAN Statistical Yearbook, 2005ii
The Association of Southeast Asian Nations (ASEAN) was established on 8 August 1967. The members of the Association are Brunei Darussalam, Cambodia, Indonesia, Lao PDR, Malaysia, Myanmar, the Philippines, Singapore, Thailand and Viet Nam. The ASEAN Secretariat is based in Jakarta, Indonesia.
For inquiries, contact:Public Affairs OfficeThe ASEAN Secretariat70A, Jalan SisingamangarajaJakarta 12110Indonesia
Phone : (62.21) 724.33.72, 726.29.91Fax : (62.21) 739.82.34, 724.35.04E-mail : [email protected] <mailto:[email protected]>
General information on ASEAN appears on-lineat the ASEAN Website: www.aseansec.org
Cataloging-in-Publication Data
ASEAN Statistical Yearbook 2005Jakarta: ASEAN Secretariat, November 2005
xxii, 356p, 15.5 x 23 cm
1. ASEAN – Statistics2. Asia, southeastern – Economic growth – Statistics
315-DDC 21st ed.
ISBN 979-3496-18-5
Printed in IndonesiaMaterial in this publication may be freely quoted or reprinted with proper acknowledgment
Copyright ASEAN Secretariat 2005All rights reserved
ASEAN Statistical Yearbook, 2005 iii
The ASEAN Statistical Yearbook 2005 is the fourth in the series. It covers key ASEAN statistics for the period of mid 1990s to 2004. Since its previous issue, timeliness and coverage of many statistics, such as those on trade, foreign direct investment (FDI), tourism, transport and communication, have improved. Such improvements may be attributed to strengthened support from the national statistical systems of the ASEAN Member Countries.
Among the notable improvements on coverage are those on FDI statistics. Starting with this issue, statistics on FDI approval are presented based on apportionment basis instead of project cost basis as used in the previous issues. The apportionment basis takes out the domestic portion of approved investment projects with foreign interest, and thus provides a better indicator of foreign investments.
The Yearbook continues to provide the users with cross-country comparison as well as highlights of regional trends and developments in the ASEAN region. These are presented through the cross-section and time series presentation of ratios, shares, growth rates, and where applicable, aggregate figures for the region as well as detailed breakdown by country, by commodity, or by other relevant categories of key statistics.
I hope you would find the ASEAN Statistical Yearbook Series resourceful. I would welcome your comments and suggestions to further improve the quality and usefulness of future publication.
ONG KENG YONGSecretary General of ASEANJakarta, November 2005
Foreword

ASEAN Statistical Yearbook, 2005iv
ASEAN Statistical Yearbook, 2005 v
Foreword iiiList of Tables vList of Figures xvGlossary xviiiDefinition xx
LIST OF TABLES
Chapter I POPULATION AND DEMOGRAPHYTable I.1. Number of Mid Year Population of ASEAN Countries, 1980-2005 2Table I.2. Population Growth in ASEAN, 1980-2005 2Table I.3. Population Density, 1980-2004 4Table I.4. Population by Sex, 2004 5Table I.5. Urban Population, 1980-2004 5Table I.6. Population by Age Group, 2003 6
Chapter II EDUCATION, HEALTH AND REPRODUCTIONTable II.1. Adult Literacy Rate, 1990-2004 9Table II.2. Net Enrollment Ratio in Primary School, by Sex, 1990-2001 10Table II.3. Net Enrollment Ratio in Secondary School, by Sex, 1990-2001 11Table II.4. Ratio of Girls to Boys in Primary and Secondary School, 1990-2001 12Table II.5. Pupil-Teacher Ratio in Primary and Secondary School, 1980-2001 13Table II.6. Crude Birth Ratio (CBR), Crude Death Ratio (CDR), and Infant Mortality Rate (IMR) of ASEAN Countries, 2001-2004 13Table II.7. Total Fertility Rate (TFR), 1980-2003 14Table II.8. Life Expectancy at Birth by Sex, 1998-2004 14Table II.9. Immunization Against Measles and DPT among Children of 1 Year Old, 1990-2003 15Table II.10. Malaria and Tuberculosis Prevalence/Incidence Rate, per 100,000 Population, 1990-2002 16Table II.11. HIV Prevalence Rate among 15-24 Years Old People, by Sex, 1999-2003 17Table II.12. Proportion of Population with Access to Safe Drinking Water and Access to Improved Sanitation, 1990-2001 18
Chapter III LABOUR AND EMPLOYMENTTable III.1 Unemployment Rate and Labour Force Participation Rate, 1996-2004 20Table III.2. Number of Unemployment and Labour Force, 1996-2004 20Table III.3. Labour Force Participation Rates by Sex, 1990, 1995 and 1999-2004 22
Table of Contents
ASEAN Statistical Yearbook, 2005vi
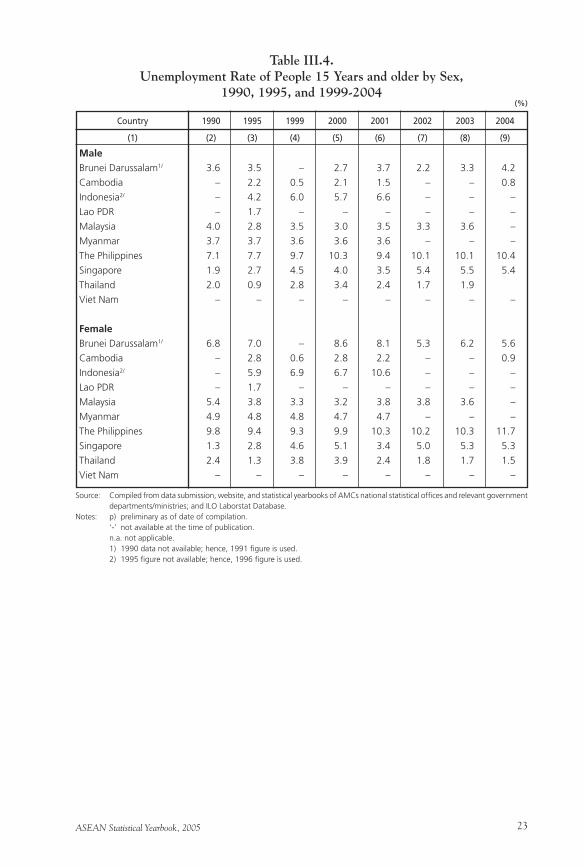
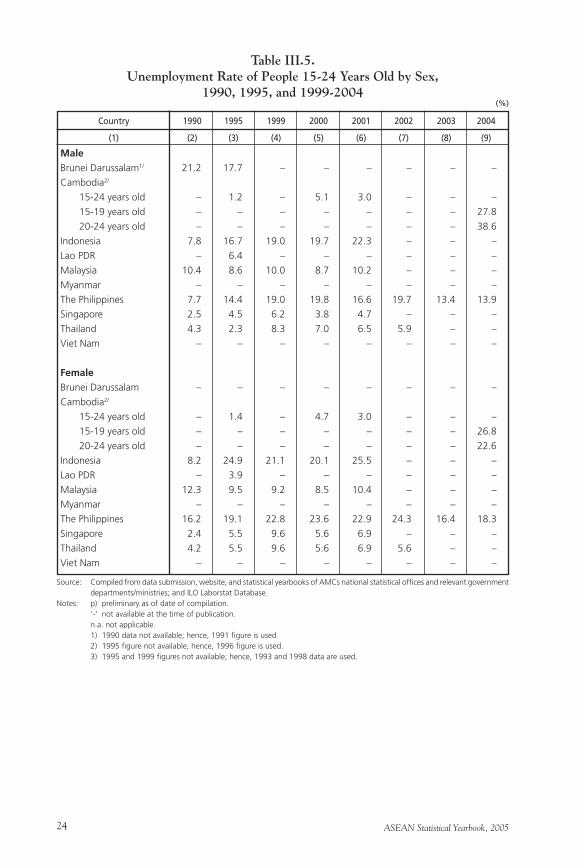
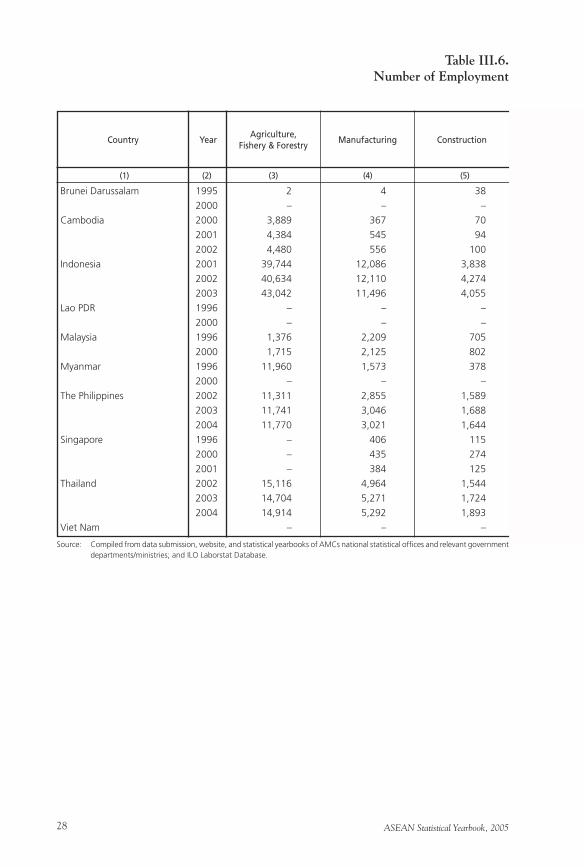
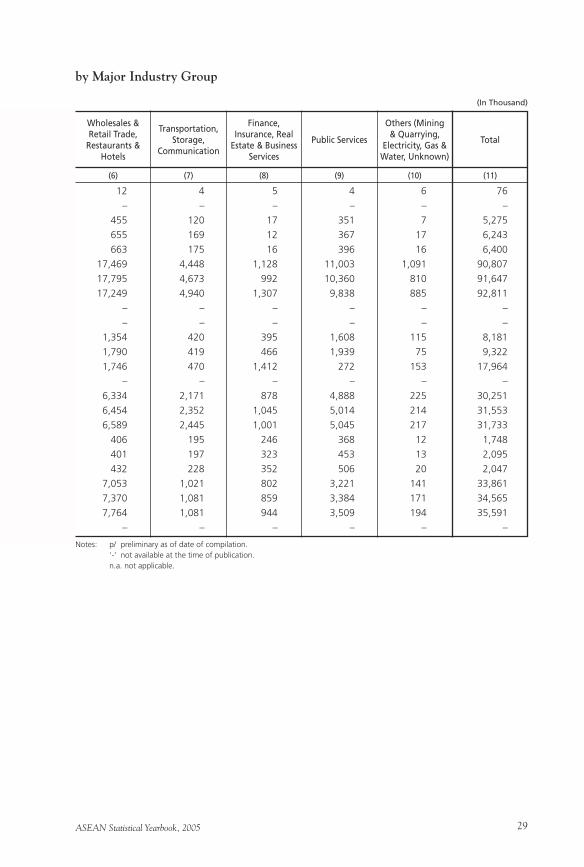
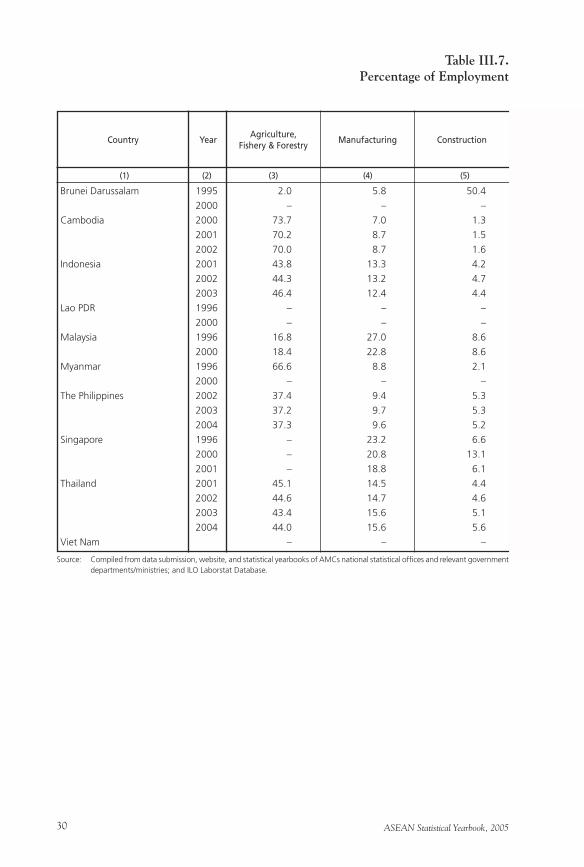
Table III.4. Unemployment Rate of People 15 Years and Older by Sex, 1990, 1995, and 1999-2004 23Table III.5. Unemployment Rate of People 15-24 Years Old by Sex, 1990, 1995 and 1999-2004 24Table III.6. Number of Employment by Major Industry Group 28Table III.7. Percentage of Employment by Major Industry Group 30Table III.8. Number of Employment by Occupation 32Table III.9. Percentage Employment by Occupation 32
Chapter IV MACRO ECONOMYTable IV.1. GDP at Current and Constant Market Prices in 34 Billion of National Currency, 1996-2004 Table IV.2. Rate of Economic Growth (GDP at Constant Price), 1996-2004 36Table IV.3. GDP per Capita at Current Market Prices in USD, 1996-2004 41Table IV.4. GDP at Current Market Prices in Million of USD, 1996-2004 41Table IV.5. GDP Share of Major Group of Economic Sectors, 2000-2004 42Table IV.6. Inflation Rates, Year-on-year End Period, and Year-on-year Average of Period, 1997-2004 42Table IV.7. Consumer Price Index, 1997-2004 44Table IV.8. Foreign Exchange Rates, 1997-2004 44Table IV.9. Interest Rates, End of the Period, 1997-2004 48Table IV.10. Money Growth, Year-on-year End of the Period, 1997-2004 48Table IV.11. Reserve Money, 1997-2004 51Table IV.12. Current Account Balance as a Percentage of GDP, 1997-2004 52Table IV.13. Current Account Balance in Million of USD, 1997-2004 52Table IV.14. Service Balance of ASEAN Countries in Million of US Dollar, 1997-2004 53Table IV.15. FDI Approval of ASEAN Countries in Million of US Dollar, 1997-2004 53Table IV.16. Government Budget Deficit, as a Percentage of GDP, 1997-2004 54Table IV.17. Government Budget Deficit, 1997-2004 54
Chapter V MERCHANDISE TRADETable V.1. ASEAN Exports by Country, 1993-2004 56Table V.2. ASEAN Imports by Country, 1993-2004 56Table V.3. Extra-ASEAN Exports by Country, 1993-2004 58Table V.4. Intra-ASEAN Exports by Country, 1993-2004 58Table V.5. Extra-ASEAN Imports by Country, 1993-2004 60Table V.6. Intra-ASEAN Imports by Country, 1993-2004 60Table V.7. ASEAN Exports by Country of Destination, 1993-2004 70Table V.8. ASEAN Imports by Country of Origin, 1993-2004 72Table V.9. ASEAN 6 Exports by Country of Destination, 1993-2004 74Table V.10. ASEAN 6 Imports by Country of Origin, 1993-2004 76Table V.11. ASEAN 6 Ten Major Exports Markets in 2001-2004 78Table V.12. ASEAN 6 Ten Major Imports Origins in 2001-2004 78Table V.13. ASEAN 6 Top-Ten Export Commodities by 2 Digits HS Code in 2001-2004 82
ASEAN Statistical Yearbook, 2005 vii
Table V.14. ASEAN 6 Top-Ten Import Commodities by 2 Digits HS Code in 2001-2004 82Table V.15. Trend of ASEAN 6 Exports of 1996 Top-Ten Commodities by 2 Digits HS Code, 1993-2004 85Table V.16. Trend of ASEAN 6 Imports of 1996 Top-Ten Commodities by 2 Digits HS Code, 1993-2004 85Table V.17. Ten Major Export Commodities of ASEAN 6 to ASEAN by 2 Digits HS Code in 2001-2004 88Table V.18. Ten Major Import Commodities of ASEAN 6 from ASEAN by 2 Digits HS Code in 2001-2004 88Table V.19. Ten Major Export Commodities of ASEAN 6 to European Union by 2 Digits HS Code in 2001-2004 90Table V.20. Ten Major Import Commodities of ASEAN 6 from European Union by 2 Digits HS Code in 2001-2004 90Table V.21. Ten Major Export Commodities of ASEAN 6 to USA by 2 Digits HS Code in 2001-2004 92Table V.22. Ten Major Import Commodities of ASEAN 6 from USA by 2 Digits HS Code in 2001-2004 92Table V.23. Ten Major Export Commodities of ASEAN 6 to Japan by 2 Digits HS Code in 2001-2004 94Table V.24. Ten Major Import Commodities of ASEAN 6 from Japan by 2 Digits HS Code in 2001-2004 94Table V.25. Ten Major Export Commodities of ASEAN 6 to China by 2 Digits HS Code in 2001-2004 96Table V.26. Ten Major Import Commodities of ASEAN 6 from China by 2 Digits HS Code in 2001-2004 96Table V.27. Ten Major Export Commodities of ASEAN 6 to Republic of Korea by 2 Digits HS Code in2001-2004 98Table V.28. Ten Major Import Commodities of ASEAN 6 from Republic of Korea by 2 Digits HS Code in 2001-2004 98Table V.29. Ten Major Export Commodities of ASEAN 6 to Australia by 2 Digits HS Code in 2001-2004 100Table V.30. Ten Major Import Commodities of ASEAN 6 from Australia by 2 Digits HS Code in 2001-2004 100Table V.31. Ten Major Export Commodities of ASEAN 6 to India by 2 Digits HS Code in 2001-2004 102Table V.32. Ten Major Import Commodities of ASEAN 6 from India by 2 Digits HS Code in 2001-2004 102Table V.33. ASEAN 6 Top-20 Export Commodities by 3 Digits-SITC Code in 2001-2004 104Table V.34. ASEAN 6 Top-20 Import Commodities by 3 Digits-SITC Code in 2001-2004 104Table V.35. Trend of ASEAN 6 Exports of 1996 Top-20 Commodities by 3 Digits-SITC Code, 1993-2004 107Table V.36. Trend of ASEAN 6 Imports of 1996 Top-20 Commodities by 3 Digits-SITC Code, 1993-2004 107Table V.37. Twenty Major Export Commodity of ASEAN 6 to ASEAN by 3 Digits-SITC Code in 2001-2004 112
ASEAN Statistical Yearbook, 2005viii
Table V.38. Twenty Major Import Commodity of ASEAN 6 from ASEAN by 3 Digits-SITC Code in 2001-2004 112Table V.39. Twenty Major Export Commodity of ASEAN 6 to European Union by 3 Digits-SITC Code in 2001-2004 114Table V.40. Twenty Major Import Commodity of ASEAN 6 from European Union by 3 Digits-SITC Code in 2001-2004 114Table V.41. Twenty Major Export Commodity of ASEAN 6 to USA by 3 Digits-SITC Code in 2001-2004 116Table V.42. Twenty Major Import Commodity of ASEAN 6 from USA by 3 Digits-SITC Code in 2001-2004 116Table V.43. Twenty Major Export Commodity of ASEAN 6 to Japan by 3 Digits-SITC Code in 2001-2004 118Table V.44. Twenty Major Import Commodity of ASEAN 6 from Japan by 3 Digits-SITC Code in 2001-2004 118Table V.45. Twenty Major Export Commodity of ASEAN 6 to China by 3 Digits-SITC Code in 2001-2004 120Table V.46. Twenty Major Import Commodity of ASEAN 6 from China by 3 Digits-SITC Code in 2001-2004 120Table V.47. Twenty Major Export Commodity of ASEAN 6 to Republic of Korea by 3 Digits-SITC Code in 2001-2004 122Table V.48. Twenty Major Import Commodity of ASEAN 6 from Republic of Korea by 3 Digits-SITC Code in 2001-2004 122Table V.49. Twenty Major Export Commodity of ASEAN 6 to Australia by 3 Digits-SITC Code in 2001-2004 124Table V.50. Twenty Major Import Commodity of ASEAN 6 from Australia by 3 Digits-SITC Code in 2001-2004 124Table V.51. Twenty Major Export Commodity of ASEAN 6 to India by 3 Digits-SITC Code in 2001-2004 126Table V.52. Twenty Major Import Commodity of ASEAN 6 from India by 3 Digits-SITC Code in 2001-2004 126Table V.53. Role of Top-Ten Intra-ASEAN Commodities in ASEAN 6 Trade, in 2004 128Table V.54. Role of Top-Ten Commodities Traded between EU and ASEAN in ASEAN 6 Trade, in 2004 128Table V.55. Role of Top-Ten Commodities Traded between USA and ASEAN in ASEAN 6 Trade, in 2004 129Table V.56. Role of Top-Ten Commodities Traded between Japan and ASEAN in ASEAN 6 Trade, in 2004 129Table V.57. Role of Top-Ten Commodities Traded between China and ASEAN in ASEAN 6 Trade, in 2004 130Table V.58. Role of Top-Ten Commodities Traded between Republic of Korea and ASEAN in ASEAN 6 Trade, in 2004 130Table V.59. Role of Top-Ten Commodities Traded between Australia and ASEAN in ASEAN 6 Trade, in 2004 131Table V.60. Role of Top-Ten Commodities Traded between India and ASEAN in ASEAN 6 Trade, in 2004 131Table V.61. Role of Top-20 Intra-ASEAN Trade Commodities in ASEAN 6 Trade, in 2004 132
ASEAN Statistical Yearbook, 2005 ix
Table V.62. Role of Top-20 Commodities Traded between EU and ASEAN in ASEAN 6 Trade, in 2004 132Table V.63. Role of Top-20 Commodities Traded between USA and ASEAN in ASEAN 6 Trade, in 2004 133Table V.64. Role of Top-20 Commodities Traded between Japan and ASEAN in ASEAN 6 Trade, in 2004 133Table V.65. Role of Top-20 Commodities Traded between China and ASEAN in ASEAN 6 Trade, in 2004 134Table V.66. Role of Top-20 Commodities Traded between Republic of Korea and ASEAN in ASEAN 6 Trade, in 2004 134Table V.67. Role of Top-20 Commodities Traded between Australia and ASEAN in ASEAN 6 Trade, in 2004 135Table V.68. Role of Top-20 Commodities Traded between India and ASEAN in ASEAN 6 Trade, in 2004 135
Chapter VI FOREIGN DIRECT INVESTMENTTable VI.1. Foreign Direct Investments in ASEAN by Host Country, 1995-2004 138Table VI.2. Foreign Direct Investments in ASEAN by Source Country, 1995-2004 142Table VI.3. Foreign Direct Investments in ASEAN from ASEAN Member Countries (Source), 1995-2004 144Table VI.4. Foreign Direct Investments in ASEAN Member Countries (Host) from ASEAN, 1995-2004 144Table VI.5. Percentage Share of Foreign Direct Investments in ASEAN by Source Country, 1995-2004 148Table VI.6. Share of ASEAN Member Countries in Intra-ASEAN Foreign Direct Investments, 1995-2004 150Table VI.7. Foreign Direct Investments in ASEAN 5 by Source Country, 1995-2004 152Table VI.8 Foreign Direct Investments in BCLMV by Source Country, 1995-2004 156Table VI.9 Foreign Direct Investments in ASEAN Member Countries by Source Country, 1995-2004 158Table VI.10. Foreign Direct Investments in ASEAN 5 and BCLMV by Source Country/Region, 1995-2004 160Table VI.11. Foreign Direct Investments in ASEAN Member Countries from USA, 1995-2004 162Table VI.12. Foreign Direct Investments in ASEAN Member Countries from Japan, 1995-2004 162Table VI.13. Foreign Direct Investments in ASEAN Member Countries from European Union (EU-15), 1995-2004 164Table VI.14. Foreign Direct Investments in ASEAN Member Countries from China, 1995-2004 164Table VI.15. Foreign Direct Investments in ASEAN Member Countries from South Korea, 1995-2004 166Table VI.16. Foreign Direct Investments in ASEAN Member Countries from Australia, 1995-2004 166
ASEAN Statistical Yearbook, 2005x
Table VI.17. Foreign Direct Investments in ASEAN Member Countries from India, 1995-2004 168Table VI.18. Foreign Direct Investments in ASEAN by Economic Sector and Source Country/Market, 1999-2004 170Table VI.19. Share of Foreign Direct Investments in ASEAN by Economic Sector and Source Country/Market, 1999-2004 170Table VI.20. Foreign Direct Investments in ASEAN by Economic Sector, 1999-2004 172Table VI.21. Share of Foreign Direct Investments in ASEAN by Economic Sector, 1999-2004 173Table VI.22.1 Foreign Direct Investments in ASEAN Member Countries by Source Country, 1995 174Table VI.22.2 Foreign Direct Investments in ASEAN Member Countries by Source Country, 1996 176Table VI.22.3 Foreign Direct Investments in ASEAN Member Countries by Source Country, 1997 178Table VI.22.4 Foreign Direct Investments in ASEAN Member Countries by Source Country, 1998 180Table VI.22.5 Foreign Direct Investments in ASEAN Member Countries by Source Country, 1999 182Table VI.22.6 Foreign Direct Investments in ASEAN Member Countries by Source Country, 2000 184Table VI.22.7 Foreign Direct Investments in ASEAN Member Countries by Source Country, 2001 186Table VI.22.8 Foreign Direct Investments in ASEAN Member Countries by Source Country, 2002 188Table VI.22.9 Foreign Direct Investments in ASEAN Member Countries by Source Country, 2003 190Table VI.22.10 Foreign Direct Investments in ASEAN Member Countries by Source Country, 2004 192Table VI.23. Foreign Direct Investments in Projects with Foreign Interest: Manufacturing Sector by International Standard Industrial Classification (ISIC), 1999-2004 Approval and Apportionment Basis 194Table VI.24. Intra-ASEAN Foreign Direct Investments in Projects with Foreign Interest: Manufacturing Sector by International Standard Industrial Classification (ISIC), 1999-2004 Approval and Apportionment Basis 196Table VI.25. Intra-ASEAN Foreign Direct Investments in Projects with Foreign Interest: Manufacturing Sector by International Standard Industrial Classification (ISIC) and Host Country, 1999-2004 Approval and Apportionment Basis 198Table VI.26. Foreign Direct Investments in Projects with Foreign Interest: Top-Five Manufacturing Industries, 1999-2004 by International Standard Industrial Classifications (ISIC) Approval and Apportionment Basis 202
ASEAN Statistical Yearbook, 2005 xi
Table VI.27. Intra-ASEAN Foreign Direct Investments in Projects with Foreign Interest: Top-Five Manufacturing Industries, 1999-2004 by International Standard Industrial Classifications (ISIC) Approval and Apportionment Basis 202
Chapter VII TRANSPORT AND COMMUNICATIONTable VII.1. ASEAN Road Infrastructure, 1997-2004 206Table VII.2. ASAEN Road Fleet, 1997-2004 208Table VII.3. ASEAN Railways Statistics, 1997-2004 210Table VII.4. ASEAN Domestic Maritime Statistics: Number of Ports and Fleet, 1997-2004 212Table VII.5. ASEAN International Maritime Statistics: Number of Ports and Fleet, 1997-2004 214Table VII.6. ASEAN Domestic Civil Aviation Statistics, 1997-2004 218Table VII.7. ASEAN International Civil Aviation Statistics, 1997-2004 220
Chapter VIII TOURISMTable VIII.1. Visitors Arrivals by Country of Destination, 1995-2004 225Table VIII.2. Rate of Growth of Visitors Arrivals by Country of Destination, 1995-2004 225Table VIII.3. Intra-ASEAN Visitors Arrivals by Country of Destination, 1995-2004 226Table VIII.4. Extra-ASEAN Visitors Arrivals by Country of Destination, 1995-2004 226Table VIII.5. International Tourism Receipt, 2001-2002 227Table VIII.6. Visitor Arrivals to ASEAN by Country of Origin and Year during 1995-2004 228Table VIII.7. Visitor Arrivals to ASEAN Member Countries by Country of Origin during 1995-2004 232Table VIII.8 Rate of Growth of Visitor Arrivals to ASEAN by Country of Origin and Year during 1996-2004 234Table VIII.9. Share in Visitor Arrivals to ASEAN by Country of Origin and Year during 1995-2004 236Table VIII.10. Share in Visitor Arrivals to ASEAN Member Countries by Country of Origin during 1995-2004 238Table VIII.11. Share of Intra-ASEAN Visitor Arrivals in ASEAN Member Countries by Year during 1995-2004 240Table VIII.12. Intra-ASEAN Visitor Arrivals by Country of Origin, 1999-2004 243Table VIII.13. Visitor Arrivals to Brunei Darussalam by Country of Origin and Year during 1995-2004 246Table VIII.14. Visitor Arrivals to Cambodia by Country of Origin and Year during 1995-2004 248Table VIII.15. Visitor Arrivals to Indonesia by Country of Origin and Year during 1995-2004 250Table VIII.16. Visitor Arrivals to Lao PDR by Country of Origin and Year during 1995-2004 252Table VIII.17. Visitor Arrivals to Malaysia by Country of Origin and Year during 1995-2004 254
ASEAN Statistical Yearbook, 2005xii
Table VIII.18. Visitor Arrivals to Myanmar by Country of Origin and Year during 1995-2004 256Table VIII.19. Visitor Arrivals to the Philippines by Country of Origin and Year during 1995-2004 258Table VIII.20. Visitor Arrivals to Singapore by Country of Origin and Year during 1995-2004 260Table VIII.21. Visitor Arrivals to Thailand by Country of Origin and Year during 1995-2004 262Table VIII.22. Visitor Arrivals to Viet Nam by Country of Origin and Year during 1995-2004 264Table VIII.23. Visitor Arrivals from ASEAN to ASEAN by Country of Destination, 1995-2004 266Table VIII.24. Visitor Arrivals from USA to ASEAN by Country of Destination, 1995-2004 266Table VIII.25. Visitor Arrivals from EU to ASEAN by Country of Destination, 1995-2004 267Table VIII.26. Visitor Arrivals from Japan to ASEAN by Country of Destination, 1995-2004 267Table VIII.27. Visitor Arrivals from China to ASEAN by Country of Destination, 1995-2004 268Table VIII.28. Visitor Arrivals from South Korea to ASEAN by Country of Destination, 1995-2004 268Table VIII.29. Visitor Arrivals from Australia to ASEAN by Country of Destination, 1995-2004 269Table VIII.30. Visitor Arrivals from India to ASEAN by Country of Destination, 1995-2004 269
Chapter IX AGRICULTURETable IX.1. Agricultural Land and Land Use, 2002 273Table IX.2. GDP, Employment, Export and Import Share of Agriculture Sector 273Table IX.3. Paddy Production in ASEAN, 1993-2004 274Table IX.4. Maize Production in ASEAN, 1993-2004 275Table IX.5. Soybean Production in ASEAN, 1993-2004 275Table IX.6. Sugarcane Production in ASEAN, 1993-2004 276Table IX.7. Cassava Production in ASEAN, 1993-2004 277Table IX.8. Rate of Growth of ASEAN Five Major Food Commodities 277Table IX.9. ASEAN 6 Export of Selected Agricultural Products and Inputs, 1993-2004 279Table IX.10. ASEAN 6 Import of Selected Agricultural Products and Inputs, 1993-2004 279Table IX.11. ASEAN Exports of Selected Agricultural Products and Inputs by Countries, 2001 280Table IX.12. ASEAN Imports of Selected Agricultural Products and Inputs by Countries, 2001 280Table IX.13. ASEAN Exports of Selected Agricultural Products and Inputs by Countries, 2002 282Table IX.14. ASEAN Imports of Selected Agricultural Products and Inputs by Countries, 2002 282
ASEAN Statistical Yearbook, 2005 xiii
Table IX.15. ASEAN Exports of Selected Agricultural Products and Inputs by Countries, 2003 284Table IX.16. ASEAN Imports of Selected Agricultural Products and Inputs by Countries, 2003 284Table IX.17. ASEAN Exports of Selected Agricultural Products and Inputs by Countries, 2004 286Table IX.18. ASEAN Imports of Selected Agricultural Products and Inputs by Countries, 2004 286Table IX.19. ASEAN 6 Major Markets of Agricultural Export Commodities, 2001-2004 288Table IX.20. ASEAN 6 Major Origin of Agricultural Import Commodities, 2001-2004 288Table IX.21. ASEAN 6 Major Markets of Selected Agricultural Export Commodities, 2000-2004 292Table IX.22. ASEAN 6 Major Origins of Selected Agricultural Import Commodities, 2000-2004 293Table IX.23. Major Markets of Export of Selected Agricultural Inputs, 2000-2004 294Table IX.24. Major Origins of Import of Selected Agricultural Inputs, 2000-2004 295Table IX.25. ASEAN Export of Fishery Products by 4-Digit HS Code, 1993-2004 296Table IX.26. ASEAN Export of Fishery Products, by Country, 1993-2004 296Table IX.27. ASEAN Import of Fishery Products by 4-Digit HS Code, 1993-2004 298Table IX.28. ASEAN Import of Fishery Products by Country, 1993-2004 298Table IX.29. Production of Selected Agricultural Products, 2001 300Table IX.30. Production of Selected Agricultural Products, 2002 300Table IX.31. Production of Selected Agricultural Products, 2003 302Table IX.32. Production of Selected Agricultural Products, 2004 302Table IX.33. Livestock and Poultry Population, 2000-2003 306Table IX.34. Livestock and Poultry Meat Production, 2000-2003 308Table IX.35. Export of Selected Agriculture Products, 2000-2002 310Table IX.36. Import of Selected Agriculture Products, 2000-2002 312
Chapter X MANUFACTURINGTable X.1. Number of Manufacturing Establishments and Persons Engaged, by Establishment Size 317Table X.2. GDP Share, Employment Share and Export and Import Share of Manufacturing Sector, 1996-2004 317Table X.3. Number of Establishments by Division of Industry, 1998-2001 318Table X.4. Percentage Distribution of Establishments by Division of Industry, 1998-2001 319Table X.5. Number of Persons Engaged in Establishments by Division of Industry, 1998-2001 320Table X.6. Number of Persons Engaged per Establishment by Division of Industry, 1998-2001 321Table X.7. Value Added per Person Engaged in Establishments by Division of Industry, 2000 322Table X.8. Index of Industrial Production for All Manufacturing Industries, 1999-2004 323Table X.9. Selected Index of Industrial Production: Indonesia, 1999-2004 324
ASEAN Statistical Yearbook, 2005xiv
Table X.10. Selected Index of Industrial Production: Malaysia, 1999-2004 325Table X.11. Selected Index of Industrial Production: the Philippines, 2000-2002 326Table X.12. Selected Index of Industrial Production: Singapore, 1999-2004 327Table X.13. Selected Index of Industrial Production: Thailand, 1999-2003 328
Chapter XI OTHER SOCIALTable XI.1. Human Development Index (HDI), 1985-2002 331Table XI.2. Percent of Population below the National Poverty Line, 1993-2004 332Table XI.3. Percent of Population below the National Poverty Line in Urban and in Rural Areas 332Table XI.4. Percentage of Population below the $1 and $2 PPP Poverty Line, 1990-2002 333Table XI.5. Gini Coefficient, 1990-2004 334Table XI.6. Income Share of the Poorest 20%, 1990-2002 334Table XI.7. Proportion of Seats in National Legislature Held by Women, 1990-2004 335Table XI.8. Female Share of Paid Employment in Non-Agricultural Activities, 1990-2002 335Table XI.9. Proportion of Children under 15 Who are Working, 1990-2001 336Table XI.10. Daily per Capita Protein Supply of ASEAN, 1980-2002 337Table XI.11. Daily per Capita Calorie Supply of ASEAN, 1980-2002 337
Chapter XII OTHER SECTORSTable XII.1. ASEAN Energy Resources and Reserves 341Table XII.2. ASEAN Crude Oil Production, 1996-2001 342Table XII.3. Petroleum Product Consumption of ASEAN, 1996-2001 342Table XII.4. Petroleum Products Exports and Imports, 1990, 1995 and 2000 343Table XII.5. Crude Oil Exports and Imports, 1996-2002 343Table XII.6. Trend of Crude Oil Exports by Country, 1993-2004 344Table XII.7. Trend of Crude Oil Import by Country, 1993-2004 344Table XII.8. Trend of Petroleum Products Exports by Country, 1993-2004 345Table XII.9. Trend of Petroleum Products Imports by Country, 1993-2004 345Table XII.10. Trend of Net Export of Crude Oil and Petroleum Products, 1993-2004 346Table XII.11. ASEAN 6 Major Markets of Crude Oil, 2000-2004 347Table XII.12. ASEAN 6 Major Suppliers (Origin) of Crude Oil, 2000-2004 347Table XII.13. ASEAN 6 Major Markets of Petroleum Products, 2000-2004 348Table XII.14. ASEAN 6 Major Suppliers (Origin) of Petroleum Products, 2000-2004 348Table XII.15. Forest Ares as a Percentage of Total Areas 349Table XII.16. National Protected Areas and CO2 Emission 349Table XII.17. Proportion of Households with Electricity, 1990-2001 350Table XII.18. Selected Science and Technology Indicators 350Table XII.19. ASEAN Telephone Services Statistics, 1997-2004 352Table XII.20. ASEAN Internet Services Statistics, 1997-2004 354
ASEAN Statistical Yearbook, 2005 xv
Graphic I.1. Population Density of ASEAN Countries, 1980-2004 4Graphic I.2. ASEAN Population by Age Group, 2003 6
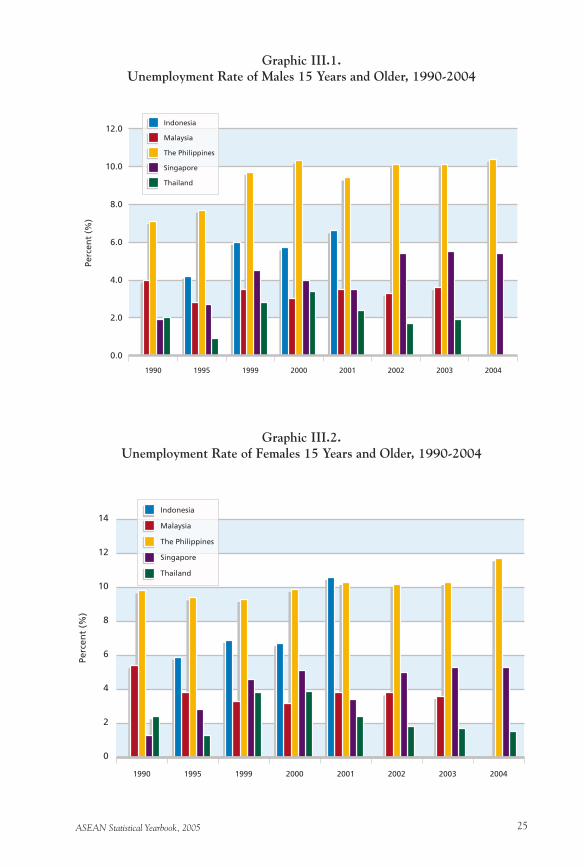
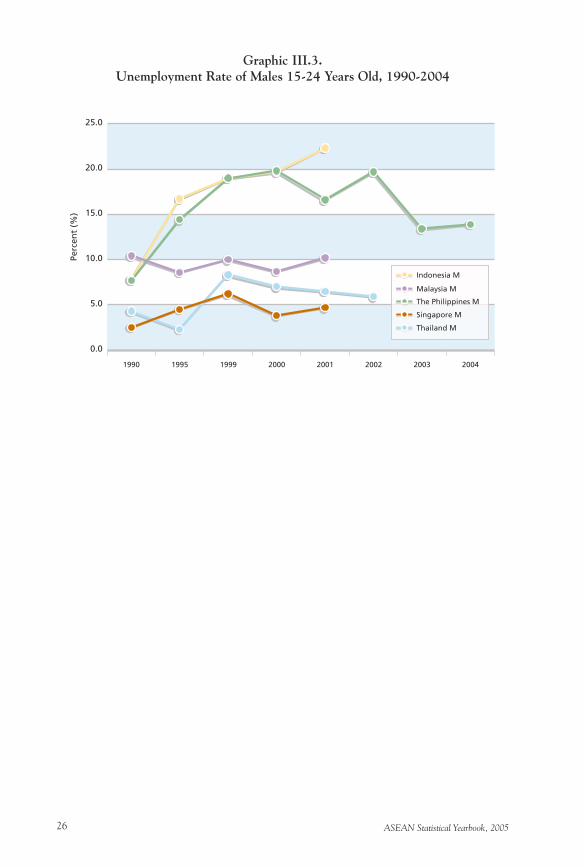
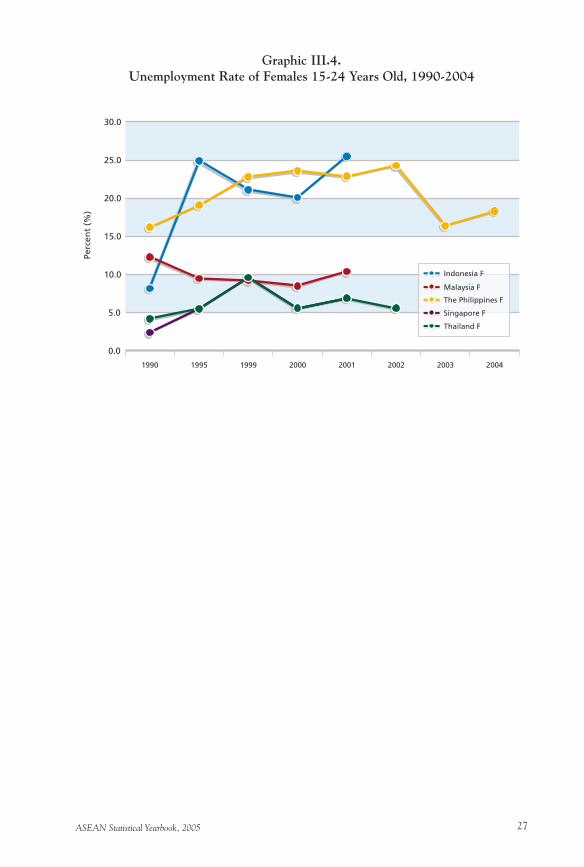
Graphic III.1. Unemployment Rate of Males 15 Years and Older, 1990-2004 25Graphic III.2. Unemployment Rate of Females 15 Years and Older, 1990-2004 25Graphic III.3. Unemployment Rate of Males 15-24 Years Old, 1990-2004 26Graphic III.4. Unemployment Rate of Females 15-24 Years Old, 1990-2004 26
Graphic IV.1. Rate of GDP Growth in ASEAN, 1996-2004 38Graphic IV.2. Rate of GDP Growth in ASEAN 5, 1996-2004 39Graphic IV.3. Rate of GDP Growth of BCLMV, 1996-2004 39Graphic IV.4 GDP per Capita in US Dollar in ASEAN 5 during 1996-2004, as Compared to 1996 40Graphic IV.5. GDP per Capita in US Dollar in BCLMV during 1996-2004, as Compared to 1996 40Graphic IV.6. Consumer Prices Index of ASEAN 5 during 1996-2004, as Compared to 1996 46Graphic IV.7. Consumer Price Index of BCLMV during 1996-2004 as Compared to 1996 46Graphic IV.8. Rate of Change of Foreign Exchange Rate in ASEAN 5, 1997-2004 47Graphic IV.9. Rate of Change of Foreign Exchange Rate in BCLMV, 1997-2004 47Graphic IV.10. ASEAN 5 National Currency to US Dollar during 1996-2004, as Compared to the 1996 Level 50Graphic IV.11. BCLMV National Currency to US Dollar during 1996-2004, as Compared to the 1996 Level 50
Graphic V.1. Trend of ASEAN 6 Total Exports and Imports, 1993-2004 62Graphic V.2. Trend of ASEAN 6 Extra-ASEAN Exports and Imports and Intra-ASEAN Exports and Imports, 1993-2004 62Graphic V.3. Trend of ASEAN 6 Exports and Imports as a Percentage of GDP, 1996-2004 63Graphic V.4. Trend of ASEAN 6 Extra-ASEAN Exports and Imports and Intra-ASEAN Exports and Imports as a Percentage of GDP, 1996-2004 63Graphic V.5. Trend of ASEAN 6 Exports by Country, 1993-2004 64Graphic V.6. Trend of ASEAN 6 Total Imports by Country, 1993-2004 64Graphic V.7. Trend of ASEAN 6 Extra-ASEAN Exports by Country, 1993-2004 65Graphic V.8. Trend of ASEAN 6 Extra-ASEAN Imports by Country, 1993-2004 65Graphic V.9. Trend of ASEAN 6 Intra-ASEAN Exports by Country, 1993-2004 66Graphic V.10. Trend of ASEAN 6 Intra-ASEAN Imports by Country, 1993-2004 66
List of Figures
ASEAN Statistical Yearbook, 2005xvi
Graphic V.11. Shares of ASEAN 6 Extra and Intra-ASEAN Exports, 1993-2004 67Graphic V.12. Shares of ASEAN 6 Extra and Intra-ASEAN Imports, 1993-2004 67Graphic V.13. Shares of ASEAN 6 Extra and Intra-ASEAN Exports by Country, 1993-2004 68Graphic V.14. Shares of ASEAN 6 Extra and Intra-ASEAN Imports by Country, 1993-2004 69Graphic V.15. ASEAN 6 Export Market, 2003 80Graphic V.16. ASEAN 6 Export Market, 2004 80Graphic V.17. ASEAN Import Origin, 2003 81Graphic V.18. ASEAN Import Origin, 2004 81Graphic V.19. Shares of Top-Ten HS-Export Commodities in ASEAN 6, 2004 84Graphic V.20. Shares of Top-Ten HS-Import Commodities in ASEAN 6, 2004 84Graphic V.21. Trend of the 1996 Top-Ten HS-Exports and Imports Commodities in ASEAN 6, 1993-2004 86Graphic V.22. Trend of Shares of the 1996 Top-Ten HS-Exports and Imports Commodities in ASEAN 6, 1993-2004 86Graphic V.23. Trend of the 1996 Top-Ten HS-Export Commodities in ASEAN 6, 1993-2004 87Graphic V.24. Trend of the 1996 Top-Ten HS-Import Commodities in ASEAN 6, 1993-2004 87Graphic V.25. Share of Top-Ten SITC-Export Commodities in ASEAN 6, 2004 106Graphic V.26. Share of Top-Ten SITC-Import Commodities in ASEAN 6, 2004 106Graphic V.27. Trend of the 1996 Top-5 SITC-Export Commodities in ASEAN 6, 1993-2004 108Graphic V.28. Trend of the 1996 Top-6 to Top-10 SITC-Export Commodities in ASEAN 6, 1993-2004 108Graphic V.29. Trend of the 1996 Top-5 SITC-Import Commodities in ASEAN 6, 1993-2004 109Graphic V.30. Trend of the 1996 Top-6 to Top-10 SITC-Import Commodities in ASEAN 6, 1993-2004 109Graphic V.31. Trend of Top-20 SITC-Export Commodities in ASEAN 6, 1993-2004 110Graphic V.32. Trend of Top-20 SITC-Import Commodities in ASEAN 6, 1993-2004 111
Graphic VI.1. Foreign Direct Investments in ASEAN 5 by Host Country, 1995-2004 140Graphic VI.2. Foreign Direct Investments in BCLMV by Host Country, 1995-2004 140Graphic VI.3. Foreign Direct Investments in ASEAN by Host Country, 1995-1998 141Graphic VI.4. Foreign Direct Investments in ASEAN by Host Country, 1995-2004 141Graphic VI.5. Extra and Intra-ASEAN Foreign Direct Investments, 1995-2004 146Graphic VI.6. Foreign Direct Investments in ASEAN by Source Country, 1995-2004 146Graphic VI.7. Foreign Direct Investments in ASEAN by Host Country, 1995-2004 147
ASEAN Statistical Yearbook, 2005 xvii
Graphic VI.8. Composition of Foreign Direct Investments in ASEAN by Source Country, 1995-2004 147Graphic VI.9. Share of Foreign Direct Investments in ASEAN 5 by Source Country, 1995-2004 154Graphic VI.10. Share of Foreign Direct Investments in BCLMV by Source Country, 1995-2004 154Graphic VI.11. Trend of Foreign Direct Investments in ASEAN 5 by Source Country, 1995-2004 155Graphic VI.12. Trend of Foreign Direct Investments in BCLMV by Source Country, 1995-2004 155Graphic VI.13. Investment Flows to ASEAN and Intra-ASEAN Investment Flows to Manufacturing Industry, 1995-2004 200Graphic VI.14. Top-Ten Intra-ASEAN Inflows of Investment to Manufacturing Industry by ISIC Code 1999-2004 201
Graphic VII.1. Total Vehicles per 1,000 Population in ASEAN Countries, 1997-2004 206Graphic VII.2. Total Goods Vehicles per 1,000 Population in ASEAN Countries, 1997-2004 207Graphic VII.3. Trend in International Cargo Throughput in International Maritime Transportation in ASEAN Countries, 1997-2004 216Graphic VII.4. Trend in Domestic Cargo Throughput in Domestic Maritime Transportation in ASEAN Countries, 1997-2004 216Graphic VII.5. Trend in International Passenger Traffic in International Civil Aviation in ASEAN Countries, 1997-2004 217Graphic VII.6. Trend in Domestic Passenger Traffic in Domestic Civil Aviation in ASEAN Countries, 1997-2004 217
Graphic VIII.1. ASEAN Tourism Receipt as Percentage of GDP 2001and 2002 227Graphic VIII.2. Trend in Intra and Extra-ASEAN Visitor Arrivals, 1995-2004 230Graphic VIII.3. Trend in Extra-ASEAN Visitor Arrivals by Group of Country of Origin, 1995-2004 230Graphic VIII.4. Rate of Growth of Tourist Arrivals to ASEAN by Group of Country of Origin, 1995-2004 231Graphic VIII.5. Share of Visitor Arrivals to ASEAN by Group of Country of Origin, 1995-2004 231Graphic VIII.6. Share of Visitor Arrivals to ASEAN 5 by Group of Country of Origin, 1995-2004 242Graphic VIII.7. Share of Visitor Arrivals to BCLMV by Group of Country of Origin, 1995-2004 242Graphic VIII.8. Share of Intra-ASEAN Tourist Arrivals by Host Countries, 2004 244Graphic VIII.9. Share of Intra and Extra-ASEAN Visitor Arrivals to ASEAN Countries, 1995-2004 244Graphic VIII.10. Trend in Visitor Arrivals in ASEAN 5 by Country, 1995-2004 245Graphic VIII.11. Trend in Visitor Arrivals in BCLMV by Country, 1995-2004 245
Graphic IX.1. Paddy Production in Five Major Paddy Producers, 1993-2004 274
ASEAN Statistical Yearbook, 2005xviii
Graphic IX.2. Sugarcane Production in Five Major Sugarcane Producers, 1993-2004 276Graphic IX.3. Rate of Growth of ASEAN Five Major Food Commodities, 1994-2003 278Graphic IX.4. Share of ASEAN 6 Major Markets of Agricultural Commodities, 2004 290Graphic IX.5. Share of ASEAN 6 Major Markets of Agricultural Commodities, 2003 290Graphic IX.6. Share of ASEAN 6 Major Origins of Agricultural Commodities, 2004 291Graphic IX.7. Share of ASEAN 6 Major Origins of Agricultural Commodities, 2003 291Graphic IX.8. Trend of Livestock and Poultry Meat Production of ASEAN, 2000-2003 304Graphic IX.9. Growth Rate of ASEAN Exports on Selected Agricultural Products, 2001-2002 304Graphic IX.10. Growth Rate of Livestock and Poultry Population, 2002-2003 305
Graphic XI.1. Trend of HDI, 1985-2002 331Graphic XI.2. Percentage of Population below $1 PPP and $2 PPP Poverty Line 333Graphic XI.3. Proportion of Children Under 15 Who are Working 336
Graphic XII.1. Trend of ASEAN Export and Import of Crude Oil and Petroleum Products 346Graphic XII.2. Trend in Telephone Density per 1,000 Persons in ASEAN Countries, 1997-2004 351Graphic XII.3. Trend in Cellular Phone Density per 1,000 Persons in ASEAN Countries, 1997-2004 351
ASEAN Statistical Yearbook, 2005 xix
Glossary
Notations: – Not available na Not applicable 0 less than 0.5 National Currency: 1 Brunei Darussalam: B $ (Brunei dollar) 2 Cambodia: Riel 3 Indonesia: Rp (Rupiah) 4 Lao PDR: Kips 5 Malaysia: RM (Ringgit Malaysia) 6 Myanmar: Kyats 7 The Philippines: Pesos 8 Singapore: S $ (Singapore dollar) 9 Thailand: Baht 10 Viet Nam: Dong Measurement Units: bn billion cap capita cu m cubic meter ha hectare kg kilogram km kilometer kWh kilowatt-hour m meter mn million mt metric ton sq m square meter sq km square kilometer 000 thousand TEUs ton equivalet units
ASEAN Statistical Yearbook, 2005xx
Abbreviations and Acronyms: ACE ASEAN Centre for Energy ADB Asian Development Bank AFSIS ASEAN Food Security Information System ATE Average Total Employment BOP Balance of Payment cif cost, insurance and freight ESCAP Economic and Social Commision for Asia and the Pacific FAO Food and Agriculture Organisation FMSU Finance and Macroeconomic Surveillance Coordinating Unit fob free on board GDP gross domestic product GNP gross national product IMF International Monetary Fund MOA Ministry of Agriculture PPP purchasing power parity SITC Standard International Trade Classification UN United Nations WB World Bank
National Statistical Office (NSO) 1 Brunei Darussalam: Department of Statistics, Department of Economic and Planning and Development 2 Cambodia: National Institute of Statistics (NIS) 3 Indonesia: BPS-Statistics Indonesia 4 Lao PDR: National Statistical Center 5 Malaysia: Department of Statistics Malaysia 6 Myanmar: Central Statistical Organisation (CSO) 7 Philippines: National Statistical Coordination Board (NSCB) and National Statistical Office (NSO) 8 Singapore: Singapore Department of Statistics 9 Thailand: National Statistical Office (NSO) 10 Viet Nam: General Statistical Office (GSO)
ASEAN Statistical Yearbook, 2005 xxi
Definitions: Transport: Pax-Km the total multiplying of total passenger by the total traveled
distance Freight-Km the total multiplying of total carried freight (kg or ton) by the
total traveled distance Cargo Thruput (Mn) number of cargoes going through port (million, usually:ton) Cargo Thruput (TEUs) number of cargoes going through port in Twenty - Foot
Equivalent Unit Freight Traffic (‘000 ton) total number of loading and unloading in Thousand Tons
Unit Trade: Extra-ASEAN Export export of ASEAN member countries to other major trading
partners Extra-ASEAN Import import of ASEAN member countries from other major trading
partners Intra-ASEAN Export export of ASEAN member countries to other ASEAN
member countries Intra-ASEAN Import Import of ASEAN member countries from other ASEAN
member countries

ASEAN Statistical Yearbook, 2005xxii
ASEAN Statistical Yearbook, 2005 1
Chapter IPopulation and Demography
ASEAN Statistical Yearbook, 20052
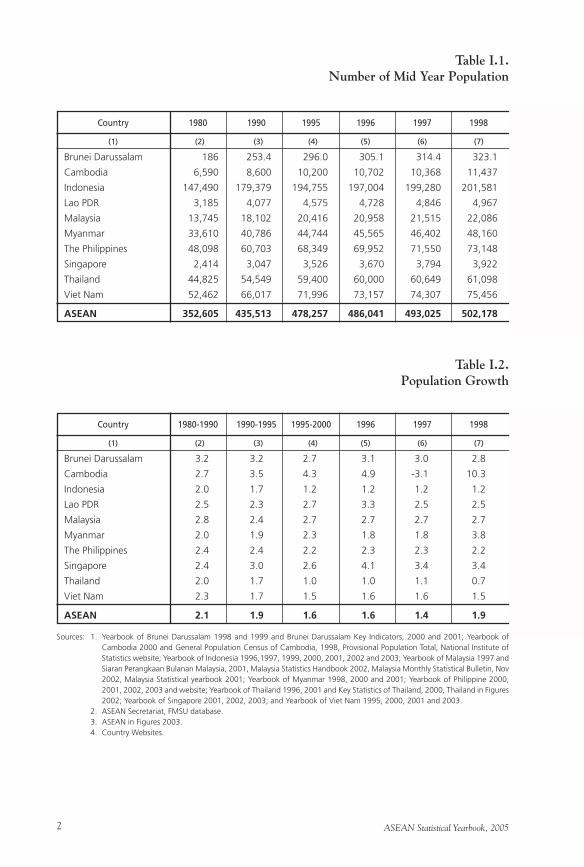
Table I.1.Number of Mid Year Population
Country
(1) (2) (3) (4) (5) (6) (7)
Brunei Darussalam 186 253.4 296.0 305.1 314.4 323.1
Cambodia 6,590 8,600 10,200 10,702 10,368 11,437
Indonesia 147,490 179,379 194,755 197,004 199,280 201,581
Lao PDR 3,185 4,077 4,575 4,728 4,846 4,967
Malaysia 13,745 18,102 20,416 20,958 21,515 22,086
Myanmar 33,610 40,786 44,744 45,565 46,402 48,160
The Philippines 48,098 60,703 68,349 69,952 71,550 73,148
Singapore 2,414 3,047 3,526 3,670 3,794 3,922
Thailand 44,825 54,549 59,400 60,000 60,649 61,098
Viet Nam 52,462 66,017 71,996 73,157 74,307 75,456
ASEAN 352,605 435,513 478,257 486,041 493,025 502,178
1980 1990 1995 1996 1997 1998
Table I.2.Population Growth
Sources: 1. Yearbook of Brunei Darussalam 1998 and 1999 and Brunei Darussalam Key Indicators, 2000 and 2001; Yearbook of Cambodia 2000 and General Population Census of Cambodia, 1998, Provisional Population Total, National Institute of Statistics website; Yearbook of Indonesia 1996,1997, 1999, 2000, 2001, 2002 and 2003; Yearbook of Malaysia 1997 and Siaran Perangkaan Bulanan Malaysia, 2001, Malaysia Statistics Handbook 2002, Malaysia Monthly Statistical Bulletin, Nov 2002, Malaysia Statistical yearbook 2001; Yearbook of Myanmar 1998, 2000 and 2001; Yearbook of Philippine 2000, 2001, 2002, 2003 and website; Yearbook of Thailand 1996, 2001 and Key Statistics of Thailand, 2000, Thailand in Figures 2002; Yearbook of Singapore 2001, 2002, 2003; and Yearbook of Viet Nam 1995, 2000, 2001 and 2003.
2. ASEAN Secretariat, FMSU database. 3. ASEAN in Figures 2003. 4. Country Websites.
Country
(1) (2) (3) (4) (5) (6) (7)
Brunei Darussalam 3.2 3.2 2.7 3.1 3.0 2.8
Cambodia 2.7 3.5 4.3 4.9 -3.1 10.3
Indonesia 2.0 1.7 1.2 1.2 1.2 1.2
Lao PDR 2.5 2.3 2.7 3.3 2.5 2.5
Malaysia 2.8 2.4 2.7 2.7 2.7 2.7
Myanmar 2.0 1.9 2.3 1.8 1.8 3.8
The Philippines 2.4 2.4 2.2 2.3 2.3 2.2
Singapore 2.4 3.0 2.6 4.1 3.4 3.4
Thailand 2.0 1.7 1.0 1.0 1.1 0.7
Viet Nam 2.3 1.7 1.5 1.6 1.6 1.5
ASEAN 2.1 1.9 1.6 1.6 1.4 1.9
1980-1990 1990-1995 1995-2000 1996 1997 1998
ASEAN Statistical Yearbook, 2005 3
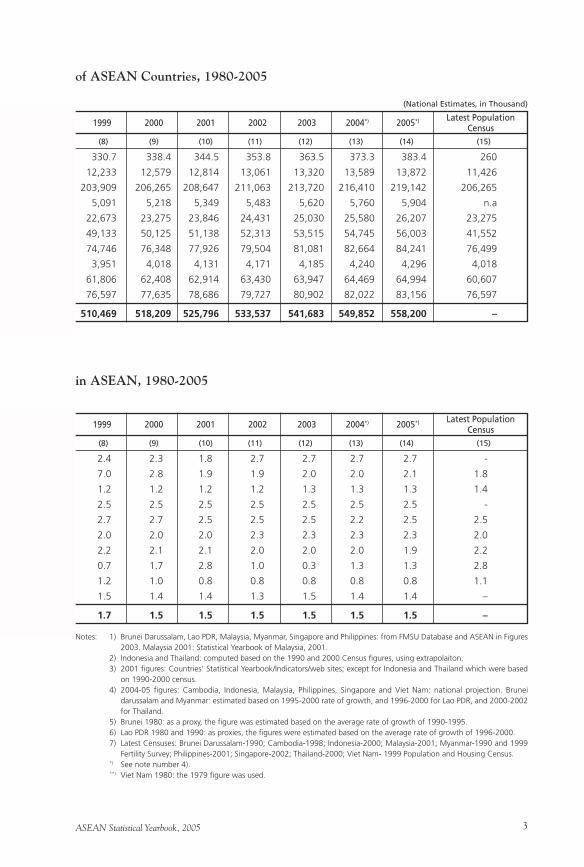
330.7 338.4 344.5 353.8 363.5 373.3 383.4 260
12,233 12,579 12,814 13,061 13,320 13,589 13,872 11,426
203,909 206,265 208,647 211,063 213,720 216,410 219,142 206,265
5,091 5,218 5,349 5,483 5,620 5,760 5,904 n.a
22,673 23,275 23,846 24,431 25,030 25,580 26,207 23,275
49,133 50,125 51,138 52,313 53,515 54,745 56,003 41,552
74,746 76,348 77,926 79,504 81,081 82,664 84,241 76,499
3,951 4,018 4,131 4,171 4,185 4,240 4,296 4,018
61,806 62,408 62,914 63,430 63,947 64,469 64,994 60,607
76,597 77,635 78,686 79,727 80,902 82,022 83,156 76,597
510,469 518,209 525,796 533,537 541,683 549,852 558,200 –
of ASEAN Countries, 1980-2005
(8) (9) (10) (11) (12) (13) (14) (15)
Latest Population Census
(National Estimates, in Thousand)
in ASEAN, 1980-2005
Notes: 1) Brunei Darussalam, Lao PDR, Malaysia, Myanmar, Singapore and Philippines: from FMSU Database and ASEAN in Figures 2003. Malaysia 2001: Statistical Yearbook of Malaysia, 2001.
2) Indonesia and Thailand: computed based on the 1990 and 2000 Census figures, using extrapolaiton. 3) 2001 figures: Countries’ Statistical Yearbook/Indicators/web sites; except for Indonesia and Thailand which were based
on 1990-2000 census. 4) 2004-05 figures: Cambodia, Indonesia, Malaysia, Philippines, Singapore and Viet Nam: national projection. Brunei
darussalam and Myanmar: estimated based on 1995-2000 rate of growth, and 1996-2000 for Lao PDR, and 2000-2002 for Thailand.
5) Brunei 1980: as a proxy, the figure was estimated based on the average rate of growth of 1990-1995. 6) Lao PDR 1980 and 1990: as proxies, the figures were estimated based on the average rate of growth of 1996-2000. 7) Latest Censuses: Brunei Darussalam-1990; Cambodia-1998; Indonesia-2000; Malaysia-2001; Myanmar-1990 and 1999
Fertility Survey; Philippines-2001; Singapore-2002; Thailand-2000; Viet Nam- 1999 Population and Housing Census. *) See note number 4). **) Viet Nam 1980: the 1979 figure was used.
1999 2000 2001 2002 2003 2004*) 2005*)
2.4 2.3 1.8 2.7 2.7 2.7 2.7 -
7.0 2.8 1.9 1.9 2.0 2.0 2.1 1.8
1.2 1.2 1.2 1.2 1.3 1.3 1.3 1.4
2.5 2.5 2.5 2.5 2.5 2.5 2.5 -
2.7 2.7 2.5 2.5 2.5 2.2 2.5 2.5
2.0 2.0 2.0 2.3 2.3 2.3 2.3 2.0
2.2 2.1 2.1 2.0 2.0 2.0 1.9 2.2
0.7 1.7 2.8 1.0 0.3 1.3 1.3 2.8
1.2 1.0 0.8 0.8 0.8 0.8 0.8 1.1
1.5 1.4 1.4 1.3 1.5 1.4 1.4 –
1.7 1.5 1.5 1.5 1.5 1.5 1.5 –
(8) (9) (10) (11) (12) (13) (14) (15)
Latest Population Census 1999 2000 2001 2002 2003 2004*) 2005*)
ASEAN Statistical Yearbook, 20054
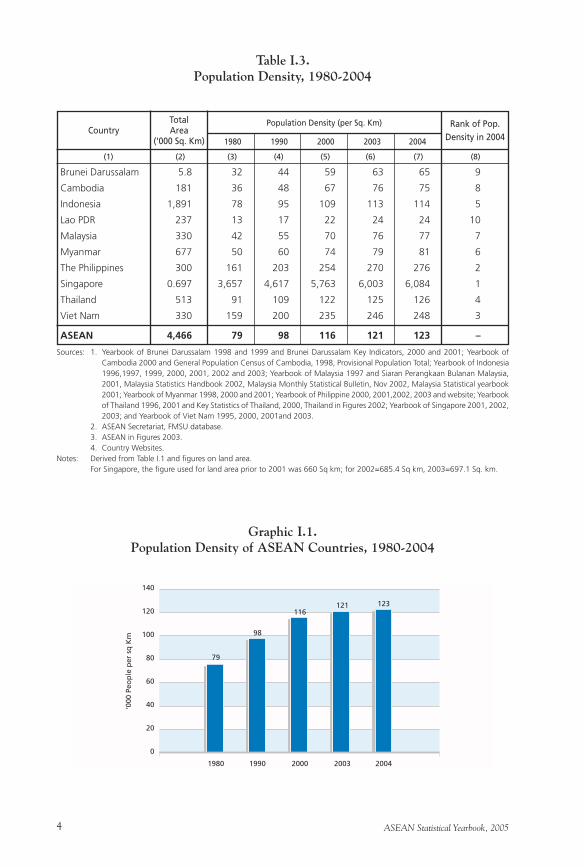
Table I.3.Population Density, 1980-2004
CountryTotalArea
(‘000 Sq. Km)
Population Density (per Sq. Km) Rank of Pop.Density in 2004 1980 1990 2000 2003 2004
Sources: 1. Yearbook of Brunei Darussalam 1998 and 1999 and Brunei Darussalam Key Indicators, 2000 and 2001; Yearbook of Cambodia 2000 and General Population Census of Cambodia, 1998, Provisional Population Total; Yearbook of Indonesia 1996,1997, 1999, 2000, 2001, 2002 and 2003; Yearbook of Malaysia 1997 and Siaran Perangkaan Bulanan Malaysia, 2001, Malaysia Statistics Handbook 2002, Malaysia Monthly Statistical Bulletin, Nov 2002, Malaysia Statistical yearbook 2001; Yearbook of Myanmar 1998, 2000 and 2001; Yearbook of Philippine 2000, 2001,2002, 2003 and website; Yearbook of Thailand 1996, 2001 and Key Statistics of Thailand, 2000, Thailand in Figures 2002; Yearbook of Singapore 2001, 2002, 2003; and Yearbook of Viet Nam 1995, 2000, 2001and 2003.
2. ASEAN Secretariat, FMSU database. 3. ASEAN in Figures 2003. 4. Country Websites.Notes: Derived from Table I.1 and figures on land area. For Singapore, the figure used for land area prior to 2001 was 660 Sq km; for 2002=685.4 Sq km, 2003=697.1 Sq. km.
(1) (2) (3) (4) (5) (6) (7) (8)
Brunei Darussalam 5.8 32 44 59 63 65 9
Cambodia 181 36 48 67 76 75 8
Indonesia 1,891 78 95 109 113 114 5
Lao PDR 237 13 17 22 24 24 10
Malaysia 330 42 55 70 76 77 7
Myanmar 677 50 60 74 79 81 6
The Philippines 300 161 203 254 270 276 2
Singapore 0.697 3,657 4,617 5,763 6,003 6,084 1
Thailand 513 91 109 122 125 126 4
Viet Nam 330 159 200 235 246 248 3
ASEAN 4,466 79 98 116 121 123 –
Graphic I.1.Population Density of ASEAN Countries, 1980-2004
ASEAN Statistical Yearbook, 2005 5
Male Female Total Male Female Total
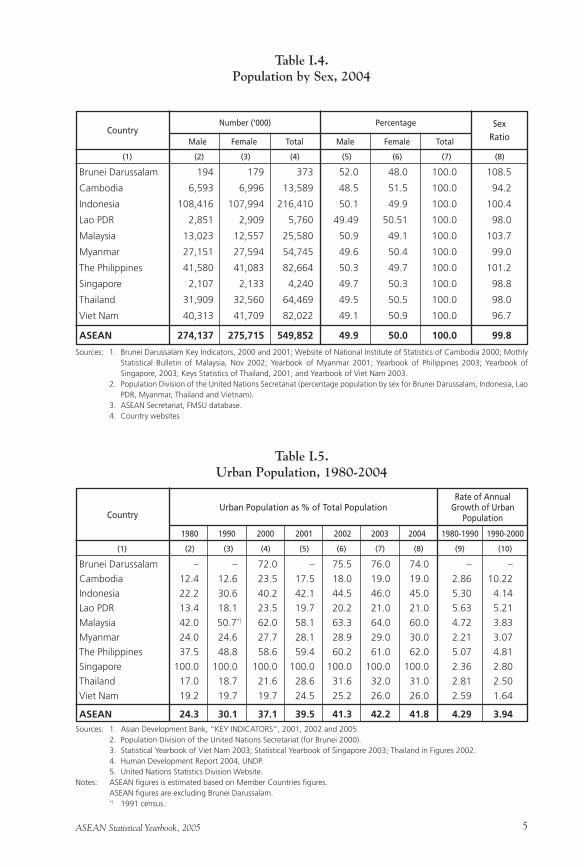
Table I.4.Population by Sex, 2004
CountryNumber (‘000)
Sources: 1. Brunei Darussalam Key Indicators, 2000 and 2001; Website of National Institute of Statistics of Cambodia 2000; Mothly Statistical Bulletin of Malaysia, Nov 2002; Yearbook of Myanmar 2001; Yearbook of Philippines 2003; Yearbook of Singapore, 2003; Keys Statistics of Thailand, 2001; and Yearbook of Viet Nam 2003.
2. Population Division of the United Nations Secretariat (percentage population by sex for Brunei Darussalam, Indonesia, Lao PDR, Myanmar, Thailand and Vietnam).
3. ASEAN Secretariat, FMSU database. 4. Country websites
(1) (2) (3) (4) (5) (6) (7) (8)
Brunei Darussalam 194 179 373 52.0 48.0 100.0 108.5
Cambodia 6,593 6,996 13,589 48.5 51.5 100.0 94.2
Indonesia 108,416 107,994 216,410 50.1 49.9 100.0 100.4
Lao PDR 2,851 2,909 5,760 49.49 50.51 100.0 98.0
Malaysia 13,023 12,557 25,580 50.9 49.1 100.0 103.7
Myanmar 27,151 27,594 54,745 49.6 50.4 100.0 99.0
The Philippines 41,580 41,083 82,664 50.3 49.7 100.0 101.2
Singapore 2,107 2,133 4,240 49.7 50.3 100.0 98.8
Thailand 31,909 32,560 64,469 49.5 50.5 100.0 98.0
Viet Nam 40,313 41,709 82,022 49.1 50.9 100.0 96.7
ASEAN 274,137 275,715 549,852 49.9 50.0 100.0 99.8
Percentage SexRatio
Brunei Darussalam – – 72.0 – 75.5 76.0 74.0 – –
Cambodia 12.4 12.6 23.5 17.5 18.0 19.0 19.0 2.86 10.22
Indonesia 22.2 30.6 40.2 42.1 44.5 46.0 45.0 5.30 4.14
Lao PDR 13.4 18.1 23.5 19.7 20.2 21.0 21.0 5.63 5.21
Malaysia 42.0 50.7*) 62.0 58.1 63.3 64.0 60.0 4.72 3.83
Myanmar 24.0 24.6 27.7 28.1 28.9 29.0 30.0 2.21 3.07
The Philippines 37.5 48.8 58.6 59.4 60.2 61.0 62.0 5.07 4.81
Singapore 100.0 100.0 100.0 100.0 100.0 100.0 100.0 2.36 2.80
Thailand 17.0 18.7 21.6 28.6 31.6 32.0 31.0 2.81 2.50
Viet Nam 19.2 19.7 19.7 24.5 25.2 26.0 26.0 2.59 1.64
ASEAN 24.3 30.1 37.1 39.5 41.3 42.2 41.8 4.29 3.94
Table I.5.Urban Population, 1980-2004
CountryUrban Population as % of Total Population
Rate of Annual Growth of Urban
Population
1980 1990 2000 2001 2002 2003 2004
(1) (2) (3) (4) (5) (6) (7) (8) (9) (10)
Sources: 1. Asian Development Bank, “KEY INDICATORS”, 2001, 2002 and 2005. 2. Population Division of the United Nations Secretariat (for Brunei 2000). 3. Statistical Yearbook of Viet Nam 2003; Statistical Yearbook of Singapore 2003; Thailand in Figures 2002. 4. Human Development Report 2004, UNDP. 5. United Nations Statistics Division Website.Notes: ASEAN figures is estimated based on Member Countries figures. ASEAN figures are excluding Brunei Darussalam. *) 1991 census.
1990-20001980-1990
ASEAN Statistical Yearbook, 20056
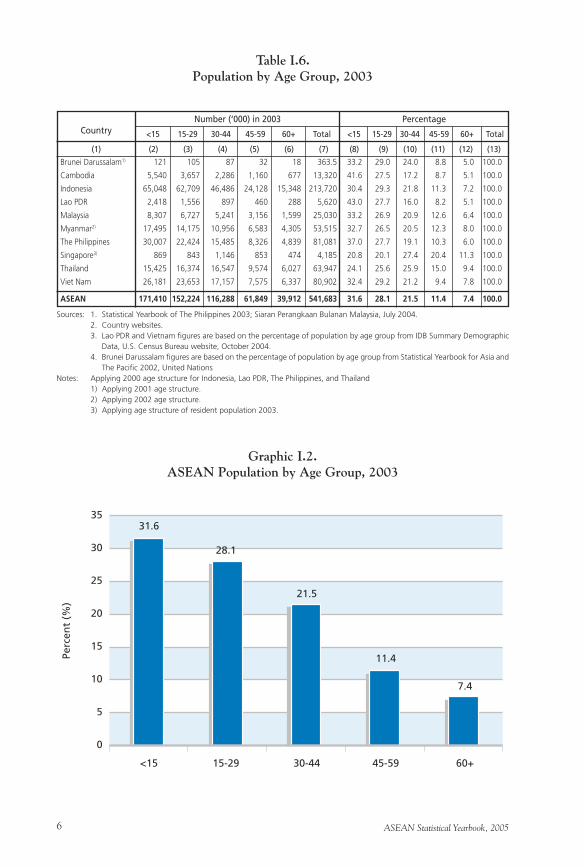
Brunei Darussalam1) 121 105 87 32 18 363.5 33.2 29.0 24.0 8.8 5.0 100.0
Cambodia 5,540 3,657 2,286 1,160 677 13,320 41.6 27.5 17.2 8.7 5.1 100.0
Indonesia 65,048 62,709 46,486 24,128 15,348 213,720 30.4 29.3 21.8 11.3 7.2 100.0
Lao PDR 2,418 1,556 897 460 288 5,620 43.0 27.7 16.0 8.2 5.1 100.0
Malaysia 8,307 6,727 5,241 3,156 1,599 25,030 33.2 26.9 20.9 12.6 6.4 100.0
Myanmar2) 17,495 14,175 10,956 6,583 4,305 53,515 32.7 26.5 20.5 12.3 8.0 100.0
The Philippines 30,007 22,424 15,485 8,326 4,839 81,081 37.0 27.7 19.1 10.3 6.0 100.0
Singapore3) 869 843 1,146 853 474 4,185 20.8 20.1 27.4 20.4 11.3 100.0
Thailand 15,425 16,374 16,547 9,574 6,027 63,947 24.1 25.6 25.9 15.0 9.4 100.0
Viet Nam 26,181 23,653 17,157 7,575 6,337 80,902 32.4 29.2 21.2 9.4 7.8 100.0
ASEAN 171,410 152,224 116,288 61,849 39,912 541,683 31.6 28.1 21.5 11.4 7.4 100.0
CountryNumber (‘000) in 2003 Percentage
<15 15-29 30-44 45-59 60+ Total
Sources: 1. Statistical Yearbook of The Philippines 2003; Siaran Perangkaan Bulanan Malaysia, July 2004. 2. Country websites. 3. Lao PDR and Vietnam figures are based on the percentage of population by age group from IDB Summary Demographic
Data, U.S. Census Bureau website, October 2004. 4. Brunei Darussalam figures are based on the percentage of population by age group from Statistical Yearbook for Asia and
The Pacific 2002, United NationsNotes: Applying 2000 age structure for Indonesia, Lao PDR, The Philippines, and Thailand 1) Applying 2001 age structure. 2) Applying 2002 age structure. 3) Applying age structure of resident population 2003.
(1) (2) (3) (4) (5) (6) (7) (8) (9) (10) (11) (12) (13)
<15 15-29 30-44 45-59 60+ Total
Table I.6.Population by Age Group, 2003
Graphic I.2.ASEAN Population by Age Group, 2003

ASEAN Statistical Yearbook, 2005 7
Chapter IIEducation, Health and
Reproduction

ASEAN Statistical Yearbook, 20058
ASEAN Statistical Yearbook, 2005 9
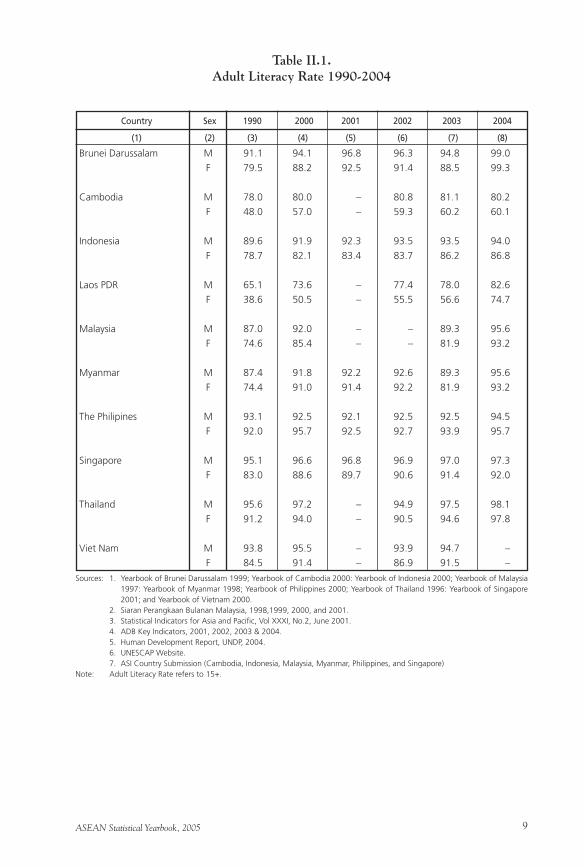
(1) (2) (3) (4) (5) (6) (7) (8)
Brunei Darussalam M 91.1 94.1 96.8 96.3 94.8 99.0
F 79.5 88.2 92.5 91.4 88.5 99.3
Cambodia M 78.0 80.0 – 80.8 81.1 80.2
F 48.0 57.0 – 59.3 60.2 60.1
Indonesia M 89.6 91.9 92.3 93.5 93.5 94.0
F 78.7 82.1 83.4 83.7 86.2 86.8
Laos PDR M 65.1 73.6 – 77.4 78.0 82.6
F 38.6 50.5 – 55.5 56.6 74.7
Malaysia M 87.0 92.0 – – 89.3 95.6
F 74.6 85.4 – – 81.9 93.2
Myanmar M 87.4 91.8 92.2 92.6 89.3 95.6
F 74.4 91.0 91.4 92.2 81.9 93.2
The Philipines M 93.1 92.5 92.1 92.5 92.5 94.5
F 92.0 95.7 92.5 92.7 93.9 95.7
Singapore M 95.1 96.6 96.8 96.9 97.0 97.3
F 83.0 88.6 89.7 90.6 91.4 92.0
Thailand M 95.6 97.2 – 94.9 97.5 98.1
F 91.2 94.0 – 90.5 94.6 97.8
Viet Nam M 93.8 95.5 – 93.9 94.7 –
F 84.5 91.4 – 86.9 91.5 –
Table II.1.Adult Literacy Rate 1990-2004
Country Sex 1990 2000 2001 2002 2003 2004
Sources: 1. Yearbook of Brunei Darussalam 1999; Yearbook of Cambodia 2000: Yearbook of Indonesia 2000; Yearbook of Malaysia 1997: Yearbook of Myanmar 1998; Yearbook of Philippines 2000; Yearbook of Thailand 1996: Yearbook of Singapore 2001; and Yearbook of Vietnam 2000.
2. Siaran Perangkaan Bulanan Malaysia, 1998,1999, 2000, and 2001. 3. Statistical Indicators for Asia and Pacific, Vol XXXI, No.2, June 2001. 4. ADB Key Indicators, 2001, 2002, 2003 & 2004. 5. Human Development Report, UNDP, 2004. 6. UNESCAP Website. 7. ASI Country Submission (Cambodia, Indonesia, Malaysia, Myanmar, Philippines, and Singapore)Note: Adult Literacy Rate refers to 15+.
ASEAN Statistical Yearbook, 200510
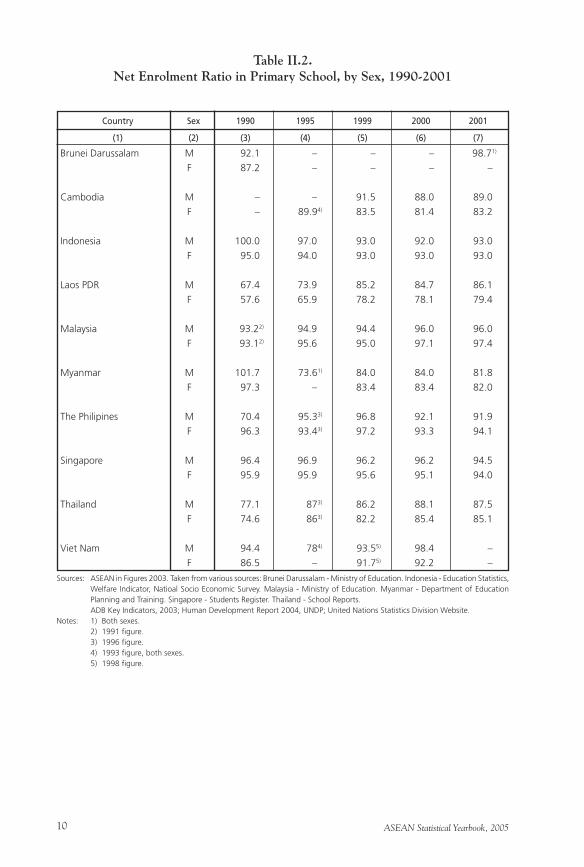
Country Sex 1990 1995 1999 2000 2001
(1) (2) (3) (4) (5) (6) (7)
Brunei Darussalam M 92.1 – – – 98.71)
F 87.2 – – – –
Cambodia M – – 91.5 88.0 89.0
F – 89.94) 83.5 81.4 83.2
Indonesia M 100.0 97.0 93.0 92.0 93.0
F 95.0 94.0 93.0 93.0 93.0
Laos PDR M 67.4 73.9 85.2 84.7 86.1
F 57.6 65.9 78.2 78.1 79.4
Malaysia M 93.22) 94.9 94.4 96.0 96.0
F 93.12) 95.6 95.0 97.1 97.4
Myanmar M 101.7 73.61) 84.0 84.0 81.8
F 97.3 – 83.4 83.4 82.0
The Philipines M 70.4 95.33) 96.8 92.1 91.9
F 96.3 93.43) 97.2 93.3 94.1
Singapore M 96.4 96.9 96.2 96.2 94.5
F 95.9 95.9 95.6 95.1 94.0
Thailand M 77.1 873) 86.2 88.1 87.5
F 74.6 863) 82.2 85.4 85.1
Viet Nam M 94.4 784) 93.55) 98.4 –
F 86.5 – 91.75) 92.2 –
Table II.2.Net Enrolment Ratio in Primary School, by Sex, 1990-2001
Sources: ASEAN in Figures 2003. Taken from various sources: Brunei Darussalam - Ministry of Education. Indonesia - Education Statistics, Welfare Indicator, Natioal Socio Economic Survey. Malaysia - Ministry of Education. Myanmar - Department of Education Planning and Training. Singapore - Students Register. Thailand - School Reports.
ADB Key Indicators, 2003; Human Development Report 2004, UNDP; United Nations Statistics Division Website.Notes: 1) Both sexes. 2) 1991 figure. 3) 1996 figure. 4) 1993 figure, both sexes. 5) 1998 figure.
ASEAN Statistical Yearbook, 2005 11
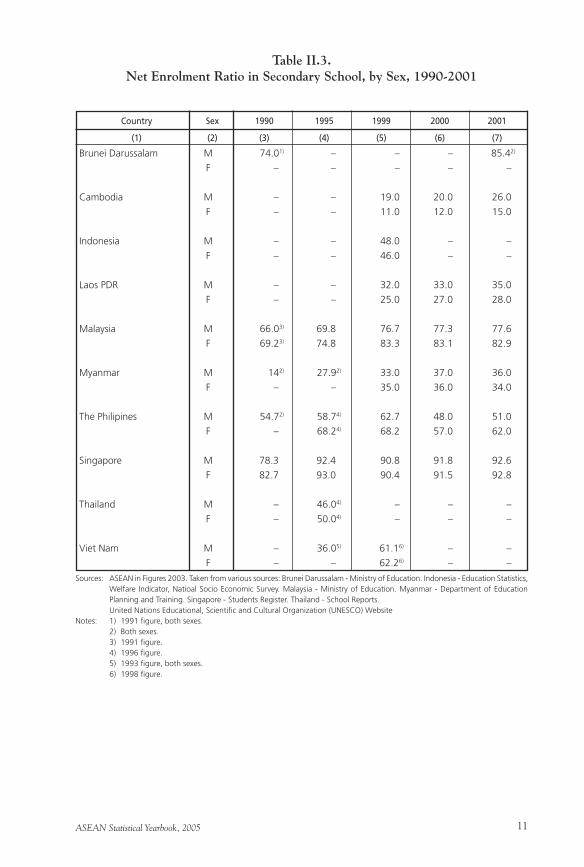
Country Sex 1990 1995 1999 2000 2001
(1) (2) (3) (4) (5) (6) (7)
Brunei Darussalam M 74.01) – – – 85.42)
F – – – – –
Cambodia M – – 19.0 20.0 26.0
F – – 11.0 12.0 15.0
Indonesia M – – 48.0 – –
F – – 46.0 – –
Laos PDR M – – 32.0 33.0 35.0
F – – 25.0 27.0 28.0
Malaysia M 66.03) 69.8 76.7 77.3 77.6
F 69.23) 74.8 83.3 83.1 82.9
Myanmar M 142) 27.92) 33.0 37.0 36.0
F – – 35.0 36.0 34.0
The Philipines M 54.72) 58.74) 62.7 48.0 51.0
F – 68.24) 68.2 57.0 62.0
Singapore M 78.3 92.4 90.8 91.8 92.6
F 82.7 93.0 90.4 91.5 92.8
Thailand M – 46.04) – – –
F – 50.04) – – –
Viet Nam M – 36.05) 61.16) – –
F – – 62.26) – –
Table II.3.Net Enrolment Ratio in Secondary School, by Sex, 1990-2001
Sources: ASEAN in Figures 2003. Taken from various sources: Brunei Darussalam - Ministry of Education. Indonesia - Education Statistics, Welfare Indicator, Natioal Socio Economic Survey. Malaysia - Ministry of Education. Myanmar - Department of Education Planning and Training. Singapore - Students Register. Thailand - School Reports.
United Nations Educational, Scientific and Cultural Organization (UNESCO) WebsiteNotes: 1) 1991 figure, both sexes. 2) Both sexes. 3) 1991 figure. 4) 1996 figure. 5) 1993 figure, both sexes. 6) 1998 figure.
ASEAN Statistical Yearbook, 200512
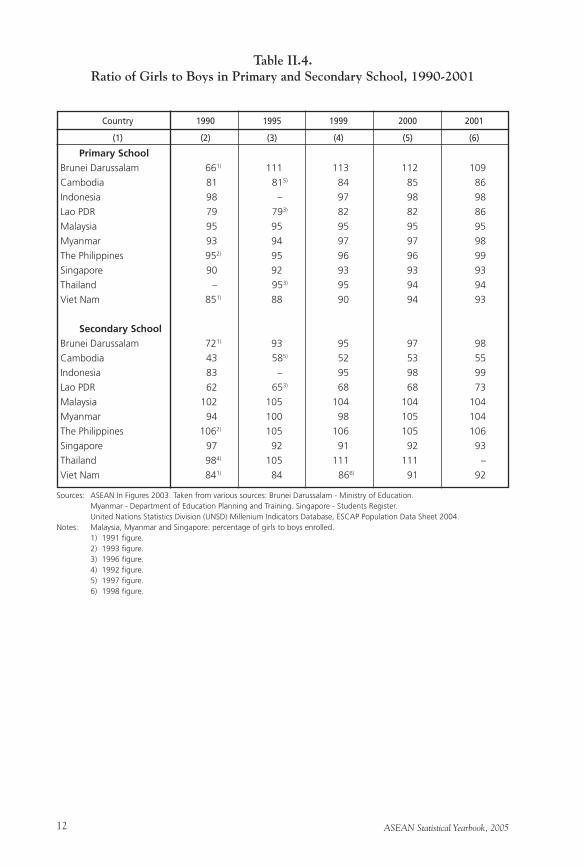
Country 1990 1995 1999 2000 2001
(1) (2) (3) (4) (5) (6)
Primary School
Brunei Darussalam 661) 111 113 112 109
Cambodia 81 815) 84 85 86
Indonesia 98 – 97 98 98
Lao PDR 79 793) 82 82 86
Malaysia 95 95 95 95 95
Myanmar 93 94 97 97 98
The Philippines 952) 95 96 96 99
Singapore 90 92 93 93 93
Thailand – 953) 95 94 94
Viet Nam 851) 88 90 94 93
Secondary School
Brunei Darussalam 721) 93 95 97 98
Cambodia 43 585) 52 53 55
Indonesia 83 – 95 98 99
Lao PDR 62 653) 68 68 73
Malaysia 102 105 104 104 104
Myanmar 94 100 98 105 104
The Philippines 1062) 105 106 105 106
Singapore 97 92 91 92 93
Thailand 984) 105 111 111 –
Viet Nam 841) 84 866) 91 92
Table II.4.Ratio of Girls to Boys in Primary and Secondary School, 1990-2001
Sources: ASEAN In Figures 2003. Taken from various sources: Brunei Darussalam - Ministry of Education. Myanmar - Department of Education Planning and Training. Singapore - Students Register. United Nations Statistics Division (UNSD) Millenium Indicators Database, ESCAP Population Data Sheet 2004.Notes: Malaysia, Myanmar and Singapore: percentage of girls to boys enrolled. 1) 1991 figure. 2) 1993 figure. 3) 1996 figure. 4) 1992 figure. 5) 1997 figure. 6) 1998 figure.
ASEAN Statistical Yearbook, 2005 13
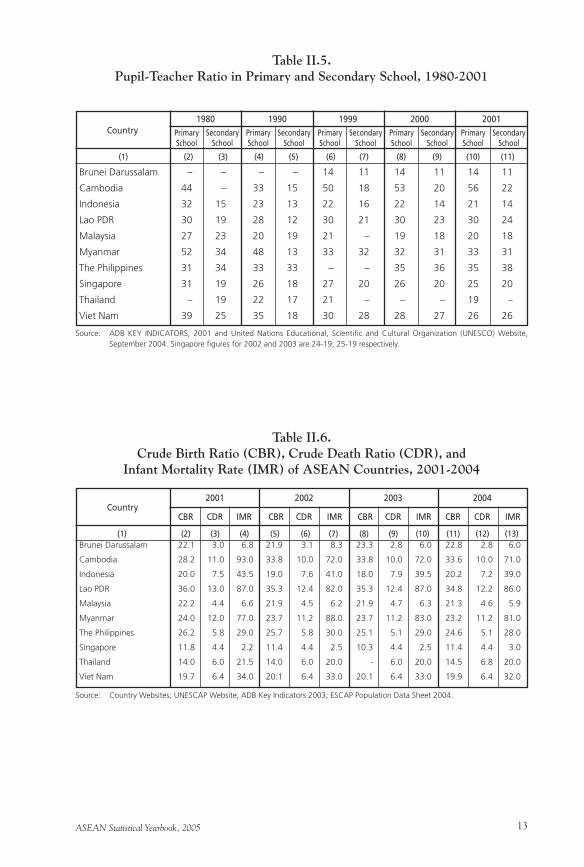
2001 2002 2003 2004
CBR CDR IMR CBR CDR IMR CBR CDR IMR CBR CDR IMR
Brunei Darussalam – – – – 14 11 14 11 14 11
Cambodia 44 – 33 15 50 18 53 20 56 22
Indonesia 32 15 23 13 22 16 22 14 21 14
Lao PDR 30 19 28 12 30 21 30 23 30 24
Malaysia 27 23 20 19 21 – 19 18 20 18
Myanmar 52 34 48 13 33 32 32 31 33 31
The Philippines 31 34 33 33 – – 35 36 35 38
Singapore 31 19 26 18 27 20 26 20 25 20
Thailand – 19 22 17 21 – – – 19 –
Viet Nam 39 25 35 18 30 28 28 27 26 26
1980 1990 1999 2000 2001
Table II.5.Pupil-Teacher Ratio in Primary and Secondary School, 1980-2001
Country
(1) (2) (3) (4) (5) (6) (7) (8) (9) (10) (11)
Source: ADB KEY INDICATORS, 2001 and United Nations Educational, Scientific and Cultural Organization (UNESCO) Website, September 2004. Singapore figures for 2002 and 2003 are 24-19; 25-19 respectively.
PrimarySchool
SecondarySchool
Brunei Darussalam 22.1 3.0 6.8 21.9 3.1 8.3 23.3 2.8 6.0 22.8 2.8 6.0
Cambodia 28.2 11.0 93.0 33.8 10.0 72.0 33.8 10.0 72.0 33.6 10.0 71.0
Indonesia 20.0 7.5 43.5 19.0 7.6 41.0 18.0 7.9 39.5 20.2 7.2 39.0
Lao PDR 36.0 13.0 87.0 35.3 12.4 82.0 35.3 12.4 87.0 34.8 12.2 86.0
Malaysia 22.2 4.4 6.6 21.9 4.5 6.2 21.9 4.7 6.3 21.3 4.6 5.9
Myanmar 24.0 12.0 77.0 23.7 11.2 88.0 23.7 11.2 83.0 23.2 11.2 81.0
The Philippines 26.2 5.8 29.0 25.7 5.8 30.0 25.1 5.1 29.0 24.6 5.1 28.0
Singapore 11.8 4.4 2.2 11.4 4.4 2.5 10.3 4.4 2.5 11.4 4.4 3.0
Thailand 14.0 6.0 21.5 14.0 6.0 20.0 - 6.0 20.0 14.5 6.8 20.0
Viet Nam 19.7 6.4 34.0 20.1 6.4 33.0 20.1 6.4 33.0 19.9 6.4 32.0
Table II.6.Crude Birth Ratio (CBR), Crude Death Ratio (CDR), and
Infant Mortality Rate (IMR) of ASEAN Countries, 2001-2004
Country
(1) (2) (3) (4) (5) (6) (7) (8) (9) (10) (11) (12) (13)
Source: Country Websites; UNESCAP Website; ADB Key Indicators 2003; ESCAP Population Data Sheet 2004.
PrimarySchool
SecondarySchool
PrimarySchool
SecondarySchool
PrimarySchool
SecondarySchool
PrimarySchool
SecondarySchool
ASEAN Statistical Yearbook, 200514
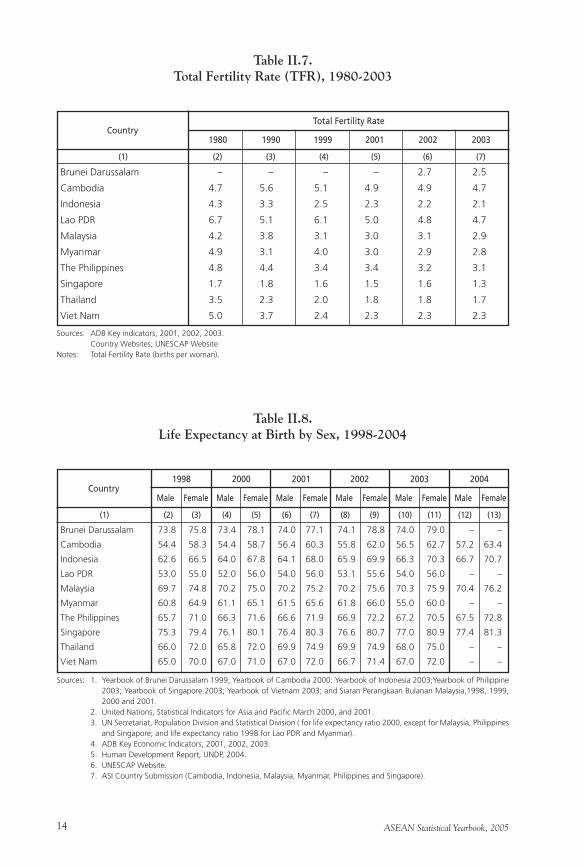
Brunei Darussalam – – – – 2.7 2.5
Cambodia 4.7 5.6 5.1 4.9 4.9 4.7
Indonesia 4.3 3.3 2.5 2.3 2.2 2.1
Lao PDR 6.7 5.1 6.1 5.0 4.8 4.7
Malaysia 4.2 3.8 3.1 3.0 3.1 2.9
Myanmar 4.9 3.1 4.0 3.0 2.9 2.8
The Philippines 4.8 4.4 3.4 3.4 3.2 3.1
Singapore 1.7 1.8 1.6 1.5 1.6 1.3
Thailand 3.5 2.3 2.0 1.8 1.8 1.7
Viet Nam 5.0 3.7 2.4 2.3 2.3 2.3
Table II.7.Total Fertility Rate (TFR), 1980-2003
CountryTotal Fertility Rate
1980 1990 1999 2001 2002 2003
Sources: ADB Key indicators, 2001, 2002, 2003. Country Websites; UNESCAP Website Notes: Total Fertility Rate (births per woman).
(1) (2) (3) (4) (5) (6) (7)
Brunei Darussalam 73.8 75.8 73.4 78.1 74.0 77.1 74.1 78.8 74.0 79.0 – –
Cambodia 54.4 58.3 54.4 58.7 56.4 60.3 55.8 62.0 56.5 62.7 57.2 63.4
Indonesia 62.6 66.5 64.0 67.8 64.1 68.0 65.9 69.9 66.3 70.3 66.7 70.7
Lao PDR 53.0 55.0 52.0 56.0 54.0 56.0 53.1 55.6 54.0 56.0 – –
Malaysia 69.7 74.8 70.2 75.0 70.2 75.2 70.2 75.6 70.3 75.9 70.4 76.2
Myanmar 60.8 64.9 61.1 65.1 61.5 65.6 61.8 66.0 55.0 60.0 – –
The Philippines 65.7 71.0 66.3 71.6 66.6 71.9 66.9 72.2 67.2 70.5 67.5 72.8
Singapore 75.3 79.4 76.1 80.1 76.4 80.3 76.6 80.7 77.0 80.9 77.4 81.3
Thailand 66.0 72.0 65.8 72.0 69.9 74.9 69.9 74.9 68.0 75.0 – –
Viet Nam 65.0 70.0 67.0 71.0 67.0 72.0 66.7 71.4 67.0 72.0 – –
1998 2000 2001 2002 2003 2004
Table II.8.Life Expectancy at Birth by Sex, 1998-2004
Country
(1) (2) (3) (4) (5) (6) (7) (8) (9) (10) (11) (12) (13)
Sources: 1. Yearbook of Brunei Darussalam 1999; Yearbook of Cambodia 2000: Yearbook of Indonesia 2003;Yearbook of Philippine 2003; Yearbook of Singapore 2003; Yearbook of Vietnam 2003; and Siaran Perangkaan Bulanan Malaysia,1998, 1999, 2000 and 2001.
2. United Nations, Statistical Indicators for Asia and Pacific March 2000, and 2001. 3. UN Secretariat, Population Division and Statistical Division ( for life expectancy ratio 2000, except for Malaysia, Philippines
and Singapore; and life expectancy ratio 1998 for Lao PDR and Myanmar). 4. ADB Key Economic Indicators, 2001, 2002, 2003. 5. Human Development Report, UNDP, 2004. 6. UNESCAP Website. 7. ASI Country Submission (Cambodia, Indonesia, Malaysia, Myanmar, Philippines and Singapore).
Male Female Male Female Male Female Male Female Male Female Male Female
ASEAN Statistical Yearbook, 2005 15
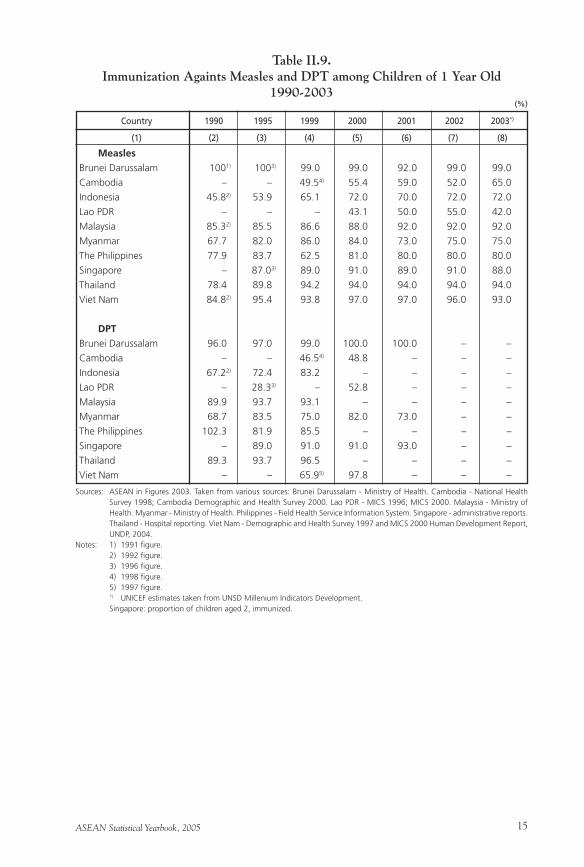
Country 1990 1995 1999 2000 2001 2002 2003*)
(1) (2) (3) (4) (5) (6) (7) (8)
Measles
Brunei Darussalam 1001) 1003) 99.0 99.0 92.0 99.0 99.0
Cambodia – – 49.54) 55.4 59.0 52.0 65.0
Indonesia 45.82) 53.9 65.1 72.0 70.0 72.0 72.0
Lao PDR – – – 43.1 50.0 55.0 42.0
Malaysia 85.32) 85.5 86.6 88.0 92.0 92.0 92.0
Myanmar 67.7 82.0 86.0 84.0 73.0 75.0 75.0
The Philippines 77.9 83.7 62.5 81.0 80.0 80.0 80.0
Singapore – 87.03) 89.0 91.0 89.0 91.0 88.0
Thailand 78.4 89.8 94.2 94.0 94.0 94.0 94.0
Viet Nam 84.82) 95.4 93.8 97.0 97.0 96.0 93.0
DPT
Brunei Darussalam 96.0 97.0 99.0 100.0 100.0 – –
Cambodia – – 46.54) 48.8 – – –
Indonesia 67.22) 72.4 83.2 – – – –
Lao PDR – 28.33) – 52.8 – – –
Malaysia 89.9 93.7 93.1 – – – –
Myanmar 68.7 83.5 75.0 82.0 73.0 – –
The Philippines 102.3 81.9 85.5 – – – –
Singapore – 89.0 91.0 91.0 93.0 – –
Thailand 89.3 93.7 96.5 – – – –
Viet Nam – – 65.95) 97.8 – – –
Table II.9.Immunization Againts Measles and DPT among Children of 1 Year Old
1990-2003
Sources: ASEAN in Figures 2003. Taken from various sources: Brunei Darussalam - Ministry of Health. Cambodia - National Health Survey 1998; Cambodia Demographic and Health Survey 2000. Lao PDR - MICS 1996; MICS 2000. Malaysia - Ministry of Health. Myanmar - Ministry of Health. Philippines - Field Health Service Information System. Singapore - administrative reports. Thailand - Hospital reporting. Viet Nam - Demographic and Health Survey 1997 and MICS 2000 Human Development Report, UNDP, 2004.
Notes: 1) 1991 figure. 2) 1992 figure. 3) 1996 figure. 4) 1998 figure. 5) 1997 figure. *) UNICEF estimates taken from UNSD Millenium Indicators Development. Singapore: proportion of children aged 2, immunized.
(%)
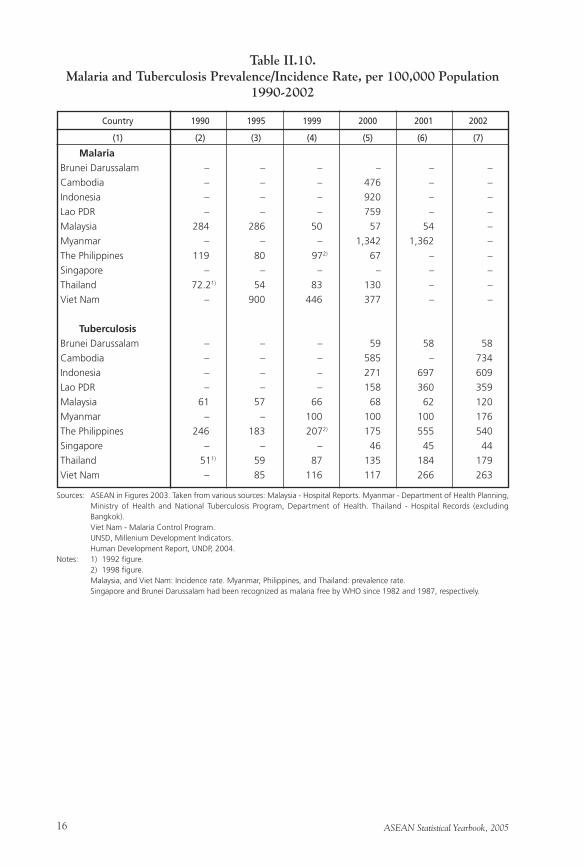
ASEAN Statistical Yearbook, 200516
Table II.10.Malaria and Tuberculosis Prevalence/Incidence Rate, per 100,000 Population
1990-2002
Sources: ASEAN in Figures 2003. Taken from various sources: Malaysia - Hospital Reports. Myanmar - Department of Health Planning, Ministry of Health and National Tuberculosis Program, Department of Health. Thailand - Hospital Records (excluding Bangkok).
Viet Nam - Malaria Control Program. UNSD, Millenium Development Indicators. Human Development Report, UNDP, 2004.Notes: 1) 1992 figure. 2) 1998 figure. Malaysia, and Viet Nam: Incidence rate. Myanmar, Philippines, and Thailand: prevalence rate. Singapore and Brunei Darussalam had been recognized as malaria free by WHO since 1982 and 1987, respectively.
(1) (2) (3) (4) (5) (6) (7)
Malaria
Brunei Darussalam – – – – – –
Cambodia – – – 476 – –
Indonesia – – – 920 – –
Lao PDR – – – 759 – –
Malaysia 284 286 50 57 54 –
Myanmar – – – 1,342 1,362 –
The Philippines 119 80 972) 67 – –
Singapore – – – – – –
Thailand 72.21) 54 83 130 – –
Viet Nam – 900 446 377 – –
Tuberculosis
Brunei Darussalam – – – 59 58 58
Cambodia – – – 585 – 734
Indonesia – – – 271 697 609
Lao PDR – – – 158 360 359
Malaysia 61 57 66 68 62 120
Myanmar – – 100 100 100 176
The Philippines 246 183 2072) 175 555 540
Singapore – – – 46 45 44
Thailand 511) 59 87 135 184 179
Viet Nam – 85 116 117 266 263
Country 1990 1995 1999 2000 2001 2002
ASEAN Statistical Yearbook, 2005 17
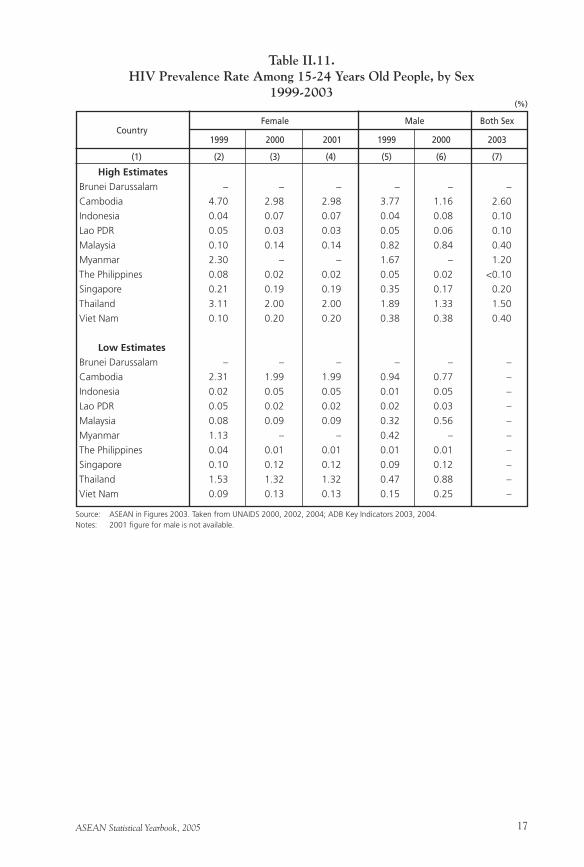
Table II.11.HIV Prevalence Rate Among 15-24 Years Old People, by Sex
1999-2003
Source: ASEAN in Figures 2003. Taken from UNAIDS 2000, 2002, 2004; ADB Key Indicators 2003, 2004.Notes: 2001 figure for male is not available.
(1) (2) (3) (4) (5) (6) (7)
High Estimates
Brunei Darussalam – – – – – –
Cambodia 4.70 2.98 2.98 3.77 1.16 2.60
Indonesia 0.04 0.07 0.07 0.04 0.08 0.10
Lao PDR 0.05 0.03 0.03 0.05 0.06 0.10
Malaysia 0.10 0.14 0.14 0.82 0.84 0.40
Myanmar 2.30 – – 1.67 – 1.20
The Philippines 0.08 0.02 0.02 0.05 0.02 <0.10
Singapore 0.21 0.19 0.19 0.35 0.17 0.20
Thailand 3.11 2.00 2.00 1.89 1.33 1.50
Viet Nam 0.10 0.20 0.20 0.38 0.38 0.40
Low Estimates
Brunei Darussalam – – – – – –
Cambodia 2.31 1.99 1.99 0.94 0.77 –
Indonesia 0.02 0.05 0.05 0.01 0.05 –
Lao PDR 0.05 0.02 0.02 0.02 0.03 –
Malaysia 0.08 0.09 0.09 0.32 0.56 –
Myanmar 1.13 – – 0.42 – –
The Philippines 0.04 0.01 0.01 0.01 0.01 –
Singapore 0.10 0.12 0.12 0.09 0.12 –
Thailand 1.53 1.32 1.32 0.47 0.88 –
Viet Nam 0.09 0.13 0.13 0.15 0.25 –
1999 2000 2001 1999 2000 2003
(%)
Country Female Male Both Sex
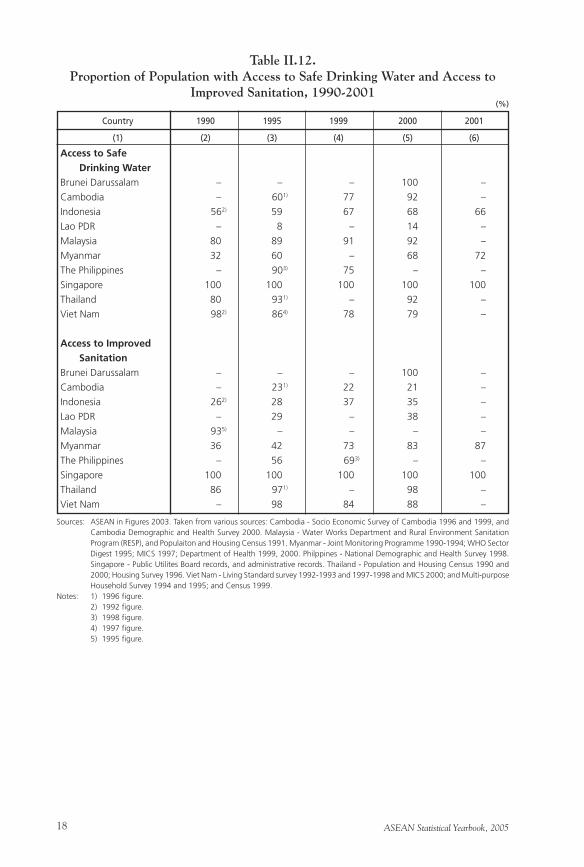
ASEAN Statistical Yearbook, 200518
Country 1990 1995 1999 2000 2001
(1) (2) (3) (4) (5) (6)
Access to Safe
Drinking Water
Brunei Darussalam – – – 100 –
Cambodia – 601) 77 92 –
Indonesia 562) 59 67 68 66
Lao PDR – 8 – 14 –
Malaysia 80 89 91 92 –
Myanmar 32 60 – 68 72
The Philippines – 903) 75 – –
Singapore 100 100 100 100 100
Thailand 80 931) – 92 –
Viet Nam 982) 864) 78 79 –
Access to Improved
Sanitation
Brunei Darussalam – – – 100 –
Cambodia – 231) 22 21 –
Indonesia 262) 28 37 35 –
Lao PDR – 29 – 38 –
Malaysia 935) – – – –
Myanmar 36 42 73 83 87
The Philippines – 56 693) – –
Singapore 100 100 100 100 100
Thailand 86 971) – 98 –
Viet Nam – 98 84 88 –
Table II.12.Proportion of Population with Access to Safe Drinking Water and Access to
Improved Sanitation, 1990-2001
Sources: ASEAN in Figures 2003. Taken from various sources: Cambodia - Socio Economic Survey of Cambodia 1996 and 1999, and Cambodia Demographic and Health Survey 2000. Malaysia - Water Works Department and Rural Environment Sanitation Program (RESP), and Populaiton and Housing Census 1991. Myanmar - Joint Monitoring Programme 1990-1994; WHO Sector Digest 1995; MICS 1997; Department of Health 1999, 2000. Philppines - National Demographic and Health Survey 1998. Singapore - Public Utilites Board records, and administrative records. Thailand - Population and Housing Census 1990 and 2000; Housing Survey 1996. Viet Nam - Living Standard survey 1992-1993 and 1997-1998 and MICS 2000; and Multi-purpose Household Survey 1994 and 1995; and Census 1999.
Notes: 1) 1996 figure. 2) 1992 figure. 3) 1998 figure. 4) 1997 figure. 5) 1995 figure.
(%)
ASEAN Statistical Yearbook, 2005 19
Chapter IIILabour and Employment
ASEAN Statistical Yearbook, 200520
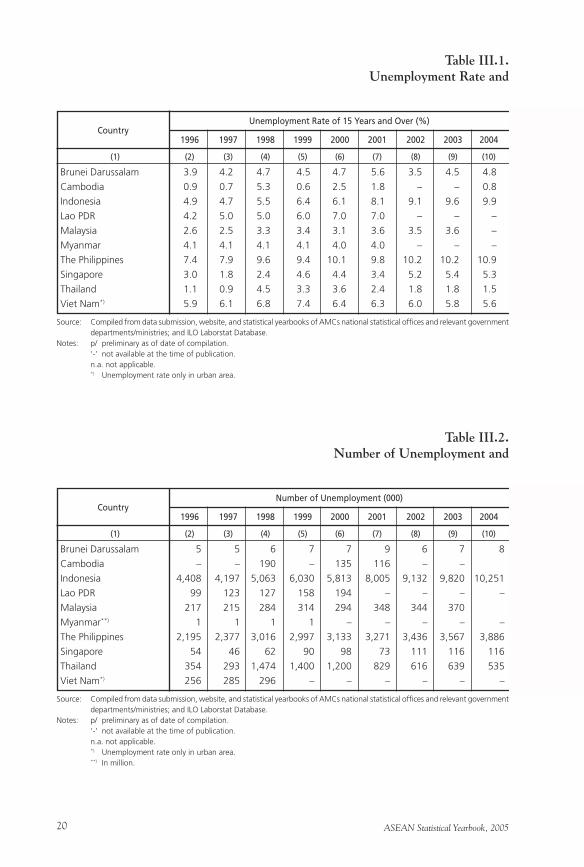
Brunei Darussalam 3.9 4.2 4.7 4.5 4.7 5.6 3.5 4.5 4.8
Cambodia 0.9 0.7 5.3 0.6 2.5 1.8 – – 0.8
Indonesia 4.9 4.7 5.5 6.4 6.1 8.1 9.1 9.6 9.9
Lao PDR 4.2 5.0 5.0 6.0 7.0 7.0 – – –
Malaysia 2.6 2.5 3.3 3.4 3.1 3.6 3.5 3.6 –
Myanmar 4.1 4.1 4.1 4.1 4.0 4.0 – – –
The Philippines 7.4 7.9 9.6 9.4 10.1 9.8 10.2 10.2 10.9
Singapore 3.0 1.8 2.4 4.6 4.4 3.4 5.2 5.4 5.3
Thailand 1.1 0.9 4.5 3.3 3.6 2.4 1.8 1.8 1.5
Viet Nam*) 5.9 6.1 6.8 7.4 6.4 6.3 6.0 5.8 5.6
1996 1997 1998 1999 2000 2001 2002 2003 2004
Table III.1.Unemployment Rate and
Country
(1) (2) (3) (4) (5) (6) (7) (8) (9) (10)
Source: Compiled from data submission, website, and statistical yearbooks of AMCs national statistical offices and relevant government departments/ministries; and ILO Laborstat Database.
Notes: p/ preliminary as of date of compilation. ‘-’ not available at the time of publication. n.a. not applicable. *) Unemployment rate only in urban area.
Unemployment Rate of 15 Years and Over (%)
Brunei Darussalam 5 5 6 7 7 9 6 7 8
Cambodia – – 190 – 135 116 – –
Indonesia 4,408 4,197 5,063 6,030 5,813 8,005 9,132 9,820 10,251
Lao PDR 99 123 127 158 194 – – – –
Malaysia 217 215 284 314 294 348 344 370
Myanmar**) 1 1 1 1 – – – – –
The Philippines 2,195 2,377 3,016 2,997 3,133 3,271 3,436 3,567 3,886
Singapore 54 46 62 90 98 73 111 116 116
Thailand 354 293 1,474 1,400 1,200 829 616 639 535
Viet Nam*) 256 285 296 – – – – – –
1996 1997 1998 1999 2000 2001 2002 2003 2004
Table III.2.Number of Unemployment and
Country
(1) (2) (3) (4) (5) (6) (7) (8) (9) (10)
Source: Compiled from data submission, website, and statistical yearbooks of AMCs national statistical offices and relevant government departments/ministries; and ILO Laborstat Database.
Notes: p/ preliminary as of date of compilation. ‘-’ not available at the time of publication. n.a. not applicable. *) Unemployment rate only in urban area. **) In million.
Number of Unemployment (000)
ASEAN Statistical Yearbook, 2005 21
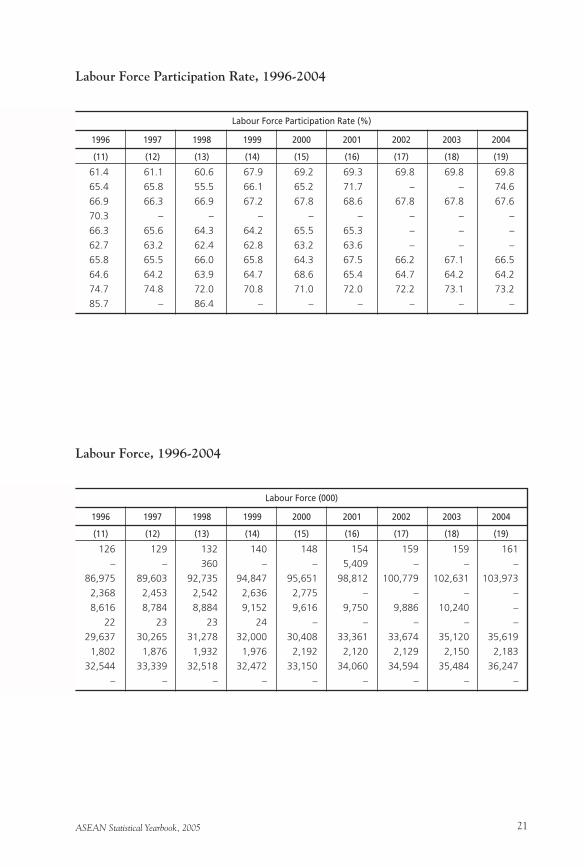
61.4 61.1 60.6 67.9 69.2 69.3 69.8 69.8 69.8
65.4 65.8 55.5 66.1 65.2 71.7 – – 74.6
66.9 66.3 66.9 67.2 67.8 68.6 67.8 67.8 67.6
70.3 – – – – – – – –
66.3 65.6 64.3 64.2 65.5 65.3 – – –
62.7 63.2 62.4 62.8 63.2 63.6 – – –
65.8 65.5 66.0 65.8 64.3 67.5 66.2 67.1 66.5
64.6 64.2 63.9 64.7 68.6 65.4 64.7 64.2 64.2
74.7 74.8 72.0 70.8 71.0 72.0 72.2 73.1 73.2
85.7 – 86.4 – – – – – –
1996 1997 1998 1999 2000 2001 2002 2003 2004
Labour Force Participation Rate, 1996-2004
(11) (12) (13) (14) (15) (16) (17) (18) (19)
Labour Force Participation Rate (%)
126 129 132 140 148 154 159 159 161
– – 360 – – 5,409 – – –
86,975 89,603 92,735 94,847 95,651 98,812 100,779 102,631 103,973
2,368 2,453 2,542 2,636 2,775 – – – –
8,616 8,784 8,884 9,152 9,616 9,750 9,886 10,240 –
22 23 23 24 – – – – –
29,637 30,265 31,278 32,000 30,408 33,361 33,674 35,120 35,619
1,802 1,876 1,932 1,976 2,192 2,120 2,129 2,150 2,183
32,544 33,339 32,518 32,472 33,150 34,060 34,594 35,484 36,247
– – – – – – – – –
1996 1997 1998 1999 2000 2001 2002 2003 2004
Labour Force, 1996-2004
(11) (12) (13) (14) (15) (16) (17) (18) (19)
Labour Force (000)
ASEAN Statistical Yearbook, 200522
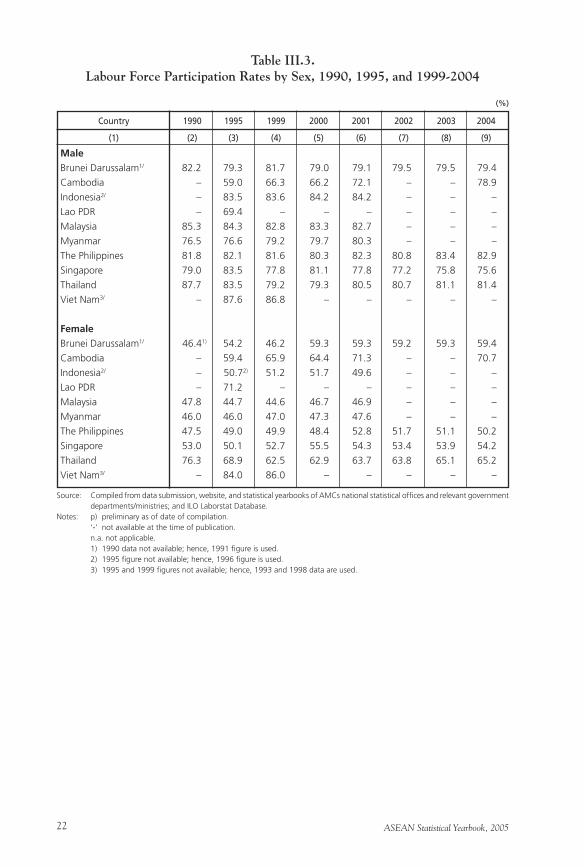
Male
Brunei Darussalam1/ 82.2 79.3 81.7 79.0 79.1 79.5 79.5 79.4
Cambodia – 59.0 66.3 66.2 72.1 – – 78.9
Indonesia2/ – 83.5 83.6 84.2 84.2 – – –
Lao PDR – 69.4 – – – – – –
Malaysia 85.3 84.3 82.8 83.3 82.7 – – –
Myanmar 76.5 76.6 79.2 79.7 80.3 – – –
The Philippines 81.8 82.1 81.6 80.3 82.3 80.8 83.4 82.9
Singapore 79.0 83.5 77.8 81.1 77.8 77.2 75.8 75.6
Thailand 87.7 83.5 79.2 79.3 80.5 80.7 81.1 81.4
Viet Nam3/ – 87.6 86.8 – – – – –
Female
Brunei Darussalam1/ 46.41) 54.2 46.2 59.3 59.3 59.2 59.3 59.4
Cambodia – 59.4 65.9 64.4 71.3 – – 70.7
Indonesia2/ – 50.72) 51.2 51.7 49.6 – – –
Lao PDR – 71.2 – – – – – –
Malaysia 47.8 44.7 44.6 46.7 46.9 – – –
Myanmar 46.0 46.0 47.0 47.3 47.6 – – –
The Philippines 47.5 49.0 49.9 48.4 52.8 51.7 51.1 50.2
Singapore 53.0 50.1 52.7 55.5 54.3 53.4 53.9 54.2
Thailand 76.3 68.9 62.5 62.9 63.7 63.8 65.1 65.2
Viet Nam3/ – 84.0 86.0 – – – – –
Table III.3.Labour Force Participation Rates by Sex, 1990, 1995, and 1999-2004
Country 1990 1995 1999 2000 2001 2002 2003 2004
(1) (2) (3) (4) (5) (6) (7) (8) (9)
Source: Compiled from data submission, website, and statistical yearbooks of AMCs national statistical offices and relevant government departments/ministries; and ILO Laborstat Database.
Notes: p) preliminary as of date of compilation. ‘-’ not available at the time of publication. n.a. not applicable. 1) 1990 data not available; hence, 1991 figure is used. 2) 1995 figure not available; hence, 1996 figure is used. 3) 1995 and 1999 figures not available; hence, 1993 and 1998 data are used.
(%)
ASEAN Statistical Yearbook, 2005 23
Male
Brunei Darussalam1/ 3.6 3.5 – 2.7 3.7 2.2 3.3 4.2
Cambodia – 2.2 0.5 2.1 1.5 – – 0.8
Indonesia2/ – 4.2 6.0 5.7 6.6 – – –
Lao PDR – 1.7 – – – – – –
Malaysia 4.0 2.8 3.5 3.0 3.5 3.3 3.6 –
Myanmar 3.7 3.7 3.6 3.6 3.6 – – –
The Philippines 7.1 7.7 9.7 10.3 9.4 10.1 10.1 10.4
Singapore 1.9 2.7 4.5 4.0 3.5 5.4 5.5 5.4
Thailand 2.0 0.9 2.8 3.4 2.4 1.7 1.9
Viet Nam – – – – – – – –
Female
Brunei Darussalam1/ 6.8 7.0 – 8.6 8.1 5.3 6.2 5.6
Cambodia – 2.8 0.6 2.8 2.2 – – 0.9
Indonesia2/ – 5.9 6.9 6.7 10.6 – – –
Lao PDR – 1.7 – – – – – –
Malaysia 5.4 3.8 3.3 3.2 3.8 3.8 3.6 –
Myanmar 4.9 4.8 4.8 4.7 4.7 – – –
The Philippines 9.8 9.4 9.3 9.9 10.3 10.2 10.3 11.7
Singapore 1.3 2.8 4.6 5.1 3.4 5.0 5.3 5.3
Thailand 2.4 1.3 3.8 3.9 2.4 1.8 1.7 1.5
Viet Nam – – – – – – – –
Table III.4.Unemployment Rate of People 15 Years and older by Sex,
1990, 1995, and 1999-2004
Country 1990 1995 1999 2000 2001 2002 2003 2004
(1) (2) (3) (4) (5) (6) (7) (8) (9)
Source: Compiled from data submission, website, and statistical yearbooks of AMCs national statistical offices and relevant government departments/ministries; and ILO Laborstat Database.
Notes: p) preliminary as of date of compilation. ‘-’ not available at the time of publication. n.a. not applicable. 1) 1990 data not available; hence, 1991 figure is used. 2) 1995 figure not available; hence, 1996 figure is used.
(%)
ASEAN Statistical Yearbook, 200524
Male
Brunei Darussalam1/ 21.2 17.7 – – – – – –
Cambodia2/
15-24 years old – 1.2 – 5.1 3.0 – – –
15-19 years old – – – – – – – 27.8
20-24 years old – – – – – – – 38.6
Indonesia 7.8 16.7 19.0 19.7 22.3 – – –
Lao PDR – 6.4 – – – – – –
Malaysia 10.4 8.6 10.0 8.7 10.2 – – –
Myanmar – – – – – – – –
The Philippines 7.7 14.4 19.0 19.8 16.6 19.7 13.4 13.9
Singapore 2.5 4.5 6.2 3.8 4.7 – – –
Thailand 4.3 2.3 8.3 7.0 6.5 5.9 – –
Viet Nam – – – – – – – –
Female
Brunei Darussalam – – – – – – – –
Cambodia2/
15-24 years old – 1.4 – 4.7 3.0 – – –
15-19 years old – – – – – – – 26.8
20-24 years old – – – – – – – 22.6
Indonesia 8.2 24.9 21.1 20.1 25.5 – – –
Lao PDR – 3.9 – – – – – –
Malaysia 12.3 9.5 9.2 8.5 10.4 – – –
Myanmar – – – – – – – –
The Philippines 16.2 19.1 22.8 23.6 22.9 24.3 16.4 18.3
Singapore 2.4 5.5 9.6 5.6 6.9 – – –
Thailand 4.2 5.5 9.6 5.6 6.9 5.6 – –
Viet Nam – – – – – – – –
Table III.5.Unemployment Rate of People 15-24 Years Old by Sex,
1990, 1995, and 1999-2004
Country 1990 1995 1999 2000 2001 2002 2003 2004
(1) (2) (3) (4) (5) (6) (7) (8) (9)
Source: Compiled from data submission, website, and statistical yearbooks of AMCs national statistical offices and relevant government departments/ministries; and ILO Laborstat Database.
Notes: p) preliminary as of date of compilation. ‘-’ not available at the time of publication. n.a. not applicable. 1) 1990 data not available; hence, 1991 figure is used. 2) 1995 figure not available; hence, 1996 figure is used. 3) 1995 and 1999 figures not available; hence, 1993 and 1998 data are used.
(%)
ASEAN Statistical Yearbook, 2005 25
Graphic III.1.Unemployment Rate of Males 15 Years and Older, 1990-2004
Graphic III.2.Unemployment Rate of Females 15 Years and Older, 1990-2004
ASEAN Statistical Yearbook, 200526
Graphic III.3.Unemployment Rate of Males 15-24 Years Old, 1990-2004
ASEAN Statistical Yearbook, 2005 27
Graphic III.4.Unemployment Rate of Females 15-24 Years Old, 1990-2004
ASEAN Statistical Yearbook, 200528
Brunei Darussalam 1995 2 4 38
2000 – – –
Cambodia 2000 3,889 367 70
2001 4,384 545 94
2002 4,480 556 100
Indonesia 2001 39,744 12,086 3,838
2002 40,634 12,110 4,274
2003 43,042 11,496 4,055
Lao PDR 1996 – – –
2000 – – –
Malaysia 1996 1,376 2,209 705
2000 1,715 2,125 802
Myanmar 1996 11,960 1,573 378
2000 – – –
The Philippines 2002 11,311 2,855 1,589
2003 11,741 3,046 1,688
2004 11,770 3,021 1,644
Singapore 1996 – 406 115
2000 – 435 274
2001 – 384 125
Thailand 2002 15,116 4,964 1,544
2003 14,704 5,271 1,724
2004 14,914 5,292 1,893
Viet Nam – – –
Table III.6.Number of Employment
Country Year
(1) (2) (3) (4) (5)
Agriculture, Fishery & Forestry
Source: Compiled from data submission, website, and statistical yearbooks of AMCs national statistical offices and relevant government departments/ministries; and ILO Laborstat Database.
Manufacturing Construction
ASEAN Statistical Yearbook, 2005 29
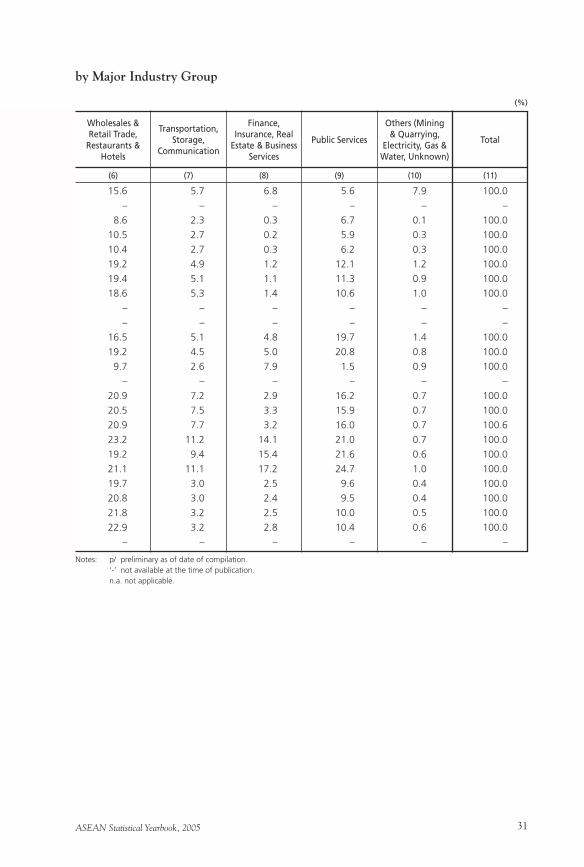
by Major Industry Group
(In Thousand)
Notes: p/ preliminary as of date of compilation. ‘-’ not available at the time of publication. n.a. not applicable.
Wholesales & Retail Trade,
Restaurants & Hotels
Transportation, Storage,
Communication
Finance, Insurance, Real
Estate & Business Services
Public Services
Others (Mining & Quarrying,
Electricity, Gas & Water, Unknown)
Total
12 4 5 4 6 76
– – – – – –
455 120 17 351 7 5,275
655 169 12 367 17 6,243
663 175 16 396 16 6,400
17,469 4,448 1,128 11,003 1,091 90,807
17,795 4,673 992 10,360 810 91,647
17,249 4,940 1,307 9,838 885 92,811
– – – – – –
– – – – – –
1,354 420 395 1,608 115 8,181
1,790 419 466 1,939 75 9,322
1,746 470 1,412 272 153 17,964
– – – – – –
6,334 2,171 878 4,888 225 30,251
6,454 2,352 1,045 5,014 214 31,553
6,589 2,445 1,001 5,045 217 31,733
406 195 246 368 12 1,748
401 197 323 453 13 2,095
432 228 352 506 20 2,047
7,053 1,021 802 3,221 141 33,861
7,370 1,081 859 3,384 171 34,565
7,764 1,081 944 3,509 194 35,591
– – – – – –
(6) (7) (8) (9) (10) (11)
ASEAN Statistical Yearbook, 200530
Brunei Darussalam 1995 2.0 5.8 50.4
2000 – – –
Cambodia 2000 73.7 7.0 1.3
2001 70.2 8.7 1.5
2002 70.0 8.7 1.6
Indonesia 2001 43.8 13.3 4.2
2002 44.3 13.2 4.7
2003 46.4 12.4 4.4
Lao PDR 1996 – – –
2000 – – –
Malaysia 1996 16.8 27.0 8.6
2000 18.4 22.8 8.6
Myanmar 1996 66.6 8.8 2.1
2000 – – –
The Philippines 2002 37.4 9.4 5.3
2003 37.2 9.7 5.3
2004 37.3 9.6 5.2
Singapore 1996 – 23.2 6.6
2000 – 20.8 13.1
2001 – 18.8 6.1
Thailand 2001 45.1 14.5 4.4
2002 44.6 14.7 4.6
2003 43.4 15.6 5.1
2004 44.0 15.6 5.6
Viet Nam – – –
Table III.7.Percentage of Employment
Country Year
(1) (2) (3) (4) (5)
Agriculture, Fishery & Forestry
Source: Compiled from data submission, website, and statistical yearbooks of AMCs national statistical offices and relevant government departments/ministries; and ILO Laborstat Database.
Manufacturing Construction
ASEAN Statistical Yearbook, 2005 31
15.6 5.7 6.8 5.6 7.9 100.0
– – – – – –
8.6 2.3 0.3 6.7 0.1 100.0
10.5 2.7 0.2 5.9 0.3 100.0
10.4 2.7 0.3 6.2 0.3 100.0
19.2 4.9 1.2 12.1 1.2 100.0
19.4 5.1 1.1 11.3 0.9 100.0
18.6 5.3 1.4 10.6 1.0 100.0
– – – – – –
– – – – – –
16.5 5.1 4.8 19.7 1.4 100.0
19.2 4.5 5.0 20.8 0.8 100.0
9.7 2.6 7.9 1.5 0.9 100.0
– – – – – –
20.9 7.2 2.9 16.2 0.7 100.0
20.5 7.5 3.3 15.9 0.7 100.0
20.9 7.7 3.2 16.0 0.7 100.6
23.2 11.2 14.1 21.0 0.7 100.0
19.2 9.4 15.4 21.6 0.6 100.0
21.1 11.1 17.2 24.7 1.0 100.0
19.7 3.0 2.5 9.6 0.4 100.0
20.8 3.0 2.4 9.5 0.4 100.0
21.8 3.2 2.5 10.0 0.5 100.0
22.9 3.2 2.8 10.4 0.6 100.0
– – – – – –
by Major Industry Group
(%)
Notes: p/ preliminary as of date of compilation. ‘-’ not available at the time of publication. n.a. not applicable.
Wholesales & Retail Trade,
Restaurants & Hotels
Transportation, Storage,
Communication
Finance, Insurance, Real
Estate & Business Services
Public Services
Others (Mining & Quarrying,
Electricity, Gas & Water, Unknown)
Total
(6) (7) (8) (9) (10) (11)
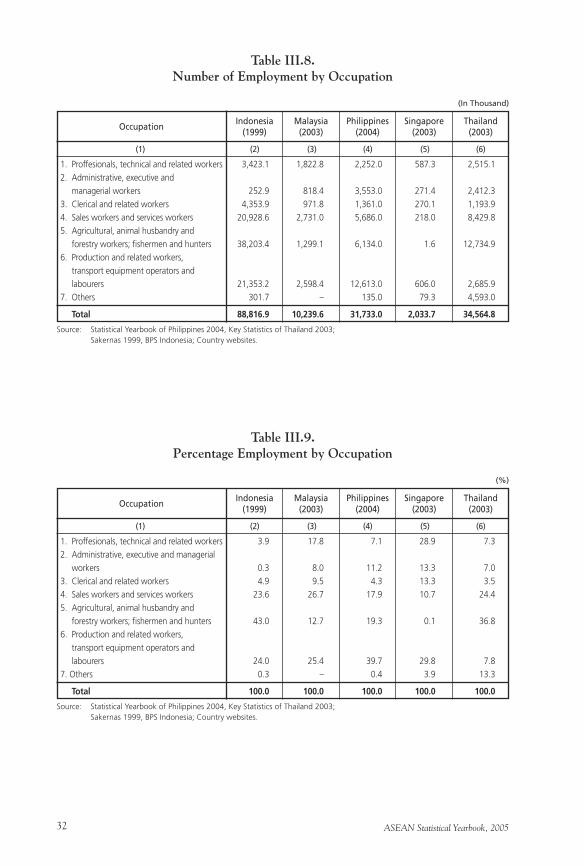
ASEAN Statistical Yearbook, 200532
Table III.8.Number of Employment by Occupation
Occupation
(1) (2) (3) (4) (5) (6)
1. Proffesionals, technical and related workers 3,423.1 1,822.8 2,252.0 587.3 2,515.1
2. Administrative, executive and
managerial workers 252.9 818.4 3,553.0 271.4 2,412.3
3. Clerical and related workers 4,353.9 971.8 1,361.0 270.1 1,193.9
4. Sales workers and services workers 20,928.6 2,731.0 5,686.0 218.0 8,429.8
5. Agricultural, animal husbandry and
forestry workers; fishermen and hunters 38,203.4 1,299.1 6,134.0 1.6 12,734.9
6. Production and related workers,
transport equipment operators and
labourers 21,353.2 2,598.4 12,613.0 606.0 2,685.9
7. Others 301.7 – 135.0 79.3 4,593.0
Total 88,816.9 10,239.6 31,733.0 2,033.7 34,564.8
Indonesia (1999)
(In Thousand)
Malaysia (2003)
Philippines (2004)
Singapore (2003)
Thailand (2003)
Table III.9.Percentage Employment by Occupation
(%)
Occupation
(1) (2) (3) (4) (5) (6)
1. Proffesionals, technical and related workers 3.9 17.8 7.1 28.9 7.3
2. Administrative, executive and managerial
workers 0.3 8.0 11.2 13.3 7.0
3. Clerical and related workers 4.9 9.5 4.3 13.3 3.5
4. Sales workers and services workers 23.6 26.7 17.9 10.7 24.4
5. Agricultural, animal husbandry and
forestry workers; fishermen and hunters 43.0 12.7 19.3 0.1 36.8
6. Production and related workers,
transport equipment operators and
labourers 24.0 25.4 39.7 29.8 7.8
7. Others 0.3 – 0.4 3.9 13.3
Total 100.0 100.0 100.0 100.0 100.0
Indonesia (1999)
Malaysia (2003)
Philippines (2004)
Singapore (2003)
Thailand (2003)
Source: Statistical Yearbook of Philippines 2004, Key Statistics of Thailand 2003; Sakernas 1999, BPS Indonesia; Country websites.
Source: Statistical Yearbook of Philippines 2004, Key Statistics of Thailand 2003; Sakernas 1999, BPS Indonesia; Country websites.
ASEAN Statistical Yearbook, 2005 33
Chapter IVMacro Economy
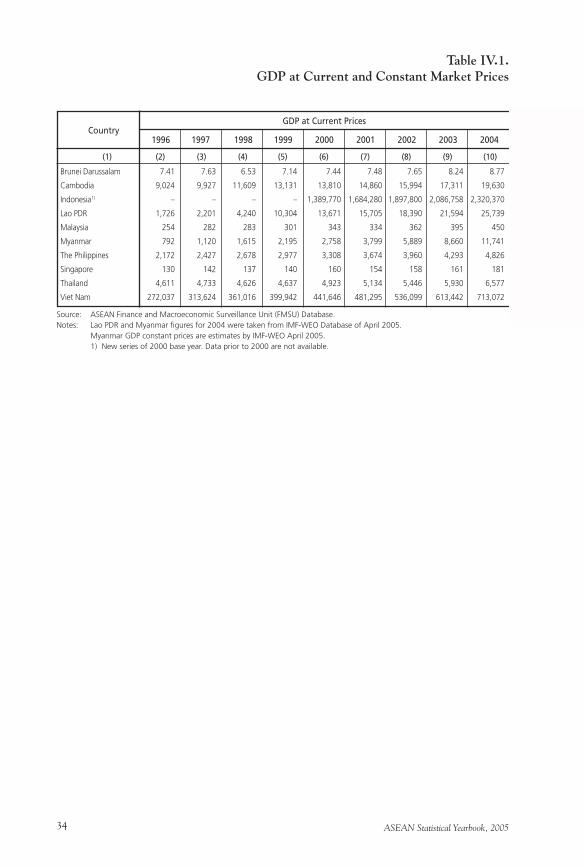
ASEAN Statistical Yearbook, 200534
1996 1997 1998 1999 2000 2001 2002 2003 2004
Table IV.1.GDP at Current and Constant Market Prices
Country
(1) (2) (3) (4) (5) (6) (7) (8) (9) (10)
Source: ASEAN Finance and Macroeconomic Surveillance Unit (FMSU) Database.Notes: Lao PDR and Myanmar figures for 2004 were taken from IMF-WEO Database of April 2005. Myanmar GDP constant prices are estimates by IMF-WEO April 2005. 1) New series of 2000 base year. Data prior to 2000 are not available.
GDP at Current Prices
Brunei Darussalam 7.41 7.63 6.53 7.14 7.44 7.48 7.65 8.24 8.77
Cambodia 9,024 9,927 11,609 13,131 13,810 14,860 15,994 17,311 19,630
Indonesia1) – – – – 1,389,770 1,684,280 1,897,800 2,086,758 2,320,370
Lao PDR 1,726 2,201 4,240 10,304 13,671 15,705 18,390 21,594 25,739
Malaysia 254 282 283 301 343 334 362 395 450
Myanmar 792 1,120 1,615 2,195 2,758 3,799 5,889 8,660 11,741
The Philippines 2,172 2,427 2,678 2,977 3,308 3,674 3,960 4,293 4,826
Singapore 130 142 137 140 160 154 158 161 181
Thailand 4,611 4,733 4,626 4,637 4,923 5,134 5,446 5,930 6,577
Viet Nam 272,037 313,624 361,016 399,942 441,646 481,295 536,099 613,442 713,072
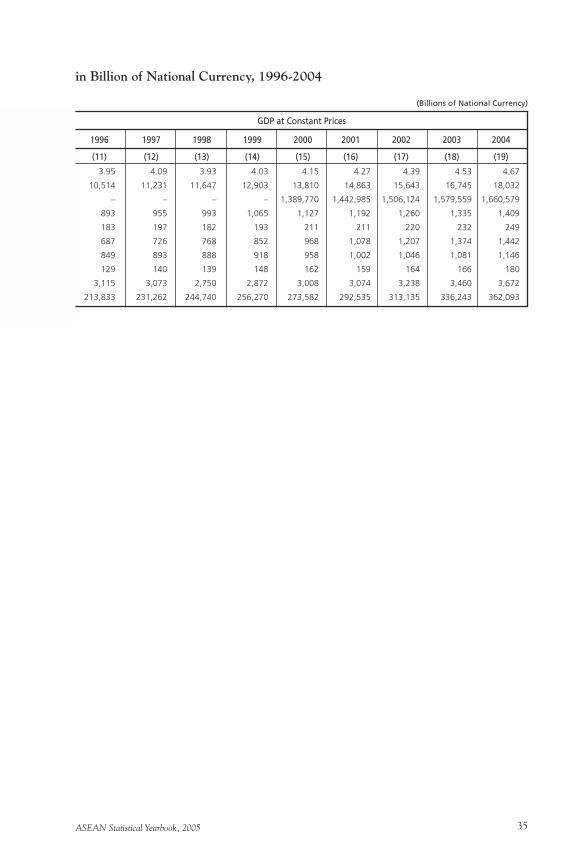
ASEAN Statistical Yearbook, 2005 35
3.95 4.09 3.93 4.03 4.15 4.27 4.39 4.53 4.67
10,514 11,231 11,647 12,903 13,810 14,863 15,643 16,745 18,032
– – – – 1,389,770 1,442,985 1,506,124 1,579,559 1,660,579
893 955 993 1,065 1,127 1,192 1,260 1,335 1,409
183 197 182 193 211 211 220 232 249
687 726 768 852 968 1,078 1,207 1,374 1,442
849 893 888 918 958 1,002 1,046 1,081 1,146
129 140 139 148 162 159 164 166 180
3,115 3,073 2,750 2,872 3,008 3,074 3,238 3,460 3,672
213,833 231,262 244,740 256,270 273,582 292,535 313,135 336,243 362,093
1996 1997 1998 1999 2000 2001 2002 2003 2004
in Billion of National Currency, 1996-2004
(11) (12) (13) (14) (15) (16) (17) (18) (19)
GDP at Constant Prices
(Billions of National Currency)
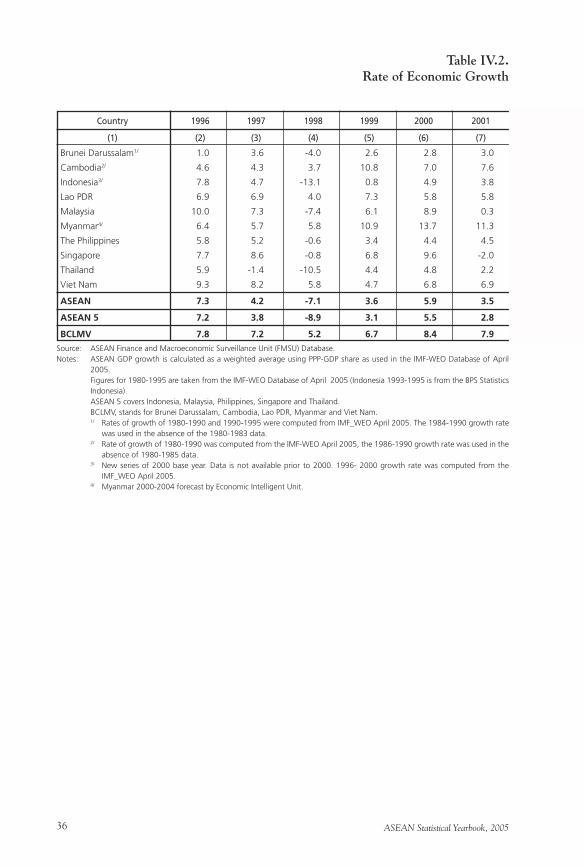
ASEAN Statistical Yearbook, 200536
Table IV.2.Rate of Economic Growth
Country 1996 1997 1998 1999 2000 2001
(1) (2) (3) (4) (5) (6) (7)
Source: ASEAN Finance and Macroeconomic Surveillance Unit (FMSU) Database.Notes: ASEAN GDP growth is calculated as a weighted average using PPP-GDP share as used in the IMF-WEO Database of April
2005. Figures for 1980-1995 are taken from the IMF-WEO Database of April 2005 (Indonesia 1993-1995 is from the BPS Statistics
Indonesia). ASEAN 5 covers Indonesia, Malaysia, Philippines, Singapore and Thailand. BCLMV, stands for Brunei Darussalam, Cambodia, Lao PDR, Myanmar and Viet Nam. 1/ Rates of growth of 1980-1990 and 1990-1995 were computed from IMF_WEO April 2005. The 1984-1990 growth rate
was used in the absence of the 1980-1983 data. 2/ Rate of growth of 1980-1990 was computed from the IMF-WEO April 2005, the 1986-1990 growth rate was used in the
absence of 1980-1985 data. 3/ New series of 2000 base year. Data is not available prior to 2000. 1996- 2000 growth rate was computed from the
IMF_WEO April 2005. 4/ Myanmar 2000-2004 forecast by Economic Intelligent Unit.
Brunei Darussalam1/ 1.0 3.6 -4.0 2.6 2.8 3.0
Cambodia2/ 4.6 4.3 3.7 10.8 7.0 7.6
Indonesia3/ 7.8 4.7 -13.1 0.8 4.9 3.8
Lao PDR 6.9 6.9 4.0 7.3 5.8 5.8
Malaysia 10.0 7.3 -7.4 6.1 8.9 0.3
Myanmar4/ 6.4 5.7 5.8 10.9 13.7 11.3
The Philippines 5.8 5.2 -0.6 3.4 4.4 4.5
Singapore 7.7 8.6 -0.8 6.8 9.6 -2.0
Thailand 5.9 -1.4 -10.5 4.4 4.8 2.2
Viet Nam 9.3 8.2 5.8 4.7 6.8 6.9
ASEAN 7.3 4.2 -7.1 3.6 5.9 3.5
ASEAN 5 7.2 3.8 -8.9 3.1 5.5 2.8
BCLMV 7.8 7.2 5.2 6.7 8.4 7.9
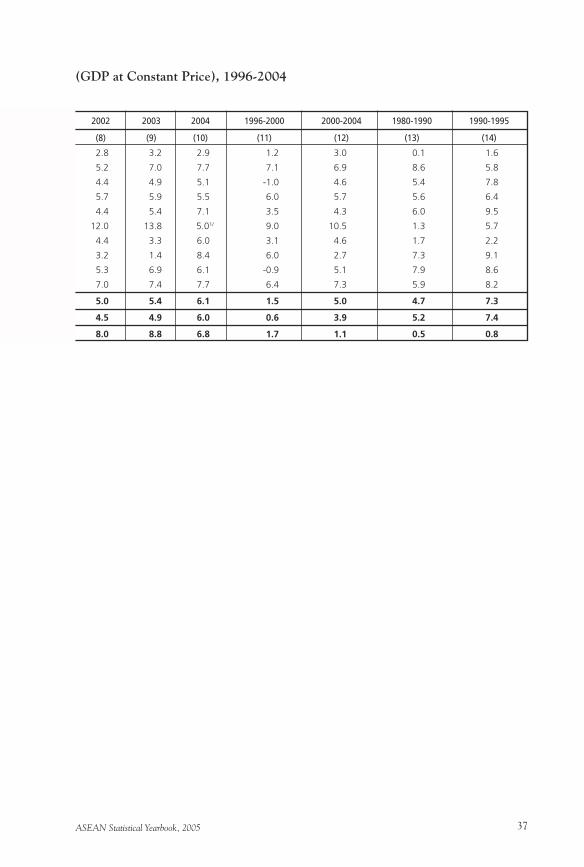
ASEAN Statistical Yearbook, 2005 37
(GDP at Constant Price), 1996-2004
2002 2003 2004 1996-2000 2000-2004 1980-1990 1990-1995
(8) (9) (10) (11) (12) (13) (14)
2.8 3.2 2.9 1.2 3.0 0.1 1.6
5.2 7.0 7.7 7.1 6.9 8.6 5.8
4.4 4.9 5.1 -1.0 4.6 5.4 7.8
5.7 5.9 5.5 6.0 5.7 5.6 6.4
4.4 5.4 7.1 3.5 4.3 6.0 9.5
12.0 13.8 5.01/ 9.0 10.5 1.3 5.7
4.4 3.3 6.0 3.1 4.6 1.7 2.2
3.2 1.4 8.4 6.0 2.7 7.3 9.1
5.3 6.9 6.1 -0.9 5.1 7.9 8.6
7.0 7.4 7.7 6.4 7.3 5.9 8.2
5.0 5.4 6.1 1.5 5.0 4.7 7.3
4.5 4.9 6.0 0.6 3.9 5.2 7.4
8.0 8.8 6.8 1.7 1.1 0.5 0.8
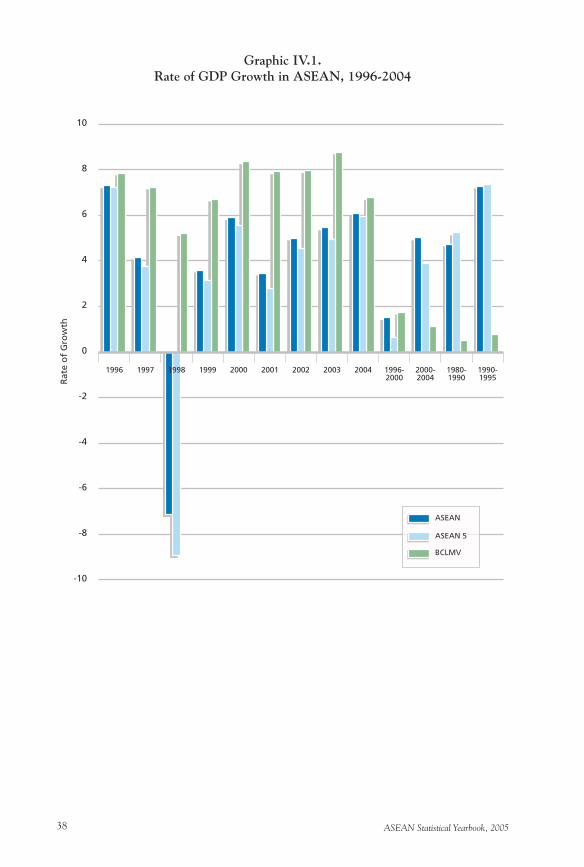
ASEAN Statistical Yearbook, 200538
Graphic IV.1.Rate of GDP Growth in ASEAN, 1996-2004
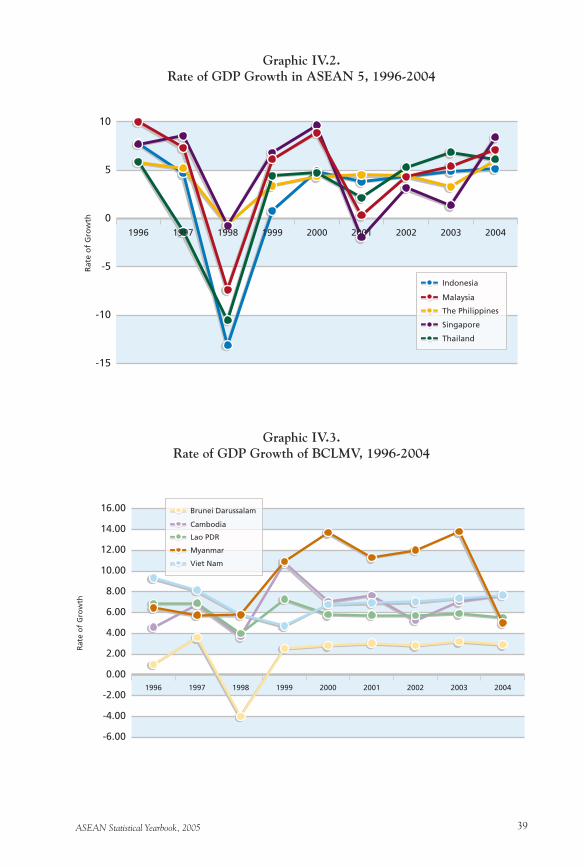
ASEAN Statistical Yearbook, 2005 39
Graphic IV.2.Rate of GDP Growth in ASEAN 5, 1996-2004
Graphic IV.3.Rate of GDP Growth of BCLMV, 1996-2004
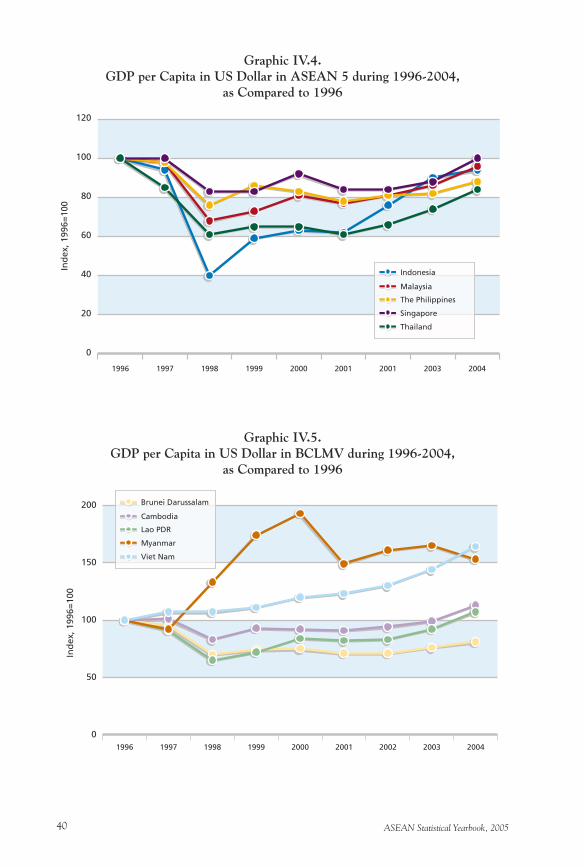
ASEAN Statistical Yearbook, 200540
Graphic IV.4.GDP per Capita in US Dollar in ASEAN 5 during 1996-2004,
as Compared to 1996
Graphic IV.5.GDP per Capita in US Dollar in BCLMV during 1996-2004,
as Compared to 1996
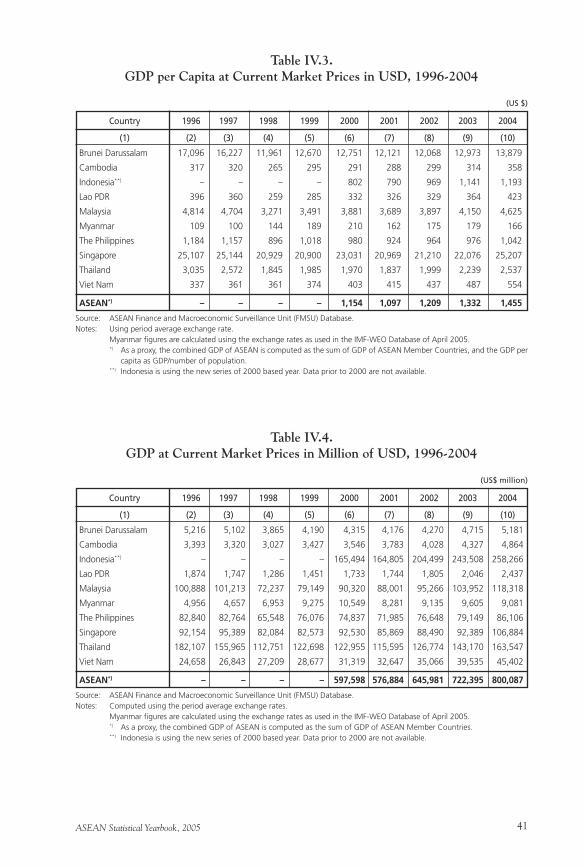
ASEAN Statistical Yearbook, 2005 41
Brunei Darussalam 17,096 16,227 11,961 12,670 12,751 12,121 12,068 12,973 13,879
Cambodia 317 320 265 295 291 288 299 314 358
Indonesia**) – – – – 802 790 969 1,141 1,193
Lao PDR 396 360 259 285 332 326 329 364 423
Malaysia 4,814 4,704 3,271 3,491 3,881 3,689 3,897 4,150 4,625
Myanmar 109 100 144 189 210 162 175 179 166
The Philippines 1,184 1,157 896 1,018 980 924 964 976 1,042
Singapore 25,107 25,144 20,929 20,900 23,031 20,969 21,210 22,076 25,207
Thailand 3,035 2,572 1,845 1,985 1,970 1,837 1,999 2,239 2,537
Viet Nam 337 361 361 374 403 415 437 487 554
ASEAN*) – – – – 1,154 1,097 1,209 1,332 1,455
Table IV.3.GDP per Capita at Current Market Prices in USD, 1996-2004
Country 1996 1997 1998 1999 2000 2001 2002 2003 2004
(1) (2) (3) (4) (5) (6) (7) (8) (9) (10)
Source: ASEAN Finance and Macroeconomic Surveillance Unit (FMSU) Database.Notes: Using period average exchange rate. Myanmar figures are calculated using the exchange rates as used in the IMF-WEO Database of April 2005. *) As a proxy, the combined GDP of ASEAN is computed as the sum of GDP of ASEAN Member Countries, and the GDP per
capita as GDP/number of population. **) Indonesia is using the new series of 2000 based year. Data prior to 2000 are not available.
(US $)
Table IV.4.GDP at Current Market Prices in Million of USD, 1996-2004
Country 1996 1997 1998 1999 2000 2001 2002 2003 2004
(1) (2) (3) (4) (5) (6) (7) (8) (9) (10)
Source: ASEAN Finance and Macroeconomic Surveillance Unit (FMSU) Database.Notes: Computed using the period average exchange rates. Myanmar figures are calculated using the exchange rates as used in the IMF-WEO Database of April 2005. *) As a proxy, the combined GDP of ASEAN is computed as the sum of GDP of ASEAN Member Countries. **) Indonesia is using the new series of 2000 based year. Data prior to 2000 are not available.
(US$ million)
Brunei Darussalam 5,216 5,102 3,865 4,190 4,315 4,176 4,270 4,715 5,181
Cambodia 3,393 3,320 3,027 3,427 3,546 3,783 4,028 4,327 4,864
Indonesia**) – – – – 165,494 164,805 204,499 243,508 258,266
Lao PDR 1,874 1,747 1,286 1,451 1,733 1,744 1,805 2,046 2,437
Malaysia 100,888 101,213 72,237 79,149 90,320 88,001 95,266 103,952 118,318
Myanmar 4,956 4,657 6,953 9,275 10,549 8,281 9,135 9,605 9,081
The Philippines 82,840 82,764 65,548 76,076 74,837 71,985 76,648 79,149 86,106
Singapore 92,154 95,389 82,084 82,573 92,530 85,869 88,490 92,389 106,884
Thailand 182,107 155,965 112,751 122,698 122,955 115,595 126,774 143,170 163,547
Viet Nam 24,658 26,843 27,209 28,677 31,319 32,647 35,066 39,535 45,402
ASEAN*) – – – – 597,598 576,884 645,981 722,395 800,087
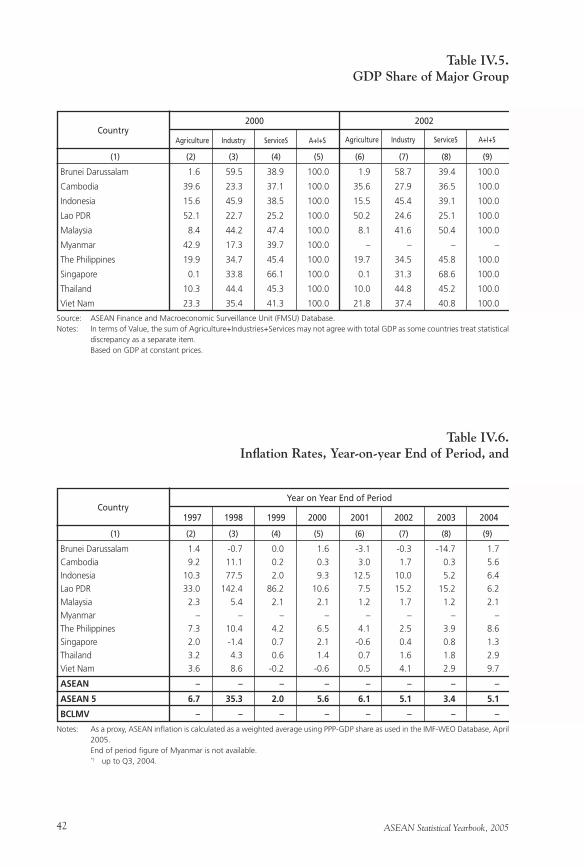
ASEAN Statistical Yearbook, 200542
Agriculture Industry ServiceS A+I+S
Table IV.5.GDP Share of Major Group
Country
(1) (2) (3) (4) (5) (6) (7) (8) (9)
Source: ASEAN Finance and Macroeconomic Surveillance Unit (FMSU) Database.Notes: In terms of Value, the sum of Agriculture+Industries+Services may not agree with total GDP as some countries treat statistical
discrepancy as a separate item. Based on GDP at constant prices.
2000
Agriculture Industry ServiceS A+I+S
2002
Brunei Darussalam 1.6 59.5 38.9 100.0 1.9 58.7 39.4 100.0
Cambodia 39.6 23.3 37.1 100.0 35.6 27.9 36.5 100.0
Indonesia 15.6 45.9 38.5 100.0 15.5 45.4 39.1 100.0
Lao PDR 52.1 22.7 25.2 100.0 50.2 24.6 25.1 100.0
Malaysia 8.4 44.2 47.4 100.0 8.1 41.6 50.4 100.0
Myanmar 42.9 17.3 39.7 100.0 – – – –
The Philippines 19.9 34.7 45.4 100.0 19.7 34.5 45.8 100.0
Singapore 0.1 33.8 66.1 100.0 0.1 31.3 68.6 100.0
Thailand 10.3 44.4 45.3 100.0 10.0 44.8 45.2 100.0
Viet Nam 23.3 35.4 41.3 100.0 21.8 37.4 40.8 100.0
1997 1998 1999 2000 2001 2002 2003 2004
Table IV.6.Inflation Rates, Year-on-year End of Period, and
Country
(1) (2) (3) (4) (5) (6) (7) (8) (9)
Notes: As a proxy, ASEAN inflation is calculated as a weighted average using PPP-GDP share as used in the IMF-WEO Database, April 2005.
End of period figure of Myanmar is not available. *) up to Q3, 2004.
Year on Year End of Period
Brunei Darussalam 1.4 -0.7 0.0 1.6 -3.1 -0.3 -14.7 1.7
Cambodia 9.2 11.1 0.2 0.3 3.0 1.7 0.3 5.6
Indonesia 10.3 77.5 2.0 9.3 12.5 10.0 5.2 6.4
Lao PDR 33.0 142.4 86.2 10.6 7.5 15.2 15.2 6.2
Malaysia 2.3 5.4 2.1 2.1 1.2 1.7 1.2 2.1
Myanmar – – – – – – – –
The Philippines 7.3 10.4 4.2 6.5 4.1 2.5 3.9 8.6
Singapore 2.0 -1.4 0.7 2.1 -0.6 0.4 0.8 1.3
Thailand 3.2 4.3 0.6 1.4 0.7 1.6 1.8 2.9
Viet Nam 3.6 8.6 -0.2 -0.6 0.5 4.1 2.9 9.7
ASEAN – – – – – – – –
ASEAN 5 6.7 35.3 2.0 5.6 6.1 5.1 3.4 5.1
BCLMV – – – – – – – –
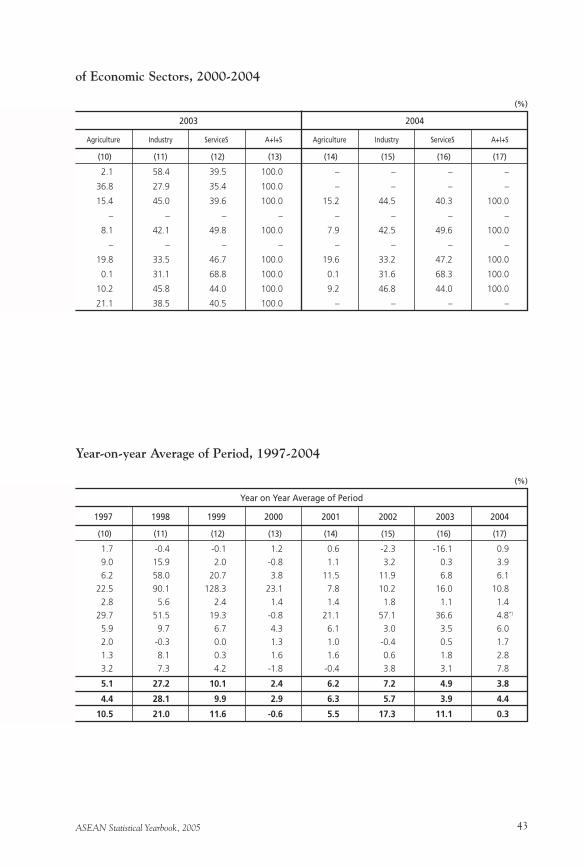
ASEAN Statistical Yearbook, 2005 43
2.1 58.4 39.5 100.0 – – – –
36.8 27.9 35.4 100.0 – – – –
15.4 45.0 39.6 100.0 15.2 44.5 40.3 100.0
– – – – – – – –
8.1 42.1 49.8 100.0 7.9 42.5 49.6 100.0
– – – – – – – –
19.8 33.5 46.7 100.0 19.6 33.2 47.2 100.0
0.1 31.1 68.8 100.0 0.1 31.6 68.3 100.0
10.2 45.8 44.0 100.0 9.2 46.8 44.0 100.0
21.1 38.5 40.5 100.0 – – – –
of Economic Sectors, 2000-2004
(10) (11) (12) (13) (14) (15) (16) (17)
2003
(%)
Agriculture Industry ServiceS A+I+S
2004
Agriculture Industry ServiceS A+I+S
1.7 -0.4 -0.1 1.2 0.6 -2.3 -16.1 0.9
9.0 15.9 2.0 -0.8 1.1 3.2 0.3 3.9
6.2 58.0 20.7 3.8 11.5 11.9 6.8 6.1
22.5 90.1 128.3 23.1 7.8 10.2 16.0 10.8
2.8 5.6 2.4 1.4 1.4 1.8 1.1 1.4
29.7 51.5 19.3 -0.8 21.1 57.1 36.6 4.8*)
5.9 9.7 6.7 4.3 6.1 3.0 3.5 6.0
2.0 -0.3 0.0 1.3 1.0 -0.4 0.5 1.7
1.3 8.1 0.3 1.6 1.6 0.6 1.8 2.8
3.2 7.3 4.2 -1.8 -0.4 3.8 3.1 7.8
5.1 27.2 10.1 2.4 6.2 7.2 4.9 3.8
4.4 28.1 9.9 2.9 6.3 5.7 3.9 4.4
10.5 21.0 11.6 -0.6 5.5 17.3 11.1 0.3
Year-on-year Average of Period, 1997-2004
(10) (11) (12) (13) (14) (15) (16) (17)
Year on Year Average of Period
(%)
1997 1998 1999 2000 2001 2002 2003 2004
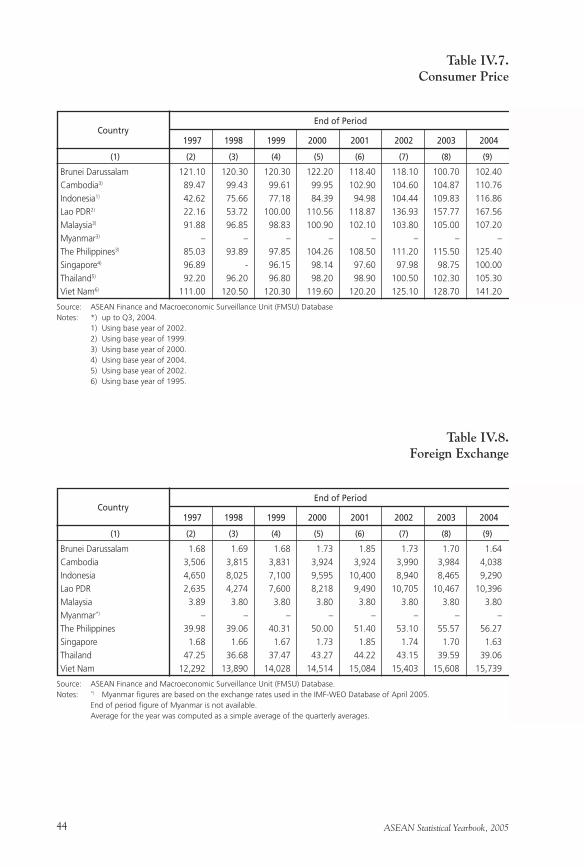
ASEAN Statistical Yearbook, 200544
Table IV.8.Foreign Exchange
1997 1998 1999 2000 2001 2002 2003 2004
Table IV.7.Consumer Price
Country
(1) (2) (3) (4) (5) (6) (7) (8) (9)
Source: ASEAN Finance and Macroeconomic Surveillance Unit (FMSU) Database Notes: *) up to Q3, 2004. 1) Using base year of 2002. 2) Using base year of 1999. 3) Using base year of 2000. 4) Using base year of 2004. 5) Using base year of 2002. 6) Using base year of 1995.
End of Period
Brunei Darussalam 121.10 120.30 120.30 122.20 118.40 118.10 100.70 102.40
Cambodia3) 89.47 99.43 99.61 99.95 102.90 104.60 104.87 110.76
Indonesia1) 42.62 75.66 77.18 84.39 94.98 104.44 109.83 116.86
Lao PDR2) 22.16 53.72 100.00 110.56 118.87 136.93 157.77 167.56
Malaysia3) 91.88 96.85 98.83 100.90 102.10 103.80 105.00 107.20
Myanmar3) – – – – – – – –
The Philippines3) 85.03 93.89 97.85 104.26 108.50 111.20 115.50 125.40
Singapore4) 96.89 - 96.15 98.14 97.60 97.98 98.75 100.00
Thailand5) 92.20 96.20 96.80 98.20 98.90 100.50 102.30 105.30
Viet Nam6) 111.00 120.50 120.30 119.60 120.20 125.10 128.70 141.20
1997 1998 1999 2000 2001 2002 2003 2004Country
(1) (2) (3) (4) (5) (6) (7) (8) (9)
Source: ASEAN Finance and Macroeconomic Surveillance Unit (FMSU) Database.Notes: *) Myanmar figures are based on the exchange rates used in the IMF-WEO Database of April 2005. End of period figure of Myanmar is not available. Average for the year was computed as a simple average of the quarterly averages.
End of Period
Brunei Darussalam 1.68 1.69 1.68 1.73 1.85 1.73 1.70 1.64
Cambodia 3,506 3,815 3,831 3,924 3,924 3,990 3,984 4,038
Indonesia 4,650 8,025 7,100 9,595 10,400 8,940 8,465 9,290
Lao PDR 2,635 4,274 7,600 8,218 9,490 10,705 10,467 10,396
Malaysia 3.89 3.80 3.80 3.80 3.80 3.80 3.80 3.80
Myanmar*) – – – – – – – –
The Philippines 39.98 39.06 40.31 50.00 51.40 53.10 55.57 56.27
Singapore 1.68 1.66 1.67 1.73 1.85 1.74 1.70 1.63
Thailand 47.25 36.68 37.47 43.27 44.22 43.15 39.59 39.06
Viet Nam 12,292 13,890 14,028 14,514 15,084 15,403 15,608 15,739
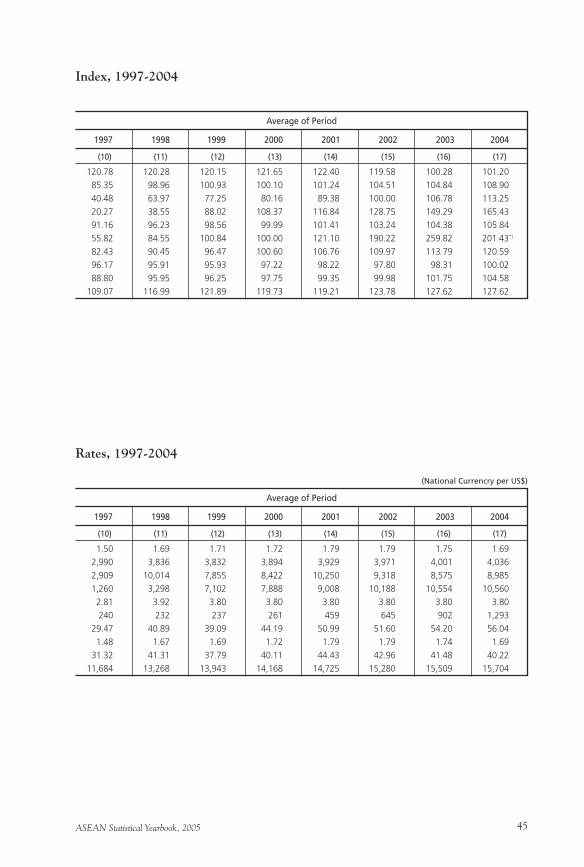
ASEAN Statistical Yearbook, 2005 45
Rates, 1997-2004
(National Currencry per US$)
120.78 120.28 120.15 121.65 122.40 119.58 100.28 101.20
85.35 98.96 100.93 100.10 101.24 104.51 104.84 108.90
40.48 63.97 77.25 80.16 89.38 100.00 106.78 113.25
20.27 38.55 88.02 108.37 116.84 128.75 149.29 165.43
91.16 96.23 98.56 99.99 101.41 103.24 104.38 105.84
55.82 84.55 100.84 100.00 121.10 190.22 259.82 201.43*)
82.43 90.45 96.47 100.60 106.76 109.97 113.79 120.59
96.17 95.91 95.93 97.22 98.22 97.80 98.31 100.02
88.80 95.95 96.25 97.75 99.35 99.98 101.75 104.58
109.07 116.99 121.89 119.73 119.21 123.78 127.62 127.62
Index, 1997-2004
(10) (11) (12) (13) (14) (15) (16) (17)
Average of Period
1997 1998 1999 2000 2001 2002 2003 2004
1.50 1.69 1.71 1.72 1.79 1.79 1.75 1.69
2,990 3,836 3,832 3,894 3,929 3,971 4,001 4,036
2,909 10,014 7,855 8,422 10,250 9,318 8,575 8,985
1,260 3,298 7,102 7,888 9,008 10,188 10,554 10,560
2.81 3.92 3.80 3.80 3.80 3.80 3.80 3.80
240 232 237 261 459 645 902 1,293
29.47 40.89 39.09 44.19 50.99 51.60 54.20 56.04
1.48 1.67 1.69 1.72 1.79 1.79 1.74 1.69
31.32 41.31 37.79 40.11 44.43 42.96 41.48 40.22
11,684 13,268 13,943 14,168 14,725 15,280 15,509 15,704
(10) (11) (12) (13) (14) (15) (16) (17)
Average of Period
1997 1998 1999 2000 2001 2002 2003 2004
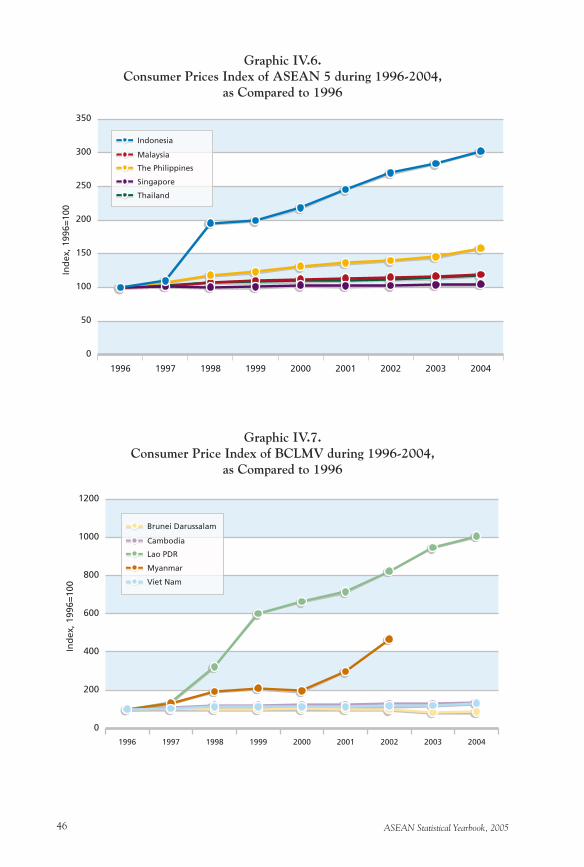
ASEAN Statistical Yearbook, 200546
Graphic IV.6.Consumer Prices Index of ASEAN 5 during 1996-2004,
as Compared to 1996
Graphic IV.7.Consumer Price Index of BCLMV during 1996-2004,
as Compared to 1996
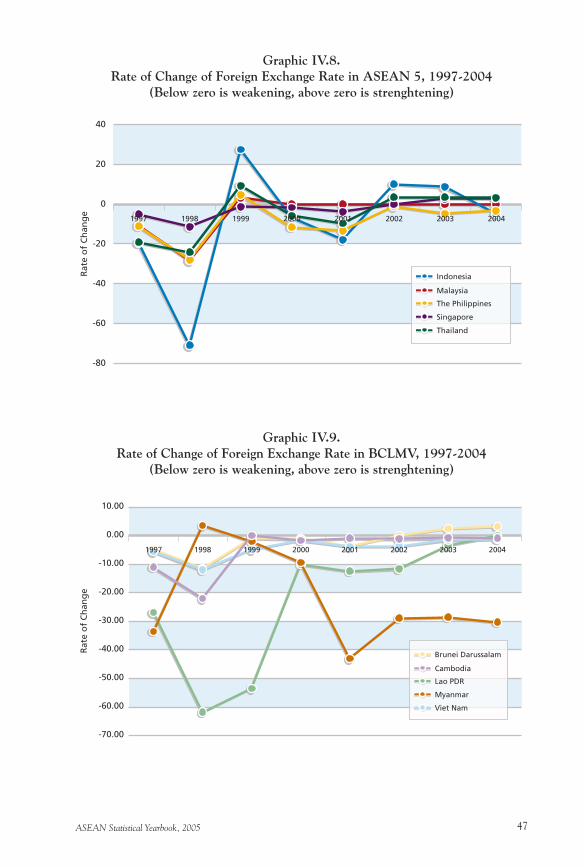
ASEAN Statistical Yearbook, 2005 47
Graphic IV.8.Rate of Change of Foreign Exchange Rate in ASEAN 5, 1997-2004
(Below zero is weakening, above zero is strenghtening)
Graphic IV.9.Rate of Change of Foreign Exchange Rate in BCLMV, 1997-2004
(Below zero is weakening, above zero is strenghtening)
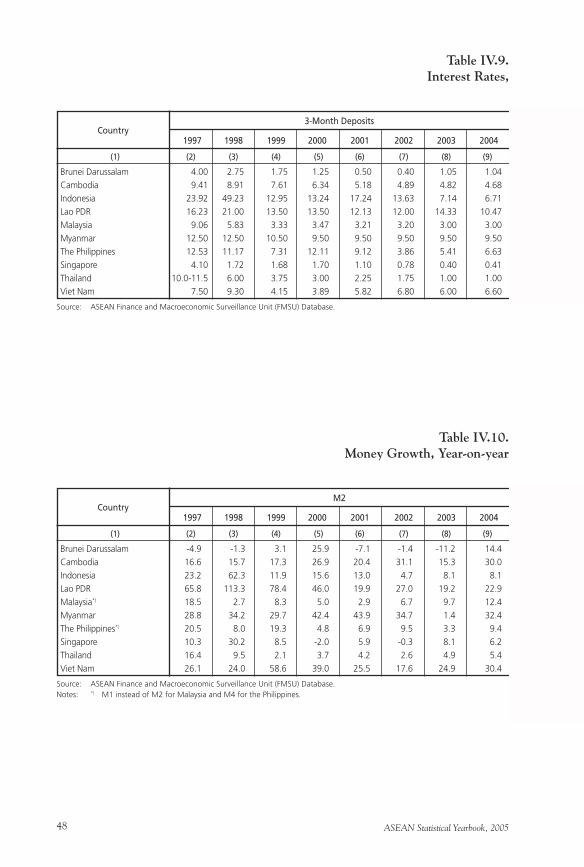
ASEAN Statistical Yearbook, 200548
Table IV.10.Money Growth, Year-on-year
1997 1998 1999 2000 2001 2002 2003 2004
Table IV.9.Interest Rates,
Country
(1) (2) (3) (4) (5) (6) (7) (8) (9)
Source: ASEAN Finance and Macroeconomic Surveillance Unit (FMSU) Database.
3-Month Deposits
Brunei Darussalam 4.00 2.75 1.75 1.25 0.50 0.40 1.05 1.04
Cambodia 9.41 8.91 7.61 6.34 5.18 4.89 4.82 4.68
Indonesia 23.92 49.23 12.95 13.24 17.24 13.63 7.14 6.71
Lao PDR 16.23 21.00 13.50 13.50 12.13 12.00 14.33 10.47
Malaysia 9.06 5.83 3.33 3.47 3.21 3.20 3.00 3.00
Myanmar 12.50 12.50 10.50 9.50 9.50 9.50 9.50 9.50
The Philippines 12.53 11.17 7.31 12.11 9.12 3.86 5.41 6.63
Singapore 4.10 1.72 1.68 1.70 1.10 0.78 0.40 0.41
Thailand 10.0-11.5 6.00 3.75 3.00 2.25 1.75 1.00 1.00
Viet Nam 7.50 9.30 4.15 3.89 5.82 6.80 6.00 6.60
1997 1998 1999 2000 2001 2002 2003 2004Country
(1) (2) (3) (4) (5) (6) (7) (8) (9)
Source: ASEAN Finance and Macroeconomic Surveillance Unit (FMSU) Database.Notes: *) M1 instead of M2 for Malaysia and M4 for the Philippines.
M2
Brunei Darussalam -4.9 -1.3 3.1 25.9 -7.1 -1.4 -11.2 14.4
Cambodia 16.6 15.7 17.3 26.9 20.4 31.1 15.3 30.0
Indonesia 23.2 62.3 11.9 15.6 13.0 4.7 8.1 8.1
Lao PDR 65.8 113.3 78.4 46.0 19.9 27.0 19.2 22.9
Malaysia*) 18.5 2.7 8.3 5.0 2.9 6.7 9.7 12.4
Myanmar 28.8 34.2 29.7 42.4 43.9 34.7 1.4 32.4
The Philippines*) 20.5 8.0 19.3 4.8 6.9 9.5 3.3 9.4
Singapore 10.3 30.2 8.5 -2.0 5.9 -0.3 8.1 6.2
Thailand 16.4 9.5 2.1 3.7 4.2 2.6 4.9 5.4
Viet Nam 26.1 24.0 58.6 39.0 25.5 17.6 24.9 30.4
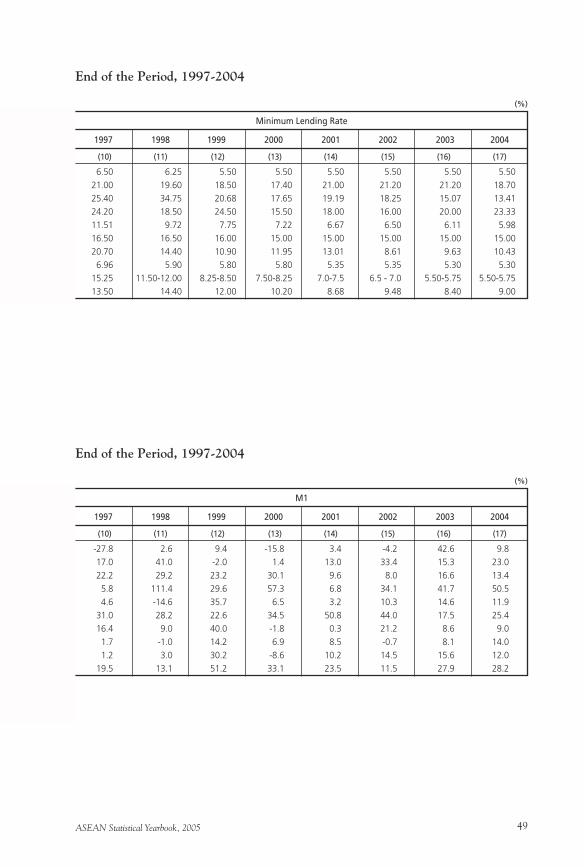
ASEAN Statistical Yearbook, 2005 49
End of the Period, 1997-2004
(%)
6.50 6.25 5.50 5.50 5.50 5.50 5.50 5.50
21.00 19.60 18.50 17.40 21.00 21.20 21.20 18.70
25.40 34.75 20.68 17.65 19.19 18.25 15.07 13.41
24.20 18.50 24.50 15.50 18.00 16.00 20.00 23.33
11.51 9.72 7.75 7.22 6.67 6.50 6.11 5.98
16.50 16.50 16.00 15.00 15.00 15.00 15.00 15.00
20.70 14.40 10.90 11.95 13.01 8.61 9.63 10.43
6.96 5.90 5.80 5.80 5.35 5.35 5.30 5.30
15.25 11.50-12.00 8.25-8.50 7.50-8.25 7.0-7.5 6.5 - 7.0 5.50-5.75 5.50-5.75
13.50 14.40 12.00 10.20 8.68 9.48 8.40 9.00
End of the Period, 1997-2004
(10) (11) (12) (13) (14) (15) (16) (17)
Minimum Lending Rate
1997 1998 1999 2000 2001 2002 2003 2004
-27.8 2.6 9.4 -15.8 3.4 -4.2 42.6 9.8
17.0 41.0 -2.0 1.4 13.0 33.4 15.3 23.0
22.2 29.2 23.2 30.1 9.6 8.0 16.6 13.4
5.8 111.4 29.6 57.3 6.8 34.1 41.7 50.5
4.6 -14.6 35.7 6.5 3.2 10.3 14.6 11.9
31.0 28.2 22.6 34.5 50.8 44.0 17.5 25.4
16.4 9.0 40.0 -1.8 0.3 21.2 8.6 9.0
1.7 -1.0 14.2 6.9 8.5 -0.7 8.1 14.0
1.2 3.0 30.2 -8.6 10.2 14.5 15.6 12.0
19.5 13.1 51.2 33.1 23.5 11.5 27.9 28.2
(10) (11) (12) (13) (14) (15) (16) (17)
M1
1997 1998 1999 2000 2001 2002 2003 2004
(%)
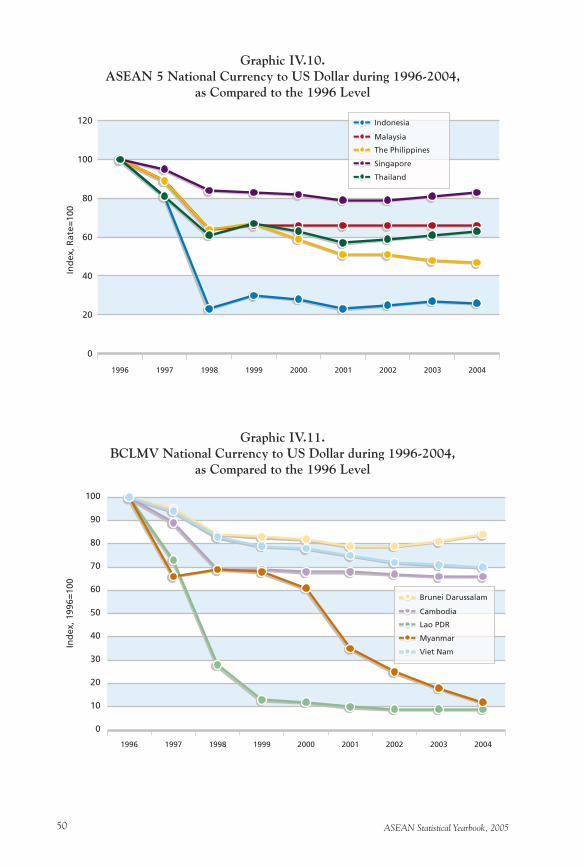
ASEAN Statistical Yearbook, 200550
Graphic IV.10.ASEAN 5 National Currency to US Dollar during 1996-2004,
as Compared to the 1996 Level
Graphic IV.11.BCLMV National Currency to US Dollar during 1996-2004,
as Compared to the 1996 Level
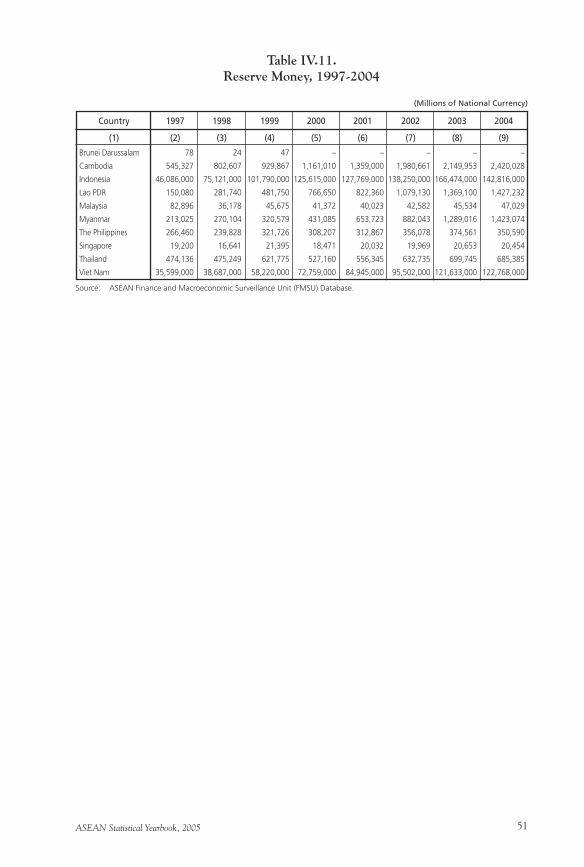
ASEAN Statistical Yearbook, 2005 51
Brunei Darussalam 78 24 47 – – – – –
Cambodia 545,327 802,607 929,867 1,161,010 1,359,000 1,980,661 2,149,953 2,420,028
Indonesia 46,086,000 75,121,000 101,790,000 125,615,000 127,769,000 138,250,000 166,474,000 142,816,000
Lao PDR 150,080 281,740 481,750 766,650 822,360 1,079,130 1,369,100 1,427,232
Malaysia 82,896 36,178 45,675 41,372 40,023 42,582 45,534 47,029
Myanmar 213,025 270,104 320,579 431,085 653,723 882,043 1,289,016 1,423,074
The Philippines 266,460 239,828 321,726 308,207 312,867 356,078 374,561 350,590
Singapore 19,200 16,641 21,395 18,471 20,032 19,969 20,653 20,454
Thailand 474,136 475,249 621,775 527,160 556,345 632,735 699,745 685,385
Viet Nam 35,599,000 38,687,000 58,220,000 72,759,000 84,945,000 95,502,000 121,633,000 122,768,000
Table IV.11.Reserve Money, 1997-2004
Country 1997 1998 1999 2000 2001 2002 2003 2004
(1) (2) (3) (4) (5) (6) (7) (8) (9)
Source: ASEAN Finance and Macroeconomic Surveillance Unit (FMSU) Database.
(Millions of National Currency)
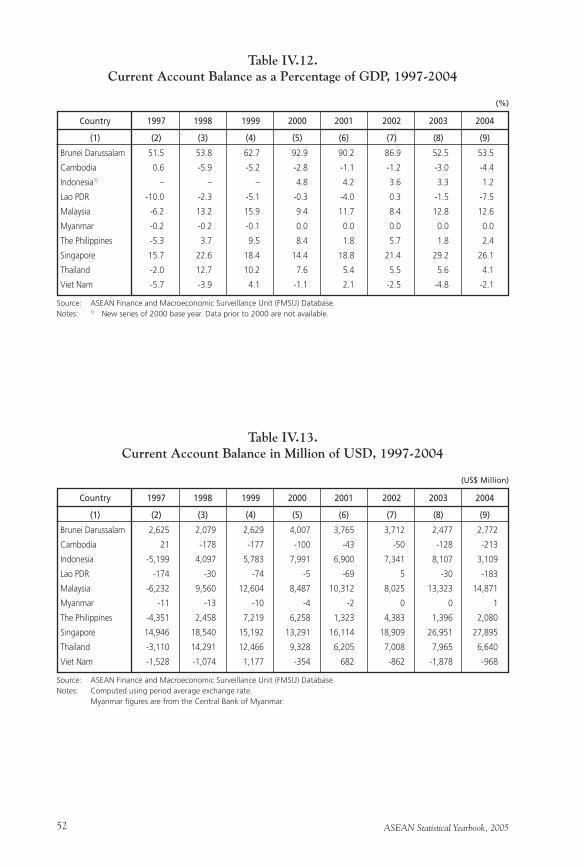
ASEAN Statistical Yearbook, 200552
Table IV.12.Current Account Balance as a Percentage of GDP, 1997-2004
Country 1997 1998 1999 2000 2001 2002 2003 2004
(1) (2) (3) (4) (5) (6) (7) (8) (9)
Source: ASEAN Finance and Macroeconomic Surveillance Unit (FMSU) Database.Notes: 1) New series of 2000 base year. Data prior to 2000 are not available.
(%)
Brunei Darussalam 51.5 53.8 62.7 92.9 90.2 86.9 52.5 53.5
Cambodia 0.6 -5.9 -5.2 -2.8 -1.1 -1.2 -3.0 -4.4
Indonesia1) – – – 4.8 4.2 3.6 3.3 1.2
Lao PDR -10.0 -2.3 -5.1 -0.3 -4.0 0.3 -1.5 -7.5
Malaysia -6.2 13.2 15.9 9.4 11.7 8.4 12.8 12.6
Myanmar -0.2 -0.2 -0.1 0.0 0.0 0.0 0.0 0.0
The Philippines -5.3 3.7 9.5 8.4 1.8 5.7 1.8 2.4
Singapore 15.7 22.6 18.4 14.4 18.8 21.4 29.2 26.1
Thailand -2.0 12.7 10.2 7.6 5.4 5.5 5.6 4.1
Viet Nam -5.7 -3.9 4.1 -1.1 2.1 -2.5 -4.8 -2.1
Table IV.13.Current Account Balance in Million of USD, 1997-2004
Country 1997 1998 1999 2000 2001 2002 2003 2004
(1) (2) (3) (4) (5) (6) (7) (8) (9)
Source: ASEAN Finance and Macroeconomic Surveillance Unit (FMSU) Database.Notes: Computed using period average exchange rate. Myanmar figures are from the Central Bank of Myanmar.
(US$ Million)
Brunei Darussalam 2,625 2,079 2,629 4,007 3,765 3,712 2,477 2,772
Cambodia 21 -178 -177 -100 -43 -50 -128 -213
Indonesia -5,199 4,097 5,783 7,991 6,900 7,341 8,107 3,109
Lao PDR -174 -30 -74 -5 -69 5 -30 -183
Malaysia -6,232 9,560 12,604 8,487 10,312 8,025 13,323 14,871
Myanmar -11 -13 -10 -4 -2 0 0 1
The Philippines -4,351 2,458 7,219 6,258 1,323 4,383 1,396 2,080
Singapore 14,946 18,540 15,192 13,291 16,114 18,909 26,951 27,895
Thailand -3,110 14,291 12,466 9,328 6,205 7,008 7,965 6,640
Viet Nam -1,528 -1,074 1,177 -354 682 -862 -1,878 -968
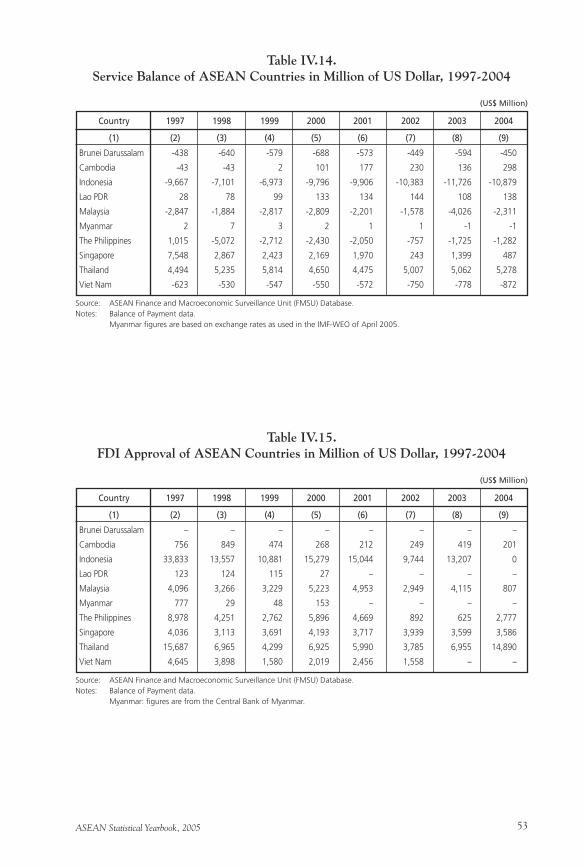
ASEAN Statistical Yearbook, 2005 53
Table IV.14.Service Balance of ASEAN Countries in Million of US Dollar, 1997-2004
Country 1997 1998 1999 2000 2001 2002 2003 2004
(1) (2) (3) (4) (5) (6) (7) (8) (9)
Source: ASEAN Finance and Macroeconomic Surveillance Unit (FMSU) Database.Notes: Balance of Payment data. Myanmar figures are based on exchange rates as used in the IMF-WEO of April 2005.
(US$ Million)
Brunei Darussalam -438 -640 -579 -688 -573 -449 -594 -450
Cambodia -43 -43 2 101 177 230 136 298
Indonesia -9,667 -7,101 -6,973 -9,796 -9,906 -10,383 -11,726 -10,879
Lao PDR 28 78 99 133 134 144 108 138
Malaysia -2,847 -1,884 -2,817 -2,809 -2,201 -1,578 -4,026 -2,311
Myanmar 2 7 3 2 1 1 -1 -1
The Philippines 1,015 -5,072 -2,712 -2,430 -2,050 -757 -1,725 -1,282
Singapore 7,548 2,867 2,423 2,169 1,970 243 1,399 487
Thailand 4,494 5,235 5,814 4,650 4,475 5,007 5,062 5,278
Viet Nam -623 -530 -547 -550 -572 -750 -778 -872
Table IV.15.FDI Approval of ASEAN Countries in Million of US Dollar, 1997-2004
Country 1997 1998 1999 2000 2001 2002 2003 2004
(1) (2) (3) (4) (5) (6) (7) (8) (9)
Source: ASEAN Finance and Macroeconomic Surveillance Unit (FMSU) Database.Notes: Balance of Payment data. Myanmar: figures are from the Central Bank of Myanmar.
(US$ Million)
Brunei Darussalam – – – – – – – –
Cambodia 756 849 474 268 212 249 419 201
Indonesia 33,833 13,557 10,881 15,279 15,044 9,744 13,207 0
Lao PDR 123 124 115 27 – – – –
Malaysia 4,096 3,266 3,229 5,223 4,953 2,949 4,115 807
Myanmar 777 29 48 153 – – – –
The Philippines 8,978 4,251 2,762 5,896 4,669 892 625 2,777
Singapore 4,036 3,113 3,691 4,193 3,717 3,939 3,599 3,586
Thailand 15,687 6,965 4,299 6,925 5,990 3,785 6,955 14,890
Viet Nam 4,645 3,898 1,580 2,019 2,456 1,558 – –
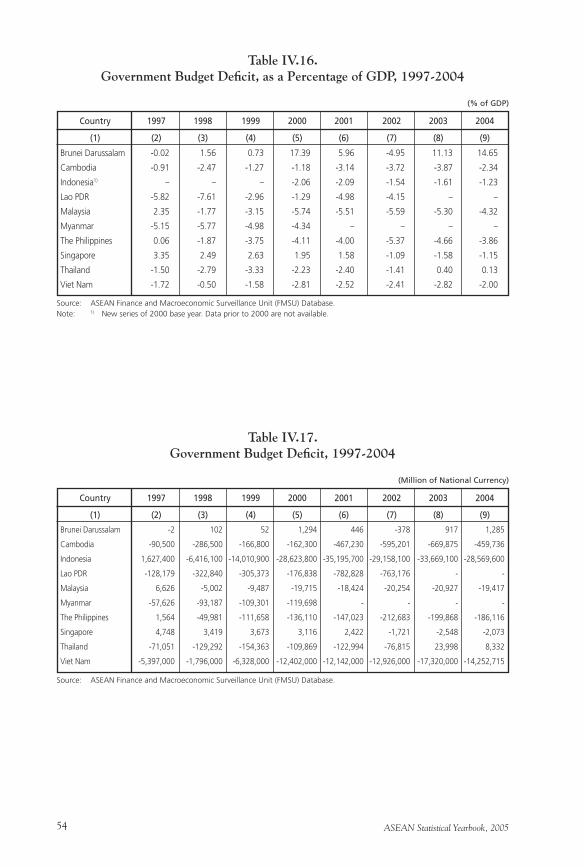
ASEAN Statistical Yearbook, 200554
Table IV.16.Government Budget Deficit, as a Percentage of GDP, 1997-2004
Country 1997 1998 1999 2000 2001 2002 2003 2004
(1) (2) (3) (4) (5) (6) (7) (8) (9)
Source: ASEAN Finance and Macroeconomic Surveillance Unit (FMSU) Database.Note: 1) New series of 2000 base year. Data prior to 2000 are not available.
(% of GDP)
Brunei Darussalam -0.02 1.56 0.73 17.39 5.96 -4.95 11.13 14.65
Cambodia -0.91 -2.47 -1.27 -1.18 -3.14 -3.72 -3.87 -2.34
Indonesia1) – – – -2.06 -2.09 -1.54 -1.61 -1.23
Lao PDR -5.82 -7.61 -2.96 -1.29 -4.98 -4.15 – –
Malaysia 2.35 -1.77 -3.15 -5.74 -5.51 -5.59 -5.30 -4.32
Myanmar -5.15 -5.77 -4.98 -4.34 – – – –
The Philippines 0.06 -1.87 -3.75 -4.11 -4.00 -5.37 -4.66 -3.86
Singapore 3.35 2.49 2.63 1.95 1.58 -1.09 -1.58 -1.15
Thailand -1.50 -2.79 -3.33 -2.23 -2.40 -1.41 0.40 0.13
Viet Nam -1.72 -0.50 -1.58 -2.81 -2.52 -2.41 -2.82 -2.00
Table IV.17.Government Budget Deficit, 1997-2004
Country 1997 1998 1999 2000 2001 2002 2003 2004
(1) (2) (3) (4) (5) (6) (7) (8) (9)
Source: ASEAN Finance and Macroeconomic Surveillance Unit (FMSU) Database.
(Million of National Currency)
Brunei Darussalam -2 102 52 1,294 446 -378 917 1,285
Cambodia -90,500 -286,500 -166,800 -162,300 -467,230 -595,201 -669,875 -459,736
Indonesia 1,627,400 -6,416,100 -14,010,900 -28,623,800 -35,195,700 -29,158,100 -33,669,100 -28,569,600
Lao PDR -128,179 -322,840 -305,373 -176,838 -782,828 -763,176 - -
Malaysia 6,626 -5,002 -9,487 -19,715 -18,424 -20,254 -20,927 -19,417
Myanmar -57,626 -93,187 -109,301 -119,698 - - - -
The Philippines 1,564 -49,981 -111,658 -136,110 -147,023 -212,683 -199,868 -186,116
Singapore 4,748 3,419 3,673 3,116 2,422 -1,721 -2,548 -2,073
Thailand -71,051 -129,292 -154,363 -109,869 -122,994 -76,815 23,998 8,332
Viet Nam -5,397,000 -1,796,000 -6,328,000 -12,402,000 -12,142,000 -12,926,000 -17,320,000 -14,252,715

ASEAN Statistical Yearbook, 2005 55
Chapter VMerchandise Trade
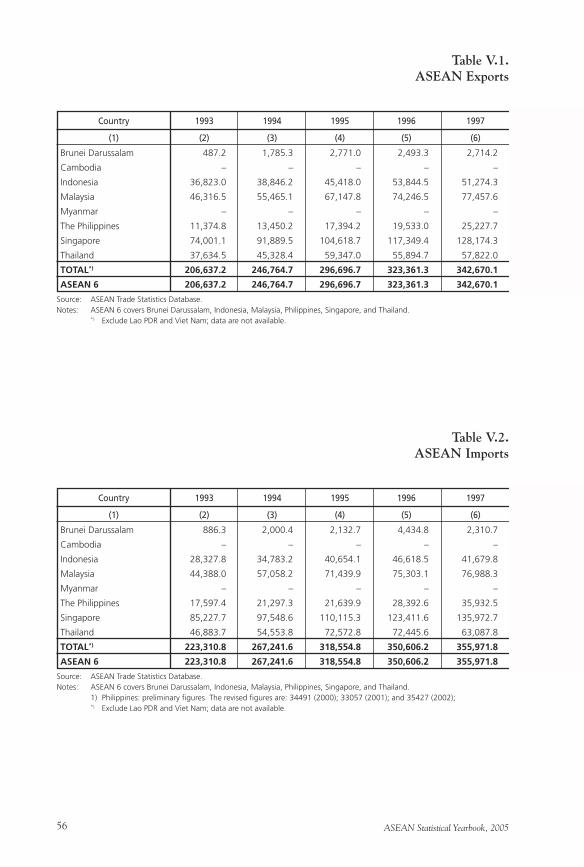
ASEAN Statistical Yearbook, 200556
Brunei Darussalam 487.2 1,785.3 2,771.0 2,493.3 2,714.2
Cambodia – – – – –
Indonesia 36,823.0 38,846.2 45,418.0 53,844.5 51,274.3
Malaysia 46,316.5 55,465.1 67,147.8 74,246.5 77,457.6
Myanmar – – – – –
The Philippines 11,374.8 13,450.2 17,394.2 19,533.0 25,227.7
Singapore 74,001.1 91,889.5 104,618.7 117,349.4 128,174.3
Thailand 37,634.5 45,328.4 59,347.0 55,894.7 57,822.0
TOTAL*) 206,637.2 246,764.7 296,696.7 323,361.3 342,670.1
ASEAN 6 206,637.2 246,764.7 296,696.7 323,361.3 342,670.1
Table V.1.ASEAN Exports
Country 1993 1994 1995 1996 1997
(1) (2) (3) (4) (5) (6)
Source: ASEAN Trade Statistics Database.Notes: ASEAN 6 covers Brunei Darussalam, Indonesia, Malaysia, Philippines, Singapore, and Thailand. *) Exclude Lao PDR and Viet Nam; data are not available.
Brunei Darussalam 886.3 2,000.4 2,132.7 4,434.8 2,310.7
Cambodia – – – – –
Indonesia 28,327.8 34,783.2 40,654.1 46,618.5 41,679.8
Malaysia 44,388.0 57,058.2 71,439.9 75,303.1 76,988.3
Myanmar – – – – –
The Philippines 17,597.4 21,297.3 21,639.9 28,392.6 35,932.5
Singapore 85,227.7 97,548.6 110,115.3 123,411.6 135,972.7
Thailand 46,883.7 54,553.8 72,572.8 72,445.6 63,087.8
TOTAL*) 223,310.8 267,241.6 318,554.8 350,606.2 355,971.8
ASEAN 6 223,310.8 267,241.6 318,554.8 350,606.2 355,971.8
Table V.2.ASEAN Imports
Country 1993 1994 1995 1996 1997
(1) (2) (3) (4) (5) (6)
Source: ASEAN Trade Statistics Database.Notes: ASEAN 6 covers Brunei Darussalam, Indonesia, Malaysia, Philippines, Singapore, and Thailand. 1) Philippines: preliminary figures. The revised figures are: 34491 (2000); 33057 (2001); and 35427 (2002); *) Exclude Lao PDR and Viet Nam; data are not available.

ASEAN Statistical Yearbook, 2005 57
1,923.7 2,340.7 2,169.1 3,530.4 2,690.9 3,211.1 5,062.3
– – 1,367.5 1,495.1 1,916.1 2,115.7 2,506.3
48,847.6 48,665.5 62,124.0 56,317.6 57,158.8 61,058.2 71,584.6
77,098.6 84,287.9 98,154.5 88,031.6 93,277.2 99,377.6 126,529.9
– 744.8 1,193.8 2,218.4 2,452.2 4,463.8 3,904.6
29,496.4 35,036.9 38,078.2 32,150.2 35,208.2 36,231.2 39,680.5
109,802.9 114,625.1 138,352.5 121,686.8 125,042.7 144,125.6 179,006.2
49,481.6 56,110.9 68,700.9 64,925.6 66,108.2 80,450.1 97,361.4
316,650.8 341,811.8 410,140.6 370,355.7 383,854.1 431,033.4 525,635.8
316,650.8 341,067.0 407,579.3 366,642.3 379,485.9 424,453.9 519,225.0
by Country, 1993-2004
1998 1999 2000 2001 2002 2003 2004
(7) (8) (9) (10) (11) (12) (13)
(US$ Million)
1,276.3 1,720.4 1,067.6 1,310.0 1,600.4 1,351.9 1,514.4
– – 1,404.6 1,502.0 1,664.8 2,906.4 2,004.5
27,336.9 24,003.3 33,514.8 30,962.1 31,288.9 32,550.7 46,524.5
60,976.5 63,677.8 79,647.5 73,097.9 78,797.8 80,091.1 105,299.4
– 1,886.1 2,219.4 2,811.4 2,118.1 1,843.3 1,933.0
29,659.9 30,742.5 31387.41) 29,550.8 33,576.4 37,496.5 44,039.2
101,495.9 110,998.0 134,680.1 115,919.0 116,336.4 127,890.7 163,324.8
38,711.6 48,318.0 61,935.3 61,975.4 62,729.9 75,759.4 95,304.8
259,456.9 281,346.0 345,856.7 317,128.6 328,112.6 359,890.0 459,944.6
259,456.9 279,459.9 342,232.7 312,815.2 324,329.8 355,140.4 456,007.1
by Country, 1993-2004
1998 1999 2000 2001 2002 2003 2004
(7) (8) (9) (10) (11) (12) (13)
(US$ Million)
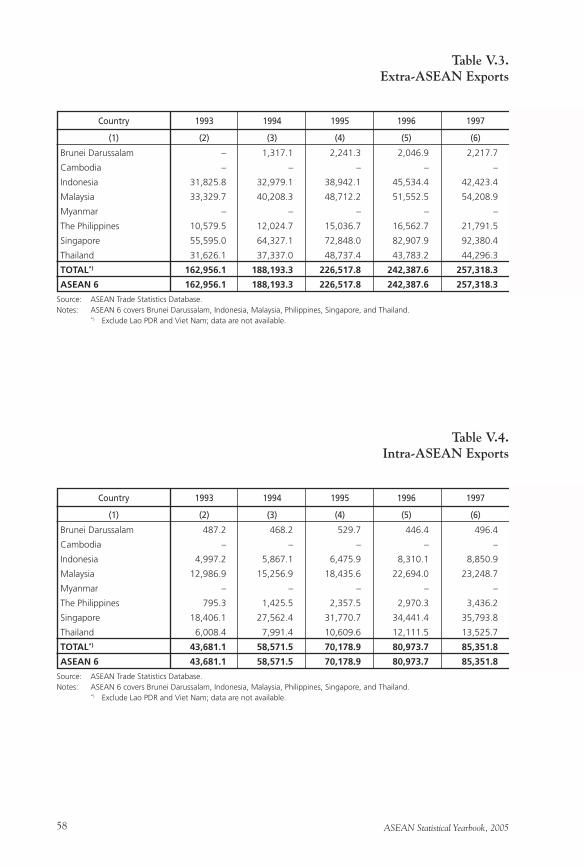
ASEAN Statistical Yearbook, 200558
Brunei Darussalam – 1,317.1 2,241.3 2,046.9 2,217.7
Cambodia – – – – –
Indonesia 31,825.8 32,979.1 38,942.1 45,534.4 42,423.4
Malaysia 33,329.7 40,208.3 48,712.2 51,552.5 54,208.9
Myanmar – – – – –
The Philippines 10,579.5 12,024.7 15,036.7 16,562.7 21,791.5
Singapore 55,595.0 64,327.1 72,848.0 82,907.9 92,380.4
Thailand 31,626.1 37,337.0 48,737.4 43,783.2 44,296.3
TOTAL*) 162,956.1 188,193.3 226,517.8 242,387.6 257,318.3
ASEAN 6 162,956.1 188,193.3 226,517.8 242,387.6 257,318.3
Table V.3.Extra-ASEAN Exports
Country 1993 1994 1995 1996 1997
(1) (2) (3) (4) (5) (6)
Source: ASEAN Trade Statistics Database.Notes: ASEAN 6 covers Brunei Darussalam, Indonesia, Malaysia, Philippines, Singapore, and Thailand. *) Exclude Lao PDR and Viet Nam; data are not available.
Brunei Darussalam 487.2 468.2 529.7 446.4 496.4
Cambodia – – – – –
Indonesia 4,997.2 5,867.1 6,475.9 8,310.1 8,850.9
Malaysia 12,986.9 15,256.9 18,435.6 22,694.0 23,248.7
Myanmar – – – – –
The Philippines 795.3 1,425.5 2,357.5 2,970.3 3,436.2
Singapore 18,406.1 27,562.4 31,770.7 34,441.4 35,793.8
Thailand 6,008.4 7,991.4 10,609.6 12,111.5 13,525.7
TOTAL*) 43,681.1 58,571.5 70,178.9 80,973.7 85,351.8
ASEAN 6 43,681.1 58,571.5 70,178.9 80,973.7 85,351.8
Table V.4.Intra-ASEAN Exports
Country 1993 1994 1995 1996 1997
(1) (2) (3) (4) (5) (6)
Source: ASEAN Trade Statistics Database.Notes: ASEAN 6 covers Brunei Darussalam, Indonesia, Malaysia, Philippines, Singapore, and Thailand. *) Exclude Lao PDR and Viet Nam; data are not available.
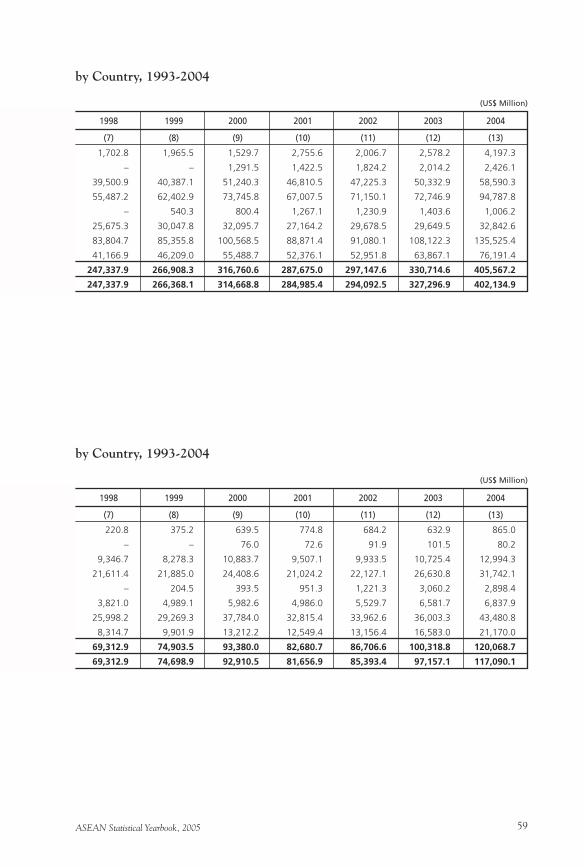
ASEAN Statistical Yearbook, 2005 59
1,702.8 1,965.5 1,529.7 2,755.6 2,006.7 2,578.2 4,197.3
– – 1,291.5 1,422.5 1,824.2 2,014.2 2,426.1
39,500.9 40,387.1 51,240.3 46,810.5 47,225.3 50,332.9 58,590.3
55,487.2 62,402.9 73,745.8 67,007.5 71,150.1 72,746.9 94,787.8
– 540.3 800.4 1,267.1 1,230.9 1,403.6 1,006.2
25,675.3 30,047.8 32,095.7 27,164.2 29,678.5 29,649.5 32,842.6
83,804.7 85,355.8 100,568.5 88,871.4 91,080.1 108,122.3 135,525.4
41,166.9 46,209.0 55,488.7 52,376.1 52,951.8 63,867.1 76,191.4
247,337.9 266,908.3 316,760.6 287,675.0 297,147.6 330,714.6 405,567.2
247,337.9 266,368.1 314,668.8 284,985.4 294,092.5 327,296.9 402,134.9
by Country, 1993-2004
1998 1999 2000 2001 2002 2003 2004
(7) (8) (9) (10) (11) (12) (13)
(US$ Million)
220.8 375.2 639.5 774.8 684.2 632.9 865.0
– – 76.0 72.6 91.9 101.5 80.2
9,346.7 8,278.3 10,883.7 9,507.1 9,933.5 10,725.4 12,994.3
21,611.4 21,885.0 24,408.6 21,024.2 22,127.1 26,630.8 31,742.1
– 204.5 393.5 951.3 1,221.3 3,060.2 2,898.4
3,821.0 4,989.1 5,982.6 4,986.0 5,529.7 6,581.7 6,837.9
25,998.2 29,269.3 37,784.0 32,815.4 33,962.6 36,003.3 43,480.8
8,314.7 9,901.9 13,212.2 12,549.4 13,156.4 16,583.0 21,170.0
69,312.9 74,903.5 93,380.0 82,680.7 86,706.6 100,318.8 120,068.7
69,312.9 74,698.9 92,910.5 81,656.9 85,393.4 97,157.1 117,090.1
by Country, 1993-2004
1998 1999 2000 2001 2002 2003 2004
(7) (8) (9) (10) (11) (12) (13)
(US$ Million)
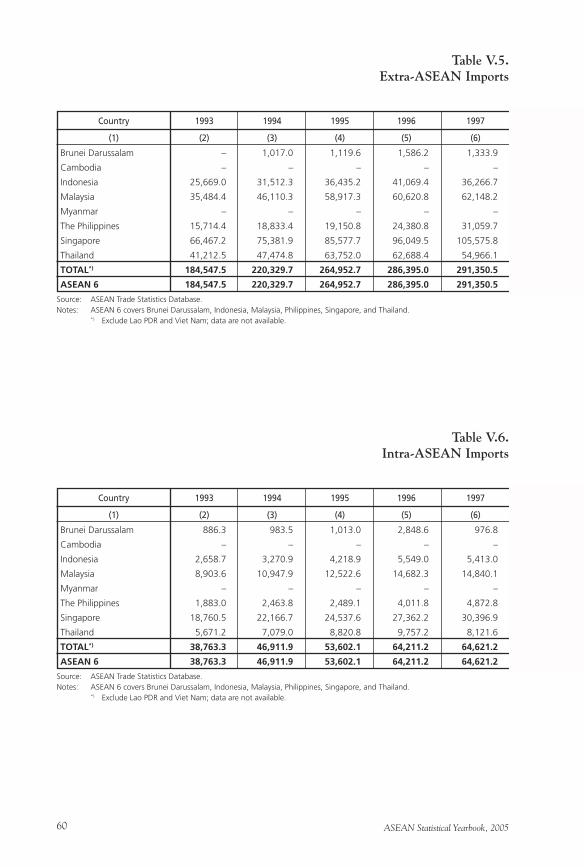
ASEAN Statistical Yearbook, 200560
Brunei Darussalam – 1,017.0 1,119.6 1,586.2 1,333.9
Cambodia – – – – –
Indonesia 25,669.0 31,512.3 36,435.2 41,069.4 36,266.7
Malaysia 35,484.4 46,110.3 58,917.3 60,620.8 62,148.2
Myanmar – – – – –
The Philippines 15,714.4 18,833.4 19,150.8 24,380.8 31,059.7
Singapore 66,467.2 75,381.9 85,577.7 96,049.5 105,575.8
Thailand 41,212.5 47,474.8 63,752.0 62,688.4 54,966.1
TOTAL*) 184,547.5 220,329.7 264,952.7 286,395.0 291,350.5
ASEAN 6 184,547.5 220,329.7 264,952.7 286,395.0 291,350.5
Table V.5.Extra-ASEAN Imports
Country 1993 1994 1995 1996 1997
(1) (2) (3) (4) (5) (6)
Source: ASEAN Trade Statistics Database.Notes: ASEAN 6 covers Brunei Darussalam, Indonesia, Malaysia, Philippines, Singapore, and Thailand. *) Exclude Lao PDR and Viet Nam; data are not available.
Brunei Darussalam 886.3 983.5 1,013.0 2,848.6 976.8
Cambodia – – – – –
Indonesia 2,658.7 3,270.9 4,218.9 5,549.0 5,413.0
Malaysia 8,903.6 10,947.9 12,522.6 14,682.3 14,840.1
Myanmar – – – – –
The Philippines 1,883.0 2,463.8 2,489.1 4,011.8 4,872.8
Singapore 18,760.5 22,166.7 24,537.6 27,362.2 30,396.9
Thailand 5,671.2 7,079.0 8,820.8 9,757.2 8,121.6
TOTAL*) 38,763.3 46,911.9 53,602.1 64,211.2 64,621.2
ASEAN 6 38,763.3 46,911.9 53,602.1 64,211.2 64,621.2
Table V.6.Intra-ASEAN Imports
Country 1993 1994 1995 1996 1997
(1) (2) (3) (4) (5) (6)
Source: ASEAN Trade Statistics Database.Notes: ASEAN 6 covers Brunei Darussalam, Indonesia, Malaysia, Philippines, Singapore, and Thailand. *) Exclude Lao PDR and Viet Nam; data are not available.
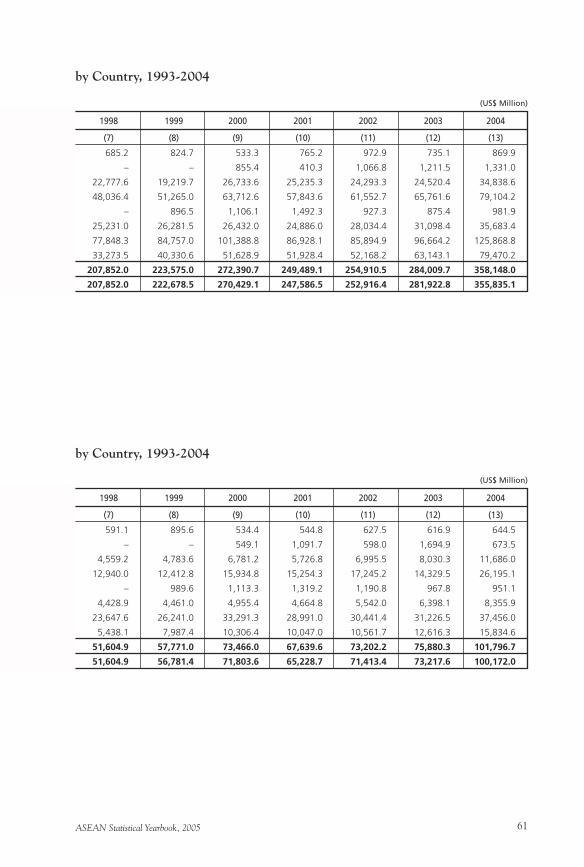
ASEAN Statistical Yearbook, 2005 61
685.2 824.7 533.3 765.2 972.9 735.1 869.9
– – 855.4 410.3 1,066.8 1,211.5 1,331.0
22,777.6 19,219.7 26,733.6 25,235.3 24,293.3 24,520.4 34,838.6
48,036.4 51,265.0 63,712.6 57,843.6 61,552.7 65,761.6 79,104.2
– 896.5 1,106.1 1,492.3 927.3 875.4 981.9
25,231.0 26,281.5 26,432.0 24,886.0 28,034.4 31,098.4 35,683.4
77,848.3 84,757.0 101,388.8 86,928.1 85,894.9 96,664.2 125,868.8
33,273.5 40,330.6 51,628.9 51,928.4 52,168.2 63,143.1 79,470.2
207,852.0 223,575.0 272,390.7 249,489.1 254,910.5 284,009.7 358,148.0
207,852.0 222,678.5 270,429.1 247,586.5 252,916.4 281,922.8 355,835.1
by Country, 1993-2004
1998 1999 2000 2001 2002 2003 2004
(7) (8) (9) (10) (11) (12) (13)
(US$ Million)
591.1 895.6 534.4 544.8 627.5 616.9 644.5
– – 549.1 1,091.7 598.0 1,694.9 673.5
4,559.2 4,783.6 6,781.2 5,726.8 6,995.5 8,030.3 11,686.0
12,940.0 12,412.8 15,934.8 15,254.3 17,245.2 14,329.5 26,195.1
– 989.6 1,113.3 1,319.2 1,190.8 967.8 951.1
4,428.9 4,461.0 4,955.4 4,664.8 5,542.0 6,398.1 8,355.9
23,647.6 26,241.0 33,291.3 28,991.0 30,441.4 31,226.5 37,456.0
5,438.1 7,987.4 10,306.4 10,047.0 10,561.7 12,616.3 15,834.6
51,604.9 57,771.0 73,466.0 67,639.6 73,202.2 75,880.3 101,796.7
51,604.9 56,781.4 71,803.6 65,228.7 71,413.4 73,217.6 100,172.0
by Country, 1993-2004
1998 1999 2000 2001 2002 2003 2004
(7) (8) (9) (10) (11) (12) (13)
(US$ Million)
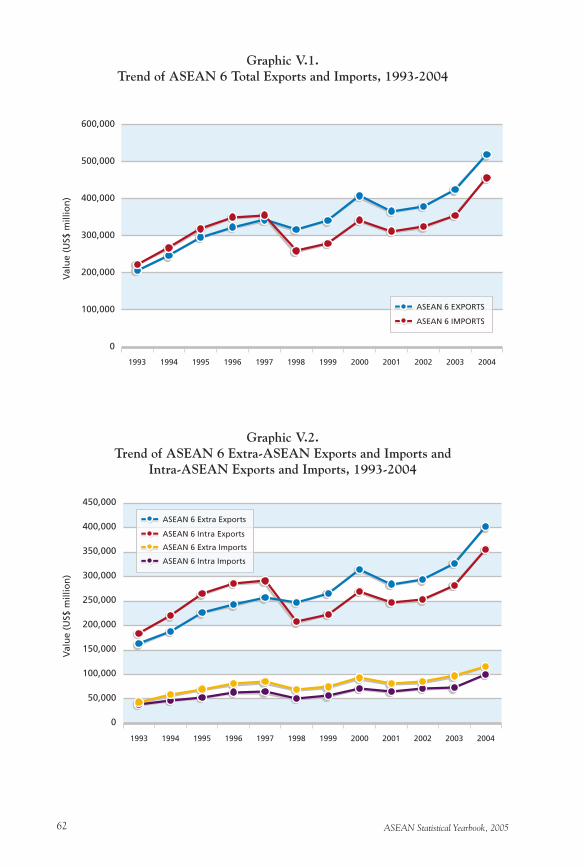
ASEAN Statistical Yearbook, 200562
Graphic V.1.Trend of ASEAN 6 Total Exports and Imports, 1993-2004
Graphic V.2.Trend of ASEAN 6 Extra-ASEAN Exports and Imports and
Intra-ASEAN Exports and Imports, 1993-2004
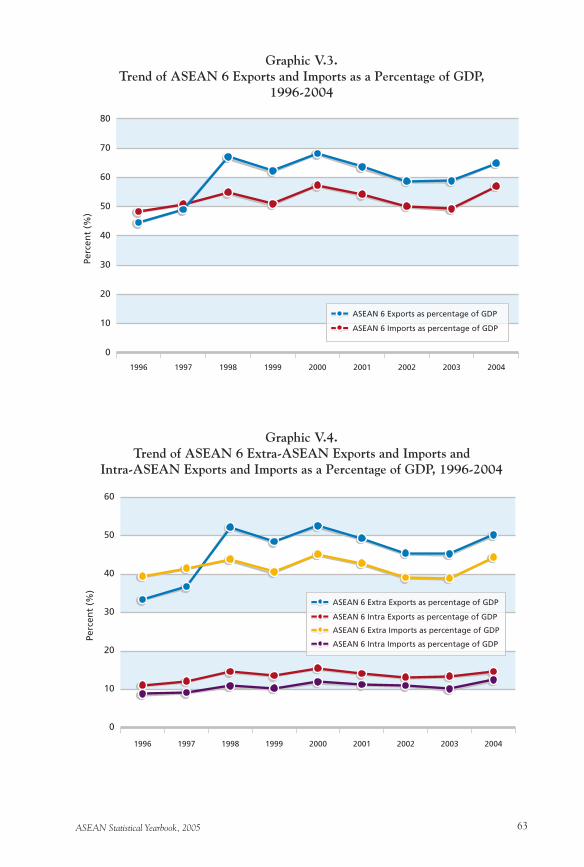
ASEAN Statistical Yearbook, 2005 63
Graphic V.3.Trend of ASEAN 6 Exports and Imports as a Percentage of GDP,
1996-2004
Graphic V.4.Trend of ASEAN 6 Extra-ASEAN Exports and Imports and
Intra-ASEAN Exports and Imports as a Percentage of GDP, 1996-2004
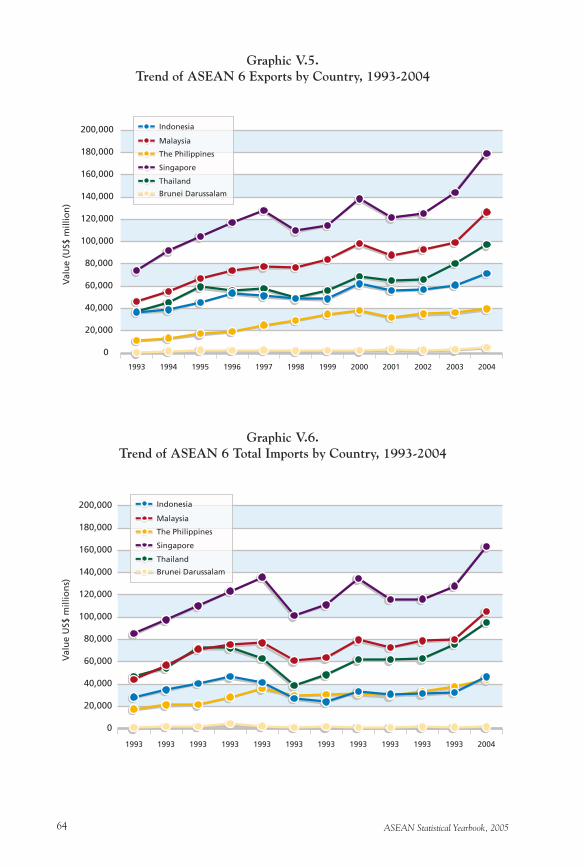
ASEAN Statistical Yearbook, 200564
Graphic V.5.Trend of ASEAN 6 Exports by Country, 1993-2004
Graphic V.6.Trend of ASEAN 6 Total Imports by Country, 1993-2004
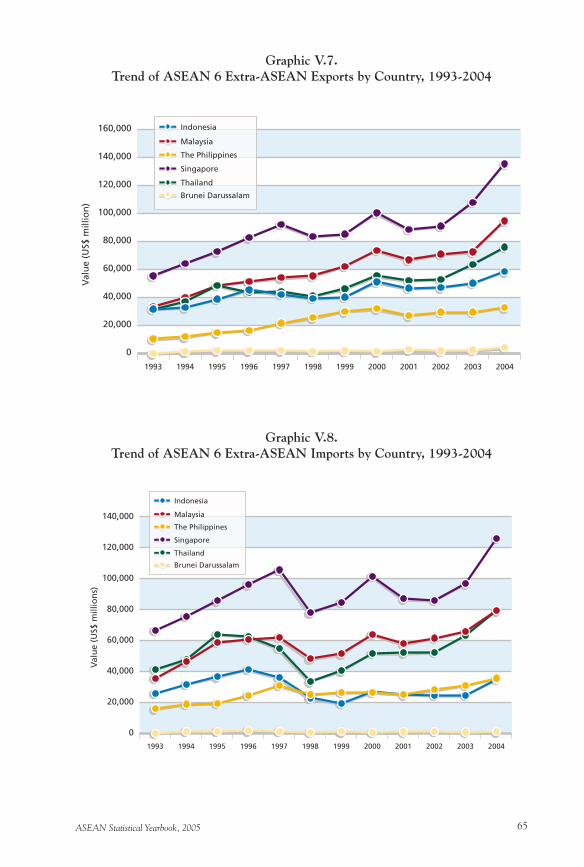
ASEAN Statistical Yearbook, 2005 65
Graphic V.7.Trend of ASEAN 6 Extra-ASEAN Exports by Country, 1993-2004
Graphic V.8.Trend of ASEAN 6 Extra-ASEAN Imports by Country, 1993-2004
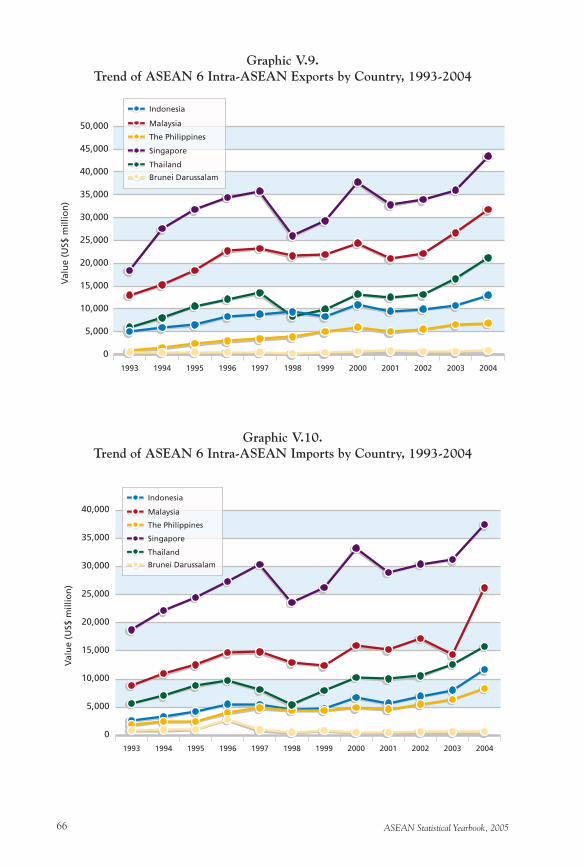
ASEAN Statistical Yearbook, 200566
Graphic V.9.Trend of ASEAN 6 Intra-ASEAN Exports by Country, 1993-2004
Graphic V.10.Trend of ASEAN 6 Intra-ASEAN Imports by Country, 1993-2004
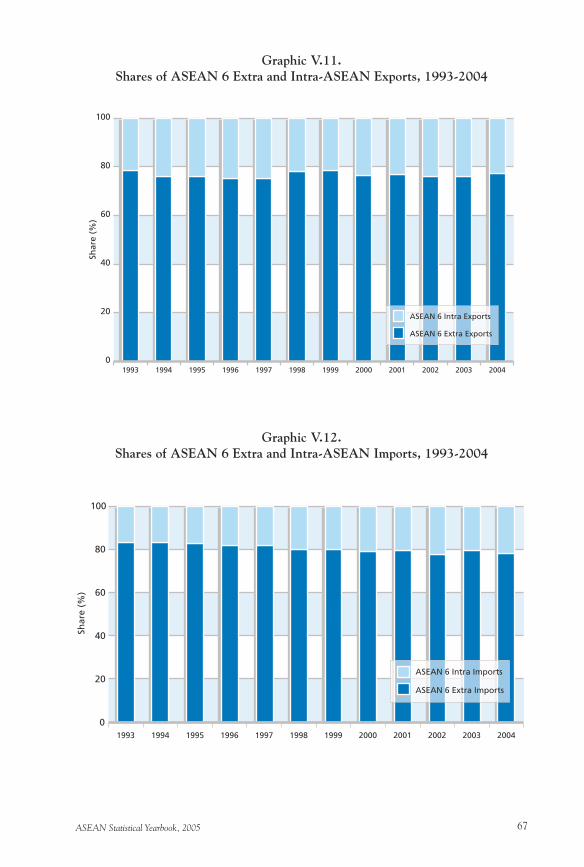
ASEAN Statistical Yearbook, 2005 67
Graphic V.11.Shares of ASEAN 6 Extra and Intra-ASEAN Exports, 1993-2004
Graphic V.12.Shares of ASEAN 6 Extra and Intra-ASEAN Imports, 1993-2004
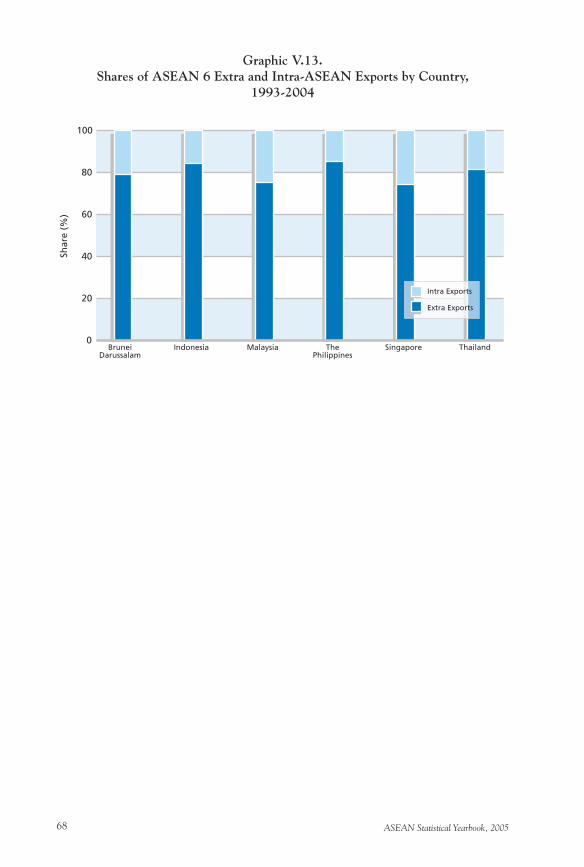
ASEAN Statistical Yearbook, 200568
Graphic V.13.Shares of ASEAN 6 Extra and Intra-ASEAN Exports by Country,
1993-2004
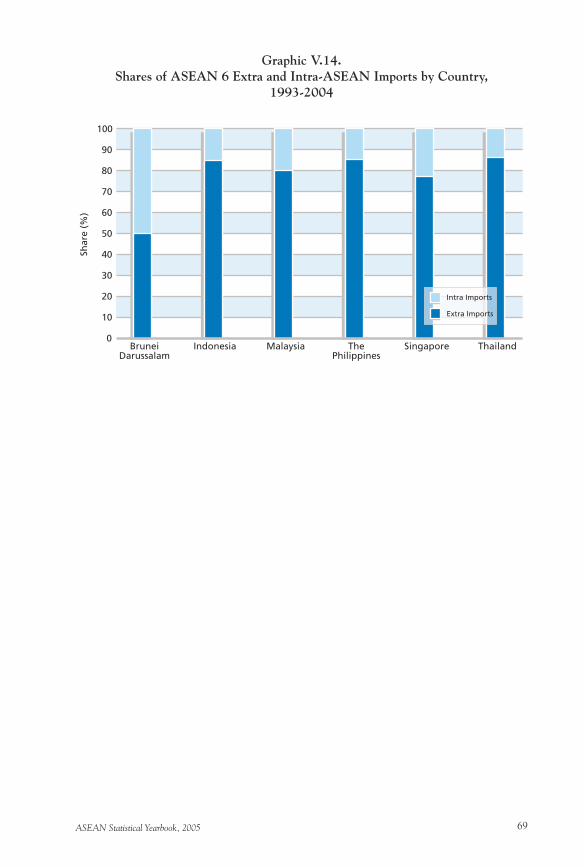
ASEAN Statistical Yearbook, 2005 69
Graphic V.14.Shares of ASEAN 6 Extra and Intra-ASEAN Imports by Country,
1993-2004
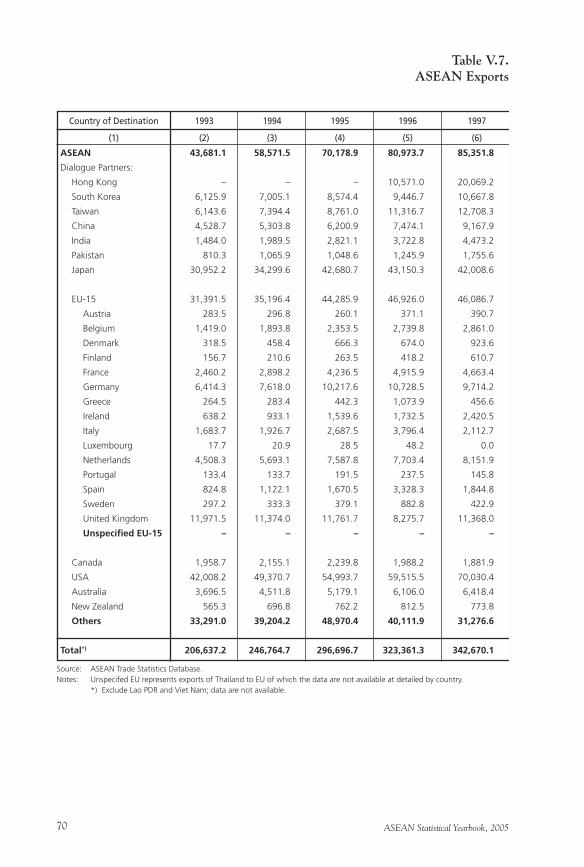
ASEAN Statistical Yearbook, 200570
ASEAN 43,681.1 58,571.5 70,178.9 80,973.7 85,351.8
Dialogue Partners:
Hong Kong – – – 10,571.0 20,069.2
South Korea 6,125.9 7,005.1 8,574.4 9,446.7 10,667.8
Taiwan 6,143.6 7,394.4 8,761.0 11,316.7 12,708.3
China 4,528.7 5,303.8 6,200.9 7,474.1 9,167.9
India 1,484.0 1,989.5 2,821.1 3,722.8 4,473.2
Pakistan 810.3 1,065.9 1,048.6 1,245.9 1,755.6
Japan 30,952.2 34,299.6 42,680.7 43,150.3 42,008.6
EU-15 31,391.5 35,196.4 44,285.9 46,926.0 46,086.7
Austria 283.5 296.8 260.1 371.1 390.7
Belgium 1,419.0 1,893.8 2,353.5 2,739.8 2,861.0
Denmark 318.5 458.4 666.3 674.0 923.6
Finland 156.7 210.6 263.5 418.2 610.7
France 2,460.2 2,898.2 4,236.5 4,915.9 4,663.4
Germany 6,414.3 7,618.0 10,217.6 10,728.5 9,714.2
Greece 264.5 283.4 442.3 1,073.9 456.6
Ireland 638.2 933.1 1,539.6 1,732.5 2,420.5
Italy 1,683.7 1,926.7 2,687.5 3,796.4 2,112.7
Luxembourg 17.7 20.9 28.5 48.2 0.0
Netherlands 4,508.3 5,693.1 7,587.8 7,703.4 8,151.9
Portugal 133.4 133.7 191.5 237.5 145.8
Spain 824.8 1,122.1 1,670.5 3,328.3 1,844.8
Sweden 297.2 333.3 379.1 882.8 422.9
United Kingdom 11,971.5 11,374.0 11,761.7 8,275.7 11,368.0
Unspecified EU-15 – – – – –
Canada 1,958.7 2,155.1 2,239.8 1,988.2 1,881.9
USA 42,008.2 49,370.7 54,993.7 59,515.5 70,030.4
Australia 3,696.5 4,511.8 5,179.1 6,106.0 6,418.4
New Zealand 565.3 696.8 762.2 812.5 773.8
Others 33,291.0 39,204.2 48,970.4 40,111.9 31,276.6
Total*) 206,637.2 246,764.7 296,696.7 323,361.3 342,670.1
Table V.7.ASEAN Exports
Country of Destination 1993 1994 1995 1996 1997
(1) (2) (3) (4) (5) (6)
Source: ASEAN Trade Statistics Database.Notes: Unspecifed EU represents exports of Thailand to EU of which the data are not available at detailed by country. *) Exclude Lao PDR and Viet Nam; data are not available.
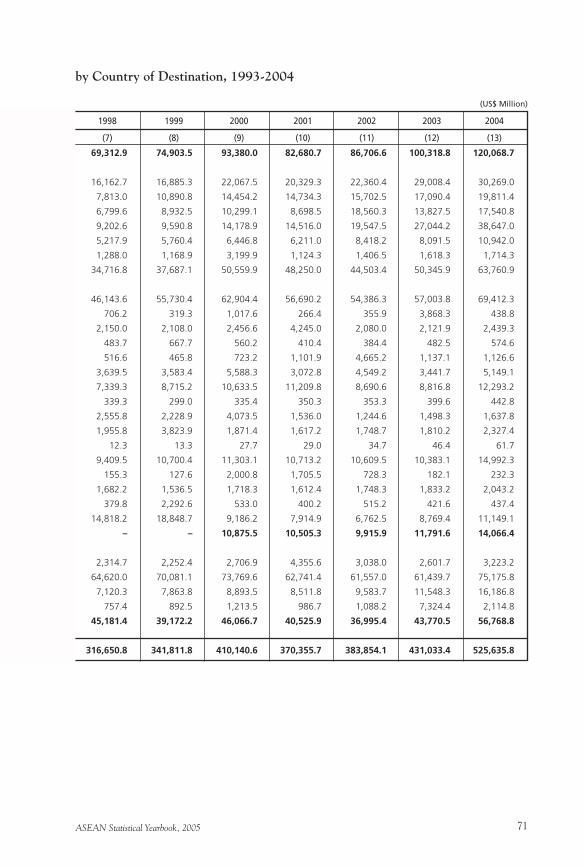
ASEAN Statistical Yearbook, 2005 71
69,312.9 74,903.5 93,380.0 82,680.7 86,706.6 100,318.8 120,068.7
16,162.7 16,885.3 22,067.5 20,329.3 22,360.4 29,008.4 30,269.0
7,813.0 10,890.8 14,454.2 14,734.3 15,702.5 17,090.4 19,811.4
6,799.6 8,932.5 10,299.1 8,698.5 18,560.3 13,827.5 17,540.8
9,202.6 9,590.8 14,178.9 14,516.0 19,547.5 27,044.2 38,647.0
5,217.9 5,760.4 6,446.8 6,211.0 8,418.2 8,091.5 10,942.0
1,288.0 1,168.9 3,199.9 1,124.3 1,406.5 1,618.3 1,714.3
34,716.8 37,687.1 50,559.9 48,250.0 44,503.4 50,345.9 63,760.9
46,143.6 55,730.4 62,904.4 56,690.2 54,386.3 57,003.8 69,412.3
706.2 319.3 1,017.6 266.4 355.9 3,868.3 438.8
2,150.0 2,108.0 2,456.6 4,245.0 2,080.0 2,121.9 2,439.3
483.7 667.7 560.2 410.4 384.4 482.5 574.6
516.6 465.8 723.2 1,101.9 4,665.2 1,137.1 1,126.6
3,639.5 3,583.4 5,588.3 3,072.8 4,549.2 3,441.7 5,149.1
7,339.3 8,715.2 10,633.5 11,209.8 8,690.6 8,816.8 12,293.2
339.3 299.0 335.4 350.3 353.3 399.6 442.8
2,555.8 2,228.9 4,073.5 1,536.0 1,244.6 1,498.3 1,637.8
1,955.8 3,823.9 1,871.4 1,617.2 1,748.7 1,810.2 2,327.4
12.3 13.3 27.7 29.0 34.7 46.4 61.7
9,409.5 10,700.4 11,303.1 10,713.2 10,609.5 10,383.1 14,992.3
155.3 127.6 2,000.8 1,705.5 728.3 182.1 232.3
1,682.2 1,536.5 1,718.3 1,612.4 1,748.3 1,833.2 2,043.2
379.8 2,292.6 533.0 400.2 515.2 421.6 437.4
14,818.2 18,848.7 9,186.2 7,914.9 6,762.5 8,769.4 11,149.1
– – 10,875.5 10,505.3 9,915.9 11,791.6 14,066.4
2,314.7 2,252.4 2,706.9 4,355.6 3,038.0 2,601.7 3,223.2
64,620.0 70,081.1 73,769.6 62,741.4 61,557.0 61,439.7 75,175.8
7,120.3 7,863.8 8,893.5 8,511.8 9,583.7 11,548.3 16,186.8
757.4 892.5 1,213.5 986.7 1,088.2 7,324.4 2,114.8
45,181.4 39,172.2 46,066.7 40,525.9 36,995.4 43,770.5 56,768.8
316,650.8 341,811.8 410,140.6 370,355.7 383,854.1 431,033.4 525,635.8
by Country of Destination, 1993-2004
1998 1999 2000 2001 2002 2003 2004
(7) (8) (9) (10) (11) (12) (13)
(US$ Million)
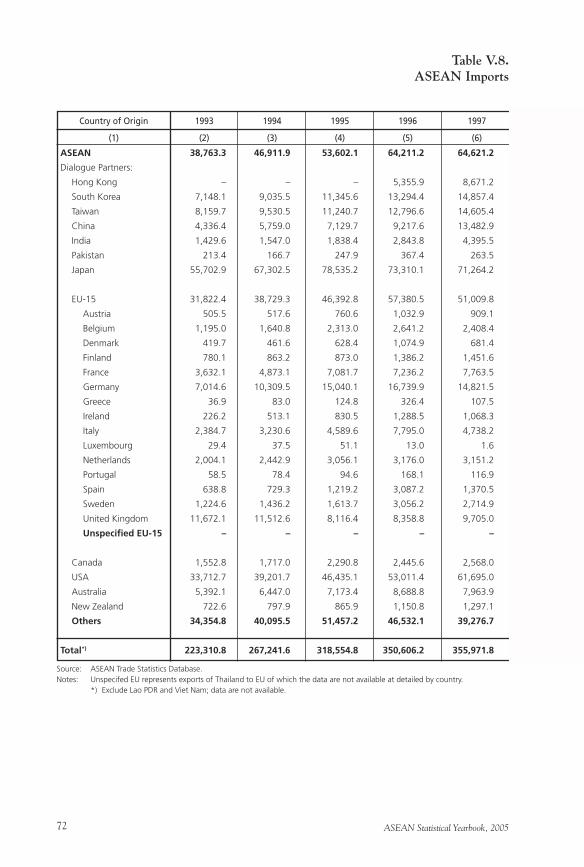
ASEAN Statistical Yearbook, 200572
ASEAN 38,763.3 46,911.9 53,602.1 64,211.2 64,621.2
Dialogue Partners:
Hong Kong – – – 5,355.9 8,671.2
South Korea 7,148.1 9,035.5 11,345.6 13,294.4 14,857.4
Taiwan 8,159.7 9,530.5 11,240.7 12,796.6 14,605.4
China 4,336.4 5,759.0 7,129.7 9,217.6 13,482.9
India 1,429.6 1,547.0 1,838.4 2,843.8 4,395.5
Pakistan 213.4 166.7 247.9 367.4 263.5
Japan 55,702.9 67,302.5 78,535.2 73,310.1 71,264.2
EU-15 31,822.4 38,729.3 46,392.8 57,380.5 51,009.8
Austria 505.5 517.6 760.6 1,032.9 909.1
Belgium 1,195.0 1,640.8 2,313.0 2,641.2 2,408.4
Denmark 419.7 461.6 628.4 1,074.9 681.4
Finland 780.1 863.2 873.0 1,386.2 1,451.6
France 3,632.1 4,873.1 7,081.7 7,236.2 7,763.5
Germany 7,014.6 10,309.5 15,040.1 16,739.9 14,821.5
Greece 36.9 83.0 124.8 326.4 107.5
Ireland 226.2 513.1 830.5 1,288.5 1,068.3
Italy 2,384.7 3,230.6 4,589.6 7,795.0 4,738.2
Luxembourg 29.4 37.5 51.1 13.0 1.6
Netherlands 2,004.1 2,442.9 3,056.1 3,176.0 3,151.2
Portugal 58.5 78.4 94.6 168.1 116.9
Spain 638.8 729.3 1,219.2 3,087.2 1,370.5
Sweden 1,224.6 1,436.2 1,613.7 3,056.2 2,714.9
United Kingdom 11,672.1 11,512.6 8,116.4 8,358.8 9,705.0
Unspecified EU-15 – – – – –
Canada 1,552.8 1,717.0 2,290.8 2,445.6 2,568.0
USA 33,712.7 39,201.7 46,435.1 53,011.4 61,695.0
Australia 5,392.1 6,447.0 7,173.4 8,688.8 7,963.9
New Zealand 722.6 797.9 865.9 1,150.8 1,297.1
Others 34,354.8 40,095.5 51,457.2 46,532.1 39,276.7
Total*) 223,310.8 267,241.6 318,554.8 350,606.2 355,971.8
Table V.8.ASEAN Imports
Country of Origin 1993 1994 1995 1996 1997
(1) (2) (3) (4) (5) (6)
Source: ASEAN Trade Statistics Database.Notes: Unspecifed EU represents exports of Thailand to EU of which the data are not available at detailed by country. *) Exclude Lao PDR and Viet Nam; data are not available.
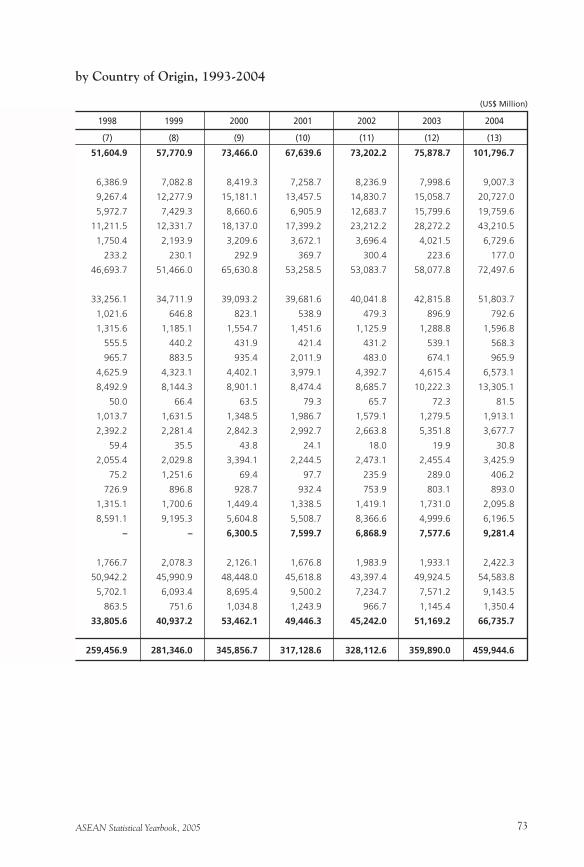
ASEAN Statistical Yearbook, 2005 73
51,604.9 57,770.9 73,466.0 67,639.6 73,202.2 75,878.7 101,796.7
6,386.9 7,082.8 8,419.3 7,258.7 8,236.9 7,998.6 9,007.3
9,267.4 12,277.9 15,181.1 13,457.5 14,830.7 15,058.7 20,727.0
5,972.7 7,429.3 8,660.6 6,905.9 12,683.7 15,799.6 19,759.6
11,211.5 12,331.7 18,137.0 17,399.2 23,212.2 28,272.2 43,210.5
1,750.4 2,193.9 3,209.6 3,672.1 3,696.4 4,021.5 6,729.6
233.2 230.1 292.9 369.7 300.4 223.6 177.0
46,693.7 51,466.0 65,630.8 53,258.5 53,083.7 58,077.8 72,497.6
33,256.1 34,711.9 39,093.2 39,681.6 40,041.8 42,815.8 51,803.7
1,021.6 646.8 823.1 538.9 479.3 896.9 792.6
1,315.6 1,185.1 1,554.7 1,451.6 1,125.9 1,288.8 1,596.8
555.5 440.2 431.9 421.4 431.2 539.1 568.3
965.7 883.5 935.4 2,011.9 483.0 674.1 965.9
4,625.9 4,323.1 4,402.1 3,979.1 4,392.7 4,615.4 6,573.1
8,492.9 8,144.3 8,901.1 8,474.4 8,685.7 10,222.3 13,305.1
50.0 66.4 63.5 79.3 65.7 72.3 81.5
1,013.7 1,631.5 1,348.5 1,986.7 1,579.1 1,279.5 1,913.1
2,392.2 2,281.4 2,842.3 2,992.7 2,663.8 5,351.8 3,677.7
59.4 35.5 43.8 24.1 18.0 19.9 30.8
2,055.4 2,029.8 3,394.1 2,244.5 2,473.1 2,455.4 3,425.9
75.2 1,251.6 69.4 97.7 235.9 289.0 406.2
726.9 896.8 928.7 932.4 753.9 803.1 893.0
1,315.1 1,700.6 1,449.4 1,338.5 1,419.1 1,731.0 2,095.8
8,591.1 9,195.3 5,604.8 5,508.7 8,366.6 4,999.6 6,196.5
– – 6,300.5 7,599.7 6,868.9 7,577.6 9,281.4
1,766.7 2,078.3 2,126.1 1,676.8 1,983.9 1,933.1 2,422.3
50,942.2 45,990.9 48,448.0 45,618.8 43,397.4 49,924.5 54,583.8
5,702.1 6,093.4 8,695.4 9,500.2 7,234.7 7,571.2 9,143.5
863.5 751.6 1,034.8 1,243.9 966.7 1,145.4 1,350.4
33,805.6 40,937.2 53,462.1 49,446.3 45,242.0 51,169.2 66,735.7
259,456.9 281,346.0 345,856.7 317,128.6 328,112.6 359,890.0 459,944.6
by Country of Origin, 1993-2004
1998 1999 2000 2001 2002 2003 2004
(7) (8) (9) (10) (11) (12) (13)
(US$ Million)
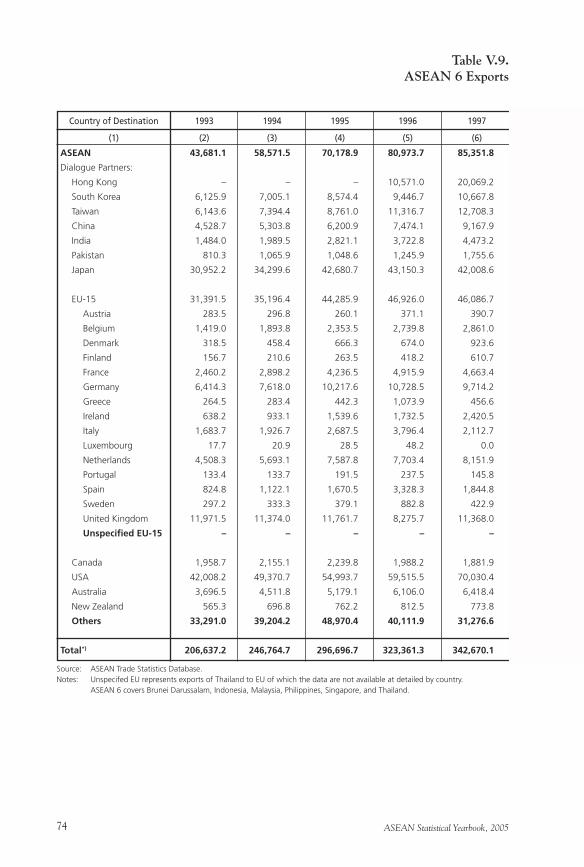
ASEAN Statistical Yearbook, 200574
ASEAN 43,681.1 58,571.5 70,178.9 80,973.7 85,351.8
Dialogue Partners:
Hong Kong – – – 10,571.0 20,069.2
South Korea 6,125.9 7,005.1 8,574.4 9,446.7 10,667.8
Taiwan 6,143.6 7,394.4 8,761.0 11,316.7 12,708.3
China 4,528.7 5,303.8 6,200.9 7,474.1 9,167.9
India 1,484.0 1,989.5 2,821.1 3,722.8 4,473.2
Pakistan 810.3 1,065.9 1,048.6 1,245.9 1,755.6
Japan 30,952.2 34,299.6 42,680.7 43,150.3 42,008.6
EU-15 31,391.5 35,196.4 44,285.9 46,926.0 46,086.7
Austria 283.5 296.8 260.1 371.1 390.7
Belgium 1,419.0 1,893.8 2,353.5 2,739.8 2,861.0
Denmark 318.5 458.4 666.3 674.0 923.6
Finland 156.7 210.6 263.5 418.2 610.7
France 2,460.2 2,898.2 4,236.5 4,915.9 4,663.4
Germany 6,414.3 7,618.0 10,217.6 10,728.5 9,714.2
Greece 264.5 283.4 442.3 1,073.9 456.6
Ireland 638.2 933.1 1,539.6 1,732.5 2,420.5
Italy 1,683.7 1,926.7 2,687.5 3,796.4 2,112.7
Luxembourg 17.7 20.9 28.5 48.2 0.0
Netherlands 4,508.3 5,693.1 7,587.8 7,703.4 8,151.9
Portugal 133.4 133.7 191.5 237.5 145.8
Spain 824.8 1,122.1 1,670.5 3,328.3 1,844.8
Sweden 297.2 333.3 379.1 882.8 422.9
United Kingdom 11,971.5 11,374.0 11,761.7 8,275.7 11,368.0
Unspecified EU-15 – – – – –
Canada 1,958.7 2,155.1 2,239.8 1,988.2 1,881.9
USA 42,008.2 49,370.7 54,993.7 59,515.5 70,030.4
Australia 3,696.5 4,511.8 5,179.1 6,106.0 6,418.4
New Zealand 565.3 696.8 762.2 812.5 773.8
Others 33,291.0 39,204.2 48,970.4 40,111.9 31,276.6
Total*) 206,637.2 246,764.7 296,696.7 323,361.3 342,670.1
Table V.9.ASEAN 6 Exports
Country of Destination 1993 1994 1995 1996 1997
(1) (2) (3) (4) (5) (6)
Source: ASEAN Trade Statistics Database.Notes: Unspecifed EU represents exports of Thailand to EU of which the data are not available at detailed by country. ASEAN 6 covers Brunei Darussalam, Indonesia, Malaysia, Philippines, Singapore, and Thailand.
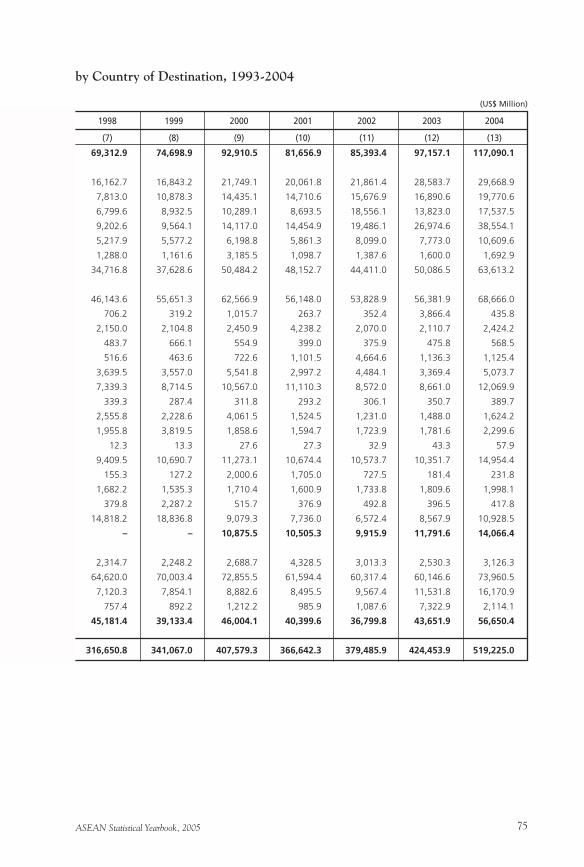
ASEAN Statistical Yearbook, 2005 75
69,312.9 74,698.9 92,910.5 81,656.9 85,393.4 97,157.1 117,090.1
16,162.7 16,843.2 21,749.1 20,061.8 21,861.4 28,583.7 29,668.9
7,813.0 10,878.3 14,435.1 14,710.6 15,676.9 16,890.6 19,770.6
6,799.6 8,932.5 10,289.1 8,693.5 18,556.1 13,823.0 17,537.5
9,202.6 9,564.1 14,117.0 14,454.9 19,486.1 26,974.6 38,554.1
5,217.9 5,577.2 6,198.8 5,861.3 8,099.0 7,773.0 10,609.6
1,288.0 1,161.6 3,185.5 1,098.7 1,387.6 1,600.0 1,692.9
34,716.8 37,628.6 50,484.2 48,152.7 44,411.0 50,086.5 63,613.2
46,143.6 55,651.3 62,566.9 56,148.0 53,828.9 56,381.9 68,666.0
706.2 319.2 1,015.7 263.7 352.4 3,866.4 435.8
2,150.0 2,104.8 2,450.9 4,238.2 2,070.0 2,110.7 2,424.2
483.7 666.1 554.9 399.0 375.9 475.8 568.5
516.6 463.6 722.6 1,101.5 4,664.6 1,136.3 1,125.4
3,639.5 3,557.0 5,541.8 2,997.2 4,484.1 3,369.4 5,073.7
7,339.3 8,714.5 10,567.0 11,110.3 8,572.0 8,661.0 12,069.9
339.3 287.4 311.8 293.2 306.1 350.7 389.7
2,555.8 2,228.6 4,061.5 1,524.5 1,231.0 1,488.0 1,624.2
1,955.8 3,819.5 1,858.6 1,594.7 1,723.9 1,781.6 2,299.6
12.3 13.3 27.6 27.3 32.9 43.3 57.9
9,409.5 10,690.7 11,273.1 10,674.4 10,573.7 10,351.7 14,954.4
155.3 127.2 2,000.6 1,705.0 727.5 181.4 231.8
1,682.2 1,535.3 1,710.4 1,600.9 1,733.8 1,809.6 1,998.1
379.8 2,287.2 515.7 376.9 492.8 396.5 417.8
14,818.2 18,836.8 9,079.3 7,736.0 6,572.4 8,567.9 10,928.5
– – 10,875.5 10,505.3 9,915.9 11,791.6 14,066.4
2,314.7 2,248.2 2,688.7 4,328.5 3,013.3 2,530.3 3,126.3
64,620.0 70,003.4 72,855.5 61,594.4 60,317.4 60,146.6 73,960.5
7,120.3 7,854.1 8,882.6 8,495.5 9,567.4 11,531.8 16,170.9
757.4 892.2 1,212.2 985.9 1,087.6 7,322.9 2,114.1
45,181.4 39,133.4 46,004.1 40,399.6 36,799.8 43,651.9 56,650.4
316,650.8 341,067.0 407,579.3 366,642.3 379,485.9 424,453.9 519,225.0
by Country of Destination, 1993-2004
1998 1999 2000 2001 2002 2003 2004
(7) (8) (9) (10) (11) (12) (13)
(US$ Million)
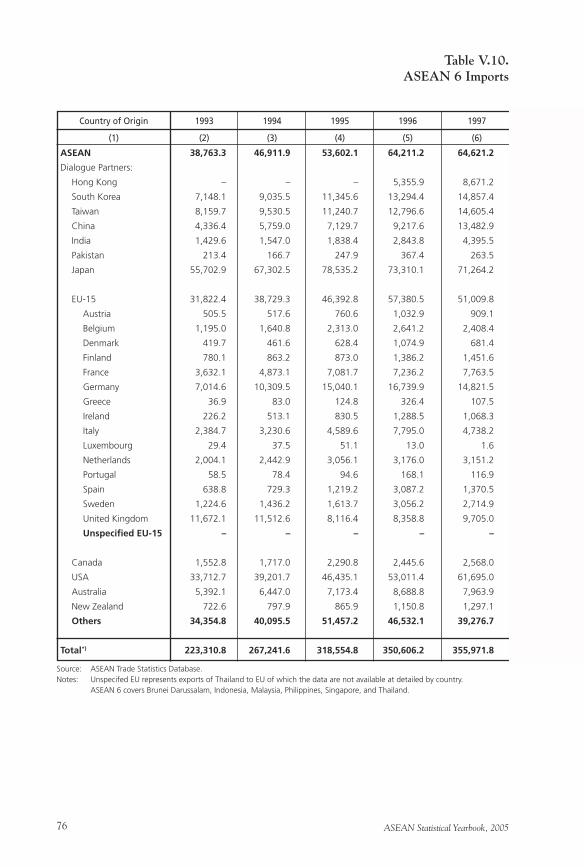
ASEAN Statistical Yearbook, 200576
ASEAN 38,763.3 46,911.9 53,602.1 64,211.2 64,621.2
Dialogue Partners:
Hong Kong – – – 5,355.9 8,671.2
South Korea 7,148.1 9,035.5 11,345.6 13,294.4 14,857.4
Taiwan 8,159.7 9,530.5 11,240.7 12,796.6 14,605.4
China 4,336.4 5,759.0 7,129.7 9,217.6 13,482.9
India 1,429.6 1,547.0 1,838.4 2,843.8 4,395.5
Pakistan 213.4 166.7 247.9 367.4 263.5
Japan 55,702.9 67,302.5 78,535.2 73,310.1 71,264.2
EU-15 31,822.4 38,729.3 46,392.8 57,380.5 51,009.8
Austria 505.5 517.6 760.6 1,032.9 909.1
Belgium 1,195.0 1,640.8 2,313.0 2,641.2 2,408.4
Denmark 419.7 461.6 628.4 1,074.9 681.4
Finland 780.1 863.2 873.0 1,386.2 1,451.6
France 3,632.1 4,873.1 7,081.7 7,236.2 7,763.5
Germany 7,014.6 10,309.5 15,040.1 16,739.9 14,821.5
Greece 36.9 83.0 124.8 326.4 107.5
Ireland 226.2 513.1 830.5 1,288.5 1,068.3
Italy 2,384.7 3,230.6 4,589.6 7,795.0 4,738.2
Luxembourg 29.4 37.5 51.1 13.0 1.6
Netherlands 2,004.1 2,442.9 3,056.1 3,176.0 3,151.2
Portugal 58.5 78.4 94.6 168.1 116.9
Spain 638.8 729.3 1,219.2 3,087.2 1,370.5
Sweden 1,224.6 1,436.2 1,613.7 3,056.2 2,714.9
United Kingdom 11,672.1 11,512.6 8,116.4 8,358.8 9,705.0
Unspecified EU-15 – – – – –
Canada 1,552.8 1,717.0 2,290.8 2,445.6 2,568.0
USA 33,712.7 39,201.7 46,435.1 53,011.4 61,695.0
Australia 5,392.1 6,447.0 7,173.4 8,688.8 7,963.9
New Zealand 722.6 797.9 865.9 1,150.8 1,297.1
Others 34,354.8 40,095.5 51,457.2 46,532.1 39,276.7
Total*) 223,310.8 267,241.6 318,554.8 350,606.2 355,971.8
Table V.10.ASEAN 6 Imports
Country of Origin 1993 1994 1995 1996 1997
(1) (2) (3) (4) (5) (6)
Source: ASEAN Trade Statistics Database.Notes: Unspecifed EU represents exports of Thailand to EU of which the data are not available at detailed by country. ASEAN 6 covers Brunei Darussalam, Indonesia, Malaysia, Philippines, Singapore, and Thailand.
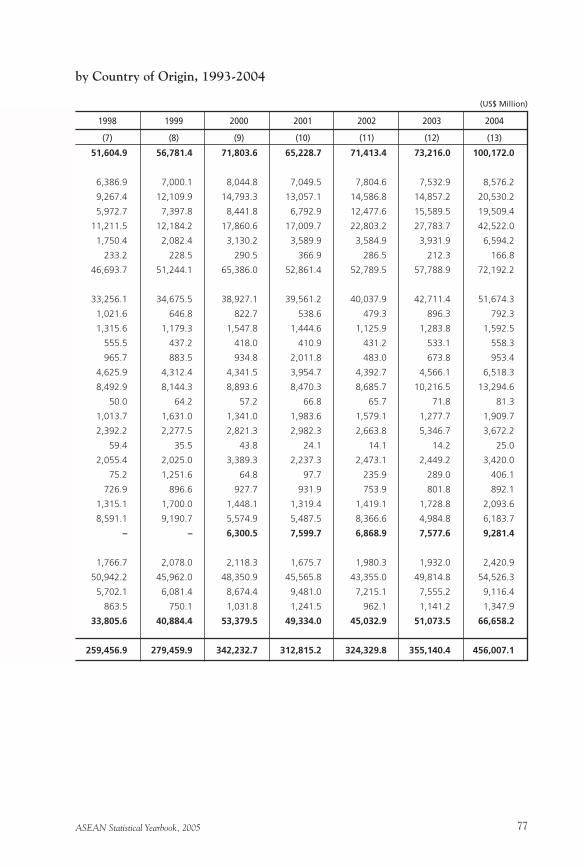
ASEAN Statistical Yearbook, 2005 77
51,604.9 56,781.4 71,803.6 65,228.7 71,413.4 73,216.0 100,172.0
6,386.9 7,000.1 8,044.8 7,049.5 7,804.6 7,532.9 8,576.2
9,267.4 12,109.9 14,793.3 13,057.1 14,586.8 14,857.2 20,530.2
5,972.7 7,397.8 8,441.8 6,792.9 12,477.6 15,589.5 19,509.4
11,211.5 12,184.2 17,860.6 17,009.7 22,803.2 27,783.7 42,522.0
1,750.4 2,082.4 3,130.2 3,589.9 3,584.9 3,931.9 6,594.2
233.2 228.5 290.5 366.9 286.5 212.3 166.8
46,693.7 51,244.1 65,386.0 52,861.4 52,789.5 57,788.9 72,192.2
33,256.1 34,675.5 38,927.1 39,561.2 40,037.9 42,711.4 51,674.3
1,021.6 646.8 822.7 538.6 479.3 896.3 792.3
1,315.6 1,179.3 1,547.8 1,444.6 1,125.9 1,283.8 1,592.5
555.5 437.2 418.0 410.9 431.2 533.1 558.3
965.7 883.5 934.8 2,011.8 483.0 673.8 953.4
4,625.9 4,312.4 4,341.5 3,954.7 4,392.7 4,566.1 6,518.3
8,492.9 8,144.3 8,893.6 8,470.3 8,685.7 10,216.5 13,294.6
50.0 64.2 57.2 66.8 65.7 71.8 81.3
1,013.7 1,631.0 1,341.0 1,983.6 1,579.1 1,277.7 1,909.7
2,392.2 2,277.5 2,821.3 2,982.3 2,663.8 5,346.7 3,672.2
59.4 35.5 43.8 24.1 14.1 14.2 25.0
2,055.4 2,025.0 3,389.3 2,237.3 2,473.1 2,449.2 3,420.0
75.2 1,251.6 64.8 97.7 235.9 289.0 406.1
726.9 896.6 927.7 931.9 753.9 801.8 892.1
1,315.1 1,700.0 1,448.1 1,319.4 1,419.1 1,728.8 2,093.6
8,591.1 9,190.7 5,574.9 5,487.5 8,366.6 4,984.8 6,183.7
– – 6,300.5 7,599.7 6,868.9 7,577.6 9,281.4
1,766.7 2,078.0 2,118.3 1,675.7 1,980.3 1,932.0 2,420.9
50,942.2 45,962.0 48,350.9 45,565.8 43,355.0 49,814.8 54,526.3
5,702.1 6,081.4 8,674.4 9,481.0 7,215.1 7,555.2 9,116.4
863.5 750.1 1,031.8 1,241.5 962.1 1,141.2 1,347.9
33,805.6 40,884.4 53,379.5 49,334.0 45,032.9 51,073.5 66,658.2
259,456.9 279,459.9 342,232.7 312,815.2 324,329.8 355,140.4 456,007.1
by Country of Origin, 1993-2004
1998 1999 2000 2001 2002 2003 2004
(7) (8) (9) (10) (11) (12) (13)
(US$ Million)
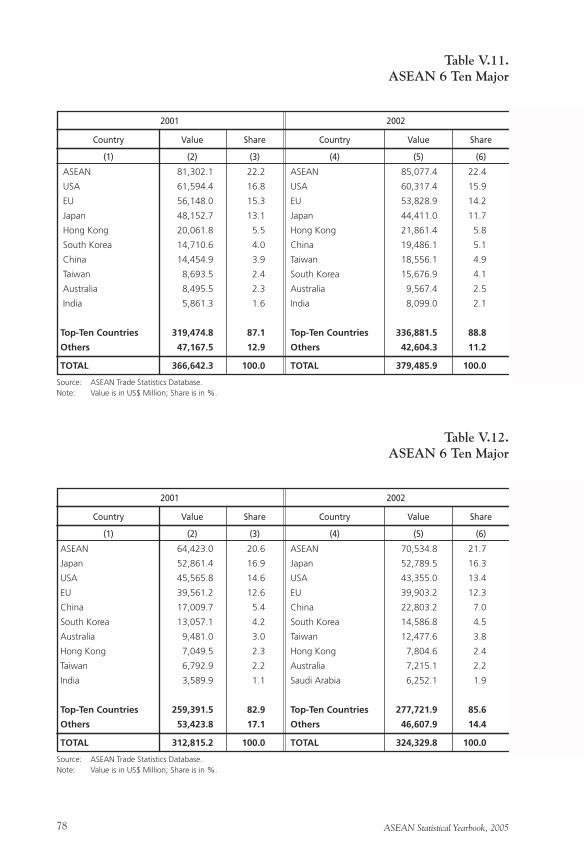
ASEAN Statistical Yearbook, 200578
ASEAN 81,302.1 22.2 ASEAN 85,077.4 22.4
USA 61,594.4 16.8 USA 60,317.4 15.9
EU 56,148.0 15.3 EU 53,828.9 14.2
Japan 48,152.7 13.1 Japan 44,411.0 11.7
Hong Kong 20,061.8 5.5 Hong Kong 21,861.4 5.8
South Korea 14,710.6 4.0 China 19,486.1 5.1
China 14,454.9 3.9 Taiwan 18,556.1 4.9
Taiwan 8,693.5 2.4 South Korea 15,676.9 4.1
Australia 8,495.5 2.3 Australia 9,567.4 2.5
India 5,861.3 1.6 India 8,099.0 2.1
Top-Ten Countries 319,474.8 87.1 Top-Ten Countries 336,881.5 88.8
Others 47,167.5 12.9 Others 42,604.3 11.2
TOTAL 366,642.3 100.0 TOTAL 379,485.9 100.0
Table V.11.ASEAN 6 Ten Major
Country Value Share
(1) (2) (3)
Source: ASEAN Trade Statistics Database.Note: Value is in US$ Million; Share is in %.
2001
Country Value Share
(4) (5) (6)
2002
ASEAN 64,423.0 20.6 ASEAN 70,534.8 21.7
Japan 52,861.4 16.9 Japan 52,789.5 16.3
USA 45,565.8 14.6 USA 43,355.0 13.4
EU 39,561.2 12.6 EU 39,903.2 12.3
China 17,009.7 5.4 China 22,803.2 7.0
South Korea 13,057.1 4.2 South Korea 14,586.8 4.5
Australia 9,481.0 3.0 Taiwan 12,477.6 3.8
Hong Kong 7,049.5 2.3 Hong Kong 7,804.6 2.4
Taiwan 6,792.9 2.2 Australia 7,215.1 2.2
India 3,589.9 1.1 Saudi Arabia 6,252.1 1.9
Top-Ten Countries 259,391.5 82.9 Top-Ten Countries 277,721.9 85.6
Others 53,423.8 17.1 Others 46,607.9 14.4
TOTAL 312,815.2 100.0 TOTAL 324,329.8 100.0
Table V.12.ASEAN 6 Ten Major
Country Value Share
(1) (2) (3)
Source: ASEAN Trade Statistics Database.Note: Value is in US$ Million; Share is in %.
2001
Country Value Share
(4) (5) (6)
2002
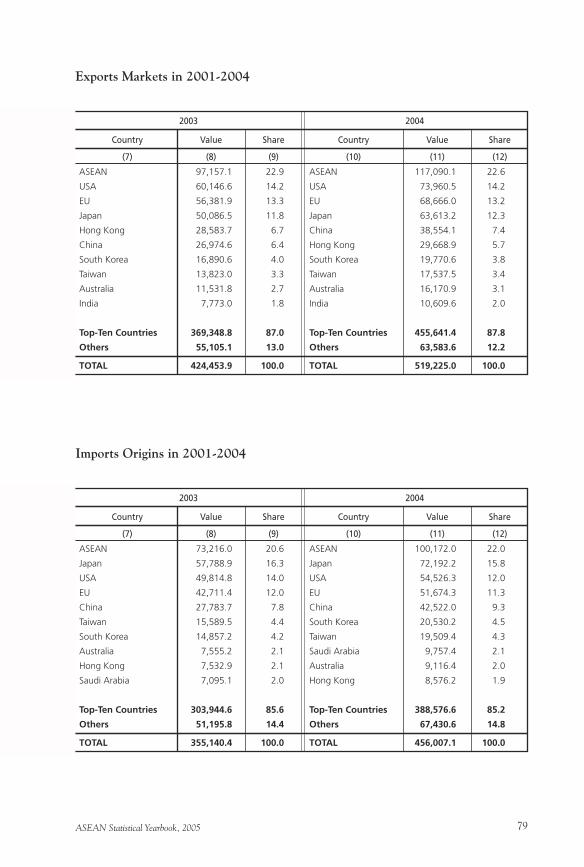
ASEAN Statistical Yearbook, 2005 79
Exports Markets in 2001-2004
ASEAN 97,157.1 22.9 ASEAN 117,090.1 22.6
USA 60,146.6 14.2 USA 73,960.5 14.2
EU 56,381.9 13.3 EU 68,666.0 13.2
Japan 50,086.5 11.8 Japan 63,613.2 12.3
Hong Kong 28,583.7 6.7 China 38,554.1 7.4
China 26,974.6 6.4 Hong Kong 29,668.9 5.7
South Korea 16,890.6 4.0 South Korea 19,770.6 3.8
Taiwan 13,823.0 3.3 Taiwan 17,537.5 3.4
Australia 11,531.8 2.7 Australia 16,170.9 3.1
India 7,773.0 1.8 India 10,609.6 2.0
Top-Ten Countries 369,348.8 87.0 Top-Ten Countries 455,641.4 87.8
Others 55,105.1 13.0 Others 63,583.6 12.2
TOTAL 424,453.9 100.0 TOTAL 519,225.0 100.0
Country Value Share
(7) (8) (9)
2003
Country Value Share
(10) (11) (12)
2004
Imports Origins in 2001-2004
ASEAN 73,216.0 20.6 ASEAN 100,172.0 22.0
Japan 57,788.9 16.3 Japan 72,192.2 15.8
USA 49,814.8 14.0 USA 54,526.3 12.0
EU 42,711.4 12.0 EU 51,674.3 11.3
China 27,783.7 7.8 China 42,522.0 9.3
Taiwan 15,589.5 4.4 South Korea 20,530.2 4.5
South Korea 14,857.2 4.2 Taiwan 19,509.4 4.3
Australia 7,555.2 2.1 Saudi Arabia 9,757.4 2.1
Hong Kong 7,532.9 2.1 Australia 9,116.4 2.0
Saudi Arabia 7,095.1 2.0 Hong Kong 8,576.2 1.9
Top-Ten Countries 303,944.6 85.6 Top-Ten Countries 388,576.6 85.2
Others 51,195.8 14.4 Others 67,430.6 14.8
TOTAL 355,140.4 100.0 TOTAL 456,007.1 100.0
Country Value Share
(7) (8) (9)
2003
Country Value Share
(10) (11) (12)
2004
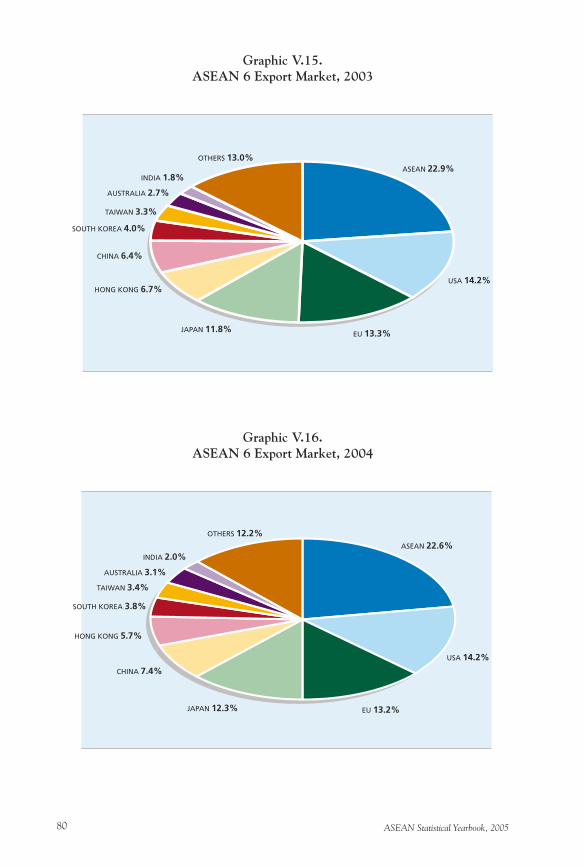
ASEAN Statistical Yearbook, 200580
Graphic V.15.ASEAN 6 Export Market, 2003
Graphic V.16.ASEAN 6 Export Market, 2004
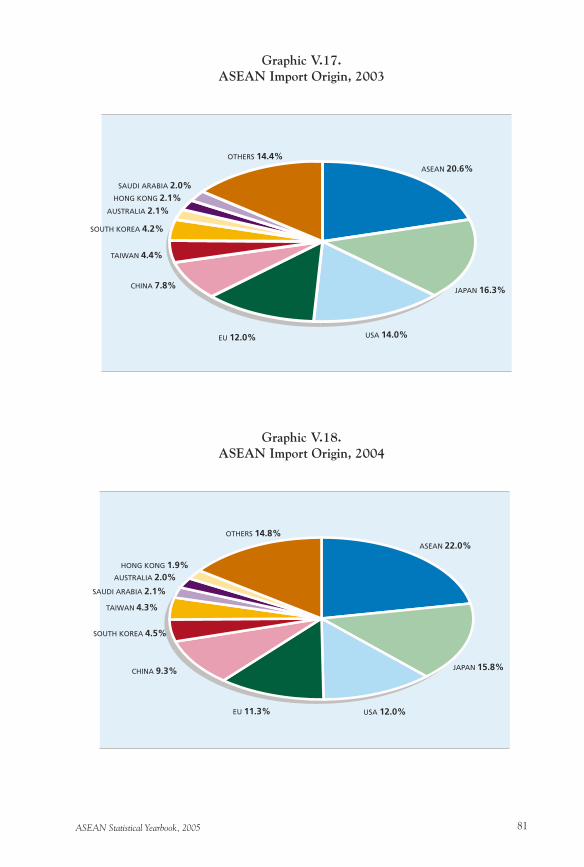
ASEAN Statistical Yearbook, 2005 81
Graphic V.17.ASEAN Import Origin, 2003
Graphic V.18.ASEAN Import Origin, 2004
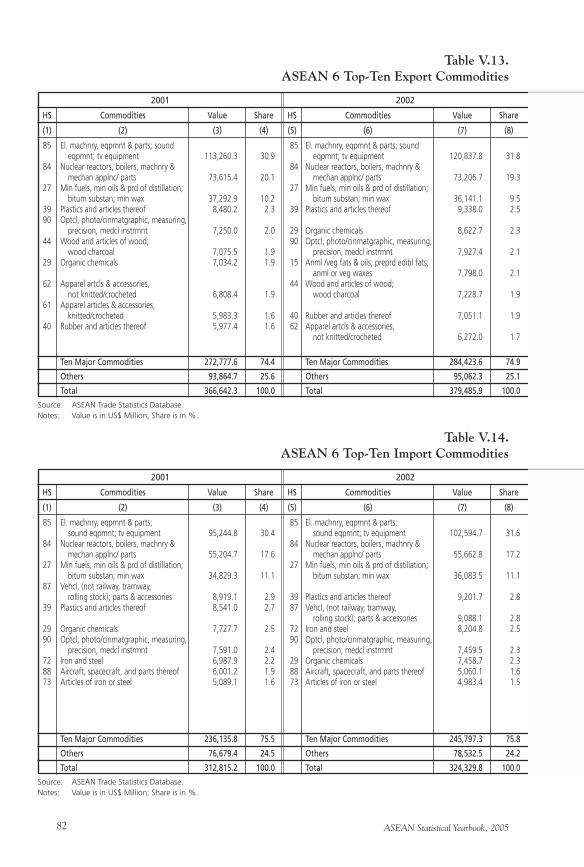
ASEAN Statistical Yearbook, 200582
Table V.13.ASEAN 6 Top-Ten Export Commodities
85 El. machnry, eqpmnt & parts; sound 85 El. machnry, eqpmnt & parts; sound eqpmnt; tv equipment 113,260.3 30.9 eqpmnt; tv equipment 120,837.8 31.8 84 Nuclear reactors, boilers, machnry & 84 Nuclear reactors, boilers, machnry & mechan applnc/ parts 73,615.4 20.1 mechan applnc/ parts 73,206.7 19.3 27 Min fuels, min oils & prd of distillation; 27 Min fuels, min oils & prd of distillation; bitum substan; min wax 37,292.9 10.2 bitum substan; min wax 36,141.1 9.5 39 Plastics and articles thereof 8,480.2 2.3 39 Plastics and articles thereof 9,338.0 2.5 90 Optcl, photo/cinmatgraphic, measuring, precision, medcl instrmnt 7,250.0 2.0 29 Organic chemicals 8,622.7 2.3 44 Wood and articles of wood; 90 Optcl, photo/cinmatgraphic, measuring, wood charcoal 7,075.5 1.9 precision, medcl instrmnt 7,927.4 2.1 29 Organic chemicals 7,034.2 1.9 15 Anml /veg fats & oils; preprd edibl fats; anml or veg waxes 7,798.0 2.1 62 Apparel artcls & accessories, 44 Wood and articles of wood; not knitted/crocheted 6,808.4 1.9 wood charcoal 7,228.7 1.9 61 Apparel articles & accessories, knitted/crocheted 5,983.3 1.6 40 Rubber and articles thereof 7,051.1 1.9 40 Rubber and articles thereof 5,977.4 1.6 62 Apparel artcls & accessories, not knitted/crocheted 6,272.0 1.7
Ten Major Commodities 272,777.6 74.4 Ten Major Commodities 284,423.6 74.9
Others 93,864.7 25.6 Others 95,062.3 25.1
Total 366,642.3 100.0 Total 379,485.9 100.0
2001
HS Commodities Value Share
Source: ASEAN Trade Statistics Database.Notes: Value is in US$ Million; Share is in %.
(1) (2) (3) (4)
2002
HS Commodities Value Share
(5) (6) (7) (8)
Table V.14.ASEAN 6 Top-Ten Import Commodities
85 El. machnry, eqpmnt & parts; 85 El. machnry, eqpmnt & parts; sound eqpmnt; tv equipment 95,244.8 30.4 sound eqpmnt; tv equipment 102,594.7 31.6 84 Nuclear reactors, boilers, machnry & 84 Nuclear reactors, boilers, machnry & mechan applnc/ parts 55,204.7 17.6 mechan applnc/ parts 55,662.8 17.2 27 Min fuels, min oils & prd of distillation; 27 Min fuels, min oils & prd of distillation; bitum substan; min wax 34,829.3 11.1 bitum substan; min wax 36,083.5 11.1 87 Vehcl, (not railway, tramway, rolling stock); parts & accessories 8,919.1 2.9 39 Plastics and articles thereof 9,201.7 2.8 39 Plastics and articles thereof 8,541.0 2.7 87 Vehcl, (not railway, tramway, rolling stock); parts & accessories 9,088.1 2.8 29 Organic chemicals 7,727.7 2.5 72 Iron and steel 8,204.8 2.5 90 Optcl, photo/cinmatgraphic, measuring, 90 Optcl, photo/cinmatgraphic, measuring, precision, medcl instrmnt 7,591.0 2.4 precision, medcl instrmnt 7,459.5 2.3 72 Iron and steel 6,987.9 2.2 29 Organic chemicals 7,458.7 2.3 88 Aircraft, spacecraft, and parts thereof 6,001.2 1.9 88 Aircraft, spacecraft, and parts thereof 5,060.1 1.6 73 Articles of iron or steel 5,089.1 1.6 73 Articles of iron or steel 4,983.4 1.5
Ten Major Commodities 236,135.8 75.5 Ten Major Commodities 245,797.3 75.8
Others 76,679.4 24.5 Others 78,532.5 24.2
Total 312,815.2 100.0 Total 324,329.8 100.0
2001
HS Commodities Value Share
Source: ASEAN Trade Statistics Database.Notes: Value is in US$ Million; Share is in %.
(1) (2) (3) (4)
2002
HS Commodities Value Share
(5) (6) (7) (8)
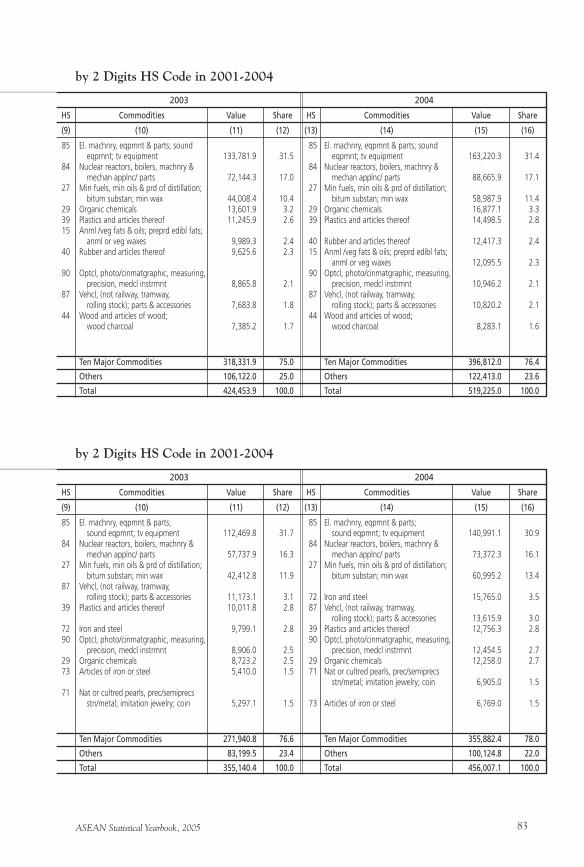
ASEAN Statistical Yearbook, 2005 83
by 2 Digits HS Code in 2001-2004
85 El. machnry, eqpmnt & parts; sound 85 El. machnry, eqpmnt & parts; sound eqpmnt; tv equipment 133,781.9 31.5 eqpmnt; tv equipment 163,220.3 31.4 84 Nuclear reactors, boilers, machnry & 84 Nuclear reactors, boilers, machnry & mechan applnc/ parts 72,144.3 17.0 mechan applnc/ parts 88,665.9 17.1 27 Min fuels, min oils & prd of distillation; 27 Min fuels, min oils & prd of distillation; bitum substan; min wax 44,008.4 10.4 bitum substan; min wax 58,987.9 11.4 29 Organic chemicals 13,601.9 3.2 29 Organic chemicals 16,877.1 3.3 39 Plastics and articles thereof 11,245.9 2.6 39 Plastics and articles thereof 14,498.5 2.8 15 Anml /veg fats & oils; preprd edibl fats; anml or veg waxes 9,989.3 2.4 40 Rubber and articles thereof 12,417.3 2.4 40 Rubber and articles thereof 9,625.6 2.3 15 Anml /veg fats & oils; preprd edibl fats; anml or veg waxes 12,095.5 2.3 90 Optcl, photo/cinmatgraphic, measuring, 90 Optcl, photo/cinmatgraphic, measuring, precision, medcl instrmnt 8,865.8 2.1 precision, medcl instrmnt 10,946.2 2.1 87 Vehcl, (not railway, tramway, 87 Vehcl, (not railway, tramway, rolling stock); parts & accessories 7,683.8 1.8 rolling stock); parts & accessories 10,820.2 2.1 44 Wood and articles of wood; 44 Wood and articles of wood; wood charcoal 7,385.2 1.7 wood charcoal 8,283.1 1.6
Ten Major Commodities 318,331.9 75.0 Ten Major Commodities 396,812.0 76.4
Others 106,122.0 25.0 Others 122,413.0 23.6
Total 424,453.9 100.0 Total 519,225.0 100.0
2003
HS Commodities Value Share
(9) (10) (11) (12)
2004
HS Commodities Value Share
(13) (14) (15) (16)
by 2 Digits HS Code in 2001-2004
85 El. machnry, eqpmnt & parts; 85 El. machnry, eqpmnt & parts; sound eqpmnt; tv equipment 112,469.8 31.7 sound eqpmnt; tv equipment 140,991.1 30.9 84 Nuclear reactors, boilers, machnry & 84 Nuclear reactors, boilers, machnry & mechan applnc/ parts 57,737.9 16.3 mechan applnc/ parts 73,372.3 16.1 27 Min fuels, min oils & prd of distillation; 27 Min fuels, min oils & prd of distillation; bitum substan; min wax 42,412.8 11.9 bitum substan; min wax 60,995.2 13.4 87 Vehcl, (not railway, tramway, rolling stock); parts & accessories 11,173.1 3.1 72 Iron and steel 15,765.0 3.5 39 Plastics and articles thereof 10,011.8 2.8 87 Vehcl, (not railway, tramway, rolling stock); parts & accessories 13,615.9 3.0 72 Iron and steel 9,799.1 2.8 39 Plastics and articles thereof 12,756.3 2.8 90 Optcl, photo/cinmatgraphic, measuring, 90 Optcl, photo/cinmatgraphic, measuring, precision, medcl instrmnt 8,906.0 2.5 precision, medcl instrmnt 12,454.5 2.7 29 Organic chemicals 8,723.2 2.5 29 Organic chemicals 12,258.0 2.7 73 Articles of iron or steel 5,410.0 1.5 71 Nat or cultred pearls, prec/semiprecs stn/metal; imitation jewelry; coin 6,905.0 1.5 71 Nat or cultred pearls, prec/semiprecs stn/metal; imitation jewelry; coin 5,297.1 1.5 73 Articles of iron or steel 6,769.0 1.5
Ten Major Commodities 271,940.8 76.6 Ten Major Commodities 355,882.4 78.0
Others 83,199.5 23.4 Others 100,124.8 22.0
Total 355,140.4 100.0 Total 456,007.1 100.0
2003
HS Commodities Value Share
(9) (10) (11) (12)
2004
HS Commodities Value Share
(13) (14) (15) (16)
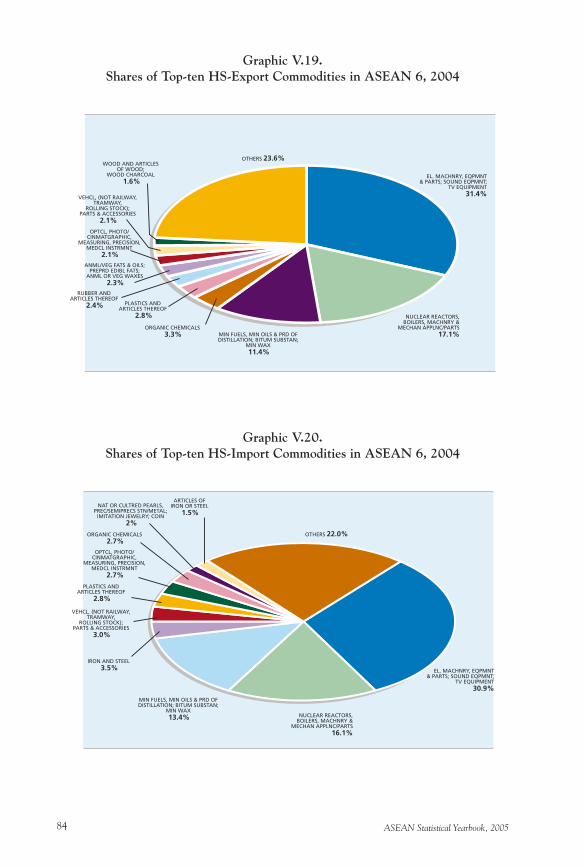
ASEAN Statistical Yearbook, 200584
Graphic V.19.Shares of Top-ten HS-Export Commodities in ASEAN 6, 2004
Graphic V.20.Shares of Top-ten HS-Import Commodities in ASEAN 6, 2004
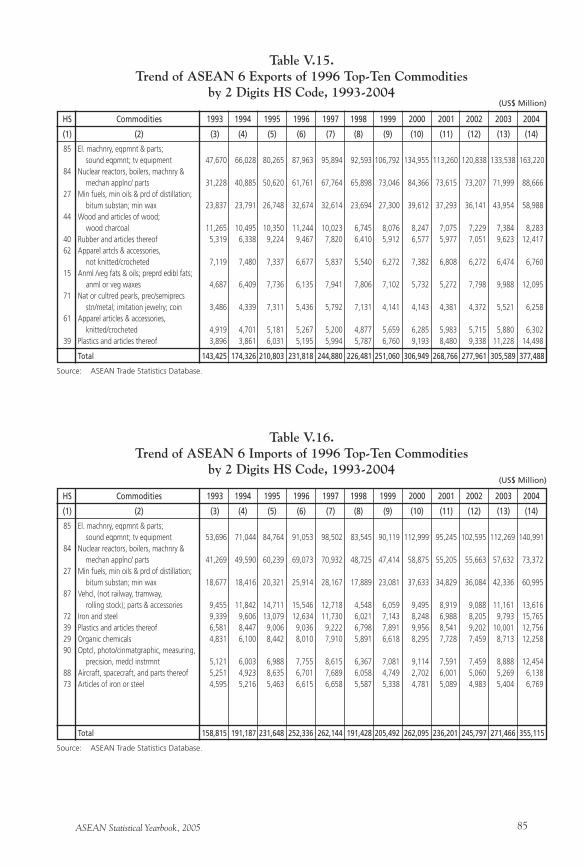
ASEAN Statistical Yearbook, 2005 85
Table V.15.Trend of ASEAN 6 Exports of 1996 Top-Ten Commodities
by 2 Digits HS Code, 1993-2004
HS Commodities 1993 1994 1995 1996 1997 1998 1999 2000 2001 2002 2003 2004
(1) (2) (3) (4) (5) (6) (7) (8) (9) (10) (11) (12) (13) (14)
85 El. machnry, eqpmnt & parts; sound eqpmnt; tv equipment 47,670 66,028 80,265 87,963 95,894 92,593 106,792 134,955 113,260 120,838 133,538 163,220 84 Nuclear reactors, boilers, machnry & mechan applnc/ parts 31,228 40,885 50,620 61,761 67,764 65,898 73,046 84,366 73,615 73,207 71,999 88,666 27 Min fuels, min oils & prd of distillation; bitum substan; min wax 23,837 23,791 26,748 32,674 32,614 23,694 27,300 39,612 37,293 36,141 43,954 58,988 44 Wood and articles of wood; wood charcoal 11,265 10,495 10,350 11,244 10,023 6,745 8,076 8,247 7,075 7,229 7,384 8,283 40 Rubber and articles thereof 5,319 6,338 9,224 9,467 7,820 6,410 5,912 6,577 5,977 7,051 9,623 12,417 62 Apparel artcls & accessories, not knitted/crocheted 7,119 7,480 7,337 6,677 5,837 5,540 6,272 7,382 6,808 6,272 6,474 6,760 15 Anml /veg fats & oils; preprd edibl fats; anml or veg waxes 4,687 6,409 7,736 6,135 7,941 7,806 7,102 5,732 5,272 7,798 9,988 12,095 71 Nat or cultred pearls, prec/semiprecs stn/metal; imitation jewelry; coin 3,486 4,339 7,311 5,436 5,792 7,131 4,141 4,143 4,381 4,372 5,521 6,258 61 Apparel articles & accessories, knitted/crocheted 4,919 4,701 5,181 5,267 5,200 4,877 5,659 6,285 5,983 5,715 5,880 6,302 39 Plastics and articles thereof 3,896 3,861 6,031 5,195 5,994 5,787 6,760 9,193 8,480 9,338 11,228 14,498
Total 143,425 174,326 210,803 231,818 244,880 226,481 251,060 306,949 268,766 277,961 305,589 377,488
Source: ASEAN Trade Statistics Database.
(US$ Million)
Table V.16.Trend of ASEAN 6 Imports of 1996 Top-Ten Commodities
by 2 Digits HS Code, 1993-2004
HS Commodities 1993 1994 1995 1996 1997 1998 1999 2000 2001 2002 2003 2004
(1) (2) (3) (4) (5) (6) (7) (8) (9) (10) (11) (12) (13) (14)
85 El. machnry, eqpmnt & parts; sound eqpmnt; tv equipment 53,696 71,044 84,764 91,053 98,502 83,545 90,119 112,999 95,245 102,595 112,269 140,991 84 Nuclear reactors, boilers, machnry & mechan applnc/ parts 41,269 49,590 60,239 69,073 70,932 48,725 47,414 58,875 55,205 55,663 57,632 73,372 27 Min fuels, min oils & prd of distillation; bitum substan; min wax 18,677 18,416 20,321 25,914 28,167 17,889 23,081 37,633 34,829 36,084 42,336 60,995 87 Vehcl, (not railway, tramway, rolling stock); parts & accessories 9,455 11,842 14,711 15,546 12,718 4,548 6,059 9,495 8,919 9,088 11,161 13,616 72 Iron and steel 9,339 9,606 13,079 12,634 11,730 6,021 7,143 8,248 6,988 8,205 9,793 15,765 39 Plastics and articles thereof 6,581 8,447 9,006 9,036 9,222 6,798 7,891 9,956 8,541 9,202 10,001 12,756 29 Organic chemicals 4,831 6,100 8,442 8,010 7,910 5,891 6,618 8,295 7,728 7,459 8,713 12,258 90 Optcl, photo/cinmatgraphic, measuring, precision, medcl instrmnt 5,121 6,003 6,988 7,755 8,615 6,367 7,081 9,114 7,591 7,459 8,888 12,454 88 Aircraft, spacecraft, and parts thereof 5,251 4,923 8,635 6,701 7,689 6,058 4,749 2,702 6,001 5,060 5,269 6,138 73 Articles of iron or steel 4,595 5,216 5,463 6,615 6,658 5,587 5,338 4,781 5,089 4,983 5,404 6,769
Total 158,815 191,187 231,648 252,336 262,144 191,428 205,492 262,095 236,201 245,797 271,466 355,115
Source: ASEAN Trade Statistics Database.
(US$ Million)
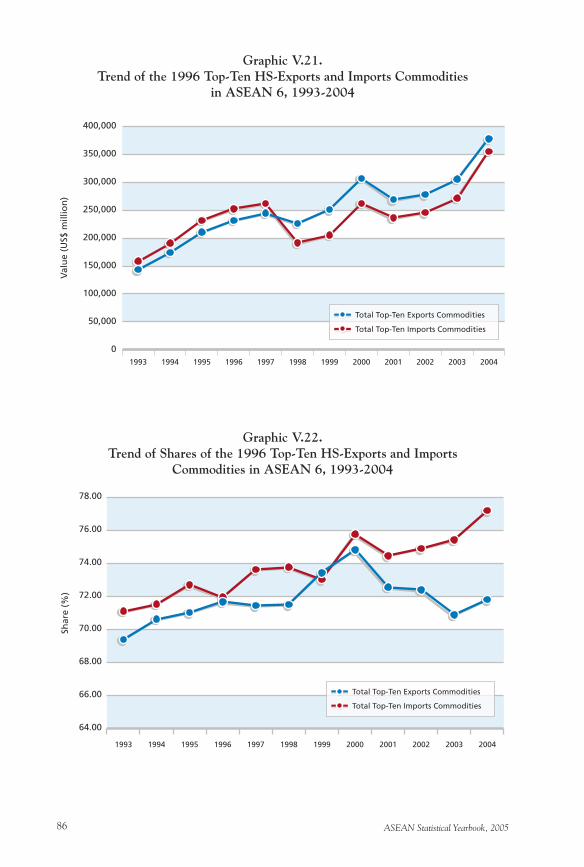
ASEAN Statistical Yearbook, 200586
Graphic V.21.Trend of the 1996 Top-Ten HS-Exports and Imports Commodities
in ASEAN 6, 1993-2004
Graphic V.22.Trend of Shares of the 1996 Top-Ten HS-Exports and Imports
Commodities in ASEAN 6, 1993-2004
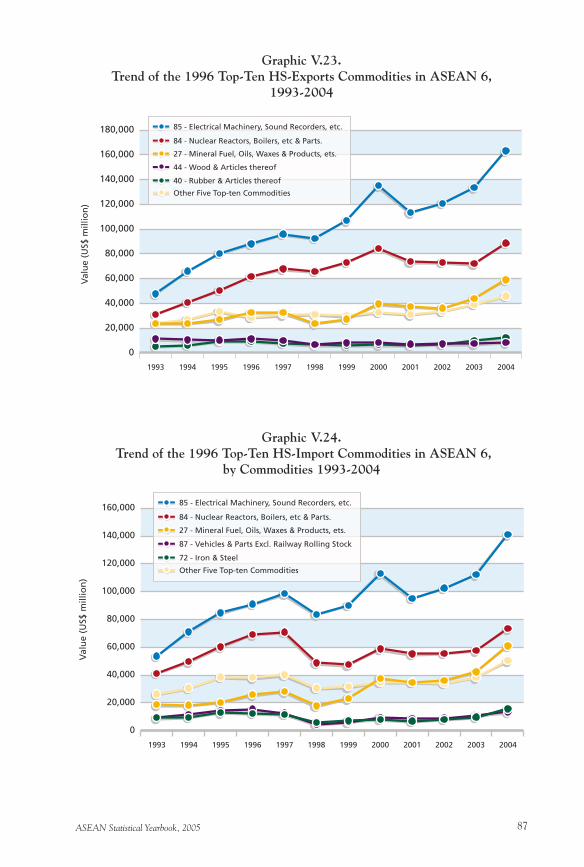
ASEAN Statistical Yearbook, 2005 87
Graphic V.23.Trend of the 1996 Top-Ten HS-Exports Commodities in ASEAN 6,
1993-2004
Graphic V.24. Trend of the 1996 Top-Ten HS-Import Commodities in ASEAN 6,
by Commodities 1993-2004
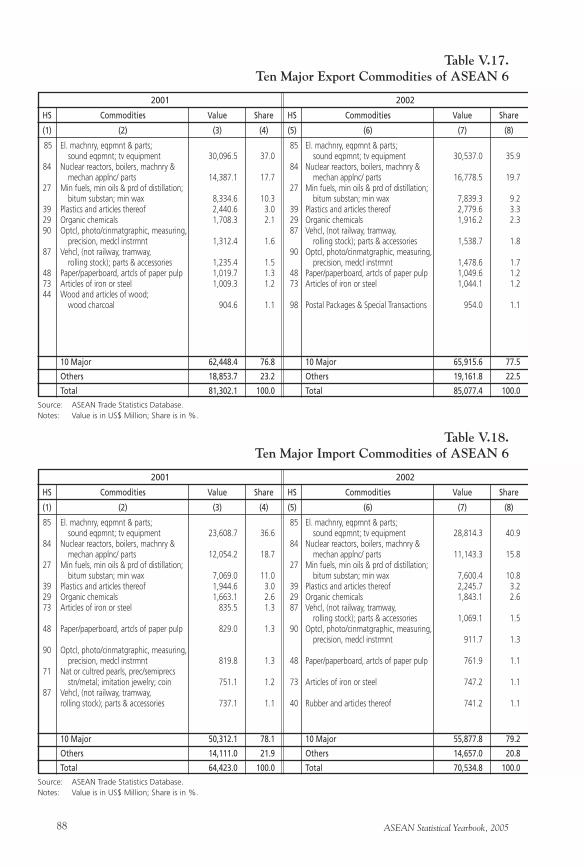
ASEAN Statistical Yearbook, 200588
Table V.17.Ten Major Export Commodities of ASEAN 6
85 El. machnry, eqpmnt & parts; 85 El. machnry, eqpmnt & parts; sound eqpmnt; tv equipment 30,096.5 37.0 sound eqpmnt; tv equipment 30,537.0 35.9 84 Nuclear reactors, boilers, machnry & 84 Nuclear reactors, boilers, machnry & mechan applnc/ parts 14,387.1 17.7 mechan applnc/ parts 16,778.5 19.7 27 Min fuels, min oils & prd of distillation; 27 Min fuels, min oils & prd of distillation; bitum substan; min wax 8,334.6 10.3 bitum substan; min wax 7,839.3 9.2 39 Plastics and articles thereof 2,440.6 3.0 39 Plastics and articles thereof 2,779.6 3.3 29 Organic chemicals 1,708.3 2.1 29 Organic chemicals 1,916.2 2.3 90 Optcl, photo/cinmatgraphic, measuring, 87 Vehcl, (not railway, tramway, precision, medcl instrmnt 1,312.4 1.6 rolling stock); parts & accessories 1,538.7 1.8 87 Vehcl, (not railway, tramway, 90 Optcl, photo/cinmatgraphic, measuring, rolling stock); parts & accessories 1,235.4 1.5 precision, medcl instrmnt 1,478.6 1.7 48 Paper/paperboard, artcls of paper pulp 1,019.7 1.3 48 Paper/paperboard, artcls of paper pulp 1,049.6 1.2 73 Articles of iron or steel 1,009.3 1.2 73 Articles of iron or steel 1,044.1 1.2 44 Wood and articles of wood; wood charcoal 904.6 1.1 98 Postal Packages & Special Transactions 954.0 1.1
10 Major 62,448.4 76.8 10 Major 65,915.6 77.5
Others 18,853.7 23.2 Others 19,161.8 22.5
Total 81,302.1 100.0 Total 85,077.4 100.0
2001
HS Commodities Value Share
Source: ASEAN Trade Statistics Database.Notes: Value is in US$ Million; Share is in %.
(1) (2) (3) (4)
2002
HS Commodities Value Share
(5) (6) (7) (8)
Table V.18.Ten Major Import Commodities of ASEAN 6
85 El. machnry, eqpmnt & parts; 85 El. machnry, eqpmnt & parts; sound eqpmnt; tv equipment 23,608.7 36.6 sound eqpmnt; tv equipment 28,814.3 40.9 84 Nuclear reactors, boilers, machnry & 84 Nuclear reactors, boilers, machnry & mechan applnc/ parts 12,054.2 18.7 mechan applnc/ parts 11,143.3 15.8 27 Min fuels, min oils & prd of distillation; 27 Min fuels, min oils & prd of distillation; bitum substan; min wax 7,069.0 11.0 bitum substan; min wax 7,600.4 10.8 39 Plastics and articles thereof 1,944.6 3.0 39 Plastics and articles thereof 2,245.7 3.2 29 Organic chemicals 1,663.1 2.6 29 Organic chemicals 1,843.1 2.6 73 Articles of iron or steel 835.5 1.3 87 Vehcl, (not railway, tramway, rolling stock); parts & accessories 1,069.1 1.5 48 Paper/paperboard, artcls of paper pulp 829.0 1.3 90 Optcl, photo/cinmatgraphic, measuring, precision, medcl instrmnt 911.7 1.3 90 Optcl, photo/cinmatgraphic, measuring, precision, medcl instrmnt 819.8 1.3 48 Paper/paperboard, artcls of paper pulp 761.9 1.1 71 Nat or cultred pearls, prec/semiprecs stn/metal; imitation jewelry; coin 751.1 1.2 73 Articles of iron or steel 747.2 1.1 87 Vehcl, (not railway, tramway, rolling stock); parts & accessories 737.1 1.1 40 Rubber and articles thereof 741.2 1.1
10 Major 50,312.1 78.1 10 Major 55,877.8 79.2
Others 14,111.0 21.9 Others 14,657.0 20.8
Total 64,423.0 100.0 Total 70,534.8 100.0
2001
HS Commodities Value Share
Source: ASEAN Trade Statistics Database.Notes: Value is in US$ Million; Share is in %.
(1) (2) (3) (4)
2002
HS Commodities Value Share
(5) (6) (7) (8)
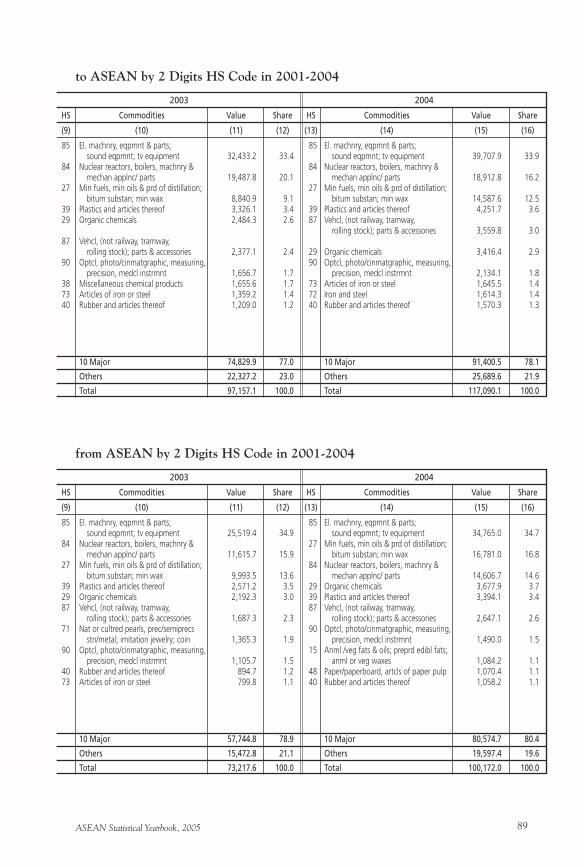
ASEAN Statistical Yearbook, 2005 89
to ASEAN by 2 Digits HS Code in 2001-2004
85 El. machnry, eqpmnt & parts; 85 El. machnry, eqpmnt & parts; sound eqpmnt; tv equipment 32,433.2 33.4 sound eqpmnt; tv equipment 39,707.9 33.9 84 Nuclear reactors, boilers, machnry & 84 Nuclear reactors, boilers, machnry & mechan applnc/ parts 19,487.8 20.1 mechan applnc/ parts 18,912.8 16.2 27 Min fuels, min oils & prd of distillation; 27 Min fuels, min oils & prd of distillation; bitum substan; min wax 8,840.9 9.1 bitum substan; min wax 14,587.6 12.5 39 Plastics and articles thereof 3,326.1 3.4 39 Plastics and articles thereof 4,251.7 3.6 29 Organic chemicals 2,484.3 2.6 87 Vehcl, (not railway, tramway, rolling stock); parts & accessories 3,559.8 3.0 87 Vehcl, (not railway, tramway, rolling stock); parts & accessories 2,377.1 2.4 29 Organic chemicals 3,416.4 2.9 90 Optcl, photo/cinmatgraphic, measuring, 90 Optcl, photo/cinmatgraphic, measuring, precision, medcl instrmnt 1,656.7 1.7 precision, medcl instrmnt 2,134.1 1.8 38 Miscellaneous chemical products 1,655.6 1.7 73 Articles of iron or steel 1,645.5 1.4 73 Articles of iron or steel 1,359.2 1.4 72 Iron and steel 1,614.3 1.4 40 Rubber and articles thereof 1,209.0 1.2 40 Rubber and articles thereof 1,570.3 1.3
10 Major 74,829.9 77.0 10 Major 91,400.5 78.1
Others 22,327.2 23.0 Others 25,689.6 21.9
Total 97,157.1 100.0 Total 117,090.1 100.0
2003
HS Commodities Value Share
(9) (10) (11) (12)
2004
HS Commodities Value Share
(13) (14) (15) (16)
from ASEAN by 2 Digits HS Code in 2001-2004
85 El. machnry, eqpmnt & parts; 85 El. machnry, eqpmnt & parts; sound eqpmnt; tv equipment 25,519.4 34.9 sound eqpmnt; tv equipment 34,765.0 34.7 84 Nuclear reactors, boilers, machnry & 27 Min fuels, min oils & prd of distillation; mechan applnc/ parts 11,615.7 15.9 bitum substan; min wax 16,781.0 16.8 27 Min fuels, min oils & prd of distillation; 84 Nuclear reactors, boilers, machnry & bitum substan; min wax 9,993.5 13.6 mechan applnc/ parts 14,606.7 14.6 39 Plastics and articles thereof 2,571.2 3.5 29 Organic chemicals 3,677.9 3.7 29 Organic chemicals 2,192.3 3.0 39 Plastics and articles thereof 3,394.1 3.4 87 Vehcl, (not railway, tramway, 87 Vehcl, (not railway, tramway, rolling stock); parts & accessories 1,687.3 2.3 rolling stock); parts & accessories 2,647.1 2.6 71 Nat or cultred pearls, prec/semiprecs 90 Optcl, photo/cinmatgraphic, measuring, stn/metal; imitation jewelry; coin 1,365.3 1.9 precision, medcl instrmnt 1,490.0 1.5 90 Optcl, photo/cinmatgraphic, measuring, 15 Anml /veg fats & oils; preprd edibl fats; precision, medcl instrmnt 1,105.7 1.5 anml or veg waxes 1,084.2 1.1 40 Rubber and articles thereof 894.7 1.2 48 Paper/paperboard, artcls of paper pulp 1,070.4 1.1 73 Articles of iron or steel 799.8 1.1 40 Rubber and articles thereof 1,058.2 1.1
10 Major 57,744.8 78.9 10 Major 80,574.7 80.4
Others 15,472.8 21.1 Others 19,597.4 19.6
Total 73,217.6 100.0 Total 100,172.0 100.0
2003
HS Commodities Value Share
(9) (10) (11) (12)
2004
HS Commodities Value Share
(13) (14) (15) (16)
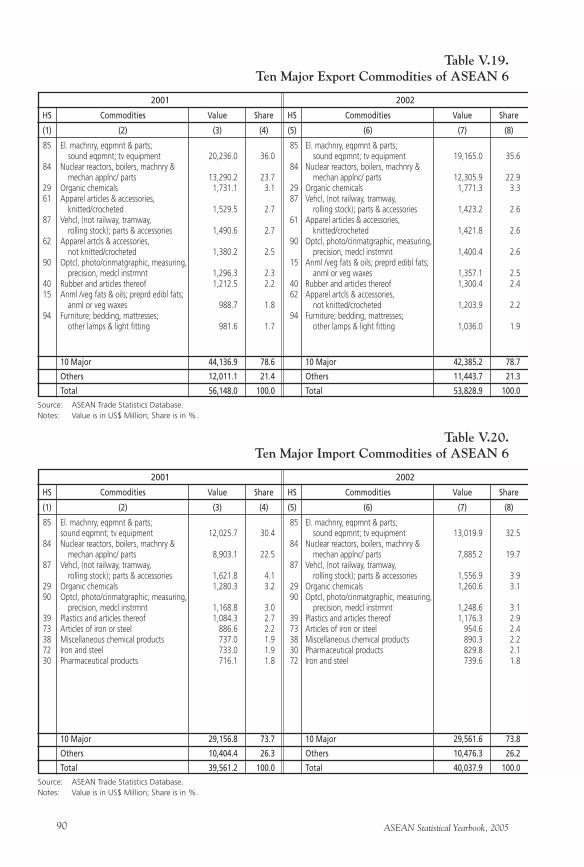
ASEAN Statistical Yearbook, 200590
Table V.19.Ten Major Export Commodities of ASEAN 6
85 El. machnry, eqpmnt & parts; 85 El. machnry, eqpmnt & parts; sound eqpmnt; tv equipment 20,236.0 36.0 sound eqpmnt; tv equipment 19,165.0 35.6 84 Nuclear reactors, boilers, machnry & 84 Nuclear reactors, boilers, machnry & mechan applnc/ parts 13,290.2 23.7 mechan applnc/ parts 12,305.9 22.9 29 Organic chemicals 1,731.1 3.1 29 Organic chemicals 1,771.3 3.3 61 Apparel articles & accessories, 87 Vehcl, (not railway, tramway, knitted/crocheted 1,529.5 2.7 rolling stock); parts & accessories 1,423.2 2.6 87 Vehcl, (not railway, tramway, 61 Apparel articles & accessories, rolling stock); parts & accessories 1,490.6 2.7 knitted/crocheted 1,421.8 2.6 62 Apparel artcls & accessories, 90 Optcl, photo/cinmatgraphic, measuring, not knitted/crocheted 1,380.2 2.5 precision, medcl instrmnt 1,400.4 2.6 90 Optcl, photo/cinmatgraphic, measuring, 15 Anml /veg fats & oils; preprd edibl fats; precision, medcl instrmnt 1,296.3 2.3 anml or veg waxes 1,357.1 2.5 40 Rubber and articles thereof 1,212.5 2.2 40 Rubber and articles thereof 1,300.4 2.4 15 Anml /veg fats & oils; preprd edibl fats; 62 Apparel artcls & accessories, anml or veg waxes 988.7 1.8 not knitted/crocheted 1,203.9 2.2 94 Furniture; bedding, mattresses; 94 Furniture; bedding, mattresses; other lamps & light fitting 981.6 1.7 other lamps & light fitting 1,036.0 1.9
10 Major 44,136.9 78.6 10 Major 42,385.2 78.7
Others 12,011.1 21.4 Others 11,443.7 21.3
Total 56,148.0 100.0 Total 53,828.9 100.0
2001
HS Commodities Value Share
Source: ASEAN Trade Statistics Database.Notes: Value is in US$ Million; Share is in %.
(1) (2) (3) (4)
2002
HS Commodities Value Share
(5) (6) (7) (8)
Table V.20.Ten Major Import Commodities of ASEAN 6
85 El. machnry, eqpmnt & parts; 85 El. machnry, eqpmnt & parts; sound eqpmnt; tv equipment 12,025.7 30.4 sound eqpmnt; tv equipment 13,019.9 32.5 84 Nuclear reactors, boilers, machnry & 84 Nuclear reactors, boilers, machnry & mechan applnc/ parts 8,903.1 22.5 mechan applnc/ parts 7,885.2 19.7 87 Vehcl, (not railway, tramway, 87 Vehcl, (not railway, tramway, rolling stock); parts & accessories 1,621.8 4.1 rolling stock); parts & accessories 1,556.9 3.9 29 Organic chemicals 1,280.3 3.2 29 Organic chemicals 1,260.6 3.1 90 Optcl, photo/cinmatgraphic, measuring, 90 Optcl, photo/cinmatgraphic, measuring, precision, medcl instrmnt 1,168.8 3.0 precision, medcl instrmnt 1,248.6 3.1 39 Plastics and articles thereof 1,084.3 2.7 39 Plastics and articles thereof 1,176.3 2.9 73 Articles of iron or steel 886.6 2.2 73 Articles of iron or steel 954.6 2.4 38 Miscellaneous chemical products 737.0 1.9 38 Miscellaneous chemical products 890.3 2.2 72 Iron and steel 733.0 1.9 30 Pharmaceutical products 829.8 2.1 30 Pharmaceutical products 716.1 1.8 72 Iron and steel 739.6 1.8
10 Major 29,156.8 73.7 10 Major 29,561.6 73.8
Others 10,404.4 26.3 Others 10,476.3 26.2
Total 39,561.2 100.0 Total 40,037.9 100.0
2001
HS Commodities Value Share
Source: ASEAN Trade Statistics Database.Notes: Value is in US$ Million; Share is in %.
(1) (2) (3) (4)
2002
HS Commodities Value Share
(5) (6) (7) (8)
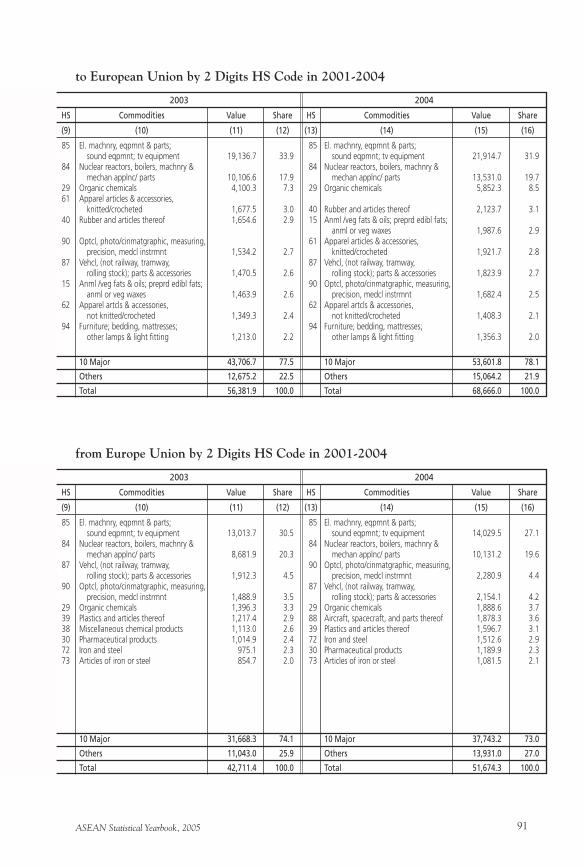
ASEAN Statistical Yearbook, 2005 91
to European Union by 2 Digits HS Code in 2001-2004
85 El. machnry, eqpmnt & parts; 85 El. machnry, eqpmnt & parts; sound eqpmnt; tv equipment 19,136.7 33.9 sound eqpmnt; tv equipment 21,914.7 31.9 84 Nuclear reactors, boilers, machnry & 84 Nuclear reactors, boilers, machnry & mechan applnc/ parts 10,106.6 17.9 mechan applnc/ parts 13,531.0 19.7 29 Organic chemicals 4,100.3 7.3 29 Organic chemicals 5,852.3 8.5 61 Apparel articles & accessories, knitted/crocheted 1,677.5 3.0 40 Rubber and articles thereof 2,123.7 3.1 40 Rubber and articles thereof 1,654.6 2.9 15 Anml /veg fats & oils; preprd edibl fats; anml or veg waxes 1,987.6 2.9 90 Optcl, photo/cinmatgraphic, measuring, 61 Apparel articles & accessories, precision, medcl instrmnt 1,534.2 2.7 knitted/crocheted 1,921.7 2.8 87 Vehcl, (not railway, tramway, 87 Vehcl, (not railway, tramway, rolling stock); parts & accessories 1,470.5 2.6 rolling stock); parts & accessories 1,823.9 2.7 15 Anml /veg fats & oils; preprd edibl fats; 90 Optcl, photo/cinmatgraphic, measuring, anml or veg waxes 1,463.9 2.6 precision, medcl instrmnt 1,682.4 2.5 62 Apparel artcls & accessories, 62 Apparel artcls & accessories, not knitted/crocheted 1,349.3 2.4 not knitted/crocheted 1,408.3 2.1 94 Furniture; bedding, mattresses; 94 Furniture; bedding, mattresses; other lamps & light fitting 1,213.0 2.2 other lamps & light fitting 1,356.3 2.0
10 Major 43,706.7 77.5 10 Major 53,601.8 78.1
Others 12,675.2 22.5 Others 15,064.2 21.9
Total 56,381.9 100.0 Total 68,666.0 100.0
2003
HS Commodities Value Share
(9) (10) (11) (12)
2004
HS Commodities Value Share
(13) (14) (15) (16)
from Europe Union by 2 Digits HS Code in 2001-2004
85 El. machnry, eqpmnt & parts; 85 El. machnry, eqpmnt & parts; sound eqpmnt; tv equipment 13,013.7 30.5 sound eqpmnt; tv equipment 14,029.5 27.1 84 Nuclear reactors, boilers, machnry & 84 Nuclear reactors, boilers, machnry & mechan applnc/ parts 8,681.9 20.3 mechan applnc/ parts 10,131.2 19.6 87 Vehcl, (not railway, tramway, 90 Optcl, photo/cinmatgraphic, measuring, rolling stock); parts & accessories 1,912.3 4.5 precision, medcl instrmnt 2,280.9 4.4 90 Optcl, photo/cinmatgraphic, measuring, 87 Vehcl, (not railway, tramway, precision, medcl instrmnt 1,488.9 3.5 rolling stock); parts & accessories 2,154.1 4.2 29 Organic chemicals 1,396.3 3.3 29 Organic chemicals 1,888.6 3.7 39 Plastics and articles thereof 1,217.4 2.9 88 Aircraft, spacecraft, and parts thereof 1,878.3 3.6 38 Miscellaneous chemical products 1,113.0 2.6 39 Plastics and articles thereof 1,596.7 3.1 30 Pharmaceutical products 1,014.9 2.4 72 Iron and steel 1,512.6 2.9 72 Iron and steel 975.1 2.3 30 Pharmaceutical products 1,189.9 2.3 73 Articles of iron or steel 854.7 2.0 73 Articles of iron or steel 1,081.5 2.1
10 Major 31,668.3 74.1 10 Major 37,743.2 73.0
Others 11,043.0 25.9 Others 13,931.0 27.0
Total 42,711.4 100.0 Total 51,674.3 100.0
2003
HS Commodities Value Share
(9) (10) (11) (12)
2004
HS Commodities Value Share
(13) (14) (15) (16)
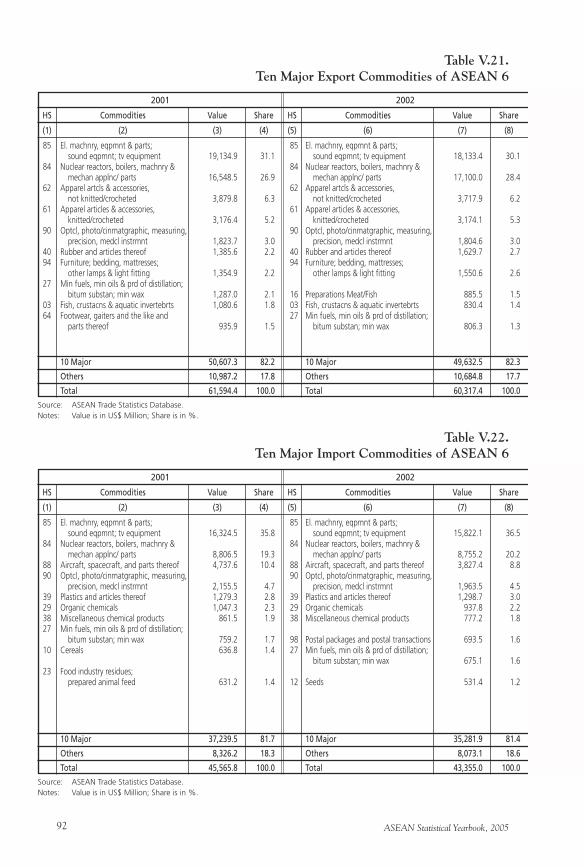
ASEAN Statistical Yearbook, 200592
Table V.21.Ten Major Export Commodities of ASEAN 6
85 El. machnry, eqpmnt & parts; 85 El. machnry, eqpmnt & parts; sound eqpmnt; tv equipment 19,134.9 31.1 sound eqpmnt; tv equipment 18,133.4 30.1 84 Nuclear reactors, boilers, machnry & 84 Nuclear reactors, boilers, machnry & mechan applnc/ parts 16,548.5 26.9 mechan applnc/ parts 17,100.0 28.4 62 Apparel artcls & accessories, 62 Apparel artcls & accessories, not knitted/crocheted 3,879.8 6.3 not knitted/crocheted 3,717.9 6.2 61 Apparel articles & accessories, 61 Apparel articles & accessories, knitted/crocheted 3,176.4 5.2 knitted/crocheted 3,174.1 5.3 90 Optcl, photo/cinmatgraphic, measuring, 90 Optcl, photo/cinmatgraphic, measuring, precision, medcl instrmnt 1,823.7 3.0 precision, medcl instrmnt 1,804.6 3.0 40 Rubber and articles thereof 1,385.6 2.2 40 Rubber and articles thereof 1,629.7 2.7 94 Furniture; bedding, mattresses; 94 Furniture; bedding, mattresses; other lamps & light fitting 1,354.9 2.2 other lamps & light fitting 1,550.6 2.6 27 Min fuels, min oils & prd of distillation; bitum substan; min wax 1,287.0 2.1 16 Preparations Meat/Fish 885.5 1.5 03 Fish, crustacns & aquatic invertebrts 1,080.6 1.8 03 Fish, crustacns & aquatic invertebrts 830.4 1.4 64 Footwear, gaiters and the like and 27 Min fuels, min oils & prd of distillation; parts thereof 935.9 1.5 bitum substan; min wax 806.3 1.3
10 Major 50,607.3 82.2 10 Major 49,632.5 82.3
Others 10,987.2 17.8 Others 10,684.8 17.7
Total 61,594.4 100.0 Total 60,317.4 100.0
2001
HS Commodities Value Share
Source: ASEAN Trade Statistics Database.Notes: Value is in US$ Million; Share is in %.
(1) (2) (3) (4)
2002
HS Commodities Value Share
(5) (6) (7) (8)
Table V.22.Ten Major Import Commodities of ASEAN 6
85 El. machnry, eqpmnt & parts; 85 El. machnry, eqpmnt & parts; sound eqpmnt; tv equipment 16,324.5 35.8 sound eqpmnt; tv equipment 15,822.1 36.5 84 Nuclear reactors, boilers, machnry & 84 Nuclear reactors, boilers, machnry & mechan applnc/ parts 8,806.5 19.3 mechan applnc/ parts 8,755.2 20.2 88 Aircraft, spacecraft, and parts thereof 4,737.6 10.4 88 Aircraft, spacecraft, and parts thereof 3,827.4 8.8 90 Optcl, photo/cinmatgraphic, measuring, 90 Optcl, photo/cinmatgraphic, measuring, precision, medcl instrmnt 2,155.5 4.7 precision, medcl instrmnt 1,963.5 4.5 39 Plastics and articles thereof 1,279.3 2.8 39 Plastics and articles thereof 1,298.7 3.0 29 Organic chemicals 1,047.3 2.3 29 Organic chemicals 937.8 2.2 38 Miscellaneous chemical products 861.5 1.9 38 Miscellaneous chemical products 777.2 1.8 27 Min fuels, min oils & prd of distillation; bitum substan; min wax 759.2 1.7 98 Postal packages and postal transactions 693.5 1.6 10 Cereals 636.8 1.4 27 Min fuels, min oils & prd of distillation; bitum substan; min wax 675.1 1.6 23 Food industry residues; prepared animal feed 631.2 1.4 12 Seeds 531.4 1.2
10 Major 37,239.5 81.7 10 Major 35,281.9 81.4
Others 8,326.2 18.3 Others 8,073.1 18.6
Total 45,565.8 100.0 Total 43,355.0 100.0
2001
HS Commodities Value Share
Source: ASEAN Trade Statistics Database.Notes: Value is in US$ Million; Share is in %.
(1) (2) (3) (4)
2002
HS Commodities Value Share
(5) (6) (7) (8)
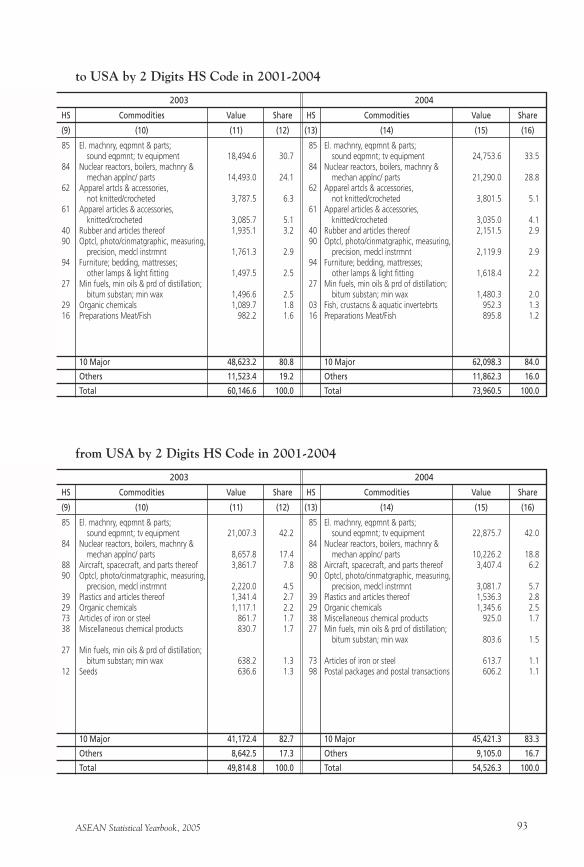
ASEAN Statistical Yearbook, 2005 93
to USA by 2 Digits HS Code in 2001-2004
85 El. machnry, eqpmnt & parts; 85 El. machnry, eqpmnt & parts; sound eqpmnt; tv equipment 18,494.6 30.7 sound eqpmnt; tv equipment 24,753.6 33.5 84 Nuclear reactors, boilers, machnry & 84 Nuclear reactors, boilers, machnry & mechan applnc/ parts 14,493.0 24.1 mechan applnc/ parts 21,290.0 28.8 62 Apparel artcls & accessories, 62 Apparel artcls & accessories, not knitted/crocheted 3,787.5 6.3 not knitted/crocheted 3,801.5 5.1 61 Apparel articles & accessories, 61 Apparel articles & accessories, knitted/crocheted 3,085.7 5.1 knitted/crocheted 3,035.0 4.1 40 Rubber and articles thereof 1,935.1 3.2 40 Rubber and articles thereof 2,151.5 2.9 90 Optcl, photo/cinmatgraphic, measuring, 90 Optcl, photo/cinmatgraphic, measuring, precision, medcl instrmnt 1,761.3 2.9 precision, medcl instrmnt 2,119.9 2.9 94 Furniture; bedding, mattresses; 94 Furniture; bedding, mattresses; other lamps & light fitting 1,497.5 2.5 other lamps & light fitting 1,618.4 2.2 27 Min fuels, min oils & prd of distillation; 27 Min fuels, min oils & prd of distillation; bitum substan; min wax 1,496.6 2.5 bitum substan; min wax 1,480.3 2.0 29 Organic chemicals 1,089.7 1.8 03 Fish, crustacns & aquatic invertebrts 952.3 1.3 16 Preparations Meat/Fish 982.2 1.6 16 Preparations Meat/Fish 895.8 1.2
10 Major 48,623.2 80.8 10 Major 62,098.3 84.0
Others 11,523.4 19.2 Others 11,862.3 16.0
Total 60,146.6 100.0 Total 73,960.5 100.0
2003
HS Commodities Value Share
(9) (10) (11) (12)
2004
HS Commodities Value Share
(13) (14) (15) (16)
from USA by 2 Digits HS Code in 2001-2004
85 El. machnry, eqpmnt & parts; 85 El. machnry, eqpmnt & parts; sound eqpmnt; tv equipment 21,007.3 42.2 sound eqpmnt; tv equipment 22,875.7 42.0 84 Nuclear reactors, boilers, machnry & 84 Nuclear reactors, boilers, machnry & mechan applnc/ parts 8,657.8 17.4 mechan applnc/ parts 10,226.2 18.8 88 Aircraft, spacecraft, and parts thereof 3,861.7 7.8 88 Aircraft, spacecraft, and parts thereof 3,407.4 6.2 90 Optcl, photo/cinmatgraphic, measuring, 90 Optcl, photo/cinmatgraphic, measuring, precision, medcl instrmnt 2,220.0 4.5 precision, medcl instrmnt 3,081.7 5.7 39 Plastics and articles thereof 1,341.4 2.7 39 Plastics and articles thereof 1,536.3 2.8 29 Organic chemicals 1,117.1 2.2 29 Organic chemicals 1,345.6 2.5 73 Articles of iron or steel 861.7 1.7 38 Miscellaneous chemical products 925.0 1.7 38 Miscellaneous chemical products 830.7 1.7 27 Min fuels, min oils & prd of distillation; bitum substan; min wax 803.6 1.5 27 Min fuels, min oils & prd of distillation; bitum substan; min wax 638.2 1.3 73 Articles of iron or steel 613.7 1.1 12 Seeds 636.6 1.3 98 Postal packages and postal transactions 606.2 1.1
10 Major 41,172.4 82.7 10 Major 45,421.3 83.3
Others 8,642.5 17.3 Others 9,105.0 16.7
Total 49,814.8 100.0 Total 54,526.3 100.0
2003
HS Commodities Value Share
(9) (10) (11) (12)
2004
HS Commodities Value Share
(13) (14) (15) (16)
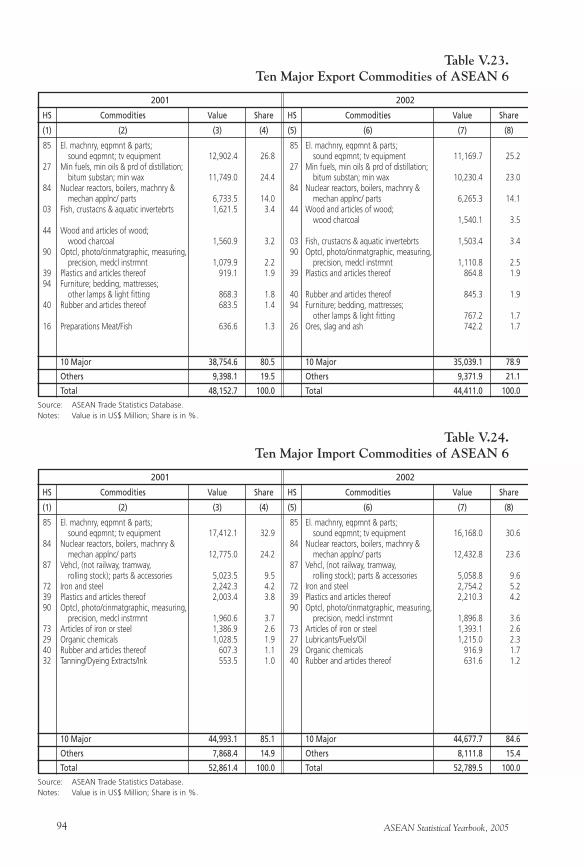
ASEAN Statistical Yearbook, 200594
Table V.23.Ten Major Export Commodities of ASEAN 6
85 El. machnry, eqpmnt & parts; 85 El. machnry, eqpmnt & parts; sound eqpmnt; tv equipment 12,902.4 26.8 sound eqpmnt; tv equipment 11,169.7 25.2 27 Min fuels, min oils & prd of distillation; 27 Min fuels, min oils & prd of distillation; bitum substan; min wax 11,749.0 24.4 bitum substan; min wax 10,230.4 23.0 84 Nuclear reactors, boilers, machnry & 84 Nuclear reactors, boilers, machnry & mechan applnc/ parts 6,733.5 14.0 mechan applnc/ parts 6,265.3 14.1 03 Fish, crustacns & aquatic invertebrts 1,621.5 3.4 44 Wood and articles of wood; wood charcoal 1,540.1 3.5 44 Wood and articles of wood; wood charcoal 1,560.9 3.2 03 Fish, crustacns & aquatic invertebrts 1,503.4 3.4 90 Optcl, photo/cinmatgraphic, measuring, 90 Optcl, photo/cinmatgraphic, measuring, precision, medcl instrmnt 1,079.9 2.2 precision, medcl instrmnt 1,110.8 2.5 39 Plastics and articles thereof 919.1 1.9 39 Plastics and articles thereof 864.8 1.9 94 Furniture; bedding, mattresses; other lamps & light fitting 868.3 1.8 40 Rubber and articles thereof 845.3 1.9 40 Rubber and articles thereof 683.5 1.4 94 Furniture; bedding, mattresses; other lamps & light fitting 767.2 1.7 16 Preparations Meat/Fish 636.6 1.3 26 Ores, slag and ash 742.2 1.7
10 Major 38,754.6 80.5 10 Major 35,039.1 78.9
Others 9,398.1 19.5 Others 9,371.9 21.1
Total 48,152.7 100.0 Total 44,411.0 100.0
2001
HS Commodities Value Share
Source: ASEAN Trade Statistics Database.Notes: Value is in US$ Million; Share is in %.
(1) (2) (3) (4)
2002
HS Commodities Value Share
(5) (6) (7) (8)
Table V.24.Ten Major Import Commodities of ASEAN 6
85 El. machnry, eqpmnt & parts; 85 El. machnry, eqpmnt & parts; sound eqpmnt; tv equipment 17,412.1 32.9 sound eqpmnt; tv equipment 16,168.0 30.6 84 Nuclear reactors, boilers, machnry & 84 Nuclear reactors, boilers, machnry & mechan applnc/ parts 12,775.0 24.2 mechan applnc/ parts 12,432.8 23.6 87 Vehcl, (not railway, tramway, 87 Vehcl, (not railway, tramway, rolling stock); parts & accessories 5,023.5 9.5 rolling stock); parts & accessories 5,058.8 9.6 72 Iron and steel 2,242.3 4.2 72 Iron and steel 2,754.2 5.2 39 Plastics and articles thereof 2,003.4 3.8 39 Plastics and articles thereof 2,210.3 4.2 90 Optcl, photo/cinmatgraphic, measuring, 90 Optcl, photo/cinmatgraphic, measuring, precision, medcl instrmnt 1,960.6 3.7 precision, medcl instrmnt 1,896.8 3.6 73 Articles of iron or steel 1,386.9 2.6 73 Articles of iron or steel 1,393.1 2.6 29 Organic chemicals 1,028.5 1.9 27 Lubricants/Fuels/Oil 1,215.0 2.3 40 Rubber and articles thereof 607.3 1.1 29 Organic chemicals 916.9 1.7 32 Tanning/Dyeing Extracts/Ink 553.5 1.0 40 Rubber and articles thereof 631.6 1.2
10 Major 44,993.1 85.1 10 Major 44,677.7 84.6
Others 7,868.4 14.9 Others 8,111.8 15.4
Total 52,861.4 100.0 Total 52,789.5 100.0
2001
HS Commodities Value Share
Source: ASEAN Trade Statistics Database.Notes: Value is in US$ Million; Share is in %.
(1) (2) (3) (4)
2002
HS Commodities Value Share
(5) (6) (7) (8)
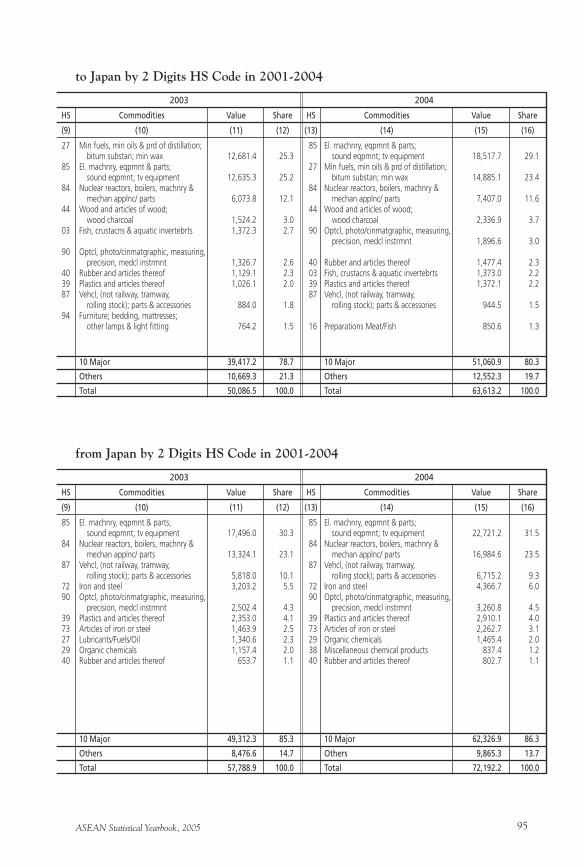
ASEAN Statistical Yearbook, 2005 95
to Japan by 2 Digits HS Code in 2001-2004
27 Min fuels, min oils & prd of distillation; 85 El. machnry, eqpmnt & parts; bitum substan; min wax 12,681.4 25.3 sound eqpmnt; tv equipment 18,517.7 29.1 85 El. machnry, eqpmnt & parts; 27 Min fuels, min oils & prd of distillation; sound eqpmnt; tv equipment 12,635.3 25.2 bitum substan; min wax 14,885.1 23.4 84 Nuclear reactors, boilers, machnry & 84 Nuclear reactors, boilers, machnry & mechan applnc/ parts 6,073.8 12.1 mechan applnc/ parts 7,407.0 11.6 44 Wood and articles of wood; 44 Wood and articles of wood; wood charcoal 1,524.2 3.0 wood charcoal 2,336.9 3.7 03 Fish, crustacns & aquatic invertebrts 1,372.3 2.7 90 Optcl, photo/cinmatgraphic, measuring, precision, medcl instrmnt 1,896.6 3.0 90 Optcl, photo/cinmatgraphic, measuring, precision, medcl instrmnt 1,326.7 2.6 40 Rubber and articles thereof 1,477.4 2.3 40 Rubber and articles thereof 1,129.1 2.3 03 Fish, crustacns & aquatic invertebrts 1,373.0 2.2 39 Plastics and articles thereof 1,026.1 2.0 39 Plastics and articles thereof 1,372.1 2.2 87 Vehcl, (not railway, tramway, 87 Vehcl, (not railway, tramway, rolling stock); parts & accessories 884.0 1.8 rolling stock); parts & accessories 944.5 1.5 94 Furniture; bedding, mattresses; other lamps & light fitting 764.2 1.5 16 Preparations Meat/Fish 850.6 1.3
10 Major 39,417.2 78.7 10 Major 51,060.9 80.3
Others 10,669.3 21.3 Others 12,552.3 19.7
Total 50,086.5 100.0 Total 63,613.2 100.0
2003
HS Commodities Value Share
(9) (10) (11) (12)
2004
HS Commodities Value Share
(13) (14) (15) (16)
from Japan by 2 Digits HS Code in 2001-2004
85 El. machnry, eqpmnt & parts; 85 El. machnry, eqpmnt & parts; sound eqpmnt; tv equipment 17,496.0 30.3 sound eqpmnt; tv equipment 22,721.2 31.5 84 Nuclear reactors, boilers, machnry & 84 Nuclear reactors, boilers, machnry & mechan applnc/ parts 13,324.1 23.1 mechan applnc/ parts 16,984.6 23.5 87 Vehcl, (not railway, tramway, 87 Vehcl, (not railway, tramway, rolling stock); parts & accessories 5,818.0 10.1 rolling stock); parts & accessories 6,715.2 9.3 72 Iron and steel 3,203.2 5.5 72 Iron and steel 4,366.7 6.0 90 Optcl, photo/cinmatgraphic, measuring, 90 Optcl, photo/cinmatgraphic, measuring, precision, medcl instrmnt 2,502.4 4.3 precision, medcl instrmnt 3,260.8 4.5 39 Plastics and articles thereof 2,353.0 4.1 39 Plastics and articles thereof 2,910.1 4.0 73 Articles of iron or steel 1,463.9 2.5 73 Articles of iron or steel 2,262.7 3.1 27 Lubricants/Fuels/Oil 1,340.6 2.3 29 Organic chemicals 1,465.4 2.0 29 Organic chemicals 1,157.4 2.0 38 Miscellaneous chemical products 837.4 1.2 40 Rubber and articles thereof 653.7 1.1 40 Rubber and articles thereof 802.7 1.1
10 Major 49,312.3 85.3 10 Major 62,326.9 86.3
Others 8,476.6 14.7 Others 9,865.3 13.7
Total 57,788.9 100.0 Total 72,192.2 100.0
2003
HS Commodities Value Share
(9) (10) (11) (12)
2004
HS Commodities Value Share
(13) (14) (15) (16)
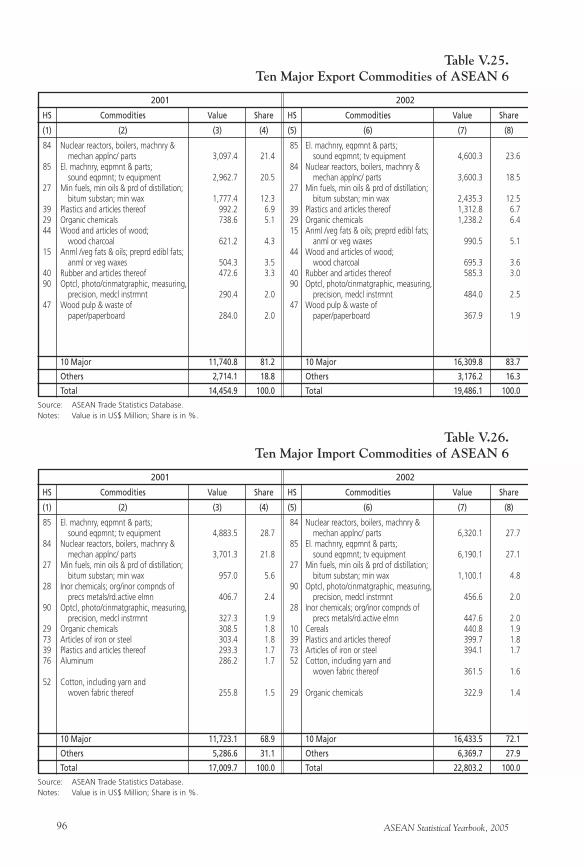
ASEAN Statistical Yearbook, 200596
Table V.25.Ten Major Export Commodities of ASEAN 6
84 Nuclear reactors, boilers, machnry & 85 El. machnry, eqpmnt & parts; mechan applnc/ parts 3,097.4 21.4 sound eqpmnt; tv equipment 4,600.3 23.6 85 El. machnry, eqpmnt & parts; 84 Nuclear reactors, boilers, machnry & sound eqpmnt; tv equipment 2,962.7 20.5 mechan applnc/ parts 3,600.3 18.5 27 Min fuels, min oils & prd of distillation; 27 Min fuels, min oils & prd of distillation; bitum substan; min wax 1,777.4 12.3 bitum substan; min wax 2,435.3 12.5 39 Plastics and articles thereof 992.2 6.9 39 Plastics and articles thereof 1,312.8 6.7 29 Organic chemicals 738.6 5.1 29 Organic chemicals 1,238.2 6.4 44 Wood and articles of wood; 15 Anml /veg fats & oils; preprd edibl fats; wood charcoal 621.2 4.3 anml or veg waxes 990.5 5.1 15 Anml /veg fats & oils; preprd edibl fats; 44 Wood and articles of wood; anml or veg waxes 504.3 3.5 wood charcoal 695.3 3.6 40 Rubber and articles thereof 472.6 3.3 40 Rubber and articles thereof 585.3 3.0 90 Optcl, photo/cinmatgraphic, measuring, 90 Optcl, photo/cinmatgraphic, measuring, precision, medcl instrmnt 290.4 2.0 precision, medcl instrmnt 484.0 2.5 47 Wood pulp & waste of 47 Wood pulp & waste of paper/paperboard 284.0 2.0 paper/paperboard 367.9 1.9
10 Major 11,740.8 81.2 10 Major 16,309.8 83.7
Others 2,714.1 18.8 Others 3,176.2 16.3
Total 14,454.9 100.0 Total 19,486.1 100.0
2001
HS Commodities Value Share
Source: ASEAN Trade Statistics Database.Notes: Value is in US$ Million; Share is in %.
(1) (2) (3) (4)
2002
HS Commodities Value Share
(5) (6) (7) (8)
Table V.26.Ten Major Import Commodities of ASEAN 6
85 El. machnry, eqpmnt & parts; 84 Nuclear reactors, boilers, machnry & sound eqpmnt; tv equipment 4,883.5 28.7 mechan applnc/ parts 6,320.1 27.7 84 Nuclear reactors, boilers, machnry & 85 El. machnry, eqpmnt & parts; mechan applnc/ parts 3,701.3 21.8 sound eqpmnt; tv equipment 6,190.1 27.1 27 Min fuels, min oils & prd of distillation; 27 Min fuels, min oils & prd of distillation; bitum substan; min wax 957.0 5.6 bitum substan; min wax 1,100.1 4.8 28 Inor chemicals; org/inor compnds of 90 Optcl, photo/cinmatgraphic, measuring, precs metals/rd.active elmn 406.7 2.4 precision, medcl instrmnt 456.6 2.0 90 Optcl, photo/cinmatgraphic, measuring, 28 Inor chemicals; org/inor compnds of precision, medcl instrmnt 327.3 1.9 precs metals/rd.active elmn 447.6 2.0 29 Organic chemicals 308.5 1.8 10 Cereals 440.8 1.9 73 Articles of iron or steel 303.4 1.8 39 Plastics and articles thereof 399.7 1.8 39 Plastics and articles thereof 293.3 1.7 73 Articles of iron or steel 394.1 1.7 76 Aluminum 286.2 1.7 52 Cotton, including yarn and woven fabric thereof 361.5 1.6 52 Cotton, including yarn and woven fabric thereof 255.8 1.5 29 Organic chemicals 322.9 1.4
10 Major 11,723.1 68.9 10 Major 16,433.5 72.1
Others 5,286.6 31.1 Others 6,369.7 27.9
Total 17,009.7 100.0 Total 22,803.2 100.0
2001
HS Commodities Value Share
Source: ASEAN Trade Statistics Database.Notes: Value is in US$ Million; Share is in %.
(1) (2) (3) (4)
2002
HS Commodities Value Share
(5) (6) (7) (8)
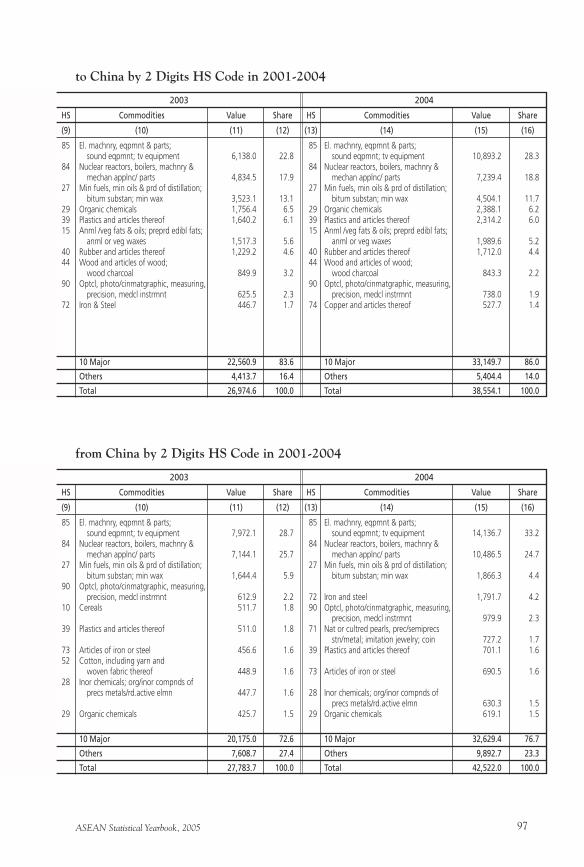
ASEAN Statistical Yearbook, 2005 97
to China by 2 Digits HS Code in 2001-2004
85 El. machnry, eqpmnt & parts; 85 El. machnry, eqpmnt & parts; sound eqpmnt; tv equipment 6,138.0 22.8 sound eqpmnt; tv equipment 10,893.2 28.3 84 Nuclear reactors, boilers, machnry & 84 Nuclear reactors, boilers, machnry & mechan applnc/ parts 4,834.5 17.9 mechan applnc/ parts 7,239.4 18.8 27 Min fuels, min oils & prd of distillation; 27 Min fuels, min oils & prd of distillation; bitum substan; min wax 3,523.1 13.1 bitum substan; min wax 4,504.1 11.7 29 Organic chemicals 1,756.4 6.5 29 Organic chemicals 2,388.1 6.2 39 Plastics and articles thereof 1,640.2 6.1 39 Plastics and articles thereof 2,314.2 6.0 15 Anml /veg fats & oils; preprd edibl fats; 15 Anml /veg fats & oils; preprd edibl fats; anml or veg waxes 1,517.3 5.6 anml or veg waxes 1,989.6 5.2 40 Rubber and articles thereof 1,229.2 4.6 40 Rubber and articles thereof 1,712.0 4.4 44 Wood and articles of wood; 44 Wood and articles of wood; wood charcoal 849.9 3.2 wood charcoal 843.3 2.2 90 Optcl, photo/cinmatgraphic, measuring, 90 Optcl, photo/cinmatgraphic, measuring, precision, medcl instrmnt 625.5 2.3 precision, medcl instrmnt 738.0 1.9 72 Iron & Steel 446.7 1.7 74 Copper and articles thereof 527.7 1.4
10 Major 22,560.9 83.6 10 Major 33,149.7 86.0
Others 4,413.7 16.4 Others 5,404.4 14.0
Total 26,974.6 100.0 Total 38,554.1 100.0
2003
HS Commodities Value Share
(9) (10) (11) (12)
2004
HS Commodities Value Share
(13) (14) (15) (16)
from China by 2 Digits HS Code in 2001-2004
85 El. machnry, eqpmnt & parts; 85 El. machnry, eqpmnt & parts; sound eqpmnt; tv equipment 7,972.1 28.7 sound eqpmnt; tv equipment 14,136.7 33.2 84 Nuclear reactors, boilers, machnry & 84 Nuclear reactors, boilers, machnry & mechan applnc/ parts 7,144.1 25.7 mechan applnc/ parts 10,486.5 24.7 27 Min fuels, min oils & prd of distillation; 27 Min fuels, min oils & prd of distillation; bitum substan; min wax 1,644.4 5.9 bitum substan; min wax 1,866.3 4.4 90 Optcl, photo/cinmatgraphic, measuring, precision, medcl instrmnt 612.9 2.2 72 Iron and steel 1,791.7 4.2 10 Cereals 511.7 1.8 90 Optcl, photo/cinmatgraphic, measuring, precision, medcl instrmnt 979.9 2.3 39 Plastics and articles thereof 511.0 1.8 71 Nat or cultred pearls, prec/semiprecs stn/metal; imitation jewelry; coin 727.2 1.7 73 Articles of iron or steel 456.6 1.6 39 Plastics and articles thereof 701.1 1.6 52 Cotton, including yarn and woven fabric thereof 448.9 1.6 73 Articles of iron or steel 690.5 1.6 28 Inor chemicals; org/inor compnds of precs metals/rd.active elmn 447.7 1.6 28 Inor chemicals; org/inor compnds of precs metals/rd.active elmn 630.3 1.5 29 Organic chemicals 425.7 1.5 29 Organic chemicals 619.1 1.5
10 Major 20,175.0 72.6 10 Major 32,629.4 76.7
Others 7,608.7 27.4 Others 9,892.7 23.3
Total 27,783.7 100.0 Total 42,522.0 100.0
2003
HS Commodities Value Share
(9) (10) (11) (12)
2004
HS Commodities Value Share
(13) (14) (15) (16)
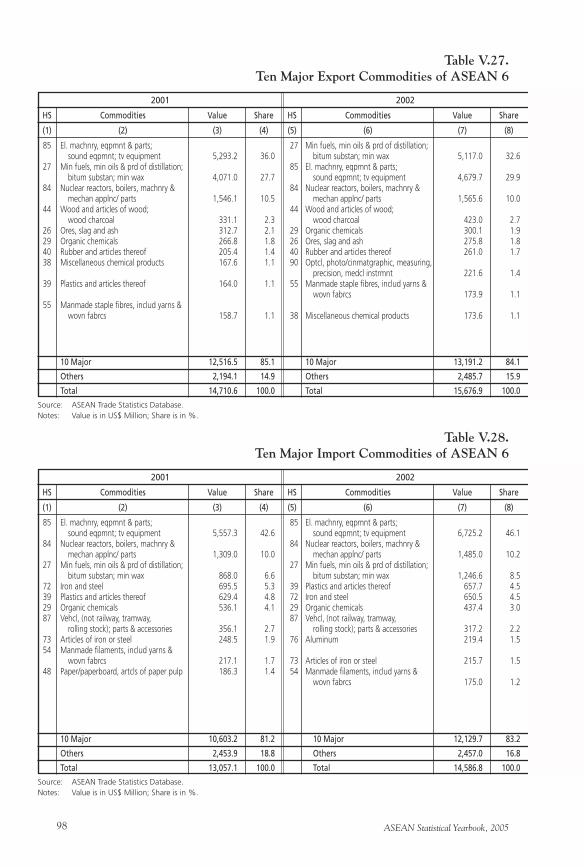
ASEAN Statistical Yearbook, 200598
Table V.27.Ten Major Export Commodities of ASEAN 6
85 El. machnry, eqpmnt & parts; 27 Min fuels, min oils & prd of distillation; sound eqpmnt; tv equipment 5,293.2 36.0 bitum substan; min wax 5,117.0 32.6 27 Min fuels, min oils & prd of distillation; 85 El. machnry, eqpmnt & parts; bitum substan; min wax 4,071.0 27.7 sound eqpmnt; tv equipment 4,679.7 29.9 84 Nuclear reactors, boilers, machnry & 84 Nuclear reactors, boilers, machnry & mechan applnc/ parts 1,546.1 10.5 mechan applnc/ parts 1,565.6 10.0 44 Wood and articles of wood; 44 Wood and articles of wood; wood charcoal 331.1 2.3 wood charcoal 423.0 2.7 26 Ores, slag and ash 312.7 2.1 29 Organic chemicals 300.1 1.9 29 Organic chemicals 266.8 1.8 26 Ores, slag and ash 275.8 1.8 40 Rubber and articles thereof 205.4 1.4 40 Rubber and articles thereof 261.0 1.7 38 Miscellaneous chemical products 167.6 1.1 90 Optcl, photo/cinmatgraphic, measuring, precision, medcl instrmnt 221.6 1.4 39 Plastics and articles thereof 164.0 1.1 55 Manmade staple fibres, includ yarns & wovn fabrcs 173.9 1.1 55 Manmade staple fibres, includ yarns & wovn fabrcs 158.7 1.1 38 Miscellaneous chemical products 173.6 1.1
10 Major 12,516.5 85.1 10 Major 13,191.2 84.1
Others 2,194.1 14.9 Others 2,485.7 15.9
Total 14,710.6 100.0 Total 15,676.9 100.0
2001
HS Commodities Value Share
Source: ASEAN Trade Statistics Database.Notes: Value is in US$ Million; Share is in %.
(1) (2) (3) (4)
2002
HS Commodities Value Share
(5) (6) (7) (8)
Table V.28.Ten Major Import Commodities of ASEAN 6
85 El. machnry, eqpmnt & parts; 85 El. machnry, eqpmnt & parts; sound eqpmnt; tv equipment 5,557.3 42.6 sound eqpmnt; tv equipment 6,725.2 46.1 84 Nuclear reactors, boilers, machnry & 84 Nuclear reactors, boilers, machnry & mechan applnc/ parts 1,309.0 10.0 mechan applnc/ parts 1,485.0 10.2 27 Min fuels, min oils & prd of distillation; 27 Min fuels, min oils & prd of distillation; bitum substan; min wax 868.0 6.6 bitum substan; min wax 1,246.6 8.5 72 Iron and steel 695.5 5.3 39 Plastics and articles thereof 657.7 4.5 39 Plastics and articles thereof 629.4 4.8 72 Iron and steel 650.5 4.5 29 Organic chemicals 536.1 4.1 29 Organic chemicals 437.4 3.0 87 Vehcl, (not railway, tramway, 87 Vehcl, (not railway, tramway, rolling stock); parts & accessories 356.1 2.7 rolling stock); parts & accessories 317.2 2.2 73 Articles of iron or steel 248.5 1.9 76 Aluminum 219.4 1.5 54 Manmade filaments, includ yarns & wovn fabrcs 217.1 1.7 73 Articles of iron or steel 215.7 1.5 48 Paper/paperboard, artcls of paper pulp 186.3 1.4 54 Manmade filaments, includ yarns & wovn fabrcs 175.0 1.2
10 Major 10,603.2 81.2 10 Major 12,129.7 83.2
Others 2,453.9 18.8 Others 2,457.0 16.8
Total 13,057.1 100.0 Total 14,586.8 100.0
2001
HS Commodities Value Share
Source: ASEAN Trade Statistics Database.Notes: Value is in US$ Million; Share is in %.
(1) (2) (3) (4)
2002
HS Commodities Value Share
(5) (6) (7) (8)
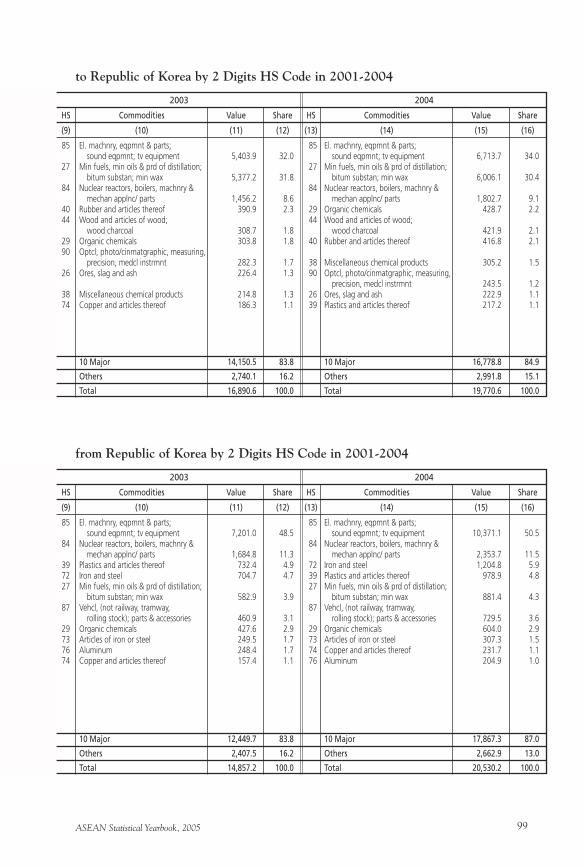
ASEAN Statistical Yearbook, 2005 99
to Republic of Korea by 2 Digits HS Code in 2001-2004
85 El. machnry, eqpmnt & parts; 85 El. machnry, eqpmnt & parts; sound eqpmnt; tv equipment 5,403.9 32.0 sound eqpmnt; tv equipment 6,713.7 34.0 27 Min fuels, min oils & prd of distillation; 27 Min fuels, min oils & prd of distillation; bitum substan; min wax 5,377.2 31.8 bitum substan; min wax 6,006.1 30.4 84 Nuclear reactors, boilers, machnry & 84 Nuclear reactors, boilers, machnry & mechan applnc/ parts 1,456.2 8.6 mechan applnc/ parts 1,802.7 9.1 40 Rubber and articles thereof 390.9 2.3 29 Organic chemicals 428.7 2.2 44 Wood and articles of wood; 44 Wood and articles of wood; wood charcoal 308.7 1.8 wood charcoal 421.9 2.1 29 Organic chemicals 303.8 1.8 40 Rubber and articles thereof 416.8 2.1 90 Optcl, photo/cinmatgraphic, measuring, precision, medcl instrmnt 282.3 1.7 38 Miscellaneous chemical products 305.2 1.5 26 Ores, slag and ash 226.4 1.3 90 Optcl, photo/cinmatgraphic, measuring, precision, medcl instrmnt 243.5 1.2 38 Miscellaneous chemical products 214.8 1.3 26 Ores, slag and ash 222.9 1.1 74 Copper and articles thereof 186.3 1.1 39 Plastics and articles thereof 217.2 1.1
10 Major 14,150.5 83.8 10 Major 16,778.8 84.9
Others 2,740.1 16.2 Others 2,991.8 15.1
Total 16,890.6 100.0 Total 19,770.6 100.0
2003
HS Commodities Value Share
(9) (10) (11) (12)
2004
HS Commodities Value Share
(13) (14) (15) (16)
from Republic of Korea by 2 Digits HS Code in 2001-2004
85 El. machnry, eqpmnt & parts; 85 El. machnry, eqpmnt & parts; sound eqpmnt; tv equipment 7,201.0 48.5 sound eqpmnt; tv equipment 10,371.1 50.5 84 Nuclear reactors, boilers, machnry & 84 Nuclear reactors, boilers, machnry & mechan applnc/ parts 1,684.8 11.3 mechan applnc/ parts 2,353.7 11.5 39 Plastics and articles thereof 732.4 4.9 72 Iron and steel 1,204.8 5.9 72 Iron and steel 704.7 4.7 39 Plastics and articles thereof 978.9 4.8 27 Min fuels, min oils & prd of distillation; 27 Min fuels, min oils & prd of distillation; bitum substan; min wax 582.9 3.9 bitum substan; min wax 881.4 4.3 87 Vehcl, (not railway, tramway, 87 Vehcl, (not railway, tramway, rolling stock); parts & accessories 460.9 3.1 rolling stock); parts & accessories 729.5 3.6 29 Organic chemicals 427.6 2.9 29 Organic chemicals 604.0 2.9 73 Articles of iron or steel 249.5 1.7 73 Articles of iron or steel 307.3 1.5 76 Aluminum 248.4 1.7 74 Copper and articles thereof 231.7 1.1 74 Copper and articles thereof 157.4 1.1 76 Aluminum 204.9 1.0
10 Major 12,449.7 83.8 10 Major 17,867.3 87.0
Others 2,407.5 16.2 Others 2,662.9 13.0
Total 14,857.2 100.0 Total 20,530.2 100.0
2003
HS Commodities Value Share
(9) (10) (11) (12)
2004
HS Commodities Value Share
(13) (14) (15) (16)
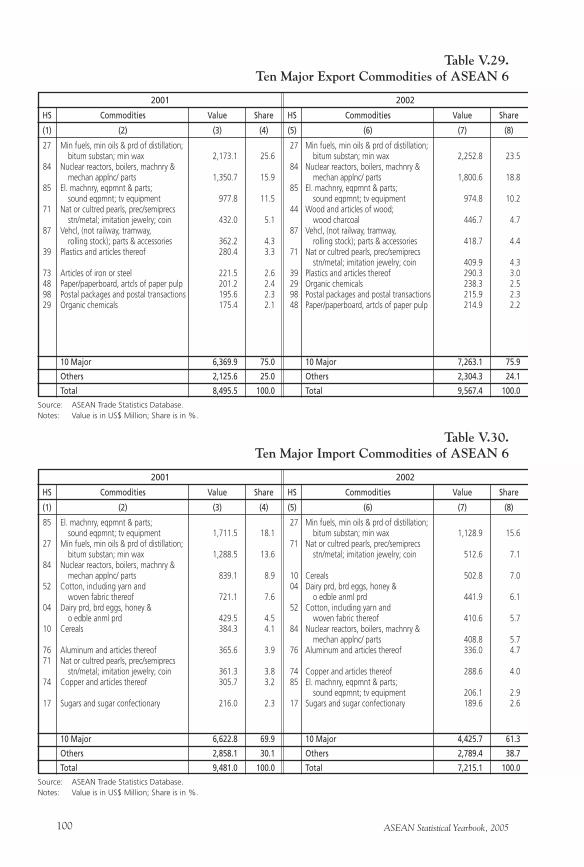
ASEAN Statistical Yearbook, 2005100
Table V.29.Ten Major Export Commodities of ASEAN 6
27 Min fuels, min oils & prd of distillation; 27 Min fuels, min oils & prd of distillation; bitum substan; min wax 2,173.1 25.6 bitum substan; min wax 2,252.8 23.5 84 Nuclear reactors, boilers, machnry & 84 Nuclear reactors, boilers, machnry & mechan applnc/ parts 1,350.7 15.9 mechan applnc/ parts 1,800.6 18.8 85 El. machnry, eqpmnt & parts; 85 El. machnry, eqpmnt & parts; sound eqpmnt; tv equipment 977.8 11.5 sound eqpmnt; tv equipment 974.8 10.2 71 Nat or cultred pearls, prec/semiprecs 44 Wood and articles of wood; stn/metal; imitation jewelry; coin 432.0 5.1 wood charcoal 446.7 4.7 87 Vehcl, (not railway, tramway, 87 Vehcl, (not railway, tramway, rolling stock); parts & accessories 362.2 4.3 rolling stock); parts & accessories 418.7 4.4 39 Plastics and articles thereof 280.4 3.3 71 Nat or cultred pearls, prec/semiprecs stn/metal; imitation jewelry; coin 409.9 4.3 73 Articles of iron or steel 221.5 2.6 39 Plastics and articles thereof 290.3 3.0 48 Paper/paperboard, artcls of paper pulp 201.2 2.4 29 Organic chemicals 238.3 2.5 98 Postal packages and postal transactions 195.6 2.3 98 Postal packages and postal transactions 215.9 2.3 29 Organic chemicals 175.4 2.1 48 Paper/paperboard, artcls of paper pulp 214.9 2.2
10 Major 6,369.9 75.0 10 Major 7,263.1 75.9
Others 2,125.6 25.0 Others 2,304.3 24.1
Total 8,495.5 100.0 Total 9,567.4 100.0
2001
HS Commodities Value Share
Source: ASEAN Trade Statistics Database.Notes: Value is in US$ Million; Share is in %.
(1) (2) (3) (4)
2002
HS Commodities Value Share
(5) (6) (7) (8)
Table V.30.Ten Major Import Commodities of ASEAN 6
85 El. machnry, eqpmnt & parts; 27 Min fuels, min oils & prd of distillation; sound eqpmnt; tv equipment 1,711.5 18.1 bitum substan; min wax 1,128.9 15.6 27 Min fuels, min oils & prd of distillation; 71 Nat or cultred pearls, prec/semiprecs bitum substan; min wax 1,288.5 13.6 stn/metal; imitation jewelry; coin 512.6 7.1 84 Nuclear reactors, boilers, machnry & mechan applnc/ parts 839.1 8.9 10 Cereals 502.8 7.0 52 Cotton, including yarn and 04 Dairy prd, brd eggs, honey & woven fabric thereof 721.1 7.6 o edble anml prd 441.9 6.1 04 Dairy prd, brd eggs, honey & 52 Cotton, including yarn and o edble anml prd 429.5 4.5 woven fabric thereof 410.6 5.7 10 Cereals 384.3 4.1 84 Nuclear reactors, boilers, machnry & mechan applnc/ parts 408.8 5.7 76 Aluminum and articles thereof 365.6 3.9 76 Aluminum and articles thereof 336.0 4.7 71 Nat or cultred pearls, prec/semiprecs stn/metal; imitation jewelry; coin 361.3 3.8 74 Copper and articles thereof 288.6 4.0 74 Copper and articles thereof 305.7 3.2 85 El. machnry, eqpmnt & parts; sound eqpmnt; tv equipment 206.1 2.9 17 Sugars and sugar confectionary 216.0 2.3 17 Sugars and sugar confectionary 189.6 2.6
10 Major 6,622.8 69.9 10 Major 4,425.7 61.3
Others 2,858.1 30.1 Others 2,789.4 38.7
Total 9,481.0 100.0 Total 7,215.1 100.0
2001
HS Commodities Value Share
Source: ASEAN Trade Statistics Database.Notes: Value is in US$ Million; Share is in %.
(1) (2) (3) (4)
2002
HS Commodities Value Share
(5) (6) (7) (8)
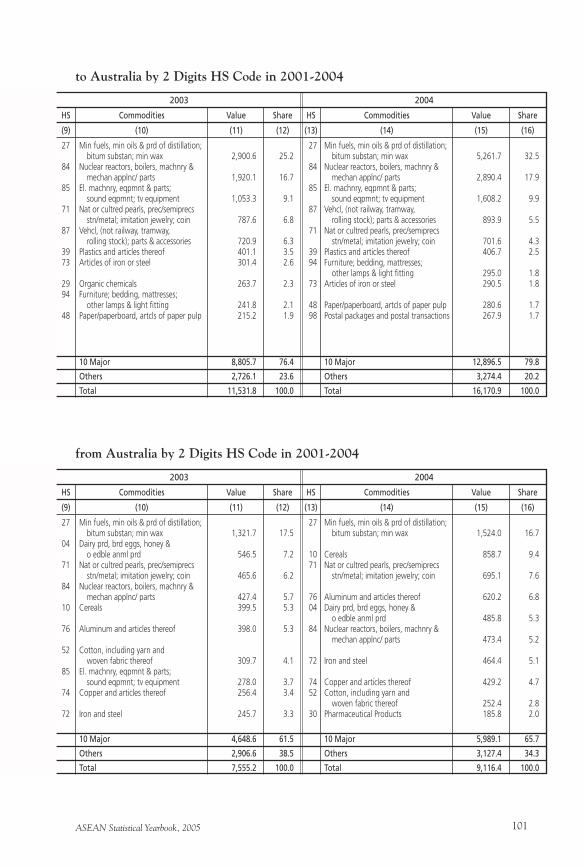
ASEAN Statistical Yearbook, 2005 101
to Australia by 2 Digits HS Code in 2001-2004
27 Min fuels, min oils & prd of distillation; 27 Min fuels, min oils & prd of distillation; bitum substan; min wax 2,900.6 25.2 bitum substan; min wax 5,261.7 32.5 84 Nuclear reactors, boilers, machnry & 84 Nuclear reactors, boilers, machnry & mechan applnc/ parts 1,920.1 16.7 mechan applnc/ parts 2,890.4 17.9 85 El. machnry, eqpmnt & parts; 85 El. machnry, eqpmnt & parts; sound eqpmnt; tv equipment 1,053.3 9.1 sound eqpmnt; tv equipment 1,608.2 9.9 71 Nat or cultred pearls, prec/semiprecs 87 Vehcl, (not railway, tramway, stn/metal; imitation jewelry; coin 787.6 6.8 rolling stock); parts & accessories 893.9 5.5 87 Vehcl, (not railway, tramway, 71 Nat or cultred pearls, prec/semiprecs rolling stock); parts & accessories 720.9 6.3 stn/metal; imitation jewelry; coin 701.6 4.3 39 Plastics and articles thereof 401.1 3.5 39 Plastics and articles thereof 406.7 2.5 73 Articles of iron or steel 301.4 2.6 94 Furniture; bedding, mattresses; other lamps & light fitting 295.0 1.8 29 Organic chemicals 263.7 2.3 73 Articles of iron or steel 290.5 1.8 94 Furniture; bedding, mattresses; other lamps & light fitting 241.8 2.1 48 Paper/paperboard, artcls of paper pulp 280.6 1.7 48 Paper/paperboard, artcls of paper pulp 215.2 1.9 98 Postal packages and postal transactions 267.9 1.7
10 Major 8,805.7 76.4 10 Major 12,896.5 79.8
Others 2,726.1 23.6 Others 3,274.4 20.2
Total 11,531.8 100.0 Total 16,170.9 100.0
2003
HS Commodities Value Share
(9) (10) (11) (12)
2004
HS Commodities Value Share
(13) (14) (15) (16)
from Australia by 2 Digits HS Code in 2001-2004
27 Min fuels, min oils & prd of distillation; 27 Min fuels, min oils & prd of distillation; bitum substan; min wax 1,321.7 17.5 bitum substan; min wax 1,524.0 16.7 04 Dairy prd, brd eggs, honey & o edble anml prd 546.5 7.2 10 Cereals 858.7 9.4 71 Nat or cultred pearls, prec/semiprecs 71 Nat or cultred pearls, prec/semiprecs stn/metal; imitation jewelry; coin 465.6 6.2 stn/metal; imitation jewelry; coin 695.1 7.6 84 Nuclear reactors, boilers, machnry & mechan applnc/ parts 427.4 5.7 76 Aluminum and articles thereof 620.2 6.8 10 Cereals 399.5 5.3 04 Dairy prd, brd eggs, honey & o edble anml prd 485.8 5.3 76 Aluminum and articles thereof 398.0 5.3 84 Nuclear reactors, boilers, machnry & mechan applnc/ parts 473.4 5.2 52 Cotton, including yarn and woven fabric thereof 309.7 4.1 72 Iron and steel 464.4 5.1 85 El. machnry, eqpmnt & parts; sound eqpmnt; tv equipment 278.0 3.7 74 Copper and articles thereof 429.2 4.7 74 Copper and articles thereof 256.4 3.4 52 Cotton, including yarn and woven fabric thereof 252.4 2.8 72 Iron and steel 245.7 3.3 30 Pharmaceutical Products 185.8 2.0
10 Major 4,648.6 61.5 10 Major 5,989.1 65.7
Others 2,906.6 38.5 Others 3,127.4 34.3
Total 7,555.2 100.0 Total 9,116.4 100.0
2003
HS Commodities Value Share
(9) (10) (11) (12)
2004
HS Commodities Value Share
(13) (14) (15) (16)
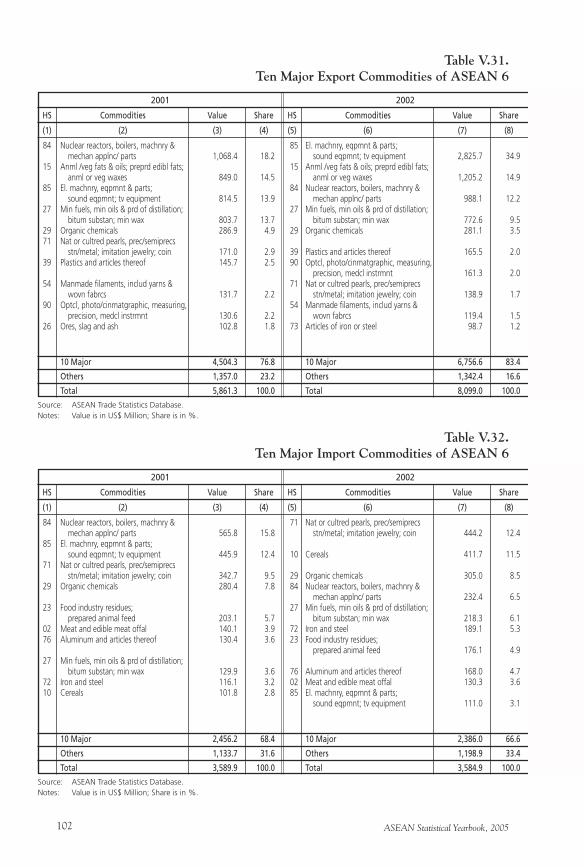
ASEAN Statistical Yearbook, 2005102
Table V.31.Ten Major Export Commodities of ASEAN 6
84 Nuclear reactors, boilers, machnry & 85 El. machnry, eqpmnt & parts; mechan applnc/ parts 1,068.4 18.2 sound eqpmnt; tv equipment 2,825.7 34.9 15 Anml /veg fats & oils; preprd edibl fats; 15 Anml /veg fats & oils; preprd edibl fats; anml or veg waxes 849.0 14.5 anml or veg waxes 1,205.2 14.9 85 El. machnry, eqpmnt & parts; 84 Nuclear reactors, boilers, machnry & sound eqpmnt; tv equipment 814.5 13.9 mechan applnc/ parts 988.1 12.2 27 Min fuels, min oils & prd of distillation; 27 Min fuels, min oils & prd of distillation; bitum substan; min wax 803.7 13.7 bitum substan; min wax 772.6 9.5 29 Organic chemicals 286.9 4.9 29 Organic chemicals 281.1 3.5 71 Nat or cultred pearls, prec/semiprecs stn/metal; imitation jewelry; coin 171.0 2.9 39 Plastics and articles thereof 165.5 2.0 39 Plastics and articles thereof 145.7 2.5 90 Optcl, photo/cinmatgraphic, measuring, precision, medcl instrmnt 161.3 2.0 54 Manmade filaments, includ yarns & 71 Nat or cultred pearls, prec/semiprecs wovn fabrcs 131.7 2.2 stn/metal; imitation jewelry; coin 138.9 1.7 90 Optcl, photo/cinmatgraphic, measuring, 54 Manmade filaments, includ yarns & precision, medcl instrmnt 130.6 2.2 wovn fabrcs 119.4 1.5 26 Ores, slag and ash 102.8 1.8 73 Articles of iron or steel 98.7 1.2
10 Major 4,504.3 76.8 10 Major 6,756.6 83.4
Others 1,357.0 23.2 Others 1,342.4 16.6
Total 5,861.3 100.0 Total 8,099.0 100.0
2001
HS Commodities Value Share
Source: ASEAN Trade Statistics Database.Notes: Value is in US$ Million; Share is in %.
(1) (2) (3) (4)
2002
HS Commodities Value Share
(5) (6) (7) (8)
Table V.32.Ten Major Import Commodities of ASEAN 6
84 Nuclear reactors, boilers, machnry & 71 Nat or cultred pearls, prec/semiprecs mechan applnc/ parts 565.8 15.8 stn/metal; imitation jewelry; coin 444.2 12.4 85 El. machnry, eqpmnt & parts; sound eqpmnt; tv equipment 445.9 12.4 10 Cereals 411.7 11.5 71 Nat or cultred pearls, prec/semiprecs stn/metal; imitation jewelry; coin 342.7 9.5 29 Organic chemicals 305.0 8.5 29 Organic chemicals 280.4 7.8 84 Nuclear reactors, boilers, machnry & mechan applnc/ parts 232.4 6.5 23 Food industry residues; 27 Min fuels, min oils & prd of distillation; prepared animal feed 203.1 5.7 bitum substan; min wax 218.3 6.1 02 Meat and edible meat offal 140.1 3.9 72 Iron and steel 189.1 5.3 76 Aluminum and articles thereof 130.4 3.6 23 Food industry residues; prepared animal feed 176.1 4.9 27 Min fuels, min oils & prd of distillation; bitum substan; min wax 129.9 3.6 76 Aluminum and articles thereof 168.0 4.7 72 Iron and steel 116.1 3.2 02 Meat and edible meat offal 130.3 3.6 10 Cereals 101.8 2.8 85 El. machnry, eqpmnt & parts; sound eqpmnt; tv equipment 111.0 3.1
10 Major 2,456.2 68.4 10 Major 2,386.0 66.6
Others 1,133.7 31.6 Others 1,198.9 33.4
Total 3,589.9 100.0 Total 3,584.9 100.0
2001
HS Commodities Value Share
Source: ASEAN Trade Statistics Database.Notes: Value is in US$ Million; Share is in %.
(1) (2) (3) (4)
2002
HS Commodities Value Share
(5) (6) (7) (8)
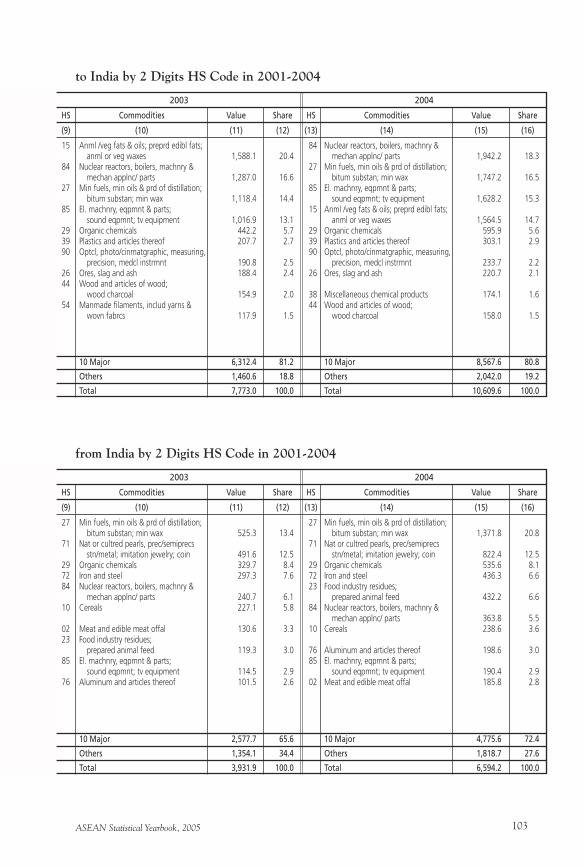
ASEAN Statistical Yearbook, 2005 103
to India by 2 Digits HS Code in 2001-2004
15 Anml /veg fats & oils; preprd edibl fats; 84 Nuclear reactors, boilers, machnry & anml or veg waxes 1,588.1 20.4 mechan applnc/ parts 1,942.2 18.3 84 Nuclear reactors, boilers, machnry & 27 Min fuels, min oils & prd of distillation; mechan applnc/ parts 1,287.0 16.6 bitum substan; min wax 1,747.2 16.5 27 Min fuels, min oils & prd of distillation; 85 El. machnry, eqpmnt & parts; bitum substan; min wax 1,118.4 14.4 sound eqpmnt; tv equipment 1,628.2 15.3 85 El. machnry, eqpmnt & parts; 15 Anml /veg fats & oils; preprd edibl fats; sound eqpmnt; tv equipment 1,016.9 13.1 anml or veg waxes 1,564.5 14.7 29 Organic chemicals 442.2 5.7 29 Organic chemicals 595.9 5.6 39 Plastics and articles thereof 207.7 2.7 39 Plastics and articles thereof 303.1 2.9 90 Optcl, photo/cinmatgraphic, measuring, 90 Optcl, photo/cinmatgraphic, measuring, precision, medcl instrmnt 190.8 2.5 precision, medcl instrmnt 233.7 2.2 26 Ores, slag and ash 188.4 2.4 26 Ores, slag and ash 220.7 2.1 44 Wood and articles of wood; wood charcoal 154.9 2.0 38 Miscellaneous chemical products 174.1 1.6 54 Manmade filaments, includ yarns & 44 Wood and articles of wood; wovn fabrcs 117.9 1.5 wood charcoal 158.0 1.5
10 Major 6,312.4 81.2 10 Major 8,567.6 80.8
Others 1,460.6 18.8 Others 2,042.0 19.2
Total 7,773.0 100.0 Total 10,609.6 100.0
2003
HS Commodities Value Share
(9) (10) (11) (12)
2004
HS Commodities Value Share
(13) (14) (15) (16)
from India by 2 Digits HS Code in 2001-2004
27 Min fuels, min oils & prd of distillation; 27 Min fuels, min oils & prd of distillation; bitum substan; min wax 525.3 13.4 bitum substan; min wax 1,371.8 20.8 71 Nat or cultred pearls, prec/semiprecs 71 Nat or cultred pearls, prec/semiprecs stn/metal; imitation jewelry; coin 491.6 12.5 stn/metal; imitation jewelry; coin 822.4 12.5 29 Organic chemicals 329.7 8.4 29 Organic chemicals 535.6 8.1 72 Iron and steel 297.3 7.6 72 Iron and steel 436.3 6.6 84 Nuclear reactors, boilers, machnry & 23 Food industry residues; mechan applnc/ parts 240.7 6.1 prepared animal feed 432.2 6.6 10 Cereals 227.1 5.8 84 Nuclear reactors, boilers, machnry & mechan applnc/ parts 363.8 5.5 02 Meat and edible meat offal 130.6 3.3 10 Cereals 238.6 3.6 23 Food industry residues; prepared animal feed 119.3 3.0 76 Aluminum and articles thereof 198.6 3.0 85 El. machnry, eqpmnt & parts; 85 El. machnry, eqpmnt & parts; sound eqpmnt; tv equipment 114.5 2.9 sound eqpmnt; tv equipment 190.4 2.9 76 Aluminum and articles thereof 101.5 2.6 02 Meat and edible meat offal 185.8 2.8
10 Major 2,577.7 65.6 10 Major 4,775.6 72.4
Others 1,354.1 34.4 Others 1,818.7 27.6
Total 3,931.9 100.0 Total 6,594.2 100.0
2003
HS Commodities Value Share
(9) (10) (11) (12)
2004
HS Commodities Value Share
(13) (14) (15) (16)
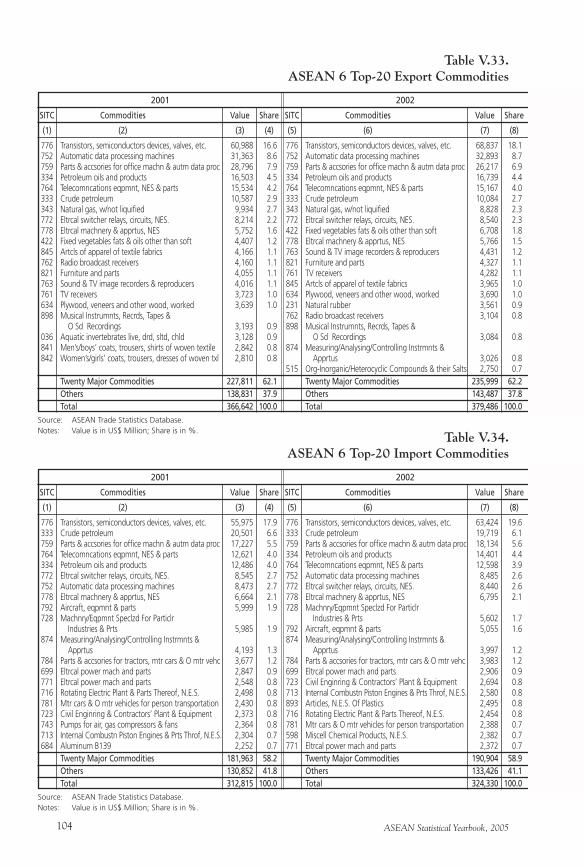
ASEAN Statistical Yearbook, 2005104
Table V.33.ASEAN 6 Top-20 Export Commodities
776 Transistors, semiconductors devices, valves, etc. 60,988 16.6 752 Automatic data processing machines 31,363 8.6 759 Parts & accsories for office machn & autm data proc 28,796 7.9 334 Petroleum oils and products 16,503 4.5 764 Telecomncations eqpmnt, NES & parts 15,534 4.2 333 Crude petroleum 10,587 2.9 343 Natural gas, w/not liquified 9,934 2.7 772 Eltrcal switcher relays, circuits, NES. 8,214 2.2 778 Eltrcal machnery & apprtus, NES 5,752 1.6 422 Fixed vegetables fats & oils other than soft 4,407 1.2 845 Artcls of apparel of textile fabrics 4,166 1.1 762 Radio broadcast receivers 4,160 1.1 821 Furniture and parts 4,055 1.1 763 Sound & TV image recorders & reproducers 4,016 1.1 761 TV receivers 3,723 1.0 634 Plywood, veneers and other wood, worked 3,639 1.0 898 Musical Instrumnts, Recrds, Tapes & O Sd Recordings 3,193 0.9 036 Aquatic invertebrates live, drd, sltd, chld 3,128 0.9 841 Men’s/boys’ coats, trousers, shirts of woven textile 2,842 0.8 842 Women’s/girls’ coats, trousers, dresses of woven txl 2,810 0.8
Twenty Major Commodities 227,811 62.1 Others 138,831 37.9 Total 366,642 100.0
2001
SITC Commodities Value Share
Source: ASEAN Trade Statistics Database.Notes: Value is in US$ Million; Share is in %.
(1) (2) (3) (4)
776 Transistors, semiconductors devices, valves, etc. 68,837 18.1 752 Automatic data processing machines 32,893 8.7 759 Parts & accsories for office machn & autm data proc 26,217 6.9 334 Petroleum oils and products 16,739 4.4 764 Telecomncations eqpmnt, NES & parts 15,167 4.0 333 Crude petroleum 10,084 2.7 343 Natural gas, w/not liquified 8,828 2.3 772 Eltrcal switcher relays, circuits, NES. 8,540 2.3 422 Fixed vegetables fats & oils other than soft 6,708 1.8 778 Eltrcal machnery & apprtus, NES 5,766 1.5 763 Sound & TV image recorders & reproducers 4,431 1.2 821 Furniture and parts 4,327 1.1 761 TV receivers 4,282 1.1 845 Artcls of apparel of textile fabrics 3,965 1.0 634 Plywood, veneers and other wood, worked 3,690 1.0 231 Natural rubber 3,561 0.9 762 Radio broadcast receivers 3,104 0.8 898 Musical Instrumnts, Recrds, Tapes & O Sd Recordings 3,084 0.8 874 Measuring/Analysing/Controlling Instrmnts & Apprtus 3,026 0.8 515 Org-Inorganic/Heterocyclic Compounds & their Salts 2,750 0.7 Twenty Major Commodities 235,999 62.2 Others 143,487 37.8 Total 379,486 100.0
2002
SITC Commodities Value Share
(5) (6) (7) (8)
Table V.34.ASEAN 6 Top-20 Import Commodities
776 Transistors, semiconductors devices, valves, etc. 55,975 17.9 333 Crude petroleum 20,501 6.6 759 Parts & accsories for office machn & autm data proc 17,227 5.5 764 Telecomncations eqpmnt, NES & parts 12,621 4.0 334 Petroleum oils and products 12,486 4.0 772 Eltrcal switcher relays, circuits, NES. 8,545 2.7 752 Automatic data processing machines 8,473 2.7 778 Eltrcal machnery & apprtus, NES 6,664 2.1 792 Aircraft, eqpmnt & parts 5,999 1.9 728 Machnry/Eqpmnt Speclzd For Particlr Industries & Prts 5,985 1.9 874 Measuring/Analysing/Controlling Instrmnts & Apprtus 4,193 1.3 784 Parts & accsories for tractors, mtr cars & O mtr vehc 3,677 1.2 699 Eltrcal power mach and parts 2,847 0.9 771 Eltrcal power mach and parts 2,548 0.8 716 Rotating Electric Plant & Parts Thereof, N.E.S. 2,498 0.8 781 Mtr cars & O mtr vehicles for person transportation 2,430 0.8 723 Civil Enginring & Contractors’ Plant & Equipment 2,373 0.8 743 Pumps for air, gas compressors & fans 2,364 0.8 713 Internal Combustn Piston Engines & Prts Throf, N.E.S. 2,304 0.7 684 Aluminum B139 2,252 0.7 Twenty Major Commodities 181,963 58.2 Others 130,852 41.8 Total 312,815 100.0
2001
SITC Commodities Value Share
Source: ASEAN Trade Statistics Database.Notes: Value is in US$ Million; Share is in %.
(1) (2) (3) (4)
776 Transistors, semiconductors devices, valves, etc. 63,424 19.6 333 Crude petroleum 19,719 6.1 759 Parts & accsories for office machn & autm data proc 18,134 5.6 334 Petroleum oils and products 14,401 4.4 764 Telecomncations eqpmnt, NES & parts 12,598 3.9 752 Automatic data processing machines 8,485 2.6 772 Eltrcal switcher relays, circuits, NES. 8,440 2.6 778 Eltrcal machnery & apprtus, NES 6,795 2.1 728 Machnry/Eqpmnt Speclzd For Particlr Industries & Prts 5,602 1.7 792 Aircraft, eqpmnt & parts 5,055 1.6 874 Measuring/Analysing/Controlling Instrmnts & Apprtus 3,997 1.2 784 Parts & accsories for tractors, mtr cars & O mtr vehc 3,983 1.2 699 Eltrcal power mach and parts 2,906 0.9 723 Civil Enginring & Contractors’ Plant & Equipment 2,694 0.8 713 Internal Combustn Piston Engines & Prts Throf, N.E.S. 2,580 0.8 893 Articles, N.E.S. Of Plastics 2,495 0.8 716 Rotating Electric Plant & Parts Thereof, N.E.S. 2,454 0.8 781 Mtr cars & O mtr vehicles for person transportation 2,388 0.7 598 Miscell Chemical Products, N.E.S. 2,382 0.7 771 Eltrcal power mach and parts 2,372 0.7 Twenty Major Commodities 190,904 58.9 Others 133,426 41.1 Total 324,330 100.0
2002
SITC Commodities Value Share
(5) (6) (7) (8)
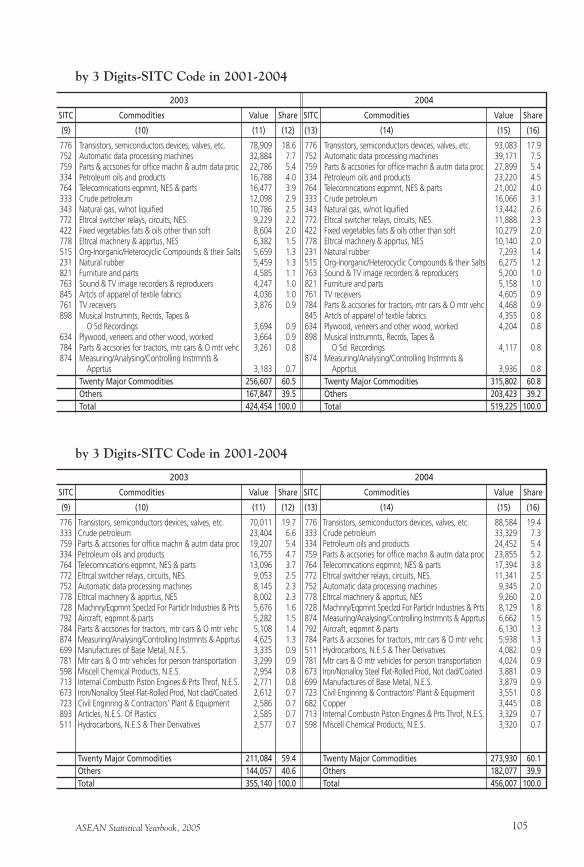
ASEAN Statistical Yearbook, 2005 105
by 3 Digits-SITC Code in 2001-2004
776 Transistors, semiconductors devices, valves, etc. 78,909 18.6 752 Automatic data processing machines 32,884 7.7 759 Parts & accsories for office machn & autm data proc 22,786 5.4 334 Petroleum oils and products 16,788 4.0 764 Telecomncations eqpmnt, NES & parts 16,477 3.9 333 Crude petroleum 12,098 2.9 343 Natural gas, w/not liquified 10,786 2.5 772 Eltrcal switcher relays, circuits, NES. 9,229 2.2 422 Fixed vegetables fats & oils other than soft 8,604 2.0 778 Eltrcal machnery & apprtus, NES 6,382 1.5 515 Org-Inorganic/Heterocyclic Compounds & their Salts 5,659 1.3 231 Natural rubber 5,459 1.3 821 Furniture and parts 4,585 1.1 763 Sound & TV image recorders & reproducers 4,247 1.0 845 Artcls of apparel of textile fabrics 4,036 1.0 761 TV receivers 3,876 0.9 898 Musical Instrumnts, Recrds, Tapes & O Sd Recordings 3,694 0.9 634 Plywood, veneers and other wood, worked 3,664 0.9 784 Parts & accsories for tractors, mtr cars & O mtr vehc 3,261 0.8 874 Measuring/Analysing/Controlling Instrmnts & Apprtus 3,183 0.7 Twenty Major Commodities 256,607 60.5 Others 167,847 39.5 Total 424,454 100.0
2003
SITC Commodities Value Share
(9) (10) (11) (12)
776 Transistors, semiconductors devices, valves, etc. 93,083 17.9 752 Automatic data processing machines 39,171 7.5 759 Parts & accsories for office machn & autm data proc 27,899 5.4 334 Petroleum oils and products 23,220 4.5 764 Telecomncations eqpmnt, NES & parts 21,002 4.0 333 Crude petroleum 16,066 3.1 343 Natural gas, w/not liquified 13,442 2.6 772 Eltrcal switcher relays, circuits, NES. 11,888 2.3 422 Fixed vegetables fats & oils other than soft 10,279 2.0 778 Eltrcal machnery & apprtus, NES 10,140 2.0 231 Natural rubber 7,293 1.4 515 Org-Inorganic/Heterocyclic Compounds & their Salts 6,275 1.2 763 Sound & TV image recorders & reproducers 5,200 1.0 821 Furniture and parts 5,158 1.0 761 TV receivers 4,605 0.9 784 Parts & accsories for tractors, mtr cars & O mtr vehc 4,468 0.9 845 Artcls of apparel of textile fabrics 4,355 0.8 634 Plywood, veneers and other wood, worked 4,204 0.8 898 Musical Instrumnts, Recrds, Tapes & O Sd Recordings 4,117 0.8 874 Measuring/Analysing/Controlling Instrmnts & Apprtus 3,936 0.8 Twenty Major Commodities 315,802 60.8 Others 203,423 39.2 Total 519,225 100.0
2004
SITC Commodities Value Share
(13) (14) (15) (16)
by 3 Digits-SITC Code in 2001-2004
776 Transistors, semiconductors devices, valves, etc. 70,011 19.7 333 Crude petroleum 23,404 6.6 759 Parts & accsories for office machn & autm data proc 19,207 5.4 334 Petroleum oils and products 16,755 4.7 764 Telecomncations eqpmnt, NES & parts 13,096 3.7 772 Eltrcal switcher relays, circuits, NES. 9,053 2.5 752 Automatic data processing machines 8,145 2.3 778 Eltrcal machnery & apprtus, NES 8,002 2.3 728 Machnry/Eqpmnt Speclzd For Particlr Industries & Prts 5,676 1.6 792 Aircraft, eqpmnt & parts 5,282 1.5 784 Parts & accsories for tractors, mtr cars & O mtr vehc 5,108 1.4 874 Measuring/Analysing/Controlling Instrmnts & Apprtus 4,625 1.3 699 Manufactures of Base Metal, N.E.S. 3,335 0.9 781 Mtr cars & O mtr vehicles for person transportation 3,299 0.9 598 Miscell Chemical Products, N.E.S. 2,954 0.8 713 Internal Combustn Piston Engines & Prts Throf, N.E.S. 2,771 0.8 673 Iron/Nonalloy Steel Flat-Rolled Prod, Not clad/Coated 2,612 0.7 723 Civil Enginring & Contractors’ Plant & Equipment 2,586 0.7 893 Articles, N.E.S. Of Plastics 2,585 0.7 511 Hydrocarbons, N.E.S & Their Derivatives 2,577 0.7
Twenty Major Commodities 211,084 59.4 Others 144,057 40.6 Total 355,140 100.0
2003
SITC Commodities Value Share
(9) (10) (11) (12)
776 Transistors, semiconductors devices, valves, etc. 88,584 19.4 333 Crude petroleum 33,329 7.3 334 Petroleum oils and products 24,452 5.4 759 Parts & accsories for office machn & autm data proc 23,855 5.2 764 Telecomncations eqpmnt, NES & parts 17,394 3.8 772 Eltrcal switcher relays, circuits, NES. 11,341 2.5 752 Automatic data processing machines 9,345 2.0 778 Eltrcal machnery & apprtus, NES 9,260 2.0 728 Machnry/Eqpmnt Speclzd For Particlr Industries & Prts 8,129 1.8 874 Measuring/Analysing/Controlling Instrmnts & Apprtus 6,662 1.5 792 Aircraft, eqpmnt & parts 6,130 1.3 784 Parts & accsories for tractors, mtr cars & O mtr vehc 5,938 1.3 511 Hydrocarbons, N.E.S & Their Derivatives 4,082 0.9 781 Mtr cars & O mtr vehicles for person transportation 4,024 0.9 673 Iron/Nonalloy Steel Flat-Rolled Prod, Not clad/Coated 3,881 0.9 699 Manufactures of Base Metal, N.E.S. 3,879 0.9 723 Civil Enginring & Contractors’ Plant & Equipment 3,551 0.8 682 Copper 3,445 0.8 713 Internal Combustn Piston Engines & Prts Throf, N.E.S. 3,329 0.7 598 Miscell Chemical Products, N.E.S. 3,320 0.7
Twenty Major Commodities 273,930 60.1 Others 182,077 39.9 Total 456,007 100.0
2004
SITC Commodities Value Share
(13) (14) (15) (16)
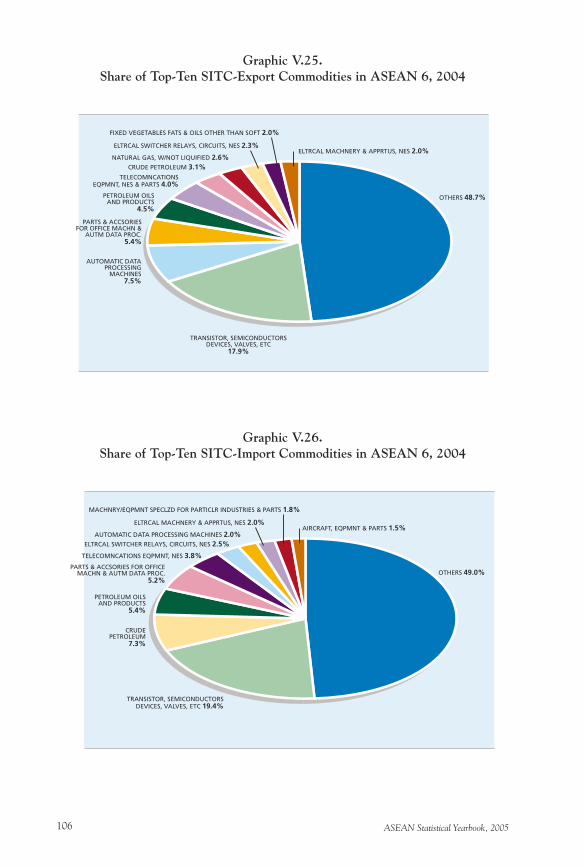
ASEAN Statistical Yearbook, 2005106
Graphic V.25.Share of Top-Ten SITC-Export Commodities in ASEAN 6, 2004
Graphic V.26.Share of Top-Ten SITC-Import Commodities in ASEAN 6, 2004
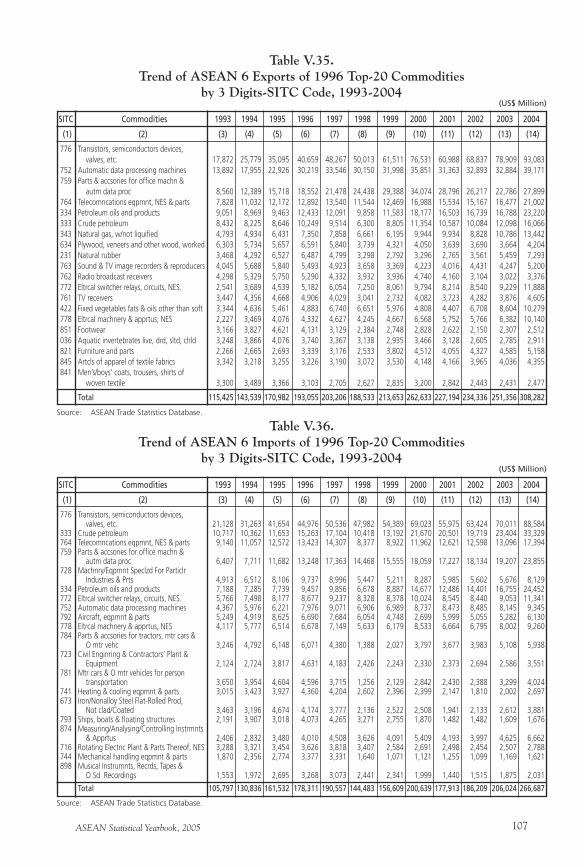
ASEAN Statistical Yearbook, 2005 107
Table V.35.Trend of ASEAN 6 Exports of 1996 Top-20 Commodities
by 3 Digits-SITC Code, 1993-2004
SITC Commodities 1993 1994 1995 1996 1997 1998 1999 2000 2001 2002 2003 2004
(1) (2) (3) (4) (5) (6) (7) (8) (9) (10) (11) (12) (13) (14)
776 Transistors, semiconductors devices, valves, etc. 17,872 25,779 35,095 40,659 48,267 50,013 61,511 76,531 60,988 68,837 78,909 93,083 752 Automatic data processing machines 13,892 17,955 22,926 30,219 33,546 30,150 31,998 35,851 31,363 32,893 32,884 39,171 759 Parts & accsories for office machn & autm data proc 8,560 12,389 15,718 18,552 21,478 24,438 29,388 34,074 28,796 26,217 22,786 27,899 764 Telecomncations eqpmnt, NES & parts 7,828 11,032 12,172 12,892 13,540 11,544 12,469 16,988 15,534 15,167 16,477 21,002 334 Petroleum oils and products 9,051 8,969 9,463 12,433 12,091 9,858 11,583 18,177 16,503 16,739 16,788 23,220 333 Crude petroleum 8,432 8,225 8,646 10,249 9,514 6,300 8,805 11,354 10,587 10,084 12,098 16,066 343 Natural gas, w/not liquified 4,793 4,934 6,431 7,350 7,858 6,661 6,195 9,944 9,934 8,828 10,786 13,442 634 Plywood, veneers and other wood, worked 6,303 5,734 5,657 6,591 5,840 3,739 4,321 4,050 3,639 3,690 3,664 4,204 231 Natural rubber 3,468 4,292 6,527 6,487 4,799 3,298 2,792 3,296 2,765 3,561 5,459 7,293 763 Sound & TV image recorders & reproducers 4,045 5,688 5,840 5,493 4,923 3,658 3,369 4,223 4,016 4,431 4,247 5,200 762 Radio broadcast receivers 4,298 5,329 5,750 5,290 4,332 3,932 3,936 4,740 4,160 3,104 3,022 3,376 772 Eltrcal switcher relays, circuits, NES. 2,541 3,689 4,539 5,182 6,054 7,250 8,061 9,794 8,214 8,540 9,229 11,888 761 TV receivers 3,447 4,356 4,668 4,906 4,029 3,041 2,732 4,082 3,723 4,282 3,876 4,605 422 Fixed vegetables fats & oils other than soft 3,344 4,636 5,461 4,883 6,740 6,651 5,976 4,808 4,407 6,708 8,604 10,279 778 Eltrcal machnery & apprtus, NES 2,227 3,469 4,076 4,332 4,627 4,245 4,667 6,568 5,752 5,766 6,382 10,140 851 Footwear 3,166 3,827 4,621 4,131 3,129 2,384 2,748 2,828 2,622 2,150 2,307 2,512 036 Aquatic invertebrates live, drd, sltd, chld 3,248 3,866 4,076 3,740 3,367 3,138 2,935 3,466 3,128 2,605 2,785 2,911 821 Furniture and parts 2,266 2,665 2,693 3,339 3,176 2,533 3,802 4,512 4,055 4,327 4,585 5,158 845 Artcls of apparel of textile fabrics 3,342 3,218 3,255 3,226 3,190 3,072 3,530 4,148 4,166 3,965 4,036 4,355 841 Men’s/boys’ coats, trousers, shirts of woven textile 3,300 3,489 3,366 3,103 2,705 2,627 2,835 3,200 2,842 2,443 2,431 2,477
Total 115,425 143,539 170,982 193,055 203,206 188,533 213,653 262,633 227,194 234,336 251,356 308,282
Source: ASEAN Trade Statistics Database.
(US$ Million)
Table V.36.Trend of ASEAN 6 Imports of 1996 Top-20 Commodities
by 3 Digits-SITC Code, 1993-2004(US$ Million)
SITC Commodities 1993 1994 1995 1996 1997 1998 1999 2000 2001 2002 2003 2004
(1) (2) (3) (4) (5) (6) (7) (8) (9) (10) (11) (12) (13) (14)
776 Transistors, semiconductors devices, valves, etc. 21,128 31,263 41,654 44,976 50,536 47,982 54,389 69,023 55,975 63,424 70,011 88,584 333 Crude petroleum 10,717 10,362 11,653 15,263 17,104 10,418 13,192 21,670 20,501 19,719 23,404 33,329 764 Telecomncations eqpmnt, NES & parts 9,140 11,057 12,572 13,423 14,307 8,377 8,922 11,962 12,621 12,598 13,096 17,394 759 Parts & accsories for office machn & autm data proc 6,407 7,711 11,682 13,248 17,363 14,468 15,555 18,059 17,227 18,134 19,207 23,855 728 Machnry/Eqpmnt Speclzd For Particlr Industries & Prts 4,913 6,512 8,106 9,737 8,996 5,447 5,211 8,287 5,985 5,602 5,676 8,129 334 Petroleum oils and products 7,188 7,285 7,739 9,457 9,856 6,678 8,887 14,677 12,486 14,401 16,755 24,452 772 Eltrcal switcher relays, circuits, NES. 5,766 7,498 8,177 8,677 9,237 8,328 8,378 10,024 8,545 8,440 9,053 11,341 752 Automatic data processing machines 4,367 5,976 6,221 7,976 9,071 6,906 6,989 8,737 8,473 8,485 8,145 9,345 792 Aircraft, eqpmnt & parts 5,249 4,919 8,625 6,690 7,684 6,054 4,748 2,699 5,999 5,055 5,282 6,130 778 Eltrcal machnery & apprtus, NES 4,117 5,777 6,514 6,678 7,149 5,633 6,179 8,533 6,664 6,795 8,002 9,260 784 Parts & accsories for tractors, mtr cars & O mtr vehc 3,246 4,792 6,148 6,071 4,380 1,388 2,027 3,797 3,677 3,983 5,108 5,938 723 Civil Enginring & Contractors’ Plant & Equipment 2,124 2,724 3,817 4,631 4,183 2,426 2,243 2,330 2,373 2,694 2,586 3,551 781 Mtr cars & O mtr vehicles for person transportation 3,650 3,954 4,604 4,596 3,715 1,256 2,129 2,842 2,430 2,388 3,299 4,024 741 Heating & cooling eqpmnt & parts 3,015 3,423 3,927 4,360 4,204 2,602 2,396 2,399 2,147 1,810 2,002 2,697 673 Iron/Nonalloy Steel Flat-Rolled Prod, Not clad/Coated 3,463 3,196 4,674 4,174 3,777 2,136 2,522 2,508 1,941 2,133 2,612 3,881 793 Ships, boats & floating structures 2,191 3,907 3,018 4,073 4,265 3,271 2,755 1,870 1,482 1,482 1,609 1,676 874 Measuring/Analysing/Controlling Instrmnts & Apprtus 2,406 2,832 3,480 4,010 4,508 3,626 4,091 5,409 4,193 3,997 4,625 6,662 716 Rotating Electric Plant & Parts Thereof, NES 3,288 3,321 3,454 3,626 3,818 3,407 2,584 2,691 2,498 2,454 2,507 2,788 744 Mechanical handling eqpmnt & parts 1,870 2,356 2,774 3,377 3,331 1,640 1,071 1,121 1,255 1,099 1,169 1,621 898 Musical Instrumnts, Recrds, Tapes & O Sd Recordings 1,553 1,972 2,695 3,268 3,073 2,441 2,341 1,999 1,440 1,515 1,875 2,031
Total 105,797 130,836 161,532 178,311 190,557 144,483 156,609 200,639 177,913 186,209 206,024 266,687
Source: ASEAN Trade Statistics Database.
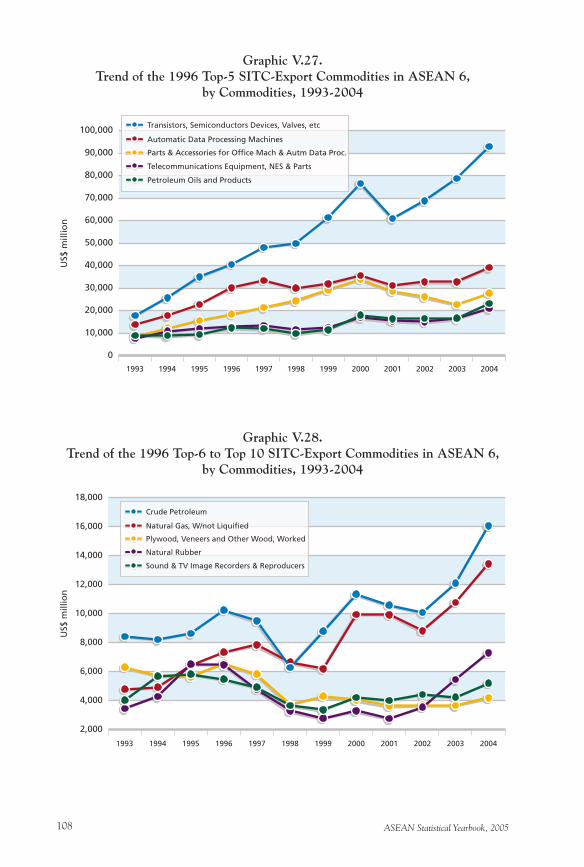
ASEAN Statistical Yearbook, 2005108
Graphic V.27.Trend of the 1996 Top-5 SITC-Export Commodities in ASEAN 6,
by Commodities, 1993-2004
Graphic V.28.Trend of the 1996 Top-6 to Top 10 SITC-Export Commodities in ASEAN 6,
by Commodities, 1993-2004
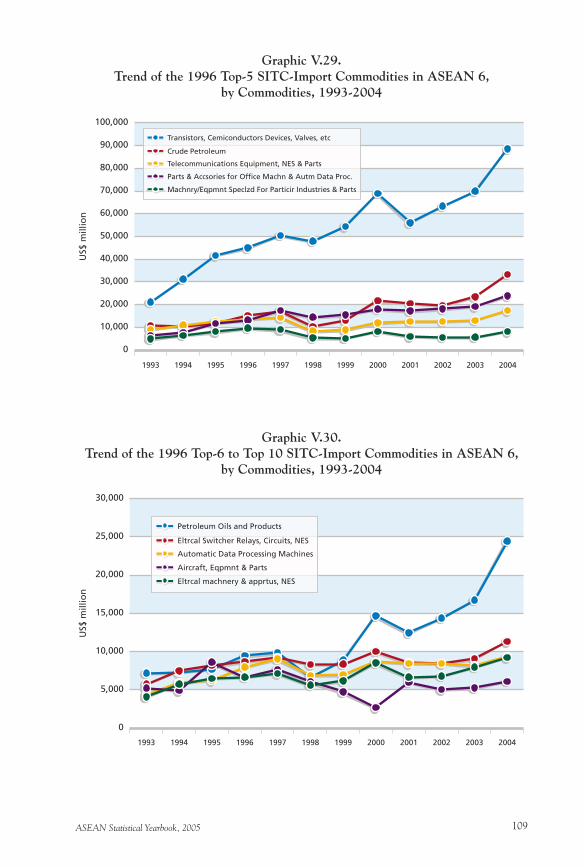
ASEAN Statistical Yearbook, 2005 109
Graphic V.29.Trend of the 1996 Top-5 SITC-Import Commodities in ASEAN 6,
by Commodities, 1993-2004
Graphic V.30.Trend of the 1996 Top-6 to Top 10 SITC-Import Commodities in ASEAN 6,
by Commodities, 1993-2004
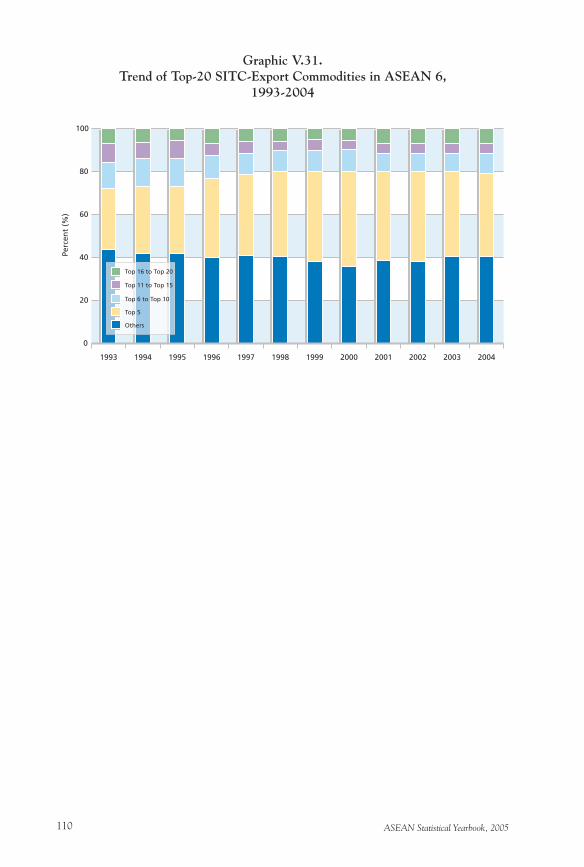
ASEAN Statistical Yearbook, 2005110
Graphic V.31.Trend of Top-20 SITC-Export Commodities in ASEAN 6,
1993-2004
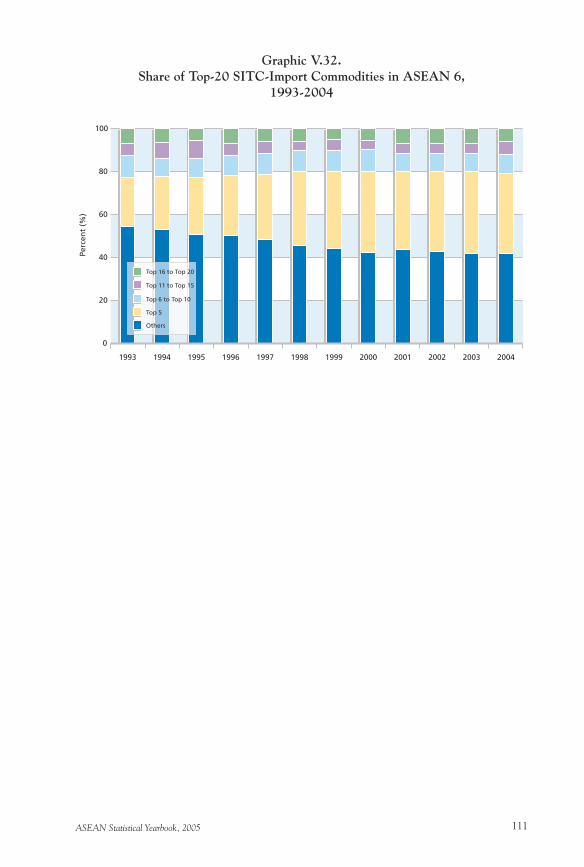
ASEAN Statistical Yearbook, 2005 111
Graphic V.32.Share of Top-20 SITC-Import Commodities in ASEAN 6,
1993-2004
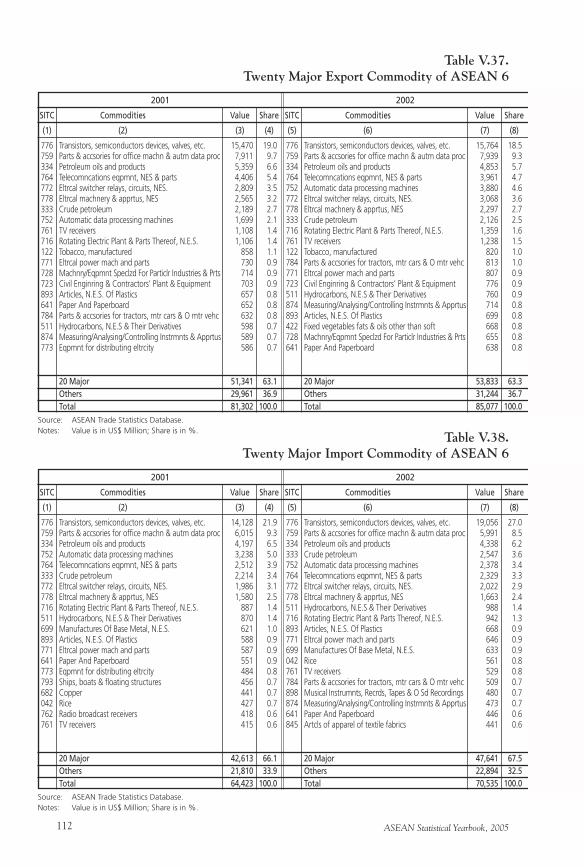
ASEAN Statistical Yearbook, 2005112
Table V.37.Twenty Major Export Commodity of ASEAN 6
776 Transistors, semiconductors devices, valves, etc. 15,470 19.0 759 Parts & accsories for office machn & autm data proc 7,911 9.7 334 Petroleum oils and products 5,359 6.6 764 Telecomncations eqpmnt, NES & parts 4,406 5.4 772 Eltrcal switcher relays, circuits, NES. 2,809 3.5 778 Eltrcal machnery & apprtus, NES 2,565 3.2 333 Crude petroleum 2,189 2.7 752 Automatic data processing machines 1,699 2.1 761 TV receivers 1,108 1.4 716 Rotating Electric Plant & Parts Thereof, N.E.S. 1,106 1.4 122 Tobacco, manufactured 858 1.1 771 Eltrcal power mach and parts 730 0.9 728 Machnry/Eqpmnt Speclzd For Particlr Industries & Prts 714 0.9 723 Civil Enginring & Contractors’ Plant & Equipment 703 0.9 893 Articles, N.E.S. Of Plastics 657 0.8 641 Paper And Paperboard 652 0.8 784 Parts & accsories for tractors, mtr cars & O mtr vehc 632 0.8 511 Hydrocarbons, N.E.S & Their Derivatives 598 0.7 874 Measuring/Analysing/Controlling Instrmnts & Apprtus 589 0.7 773 Eqpmnt for distributing eltrcity 586 0.7
20 Major 51,341 63.1 Others 29,961 36.9 Total 81,302 100.0
2001
SITC Commodities Value Share
Source: ASEAN Trade Statistics Database.Notes: Value is in US$ Million; Share is in %.
(1) (2) (3) (4)
776 Transistors, semiconductors devices, valves, etc. 15,764 18.5 759 Parts & accsories for office machn & autm data proc 7,939 9.3 334 Petroleum oils and products 4,853 5.7 764 Telecomncations eqpmnt, NES & parts 3,961 4.7 752 Automatic data processing machines 3,880 4.6 772 Eltrcal switcher relays, circuits, NES. 3,068 3.6 778 Eltrcal machnery & apprtus, NES 2,297 2.7 333 Crude petroleum 2,126 2.5 716 Rotating Electric Plant & Parts Thereof, N.E.S. 1,359 1.6 761 TV receivers 1,238 1.5 122 Tobacco, manufactured 820 1.0 784 Parts & accsories for tractors, mtr cars & O mtr vehc 813 1.0 771 Eltrcal power mach and parts 807 0.9 723 Civil Enginring & Contractors’ Plant & Equipment 776 0.9 511 Hydrocarbons, N.E.S & Their Derivatives 760 0.9 874 Measuring/Analysing/Controlling Instrmnts & Apprtus 714 0.8 893 Articles, N.E.S. Of Plastics 699 0.8 422 Fixed vegetables fats & oils other than soft 668 0.8 728 Machnry/Eqpmnt Speclzd For Particlr Industries & Prts 655 0.8 641 Paper And Paperboard 638 0.8
20 Major 53,833 63.3 Others 31,244 36.7 Total 85,077 100.0
2002
SITC Commodities Value Share
(5) (6) (7) (8)
Table V.38.Twenty Major Import Commodity of ASEAN 6
776 Transistors, semiconductors devices, valves, etc. 14,128 21.9 759 Parts & accsories for office machn & autm data proc 6,015 9.3 334 Petroleum oils and products 4,197 6.5 752 Automatic data processing machines 3,238 5.0 764 Telecomncations eqpmnt, NES & parts 2,512 3.9 333 Crude petroleum 2,214 3.4 772 Eltrcal switcher relays, circuits, NES. 1,986 3.1 778 Eltrcal machnery & apprtus, NES 1,580 2.5 716 Rotating Electric Plant & Parts Thereof, N.E.S. 887 1.4 511 Hydrocarbons, N.E.S & Their Derivatives 870 1.4 699 Manufactures Of Base Metal, N.E.S. 621 1.0 893 Articles, N.E.S. Of Plastics 588 0.9 771 Eltrcal power mach and parts 587 0.9 641 Paper And Paperboard 551 0.9 773 Eqpmnt for distributing eltrcity 484 0.8 793 Ships, boats & floating structures 456 0.7 682 Copper 441 0.7 042 Rice 427 0.7 762 Radio broadcast receivers 418 0.6 761 TV receivers 415 0.6
20 Major 42,613 66.1 Others 21,810 33.9 Total 64,423 100.0
2001
SITC Commodities Value Share
Source: ASEAN Trade Statistics Database.Notes: Value is in US$ Million; Share is in %.
(1) (2) (3) (4)
776 Transistors, semiconductors devices, valves, etc. 19,056 27.0 759 Parts & accsories for office machn & autm data proc 5,991 8.5 334 Petroleum oils and products 4,338 6.2 333 Crude petroleum 2,547 3.6 752 Automatic data processing machines 2,378 3.4 764 Telecomncations eqpmnt, NES & parts 2,329 3.3 772 Eltrcal switcher relays, circuits, NES. 2,022 2.9 778 Eltrcal machnery & apprtus, NES 1,663 2.4 511 Hydrocarbons, N.E.S & Their Derivatives 988 1.4 716 Rotating Electric Plant & Parts Thereof, N.E.S. 942 1.3 893 Articles, N.E.S. Of Plastics 668 0.9 771 Eltrcal power mach and parts 646 0.9 699 Manufactures Of Base Metal, N.E.S. 633 0.9 042 Rice 561 0.8 761 TV receivers 529 0.8 784 Parts & accsories for tractors, mtr cars & O mtr vehc 509 0.7 898 Musical Instrumnts, Recrds, Tapes & O Sd Recordings 480 0.7 874 Measuring/Analysing/Controlling Instrmnts & Apprtus 473 0.7 641 Paper And Paperboard 446 0.6 845 Artcls of apparel of textile fabrics 441 0.6 20 Major 47,641 67.5 Others 22,894 32.5 Total 70,535 100.0
2002
SITC Commodities Value Share
(5) (6) (7) (8)
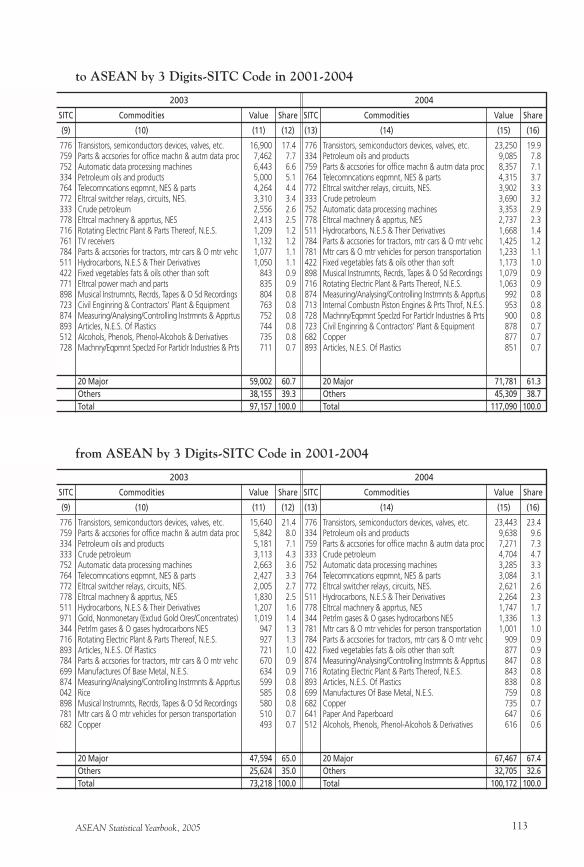
ASEAN Statistical Yearbook, 2005 113
to ASEAN by 3 Digits-SITC Code in 2001-2004
776 Transistors, semiconductors devices, valves, etc. 16,900 17.4 759 Parts & accsories for office machn & autm data proc 7,462 7.7 752 Automatic data processing machines 6,443 6.6 334 Petroleum oils and products 5,000 5.1 764 Telecomncations eqpmnt, NES & parts 4,264 4.4 772 Eltrcal switcher relays, circuits, NES. 3,310 3.4 333 Crude petroleum 2,556 2.6 778 Eltrcal machnery & apprtus, NES 2,413 2.5 716 Rotating Electric Plant & Parts Thereof, N.E.S. 1,209 1.2 761 TV receivers 1,132 1.2 784 Parts & accsories for tractors, mtr cars & O mtr vehc 1,077 1.1 511 Hydrocarbons, N.E.S & Their Derivatives 1,050 1.1 422 Fixed vegetables fats & oils other than soft 843 0.9 771 Eltrcal power mach and parts 835 0.9 898 Musical Instrumnts, Recrds, Tapes & O Sd Recordings 804 0.8 723 Civil Enginring & Contractors’ Plant & Equipment 763 0.8 874 Measuring/Analysing/Controlling Instrmnts & Apprtus 752 0.8 893 Articles, N.E.S. Of Plastics 744 0.8 512 Alcohols, Phenols, Phenol-Alcohols & Derivatives 735 0.8 728 Machnry/Eqpmnt Speclzd For Particlr Industries & Prts 711 0.7
20 Major 59,002 60.7 Others 38,155 39.3 Total 97,157 100.0
2003
SITC Commodities Value Share
(9) (10) (11) (12)
776 Transistors, semiconductors devices, valves, etc. 23,250 19.9 334 Petroleum oils and products 9,085 7.8 759 Parts & accsories for office machn & autm data proc 8,357 7.1 764 Telecomncations eqpmnt, NES & parts 4,315 3.7 772 Eltrcal switcher relays, circuits, NES. 3,902 3.3 333 Crude petroleum 3,690 3.2 752 Automatic data processing machines 3,353 2.9 778 Eltrcal machnery & apprtus, NES 2,737 2.3 511 Hydrocarbons, N.E.S & Their Derivatives 1,668 1.4 784 Parts & accsories for tractors, mtr cars & O mtr vehc 1,425 1.2 781 Mtr cars & O mtr vehicles for person transportation 1,233 1.1 422 Fixed vegetables fats & oils other than soft 1,173 1.0 898 Musical Instrumnts, Recrds, Tapes & O Sd Recordings 1,079 0.9 716 Rotating Electric Plant & Parts Thereof, N.E.S. 1,063 0.9 874 Measuring/Analysing/Controlling Instrmnts & Apprtus 992 0.8 713 Internal Combustn Piston Engines & Prts Throf, N.E.S. 953 0.8 728 Machnry/Eqpmnt Speclzd For Particlr Industries & Prts 900 0.8 723 Civil Enginring & Contractors’ Plant & Equipment 878 0.7 682 Copper 877 0.7 893 Articles, N.E.S. Of Plastics 851 0.7
20 Major 71,781 61.3 Others 45,309 38.7 Total 117,090 100.0
2004
SITC Commodities Value Share
(13) (14) (15) (16)
from ASEAN by 3 Digits-SITC Code in 2001-2004
776 Transistors, semiconductors devices, valves, etc. 15,640 21.4 759 Parts & accsories for office machn & autm data proc 5,842 8.0 334 Petroleum oils and products 5,181 7.1 333 Crude petroleum 3,113 4.3 752 Automatic data processing machines 2,663 3.6 764 Telecomncations eqpmnt, NES & parts 2,427 3.3 772 Eltrcal switcher relays, circuits, NES. 2,005 2.7 778 Eltrcal machnery & apprtus, NES 1,830 2.5 511 Hydrocarbons, N.E.S & Their Derivatives 1,207 1.6 971 Gold, Nonmonetary (Exclud Gold Ores/Concentrates) 1,019 1.4 344 Petrlm gases & O gases hydrocarbons NES 947 1.3 716 Rotating Electric Plant & Parts Thereof, N.E.S. 927 1.3 893 Articles, N.E.S. Of Plastics 721 1.0 784 Parts & accsories for tractors, mtr cars & O mtr vehc 670 0.9 699 Manufactures Of Base Metal, N.E.S. 634 0.9 874 Measuring/Analysing/Controlling Instrmnts & Apprtus 599 0.8 042 Rice 585 0.8 898 Musical Instrumnts, Recrds, Tapes & O Sd Recordings 580 0.8 781 Mtr cars & O mtr vehicles for person transportation 510 0.7 682 Copper 493 0.7
20 Major 47,594 65.0 Others 25,624 35.0 Total 73,218 100.0
2003
SITC Commodities Value Share
(9) (10) (11) (12)
776 Transistors, semiconductors devices, valves, etc. 23,443 23.4 334 Petroleum oils and products 9,638 9.6 759 Parts & accsories for office machn & autm data proc 7,271 7.3 333 Crude petroleum 4,704 4.7 752 Automatic data processing machines 3,285 3.3 764 Telecomncations eqpmnt, NES & parts 3,084 3.1 772 Eltrcal switcher relays, circuits, NES. 2,621 2.6 511 Hydrocarbons, N.E.S & Their Derivatives 2,264 2.3 778 Eltrcal machnery & apprtus, NES 1,747 1.7 344 Petrlm gases & O gases hydrocarbons NES 1,336 1.3 781 Mtr cars & O mtr vehicles for person transportation 1,001 1.0 784 Parts & accsories for tractors, mtr cars & O mtr vehc 909 0.9 422 Fixed vegetables fats & oils other than soft 877 0.9 874 Measuring/Analysing/Controlling Instrmnts & Apprtus 847 0.8 716 Rotating Electric Plant & Parts Thereof, N.E.S. 843 0.8 893 Articles, N.E.S. Of Plastics 838 0.8 699 Manufactures Of Base Metal, N.E.S. 759 0.8 682 Copper 735 0.7 641 Paper And Paperboard 647 0.6 512 Alcohols, Phenols, Phenol-Alcohols & Derivatives 616 0.6
20 Major 67,467 67.4 Others 32,705 32.6 Total 100,172 100.0
2004
SITC Commodities Value Share
(13) (14) (15) (16)
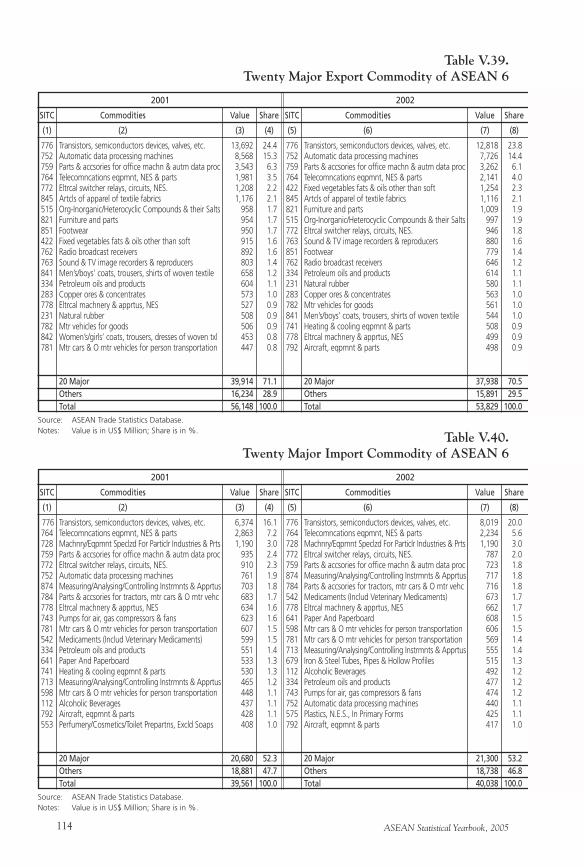
ASEAN Statistical Yearbook, 2005114
Table V.39.Twenty Major Export Commodity of ASEAN 6
776 Transistors, semiconductors devices, valves, etc. 13,692 24.4 752 Automatic data processing machines 8,568 15.3 759 Parts & accsories for office machn & autm data proc 3,543 6.3 764 Telecomncations eqpmnt, NES & parts 1,981 3.5 772 Eltrcal switcher relays, circuits, NES. 1,208 2.2 845 Artcls of apparel of textile fabrics 1,176 2.1 515 Org-Inorganic/Heterocyclic Compounds & their Salts 958 1.7 821 Furniture and parts 954 1.7 851 Footwear 950 1.7 422 Fixed vegetables fats & oils other than soft 915 1.6 762 Radio broadcast receivers 892 1.6 763 Sound & TV image recorders & reproducers 803 1.4 841 Men’s/boys’ coats, trousers, shirts of woven textile 658 1.2 334 Petroleum oils and products 604 1.1 283 Copper ores & concentrates 573 1.0 778 Eltrcal machnery & apprtus, NES 527 0.9 231 Natural rubber 508 0.9 782 Mtr vehicles for goods 506 0.9 842 Women’s/girls’ coats, trousers, dresses of woven txl 453 0.8 781 Mtr cars & O mtr vehicles for person transportation 447 0.8
20 Major 39,914 71.1 Others 16,234 28.9 Total 56,148 100.0
2001
SITC Commodities Value Share
Source: ASEAN Trade Statistics Database.Notes: Value is in US$ Million; Share is in %.
(1) (2) (3) (4)
776 Transistors, semiconductors devices, valves, etc. 12,818 23.8 752 Automatic data processing machines 7,726 14.4 759 Parts & accsories for office machn & autm data proc 3,262 6.1 764 Telecomncations eqpmnt, NES & parts 2,141 4.0 422 Fixed vegetables fats & oils other than soft 1,254 2.3 845 Artcls of apparel of textile fabrics 1,116 2.1 821 Furniture and parts 1,009 1.9 515 Org-Inorganic/Heterocyclic Compounds & their Salts 997 1.9 772 Eltrcal switcher relays, circuits, NES. 946 1.8 763 Sound & TV image recorders & reproducers 880 1.6 851 Footwear 779 1.4 762 Radio broadcast receivers 646 1.2 334 Petroleum oils and products 614 1.1 231 Natural rubber 580 1.1 283 Copper ores & concentrates 563 1.0 782 Mtr vehicles for goods 561 1.0 841 Men’s/boys’ coats, trousers, shirts of woven textile 544 1.0 741 Heating & cooling eqpmnt & parts 508 0.9 778 Eltrcal machnery & apprtus, NES 499 0.9 792 Aircraft, eqpmnt & parts 498 0.9
20 Major 37,938 70.5 Others 15,891 29.5 Total 53,829 100.0
2002
SITC Commodities Value Share
(5) (6) (7) (8)
Table V.40.Twenty Major Import Commodity of ASEAN 6
776 Transistors, semiconductors devices, valves, etc. 6,374 16.1 764 Telecomncations eqpmnt, NES & parts 2,863 7.2 728 Machnry/Eqpmnt Speclzd For Particlr Industries & Prts 1,190 3.0 759 Parts & accsories for office machn & autm data proc 935 2.4 772 Eltrcal switcher relays, circuits, NES. 910 2.3 752 Automatic data processing machines 761 1.9 874 Measuring/Analysing/Controlling Instrmnts & Apprtus 703 1.8 784 Parts & accsories for tractors, mtr cars & O mtr vehc 683 1.7 778 Eltrcal machnery & apprtus, NES 634 1.6 743 Pumps for air, gas compressors & fans 623 1.6 781 Mtr cars & O mtr vehicles for person transportation 607 1.5 542 Medicaments (Includ Veterinary Medicaments) 599 1.5 334 Petroleum oils and products 551 1.4 641 Paper And Paperboard 533 1.3 741 Heating & cooling eqpmnt & parts 530 1.3 713 Measuring/Analysing/Controlling Instrmnts & Apprtus 465 1.2 598 Mtr cars & O mtr vehicles for person transportation 448 1.1 112 Alcoholic Beverages 437 1.1 792 Aircraft, eqpmnt & parts 428 1.1 553 Perfumery/Cosmetics/Toilet Prepartns, Excld Soaps 408 1.0
20 Major 20,680 52.3 Others 18,881 47.7 Total 39,561 100.0
2001
SITC Commodities Value Share
Source: ASEAN Trade Statistics Database.Notes: Value is in US$ Million; Share is in %.
(1) (2) (3) (4)
776 Transistors, semiconductors devices, valves, etc. 8,019 20.0 764 Telecomncations eqpmnt, NES & parts 2,234 5.6 728 Machnry/Eqpmnt Speclzd For Particlr Industries & Prts 1,190 3.0 772 Eltrcal switcher relays, circuits, NES. 787 2.0 759 Parts & accsories for office machn & autm data proc 723 1.8 874 Measuring/Analysing/Controlling Instrmnts & Apprtus 717 1.8 784 Parts & accsories for tractors, mtr cars & O mtr vehc 716 1.8 542 Medicaments (Includ Veterinary Medicaments) 673 1.7 778 Eltrcal machnery & apprtus, NES 662 1.7 641 Paper And Paperboard 608 1.5 598 Mtr cars & O mtr vehicles for person transportation 606 1.5 781 Mtr cars & O mtr vehicles for person transportation 569 1.4 713 Measuring/Analysing/Controlling Instrmnts & Apprtus 555 1.4 679 Iron & Steel Tubes, Pipes & Hollow Profiles 515 1.3 112 Alcoholic Beverages 492 1.2 334 Petroleum oils and products 477 1.2 743 Pumps for air, gas compressors & fans 474 1.2 752 Automatic data processing machines 440 1.1 575 Plastics, N.E.S., In Primary Forms 425 1.1 792 Aircraft, eqpmnt & parts 417 1.0
20 Major 21,300 53.2 Others 18,738 46.8 Total 40,038 100.0
2002
SITC Commodities Value Share
(5) (6) (7) (8)
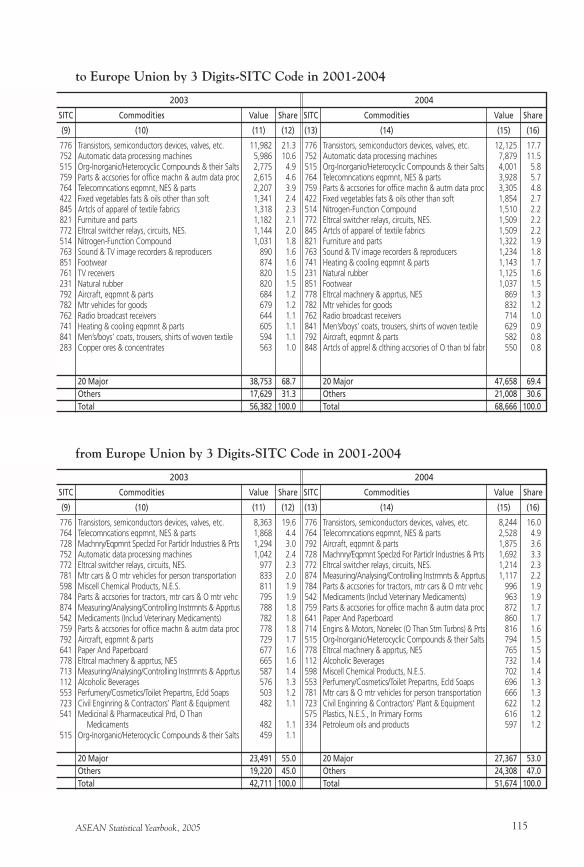
ASEAN Statistical Yearbook, 2005 115
to Europe Union by 3 Digits-SITC Code in 2001-2004
776 Transistors, semiconductors devices, valves, etc. 11,982 21.3 752 Automatic data processing machines 5,986 10.6 515 Org-Inorganic/Heterocyclic Compounds & their Salts 2,775 4.9 759 Parts & accsories for office machn & autm data proc 2,615 4.6 764 Telecomncations eqpmnt, NES & parts 2,207 3.9 422 Fixed vegetables fats & oils other than soft 1,341 2.4 845 Artcls of apparel of textile fabrics 1,318 2.3 821 Furniture and parts 1,182 2.1 772 Eltrcal switcher relays, circuits, NES. 1,144 2.0 514 Nitrogen-Function Compound 1,031 1.8 763 Sound & TV image recorders & reproducers 890 1.6 851 Footwear 874 1.6 761 TV receivers 820 1.5 231 Natural rubber 820 1.5 792 Aircraft, eqpmnt & parts 684 1.2 782 Mtr vehicles for goods 679 1.2 762 Radio broadcast receivers 644 1.1 741 Heating & cooling eqpmnt & parts 605 1.1 841 Men’s/boys’ coats, trousers, shirts of woven textile 594 1.1 283 Copper ores & concentrates 563 1.0
20 Major 38,753 68.7 Others 17,629 31.3 Total 56,382 100.0
2003
SITC Commodities Value Share
(9) (10) (11) (12)
776 Transistors, semiconductors devices, valves, etc. 12,125 17.7 752 Automatic data processing machines 7,879 11.5 515 Org-Inorganic/Heterocyclic Compounds & their Salts 4,001 5.8 764 Telecomncations eqpmnt, NES & parts 3,928 5.7 759 Parts & accsories for office machn & autm data proc 3,305 4.8 422 Fixed vegetables fats & oils other than soft 1,854 2.7 514 Nitrogen-Function Compound 1,510 2.2 772 Eltrcal switcher relays, circuits, NES. 1,509 2.2 845 Artcls of apparel of textile fabrics 1,509 2.2 821 Furniture and parts 1,322 1.9 763 Sound & TV image recorders & reproducers 1,234 1.8 741 Heating & cooling eqpmnt & parts 1,143 1.7 231 Natural rubber 1,125 1.6 851 Footwear 1,037 1.5 778 Eltrcal machnery & apprtus, NES 869 1.3 782 Mtr vehicles for goods 832 1.2 762 Radio broadcast receivers 714 1.0 841 Men’s/boys’ coats, trousers, shirts of woven textile 629 0.9 792 Aircraft, eqpmnt & parts 582 0.8 848 Artcls of apprel & clthing accsories of O than txl fabr 550 0.8
20 Major 47,658 69.4 Others 21,008 30.6 Total 68,666 100.0
2004
SITC Commodities Value Share
(13) (14) (15) (16)
from Europe Union by 3 Digits-SITC Code in 2001-2004
776 Transistors, semiconductors devices, valves, etc. 8,363 19.6 764 Telecomncations eqpmnt, NES & parts 1,868 4.4 728 Machnry/Eqpmnt Speclzd For Particlr Industries & Prts 1,294 3.0 752 Automatic data processing machines 1,042 2.4 772 Eltrcal switcher relays, circuits, NES. 977 2.3 781 Mtr cars & O mtr vehicles for person transportation 833 2.0 598 Miscell Chemical Products, N.E.S. 811 1.9 784 Parts & accsories for tractors, mtr cars & O mtr vehc 795 1.9 874 Measuring/Analysing/Controlling Instrmnts & Apprtus 788 1.8 542 Medicaments (Includ Veterinary Medicaments) 782 1.8 759 Parts & accsories for office machn & autm data proc 778 1.8 792 Aircraft, eqpmnt & parts 729 1.7 641 Paper And Paperboard 677 1.6 778 Eltrcal machnery & apprtus, NES 665 1.6 713 Measuring/Analysing/Controlling Instrmnts & Apprtus 587 1.4 112 Alcoholic Beverages 576 1.3 553 Perfumery/Cosmetics/Toilet Prepartns, Ecld Soaps 503 1.2 723 Civil Enginring & Contractors’ Plant & Equipment 482 1.1 541 Medicinal & Pharmaceutical Prd, O Than Medicaments 482 1.1 515 Org-Inorganic/Heterocyclic Compounds & their Salts 459 1.1
20 Major 23,491 55.0 Others 19,220 45.0 Total 42,711 100.0
2003
SITC Commodities Value Share
(9) (10) (11) (12)
776 Transistors, semiconductors devices, valves, etc. 8,244 16.0 764 Telecomncations eqpmnt, NES & parts 2,528 4.9 792 Aircraft, eqpmnt & parts 1,875 3.6 728 Machnry/Eqpmnt Speclzd For Particlr Industries & Prts 1,692 3.3 772 Eltrcal switcher relays, circuits, NES. 1,214 2.3 874 Measuring/Analysing/Controlling Instrmnts & Apprtus 1,117 2.2 784 Parts & accsories for tractors, mtr cars & O mtr vehc 996 1.9 542 Medicaments (Includ Veterinary Medicaments) 963 1.9 759 Parts & accsories for office machn & autm data proc 872 1.7 641 Paper And Paperboard 860 1.7 714 Engins & Motors, Nonelec (O Than Stm Turbns) & Prts 816 1.6 515 Org-Inorganic/Heterocyclic Compounds & their Salts 794 1.5 778 Eltrcal machnery & apprtus, NES 765 1.5 112 Alcoholic Beverages 732 1.4 598 Miscell Chemical Products, N.E.S. 702 1.4 553 Perfumery/Cosmetics/Toilet Prepartns, Ecld Soaps 696 1.3 781 Mtr cars & O mtr vehicles for person transportation 666 1.3 723 Civil Enginring & Contractors’ Plant & Equipment 622 1.2 575 Plastics, N.E.S., In Primary Forms 616 1.2 334 Petroleum oils and products 597 1.2
20 Major 27,367 53.0 Others 24,308 47.0 Total 51,674 100.0
2004
SITC Commodities Value Share
(13) (14) (15) (16)
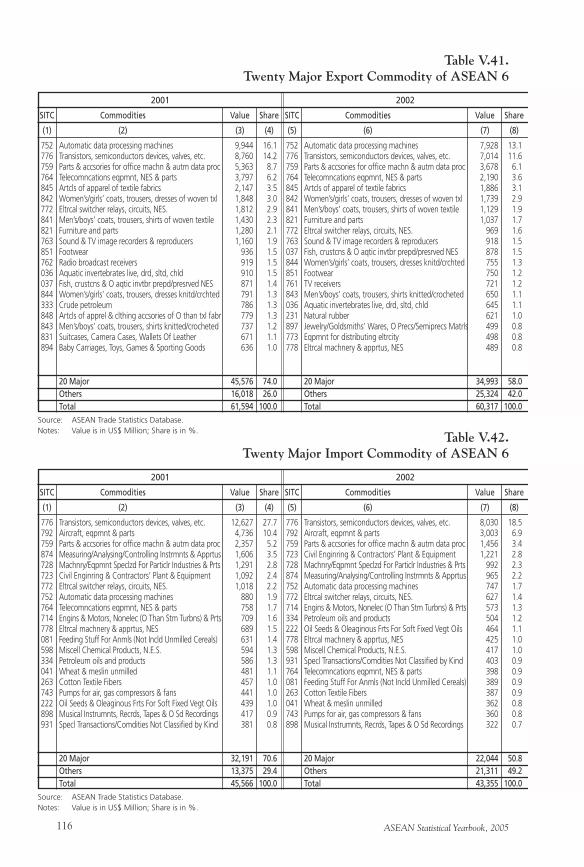
ASEAN Statistical Yearbook, 2005116
Table V.41.Twenty Major Export Commodity of ASEAN 6
752 Automatic data processing machines 9,944 16.1 776 Transistors, semiconductors devices, valves, etc. 8,760 14.2 759 Parts & accsories for office machn & autm data proc 5,363 8.7 764 Telecomncations eqpmnt, NES & parts 3,797 6.2 845 Artcls of apparel of textile fabrics 2,147 3.5 842 Women’s/girls’ coats, trousers, dresses of woven txl 1,848 3.0 772 Eltrcal switcher relays, circuits, NES. 1,812 2.9 841 Men’s/boys’ coats, trousers, shirts of woven textile 1,430 2.3 821 Furniture and parts 1,280 2.1 763 Sound & TV image recorders & reproducers 1,160 1.9 851 Footwear 936 1.5 762 Radio broadcast receivers 919 1.5 036 Aquatic invertebrates live, drd, sltd, chld 910 1.5 037 Fish, crustcns & O aqtic invtbr prepd/presrved NES 871 1.4 844 Women’s/girls’ coats, trousers, dresses knitd/crchted 791 1.3 333 Crude petroleum 786 1.3 848 Artcls of apprel & clthing accsories of O than txl fabr 779 1.3 843 Men’s/boys’ coats, trousers, shirts knitted/crocheted 737 1.2 831 Suitcases, Camera Cases, Wallets Of Leather 671 1.1 894 Baby Carriages, Toys, Games & Sporting Goods 636 1.0
20 Major 45,576 74.0 Others 16,018 26.0 Total 61,594 100.0
2001
SITC Commodities Value Share
Source: ASEAN Trade Statistics Database.Notes: Value is in US$ Million; Share is in %.
(1) (2) (3) (4)
752 Automatic data processing machines 7,928 13.1 776 Transistors, semiconductors devices, valves, etc. 7,014 11.6 759 Parts & accsories for office machn & autm data proc 3,678 6.1 764 Telecomncations eqpmnt, NES & parts 2,190 3.6 845 Artcls of apparel of textile fabrics 1,886 3.1 842 Women’s/girls’ coats, trousers, dresses of woven txl 1,739 2.9 841 Men’s/boys’ coats, trousers, shirts of woven textile 1,129 1.9 821 Furniture and parts 1,037 1.7 772 Eltrcal switcher relays, circuits, NES. 969 1.6 763 Sound & TV image recorders & reproducers 918 1.5 037 Fish, crustcns & O aqtic invtbr prepd/presrved NES 878 1.5 844 Women’s/girls’ coats, trousers, dresses knitd/crchted 755 1.3 851 Footwear 750 1.2 761 TV receivers 721 1.2 843 Men’s/boys’ coats, trousers, shirts knitted/crocheted 650 1.1 036 Aquatic invertebrates live, drd, sltd, chld 645 1.1 231 Natural rubber 621 1.0 897 Jewelry/Goldsmiths’ Wares, O Precs/Semiprecs Matrls 499 0.8 773 Eqpmnt for distributing eltrcity 498 0.8 778 Eltrcal machnery & apprtus, NES 489 0.8
20 Major 34,993 58.0 Others 25,324 42.0 Total 60,317 100.0
2002
SITC Commodities Value Share
(5) (6) (7) (8)
Table V.42.Twenty Major Import Commodity of ASEAN 6
776 Transistors, semiconductors devices, valves, etc. 12,627 27.7 792 Aircraft, eqpmnt & parts 4,736 10.4 759 Parts & accsories for office machn & autm data proc 2,357 5.2 874 Measuring/Analysing/Controlling Instrmnts & Apprtus 1,606 3.5 728 Machnry/Eqpmnt Speclzd For Particlr Industries & Prts 1,291 2.8 723 Civil Enginring & Contractors’ Plant & Equipment 1,092 2.4 772 Eltrcal switcher relays, circuits, NES. 1,018 2.2 752 Automatic data processing machines 880 1.9 764 Telecomncations eqpmnt, NES & parts 758 1.7 714 Engins & Motors, Nonelec (O Than Stm Turbns) & Prts 709 1.6 778 Eltrcal machnery & apprtus, NES 689 1.5 081 Feeding Stuff For Anmls (Not Incld Unmilled Cereals) 631 1.4 598 Miscell Chemical Products, N.E.S. 594 1.3 334 Petroleum oils and products 586 1.3 041 Wheat & meslin unmilled 481 1.1 263 Cotton Textile Fibers 457 1.0 743 Pumps for air, gas compressors & fans 441 1.0 222 Oil Seeds & Oleaginous Frts For Soft Fixed Vegt Oils 439 1.0 898 Musical Instrumnts, Recrds, Tapes & O Sd Recordings 417 0.9 931 Specl Transactions/Comdities Not Classified by Kind 381 0.8
20 Major 32,191 70.6 Others 13,375 29.4 Total 45,566 100.0
2001
SITC Commodities Value Share
Source: ASEAN Trade Statistics Database.Notes: Value is in US$ Million; Share is in %.
(1) (2) (3) (4)
776 Transistors, semiconductors devices, valves, etc. 8,030 18.5 792 Aircraft, eqpmnt & parts 3,003 6.9 759 Parts & accsories for office machn & autm data proc 1,456 3.4 723 Civil Enginring & Contractors’ Plant & Equipment 1,221 2.8 728 Machnry/Eqpmnt Speclzd For Particlr Industries & Prts 992 2.3 874 Measuring/Analysing/Controlling Instrmnts & Apprtus 965 2.2 752 Automatic data processing machines 747 1.7 772 Eltrcal switcher relays, circuits, NES. 627 1.4 714 Engins & Motors, Nonelec (O Than Stm Turbns) & Prts 573 1.3 334 Petroleum oils and products 504 1.2 222 Oil Seeds & Oleaginous Frts For Soft Fixed Vegt Oils 464 1.1 778 Eltrcal machnery & apprtus, NES 425 1.0 598 Miscell Chemical Products, N.E.S. 417 1.0 931 Specl Transactions/Comdities Not Classified by Kind 403 0.9 764 Telecomncations eqpmnt, NES & parts 398 0.9 081 Feeding Stuff For Anmls (Not Incld Unmilled Cereals) 389 0.9 263 Cotton Textile Fibers 387 0.9 041 Wheat & meslin unmilled 362 0.8 743 Pumps for air, gas compressors & fans 360 0.8 898 Musical Instrumnts, Recrds, Tapes & O Sd Recordings 322 0.7
20 Major 22,044 50.8 Others 21,311 49.2 Total 43,355 100.0
2002
SITC Commodities Value Share
(5) (6) (7) (8)
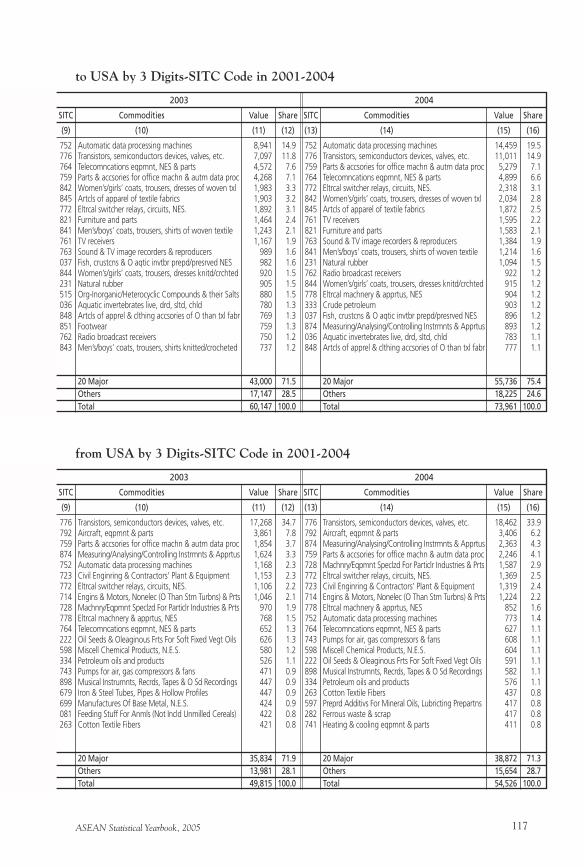
ASEAN Statistical Yearbook, 2005 117
to USA by 3 Digits-SITC Code in 2001-2004
752 Automatic data processing machines 8,941 14.9 776 Transistors, semiconductors devices, valves, etc. 7,097 11.8 764 Telecomncations eqpmnt, NES & parts 4,572 7.6 759 Parts & accsories for office machn & autm data proc 4,268 7.1 842 Women’s/girls’ coats, trousers, dresses of woven txl 1,983 3.3 845 Artcls of apparel of textile fabrics 1,903 3.2 772 Eltrcal switcher relays, circuits, NES. 1,892 3.1 821 Furniture and parts 1,464 2.4 841 Men’s/boys’ coats, trousers, shirts of woven textile 1,243 2.1 761 TV receivers 1,167 1.9 763 Sound & TV image recorders & reproducers 989 1.6 037 Fish, crustcns & O aqtic invtbr prepd/presrved NES 982 1.6 844 Women’s/girls’ coats, trousers, dresses knitd/crchted 920 1.5 231 Natural rubber 905 1.5 515 Org-Inorganic/Heterocyclic Compounds & their Salts 880 1.5 036 Aquatic invertebrates live, drd, sltd, chld 780 1.3 848 Artcls of apprel & clthing accsories of O than txl fabr 769 1.3 851 Footwear 759 1.3 762 Radio broadcast receivers 750 1.2 843 Men’s/boys’ coats, trousers, shirts knitted/crocheted 737 1.2
20 Major 43,000 71.5 Others 17,147 28.5 Total 60,147 100.0
2003
SITC Commodities Value Share
(9) (10) (11) (12)
752 Automatic data processing machines 14,459 19.5 776 Transistors, semiconductors devices, valves, etc. 11,011 14.9 759 Parts & accsories for office machn & autm data proc 5,279 7.1 764 Telecomncations eqpmnt, NES & parts 4,899 6.6 772 Eltrcal switcher relays, circuits, NES. 2,318 3.1 842 Women’s/girls’ coats, trousers, dresses of woven txl 2,034 2.8 845 Artcls of apparel of textile fabrics 1,872 2.5 761 TV receivers 1,595 2.2 821 Furniture and parts 1,583 2.1 763 Sound & TV image recorders & reproducers 1,384 1.9 841 Men’s/boys’ coats, trousers, shirts of woven textile 1,214 1.6 231 Natural rubber 1,094 1.5 762 Radio broadcast receivers 922 1.2 844 Women’s/girls’ coats, trousers, dresses knitd/crchted 915 1.2 778 Eltrcal machnery & apprtus, NES 904 1.2 333 Crude petroleum 903 1.2 037 Fish, crustcns & O aqtic invtbr prepd/presrved NES 896 1.2 874 Measuring/Analysing/Controlling Instrmnts & Apprtus 893 1.2 036 Aquatic invertebrates live, drd, sltd, chld 783 1.1 848 Artcls of apprel & clthing accsories of O than txl fabr 777 1.1
20 Major 55,736 75.4 Others 18,225 24.6 Total 73,961 100.0
2004
SITC Commodities Value Share
(13) (14) (15) (16)
from USA by 3 Digits-SITC Code in 2001-2004
776 Transistors, semiconductors devices, valves, etc. 17,268 34.7 792 Aircraft, eqpmnt & parts 3,861 7.8 759 Parts & accsories for office machn & autm data proc 1,854 3.7 874 Measuring/Analysing/Controlling Instrmnts & Apprtus 1,624 3.3 752 Automatic data processing machines 1,168 2.3 723 Civil Enginring & Contractors’ Plant & Equipment 1,153 2.3 772 Eltrcal switcher relays, circuits, NES. 1,106 2.2 714 Engins & Motors, Nonelec (O Than Stm Turbns) & Prts 1,046 2.1 728 Machnry/Eqpmnt Speclzd For Particlr Industries & Prts 970 1.9 778 Eltrcal machnery & apprtus, NES 768 1.5 764 Telecomncations eqpmnt, NES & parts 652 1.3 222 Oil Seeds & Oleaginous Frts For Soft Fixed Vegt Oils 626 1.3 598 Miscell Chemical Products, N.E.S. 580 1.2 334 Petroleum oils and products 526 1.1 743 Pumps for air, gas compressors & fans 471 0.9 898 Musical Instrumnts, Recrds, Tapes & O Sd Recordings 447 0.9 679 Iron & Steel Tubes, Pipes & Hollow Profiles 447 0.9 699 Manufactures Of Base Metal, N.E.S. 424 0.9 081 Feeding Stuff For Anmls (Not Incld Unmilled Cereals) 422 0.8 263 Cotton Textile Fibers 421 0.8
20 Major 35,834 71.9 Others 13,981 28.1 Total 49,815 100.0
2003
SITC Commodities Value Share
(9) (10) (11) (12)
776 Transistors, semiconductors devices, valves, etc. 18,462 33.9 792 Aircraft, eqpmnt & parts 3,406 6.2 874 Measuring/Analysing/Controlling Instrmnts & Apprtus 2,363 4.3 759 Parts & accsories for office machn & autm data proc 2,246 4.1 728 Machnry/Eqpmnt Speclzd For Particlr Industries & Prts 1,587 2.9 772 Eltrcal switcher relays, circuits, NES. 1,369 2.5 723 Civil Enginring & Contractors’ Plant & Equipment 1,319 2.4 714 Engins & Motors, Nonelec (O Than Stm Turbns) & Prts 1,224 2.2 778 Eltrcal machnery & apprtus, NES 852 1.6 752 Automatic data processing machines 773 1.4 764 Telecomncations eqpmnt, NES & parts 627 1.1 743 Pumps for air, gas compressors & fans 608 1.1 598 Miscell Chemical Products, N.E.S. 604 1.1 222 Oil Seeds & Oleaginous Frts For Soft Fixed Vegt Oils 591 1.1 898 Musical Instrumnts, Recrds, Tapes & O Sd Recordings 582 1.1 334 Petroleum oils and products 576 1.1 263 Cotton Textile Fibers 437 0.8 597 Preprd Additivs For Mineral Oils, Lubricting Prepartns 417 0.8 282 Ferrous waste & scrap 417 0.8 741 Heating & cooling eqpmnt & parts 411 0.8
20 Major 38,872 71.3 Others 15,654 28.7 Total 54,526 100.0
2004
SITC Commodities Value Share
(13) (14) (15) (16)
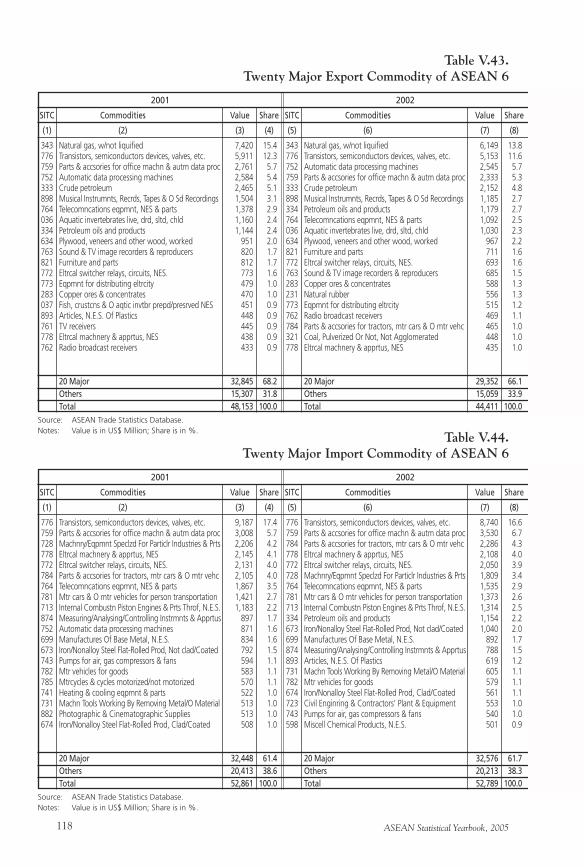
ASEAN Statistical Yearbook, 2005118
Table V.43.Twenty Major Export Commodity of ASEAN 6
343 Natural gas, w/not liquified 7,420 15.4 776 Transistors, semiconductors devices, valves, etc. 5,911 12.3 759 Parts & accsories for office machn & autm data proc 2,761 5.7 752 Automatic data processing machines 2,584 5.4 333 Crude petroleum 2,465 5.1 898 Musical Instrumnts, Recrds, Tapes & O Sd Recordings 1,504 3.1 764 Telecomncations eqpmnt, NES & parts 1,378 2.9 036 Aquatic invertebrates live, drd, sltd, chld 1,160 2.4 334 Petroleum oils and products 1,144 2.4 634 Plywood, veneers and other wood, worked 951 2.0 763 Sound & TV image recorders & reproducers 820 1.7 821 Furniture and parts 812 1.7 772 Eltrcal switcher relays, circuits, NES. 773 1.6 773 Eqpmnt for distributing eltrcity 479 1.0 283 Copper ores & concentrates 470 1.0 037 Fish, crustcns & O aqtic invtbr prepd/presrved NES 451 0.9 893 Articles, N.E.S. Of Plastics 448 0.9 761 TV receivers 445 0.9 778 Eltrcal machnery & apprtus, NES 438 0.9 762 Radio broadcast receivers 433 0.9
20 Major 32,845 68.2 Others 15,307 31.8 Total 48,153 100.0
2001
SITC Commodities Value Share
Source: ASEAN Trade Statistics Database.Notes: Value is in US$ Million; Share is in %.
(1) (2) (3) (4)
343 Natural gas, w/not liquified 6,149 13.8 776 Transistors, semiconductors devices, valves, etc. 5,153 11.6 752 Automatic data processing machines 2,545 5.7 759 Parts & accsories for office machn & autm data proc 2,333 5.3 333 Crude petroleum 2,152 4.8 898 Musical Instrumnts, Recrds, Tapes & O Sd Recordings 1,185 2.7 334 Petroleum oils and products 1,179 2.7 764 Telecomncations eqpmnt, NES & parts 1,092 2.5 036 Aquatic invertebrates live, drd, sltd, chld 1,030 2.3 634 Plywood, veneers and other wood, worked 967 2.2 821 Furniture and parts 711 1.6 772 Eltrcal switcher relays, circuits, NES. 693 1.6 763 Sound & TV image recorders & reproducers 685 1.5 283 Copper ores & concentrates 588 1.3 231 Natural rubber 556 1.3 773 Eqpmnt for distributing eltrcity 515 1.2 762 Radio broadcast receivers 469 1.1 784 Parts & accsories for tractors, mtr cars & O mtr vehc 465 1.0 321 Coal, Pulverized Or Not, Not Agglomerated 448 1.0 778 Eltrcal machnery & apprtus, NES 435 1.0
20 Major 29,352 66.1 Others 15,059 33.9 Total 44,411 100.0
2002
SITC Commodities Value Share
(5) (6) (7) (8)
Table V.44.Twenty Major Import Commodity of ASEAN 6
776 Transistors, semiconductors devices, valves, etc. 9,187 17.4 759 Parts & accsories for office machn & autm data proc 3,008 5.7 728 Machnry/Eqpmnt Speclzd For Particlr Industries & Prts 2,206 4.2 778 Eltrcal machnery & apprtus, NES 2,145 4.1 772 Eltrcal switcher relays, circuits, NES. 2,131 4.0 784 Parts & accsories for tractors, mtr cars & O mtr vehc 2,105 4.0 764 Telecomncations eqpmnt, NES & parts 1,867 3.5 781 Mtr cars & O mtr vehicles for person transportation 1,421 2.7 713 Internal Combustn Piston Engines & Prts Throf, N.E.S. 1,183 2.2 874 Measuring/Analysing/Controlling Instrmnts & Apprtus 897 1.7 752 Automatic data processing machines 871 1.6 699 Manufactures Of Base Metal, N.E.S. 834 1.6 673 Iron/Nonalloy Steel Flat-Rolled Prod, Not clad/Coated 792 1.5 743 Pumps for air, gas compressors & fans 594 1.1 782 Mtr vehicles for goods 583 1.1 785 Mtrcycles & cycles motorized/not motorized 570 1.1 741 Heating & cooling eqpmnt & parts 522 1.0 731 Machn Tools Working By Removing Metal/O Material 513 1.0 882 Photographic & Cinematographic Supplies 513 1.0 674 Iron/Nonalloy Steel Flat-Rolled Prod, Clad/Coated 508 1.0
20 Major 32,448 61.4 Others 20,413 38.6 Total 52,861 100.0
2001
SITC Commodities Value Share
Source: ASEAN Trade Statistics Database.Notes: Value is in US$ Million; Share is in %.
(1) (2) (3) (4)
776 Transistors, semiconductors devices, valves, etc. 8,740 16.6 759 Parts & accsories for office machn & autm data proc 3,530 6.7 784 Parts & accsories for tractors, mtr cars & O mtr vehc 2,286 4.3 778 Eltrcal machnery & apprtus, NES 2,108 4.0 772 Eltrcal switcher relays, circuits, NES. 2,050 3.9 728 Machnry/Eqpmnt Speclzd For Particlr Industries & Prts 1,809 3.4 764 Telecomncations eqpmnt, NES & parts 1,535 2.9 781 Mtr cars & O mtr vehicles for person transportation 1,373 2.6 713 Internal Combustn Piston Engines & Prts Throf, N.E.S. 1,314 2.5 334 Petroleum oils and products 1,154 2.2 673 Iron/Nonalloy Steel Flat-Rolled Prod, Not clad/Coated 1,040 2.0 699 Manufactures Of Base Metal, N.E.S. 892 1.7 874 Measuring/Analysing/Controlling Instrmnts & Apprtus 788 1.5 893 Articles, N.E.S. Of Plastics 619 1.2 731 Machn Tools Working By Removing Metal/O Material 605 1.1 782 Mtr vehicles for goods 579 1.1 674 Iron/Nonalloy Steel Flat-Rolled Prod, Clad/Coated 561 1.1 723 Civil Enginring & Contractors’ Plant & Equipment 553 1.0 743 Pumps for air, gas compressors & fans 540 1.0 598 Miscell Chemical Products, N.E.S. 501 0.9
20 Major 32,576 61.7 Others 20,213 38.3 Total 52,789 100.0
2002
SITC Commodities Value Share
(5) (6) (7) (8)
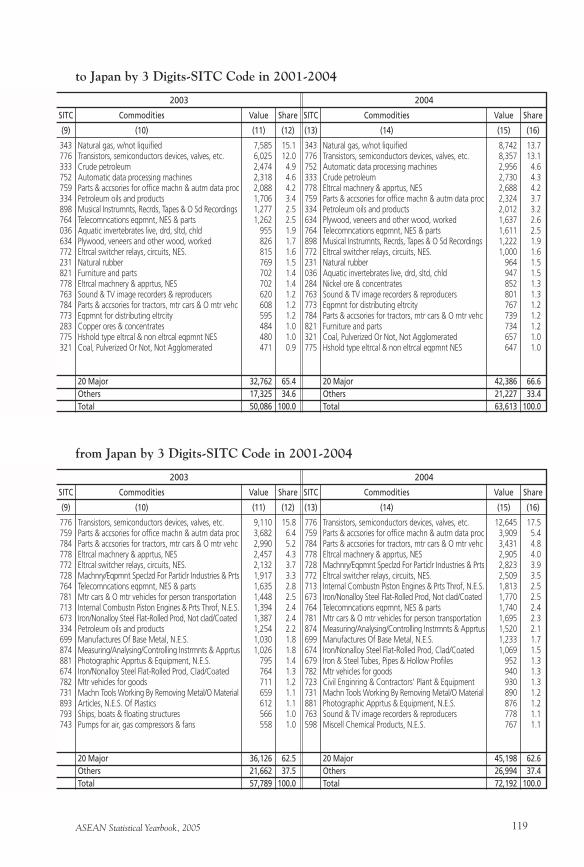
ASEAN Statistical Yearbook, 2005 119
to Japan by 3 Digits-SITC Code in 2001-2004
343 Natural gas, w/not liquified 7,585 15.1 776 Transistors, semiconductors devices, valves, etc. 6,025 12.0 333 Crude petroleum 2,474 4.9 752 Automatic data processing machines 2,318 4.6 759 Parts & accsories for office machn & autm data proc 2,088 4.2 334 Petroleum oils and products 1,706 3.4 898 Musical Instrumnts, Recrds, Tapes & O Sd Recordings 1,277 2.5 764 Telecomncations eqpmnt, NES & parts 1,262 2.5 036 Aquatic invertebrates live, drd, sltd, chld 955 1.9 634 Plywood, veneers and other wood, worked 826 1.7 772 Eltrcal switcher relays, circuits, NES. 815 1.6 231 Natural rubber 769 1.5 821 Furniture and parts 702 1.4 778 Eltrcal machnery & apprtus, NES 702 1.4 763 Sound & TV image recorders & reproducers 620 1.2 784 Parts & accsories for tractors, mtr cars & O mtr vehc 608 1.2 773 Eqpmnt for distributing eltrcity 595 1.2 283 Copper ores & concentrates 484 1.0 775 Hshold type eltrcal & non eltrcal eqpmnt NES 480 1.0 321 Coal, Pulverized Or Not, Not Agglomerated 471 0.9
20 Major 32,762 65.4 Others 17,325 34.6 Total 50,086 100.0
2003
SITC Commodities Value Share
(9) (10) (11) (12)
343 Natural gas, w/not liquified 8,742 13.7 776 Transistors, semiconductors devices, valves, etc. 8,357 13.1 752 Automatic data processing machines 2,956 4.6 333 Crude petroleum 2,730 4.3 778 Eltrcal machnery & apprtus, NES 2,688 4.2 759 Parts & accsories for office machn & autm data proc 2,324 3.7 334 Petroleum oils and products 2,012 3.2 634 Plywood, veneers and other wood, worked 1,637 2.6 764 Telecomncations eqpmnt, NES & parts 1,611 2.5 898 Musical Instrumnts, Recrds, Tapes & O Sd Recordings 1,222 1.9 772 Eltrcal switcher relays, circuits, NES. 1,000 1.6 231 Natural rubber 964 1.5 036 Aquatic invertebrates live, drd, sltd, chld 947 1.5 284 Nickel ore & concentrates 852 1.3 763 Sound & TV image recorders & reproducers 801 1.3 773 Eqpmnt for distributing eltrcity 767 1.2 784 Parts & accsories for tractors, mtr cars & O mtr vehc 739 1.2 821 Furniture and parts 734 1.2 321 Coal, Pulverized Or Not, Not Agglomerated 657 1.0 775 Hshold type eltrcal & non eltrcal eqpmnt NES 647 1.0
20 Major 42,386 66.6 Others 21,227 33.4 Total 63,613 100.0
2004
SITC Commodities Value Share
(13) (14) (15) (16)
from Japan by 3 Digits-SITC Code in 2001-2004
776 Transistors, semiconductors devices, valves, etc. 9,110 15.8 759 Parts & accsories for office machn & autm data proc 3,682 6.4 784 Parts & accsories for tractors, mtr cars & O mtr vehc 2,990 5.2 778 Eltrcal machnery & apprtus, NES 2,457 4.3 772 Eltrcal switcher relays, circuits, NES. 2,132 3.7 728 Machnry/Eqpmnt Speclzd For Particlr Industries & Prts 1,917 3.3 764 Telecomncations eqpmnt, NES & parts 1,635 2.8 781 Mtr cars & O mtr vehicles for person transportation 1,448 2.5 713 Internal Combustn Piston Engines & Prts Throf, N.E.S. 1,394 2.4 673 Iron/Nonalloy Steel Flat-Rolled Prod, Not clad/Coated 1,387 2.4 334 Petroleum oils and products 1,254 2.2 699 Manufactures Of Base Metal, N.E.S. 1,030 1.8 874 Measuring/Analysing/Controlling Instrmnts & Apprtus 1,026 1.8 881 Photographic Apprtus & Equipment, N.E.S. 795 1.4 674 Iron/Nonalloy Steel Flat-Rolled Prod, Clad/Coated 764 1.3 782 Mtr vehicles for goods 711 1.2 731 Machn Tools Working By Removing Metal/O Material 659 1.1 893 Articles, N.E.S. Of Plastics 612 1.1 793 Ships, boats & floating structures 566 1.0 743 Pumps for air, gas compressors & fans 558 1.0
20 Major 36,126 62.5 Others 21,662 37.5 Total 57,789 100.0
2003
SITC Commodities Value Share
(9) (10) (11) (12)
776 Transistors, semiconductors devices, valves, etc. 12,645 17.5 759 Parts & accsories for office machn & autm data proc 3,909 5.4 784 Parts & accsories for tractors, mtr cars & O mtr vehc 3,431 4.8 778 Eltrcal machnery & apprtus, NES 2,905 4.0 728 Machnry/Eqpmnt Speclzd For Particlr Industries & Prts 2,823 3.9 772 Eltrcal switcher relays, circuits, NES. 2,509 3.5 713 Internal Combustn Piston Engines & Prts Throf, N.E.S. 1,813 2.5 673 Iron/Nonalloy Steel Flat-Rolled Prod, Not clad/Coated 1,770 2.5 764 Telecomncations eqpmnt, NES & parts 1,740 2.4 781 Mtr cars & O mtr vehicles for person transportation 1,695 2.3 874 Measuring/Analysing/Controlling Instrmnts & Apprtus 1,520 2.1 699 Manufactures Of Base Metal, N.E.S. 1,233 1.7 674 Iron/Nonalloy Steel Flat-Rolled Prod, Clad/Coated 1,069 1.5 679 Iron & Steel Tubes, Pipes & Hollow Profiles 952 1.3 782 Mtr vehicles for goods 940 1.3 723 Civil Enginring & Contractors’ Plant & Equipment 930 1.3 731 Machn Tools Working By Removing Metal/O Material 890 1.2 881 Photographic Apprtus & Equipment, N.E.S. 876 1.2 763 Sound & TV image recorders & reproducers 778 1.1 598 Miscell Chemical Products, N.E.S. 767 1.1
20 Major 45,198 62.6 Others 26,994 37.4 Total 72,192 100.0
2004
SITC Commodities Value Share
(13) (14) (15) (16)
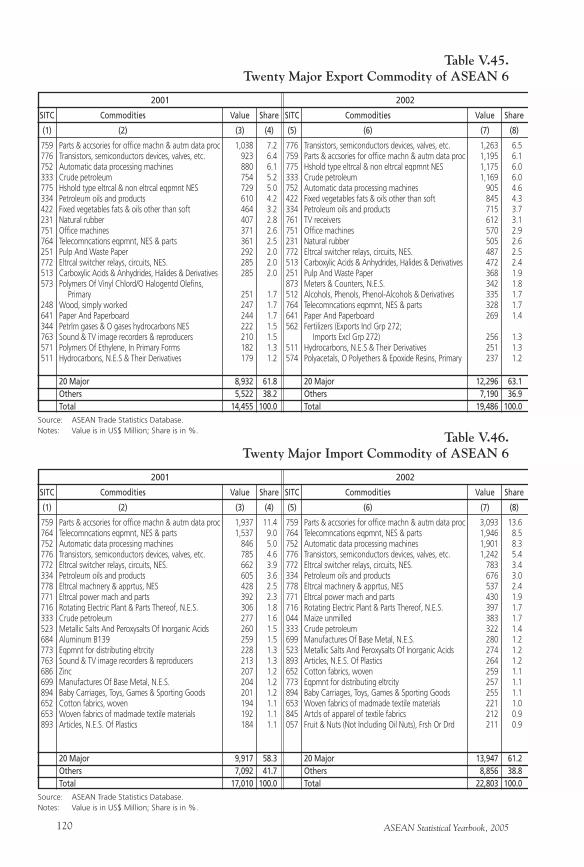
ASEAN Statistical Yearbook, 2005120
Table V.45.Twenty Major Export Commodity of ASEAN 6
759 Parts & accsories for office machn & autm data proc 1,038 7.2 776 Transistors, semiconductors devices, valves, etc. 923 6.4 752 Automatic data processing machines 880 6.1 333 Crude petroleum 754 5.2 775 Hshold type eltrcal & non eltrcal eqpmnt NES 729 5.0 334 Petroleum oils and products 610 4.2 422 Fixed vegetables fats & oils other than soft 464 3.2 231 Natural rubber 407 2.8 751 Office machines 371 2.6 764 Telecomncations eqpmnt, NES & parts 361 2.5 251 Pulp And Waste Paper 292 2.0 772 Eltrcal switcher relays, circuits, NES. 285 2.0 513 Carboxylic Acids & Anhydrides, Halides & Derivatives 285 2.0 573 Polymers Of Vinyl Chlord/O Halogentd Olefins, Primary 251 1.7 248 Wood, simply worked 247 1.7 641 Paper And Paperboard 244 1.7 344 Petrlm gases & O gases hydrocarbons NES 222 1.5 763 Sound & TV image recorders & reproducers 210 1.5 571 Polymers Of Ethylene, In Primary Forms 182 1.3 511 Hydrocarbons, N.E.S & Their Derivatives 179 1.2
20 Major 8,932 61.8 Others 5,522 38.2 Total 14,455 100.0
2001
SITC Commodities Value Share
Source: ASEAN Trade Statistics Database.Notes: Value is in US$ Million; Share is in %.
(1) (2) (3) (4)
776 Transistors, semiconductors devices, valves, etc. 1,263 6.5 759 Parts & accsories for office machn & autm data proc 1,195 6.1 775 Hshold type eltrcal & non eltrcal eqpmnt NES 1,175 6.0 333 Crude petroleum 1,169 6.0 752 Automatic data processing machines 905 4.6 422 Fixed vegetables fats & oils other than soft 845 4.3 334 Petroleum oils and products 715 3.7 761 TV receivers 612 3.1 751 Office machines 570 2.9 231 Natural rubber 505 2.6 772 Eltrcal switcher relays, circuits, NES. 487 2.5 513 Carboxylic Acids & Anhydrides, Halides & Derivatives 472 2.4 251 Pulp And Waste Paper 368 1.9 873 Meters & Counters, N.E.S. 342 1.8 512 Alcohols, Phenols, Phenol-Alcohols & Derivatives 335 1.7 764 Telecomncations eqpmnt, NES & parts 328 1.7 641 Paper And Paperboard 269 1.4 562 Fertilizers (Exports Incl Grp 272; Imports Excl Grp 272) 256 1.3 511 Hydrocarbons, N.E.S & Their Derivatives 251 1.3 574 Polyacetals, O Polyethers & Epoxide Resins, Primary 237 1.2
20 Major 12,296 63.1 Others 7,190 36.9 Total 19,486 100.0
2002
SITC Commodities Value Share
(5) (6) (7) (8)
Table V.46.Twenty Major Import Commodity of ASEAN 6
759 Parts & accsories for office machn & autm data proc 1,937 11.4 764 Telecomncations eqpmnt, NES & parts 1,537 9.0 752 Automatic data processing machines 846 5.0 776 Transistors, semiconductors devices, valves, etc. 785 4.6 772 Eltrcal switcher relays, circuits, NES. 662 3.9 334 Petroleum oils and products 605 3.6 778 Eltrcal machnery & apprtus, NES 428 2.5 771 Eltrcal power mach and parts 392 2.3 716 Rotating Electric Plant & Parts Thereof, N.E.S. 306 1.8 333 Crude petroleum 277 1.6 523 Metallic Salts And Peroxysalts Of Inorganic Acids 260 1.5 684 Aluminum B139 259 1.5 773 Eqpmnt for distributing eltrcity 228 1.3 763 Sound & TV image recorders & reproducers 213 1.3 686 Zinc 207 1.2 699 Manufactures Of Base Metal, N.E.S. 204 1.2 894 Baby Carriages, Toys, Games & Sporting Goods 201 1.2 652 Cotton fabrics, woven 194 1.1 653 Woven fabrics of madmade textile materials 192 1.1 893 Articles, N.E.S. Of Plastics 184 1.1
20 Major 9,917 58.3 Others 7,092 41.7 Total 17,010 100.0
2001
SITC Commodities Value Share
Source: ASEAN Trade Statistics Database.Notes: Value is in US$ Million; Share is in %.
(1) (2) (3) (4)
759 Parts & accsories for office machn & autm data proc 3,093 13.6 764 Telecomncations eqpmnt, NES & parts 1,946 8.5 752 Automatic data processing machines 1,901 8.3 776 Transistors, semiconductors devices, valves, etc. 1,242 5.4 772 Eltrcal switcher relays, circuits, NES. 783 3.4 334 Petroleum oils and products 676 3.0 778 Eltrcal machnery & apprtus, NES 537 2.4 771 Eltrcal power mach and parts 430 1.9 716 Rotating Electric Plant & Parts Thereof, N.E.S. 397 1.7 044 Maize unmilled 383 1.7 333 Crude petroleum 322 1.4 699 Manufactures Of Base Metal, N.E.S. 280 1.2 523 Metallic Salts And Peroxysalts Of Inorganic Acids 274 1.2 893 Articles, N.E.S. Of Plastics 264 1.2 652 Cotton fabrics, woven 259 1.1 773 Eqpmnt for distributing eltrcity 257 1.1 894 Baby Carriages, Toys, Games & Sporting Goods 255 1.1 653 Woven fabrics of madmade textile materials 221 1.0 845 Artcls of apparel of textile fabrics 212 0.9 057 Fruit & Nuts (Not Including Oil Nuts), Frsh Or Drd 211 0.9
20 Major 13,947 61.2 Others 8,856 38.8 Total 22,803 100.0
2002
SITC Commodities Value Share
(5) (6) (7) (8)
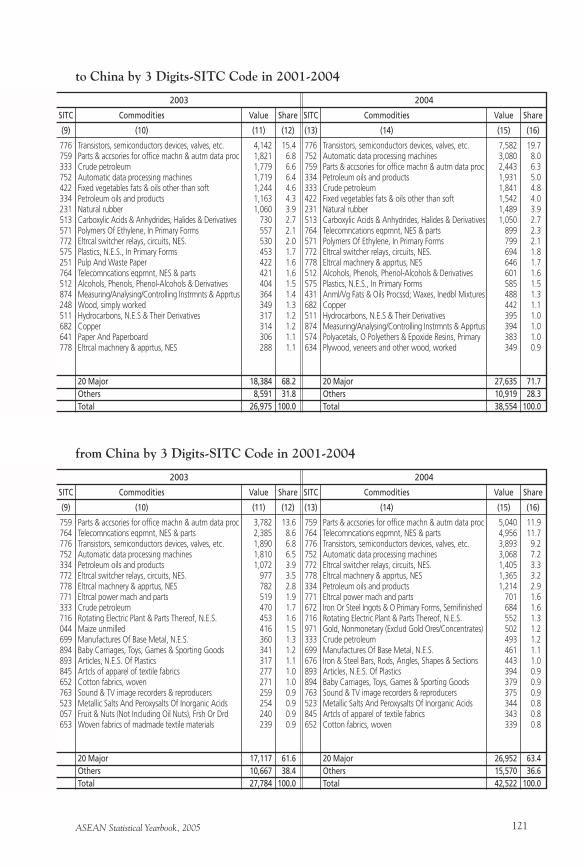
ASEAN Statistical Yearbook, 2005 121
to China by 3 Digits-SITC Code in 2001-2004
776 Transistors, semiconductors devices, valves, etc. 4,142 15.4 759 Parts & accsories for office machn & autm data proc 1,821 6.8 333 Crude petroleum 1,779 6.6 752 Automatic data processing machines 1,719 6.4 422 Fixed vegetables fats & oils other than soft 1,244 4.6 334 Petroleum oils and products 1,163 4.3 231 Natural rubber 1,060 3.9 513 Carboxylic Acids & Anhydrides, Halides & Derivatives 730 2.7 571 Polymers Of Ethylene, In Primary Forms 557 2.1 772 Eltrcal switcher relays, circuits, NES. 530 2.0 575 Plastics, N.E.S., In Primary Forms 453 1.7 251 Pulp And Waste Paper 422 1.6 764 Telecomncations eqpmnt, NES & parts 421 1.6 512 Alcohols, Phenols, Phenol-Alcohols & Derivatives 404 1.5 874 Measuring/Analysing/Controlling Instrmnts & Apprtus 364 1.4 248 Wood, simply worked 349 1.3 511 Hydrocarbons, N.E.S & Their Derivatives 317 1.2 682 Copper 314 1.2 641 Paper And Paperboard 306 1.1 778 Eltrcal machnery & apprtus, NES 288 1.1
20 Major 18,384 68.2 Others 8,591 31.8 Total 26,975 100.0
2003
SITC Commodities Value Share
(9) (10) (11) (12)
776 Transistors, semiconductors devices, valves, etc. 7,582 19.7 752 Automatic data processing machines 3,080 8.0 759 Parts & accsories for office machn & autm data proc 2,443 6.3 334 Petroleum oils and products 1,931 5.0 333 Crude petroleum 1,841 4.8 422 Fixed vegetables fats & oils other than soft 1,542 4.0 231 Natural rubber 1,489 3.9 513 Carboxylic Acids & Anhydrides, Halides & Derivatives 1,050 2.7 764 Telecomncations eqpmnt, NES & parts 899 2.3 571 Polymers Of Ethylene, In Primary Forms 799 2.1 772 Eltrcal switcher relays, circuits, NES. 694 1.8 778 Eltrcal machnery & apprtus, NES 646 1.7 512 Alcohols, Phenols, Phenol-Alcohols & Derivatives 601 1.6 575 Plastics, N.E.S., In Primary Forms 585 1.5 431 Anml/Vg Fats & Oils Procssd; Waxes, Inedbl Mixtures 488 1.3 682 Copper 442 1.1 511 Hydrocarbons, N.E.S & Their Derivatives 395 1.0 874 Measuring/Analysing/Controlling Instrmnts & Apprtus 394 1.0 574 Polyacetals, O Polyethers & Epoxide Resins, Primary 383 1.0 634 Plywood, veneers and other wood, worked 349 0.9
20 Major 27,635 71.7 Others 10,919 28.3 Total 38,554 100.0
2004
SITC Commodities Value Share
(13) (14) (15) (16)
from China by 3 Digits-SITC Code in 2001-2004
759 Parts & accsories for office machn & autm data proc 3,782 13.6 764 Telecomncations eqpmnt, NES & parts 2,385 8.6 776 Transistors, semiconductors devices, valves, etc. 1,890 6.8 752 Automatic data processing machines 1,810 6.5 334 Petroleum oils and products 1,072 3.9 772 Eltrcal switcher relays, circuits, NES. 977 3.5 778 Eltrcal machnery & apprtus, NES 782 2.8 771 Eltrcal power mach and parts 519 1.9 333 Crude petroleum 470 1.7 716 Rotating Electric Plant & Parts Thereof, N.E.S. 453 1.6 044 Maize unmilled 416 1.5 699 Manufactures Of Base Metal, N.E.S. 360 1.3 894 Baby Carriages, Toys, Games & Sporting Goods 341 1.2 893 Articles, N.E.S. Of Plastics 317 1.1 845 Artcls of apparel of textile fabrics 277 1.0 652 Cotton fabrics, woven 271 1.0 763 Sound & TV image recorders & reproducers 259 0.9 523 Metallic Salts And Peroxysalts Of Inorganic Acids 254 0.9 057 Fruit & Nuts (Not Including Oil Nuts), Frsh Or Drd 240 0.9 653 Woven fabrics of madmade textile materials 239 0.9
20 Major 17,117 61.6 Others 10,667 38.4 Total 27,784 100.0
2003
SITC Commodities Value Share
(9) (10) (11) (12)
759 Parts & accsories for office machn & autm data proc 5,040 11.9 764 Telecomncations eqpmnt, NES & parts 4,956 11.7 776 Transistors, semiconductors devices, valves, etc. 3,893 9.2 752 Automatic data processing machines 3,068 7.2 772 Eltrcal switcher relays, circuits, NES. 1,405 3.3 778 Eltrcal machnery & apprtus, NES 1,365 3.2 334 Petroleum oils and products 1,214 2.9 771 Eltrcal power mach and parts 701 1.6 672 Iron Or Steel Ingots & O Primary Forms, Semifinished 684 1.6 716 Rotating Electric Plant & Parts Thereof, N.E.S. 552 1.3 971 Gold, Nonmonetary (Exclud Gold Ores/Concentrates) 502 1.2 333 Crude petroleum 493 1.2 699 Manufactures Of Base Metal, N.E.S. 461 1.1 676 Iron & Steel Bars, Rods, Angles, Shapes & Sections 443 1.0 893 Articles, N.E.S. Of Plastics 394 0.9 894 Baby Carriages, Toys, Games & Sporting Goods 379 0.9 763 Sound & TV image recorders & reproducers 375 0.9 523 Metallic Salts And Peroxysalts Of Inorganic Acids 344 0.8 845 Artcls of apparel of textile fabrics 343 0.8 652 Cotton fabrics, woven 339 0.8
20 Major 26,952 63.4 Others 15,570 36.6 Total 42,522 100.0
2004
SITC Commodities Value Share
(13) (14) (15) (16)
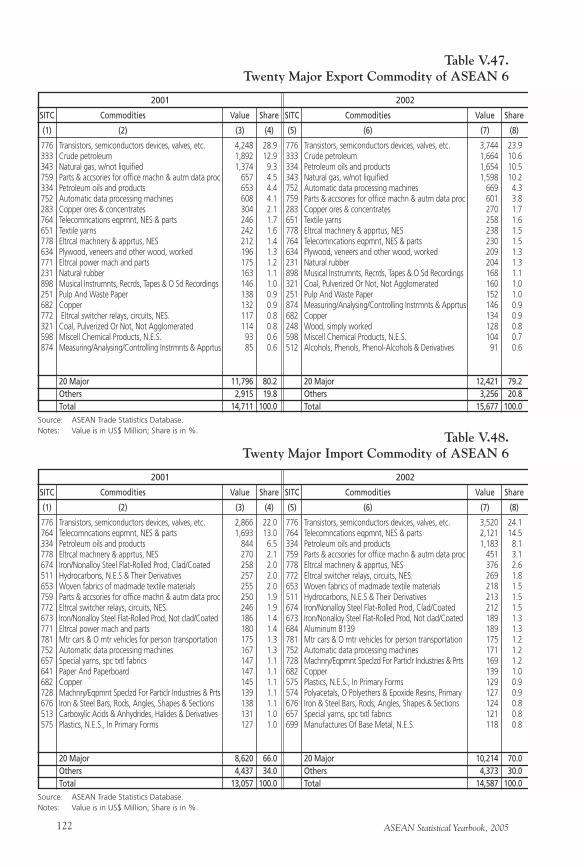
ASEAN Statistical Yearbook, 2005122
Table V.47.Twenty Major Export Commodity of ASEAN 6
776 Transistors, semiconductors devices, valves, etc. 4,248 28.9 333 Crude petroleum 1,892 12.9 343 Natural gas, w/not liquified 1,374 9.3 759 Parts & accsories for office machn & autm data proc 657 4.5 334 Petroleum oils and products 653 4.4 752 Automatic data processing machines 608 4.1 283 Copper ores & concentrates 304 2.1 764 Telecomncations eqpmnt, NES & parts 246 1.7 651 Textile yarns 242 1.6 778 Eltrcal machnery & apprtus, NES 212 1.4 634 Plywood, veneers and other wood, worked 196 1.3 771 Eltrcal power mach and parts 175 1.2 231 Natural rubber 163 1.1 898 Musical Instrumnts, Recrds, Tapes & O Sd Recordings 146 1.0 251 Pulp And Waste Paper 138 0.9 682 Copper 132 0.9 772 Eltrcal switcher relays, circuits, NES. 117 0.8 321 Coal, Pulverized Or Not, Not Agglomerated 114 0.8 598 Miscell Chemical Products, N.E.S. 93 0.6 874 Measuring/Analysing/Controlling Instrmnts & Apprtus 85 0.6
20 Major 11,796 80.2 Others 2,915 19.8 Total 14,711 100.0
2001
SITC Commodities Value Share
Source: ASEAN Trade Statistics Database.Notes: Value is in US$ Million; Share is in %.
(1) (2) (3) (4)
776 Transistors, semiconductors devices, valves, etc. 3,744 23.9 333 Crude petroleum 1,664 10.6 334 Petroleum oils and products 1,654 10.5 343 Natural gas, w/not liquified 1,598 10.2 752 Automatic data processing machines 669 4.3 759 Parts & accsories for office machn & autm data proc 601 3.8 283 Copper ores & concentrates 270 1.7 651 Textile yarns 258 1.6 778 Eltrcal machnery & apprtus, NES 238 1.5 764 Telecomncations eqpmnt, NES & parts 230 1.5 634 Plywood, veneers and other wood, worked 209 1.3 231 Natural rubber 204 1.3 898 Musical Instrumnts, Recrds, Tapes & O Sd Recordings 168 1.1 321 Coal, Pulverized Or Not, Not Agglomerated 160 1.0 251 Pulp And Waste Paper 152 1.0 874 Measuring/Analysing/Controlling Instrmnts & Apprtus 146 0.9 682 Copper 134 0.9 248 Wood, simply worked 128 0.8 598 Miscell Chemical Products, N.E.S. 104 0.7 512 Alcohols, Phenols, Phenol-Alcohols & Derivatives 91 0.6
20 Major 12,421 79.2 Others 3,256 20.8 Total 15,677 100.0
2002
SITC Commodities Value Share
(5) (6) (7) (8)
Table V.48.Twenty Major Import Commodity of ASEAN 6
776 Transistors, semiconductors devices, valves, etc. 2,866 22.0 764 Telecomncations eqpmnt, NES & parts 1,693 13.0 334 Petroleum oils and products 844 6.5 778 Eltrcal machnery & apprtus, NES 270 2.1 674 Iron/Nonalloy Steel Flat-Rolled Prod, Clad/Coated 258 2.0 511 Hydrocarbons, N.E.S & Their Derivatives 257 2.0 653 Woven fabrics of madmade textile materials 255 2.0 759 Parts & accsories for office machn & autm data proc 250 1.9 772 Eltrcal switcher relays, circuits, NES. 246 1.9 673 Iron/Nonalloy Steel Flat-Rolled Prod, Not clad/Coated 186 1.4 771 Eltrcal power mach and parts 180 1.4 781 Mtr cars & O mtr vehicles for person transportation 175 1.3 752 Automatic data processing machines 167 1.3 657 Special yarns, spc txtl fabrics 147 1.1 641 Paper And Paperboard 147 1.1 682 Copper 145 1.1 728 Machnry/Eqpmnt Speclzd For Particlr Industries & Prts 139 1.1 676 Iron & Steel Bars, Rods, Angles, Shapes & Sections 138 1.1 513 Carboxylic Acids & Anhydrides, Halides & Derivatives 131 1.0 575 Plastics, N.E.S., In Primary Forms 127 1.0
20 Major 8,620 66.0 Others 4,437 34.0 Total 13,057 100.0
2001
SITC Commodities Value Share
Source: ASEAN Trade Statistics Database.Notes: Value is in US$ Million; Share is in %.
(1) (2) (3) (4)
776 Transistors, semiconductors devices, valves, etc. 3,520 24.1 764 Telecomncations eqpmnt, NES & parts 2,121 14.5 334 Petroleum oils and products 1,183 8.1 759 Parts & accsories for office machn & autm data proc 451 3.1 778 Eltrcal machnery & apprtus, NES 376 2.6 772 Eltrcal switcher relays, circuits, NES. 269 1.8 653 Woven fabrics of madmade textile materials 218 1.5 511 Hydrocarbons, N.E.S & Their Derivatives 213 1.5 674 Iron/Nonalloy Steel Flat-Rolled Prod, Clad/Coated 212 1.5 673 Iron/Nonalloy Steel Flat-Rolled Prod, Not clad/Coated 189 1.3 684 Aluminum B139 189 1.3 781 Mtr cars & O mtr vehicles for person transportation 175 1.2 752 Automatic data processing machines 171 1.2 728 Machnry/Eqpmnt Speclzd For Particlr Industries & Prts 169 1.2 682 Copper 139 1.0 575 Plastics, N.E.S., In Primary Forms 129 0.9 574 Polyacetals, O Polyethers & Epoxide Resins, Primary 127 0.9 676 Iron & Steel Bars, Rods, Angles, Shapes & Sections 124 0.8 657 Special yarns, spc txtl fabrics 121 0.8 699 Manufactures Of Base Metal, N.E.S. 118 0.8
20 Major 10,214 70.0 Others 4,373 30.0 Total 14,587 100.0
2002
SITC Commodities Value Share
(5) (6) (7) (8)
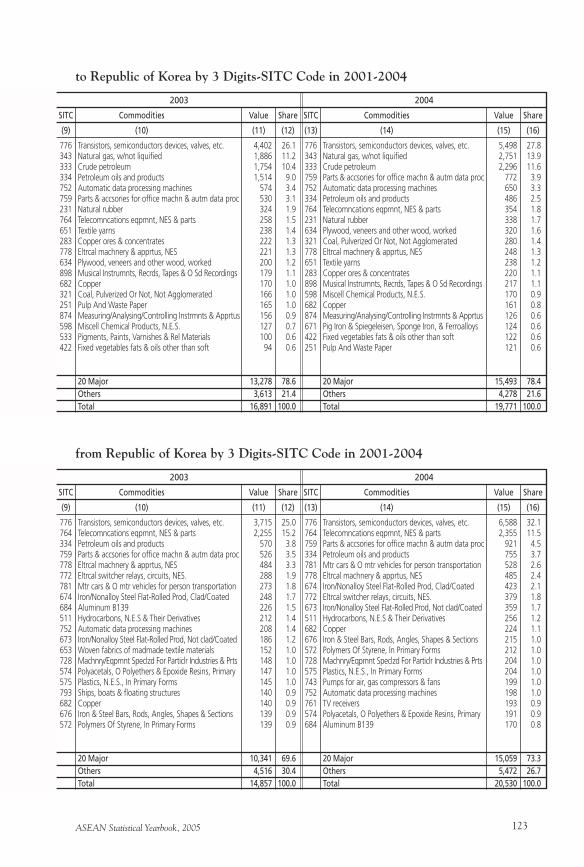
ASEAN Statistical Yearbook, 2005 123
to Republic of Korea by 3 Digits-SITC Code in 2001-2004
776 Transistors, semiconductors devices, valves, etc. 4,402 26.1 343 Natural gas, w/not liquified 1,886 11.2 333 Crude petroleum 1,754 10.4 334 Petroleum oils and products 1,514 9.0 752 Automatic data processing machines 574 3.4 759 Parts & accsories for office machn & autm data proc 530 3.1 231 Natural rubber 324 1.9 764 Telecomncations eqpmnt, NES & parts 258 1.5 651 Textile yarns 238 1.4 283 Copper ores & concentrates 222 1.3 778 Eltrcal machnery & apprtus, NES 221 1.3 634 Plywood, veneers and other wood, worked 200 1.2 898 Musical Instrumnts, Recrds, Tapes & O Sd Recordings 179 1.1 682 Copper 170 1.0 321 Coal, Pulverized Or Not, Not Agglomerated 166 1.0 251 Pulp And Waste Paper 165 1.0 874 Measuring/Analysing/Controlling Instrmnts & Apprtus 156 0.9 598 Miscell Chemical Products, N.E.S. 127 0.7 533 Pigments, Paints, Varnishes & Rel Materials 100 0.6 422 Fixed vegetables fats & oils other than soft 94 0.6
20 Major 13,278 78.6 Others 3,613 21.4 Total 16,891 100.0
2003
SITC Commodities Value Share
(9) (10) (11) (12)
776 Transistors, semiconductors devices, valves, etc. 5,498 27.8 343 Natural gas, w/not liquified 2,751 13.9 333 Crude petroleum 2,296 11.6 759 Parts & accsories for office machn & autm data proc 772 3.9 752 Automatic data processing machines 650 3.3 334 Petroleum oils and products 486 2.5 764 Telecomncations eqpmnt, NES & parts 354 1.8 231 Natural rubber 338 1.7 634 Plywood, veneers and other wood, worked 320 1.6 321 Coal, Pulverized Or Not, Not Agglomerated 280 1.4 778 Eltrcal machnery & apprtus, NES 248 1.3 651 Textile yarns 238 1.2 283 Copper ores & concentrates 220 1.1 898 Musical Instrumnts, Recrds, Tapes & O Sd Recordings 217 1.1 598 Miscell Chemical Products, N.E.S. 170 0.9 682 Copper 161 0.8 874 Measuring/Analysing/Controlling Instrmnts & Apprtus 126 0.6 671 Pig Iron & Spiegeleisen, Sponge Iron, & Ferroalloys 124 0.6 422 Fixed vegetables fats & oils other than soft 122 0.6 251 Pulp And Waste Paper 121 0.6
20 Major 15,493 78.4 Others 4,278 21.6 Total 19,771 100.0
2004
SITC Commodities Value Share
(13) (14) (15) (16)
from Republic of Korea by 3 Digits-SITC Code in 2001-2004
776 Transistors, semiconductors devices, valves, etc. 3,715 25.0 764 Telecomncations eqpmnt, NES & parts 2,255 15.2 334 Petroleum oils and products 570 3.8 759 Parts & accsories for office machn & autm data proc 526 3.5 778 Eltrcal machnery & apprtus, NES 484 3.3 772 Eltrcal switcher relays, circuits, NES. 288 1.9 781 Mtr cars & O mtr vehicles for person transportation 273 1.8 674 Iron/Nonalloy Steel Flat-Rolled Prod, Clad/Coated 248 1.7 684 Aluminum B139 226 1.5 511 Hydrocarbons, N.E.S & Their Derivatives 212 1.4 752 Automatic data processing machines 208 1.4 673 Iron/Nonalloy Steel Flat-Rolled Prod, Not clad/Coated 186 1.2 653 Woven fabrics of madmade textile materials 152 1.0 728 Machnry/Eqpmnt Speclzd For Particlr Industries & Prts 148 1.0 574 Polyacetals, O Polyethers & Epoxide Resins, Primary 147 1.0 575 Plastics, N.E.S., In Primary Forms 145 1.0 793 Ships, boats & floating structures 140 0.9 682 Copper 140 0.9 676 Iron & Steel Bars, Rods, Angles, Shapes & Sections 139 0.9 572 Polymers Of Styrene, In Primary Forms 139 0.9
20 Major 10,341 69.6 Others 4,516 30.4 Total 14,857 100.0
2003
SITC Commodities Value Share
(9) (10) (11) (12)
776 Transistors, semiconductors devices, valves, etc. 6,588 32.1 764 Telecomncations eqpmnt, NES & parts 2,355 11.5 759 Parts & accsories for office machn & autm data proc 921 4.5 334 Petroleum oils and products 755 3.7 781 Mtr cars & O mtr vehicles for person transportation 528 2.6 778 Eltrcal machnery & apprtus, NES 485 2.4 674 Iron/Nonalloy Steel Flat-Rolled Prod, Clad/Coated 423 2.1 772 Eltrcal switcher relays, circuits, NES. 379 1.8 673 Iron/Nonalloy Steel Flat-Rolled Prod, Not clad/Coated 359 1.7 511 Hydrocarbons, N.E.S & Their Derivatives 256 1.2 682 Copper 224 1.1 676 Iron & Steel Bars, Rods, Angles, Shapes & Sections 215 1.0 572 Polymers Of Styrene, In Primary Forms 212 1.0 728 Machnry/Eqpmnt Speclzd For Particlr Industries & Prts 204 1.0 575 Plastics, N.E.S., In Primary Forms 204 1.0 743 Pumps for air, gas compressors & fans 199 1.0 752 Automatic data processing machines 198 1.0 761 TV receivers 193 0.9 574 Polyacetals, O Polyethers & Epoxide Resins, Primary 191 0.9 684 Aluminum B139 170 0.8
20 Major 15,059 73.3 Others 5,472 26.7 Total 20,530 100.0
2004
SITC Commodities Value Share
(13) (14) (15) (16)
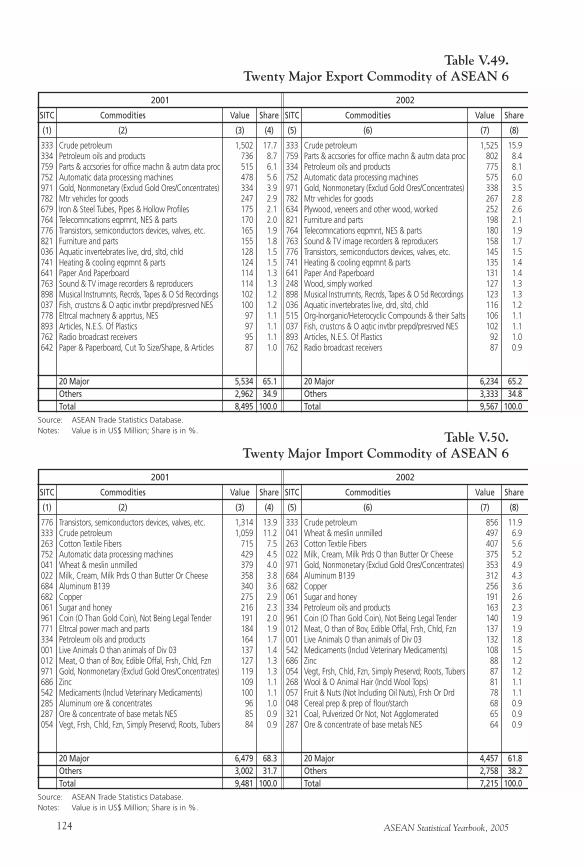
ASEAN Statistical Yearbook, 2005124
Table V.49.Twenty Major Export Commodity of ASEAN 6
333 Crude petroleum 1,502 17.7 334 Petroleum oils and products 736 8.7 759 Parts & accsories for office machn & autm data proc 515 6.1 752 Automatic data processing machines 478 5.6 971 Gold, Nonmonetary (Exclud Gold Ores/Concentrates) 334 3.9 782 Mtr vehicles for goods 247 2.9 679 Iron & Steel Tubes, Pipes & Hollow Profiles 175 2.1 764 Telecomncations eqpmnt, NES & parts 170 2.0 776 Transistors, semiconductors devices, valves, etc. 165 1.9 821 Furniture and parts 155 1.8 036 Aquatic invertebrates live, drd, sltd, chld 128 1.5 741 Heating & cooling eqpmnt & parts 124 1.5 641 Paper And Paperboard 114 1.3 763 Sound & TV image recorders & reproducers 114 1.3 898 Musical Instrumnts, Recrds, Tapes & O Sd Recordings 102 1.2 037 Fish, crustcns & O aqtic invtbr prepd/presrved NES 100 1.2 778 Eltrcal machnery & apprtus, NES 97 1.1 893 Articles, N.E.S. Of Plastics 97 1.1 762 Radio broadcast receivers 95 1.1 642 Paper & Paperboard, Cut To Size/Shape, & Articles 87 1.0
20 Major 5,534 65.1 Others 2,962 34.9 Total 8,495 100.0
2001
SITC Commodities Value Share
Source: ASEAN Trade Statistics Database.Notes: Value is in US$ Million; Share is in %.
(1) (2) (3) (4)
333 Crude petroleum 1,525 15.9 759 Parts & accsories for office machn & autm data proc 802 8.4 334 Petroleum oils and products 775 8.1 752 Automatic data processing machines 575 6.0 971 Gold, Nonmonetary (Exclud Gold Ores/Concentrates) 338 3.5 782 Mtr vehicles for goods 267 2.8 634 Plywood, veneers and other wood, worked 252 2.6 821 Furniture and parts 198 2.1 764 Telecomncations eqpmnt, NES & parts 180 1.9 763 Sound & TV image recorders & reproducers 158 1.7 776 Transistors, semiconductors devices, valves, etc. 145 1.5 741 Heating & cooling eqpmnt & parts 135 1.4 641 Paper And Paperboard 131 1.4 248 Wood, simply worked 127 1.3 898 Musical Instrumnts, Recrds, Tapes & O Sd Recordings 123 1.3 036 Aquatic invertebrates live, drd, sltd, chld 116 1.2 515 Org-Inorganic/Heterocyclic Compounds & their Salts 106 1.1 037 Fish, crustcns & O aqtic invtbr prepd/presrved NES 102 1.1 893 Articles, N.E.S. Of Plastics 92 1.0 762 Radio broadcast receivers 87 0.9
20 Major 6,234 65.2 Others 3,333 34.8 Total 9,567 100.0
2002
SITC Commodities Value Share
(5) (6) (7) (8)
Table V.50.Twenty Major Import Commodity of ASEAN 6
776 Transistors, semiconductors devices, valves, etc. 1,314 13.9 333 Crude petroleum 1,059 11.2 263 Cotton Textile Fibers 715 7.5 752 Automatic data processing machines 429 4.5 041 Wheat & meslin unmilled 379 4.0 022 Milk, Cream, Milk Prds O than Butter Or Cheese 358 3.8 684 Aluminum B139 340 3.6 682 Copper 275 2.9 061 Sugar and honey 216 2.3 961 Coin (O Than Gold Coin), Not Being Legal Tender 191 2.0 771 Eltrcal power mach and parts 184 1.9 334 Petroleum oils and products 164 1.7 001 Live Animals O than animals of Div 03 137 1.4 012 Meat, O than of Bov, Edible Offal, Frsh, Chld, Fzn 127 1.3 971 Gold, Nonmonetary (Exclud Gold Ores/Concentrates) 119 1.3 686 Zinc 109 1.1 542 Medicaments (Includ Veterinary Medicaments) 100 1.1 285 Aluminum ore & concentrates 96 1.0 287 Ore & concentrate of base metals NES 85 0.9 054 Vegt, Frsh, Chld, Fzn, Simply Preservd; Roots, Tubers 84 0.9
20 Major 6,479 68.3 Others 3,002 31.7 Total 9,481 100.0
2001
SITC Commodities Value Share
Source: ASEAN Trade Statistics Database.Notes: Value is in US$ Million; Share is in %.
(1) (2) (3) (4)
333 Crude petroleum 856 11.9 041 Wheat & meslin unmilled 497 6.9 263 Cotton Textile Fibers 407 5.6 022 Milk, Cream, Milk Prds O than Butter Or Cheese 375 5.2 971 Gold, Nonmonetary (Exclud Gold Ores/Concentrates) 353 4.9 684 Aluminum B139 312 4.3 682 Copper 256 3.6 061 Sugar and honey 191 2.6 334 Petroleum oils and products 163 2.3 961 Coin (O Than Gold Coin), Not Being Legal Tender 140 1.9 012 Meat, O than of Bov, Edible Offal, Frsh, Chld, Fzn 137 1.9 001 Live Animals O than animals of Div 03 132 1.8 542 Medicaments (Includ Veterinary Medicaments) 108 1.5 686 Zinc 88 1.2 054 Vegt, Frsh, Chld, Fzn, Simply Preservd; Roots, Tubers 87 1.2 268 Wool & O Animal Hair (Incld Wool Tops) 81 1.1 057 Fruit & Nuts (Not Including Oil Nuts), Frsh Or Drd 78 1.1 048 Cereal prep & prep of flour/starch 68 0.9 321 Coal, Pulverized Or Not, Not Agglomerated 65 0.9 287 Ore & concentrate of base metals NES 64 0.9
20 Major 4,457 61.8 Others 2,758 38.2 Total 7,215 100.0
2002
SITC Commodities Value Share
(5) (6) (7) (8)
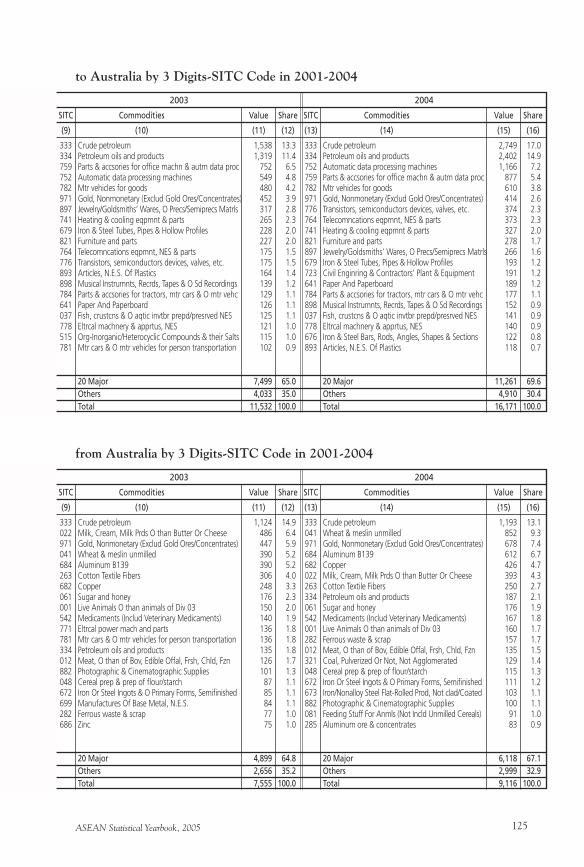
ASEAN Statistical Yearbook, 2005 125
to Australia by 3 Digits-SITC Code in 2001-2004
333 Crude petroleum 1,538 13.3 334 Petroleum oils and products 1,319 11.4 759 Parts & accsories for office machn & autm data proc 752 6.5 752 Automatic data processing machines 549 4.8 782 Mtr vehicles for goods 480 4.2 971 Gold, Nonmonetary (Exclud Gold Ores/Concentrates) 452 3.9 897 Jewelry/Goldsmiths’ Wares, O Precs/Semiprecs Matrls 317 2.8 741 Heating & cooling eqpmnt & parts 265 2.3 679 Iron & Steel Tubes, Pipes & Hollow Profiles 228 2.0 821 Furniture and parts 227 2.0 764 Telecomncations eqpmnt, NES & parts 175 1.5 776 Transistors, semiconductors devices, valves, etc. 175 1.5 893 Articles, N.E.S. Of Plastics 164 1.4 898 Musical Instrumnts, Recrds, Tapes & O Sd Recordings 139 1.2 784 Parts & accsories for tractors, mtr cars & O mtr vehc 129 1.1 641 Paper And Paperboard 126 1.1 037 Fish, crustcns & O aqtic invtbr prepd/presrved NES 125 1.1 778 Eltrcal machnery & apprtus, NES 121 1.0 515 Org-Inorganic/Heterocyclic Compounds & their Salts 115 1.0 781 Mtr cars & O mtr vehicles for person transportation 102 0.9
20 Major 7,499 65.0 Others 4,033 35.0 Total 11,532 100.0
2003
SITC Commodities Value Share
(9) (10) (11) (12)
333 Crude petroleum 2,749 17.0 334 Petroleum oils and products 2,402 14.9 752 Automatic data processing machines 1,166 7.2 759 Parts & accsories for office machn & autm data proc 877 5.4 782 Mtr vehicles for goods 610 3.8 971 Gold, Nonmonetary (Exclud Gold Ores/Concentrates) 414 2.6 776 Transistors, semiconductors devices, valves, etc. 374 2.3 764 Telecomncations eqpmnt, NES & parts 373 2.3 741 Heating & cooling eqpmnt & parts 327 2.0 821 Furniture and parts 278 1.7 897 Jewelry/Goldsmiths’ Wares, O Precs/Semiprecs Matrls 266 1.6 679 Iron & Steel Tubes, Pipes & Hollow Profiles 193 1.2 723 Civil Enginring & Contractors’ Plant & Equipment 191 1.2 641 Paper And Paperboard 189 1.2 784 Parts & accsories for tractors, mtr cars & O mtr vehc 177 1.1 898 Musical Instrumnts, Recrds, Tapes & O Sd Recordings 152 0.9 037 Fish, crustcns & O aqtic invtbr prepd/presrved NES 141 0.9 778 Eltrcal machnery & apprtus, NES 140 0.9 676 Iron & Steel Bars, Rods, Angles, Shapes & Sections 122 0.8 893 Articles, N.E.S. Of Plastics 118 0.7
20 Major 11,261 69.6 Others 4,910 30.4 Total 16,171 100.0
2004
SITC Commodities Value Share
(13) (14) (15) (16)
from Australia by 3 Digits-SITC Code in 2001-2004
333 Crude petroleum 1,124 14.9 022 Milk, Cream, Milk Prds O than Butter Or Cheese 486 6.4 971 Gold, Nonmonetary (Exclud Gold Ores/Concentrates) 447 5.9 041 Wheat & meslin unmilled 390 5.2 684 Aluminum B139 390 5.2 263 Cotton Textile Fibers 306 4.0 682 Copper 248 3.3 061 Sugar and honey 176 2.3 001 Live Animals O than animals of Div 03 150 2.0 542 Medicaments (Includ Veterinary Medicaments) 140 1.9 771 Eltrcal power mach and parts 136 1.8 781 Mtr cars & O mtr vehicles for person transportation 136 1.8 334 Petroleum oils and products 135 1.8 012 Meat, O than of Bov, Edible Offal, Frsh, Chld, Fzn 126 1.7 882 Photographic & Cinematographic Supplies 101 1.3 048 Cereal prep & prep of flour/starch 87 1.1 672 Iron Or Steel Ingots & O Primary Forms, Semifinished 85 1.1 699 Manufactures Of Base Metal, N.E.S. 84 1.1 282 Ferrous waste & scrap 77 1.0 686 Zinc 75 1.0
20 Major 4,899 64.8 Others 2,656 35.2 Total 7,555 100.0
2003
SITC Commodities Value Share
(9) (10) (11) (12)
333 Crude petroleum 1,193 13.1 041 Wheat & meslin unmilled 852 9.3 971 Gold, Nonmonetary (Exclud Gold Ores/Concentrates) 678 7.4 684 Aluminum B139 612 6.7 682 Copper 426 4.7 022 Milk, Cream, Milk Prds O than Butter Or Cheese 393 4.3 263 Cotton Textile Fibers 250 2.7 334 Petroleum oils and products 187 2.1 061 Sugar and honey 176 1.9 542 Medicaments (Includ Veterinary Medicaments) 167 1.8 001 Live Animals O than animals of Div 03 160 1.7 282 Ferrous waste & scrap 157 1.7 012 Meat, O than of Bov, Edible Offal, Frsh, Chld, Fzn 135 1.5 321 Coal, Pulverized Or Not, Not Agglomerated 129 1.4 048 Cereal prep & prep of flour/starch 115 1.3 672 Iron Or Steel Ingots & O Primary Forms, Semifinished 111 1.2 673 Iron/Nonalloy Steel Flat-Rolled Prod, Not clad/Coated 103 1.1 882 Photographic & Cinematographic Supplies 100 1.1 081 Feeding Stuff For Anmls (Not Incld Unmilled Cereals) 91 1.0 285 Aluminum ore & concentrates 83 0.9
20 Major 6,118 67.1 Others 2,999 32.9 Total 9,116 100.0
2004
SITC Commodities Value Share
(13) (14) (15) (16)
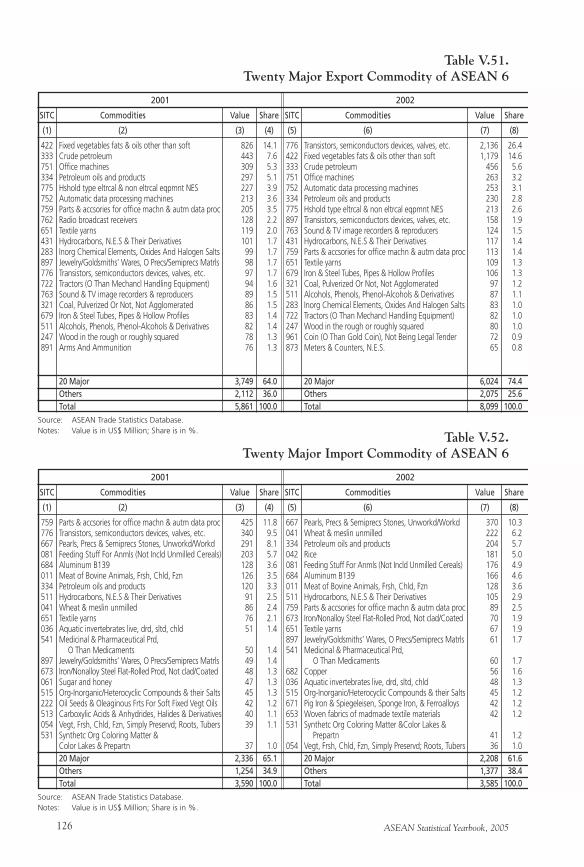
ASEAN Statistical Yearbook, 2005126
Table V.51.Twenty Major Export Commodity of ASEAN 6
422 Fixed vegetables fats & oils other than soft 826 14.1 333 Crude petroleum 443 7.6 751 Office machines 309 5.3 334 Petroleum oils and products 297 5.1 775 Hshold type eltrcal & non eltrcal eqpmnt NES 227 3.9 752 Automatic data processing machines 213 3.6 759 Parts & accsories for office machn & autm data proc 205 3.5 762 Radio broadcast receivers 128 2.2 651 Textile yarns 119 2.0 431 Hydrocarbons, N.E.S & Their Derivatives 101 1.7 283 Inorg Chemical Elements, Oxides And Halogen Salts 99 1.7 897 Jewelry/Goldsmiths’ Wares, O Precs/Semiprecs Matrls 98 1.7 776 Transistors, semiconductors devices, valves, etc. 97 1.7 722 Tractors (O Than Mechancl Handling Equipment) 94 1.6 763 Sound & TV image recorders & reproducers 89 1.5 321 Coal, Pulverized Or Not, Not Agglomerated 86 1.5 679 Iron & Steel Tubes, Pipes & Hollow Profiles 83 1.4 511 Alcohols, Phenols, Phenol-Alcohols & Derivatives 82 1.4 247 Wood in the rough or roughly squared 78 1.3 891 Arms And Ammunition 76 1.3
20 Major 3,749 64.0 Others 2,112 36.0 Total 5,861 100.0
2001
SITC Commodities Value Share
Source: ASEAN Trade Statistics Database.Notes: Value is in US$ Million; Share is in %.
(1) (2) (3) (4)
776 Transistors, semiconductors devices, valves, etc. 2,136 26.4 422 Fixed vegetables fats & oils other than soft 1,179 14.6 333 Crude petroleum 456 5.6 751 Office machines 263 3.2 752 Automatic data processing machines 253 3.1 334 Petroleum oils and products 230 2.8 775 Hshold type eltrcal & non eltrcal eqpmnt NES 213 2.6 897 Transistors, semiconductors devices, valves, etc. 158 1.9 763 Sound & TV image recorders & reproducers 124 1.5 431 Hydrocarbons, N.E.S & Their Derivatives 117 1.4 759 Parts & accsories for office machn & autm data proc 113 1.4 651 Textile yarns 109 1.3 679 Iron & Steel Tubes, Pipes & Hollow Profiles 106 1.3 321 Coal, Pulverized Or Not, Not Agglomerated 97 1.2 511 Alcohols, Phenols, Phenol-Alcohols & Derivatives 87 1.1 283 Inorg Chemical Elements, Oxides And Halogen Salts 83 1.0 722 Tractors (O Than Mechancl Handling Equipment) 82 1.0 247 Wood in the rough or roughly squared 80 1.0 961 Coin (O Than Gold Coin), Not Being Legal Tender 72 0.9 873 Meters & Counters, N.E.S. 65 0.8
20 Major 6,024 74.4 Others 2,075 25.6 Total 8,099 100.0
2002
SITC Commodities Value Share
(5) (6) (7) (8)
Table V.52.Twenty Major Import Commodity of ASEAN 6
759 Parts & accsories for office machn & autm data proc 425 11.8 776 Transistors, semiconductors devices, valves, etc. 340 9.5 667 Pearls, Precs & Semiprecs Stones, Unworkd/Workd 291 8.1 081 Feeding Stuff For Anmls (Not Incld Unmilled Cereals) 203 5.7 684 Aluminum B139 128 3.6 011 Meat of Bovine Animals, Frsh, Chld, Fzn 126 3.5 334 Petroleum oils and products 120 3.3 511 Hydrocarbons, N.E.S & Their Derivatives 91 2.5 041 Wheat & meslin unmilled 86 2.4 651 Textile yarns 76 2.1 036 Aquatic invertebrates live, drd, sltd, chld 51 1.4 541 Medicinal & Pharmaceutical Prd, O Than Medicaments 50 1.4 897 Jewelry/Goldsmiths’ Wares, O Precs/Semiprecs Matrls 49 1.4 673 Iron/Nonalloy Steel Flat-Rolled Prod, Not clad/Coated 48 1.3 061 Sugar and honey 47 1.3 515 Org-Inorganic/Heterocyclic Compounds & their Salts 45 1.3 222 Oil Seeds & Oleaginous Frts For Soft Fixed Vegt Oils 42 1.2 513 Carboxylic Acids & Anhydrides, Halides & Derivatives 40 1.1 054 Vegt, Frsh, Chld, Fzn, Simply Preservd; Roots, Tubers 39 1.1 531 Synthetc Org Coloring Matter & Color Lakes & Prepartn 37 1.0 20 Major 2,336 65.1 Others 1,254 34.9 Total 3,590 100.0
2001
SITC Commodities Value Share
Source: ASEAN Trade Statistics Database.Notes: Value is in US$ Million; Share is in %.
(1) (2) (3) (4)
667 Pearls, Precs & Semiprecs Stones, Unworkd/Workd 370 10.3 041 Wheat & meslin unmilled 222 6.2 334 Petroleum oils and products 204 5.7 042 Rice 181 5.0 081 Feeding Stuff For Anmls (Not Incld Unmilled Cereals) 176 4.9 684 Aluminum B139 166 4.6 011 Meat of Bovine Animals, Frsh, Chld, Fzn 128 3.6 511 Hydrocarbons, N.E.S & Their Derivatives 105 2.9 759 Parts & accsories for office machn & autm data proc 89 2.5 673 Iron/Nonalloy Steel Flat-Rolled Prod, Not clad/Coated 70 1.9 651 Textile yarns 67 1.9 897 Jewelry/Goldsmiths’ Wares, O Precs/Semiprecs Matrls 61 1.7 541 Medicinal & Pharmaceutical Prd, O Than Medicaments 60 1.7 682 Copper 56 1.6 036 Aquatic invertebrates live, drd, sltd, chld 48 1.3 515 Org-Inorganic/Heterocyclic Compounds & their Salts 45 1.2 671 Pig Iron & Spiegeleisen, Sponge Iron, & Ferroalloys 42 1.2 653 Woven fabrics of madmade textile materials 42 1.2 531 Synthetc Org Coloring Matter &Color Lakes & Prepartn 41 1.2 054 Vegt, Frsh, Chld, Fzn, Simply Preservd; Roots, Tubers 36 1.0 20 Major 2,208 61.6 Others 1,377 38.4 Total 3,585 100.0
2002
SITC Commodities Value Share
(5) (6) (7) (8)
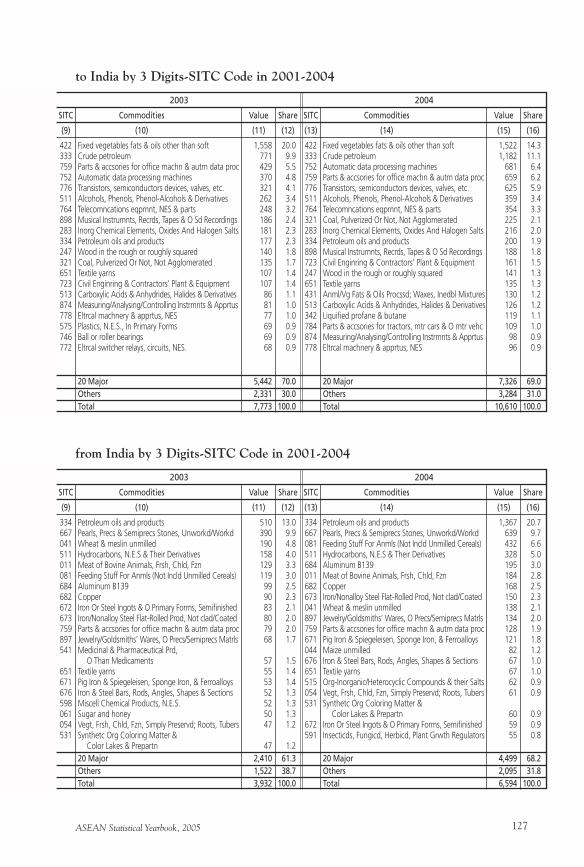
ASEAN Statistical Yearbook, 2005 127
to India by 3 Digits-SITC Code in 2001-2004
422 Fixed vegetables fats & oils other than soft 1,558 20.0 333 Crude petroleum 771 9.9 759 Parts & accsories for office machn & autm data proc 429 5.5 752 Automatic data processing machines 370 4.8 776 Transistors, semiconductors devices, valves, etc. 321 4.1 511 Alcohols, Phenols, Phenol-Alcohols & Derivatives 262 3.4 764 Telecomncations eqpmnt, NES & parts 248 3.2 898 Musical Instrumnts, Recrds, Tapes & O Sd Recordings 186 2.4 283 Inorg Chemical Elements, Oxides And Halogen Salts 181 2.3 334 Petroleum oils and products 177 2.3 247 Wood in the rough or roughly squared 140 1.8 321 Coal, Pulverized Or Not, Not Agglomerated 135 1.7 651 Textile yarns 107 1.4 723 Civil Enginring & Contractors’ Plant & Equipment 107 1.4 513 Carboxylic Acids & Anhydrides, Halides & Derivatives 86 1.1 874 Measuring/Analysing/Controlling Instrmnts & Apprtus 81 1.0 778 Eltrcal machnery & apprtus, NES 77 1.0 575 Plastics, N.E.S., In Primary Forms 69 0.9 746 Ball or roller bearings 69 0.9 772 Eltrcal switcher relays, circuits, NES. 68 0.9
20 Major 5,442 70.0 Others 2,331 30.0 Total 7,773 100.0
2003
SITC Commodities Value Share
(9) (10) (11) (12)
422 Fixed vegetables fats & oils other than soft 1,522 14.3 333 Crude petroleum 1,182 11.1 752 Automatic data processing machines 681 6.4 759 Parts & accsories for office machn & autm data proc 659 6.2 776 Transistors, semiconductors devices, valves, etc. 625 5.9 511 Alcohols, Phenols, Phenol-Alcohols & Derivatives 359 3.4 764 Telecomncations eqpmnt, NES & parts 354 3.3 321 Coal, Pulverized Or Not, Not Agglomerated 225 2.1 283 Inorg Chemical Elements, Oxides And Halogen Salts 216 2.0 334 Petroleum oils and products 200 1.9 898 Musical Instrumnts, Recrds, Tapes & O Sd Recordings 188 1.8 723 Civil Enginring & Contractors’ Plant & Equipment 161 1.5 247 Wood in the rough or roughly squared 141 1.3 651 Textile yarns 135 1.3 431 Anml/Vg Fats & Oils Procssd; Waxes, Inedbl Mixtures 130 1.2 513 Carboxylic Acids & Anhydrides, Halides & Derivatives 126 1.2 342 Liquified profane & butane 119 1.1 784 Parts & accsories for tractors, mtr cars & O mtr vehc 109 1.0 874 Measuring/Analysing/Controlling Instrmnts & Apprtus 98 0.9 778 Eltrcal machnery & apprtus, NES 96 0.9
20 Major 7,326 69.0 Others 3,284 31.0 Total 10,610 100.0
2004
SITC Commodities Value Share
(13) (14) (15) (16)
from India by 3 Digits-SITC Code in 2001-2004
334 Petroleum oils and products 510 13.0 667 Pearls, Precs & Semiprecs Stones, Unworkd/Workd 390 9.9 041 Wheat & meslin unmilled 190 4.8 511 Hydrocarbons, N.E.S & Their Derivatives 158 4.0 011 Meat of Bovine Animals, Frsh, Chld, Fzn 129 3.3 081 Feeding Stuff For Anmls (Not Incld Unmilled Cereals) 119 3.0 684 Aluminum B139 99 2.5 682 Copper 90 2.3 672 Iron Or Steel Ingots & O Primary Forms, Semifinished 83 2.1 673 Iron/Nonalloy Steel Flat-Rolled Prod, Not clad/Coated 80 2.0 759 Parts & accsories for office machn & autm data proc 79 2.0 897 Jewelry/Goldsmiths’ Wares, O Precs/Semiprecs Matrls 68 1.7 541 Medicinal & Pharmaceutical Prd, O Than Medicaments 57 1.5 651 Textile yarns 55 1.4 671 Pig Iron & Spiegeleisen, Sponge Iron, & Ferroalloys 53 1.4 676 Iron & Steel Bars, Rods, Angles, Shapes & Sections 52 1.3 598 Miscell Chemical Products, N.E.S. 52 1.3 061 Sugar and honey 50 1.3 054 Vegt, Frsh, Chld, Fzn, Simply Preservd; Roots, Tubers 47 1.2 531 Synthetc Org Coloring Matter & Color Lakes & Prepartn 47 1.2 20 Major 2,410 61.3 Others 1,522 38.7 Total 3,932 100.0
2003
SITC Commodities Value Share
(9) (10) (11) (12)
334 Petroleum oils and products 1,367 20.7 667 Pearls, Precs & Semiprecs Stones, Unworkd/Workd 639 9.7 081 Feeding Stuff For Anmls (Not Incld Unmilled Cereals) 432 6.6 511 Hydrocarbons, N.E.S & Their Derivatives 328 5.0 684 Aluminum B139 195 3.0 011 Meat of Bovine Animals, Frsh, Chld, Fzn 184 2.8 682 Copper 168 2.5 673 Iron/Nonalloy Steel Flat-Rolled Prod, Not clad/Coated 150 2.3 041 Wheat & meslin unmilled 138 2.1 897 Jewelry/Goldsmiths’ Wares, O Precs/Semiprecs Matrls 134 2.0 759 Parts & accsories for office machn & autm data proc 128 1.9 671 Pig Iron & Spiegeleisen, Sponge Iron, & Ferroalloys 121 1.8 044 Maize unmilled 82 1.2 676 Iron & Steel Bars, Rods, Angles, Shapes & Sections 67 1.0 651 Textile yarns 67 1.0 515 Org-Inorganic/Heterocyclic Compounds & their Salts 62 0.9 054 Vegt, Frsh, Chld, Fzn, Simply Preservd; Roots, Tubers 61 0.9 531 Synthetc Org Coloring Matter & Color Lakes & Prepartn 60 0.9 672 Iron Or Steel Ingots & O Primary Forms, Semifinished 59 0.9 591 Insecticds, Fungicd, Herbicd, Plant Grwth Regulators 55 0.8
20 Major 4,499 68.2 Others 2,095 31.8 Total 6,594 100.0
2004
SITC Commodities Value Share
(13) (14) (15) (16)
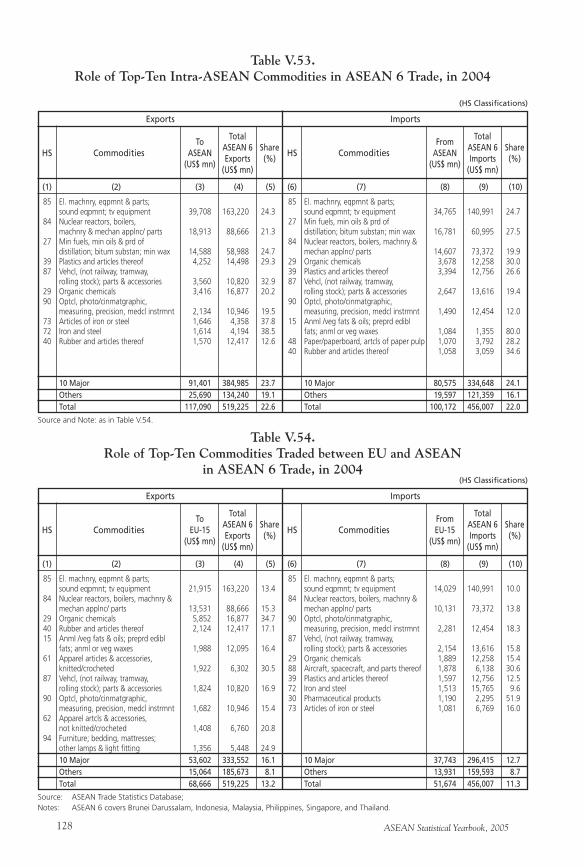
ASEAN Statistical Yearbook, 2005128
85 El. machnry, eqpmnt & parts; sound eqpmnt; tv equipment 39,708 163,220 24.3 84 Nuclear reactors, boilers, machnry & mechan applnc/ parts 18,913 88,666 21.3 27 Min fuels, min oils & prd of distillation; bitum substan; min wax 14,588 58,988 24.7 39 Plastics and articles thereof 4,252 14,498 29.3 87 Vehcl, (not railway, tramway, rolling stock); parts & accessories 3,560 10,820 32.9 29 Organic chemicals 3,416 16,877 20.2 90 Optcl, photo/cinmatgraphic, measuring, precision, medcl instrmnt 2,134 10,946 19.5 73 Articles of iron or steel 1,646 4,358 37.8 72 Iron and steel 1,614 4,194 38.5 40 Rubber and articles thereof 1,570 12,417 12.6
10 Major 91,401 384,985 23.7 Others 25,690 134,240 19.1 Total 117,090 519,225 22.6
Table V.53.Role of Top-Ten Intra-ASEAN Commodities in ASEAN 6 Trade, in 2004
Exports
HS Commodities
Source and Note: as in Table V.54.
(1) (2) (3) (4) (5)
Total ASEAN 6 Exports
(US$ mn)
Share(%)
(HS Classifications)
To ASEAN
(US$ mn)
Source: ASEAN Trade Statistics Database;Notes: ASEAN 6 covers Brunei Darussalam, Indonesia, Malaysia, Philippines, Singapore, and Thailand.
85 El. machnry, eqpmnt & parts; sound eqpmnt; tv equipment 34,765 140,991 24.7 27 Min fuels, min oils & prd of distillation; bitum substan; min wax 16,781 60,995 27.5 84 Nuclear reactors, boilers, machnry & mechan applnc/ parts 14,607 73,372 19.9 29 Organic chemicals 3,678 12,258 30.0 39 Plastics and articles thereof 3,394 12,756 26.6 87 Vehcl, (not railway, tramway, rolling stock); parts & accessories 2,647 13,616 19.4 90 Optcl, photo/cinmatgraphic, measuring, precision, medcl instrmnt 1,490 12,454 12.0 15 Anml /veg fats & oils; preprd edibl fats; anml or veg waxes 1,084 1,355 80.0 48 Paper/paperboard, artcls of paper pulp 1,070 3,792 28.2 40 Rubber and articles thereof 1,058 3,059 34.6
10 Major 80,575 334,648 24.1 Others 19,597 121,359 16.1 Total 100,172 456,007 22.0
Imports
HS Commodities
(6) (7) (8) (9) (10)
Total ASEAN 6 Imports
(US$ mn)
Share(%)
From ASEAN
(US$ mn)
Table V.54.Role of Top-Ten Commodities Traded between EU and ASEAN
in ASEAN 6 Trade, in 2004
85 El. machnry, eqpmnt & parts; sound eqpmnt; tv equipment 21,915 163,220 13.4 84 Nuclear reactors, boilers, machnry & mechan applnc/ parts 13,531 88,666 15.3 29 Organic chemicals 5,852 16,877 34.7 40 Rubber and articles thereof 2,124 12,417 17.1 15 Anml /veg fats & oils; preprd edibl fats; anml or veg waxes 1,988 12,095 16.4 61 Apparel articles & accessories, knitted/crocheted 1,922 6,302 30.5 87 Vehcl, (not railway, tramway, rolling stock); parts & accessories 1,824 10,820 16.9 90 Optcl, photo/cinmatgraphic, measuring, precision, medcl instrmnt 1,682 10,946 15.4 62 Apparel artcls & accessories, not knitted/crocheted 1,408 6,760 20.8 94 Furniture; bedding, mattresses; other lamps & light fitting 1,356 5,448 24.9 10 Major 53,602 333,552 16.1 Others 15,064 185,673 8.1 Total 68,666 519,225 13.2
Exports
HS Commodities
(1) (2) (3) (4) (5)
Total ASEAN 6 Exports
(US$ mn)
Share(%)
To EU-15
(US$ mn)
85 El. machnry, eqpmnt & parts; sound eqpmnt; tv equipment 14,029 140,991 10.0 84 Nuclear reactors, boilers, machnry & mechan applnc/ parts 10,131 73,372 13.8 90 Optcl, photo/cinmatgraphic, measuring, precision, medcl instrmnt 2,281 12,454 18.3 87 Vehcl, (not railway, tramway, rolling stock); parts & accessories 2,154 13,616 15.8 29 Organic chemicals 1,889 12,258 15.4 88 Aircraft, spacecraft, and parts thereof 1,878 6,138 30.6 39 Plastics and articles thereof 1,597 12,756 12.5 72 Iron and steel 1,513 15,765 9.6 30 Pharmaceutical products 1,190 2,295 51.9 73 Articles of iron or steel 1,081 6,769 16.0
10 Major 37,743 296,415 12.7 Others 13,931 159,593 8.7 Total 51,674 456,007 11.3
Imports
HS Commodities
(6) (7) (8) (9) (10)
Total ASEAN 6 Imports
(US$ mn)
Share(%)
From EU-15
(US$ mn)
(HS Classifications)
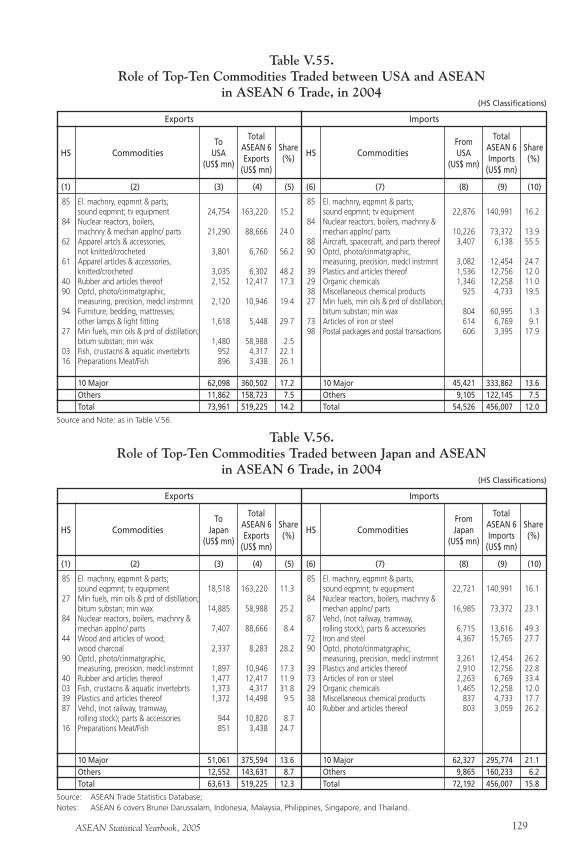
ASEAN Statistical Yearbook, 2005 129
85 El. machnry, eqpmnt & parts; sound eqpmnt; tv equipment 24,754 163,220 15.2 84 Nuclear reactors, boilers, machnry & mechan applnc/ parts 21,290 88,666 24.0 62 Apparel artcls & accessories, not knitted/crocheted 3,801 6,760 56.2 61 Apparel articles & accessories, knitted/crocheted 3,035 6,302 48.2 40 Rubber and articles thereof 2,152 12,417 17.3 90 Optcl, photo/cinmatgraphic, measuring, precision, medcl instrmnt 2,120 10,946 19.4 94 Furniture; bedding, mattresses; other lamps & light fitting 1,618 5,448 29.7 27 Min fuels, min oils & prd of distillation; bitum substan; min wax 1,480 58,988 2.5 03 Fish, crustacns & aquatic invertebrts 952 4,317 22.1 16 Preparations Meat/Fish 896 3,438 26.1
10 Major 62,098 360,502 17.2 Others 11,862 158,723 7.5 Total 73,961 519,225 14.2
Table V.55.Role of Top-Ten Commodities Traded between USA and ASEAN
in ASEAN 6 Trade, in 2004
Exports
HS Commodities
Source and Note: as in Table V.56.
(1) (2) (3) (4) (5)
Total ASEAN 6 Exports
(US$ mn)
Share(%)
(HS Classifications)
To USA
(US$ mn)
Source: ASEAN Trade Statistics Database;Notes: ASEAN 6 covers Brunei Darussalam, Indonesia, Malaysia, Philippines, Singapore, and Thailand.
85 El. machnry, eqpmnt & parts; sound eqpmnt; tv equipment 22,876 140,991 16.2 84 Nuclear reactors, boilers, machnry & mechan applnc/ parts 10,226 73,372 13.9 88 Aircraft, spacecraft, and parts thereof 3,407 6,138 55.5 90 Optcl, photo/cinmatgraphic, measuring, precision, medcl instrmnt 3,082 12,454 24.7 39 Plastics and articles thereof 1,536 12,756 12.0 29 Organic chemicals 1,346 12,258 11.0 38 Miscellaneous chemical products 925 4,733 19.5 27 Min fuels, min oils & prd of distillation; bitum substan; min wax 804 60,995 1.3 73 Articles of iron or steel 614 6,769 9.1 98 Postal packages and postal transactions 606 3,395 17.9
10 Major 45,421 333,862 13.6 Others 9,105 122,145 7.5 Total 54,526 456,007 12.0
Imports
HS Commodities
(6) (7) (8) (9) (10)
Total ASEAN 6 Imports
(US$ mn)
Share(%)
From USA
(US$ mn)
Table V.56.Role of Top-Ten Commodities Traded between Japan and ASEAN
in ASEAN 6 Trade, in 2004
85 El. machnry, eqpmnt & parts; sound eqpmnt; tv equipment 18,518 163,220 11.3 27 Min fuels, min oils & prd of distillation; bitum substan; min wax 14,885 58,988 25.2 84 Nuclear reactors, boilers, machnry & mechan applnc/ parts 7,407 88,666 8.4 44 Wood and articles of wood; wood charcoal 2,337 8,283 28.2 90 Optcl, photo/cinmatgraphic, measuring, precision, medcl instrmnt 1,897 10,946 17.3 40 Rubber and articles thereof 1,477 12,417 11.9 03 Fish, crustacns & aquatic invertebrts 1,373 4,317 31.8 39 Plastics and articles thereof 1,372 14,498 9.5 87 Vehcl, (not railway, tramway, rolling stock); parts & accessories 944 10,820 8.7 16 Preparations Meat/Fish 851 3,438 24.7
10 Major 51,061 375,594 13.6 Others 12,552 143,631 8.7 Total 63,613 519,225 12.3
Exports
HS Commodities
(1) (2) (3) (4) (5)
Total ASEAN 6 Exports
(US$ mn)
Share(%)
To Japan
(US$ mn)
85 El. machnry, eqpmnt & parts; sound eqpmnt; tv equipment 22,721 140,991 16.1 84 Nuclear reactors, boilers, machnry & mechan applnc/ parts 16,985 73,372 23.1 87 Vehcl, (not railway, tramway, rolling stock); parts & accessories 6,715 13,616 49.3 72 Iron and steel 4,367 15,765 27.7 90 Optcl, photo/cinmatgraphic, measuring, precision, medcl instrmnt 3,261 12,454 26.2 39 Plastics and articles thereof 2,910 12,756 22.8 73 Articles of iron or steel 2,263 6,769 33.4 29 Organic chemicals 1,465 12,258 12.0 38 Miscellaneous chemical products 837 4,733 17.7 40 Rubber and articles thereof 803 3,059 26.2
10 Major 62,327 295,774 21.1 Others 9,865 160,233 6.2 Total 72,192 456,007 15.8
Imports
HS Commodities
(6) (7) (8) (9) (10)
Total ASEAN 6 Imports
(US$ mn)
Share(%)
From Japan
(US$ mn)
(HS Classifications)
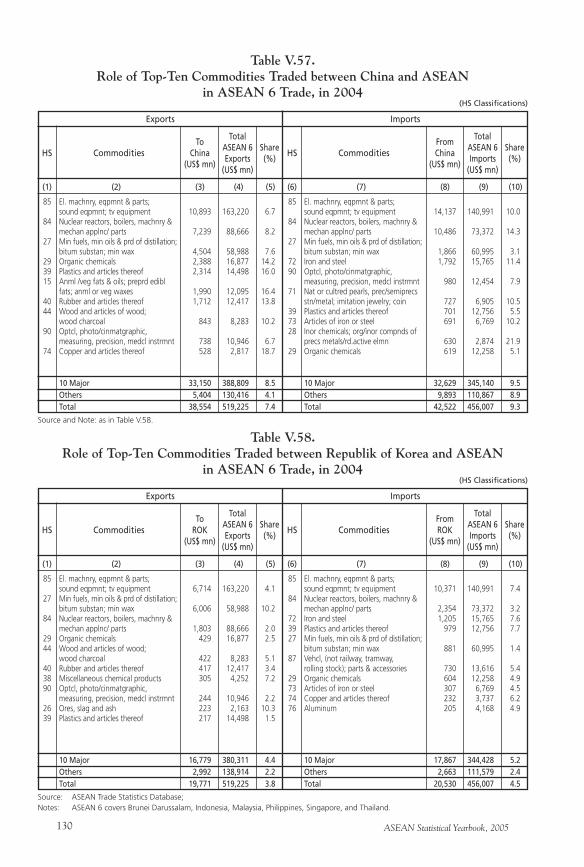
ASEAN Statistical Yearbook, 2005130
85 El. machnry, eqpmnt & parts; sound eqpmnt; tv equipment 10,893 163,220 6.7 84 Nuclear reactors, boilers, machnry & mechan applnc/ parts 7,239 88,666 8.2 27 Min fuels, min oils & prd of distillation; bitum substan; min wax 4,504 58,988 7.6 29 Organic chemicals 2,388 16,877 14.2 39 Plastics and articles thereof 2,314 14,498 16.0 15 Anml /veg fats & oils; preprd edibl fats; anml or veg waxes 1,990 12,095 16.4 40 Rubber and articles thereof 1,712 12,417 13.8 44 Wood and articles of wood; wood charcoal 843 8,283 10.2 90 Optcl, photo/cinmatgraphic, measuring, precision, medcl instrmnt 738 10,946 6.7 74 Copper and articles thereof 528 2,817 18.7
10 Major 33,150 388,809 8.5 Others 5,404 130,416 4.1 Total 38,554 519,225 7.4
Table V.57.Role of Top-Ten Commodities Traded between China and ASEAN
in ASEAN 6 Trade, in 2004
Exports
HS Commodities
Source and Note: as in Table V.58.
(1) (2) (3) (4) (5)
Total ASEAN 6 Exports
(US$ mn)
Share(%)
(HS Classifications)
To China
(US$ mn)
Source: ASEAN Trade Statistics Database;Notes: ASEAN 6 covers Brunei Darussalam, Indonesia, Malaysia, Philippines, Singapore, and Thailand.
85 El. machnry, eqpmnt & parts; sound eqpmnt; tv equipment 14,137 140,991 10.0 84 Nuclear reactors, boilers, machnry & mechan applnc/ parts 10,486 73,372 14.3 27 Min fuels, min oils & prd of distillation; bitum substan; min wax 1,866 60,995 3.1 72 Iron and steel 1,792 15,765 11.4 90 Optcl, photo/cinmatgraphic, measuring, precision, medcl instrmnt 980 12,454 7.9 71 Nat or cultred pearls, prec/semiprecs stn/metal; imitation jewelry; coin 727 6,905 10.5 39 Plastics and articles thereof 701 12,756 5.5 73 Articles of iron or steel 691 6,769 10.2 28 Inor chemicals; org/inor compnds of precs metals/rd.active elmn 630 2,874 21.9 29 Organic chemicals 619 12,258 5.1
10 Major 32,629 345,140 9.5 Others 9,893 110,867 8.9 Total 42,522 456,007 9.3
Imports
HS Commodities
(6) (7) (8) (9) (10)
Total ASEAN 6 Imports
(US$ mn)
Share(%)
From China
(US$ mn)
Table V.58.Role of Top-Ten Commodities Traded between Republik of Korea and ASEAN
in ASEAN 6 Trade, in 2004
85 El. machnry, eqpmnt & parts; sound eqpmnt; tv equipment 6,714 163,220 4.1 27 Min fuels, min oils & prd of distillation; bitum substan; min wax 6,006 58,988 10.2 84 Nuclear reactors, boilers, machnry & mechan applnc/ parts 1,803 88,666 2.0 29 Organic chemicals 429 16,877 2.5 44 Wood and articles of wood; wood charcoal 422 8,283 5.1 40 Rubber and articles thereof 417 12,417 3.4 38 Miscellaneous chemical products 305 4,252 7.2 90 Optcl, photo/cinmatgraphic, measuring, precision, medcl instrmnt 244 10,946 2.2 26 Ores, slag and ash 223 2,163 10.3 39 Plastics and articles thereof 217 14,498 1.5
10 Major 16,779 380,311 4.4 Others 2,992 138,914 2.2 Total 19,771 519,225 3.8
Exports
HS Commodities
(1) (2) (3) (4) (5)
Total ASEAN 6 Exports
(US$ mn)
Share(%)
To ROK
(US$ mn)
85 El. machnry, eqpmnt & parts; sound eqpmnt; tv equipment 10,371 140,991 7.4 84 Nuclear reactors, boilers, machnry & mechan applnc/ parts 2,354 73,372 3.2 72 Iron and steel 1,205 15,765 7.6 39 Plastics and articles thereof 979 12,756 7.7 27 Min fuels, min oils & prd of distillation; bitum substan; min wax 881 60,995 1.4 87 Vehcl, (not railway, tramway, rolling stock); parts & accessories 730 13,616 5.4 29 Organic chemicals 604 12,258 4.9 73 Articles of iron or steel 307 6,769 4.5 74 Copper and articles thereof 232 3,737 6.2 76 Aluminum 205 4,168 4.9
10 Major 17,867 344,428 5.2 Others 2,663 111,579 2.4 Total 20,530 456,007 4.5
Imports
HS Commodities
(6) (7) (8) (9) (10)
Total ASEAN 6 Imports
(US$ mn)
Share(%)
From ROK
(US$ mn)
(HS Classifications)
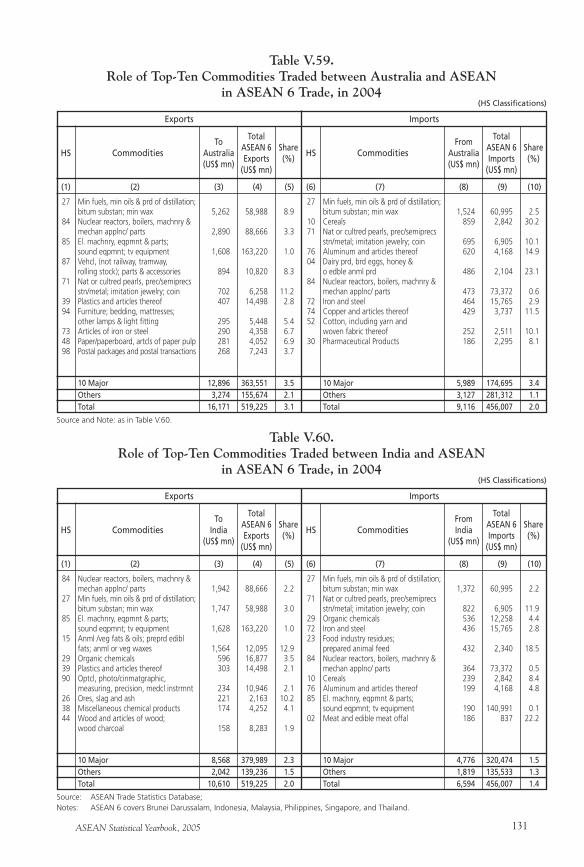
ASEAN Statistical Yearbook, 2005 131
27 Min fuels, min oils & prd of distillation; bitum substan; min wax 5,262 58,988 8.9 84 Nuclear reactors, boilers, machnry & mechan applnc/ parts 2,890 88,666 3.3 85 El. machnry, eqpmnt & parts; sound eqpmnt; tv equipment 1,608 163,220 1.0 87 Vehcl, (not railway, tramway, rolling stock); parts & accessories 894 10,820 8.3 71 Nat or cultred pearls, prec/semiprecs stn/metal; imitation jewelry; coin 702 6,258 11.2 39 Plastics and articles thereof 407 14,498 2.8 94 Furniture; bedding, mattresses; other lamps & light fitting 295 5,448 5.4 73 Articles of iron or steel 290 4,358 6.7 48 Paper/paperboard, artcls of paper pulp 281 4,052 6.9 98 Postal packages and postal transactions 268 7,243 3.7
10 Major 12,896 363,551 3.5 Others 3,274 155,674 2.1 Total 16,171 519,225 3.1
Table V.59.Role of Top-Ten Commodities Traded between Australia and ASEAN
in ASEAN 6 Trade, in 2004
Exports
HS Commodities
Source and Note: as in Table V.60.
(1) (2) (3) (4) (5)
Total ASEAN 6 Exports
(US$ mn)
Share(%)
(HS Classifications)
To Australia(US$ mn)
Source: ASEAN Trade Statistics Database;Notes: ASEAN 6 covers Brunei Darussalam, Indonesia, Malaysia, Philippines, Singapore, and Thailand.
27 Min fuels, min oils & prd of distillation; bitum substan; min wax 1,524 60,995 2.5 10 Cereals 859 2,842 30.2 71 Nat or cultred pearls, prec/semiprecs stn/metal; imitation jewelry; coin 695 6,905 10.1 76 Aluminum and articles thereof 620 4,168 14.9 04 Dairy prd, brd eggs, honey & o edble anml prd 486 2,104 23.1 84 Nuclear reactors, boilers, machnry & mechan applnc/ parts 473 73,372 0.6 72 Iron and steel 464 15,765 2.9 74 Copper and articles thereof 429 3,737 11.5 52 Cotton, including yarn and woven fabric thereof 252 2,511 10.1 30 Pharmaceutical Products 186 2,295 8.1
10 Major 5,989 174,695 3.4 Others 3,127 281,312 1.1 Total 9,116 456,007 2.0
Imports
HS Commodities
(6) (7) (8) (9) (10)
Total ASEAN 6 Imports
(US$ mn)
Share(%)
From Australia(US$ mn)
Table V.60.Role of Top-Ten Commodities Traded between India and ASEAN
in ASEAN 6 Trade, in 2004
84 Nuclear reactors, boilers, machnry & mechan applnc/ parts 1,942 88,666 2.2 27 Min fuels, min oils & prd of distillation; bitum substan; min wax 1,747 58,988 3.0 85 El. machnry, eqpmnt & parts; sound eqpmnt; tv equipment 1,628 163,220 1.0 15 Anml /veg fats & oils; preprd edibl fats; anml or veg waxes 1,564 12,095 12.9 29 Organic chemicals 596 16,877 3.5 39 Plastics and articles thereof 303 14,498 2.1 90 Optcl, photo/cinmatgraphic, measuring, precision, medcl instrmnt 234 10,946 2.1 26 Ores, slag and ash 221 2,163 10.2 38 Miscellaneous chemical products 174 4,252 4.1 44 Wood and articles of wood; wood charcoal 158 8,283 1.9
10 Major 8,568 379,989 2.3 Others 2,042 139,236 1.5 Total 10,610 519,225 2.0
Exports
HS Commodities
(1) (2) (3) (4) (5)
Total ASEAN 6 Exports
(US$ mn)
Share(%)
To India
(US$ mn)
27 Min fuels, min oils & prd of distillation; bitum substan; min wax 1,372 60,995 2.2 71 Nat or cultred pearls, prec/semiprecs stn/metal; imitation jewelry; coin 822 6,905 11.9 29 Organic chemicals 536 12,258 4.4 72 Iron and steel 436 15,765 2.8 23 Food industry residues; prepared animal feed 432 2,340 18.5 84 Nuclear reactors, boilers, machnry & mechan applnc/ parts 364 73,372 0.5 10 Cereals 239 2,842 8.4 76 Aluminum and articles thereof 199 4,168 4.8 85 El. machnry, eqpmnt & parts; sound eqpmnt; tv equipment 190 140,991 0.1 02 Meat and edible meat offal 186 837 22.2
10 Major 4,776 320,474 1.5 Others 1,819 135,533 1.3 Total 6,594 456,007 1.4
Imports
HS Commodities
(6) (7) (8) (9) (10)
Total ASEAN 6 Imports
(US$ mn)
Share(%)
From India
(US$ mn)
(HS Classifications)
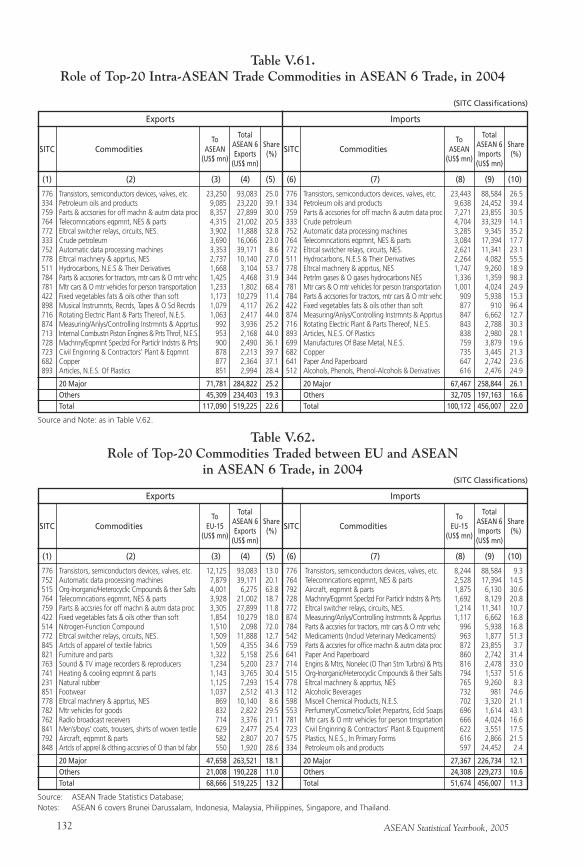
ASEAN Statistical Yearbook, 2005132
776 Transistors, semiconductors devices, valves, etc. 23,250 93,083 25.0 334 Petroleum oils and products 9,085 23,220 39.1 759 Parts & accsories for off machn & autm data proc 8,357 27,899 30.0 764 Telecomncations eqpmnt, NES & parts 4,315 21,002 20.5 772 Eltrcal switcher relays, circuits, NES. 3,902 11,888 32.8 333 Crude petroleum 3,690 16,066 23.0 752 Automatic data processing machines 3,353 39,171 8.6 778 Eltrcal machnery & apprtus, NES 2,737 10,140 27.0 511 Hydrocarbons, N.E.S & Their Derivatives 1,668 3,104 53.7 784 Parts & accsories for tractors, mtr cars & O mtr vehc 1,425 4,468 31.9 781 Mtr cars & O mtr vehicles for person transportation 1,233 1,802 68.4 422 Fixed vegetables fats & oils other than soft 1,173 10,279 11.4 898 Musical Instrumnts, Recrds, Tapes & O Sd Recrds 1,079 4,117 26.2 716 Rotating Electric Plant & Parts Thereof, N.E.S. 1,063 2,417 44.0 874 Measuring/Anlys/Controlling Instrmnts & Apprtus 992 3,936 25.2 713 Internal Combustn Piston Engines & Prts Throf, N.E.S. 953 2,168 44.0 728 Machnry/Eqpmnt Speclzd For Particlr Indstrs & Prts 900 2,490 36.1 723 Civil Enginring & Contractors’ Plant & Eqpmnt 878 2,213 39.7 682 Copper 877 2,364 37.1 893 Articles, N.E.S. Of Plastics 851 2,994 28.4
20 Major 71,781 284,822 25.2 Others 45,309 234,403 19.3 Total 117,090 519,225 22.6
Table V.61.Role of Top-20 Intra-ASEAN Trade Commodities in ASEAN 6 Trade, in 2004
Exports
SITC Commodities
Source and Note: as in Table V.62.
(1) (2) (3) (4) (5)
Total ASEAN 6 Exports
(US$ mn)
Share(%)
(SITC Classifications)
To ASEAN
(US$ mn)
Imports
776 Transistors, semiconductors devices, valves, etc. 23,443 88,584 26.5 334 Petroleum oils and products 9,638 24,452 39.4 759 Parts & accsories for off machn & autm data proc 7,271 23,855 30.5 333 Crude petroleum 4,704 33,329 14.1 752 Automatic data processing machines 3,285 9,345 35.2 764 Telecomncations eqpmnt, NES & parts 3,084 17,394 17.7 772 Eltrcal switcher relays, circuits, NES. 2,621 11,341 23.1 511 Hydrocarbons, N.E.S & Their Derivatives 2,264 4,082 55.5 778 Eltrcal machnery & apprtus, NES 1,747 9,260 18.9 344 Petrlm gases & O gases hydrocarbons NES 1,336 1,359 98.3 781 Mtr cars & O mtr vehicles for person transportation 1,001 4,024 24.9 784 Parts & accsories for tractors, mtr cars & O mtr vehc 909 5,938 15.3 422 Fixed vegetables fats & oils other than soft 877 910 96.4 874 Measuring/Anlys/Controlling Instrmnts & Apprtus 847 6,662 12.7 716 Rotating Electric Plant & Parts Thereof, N.E.S. 843 2,788 30.3 893 Articles, N.E.S. Of Plastics 838 2,980 28.1 699 Manufactures Of Base Metal, N.E.S. 759 3,879 19.6 682 Copper 735 3,445 21.3 641 Paper And Paperboard 647 2,742 23.6 512 Alcohols, Phenols, Phenol-Alcohols & Derivatives 616 2,476 24.9
20 Major 67,467 258,844 26.1 Others 32,705 197,163 16.6 Total 100,172 456,007 22.0
SITC Commodities
(6) (7) (8) (9) (10)
Total ASEAN 6 Imports
(US$ mn)
Share(%)
To ASEAN
(US$ mn)
776 Transistors, semiconductors devices, valves, etc. 12,125 93,083 13.0 752 Automatic data processing machines 7,879 39,171 20.1 515 Org-Inorganic/Heterocyclic Cmpounds & their Salts 4,001 6,275 63.8 764 Telecomncations eqpmnt, NES & parts 3,928 21,002 18.7 759 Parts & accsries for off machn & autm data proc 3,305 27,899 11.8 422 Fixed vegetables fats & oils other than soft 1,854 10,279 18.0 514 Nitrogen-Function Compound 1,510 2,098 72.0 772 Eltrcal switcher relays, circuits, NES. 1,509 11,888 12.7 845 Artcls of apparel of textile fabrics 1,509 4,355 34.6 821 Furniture and parts 1,322 5,158 25.6 763 Sound & TV image recorders & reproducers 1,234 5,200 23.7 741 Heating & cooling eqpmnt & parts 1,143 3,765 30.4 231 Natural rubber 1,125 7,293 15.4 851 Footwear 1,037 2,512 41.3 778 Eltrcal machnery & apprtus, NES 869 10,140 8.6 782 Mtr vehicles for goods 832 2,822 29.5 762 Radio broadcast receivers 714 3,376 21.1 841 Men’s/boys’ coats, trousers, shirts of woven textile 629 2,477 25.4 792 Aircraft, eqpmnt & parts 582 2,807 20.7 848 Artcls of apprel & clthing accsries of O than txl fabr 550 1,920 28.6
20 Major 47,658 263,521 18.1 Others 21,008 190,228 11.0 Total 68,666 519,225 13.2
Table V.62.Role of Top-20 Commodities Traded between EU and ASEAN
in ASEAN 6 Trade, in 2004
Exports
SITC Commodities
(1) (2) (3) (4) (5)
Total ASEAN 6 Exports
(US$ mn)
Share(%)
(SITC Classifications)
To EU-15
(US$ mn)
Imports
776 Transistors, semiconductors devices, valves, etc. 8,244 88,584 9.3 764 Telecomncations eqpmnt, NES & parts 2,528 17,394 14.5 792 Aircraft, eqpmnt & parts 1,875 6,130 30.6 728 Machnry/Eqpmnt Speclzd For Particlr Indstrs & Prts 1,692 8,129 20.8 772 Eltrcal switcher relays, circuits, NES. 1,214 11,341 10.7 874 Measuring/Anlys/Controlling Instrmnts & Apprtus 1,117 6,662 16.8 784 Parts & accsries for tractors, mtr cars & O mtr vehc 996 5,938 16.8 542 Medicaments (Includ Veterinary Medicaments) 963 1,877 51.3 759 Parts & accsries for office machn & autm data proc 872 23,855 3.7 641 Paper And Paperboard 860 2,742 31.4 714 Engins & Mtrs, Nonelec (O Than Stm Turbns) & Prts 816 2,478 33.0 515 Org-Inorganic/Heterocyclic Cmpounds & their Salts 794 1,537 51.6 778 Eltrcal machnery & apprtus, NES 765 9,260 8.3 112 Alcoholic Beverages 732 981 74.6 598 Miscell Chemical Products, N.E.S. 702 3,320 21.1 553 Perfumery/Cosmetics/Toilet Prepartns, Ecld Soaps 696 1,614 43.1 781 Mtr cars & O mtr vehicles for person trnsprtation 666 4,024 16.6 723 Civil Enginring & Contractors’ Plant & Equipment 622 3,551 17.5 575 Plastics, N.E.S., In Primary Forms 616 2,866 21.5 334 Petroleum oils and products 597 24,452 2.4
20 Major 27,367 226,734 12.1 Others 24,308 229,273 10.6 Total 51,674 456,007 11.3
SITC Commodities
(6) (7) (8) (9) (10)
Total ASEAN 6 Imports
(US$ mn)
Share(%)
To EU-15
(US$ mn)
Source: ASEAN Trade Statistics Database;Notes: ASEAN 6 covers Brunei Darussalam, Indonesia, Malaysia, Philippines, Singapore, and Thailand.
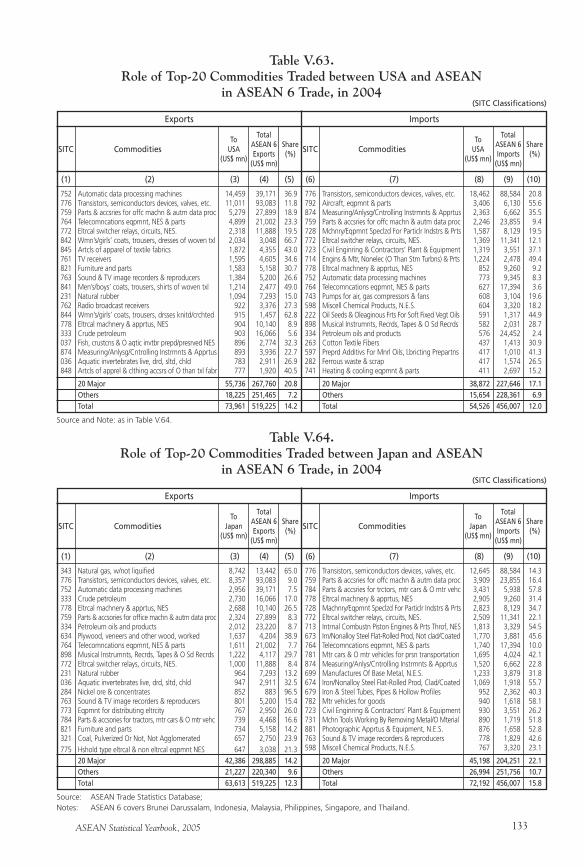
ASEAN Statistical Yearbook, 2005 133
752 Automatic data processing machines 14,459 39,171 36.9 776 Transistors, semiconductors devices, valves, etc. 11,011 93,083 11.8 759 Parts & accsries for offc machn & autm data proc 5,279 27,899 18.9 764 Telecomncations eqpmnt, NES & parts 4,899 21,002 23.3 772 Eltrcal switcher relays, circuits, NES. 2,318 11,888 19.5 842 Wmn’s/girls’ coats, trousers, dresses of woven txl 2,034 3,048 66.7 845 Artcls of apparel of textile fabrics 1,872 4,355 43.0 761 TV receivers 1,595 4,605 34.6 821 Furniture and parts 1,583 5,158 30.7 763 Sound & TV image recorders & reproducers 1,384 5,200 26.6 841 Men’s/boys’ coats, trousers, shirts of woven txl 1,214 2,477 49.0 231 Natural rubber 1,094 7,293 15.0 762 Radio broadcast receivers 922 3,376 27.3 844 Wmn’s/girls’ coats, trousers, drsses knitd/crchted 915 1,457 62.8 778 Eltrcal machnery & apprtus, NES 904 10,140 8.9 333 Crude petroleum 903 16,066 5.6 037 Fish, crustcns & O aqtic invtbr prepd/presrved NES 896 2,774 32.3 874 Measuring/Anlysg/Cntrolling Instrmnts & Apprtus 893 3,936 22.7 036 Aquatic invertebrates live, drd, sltd, chld 783 2,911 26.9 848 Artcls of apprel & clthing accsrs of O than txl fabr 777 1,920 40.5
20 Major 55,736 267,760 20.8 Others 18,225 251,465 7.2 Total 73,961 519,225 14.2
Table V.63.Role of Top-20 Commodities Traded between USA and ASEAN
in ASEAN 6 Trade, in 2004
Exports
SITC Commodities
Source and Note: as in Table V.64.
(1) (2) (3) (4) (5)
Total ASEAN 6 Exports
(US$ mn)
Share(%)
(SITC Classifications)
To USA
(US$ mn)
Imports
776 Transistors, semiconductors devices, valves, etc. 18,462 88,584 20.8 792 Aircraft, eqpmnt & parts 3,406 6,130 55.6 874 Measuring/Anlysg/Cntrolling Instrmnts & Apprtus 2,363 6,662 35.5 759 Parts & accsries for offc machn & autm data proc 2,246 23,855 9.4 728 Mchnry/Eqpmnt Speclzd For Particlr Indstrs & Prts 1,587 8,129 19.5 772 Eltrcal switcher relays, circuits, NES. 1,369 11,341 12.1 723 Civil Enginring & Contractors’ Plant & Equipment 1,319 3,551 37.1 714 Engins & Mtr, Nonelec (O Than Stm Turbns) & Prts 1,224 2,478 49.4 778 Eltrcal machnery & apprtus, NES 852 9,260 9.2 752 Automatic data processing machines 773 9,345 8.3 764 Telecomncations eqpmnt, NES & parts 627 17,394 3.6 743 Pumps for air, gas compressors & fans 608 3,104 19.6 598 Miscell Chemical Products, N.E.S. 604 3,320 18.2 222 Oil Seeds & Oleaginous Frts For Soft Fixed Vegt Oils 591 1,317 44.9 898 Musical Instrumnts, Recrds, Tapes & O Sd Recrds 582 2,031 28.7 334 Petroleum oils and products 576 24,452 2.4 263 Cotton Textile Fibers 437 1,413 30.9 597 Preprd Additivs For Mnrl Oils, Lbricting Prepartns 417 1,010 41.3 282 Ferrous waste & scrap 417 1,574 26.5 741 Heating & cooling eqpmnt & parts 411 2,697 15.2
20 Major 38,872 227,646 17.1 Others 15,654 228,361 6.9 Total 54,526 456,007 12.0
SITC Commodities
(6) (7) (8) (9) (10)
Total ASEAN 6 Imports
(US$ mn)
Share(%)
To USA
(US$ mn)
343 Natural gas, w/not liquified 8,742 13,442 65.0 776 Transistors, semiconductors devices, valves, etc. 8,357 93,083 9.0 752 Automatic data processing machines 2,956 39,171 7.5 333 Crude petroleum 2,730 16,066 17.0 778 Eltrcal machnery & apprtus, NES 2,688 10,140 26.5 759 Parts & accsories for office machn & autm data proc 2,324 27,899 8.3 334 Petroleum oils and products 2,012 23,220 8.7 634 Plywood, veneers and other wood, worked 1,637 4,204 38.9 764 Telecomncations eqpmnt, NES & parts 1,611 21,002 7.7 898 Musical Instrumnts, Recrds, Tapes & O Sd Recrds 1,222 4,117 29.7 772 Eltrcal switcher relays, circuits, NES. 1,000 11,888 8.4 231 Natural rubber 964 7,293 13.2 036 Aquatic invertebrates live, drd, sltd, chld 947 2,911 32.5 284 Nickel ore & concentrates 852 883 96.5 763 Sound & TV image recorders & reproducers 801 5,200 15.4 773 Eqpmnt for distributing eltrcity 767 2,950 26.0 784 Parts & accsories for tractors, mtr cars & O mtr vehc 739 4,468 16.6 821 Furniture and parts 734 5,158 14.2 321 Coal, Pulverized Or Not, Not Agglomerated 657 2,750 23.9 775 Hshold type eltrcal & non eltrcal eqpmnt NES 647 3,038 21.3 20 Major 42,386 298,885 14.2 Others 21,227 220,340 9.6 Total 63,613 519,225 12.3
Table V.64.Role of Top-20 Commodities Traded between Japan and ASEAN
in ASEAN 6 Trade, in 2004
Exports
SITC Commodities
(1) (2) (3) (4) (5)
Total ASEAN 6 Exports
(US$ mn)
Share(%)
(SITC Classifications)
To Japan
(US$ mn)
Imports
776 Transistors, semiconductors devices, valves, etc. 12,645 88,584 14.3 759 Parts & accsries for offc machn & autm data proc 3,909 23,855 16.4 784 Parts & accsries for trctors, mtr cars & O mtr vehc 3,431 5,938 57.8 778 Eltrcal machnery & apprtus, NES 2,905 9,260 31.4 728 Machnry/Eqpmnt Speclzd For Particlr Indstrs & Prts 2,823 8,129 34.7 772 Eltrcal switcher relays, circuits, NES. 2,509 11,341 22.1 713 Intrnal Combustn Piston Engines & Prts Throf, NES 1,813 3,329 54.5 673 Irn/Nonalloy Steel Flat-Rolled Prod, Not clad/Coated 1,770 3,881 45.6 764 Telecomncations eqpmnt, NES & parts 1,740 17,394 10.0 781 Mtr cars & O mtr vehicles for prsn transportation 1,695 4,024 42.1 874 Measuring/Anlys/Cntrolling Instrmnts & Apprtus 1,520 6,662 22.8 699 Manufactures Of Base Metal, N.E.S. 1,233 3,879 31.8 674 Iron/Nonalloy Steel Flat-Rolled Prod, Clad/Coated 1,069 1,918 55.7 679 Iron & Steel Tubes, Pipes & Hollow Profiles 952 2,362 40.3 782 Mtr vehicles for goods 940 1,618 58.1 723 Civil Enginring & Contractors’ Plant & Equipment 930 3,551 26.2 731 Mchn Tools Working By Removing Metal/O Mterial 890 1,719 51.8 881 Photographic Apprtus & Equipment, N.E.S. 876 1,658 52.8 763 Sound & TV image recorders & reproducers 778 1,829 42.6 598 Miscell Chemical Products, N.E.S. 767 3,320 23.1
20 Major 45,198 204,251 22.1 Others 26,994 251,756 10.7 Total 72,192 456,007 15.8
SITC Commodities
(6) (7) (8) (9) (10)
Total ASEAN 6 Imports
(US$ mn)
Share(%)
To Japan
(US$ mn)
Source: ASEAN Trade Statistics Database;Notes: ASEAN 6 covers Brunei Darussalam, Indonesia, Malaysia, Philippines, Singapore, and Thailand.
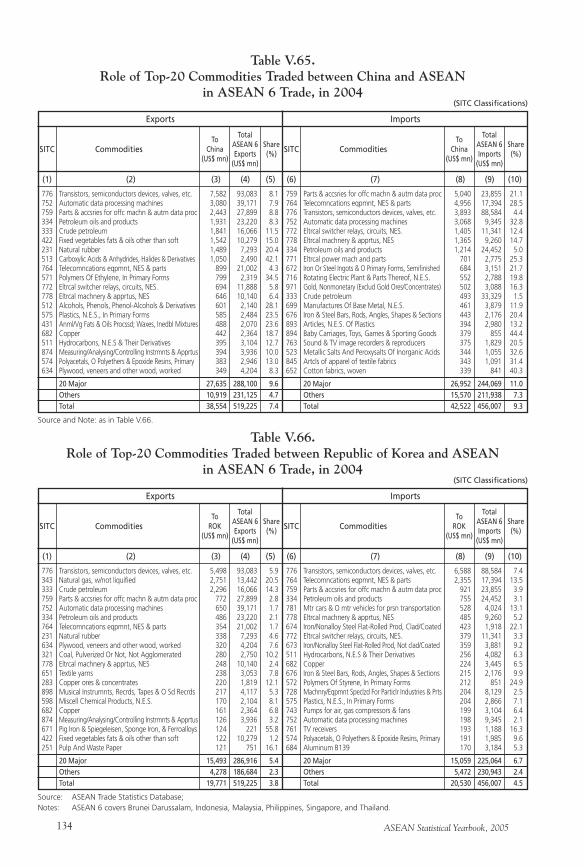
ASEAN Statistical Yearbook, 2005134
776 Transistors, semiconductors devices, valves, etc. 7,582 93,083 8.1 752 Automatic data processing machines 3,080 39,171 7.9 759 Parts & accsries for offc machn & autm data proc 2,443 27,899 8.8 334 Petroleum oils and products 1,931 23,220 8.3 333 Crude petroleum 1,841 16,066 11.5 422 Fixed vegetables fats & oils other than soft 1,542 10,279 15.0 231 Natural rubber 1,489 7,293 20.4 513 Carboxylic Acids & Anhydrides, Halides & Derivatives 1,050 2,490 42.1 764 Telecomncations eqpmnt, NES & parts 899 21,002 4.3 571 Polymers Of Ethylene, In Primary Forms 799 2,319 34.5 772 Eltrcal switcher relays, circuits, NES. 694 11,888 5.8 778 Eltrcal machnery & apprtus, NES 646 10,140 6.4 512 Alcohols, Phenols, Phenol-Alcohols & Derivatives 601 2,140 28.1 575 Plastics, N.E.S., In Primary Forms 585 2,484 23.5 431 Anml/Vg Fats & Oils Procssd; Waxes, Inedbl Mixtures 488 2,070 23.6 682 Copper 442 2,364 18.7 511 Hydrocarbons, N.E.S & Their Derivatives 395 3,104 12.7 874 Measuring/Analysing/Controlling Instrmnts & Apprtus 394 3,936 10.0 574 Polyacetals, O Polyethers & Epoxide Resins, Primary 383 2,946 13.0 634 Plywood, veneers and other wood, worked 349 4,204 8.3
20 Major 27,635 288,100 9.6 Others 10,919 231,125 4.7 Total 38,554 519,225 7.4
Table V.65.Role of Top-20 Commodities Traded between China and ASEAN
in ASEAN 6 Trade, in 2004
Exports
SITC Commodities
Source and Note: as in Table V.66.
(1) (2) (3) (4) (5)
Total ASEAN 6 Exports
(US$ mn)
Share(%)
(SITC Classifications)
To China
(US$ mn)
Imports
759 Parts & accsries for offc machn & autm data proc 5,040 23,855 21.1 764 Telecomncations eqpmnt, NES & parts 4,956 17,394 28.5 776 Transistors, semiconductors devices, valves, etc. 3,893 88,584 4.4 752 Automatic data processing machines 3,068 9,345 32.8 772 Eltrcal switcher relays, circuits, NES. 1,405 11,341 12.4 778 Eltrcal machnery & apprtus, NES 1,365 9,260 14.7 334 Petroleum oils and products 1,214 24,452 5.0 771 Eltrcal power mach and parts 701 2,775 25.3 672 Iron Or Steel Ingots & O Primary Forms, Semifinished 684 3,151 21.7 716 Rotating Electric Plant & Parts Thereof, N.E.S. 552 2,788 19.8 971 Gold, Nonmonetary (Exclud Gold Ores/Concentrates) 502 3,088 16.3 333 Crude petroleum 493 33,329 1.5 699 Manufactures Of Base Metal, N.E.S. 461 3,879 11.9 676 Iron & Steel Bars, Rods, Angles, Shapes & Sections 443 2,176 20.4 893 Articles, N.E.S. Of Plastics 394 2,980 13.2 894 Baby Carriages, Toys, Games & Sporting Goods 379 855 44.4 763 Sound & TV image recorders & reproducers 375 1,829 20.5 523 Metallic Salts And Peroxysalts Of Inorganic Acids 344 1,055 32.6 845 Artcls of apparel of textile fabrics 343 1,091 31.4 652 Cotton fabrics, woven 339 841 40.3
20 Major 26,952 244,069 11.0 Others 15,570 211,938 7.3 Total 42,522 456,007 9.3
SITC Commodities
(6) (7) (8) (9) (10)
Total ASEAN 6 Imports
(US$ mn)
Share(%)
To China
(US$ mn)
776 Transistors, semiconductors devices, valves, etc. 5,498 93,083 5.9 343 Natural gas, w/not liquified 2,751 13,442 20.5 333 Crude petroleum 2,296 16,066 14.3 759 Parts & accsries for offc machn & autm data proc 772 27,899 2.8 752 Automatic data processing machines 650 39,171 1.7 334 Petroleum oils and products 486 23,220 2.1 764 Telecomncations eqpmnt, NES & parts 354 21,002 1.7 231 Natural rubber 338 7,293 4.6 634 Plywood, veneers and other wood, worked 320 4,204 7.6 321 Coal, Pulverized Or Not, Not Agglomerated 280 2,750 10.2 778 Eltrcal machnery & apprtus, NES 248 10,140 2.4 651 Textile yarns 238 3,053 7.8 283 Copper ores & concentrates 220 1,819 12.1 898 Musical Instrumnts, Recrds, Tapes & O Sd Recrds 217 4,117 5.3 598 Miscell Chemical Products, N.E.S. 170 2,104 8.1 682 Copper 161 2,364 6.8 874 Measuring/Analysing/Controlling Instrmnts & Apprtus 126 3,936 3.2 671 Pig Iron & Spiegeleisen, Sponge Iron, & Ferroalloys 124 221 55.8 422 Fixed vegetables fats & oils other than soft 122 10,279 1.2 251 Pulp And Waste Paper 121 751 16.1
20 Major 15,493 286,916 5.4 Others 4,278 186,684 2.3 Total 19,771 519,225 3.8
Table V.66.Role of Top-20 Commodities Traded between Republic of Korea and ASEAN
in ASEAN 6 Trade, in 2004
Exports
SITC Commodities
(1) (2) (3) (4) (5)
Total ASEAN 6 Exports
(US$ mn)
Share(%)
(SITC Classifications)
To ROK
(US$ mn)
Imports
776 Transistors, semiconductors devices, valves, etc. 6,588 88,584 7.4 764 Telecomncations eqpmnt, NES & parts 2,355 17,394 13.5 759 Parts & accsries for offc machn & autm data proc 921 23,855 3.9 334 Petroleum oils and products 755 24,452 3.1 781 Mtr cars & O mtr vehicles for prsn transportation 528 4,024 13.1 778 Eltrcal machnery & apprtus, NES 485 9,260 5.2 674 Iron/Nonalloy Steel Flat-Rolled Prod, Clad/Coated 423 1,918 22.1 772 Eltrcal switcher relays, circuits, NES. 379 11,341 3.3 673 Iron/Nonalloy Steel Flat-Rolled Prod, Not clad/Coated 359 3,881 9.2 511 Hydrocarbons, N.E.S & Their Derivatives 256 4,082 6.3 682 Copper 224 3,445 6.5 676 Iron & Steel Bars, Rods, Angles, Shapes & Sections 215 2,176 9.9 572 Polymers Of Styrene, In Primary Forms 212 851 24.9 728 Machnry/Eqpmnt Speclzd For Particlr Industries & Prts 204 8,129 2.5 575 Plastics, N.E.S., In Primary Forms 204 2,866 7.1 743 Pumps for air, gas compressors & fans 199 3,104 6.4 752 Automatic data processing machines 198 9,345 2.1 761 TV receivers 193 1,188 16.3 574 Polyacetals, O Polyethers & Epoxide Resins, Primary 191 1,985 9.6 684 Aluminum B139 170 3,184 5.3
20 Major 15,059 225,064 6.7 Others 5,472 230,943 2.4 Total 20,530 456,007 4.5
SITC Commodities
(6) (7) (8) (9) (10)
Total ASEAN 6 Imports
(US$ mn)
Share(%)
To ROK
(US$ mn)
Source: ASEAN Trade Statistics Database;Notes: ASEAN 6 covers Brunei Darussalam, Indonesia, Malaysia, Philippines, Singapore, and Thailand.
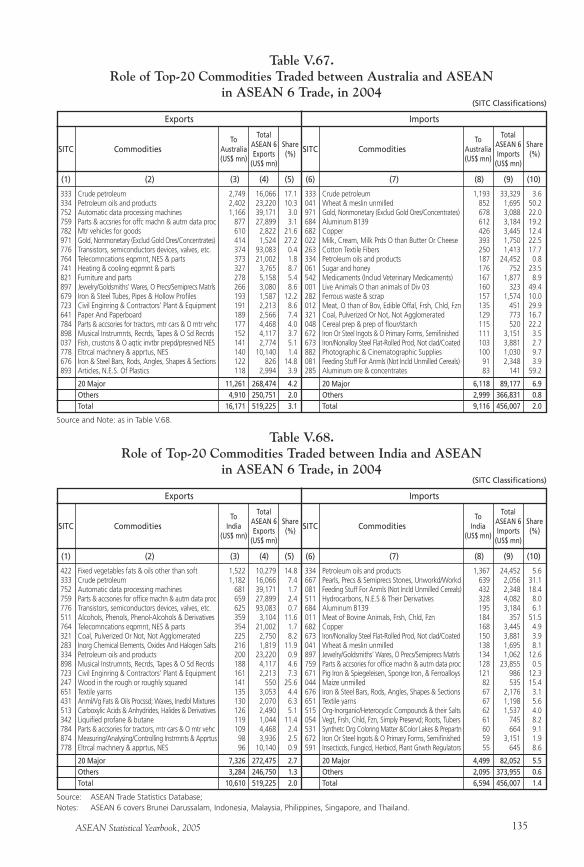
ASEAN Statistical Yearbook, 2005 135
333 Crude petroleum 2,749 16,066 17.1 334 Petroleum oils and products 2,402 23,220 10.3 752 Automatic data processing machines 1,166 39,171 3.0 759 Parts & accsries for offc machn & autm data proc 877 27,899 3.1 782 Mtr vehicles for goods 610 2,822 21.6 971 Gold, Nonmonetary (Exclud Gold Ores/Concentrates) 414 1,524 27.2 776 Transistors, semiconductors devices, valves, etc. 374 93,083 0.4 764 Telecomncations eqpmnt, NES & parts 373 21,002 1.8 741 Heating & cooling eqpmnt & parts 327 3,765 8.7 821 Furniture and parts 278 5,158 5.4 897 Jewelry/Goldsmiths’ Wares, O Precs/Semiprecs Matrls 266 3,080 8.6 679 Iron & Steel Tubes, Pipes & Hollow Profiles 193 1,587 12.2 723 Civil Enginring & Contractors’ Plant & Equipment 191 2,213 8.6 641 Paper And Paperboard 189 2,566 7.4 784 Parts & accsories for tractors, mtr cars & O mtr vehc 177 4,468 4.0 898 Musical Instrumnts, Recrds, Tapes & O Sd Recrds 152 4,117 3.7 037 Fish, crustcns & O aqtic invtbr prepd/presrved NES 141 2,774 5.1 778 Eltrcal machnery & apprtus, NES 140 10,140 1.4 676 Iron & Steel Bars, Rods, Angles, Shapes & Sections 122 826 14.8 893 Articles, N.E.S. Of Plastics 118 2,994 3.9
20 Major 11,261 268,474 4.2 Others 4,910 250,751 2.0 Total 16,171 519,225 3.1
Table V.67.Role of Top-20 Commodities Traded between Australia and ASEAN
in ASEAN 6 Trade, in 2004
Exports
SITC Commodities
Source and Note: as in Table V.68.
(1) (2) (3) (4) (5)
Total ASEAN 6 Exports
(US$ mn)
Share(%)
(SITC Classifications)
To Australia(US$ mn)
Imports
333 Crude petroleum 1,193 33,329 3.6 041 Wheat & meslin unmilled 852 1,695 50.2 971 Gold, Nonmonetary (Exclud Gold Ores/Concentrates) 678 3,088 22.0 684 Aluminum B139 612 3,184 19.2 682 Copper 426 3,445 12.4 022 Milk, Cream, Milk Prds O than Butter Or Cheese 393 1,750 22.5 263 Cotton Textile Fibers 250 1,413 17.7 334 Petroleum oils and products 187 24,452 0.8 061 Sugar and honey 176 752 23.5 542 Medicaments (Includ Veterinary Medicaments) 167 1,877 8.9 001 Live Animals O than animals of Div 03 160 323 49.4 282 Ferrous waste & scrap 157 1,574 10.0 012 Meat, O than of Bov, Edible Offal, Frsh, Chld, Fzn 135 451 29.9 321 Coal, Pulverized Or Not, Not Agglomerated 129 773 16.7 048 Cereal prep & prep of flour/starch 115 520 22.2 672 Iron Or Steel Ingots & O Primary Forms, Semifinished 111 3,151 3.5 673 Iron/Nonalloy Steel Flat-Rolled Prod, Not clad/Coated 103 3,881 2.7 882 Photographic & Cinematographic Supplies 100 1,030 9.7 081 Feeding Stuff For Anmls (Not Incld Unmilled Cereals) 91 2,348 3.9 285 Aluminum ore & concentrates 83 141 59.2
20 Major 6,118 89,177 6.9 Others 2,999 366,831 0.8 Total 9,116 456,007 2.0
SITC Commodities
(6) (7) (8) (9) (10)
Total ASEAN 6 Imports
(US$ mn)
Share(%)
To Australia(US$ mn)
422 Fixed vegetables fats & oils other than soft 1,522 10,279 14.8 333 Crude petroleum 1,182 16,066 7.4 752 Automatic data processing machines 681 39,171 1.7 759 Parts & accsories for office machn & autm data proc 659 27,899 2.4 776 Transistors, semiconductors devices, valves, etc. 625 93,083 0.7 511 Alcohols, Phenols, Phenol-Alcohols & Derivatives 359 3,104 11.6 764 Telecomncations eqpmnt, NES & parts 354 21,002 1.7 321 Coal, Pulverized Or Not, Not Agglomerated 225 2,750 8.2 283 Inorg Chemical Elements, Oxides And Halogen Salts 216 1,819 11.9 334 Petroleum oils and products 200 23,220 0.9 898 Musical Instrumnts, Recrds, Tapes & O Sd Recrds 188 4,117 4.6 723 Civil Enginring & Contractors’ Plant & Equipment 161 2,213 7.3 247 Wood in the rough or roughly squared 141 550 25.6 651 Textile yarns 135 3,053 4.4 431 Anml/Vg Fats & Oils Procssd; Waxes, Inedbl Mixtures 130 2,070 6.3 513 Carboxylic Acids & Anhydrides, Halides & Derivatives 126 2,490 5.1 342 Liquified profane & butane 119 1,044 11.4 784 Parts & accsories for tractors, mtr cars & O mtr vehc 109 4,468 2.4 874 Measuring/Analysing/Controlling Instrmnts & Apprtus 98 3,936 2.5 778 Eltrcal machnery & apprtus, NES 96 10,140 0.9
20 Major 7,326 272,475 2.7 Others 3,284 246,750 1.3 Total 10,610 519,225 2.0
Table V.68.Role of Top-20 Commodities Traded between India and ASEAN
in ASEAN 6 Trade, in 2004
Exports
SITC Commodities
(1) (2) (3) (4) (5)
Total ASEAN 6 Exports
(US$ mn)
Share(%)
(SITC Classifications)
To India
(US$ mn)
Imports
334 Petroleum oils and products 1,367 24,452 5.6 667 Pearls, Precs & Semiprecs Stones, Unworkd/Workd 639 2,056 31.1 081 Feeding Stuff For Anmls (Not Incld Unmilled Cereals) 432 2,348 18.4 511 Hydrocarbons, N.E.S & Their Derivatives 328 4,082 8.0 684 Aluminum B139 195 3,184 6.1 011 Meat of Bovine Animals, Frsh, Chld, Fzn 184 357 51.5 682 Copper 168 3,445 4.9 673 Iron/Nonalloy Steel Flat-Rolled Prod, Not clad/Coated 150 3,881 3.9 041 Wheat & meslin unmilled 138 1,695 8.1 897 Jewelry/Goldsmiths’ Wares, O Precs/Semiprecs Matrls 134 1,062 12.6 759 Parts & accsories for office machn & autm data proc 128 23,855 0.5 671 Pig Iron & Spiegeleisen, Sponge Iron, & Ferroalloys 121 986 12.3 044 Maize unmilled 82 535 15.4 676 Iron & Steel Bars, Rods, Angles, Shapes & Sections 67 2,176 3.1 651 Textile yarns 67 1,198 5.6 515 Org-Inorganic/Heterocyclic Compounds & their Salts 62 1,537 4.0 054 Vegt, Frsh, Chld, Fzn, Simply Preservd; Roots, Tubers 61 745 8.2 531 Synthetc Org Coloring Matter &Color Lakes & Prepartn 60 664 9.1 672 Iron Or Steel Ingots & O Primary Forms, Semifinished 59 3,151 1.9 591 Insecticds, Fungicd, Herbicd, Plant Grwth Regulators 55 645 8.6
20 Major 4,499 82,052 5.5 Others 2,095 373,955 0.6 Total 6,594 456,007 1.4
SITC Commodities
(6) (7) (8) (9) (10)
Total ASEAN 6 Imports
(US$ mn)
Share(%)
To India
(US$ mn)
Source: ASEAN Trade Statistics Database;Notes: ASEAN 6 covers Brunei Darussalam, Indonesia, Malaysia, Philippines, Singapore, and Thailand.

ASEAN Statistical Yearbook, 2005136
ASEAN Statistical Yearbook, 2005 137
Chapter VIForeign Direct Investment
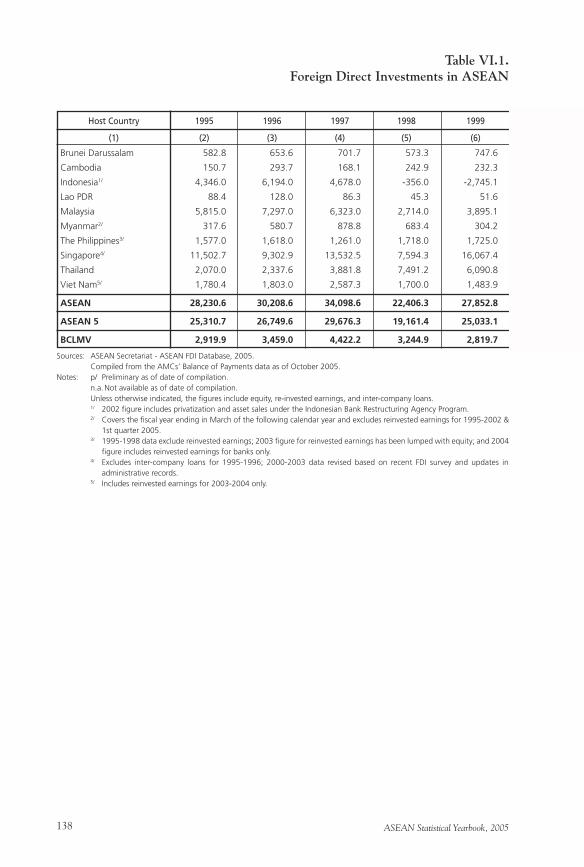
ASEAN Statistical Yearbook, 2005138
Sources: ASEAN Secretariat - ASEAN FDI Database, 2005. Compiled from the AMCs’ Balance of Payments data as of October 2005.Notes: p/ Preliminary as of date of compilation. n.a. Not available as of date of compilation. Unless otherwise indicated, the figures include equity, re-invested earnings, and inter-company loans. 1/ 2002 figure includes privatization and asset sales under the Indonesian Bank Restructuring Agency Program. 2/ Covers the fiscal year ending in March of the following calendar year and excludes reinvested earnings for 1995-2002 &
1st quarter 2005. 3/ 1995-1998 data exclude reinvested earnings; 2003 figure for reinvested earnings has been lumped with equity; and 2004
figure includes reinvested earnings for banks only. 4/ Excludes inter-company loans for 1995-1996; 2000-2003 data revised based on recent FDI survey and updates in
administrative records. 5/ Includes reinvested earnings for 2003-2004 only.
Brunei Darussalam 582.8 653.6 701.7 573.3 747.6
Cambodia 150.7 293.7 168.1 242.9 232.3
Indonesia1/ 4,346.0 6,194.0 4,678.0 -356.0 -2,745.1
Lao PDR 88.4 128.0 86.3 45.3 51.6
Malaysia 5,815.0 7,297.0 6,323.0 2,714.0 3,895.1
Myanmar2/ 317.6 580.7 878.8 683.4 304.2
The Philippines3/ 1,577.0 1,618.0 1,261.0 1,718.0 1,725.0
Singapore4/ 11,502.7 9,302.9 13,532.5 7,594.3 16,067.4
Thailand 2,070.0 2,337.6 3,881.8 7,491.2 6,090.8
Viet Nam5/ 1,780.4 1,803.0 2,587.3 1,700.0 1,483.9
ASEAN 28,230.6 30,208.6 34,098.6 22,406.3 27,852.8
ASEAN 5 25,310.7 26,749.6 29,676.3 19,161.4 25,033.1
BCLMV 2,919.9 3,459.0 4,422.2 3,244.9 2,819.7
Host Country 1995 1996 1997 1998 1999
(1) (2) (3) (4) (5) (6)
Table VI.1.Foreign Direct Investments in ASEAN
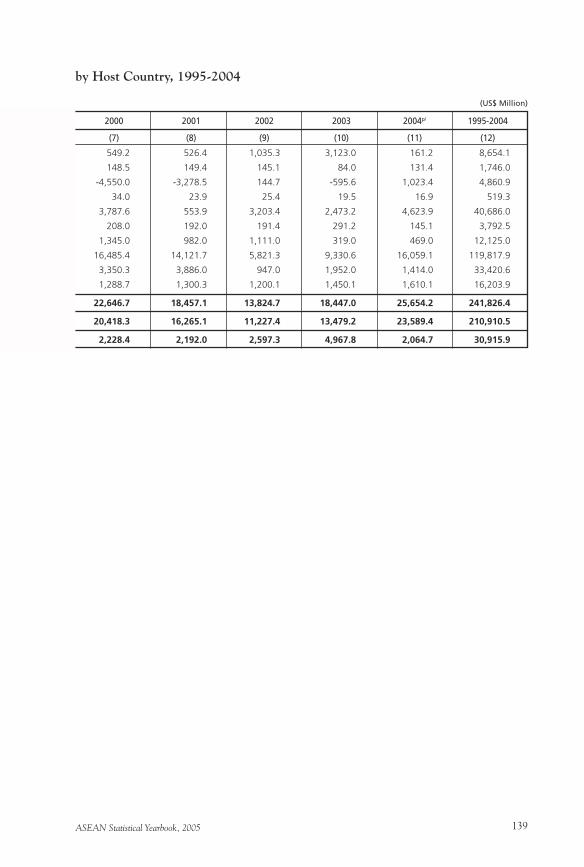
ASEAN Statistical Yearbook, 2005 139
by Host Country, 1995-2004
(US$ Million)
549.2 526.4 1,035.3 3,123.0 161.2 8,654.1
148.5 149.4 145.1 84.0 131.4 1,746.0
-4,550.0 -3,278.5 144.7 -595.6 1,023.4 4,860.9
34.0 23.9 25.4 19.5 16.9 519.3
3,787.6 553.9 3,203.4 2,473.2 4,623.9 40,686.0
208.0 192.0 191.4 291.2 145.1 3,792.5
1,345.0 982.0 1,111.0 319.0 469.0 12,125.0
16,485.4 14,121.7 5,821.3 9,330.6 16,059.1 119,817.9
3,350.3 3,886.0 947.0 1,952.0 1,414.0 33,420.6
1,288.7 1,300.3 1,200.1 1,450.1 1,610.1 16,203.9
22,646.7 18,457.1 13,824.7 18,447.0 25,654.2 241,826.4
20,418.3 16,265.1 11,227.4 13,479.2 23,589.4 210,910.5
2,228.4 2,192.0 2,597.3 4,967.8 2,064.7 30,915.9
2000 2001 2002 2003 2004p/ 1995-2004
(7) (8) (9) (10) (11) (12)
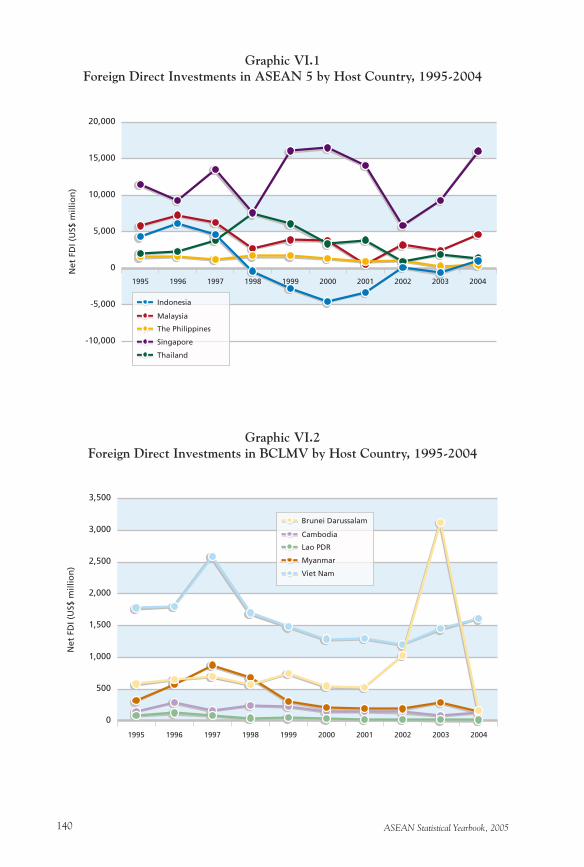
ASEAN Statistical Yearbook, 2005140
Graphic VI.1Foreign Direct Investments in ASEAN 5 by Host Country, 1995-2004
Graphic VI.2Foreign Direct Investments in BCLMV by Host Country, 1995-2004
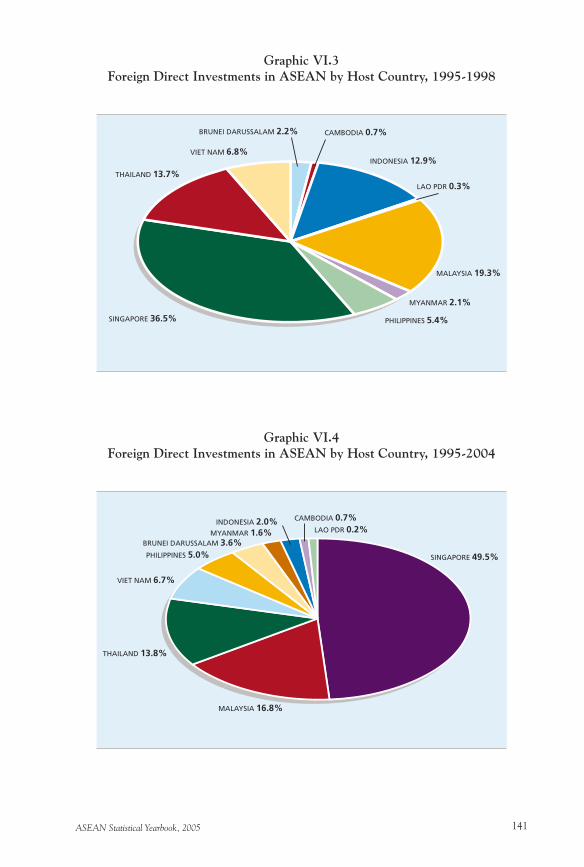
ASEAN Statistical Yearbook, 2005 141
Graphic VI.3Foreign Direct Investments in ASEAN by Host Country, 1995-1998
Graphic VI.4Foreign Direct Investments in ASEAN by Host Country, 1995-2004
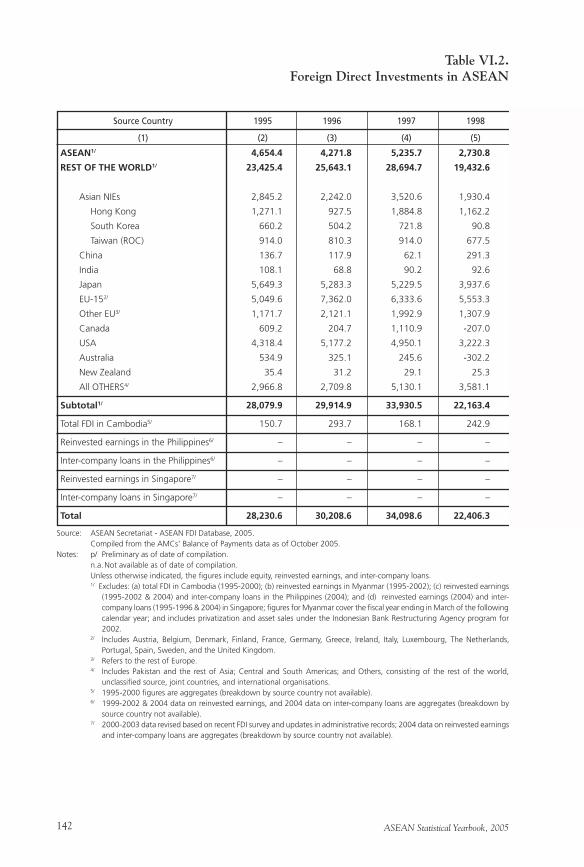
ASEAN Statistical Yearbook, 2005142
Table VI.2.Foreign Direct Investments in ASEAN
Source: ASEAN Secretariat - ASEAN FDI Database, 2005. Compiled from the AMCs’ Balance of Payments data as of October 2005.Notes: p/ Preliminary as of date of compilation. n.a. Not available as of date of compilation. Unless otherwise indicated, the figures include equity, reinvested earnings, and inter-company loans. 1/ Excludes: (a) total FDI in Cambodia (1995-2000); (b) reinvested earnings in Myanmar (1995-2002); (c) reinvested earnings
(1995-2002 & 2004) and inter-company loans in the Philippines (2004); and (d) reinvested earnings (2004) and inter-company loans (1995-1996 & 2004) in Singapore; figures for Myanmar cover the fiscal year ending in March of the following calendar year; and includes privatization and asset sales under the Indonesian Bank Restructuring Agency program for 2002.
2/ Includes Austria, Belgium, Denmark, Finland, France, Germany, Greece, Ireland, Italy, Luxembourg, The Netherlands, Portugal, Spain, Sweden, and the United Kingdom.
3/ Refers to the rest of Europe. 4/ Includes Pakistan and the rest of Asia; Central and South Americas; and Others, consisting of the rest of the world,
unclassified source, joint countries, and international organisations. 5/ 1995-2000 figures are aggregates (breakdown by source country not available). 6/ 1999-2002 & 2004 data on reinvested earnings, and 2004 data on inter-company loans are aggregates (breakdown by
source country not available). 7/ 2000-2003 data revised based on recent FDI survey and updates in administrative records; 2004 data on reinvested earnings
and inter-company loans are aggregates (breakdown by source country not available).
ASEAN1/ 4,654.4 4,271.8 5,235.7 2,730.8
REST OF THE WORLD1/ 23,425.4 25,643.1 28,694.7 19,432.6
Asian NIEs 2,845.2 2,242.0 3,520.6 1,930.4
Hong Kong 1,271.1 927.5 1,884.8 1,162.2
South Korea 660.2 504.2 721.8 90.8
Taiwan (ROC) 914.0 810.3 914.0 677.5
China 136.7 117.9 62.1 291.3
India 108.1 68.8 90.2 92.6
Japan 5,649.3 5,283.3 5,229.5 3,937.6
EU-152/ 5,049.6 7,362.0 6,333.6 5,553.3
Other EU3/ 1,171.7 2,121.1 1,992.9 1,307.9
Canada 609.2 204.7 1,110.9 -207.0
USA 4,318.4 5,177.2 4,950.1 3,222.3
Australia 534.9 325.1 245.6 -302.2
New Zealand 35.4 31.2 29.1 25.3
All OTHERS4/ 2,966.8 2,709.8 5,130.1 3,581.1
Subtotal1/ 28,079.9 29,914.9 33,930.5 22,163.4
Total FDI in Cambodia5/ 150.7 293.7 168.1 242.9
Reinvested earnings in the Philippines6/ – – – –
Inter-company loans in the Philippines6/ – – – –
Reinvested earnings in Singapore7/ – – – –
Inter-company loans in Singapore7/ – – – –
Total 28,230.6 30,208.6 34,098.6 22,406.3
Source Country 1995 1996 1997 1998
(1) (2) (3) (4) (5)

ASEAN Statistical Yearbook, 2005 143
by Source Country, 1995-2004
(US$ Million)
1999 2000 2001 2002 2003 2004p/ 1995-2004
(6) (7) (8) (9) (10) (11) (12)
1,789.3 763.1 2,495.4 3,634.4 2,301.8 2,432.7 30,309.4
25,461.2 21,909.1 16,088.7 10,070.3 16,145.2 19,371.1 206,241.5
1,629.0 1,459.8 1,828.0 567.6 1,558.9 2,427.9 20,009.6
697.6 1,128.9 -431.9 204.5 100.1 344.9 7,289.6
528.9 -45.0 -264.8 92.4 632.0 896.5 3,816.9
402.5 375.9 2,524.7 270.7 826.9 1,186.6 8,903.0
62.5 -133.4 147.3 -80.9 188.7 225.9 1,018.0
41.7 79.5 32.3 96.0 81.2 46.3 736.8
1,688.2 455.0 1,606.3 3,366.2 2,317.7 2,538.2 32,071.3
9,806.0 13,479.6 6,006.5 4,235.9 5,230.4 5,420.5 68,477.5
2,242.0 360.6 47.1 851.5 1,444.4 937.2 12,476.3
-14.2 -397.6 -555.4 -191.7 -10.7 92.1 640.4
5,931.7 7,311.6 4,569.4 357.6 1,395.3 5,051.9 42,285.4
-935.0 -302.8 -95.1 202.6 181.1 392.5 246.8
80.2 43.1 14.7 53.7 88.5 -1.9 399.4
4,929.2 -446.1 2,487.5 611.7 3,669.6 2,240.5 27,880.1
27,250.5 22,672.2 18,584.1 13,704.7 18,447.0 21,803.9 236,550.9
232.3 148.5 – – – – 1,236.2
370.0 -174.0 –127.0 120.0 – 2.0 191.0
– – – – – –278.0 –278.0
– – – – – 3,833.8 3,833.8
– – – – – 292.5 292.5
27,852.8 22,646.7 18,457.1 13,824.7 18,447.0 25,654.2 241,826.4
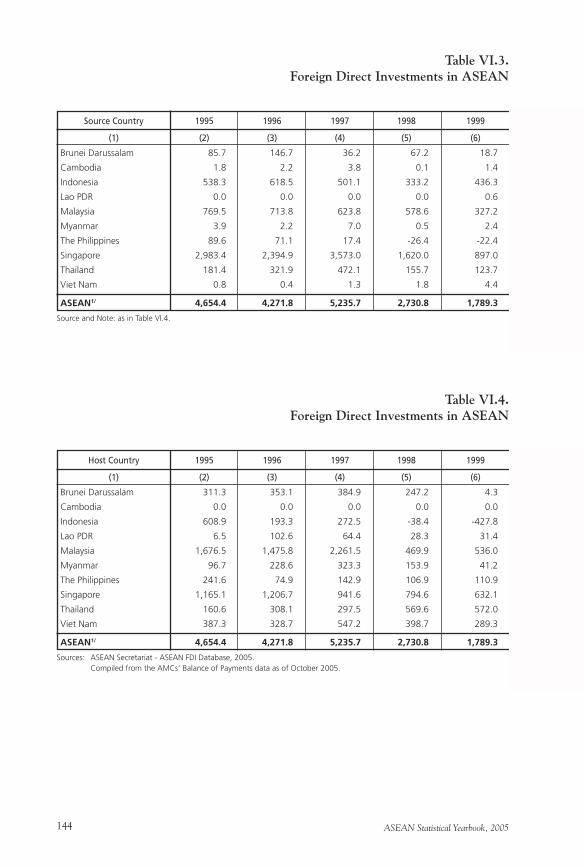
ASEAN Statistical Yearbook, 2005144
Table VI.3.Foreign Direct Investments in ASEAN
Brunei Darussalam 85.7 146.7 36.2 67.2 18.7
Cambodia 1.8 2.2 3.8 0.1 1.4
Indonesia 538.3 618.5 501.1 333.2 436.3
Lao PDR 0.0 0.0 0.0 0.0 0.6
Malaysia 769.5 713.8 623.8 578.6 327.2
Myanmar 3.9 2.2 7.0 0.5 2.4
The Philippines 89.6 71.1 17.4 -26.4 -22.4
Singapore 2,983.4 2,394.9 3,573.0 1,620.0 897.0
Thailand 181.4 321.9 472.1 155.7 123.7
Viet Nam 0.8 0.4 1.3 1.8 4.4
ASEAN1/ 4,654.4 4,271.8 5,235.7 2,730.8 1,789.3
Source Country 1995 1996 1997 1998 1999
(1) (2) (3) (4) (5) (6)
Table VI.4.Foreign Direct Investments in ASEAN
Sources: ASEAN Secretariat - ASEAN FDI Database, 2005. Compiled from the AMCs’ Balance of Payments data as of October 2005.
Brunei Darussalam 311.3 353.1 384.9 247.2 4.3
Cambodia 0.0 0.0 0.0 0.0 0.0
Indonesia 608.9 193.3 272.5 -38.4 -427.8
Lao PDR 6.5 102.6 64.4 28.3 31.4
Malaysia 1,676.5 1,475.8 2,261.5 469.9 536.0
Myanmar 96.7 228.6 323.3 153.9 41.2
The Philippines 241.6 74.9 142.9 106.9 110.9
Singapore 1,165.1 1,206.7 941.6 794.6 632.1
Thailand 160.6 308.1 297.5 569.6 572.0
Viet Nam 387.3 328.7 547.2 398.7 289.3
ASEAN1/ 4,654.4 4,271.8 5,235.7 2,730.8 1,789.3
Host Country 1995 1996 1997 1998 1999
(1) (2) (3) (4) (5) (6)
Source and Note: as in Table VI.4.
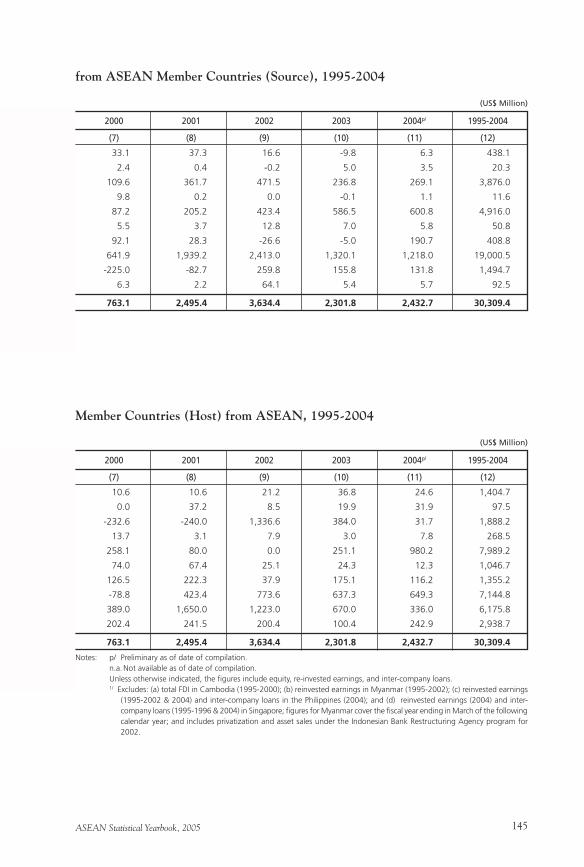
ASEAN Statistical Yearbook, 2005 145
from ASEAN Member Countries (Source), 1995-2004
(US$ Million)
33.1 37.3 16.6 -9.8 6.3 438.1
2.4 0.4 -0.2 5.0 3.5 20.3
109.6 361.7 471.5 236.8 269.1 3,876.0
9.8 0.2 0.0 -0.1 1.1 11.6
87.2 205.2 423.4 586.5 600.8 4,916.0
5.5 3.7 12.8 7.0 5.8 50.8
92.1 28.3 -26.6 -5.0 190.7 408.8
641.9 1,939.2 2,413.0 1,320.1 1,218.0 19,000.5
-225.0 -82.7 259.8 155.8 131.8 1,494.7
6.3 2.2 64.1 5.4 5.7 92.5
763.1 2,495.4 3,634.4 2,301.8 2,432.7 30,309.4
2000 2001 2002 2003 2004p/ 1995-2004
(7) (8) (9) (10) (11) (12)
Member Countries (Host) from ASEAN, 1995-2004
(US$ Million)
10.6 10.6 21.2 36.8 24.6 1,404.7
0.0 37.2 8.5 19.9 31.9 97.5
-232.6 -240.0 1,336.6 384.0 31.7 1,888.2
13.7 3.1 7.9 3.0 7.8 268.5
258.1 80.0 0.0 251.1 980.2 7,989.2
74.0 67.4 25.1 24.3 12.3 1,046.7
126.5 222.3 37.9 175.1 116.2 1,355.2
-78.8 423.4 773.6 637.3 649.3 7,144.8
389.0 1,650.0 1,223.0 670.0 336.0 6,175.8
202.4 241.5 200.4 100.4 242.9 2,938.7
763.1 2,495.4 3,634.4 2,301.8 2,432.7 30,309.4
2000 2001 2002 2003 2004p/ 1995-2004
(7) (8) (9) (10) (11) (12)
Notes: p/ Preliminary as of date of compilation. n.a. Not available as of date of compilation. Unless otherwise indicated, the figures include equity, re-invested earnings, and inter-company loans. 1/ Excludes: (a) total FDI in Cambodia (1995-2000); (b) reinvested earnings in Myanmar (1995-2002); (c) reinvested earnings
(1995-2002 & 2004) and inter-company loans in the Philippines (2004); and (d) reinvested earnings (2004) and inter-company loans (1995-1996 & 2004) in Singapore; figures for Myanmar cover the fiscal year ending in March of the following calendar year; and includes privatization and asset sales under the Indonesian Bank Restructuring Agency program for 2002.
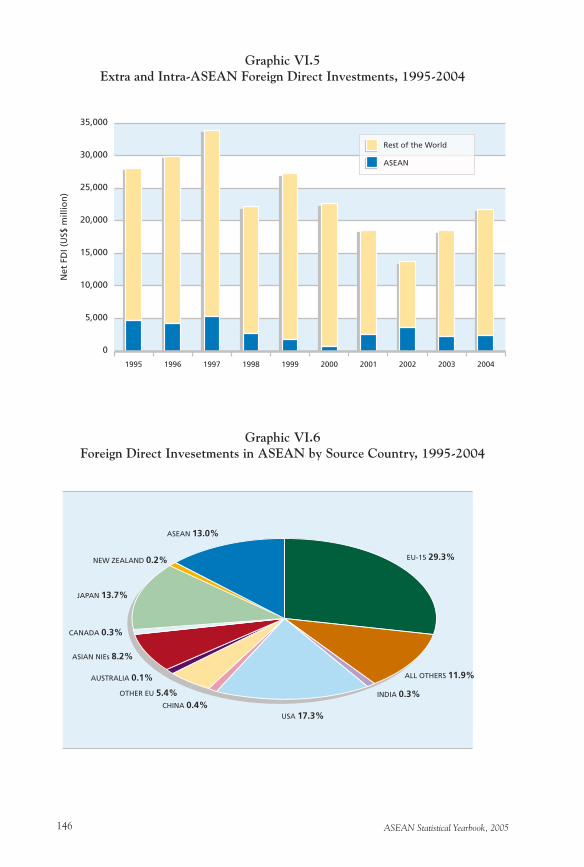
ASEAN Statistical Yearbook, 2005146
Graphic VI.5Extra and Intra-ASEAN Foreign Direct Investments, 1995-2004
Graphic VI.6Foreign Direct Invesetments in ASEAN by Source Country, 1995-2004
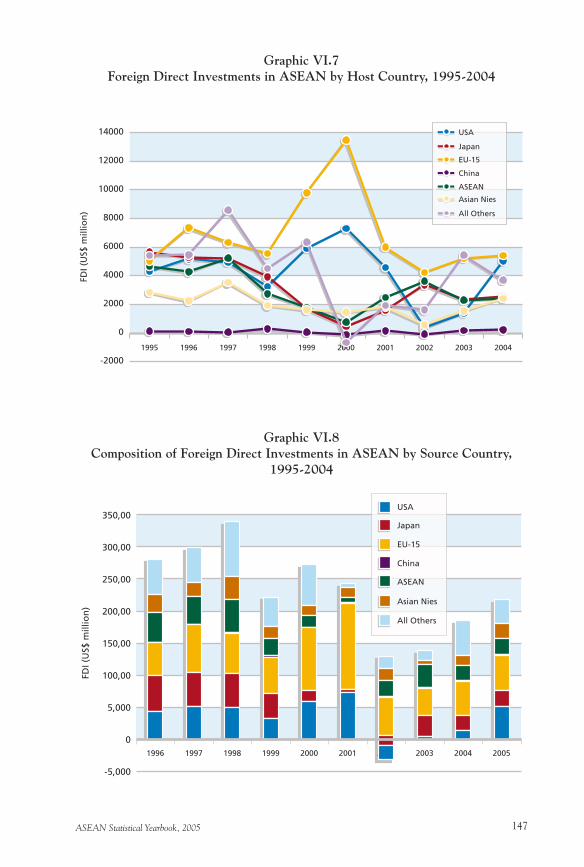
ASEAN Statistical Yearbook, 2005 147
Graphic VI.7Foreign Direct Investments in ASEAN by Host Country, 1995-2004
Graphic VI.8Composition of Foreign Direct Investments in ASEAN by Source Country,
1995-2004
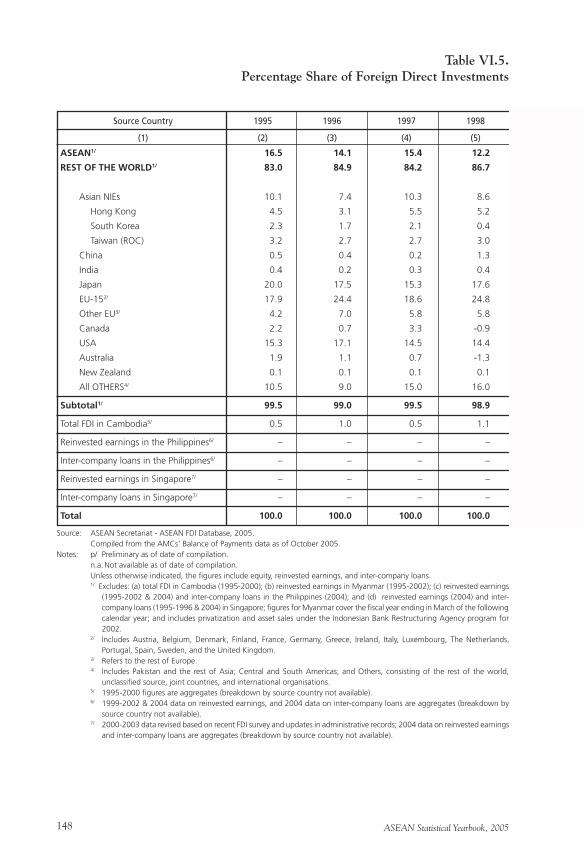
ASEAN Statistical Yearbook, 2005148
Table VI.5.Percentage Share of Foreign Direct Investments
Source: ASEAN Secretariat - ASEAN FDI Database, 2005. Compiled from the AMCs’ Balance of Payments data as of October 2005.Notes: p/ Preliminary as of date of compilation. n.a. Not available as of date of compilation. Unless otherwise indicated, the figures include equity, reinvested earnings, and inter-company loans. 1/ Excludes: (a) total FDI in Cambodia (1995-2000); (b) reinvested earnings in Myanmar (1995-2002); (c) reinvested earnings
(1995-2002 & 2004) and inter-company loans in the Philippines (2004); and (d) reinvested earnings (2004) and inter-company loans (1995-1996 & 2004) in Singapore; figures for Myanmar cover the fiscal year ending in March of the following calendar year; and includes privatization and asset sales under the Indonesian Bank Restructuring Agency program for 2002.
2/ Includes Austria, Belgium, Denmark, Finland, France, Germany, Greece, Ireland, Italy, Luxembourg, The Netherlands, Portugal, Spain, Sweden, and the United Kingdom.
3/ Refers to the rest of Europe. 4/ Includes Pakistan and the rest of Asia; Central and South Americas; and Others, consisting of the rest of the world,
unclassified source, joint countries, and international organisations. 5/ 1995-2000 figures are aggregates (breakdown by source country not available). 6/ 1999-2002 & 2004 data on reinvested earnings, and 2004 data on inter-company loans are aggregates (breakdown by
source country not available). 7/ 2000-2003 data revised based on recent FDI survey and updates in administrative records; 2004 data on reinvested earnings
and inter-company loans are aggregates (breakdown by source country not available).
ASEAN1/ 16.5 14.1 15.4 12.2
REST OF THE WORLD1/ 83.0 84.9 84.2 86.7
Asian NIEs 10.1 7.4 10.3 8.6
Hong Kong 4.5 3.1 5.5 5.2
South Korea 2.3 1.7 2.1 0.4
Taiwan (ROC) 3.2 2.7 2.7 3.0
China 0.5 0.4 0.2 1.3
India 0.4 0.2 0.3 0.4
Japan 20.0 17.5 15.3 17.6
EU-152/ 17.9 24.4 18.6 24.8
Other EU3/ 4.2 7.0 5.8 5.8
Canada 2.2 0.7 3.3 -0.9
USA 15.3 17.1 14.5 14.4
Australia 1.9 1.1 0.7 -1.3
New Zealand 0.1 0.1 0.1 0.1
All OTHERS4/ 10.5 9.0 15.0 16.0
Subtotal1/ 99.5 99.0 99.5 98.9
Total FDI in Cambodia5/ 0.5 1.0 0.5 1.1
Reinvested earnings in the Philippines6/ – – – –
Inter-company loans in the Philippines6/ – – – –
Reinvested earnings in Singapore7/ – – – –
Inter-company loans in Singapore7/ – – – –
Total 100.0 100.0 100.0 100.0
Source Country 1995 1996 1997 1998
(1) (2) (3) (4) (5)
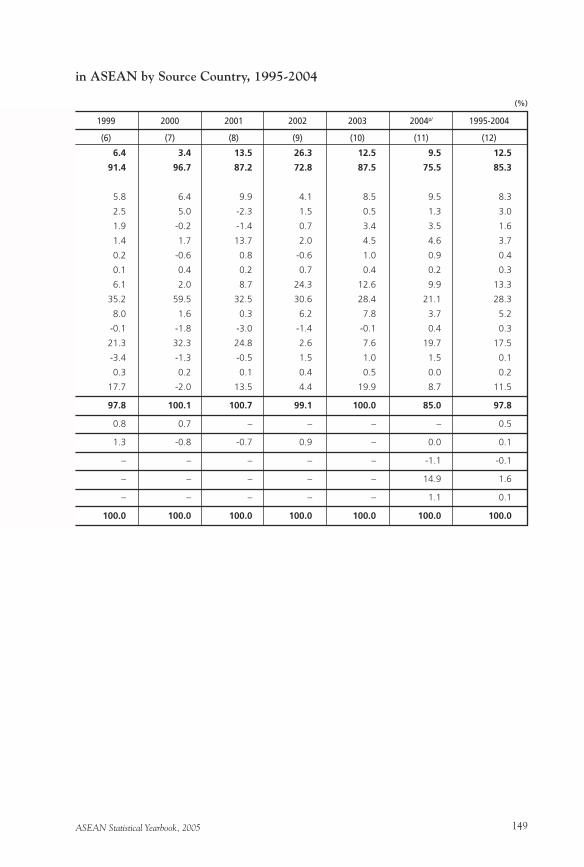
ASEAN Statistical Yearbook, 2005 149
in ASEAN by Source Country, 1995-2004
(%)
1999 2000 2001 2002 2003 2004p/ 1995-2004
(6) (7) (8) (9) (10) (11) (12)
6.4 3.4 13.5 26.3 12.5 9.5 12.5
91.4 96.7 87.2 72.8 87.5 75.5 85.3
5.8 6.4 9.9 4.1 8.5 9.5 8.3
2.5 5.0 -2.3 1.5 0.5 1.3 3.0
1.9 -0.2 -1.4 0.7 3.4 3.5 1.6
1.4 1.7 13.7 2.0 4.5 4.6 3.7
0.2 -0.6 0.8 -0.6 1.0 0.9 0.4
0.1 0.4 0.2 0.7 0.4 0.2 0.3
6.1 2.0 8.7 24.3 12.6 9.9 13.3
35.2 59.5 32.5 30.6 28.4 21.1 28.3
8.0 1.6 0.3 6.2 7.8 3.7 5.2
-0.1 -1.8 -3.0 -1.4 -0.1 0.4 0.3
21.3 32.3 24.8 2.6 7.6 19.7 17.5
-3.4 -1.3 -0.5 1.5 1.0 1.5 0.1
0.3 0.2 0.1 0.4 0.5 0.0 0.2
17.7 -2.0 13.5 4.4 19.9 8.7 11.5
97.8 100.1 100.7 99.1 100.0 85.0 97.8
0.8 0.7 – – – – 0.5
1.3 -0.8 -0.7 0.9 – 0.0 0.1
– – – – – -1.1 -0.1
– – – – – 14.9 1.6
– – – – – 1.1 0.1
100.0 100.0 100.0 100.0 100.0 100.0 100.0
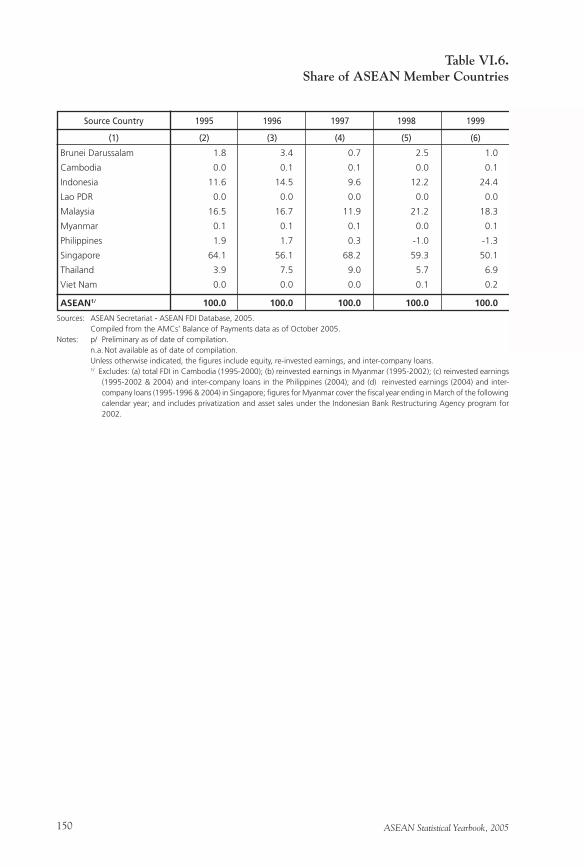
ASEAN Statistical Yearbook, 2005150
Table VI.6.Share of ASEAN Member Countries
Sources: ASEAN Secretariat - ASEAN FDI Database, 2005. Compiled from the AMCs’ Balance of Payments data as of October 2005.Notes: p/ Preliminary as of date of compilation. n.a. Not available as of date of compilation. Unless otherwise indicated, the figures include equity, re-invested earnings, and inter-company loans. 1/ Excludes: (a) total FDI in Cambodia (1995-2000); (b) reinvested earnings in Myanmar (1995-2002); (c) reinvested earnings
(1995-2002 & 2004) and inter-company loans in the Philippines (2004); and (d) reinvested earnings (2004) and inter-company loans (1995-1996 & 2004) in Singapore; figures for Myanmar cover the fiscal year ending in March of the following calendar year; and includes privatization and asset sales under the Indonesian Bank Restructuring Agency program for 2002.
Brunei Darussalam 1.8 3.4 0.7 2.5 1.0
Cambodia 0.0 0.1 0.1 0.0 0.1
Indonesia 11.6 14.5 9.6 12.2 24.4
Lao PDR 0.0 0.0 0.0 0.0 0.0
Malaysia 16.5 16.7 11.9 21.2 18.3
Myanmar 0.1 0.1 0.1 0.0 0.1
Philippines 1.9 1.7 0.3 -1.0 -1.3
Singapore 64.1 56.1 68.2 59.3 50.1
Thailand 3.9 7.5 9.0 5.7 6.9
Viet Nam 0.0 0.0 0.0 0.1 0.2
ASEAN1/ 100.0 100.0 100.0 100.0 100.0
Source Country 1995 1996 1997 1998 1999
(1) (2) (3) (4) (5) (6)
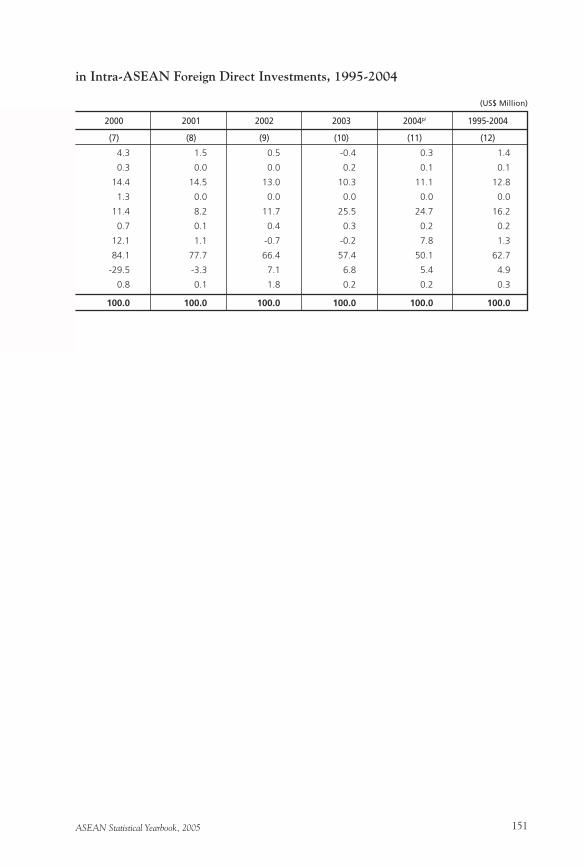
ASEAN Statistical Yearbook, 2005 151
in Intra-ASEAN Foreign Direct Investments, 1995-2004
(US$ Million)
4.3 1.5 0.5 -0.4 0.3 1.4
0.3 0.0 0.0 0.2 0.1 0.1
14.4 14.5 13.0 10.3 11.1 12.8
1.3 0.0 0.0 0.0 0.0 0.0
11.4 8.2 11.7 25.5 24.7 16.2
0.7 0.1 0.4 0.3 0.2 0.2
12.1 1.1 -0.7 -0.2 7.8 1.3
84.1 77.7 66.4 57.4 50.1 62.7
-29.5 -3.3 7.1 6.8 5.4 4.9
0.8 0.1 1.8 0.2 0.2 0.3
100.0 100.0 100.0 100.0 100.0 100.0
2000 2001 2002 2003 2004p/ 1995-2004
(7) (8) (9) (10) (11) (12)
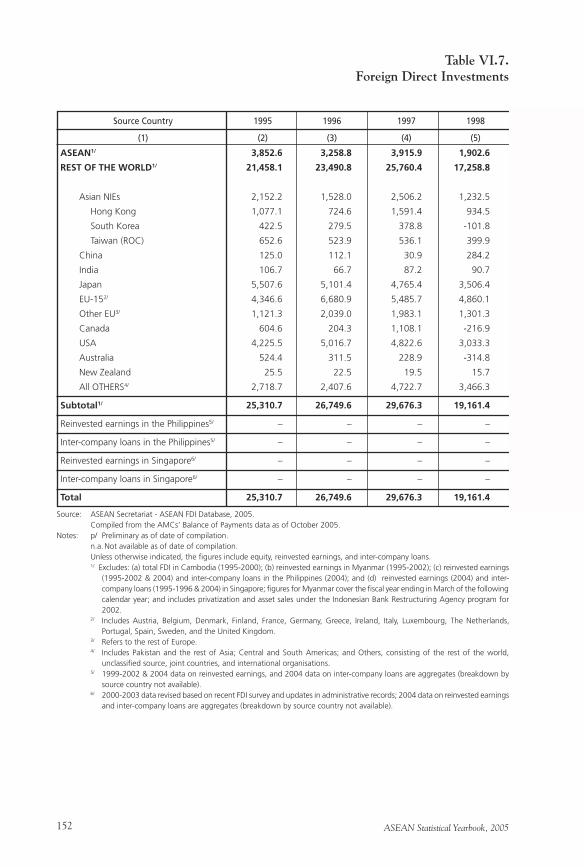
ASEAN Statistical Yearbook, 2005152
Table VI.7.Foreign Direct Investments
Source: ASEAN Secretariat - ASEAN FDI Database, 2005. Compiled from the AMCs’ Balance of Payments data as of October 2005.Notes: p/ Preliminary as of date of compilation. n.a. Not available as of date of compilation. Unless otherwise indicated, the figures include equity, reinvested earnings, and inter-company loans. 1/ Excludes: (a) total FDI in Cambodia (1995-2000); (b) reinvested earnings in Myanmar (1995-2002); (c) reinvested earnings
(1995-2002 & 2004) and inter-company loans in the Philippines (2004); and (d) reinvested earnings (2004) and inter-company loans (1995-1996 & 2004) in Singapore; figures for Myanmar cover the fiscal year ending in March of the following calendar year; and includes privatization and asset sales under the Indonesian Bank Restructuring Agency program for 2002.
2/ Includes Austria, Belgium, Denmark, Finland, France, Germany, Greece, Ireland, Italy, Luxembourg, The Netherlands, Portugal, Spain, Sweden, and the United Kingdom.
3/ Refers to the rest of Europe. 4/ Includes Pakistan and the rest of Asia; Central and South Americas; and Others, consisting of the rest of the world,
unclassified source, joint countries, and international organisations. 5/ 1999-2002 & 2004 data on reinvested earnings, and 2004 data on inter-company loans are aggregates (breakdown by
source country not available). 6/ 2000-2003 data revised based on recent FDI survey and updates in administrative records; 2004 data on reinvested earnings
and inter-company loans are aggregates (breakdown by source country not available).
ASEAN1/ 3,852.6 3,258.8 3,915.9 1,902.6
REST OF THE WORLD1/ 21,458.1 23,490.8 25,760.4 17,258.8
Asian NIEs 2,152.2 1,528.0 2,506.2 1,232.5
Hong Kong 1,077.1 724.6 1,591.4 934.5
South Korea 422.5 279.5 378.8 -101.8
Taiwan (ROC) 652.6 523.9 536.1 399.9
China 125.0 112.1 30.9 284.2
India 106.7 66.7 87.2 90.7
Japan 5,507.6 5,101.4 4,765.4 3,506.4
EU-152/ 4,346.6 6,680.9 5,485.7 4,860.1
Other EU3/ 1,121.3 2,039.0 1,983.1 1,301.3
Canada 604.6 204.3 1,108.1 -216.9
USA 4,225.5 5,016.7 4,822.6 3,033.3
Australia 524.4 311.5 228.9 -314.8
New Zealand 25.5 22.5 19.5 15.7
All OTHERS4/ 2,718.7 2,407.6 4,722.7 3,466.3
Subtotal1/ 25,310.7 26,749.6 29,676.3 19,161.4
Reinvested earnings in the Philippines5/ – – – –
Inter-company loans in the Philippines5/ – – – –
Reinvested earnings in Singapore6/ – – – –
Inter-company loans in Singapore6/ – – – –
Total 25,310.7 26,749.6 29,676.3 19,161.4
Source Country 1995 1996 1997 1998
(1) (2) (3) (4) (5)
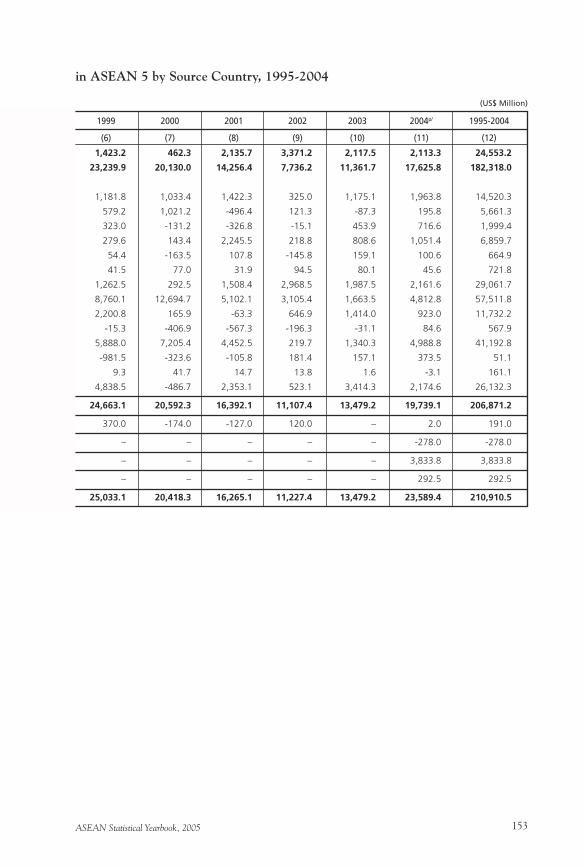
ASEAN Statistical Yearbook, 2005 153
in ASEAN 5 by Source Country, 1995-2004
(US$ Million)
1999 2000 2001 2002 2003 2004p/ 1995-2004
(6) (7) (8) (9) (10) (11) (12)
1,423.2 462.3 2,135.7 3,371.2 2,117.5 2,113.3 24,553.2
23,239.9 20,130.0 14,256.4 7,736.2 11,361.7 17,625.8 182,318.0
1,181.8 1,033.4 1,422.3 325.0 1,175.1 1,963.8 14,520.3
579.2 1,021.2 -496.4 121.3 -87.3 195.8 5,661.3
323.0 -131.2 -326.8 -15.1 453.9 716.6 1,999.4
279.6 143.4 2,245.5 218.8 808.6 1,051.4 6,859.7
54.4 -163.5 107.8 -145.8 159.1 100.6 664.9
41.5 77.0 31.9 94.5 80.1 45.6 721.8
1,262.5 292.5 1,508.4 2,968.5 1,987.5 2,161.6 29,061.7
8,760.1 12,694.7 5,102.1 3,105.4 1,663.5 4,812.8 57,511.8
2,200.8 165.9 -63.3 646.9 1,414.0 923.0 11,732.2
-15.3 -406.9 -567.3 -196.3 -31.1 84.6 567.9
5,888.0 7,205.4 4,452.5 219.7 1,340.3 4,988.8 41,192.8
-981.5 -323.6 -105.8 181.4 157.1 373.5 51.1
9.3 41.7 14.7 13.8 1.6 -3.1 161.1
4,838.5 -486.7 2,353.1 523.1 3,414.3 2,174.6 26,132.3
24,663.1 20,592.3 16,392.1 11,107.4 13,479.2 19,739.1 206,871.2
370.0 -174.0 -127.0 120.0 – 2.0 191.0
– – – – – -278.0 -278.0
– – – – – 3,833.8 3,833.8
– – – – – 292.5 292.5
25,033.1 20,418.3 16,265.1 11,227.4 13,479.2 23,589.4 210,910.5
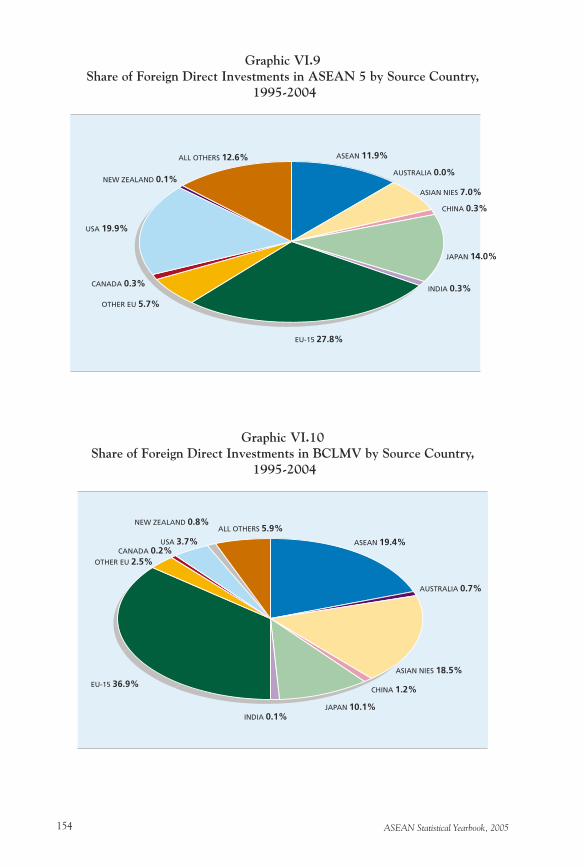
ASEAN Statistical Yearbook, 2005154
Graphic VI.9Share of Foreign Direct Investments in ASEAN 5 by Source Country,
1995-2004
Graphic VI.10Share of Foreign Direct Investments in BCLMV by Source Country,
1995-2004
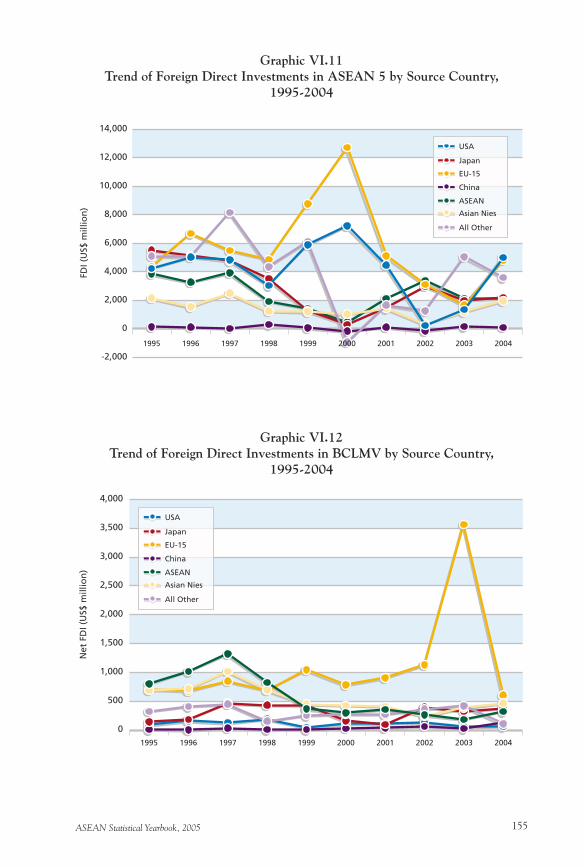
ASEAN Statistical Yearbook, 2005 155
Graphic VI.11Trend of Foreign Direct Investments in ASEAN 5 by Source Country,
1995-2004
Graphic VI.12Trend of Foreign Direct Investments in BCLMV by Source Country,
1995-2004
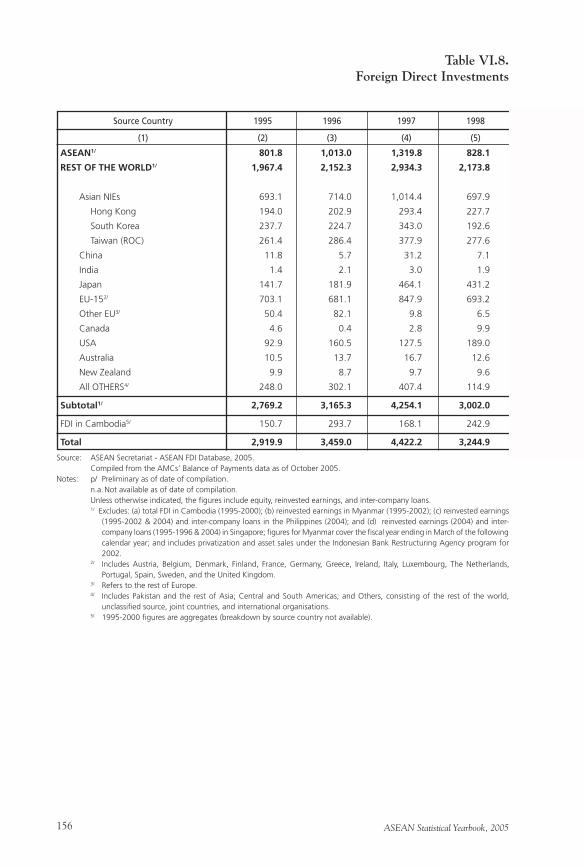
ASEAN Statistical Yearbook, 2005156
Table VI.8.Foreign Direct Investments
Source: ASEAN Secretariat - ASEAN FDI Database, 2005. Compiled from the AMCs’ Balance of Payments data as of October 2005.Notes: p/ Preliminary as of date of compilation. n.a. Not available as of date of compilation. Unless otherwise indicated, the figures include equity, reinvested earnings, and inter-company loans. 1/ Excludes: (a) total FDI in Cambodia (1995-2000); (b) reinvested earnings in Myanmar (1995-2002); (c) reinvested earnings
(1995-2002 & 2004) and inter-company loans in the Philippines (2004); and (d) reinvested earnings (2004) and inter-company loans (1995-1996 & 2004) in Singapore; figures for Myanmar cover the fiscal year ending in March of the following calendar year; and includes privatization and asset sales under the Indonesian Bank Restructuring Agency program for 2002.
2/ Includes Austria, Belgium, Denmark, Finland, France, Germany, Greece, Ireland, Italy, Luxembourg, The Netherlands, Portugal, Spain, Sweden, and the United Kingdom.
3/ Refers to the rest of Europe. 4/ Includes Pakistan and the rest of Asia; Central and South Americas; and Others, consisting of the rest of the world,
unclassified source, joint countries, and international organisations. 5/ 1995-2000 figures are aggregates (breakdown by source country not available).
ASEAN1/ 801.8 1,013.0 1,319.8 828.1
REST OF THE WORLD1/ 1,967.4 2,152.3 2,934.3 2,173.8
Asian NIEs 693.1 714.0 1,014.4 697.9
Hong Kong 194.0 202.9 293.4 227.7
South Korea 237.7 224.7 343.0 192.6
Taiwan (ROC) 261.4 286.4 377.9 277.6
China 11.8 5.7 31.2 7.1
India 1.4 2.1 3.0 1.9
Japan 141.7 181.9 464.1 431.2
EU-152/ 703.1 681.1 847.9 693.2
Other EU3/ 50.4 82.1 9.8 6.5
Canada 4.6 0.4 2.8 9.9
USA 92.9 160.5 127.5 189.0
Australia 10.5 13.7 16.7 12.6
New Zealand 9.9 8.7 9.7 9.6
All OTHERS4/ 248.0 302.1 407.4 114.9
Subtotal1/ 2,769.2 3,165.3 4,254.1 3,002.0
FDI in Cambodia5/ 150.7 293.7 168.1 242.9
Total 2,919.9 3,459.0 4,422.2 3,244.9
Source Country 1995 1996 1997 1998
(1) (2) (3) (4) (5)
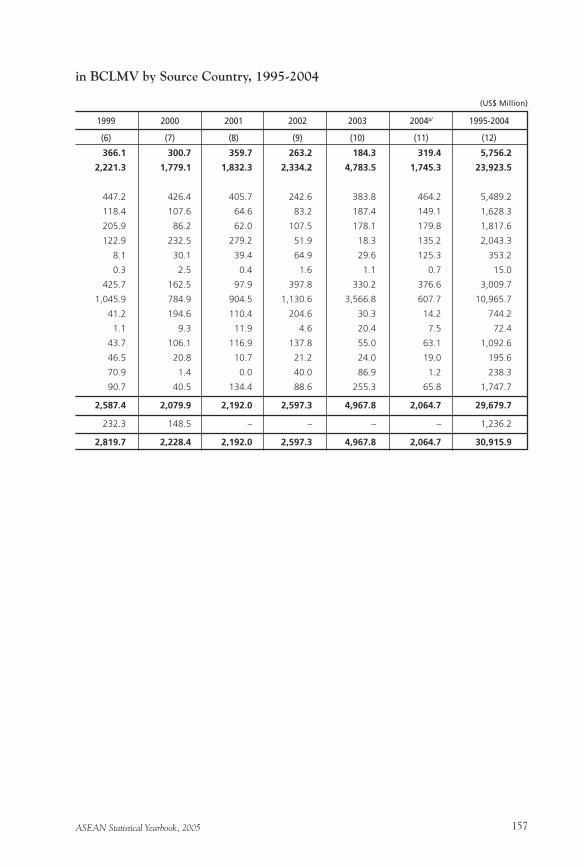
ASEAN Statistical Yearbook, 2005 157
in BCLMV by Source Country, 1995-2004
(US$ Million)
1999 2000 2001 2002 2003 2004p/ 1995-2004
(6) (7) (8) (9) (10) (11) (12)
366.1 300.7 359.7 263.2 184.3 319.4 5,756.2
2,221.3 1,779.1 1,832.3 2,334.2 4,783.5 1,745.3 23,923.5
447.2 426.4 405.7 242.6 383.8 464.2 5,489.2
118.4 107.6 64.6 83.2 187.4 149.1 1,628.3
205.9 86.2 62.0 107.5 178.1 179.8 1,817.6
122.9 232.5 279.2 51.9 18.3 135.2 2,043.3
8.1 30.1 39.4 64.9 29.6 125.3 353.2
0.3 2.5 0.4 1.6 1.1 0.7 15.0
425.7 162.5 97.9 397.8 330.2 376.6 3,009.7
1,045.9 784.9 904.5 1,130.6 3,566.8 607.7 10,965.7
41.2 194.6 110.4 204.6 30.3 14.2 744.2
1.1 9.3 11.9 4.6 20.4 7.5 72.4
43.7 106.1 116.9 137.8 55.0 63.1 1,092.6
46.5 20.8 10.7 21.2 24.0 19.0 195.6
70.9 1.4 0.0 40.0 86.9 1.2 238.3
90.7 40.5 134.4 88.6 255.3 65.8 1,747.7
2,587.4 2,079.9 2,192.0 2,597.3 4,967.8 2,064.7 29,679.7
232.3 148.5 – – – – 1,236.2
2,819.7 2,228.4 2,192.0 2,597.3 4,967.8 2,064.7 30,915.9
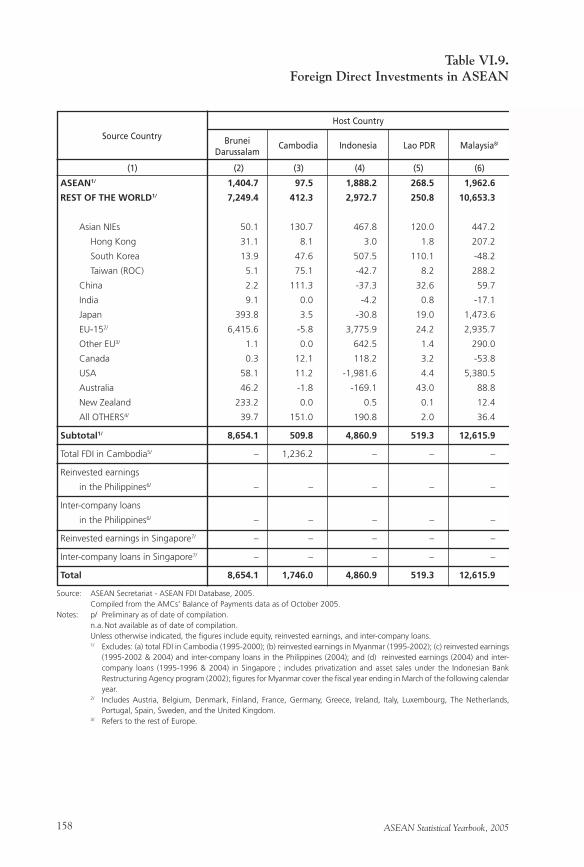
ASEAN Statistical Yearbook, 2005158
Table VI.9.Foreign Direct Investments in ASEAN
Source: ASEAN Secretariat - ASEAN FDI Database, 2005. Compiled from the AMCs’ Balance of Payments data as of October 2005.Notes: p/ Preliminary as of date of compilation. n.a. Not available as of date of compilation. Unless otherwise indicated, the figures include equity, reinvested earnings, and inter-company loans. 1/ Excludes: (a) total FDI in Cambodia (1995-2000); (b) reinvested earnings in Myanmar (1995-2002); (c) reinvested earnings
(1995-2002 & 2004) and inter-company loans in the Philippines (2004); and (d) reinvested earnings (2004) and inter-company loans (1995-1996 & 2004) in Singapore ; includes privatization and asset sales under the Indonesian Bank Restructuring Agency program (2002); figures for Myanmar cover the fiscal year ending in March of the following calendar year.
2/ Includes Austria, Belgium, Denmark, Finland, France, Germany, Greece, Ireland, Italy, Luxembourg, The Netherlands, Portugal, Spain, Sweden, and the United Kingdom.
3/ Refers to the rest of Europe.
Cambodia Indonesia Lao PDR Malaysia8/
(1) (2) (3) (4) (5) (6)
ASEAN1/ 1,404.7 97.5 1,888.2 268.5 1,962.6
REST OF THE WORLD1/ 7,249.4 412.3 2,972.7 250.8 10,653.3
Asian NIEs 50.1 130.7 467.8 120.0 447.2
Hong Kong 31.1 8.1 3.0 1.8 207.2
South Korea 13.9 47.6 507.5 110.1 -48.2
Taiwan (ROC) 5.1 75.1 -42.7 8.2 288.2
China 2.2 111.3 -37.3 32.6 59.7
India 9.1 0.0 -4.2 0.8 -17.1
Japan 393.8 3.5 -30.8 19.0 1,473.6
EU-152/ 6,415.6 -5.8 3,775.9 24.2 2,935.7
Other EU3/ 1.1 0.0 642.5 1.4 290.0
Canada 0.3 12.1 118.2 3.2 -53.8
USA 58.1 11.2 -1,981.6 4.4 5,380.5
Australia 46.2 -1.8 -169.1 43.0 88.8
New Zealand 233.2 0.0 0.5 0.1 12.4
All OTHERS4/ 39.7 151.0 190.8 2.0 36.4
Subtotal1/ 8,654.1 509.8 4,860.9 519.3 12,615.9
Total FDI in Cambodia5/ – 1,236.2 – – –
Reinvested earnings
in the Philippines6/ – – – – –
Inter-company loans
in the Philippines6/ – – – – –
Reinvested earnings in Singapore7/ – – – – –
Inter-company loans in Singapore7/ – – – – –
Total 8,654.1 1,746.0 4,860.9 519.3 12,615.9
Host Country
Source Country BruneiDarussalam
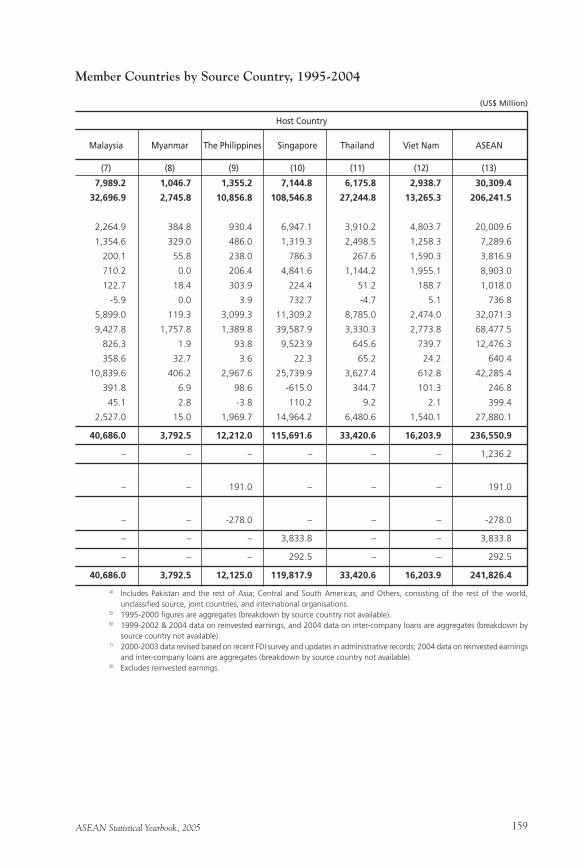
ASEAN Statistical Yearbook, 2005 159
Member Countries by Source Country, 1995-2004
(US$ Million)
Malaysia Myanmar The Philippines Singapore Thailand Viet Nam ASEAN
(7) (8) (9) (10) (11) (12) (13)
7,989.2 1,046.7 1,355.2 7,144.8 6,175.8 2,938.7 30,309.4
32,696.9 2,745.8 10,856.8 108,546.8 27,244.8 13,265.3 206,241.5
2,264.9 384.8 930.4 6,947.1 3,910.2 4,803.7 20,009.6
1,354.6 329.0 486.0 1,319.3 2,498.5 1,258.3 7,289.6
200.1 55.8 238.0 786.3 267.6 1,590.3 3,816.9
710.2 0.0 206.4 4,841.6 1,144.2 1,955.1 8,903.0
122.7 18.4 303.9 224.4 51.2 188.7 1,018.0
-5.9 0.0 3.9 732.7 -4.7 5.1 736.8
5,899.0 119.3 3,099.3 11,309.2 8,785.0 2,474.0 32,071.3
9,427.8 1,757.8 1,389.8 39,587.9 3,330.3 2,773.8 68,477.5
826.3 1.9 93.8 9,523.9 645.6 739.7 12,476.3
358.6 32.7 3.6 22.3 65.2 24.2 640.4
10,839.6 406.2 2,967.6 25,739.9 3,627.4 612.8 42,285.4
391.8 6.9 98.6 -615.0 344.7 101.3 246.8
45.1 2.8 -3.8 110.2 9.2 2.1 399.4
2,527.0 15.0 1,969.7 14,964.2 6,480.6 1,540.1 27,880.1
40,686.0 3,792.5 12,212.0 115,691.6 33,420.6 16,203.9 236,550.9
– – – – – – 1,236.2
– – 191.0 – – – 191.0
– – -278.0 – – – -278.0
– – – 3,833.8 – – 3,833.8
– – – 292.5 – – 292.5
40,686.0 3,792.5 12,125.0 119,817.9 33,420.6 16,203.9 241,826.4
Host Country
4/ Includes Pakistan and the rest of Asia; Central and South Americas; and Others, consisting of the rest of the world, unclassified source, joint countries, and international organisations.
5/ 1995-2000 figures are aggregates (breakdown by source country not available). 6/ 1999-2002 & 2004 data on reinvested earnings, and 2004 data on inter-company loans are aggregates (breakdown by
source country not available). 7/ 2000-2003 data revised based on recent FDI survey and updates in administrative records; 2004 data on reinvested earnings
and inter-company loans are aggregates (breakdown by source country not available). 8/ Excludes reinvested earnings.
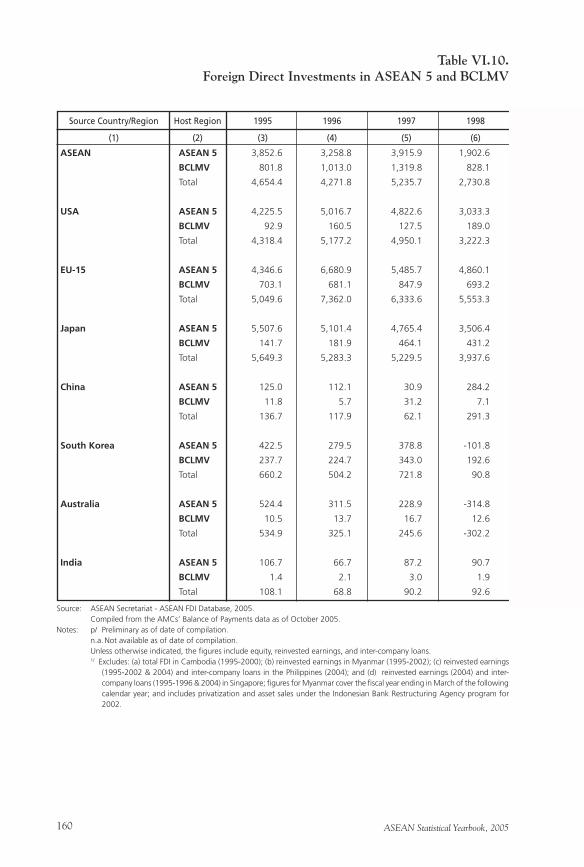
ASEAN Statistical Yearbook, 2005160
Table VI.10.Foreign Direct Investments in ASEAN 5 and BCLMV
Source: ASEAN Secretariat - ASEAN FDI Database, 2005. Compiled from the AMCs’ Balance of Payments data as of October 2005.Notes: p/ Preliminary as of date of compilation. n.a. Not available as of date of compilation. Unless otherwise indicated, the figures include equity, reinvested earnings, and inter-company loans. 1/ Excludes: (a) total FDI in Cambodia (1995-2000); (b) reinvested earnings in Myanmar (1995-2002); (c) reinvested earnings
(1995-2002 & 2004) and inter-company loans in the Philippines (2004); and (d) reinvested earnings (2004) and inter-company loans (1995-1996 & 2004) in Singapore; figures for Myanmar cover the fiscal year ending in March of the following calendar year; and includes privatization and asset sales under the Indonesian Bank Restructuring Agency program for 2002.
ASEAN ASEAN 5 3,852.6 3,258.8 3,915.9 1,902.6
BCLMV 801.8 1,013.0 1,319.8 828.1
Total 4,654.4 4,271.8 5,235.7 2,730.8
USA ASEAN 5 4,225.5 5,016.7 4,822.6 3,033.3
BCLMV 92.9 160.5 127.5 189.0
Total 4,318.4 5,177.2 4,950.1 3,222.3
EU-15 ASEAN 5 4,346.6 6,680.9 5,485.7 4,860.1
BCLMV 703.1 681.1 847.9 693.2
Total 5,049.6 7,362.0 6,333.6 5,553.3
Japan ASEAN 5 5,507.6 5,101.4 4,765.4 3,506.4
BCLMV 141.7 181.9 464.1 431.2
Total 5,649.3 5,283.3 5,229.5 3,937.6
China ASEAN 5 125.0 112.1 30.9 284.2
BCLMV 11.8 5.7 31.2 7.1
Total 136.7 117.9 62.1 291.3
South Korea ASEAN 5 422.5 279.5 378.8 -101.8
BCLMV 237.7 224.7 343.0 192.6
Total 660.2 504.2 721.8 90.8
Australia ASEAN 5 524.4 311.5 228.9 -314.8
BCLMV 10.5 13.7 16.7 12.6
Total 534.9 325.1 245.6 -302.2
India ASEAN 5 106.7 66.7 87.2 90.7
BCLMV 1.4 2.1 3.0 1.9
Total 108.1 68.8 90.2 92.6
Source Country/Region Host Region 1995 1996 1997 1998
(1) (2) (3) (4) (5) (6)
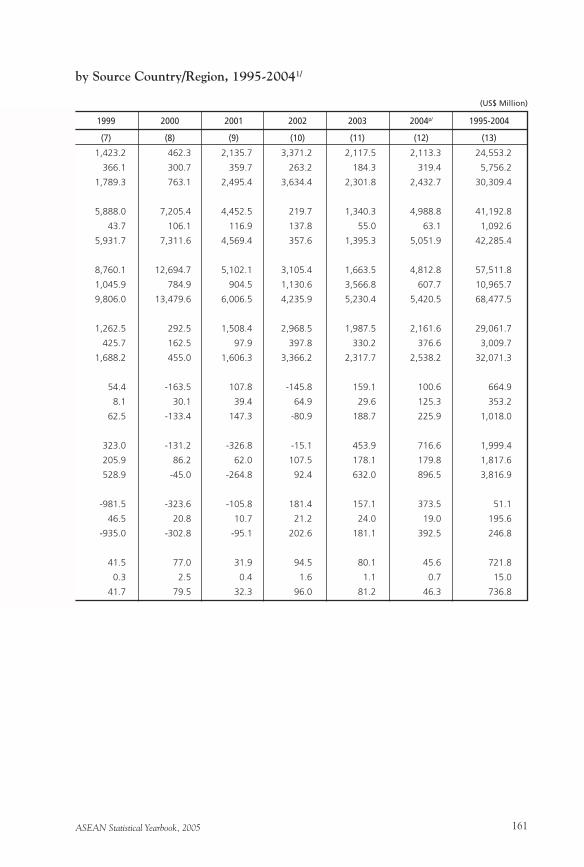
ASEAN Statistical Yearbook, 2005 161
by Source Country/Region, 1995-20041/
(US$ Million)
1999 2000 2001 2002 2003 2004p/ 1995-2004
(7) (8) (9) (10) (11) (12) (13)
1,423.2 462.3 2,135.7 3,371.2 2,117.5 2,113.3 24,553.2
366.1 300.7 359.7 263.2 184.3 319.4 5,756.2
1,789.3 763.1 2,495.4 3,634.4 2,301.8 2,432.7 30,309.4
5,888.0 7,205.4 4,452.5 219.7 1,340.3 4,988.8 41,192.8
43.7 106.1 116.9 137.8 55.0 63.1 1,092.6
5,931.7 7,311.6 4,569.4 357.6 1,395.3 5,051.9 42,285.4
8,760.1 12,694.7 5,102.1 3,105.4 1,663.5 4,812.8 57,511.8
1,045.9 784.9 904.5 1,130.6 3,566.8 607.7 10,965.7
9,806.0 13,479.6 6,006.5 4,235.9 5,230.4 5,420.5 68,477.5
1,262.5 292.5 1,508.4 2,968.5 1,987.5 2,161.6 29,061.7
425.7 162.5 97.9 397.8 330.2 376.6 3,009.7
1,688.2 455.0 1,606.3 3,366.2 2,317.7 2,538.2 32,071.3
54.4 -163.5 107.8 -145.8 159.1 100.6 664.9
8.1 30.1 39.4 64.9 29.6 125.3 353.2
62.5 -133.4 147.3 -80.9 188.7 225.9 1,018.0
323.0 -131.2 -326.8 -15.1 453.9 716.6 1,999.4
205.9 86.2 62.0 107.5 178.1 179.8 1,817.6
528.9 -45.0 -264.8 92.4 632.0 896.5 3,816.9
-981.5 -323.6 -105.8 181.4 157.1 373.5 51.1
46.5 20.8 10.7 21.2 24.0 19.0 195.6
-935.0 -302.8 -95.1 202.6 181.1 392.5 246.8
41.5 77.0 31.9 94.5 80.1 45.6 721.8
0.3 2.5 0.4 1.6 1.1 0.7 15.0
41.7 79.5 32.3 96.0 81.2 46.3 736.8
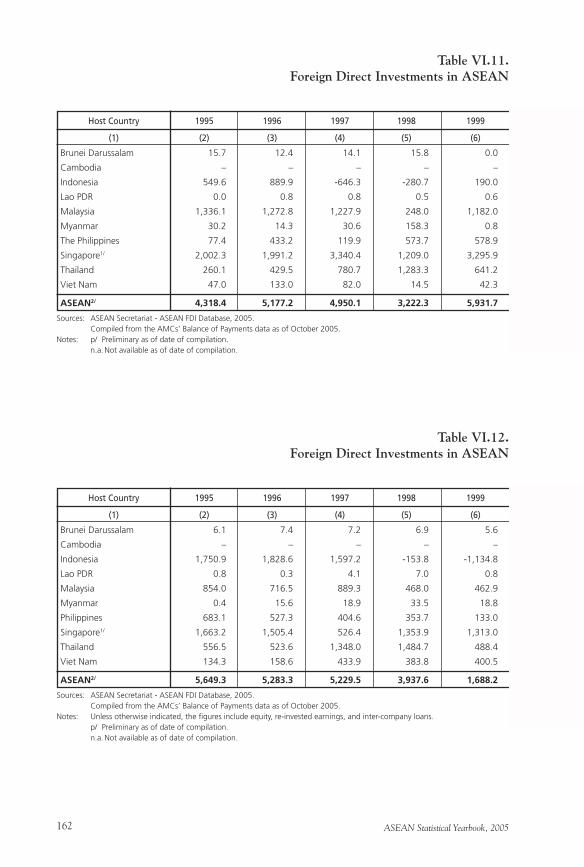
ASEAN Statistical Yearbook, 2005162
Table VI.11.Foreign Direct Investments in ASEAN
Sources: ASEAN Secretariat - ASEAN FDI Database, 2005. Compiled from the AMCs’ Balance of Payments data as of October 2005.Notes: p/ Preliminary as of date of compilation. n.a. Not available as of date of compilation.
Brunei Darussalam 15.7 12.4 14.1 15.8 0.0
Cambodia – – – – –
Indonesia 549.6 889.9 -646.3 -280.7 190.0
Lao PDR 0.0 0.8 0.8 0.5 0.6
Malaysia 1,336.1 1,272.8 1,227.9 248.0 1,182.0
Myanmar 30.2 14.3 30.6 158.3 0.8
The Philippines 77.4 433.2 119.9 573.7 578.9
Singapore1/ 2,002.3 1,991.2 3,340.4 1,209.0 3,295.9
Thailand 260.1 429.5 780.7 1,283.3 641.2
Viet Nam 47.0 133.0 82.0 14.5 42.3
ASEAN2/ 4,318.4 5,177.2 4,950.1 3,222.3 5,931.7
Host Country 1995 1996 1997 1998 1999
(1) (2) (3) (4) (5) (6)
Table VI.12.Foreign Direct Investments in ASEAN
Sources: ASEAN Secretariat - ASEAN FDI Database, 2005. Compiled from the AMCs’ Balance of Payments data as of October 2005.Notes: Unless otherwise indicated, the figures include equity, re-invested earnings, and inter-company loans. p/ Preliminary as of date of compilation. n.a. Not available as of date of compilation.
Brunei Darussalam 6.1 7.4 7.2 6.9 5.6
Cambodia – – – – –
Indonesia 1,750.9 1,828.6 1,597.2 -153.8 -1,134.8
Lao PDR 0.8 0.3 4.1 7.0 0.8
Malaysia 854.0 716.5 889.3 468.0 462.9
Myanmar 0.4 15.6 18.9 33.5 18.8
Philippines 683.1 527.3 404.6 353.7 133.0
Singapore1/ 1,663.2 1,505.4 526.4 1,353.9 1,313.0
Thailand 556.5 523.6 1,348.0 1,484.7 488.4
Viet Nam 134.3 158.6 433.9 383.8 400.5
ASEAN2/ 5,649.3 5,283.3 5,229.5 3,937.6 1,688.2
Host Country 1995 1996 1997 1998 1999
(1) (2) (3) (4) (5) (6)
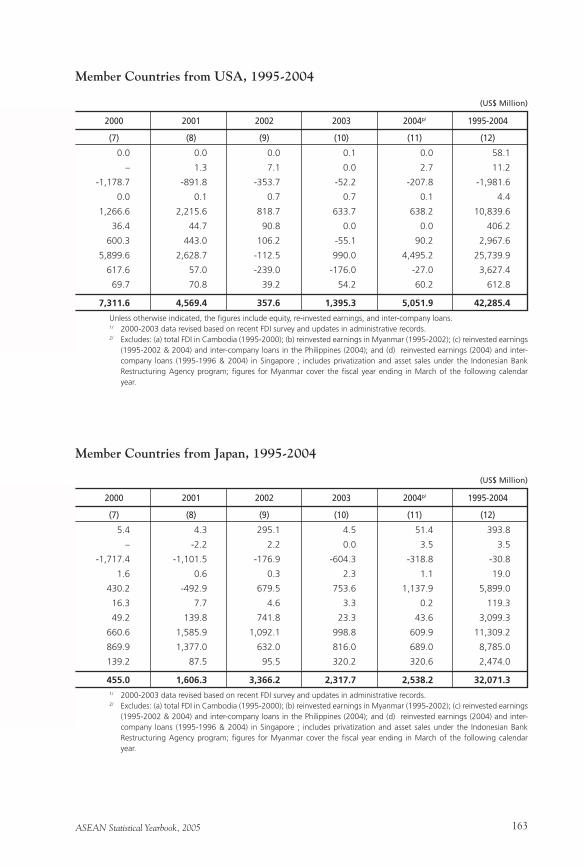
ASEAN Statistical Yearbook, 2005 163
Member Countries from USA, 1995-2004
(US$ Million)
0.0 0.0 0.0 0.1 0.0 58.1
– 1.3 7.1 0.0 2.7 11.2
-1,178.7 -891.8 -353.7 -52.2 -207.8 -1,981.6
0.0 0.1 0.7 0.7 0.1 4.4
1,266.6 2,215.6 818.7 633.7 638.2 10,839.6
36.4 44.7 90.8 0.0 0.0 406.2
600.3 443.0 106.2 -55.1 90.2 2,967.6
5,899.6 2,628.7 -112.5 990.0 4,495.2 25,739.9
617.6 57.0 -239.0 -176.0 -27.0 3,627.4
69.7 70.8 39.2 54.2 60.2 612.8
7,311.6 4,569.4 357.6 1,395.3 5,051.9 42,285.4
2000 2001 2002 2003 2004p/ 1995-2004
(7) (8) (9) (10) (11) (12)
Member Countries from Japan, 1995-2004
(US$ Million)
5.4 4.3 295.1 4.5 51.4 393.8
– -2.2 2.2 0.0 3.5 3.5
-1,717.4 -1,101.5 -176.9 -604.3 -318.8 -30.8
1.6 0.6 0.3 2.3 1.1 19.0
430.2 -492.9 679.5 753.6 1,137.9 5,899.0
16.3 7.7 4.6 3.3 0.2 119.3
49.2 139.8 741.8 23.3 43.6 3,099.3
660.6 1,585.9 1,092.1 998.8 609.9 11,309.2
869.9 1,377.0 632.0 816.0 689.0 8,785.0
139.2 87.5 95.5 320.2 320.6 2,474.0
455.0 1,606.3 3,366.2 2,317.7 2,538.2 32,071.3
2000 2001 2002 2003 2004p/ 1995-2004
(7) (8) (9) (10) (11) (12)
Unless otherwise indicated, the figures include equity, re-invested earnings, and inter-company loans. 1/ 2000-2003 data revised based on recent FDI survey and updates in administrative records. 2/ Excludes: (a) total FDI in Cambodia (1995-2000); (b) reinvested earnings in Myanmar (1995-2002); (c) reinvested earnings
(1995-2002 & 2004) and inter-company loans in the Philippines (2004); and (d) reinvested earnings (2004) and inter-company loans (1995-1996 & 2004) in Singapore ; includes privatization and asset sales under the Indonesian Bank Restructuring Agency program; figures for Myanmar cover the fiscal year ending in March of the following calendar year.
1/ 2000-2003 data revised based on recent FDI survey and updates in administrative records. 2/ Excludes: (a) total FDI in Cambodia (1995-2000); (b) reinvested earnings in Myanmar (1995-2002); (c) reinvested earnings
(1995-2002 & 2004) and inter-company loans in the Philippines (2004); and (d) reinvested earnings (2004) and inter-company loans (1995-1996 & 2004) in Singapore ; includes privatization and asset sales under the Indonesian Bank Restructuring Agency program; figures for Myanmar cover the fiscal year ending in March of the following calendar year.
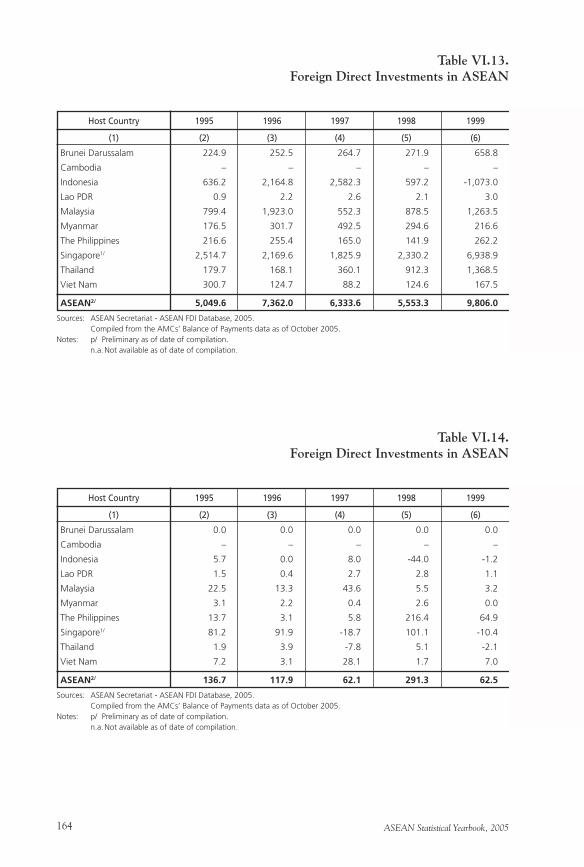
ASEAN Statistical Yearbook, 2005164
Table VI.13.Foreign Direct Investments in ASEAN
Sources: ASEAN Secretariat - ASEAN FDI Database, 2005. Compiled from the AMCs’ Balance of Payments data as of October 2005.Notes: p/ Preliminary as of date of compilation. n.a. Not available as of date of compilation.
Brunei Darussalam 224.9 252.5 264.7 271.9 658.8
Cambodia – – – – –
Indonesia 636.2 2,164.8 2,582.3 597.2 -1,073.0
Lao PDR 0.9 2.2 2.6 2.1 3.0
Malaysia 799.4 1,923.0 552.3 878.5 1,263.5
Myanmar 176.5 301.7 492.5 294.6 216.6
The Philippines 216.6 255.4 165.0 141.9 262.2
Singapore1/ 2,514.7 2,169.6 1,825.9 2,330.2 6,938.9
Thailand 179.7 168.1 360.1 912.3 1,368.5
Viet Nam 300.7 124.7 88.2 124.6 167.5
ASEAN2/ 5,049.6 7,362.0 6,333.6 5,553.3 9,806.0
Host Country 1995 1996 1997 1998 1999
(1) (2) (3) (4) (5) (6)
Table VI.14.Foreign Direct Investments in ASEAN
Sources: ASEAN Secretariat - ASEAN FDI Database, 2005. Compiled from the AMCs’ Balance of Payments data as of October 2005.Notes: p/ Preliminary as of date of compilation. n.a. Not available as of date of compilation.
Brunei Darussalam 0.0 0.0 0.0 0.0 0.0
Cambodia – – – – –
Indonesia 5.7 0.0 8.0 -44.0 -1.2
Lao PDR 1.5 0.4 2.7 2.8 1.1
Malaysia 22.5 13.3 43.6 5.5 3.2
Myanmar 3.1 2.2 0.4 2.6 0.0
The Philippines 13.7 3.1 5.8 216.4 64.9
Singapore1/ 81.2 91.9 -18.7 101.1 -10.4
Thailand 1.9 3.9 -7.8 5.1 -2.1
Viet Nam 7.2 3.1 28.1 1.7 7.0
ASEAN2/ 136.7 117.9 62.1 291.3 62.5
Host Country 1995 1996 1997 1998 1999
(1) (2) (3) (4) (5) (6)
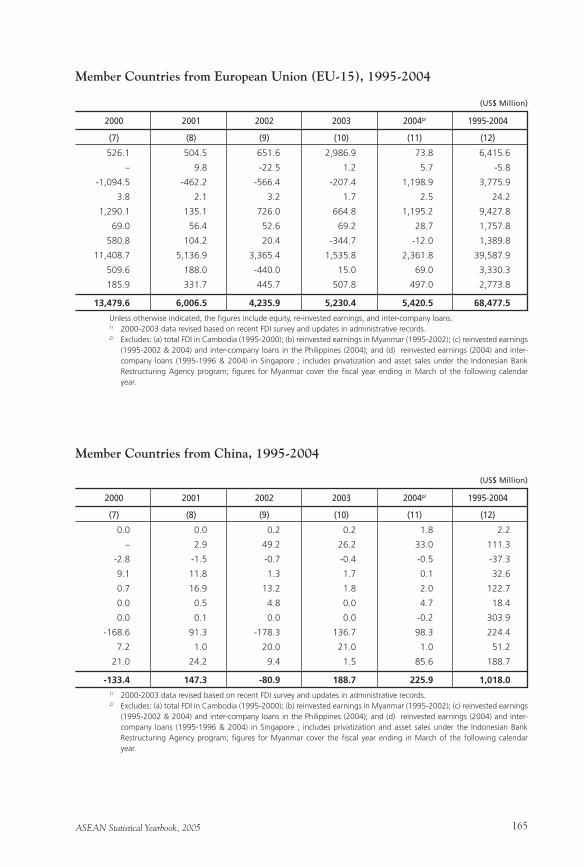
ASEAN Statistical Yearbook, 2005 165
Member Countries from European Union (EU-15), 1995-2004
(US$ Million)
526.1 504.5 651.6 2,986.9 73.8 6,415.6
– 9.8 -22.5 1.2 5.7 -5.8
-1,094.5 -462.2 -566.4 -207.4 1,198.9 3,775.9
3.8 2.1 3.2 1.7 2.5 24.2
1,290.1 135.1 726.0 664.8 1,195.2 9,427.8
69.0 56.4 52.6 69.2 28.7 1,757.8
580.8 104.2 20.4 -344.7 -12.0 1,389.8
11,408.7 5,136.9 3,365.4 1,535.8 2,361.8 39,587.9
509.6 188.0 -440.0 15.0 69.0 3,330.3
185.9 331.7 445.7 507.8 497.0 2,773.8
13,479.6 6,006.5 4,235.9 5,230.4 5,420.5 68,477.5
2000 2001 2002 2003 2004p/ 1995-2004
(7) (8) (9) (10) (11) (12)
Member Countries from China, 1995-2004
(US$ Million)
0.0 0.0 0.2 0.2 1.8 2.2
– 2.9 49.2 26.2 33.0 111.3
-2.8 -1.5 -0.7 -0.4 -0.5 -37.3
9.1 11.8 1.3 1.7 0.1 32.6
0.7 16.9 13.2 1.8 2.0 122.7
0.0 0.5 4.8 0.0 4.7 18.4
0.0 0.1 0.0 0.0 -0.2 303.9
-168.6 91.3 -178.3 136.7 98.3 224.4
7.2 1.0 20.0 21.0 1.0 51.2
21.0 24.2 9.4 1.5 85.6 188.7
-133.4 147.3 -80.9 188.7 225.9 1,018.0
2000 2001 2002 2003 2004p/ 1995-2004
(7) (8) (9) (10) (11) (12)
Unless otherwise indicated, the figures include equity, re-invested earnings, and inter-company loans. 1/ 2000-2003 data revised based on recent FDI survey and updates in administrative records. 2/ Excludes: (a) total FDI in Cambodia (1995-2000); (b) reinvested earnings in Myanmar (1995-2002); (c) reinvested earnings
(1995-2002 & 2004) and inter-company loans in the Philippines (2004); and (d) reinvested earnings (2004) and inter-company loans (1995-1996 & 2004) in Singapore ; includes privatization and asset sales under the Indonesian Bank Restructuring Agency program; figures for Myanmar cover the fiscal year ending in March of the following calendar year.
1/ 2000-2003 data revised based on recent FDI survey and updates in administrative records. 2/ Excludes: (a) total FDI in Cambodia (1995-2000); (b) reinvested earnings in Myanmar (1995-2002); (c) reinvested earnings
(1995-2002 & 2004) and inter-company loans in the Philippines (2004); and (d) reinvested earnings (2004) and inter-company loans (1995-1996 & 2004) in Singapore ; includes privatization and asset sales under the Indonesian Bank Restructuring Agency program; figures for Myanmar cover the fiscal year ending in March of the following calendar year.
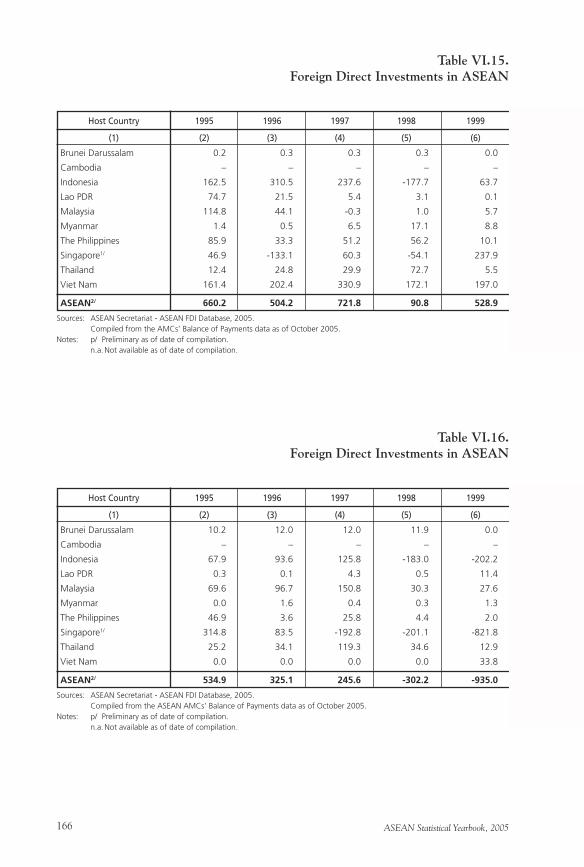
ASEAN Statistical Yearbook, 2005166
Table VI.15.Foreign Direct Investments in ASEAN
Sources: ASEAN Secretariat - ASEAN FDI Database, 2005. Compiled from the AMCs’ Balance of Payments data as of October 2005.Notes: p/ Preliminary as of date of compilation. n.a. Not available as of date of compilation.
Brunei Darussalam 0.2 0.3 0.3 0.3 0.0
Cambodia – – – – –
Indonesia 162.5 310.5 237.6 -177.7 63.7
Lao PDR 74.7 21.5 5.4 3.1 0.1
Malaysia 114.8 44.1 -0.3 1.0 5.7
Myanmar 1.4 0.5 6.5 17.1 8.8
The Philippines 85.9 33.3 51.2 56.2 10.1
Singapore1/ 46.9 -133.1 60.3 -54.1 237.9
Thailand 12.4 24.8 29.9 72.7 5.5
Viet Nam 161.4 202.4 330.9 172.1 197.0
ASEAN2/ 660.2 504.2 721.8 90.8 528.9
Host Country 1995 1996 1997 1998 1999
(1) (2) (3) (4) (5) (6)
Table VI.16.Foreign Direct Investments in ASEAN
Sources: ASEAN Secretariat - ASEAN FDI Database, 2005. Compiled from the ASEAN AMCs’ Balance of Payments data as of October 2005.Notes: p/ Preliminary as of date of compilation. n.a. Not available as of date of compilation.
Brunei Darussalam 10.2 12.0 12.0 11.9 0.0
Cambodia – – – – –
Indonesia 67.9 93.6 125.8 -183.0 -202.2
Lao PDR 0.3 0.1 4.3 0.5 11.4
Malaysia 69.6 96.7 150.8 30.3 27.6
Myanmar 0.0 1.6 0.4 0.3 1.3
The Philippines 46.9 3.6 25.8 4.4 2.0
Singapore1/ 314.8 83.5 -192.8 -201.1 -821.8
Thailand 25.2 34.1 119.3 34.6 12.9
Viet Nam 0.0 0.0 0.0 0.0 33.8
ASEAN2/ 534.9 325.1 245.6 -302.2 -935.0
Host Country 1995 1996 1997 1998 1999
(1) (2) (3) (4) (5) (6)
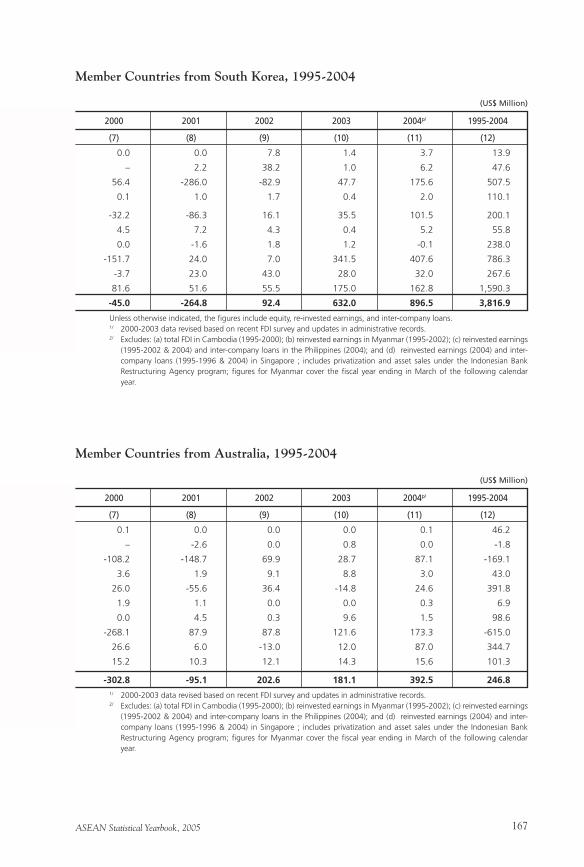
ASEAN Statistical Yearbook, 2005 167
Member Countries from South Korea, 1995-2004
(US$ Million)
0.0 0.0 7.8 1.4 3.7 13.9
– 2.2 38.2 1.0 6.2 47.6
56.4 -286.0 -82.9 47.7 175.6 507.5
0.1 1.0 1.7 0.4 2.0 110.1
-32.2 -86.3 16.1 35.5 101.5 200.1
4.5 7.2 4.3 0.4 5.2 55.8
0.0 -1.6 1.8 1.2 -0.1 238.0
-151.7 24.0 7.0 341.5 407.6 786.3
-3.7 23.0 43.0 28.0 32.0 267.6
81.6 51.6 55.5 175.0 162.8 1,590.3
-45.0 -264.8 92.4 632.0 896.5 3,816.9
2000 2001 2002 2003 2004p/ 1995-2004
(7) (8) (9) (10) (11) (12)
Member Countries from Australia, 1995-2004
(US$ Million)
0.1 0.0 0.0 0.0 0.1 46.2
– -2.6 0.0 0.8 0.0 -1.8
-108.2 -148.7 69.9 28.7 87.1 -169.1
3.6 1.9 9.1 8.8 3.0 43.0
26.0 -55.6 36.4 -14.8 24.6 391.8
1.9 1.1 0.0 0.0 0.3 6.9
0.0 4.5 0.3 9.6 1.5 98.6
-268.1 87.9 87.8 121.6 173.3 -615.0
26.6 6.0 -13.0 12.0 87.0 344.7
15.2 10.3 12.1 14.3 15.6 101.3
-302.8 -95.1 202.6 181.1 392.5 246.8
2000 2001 2002 2003 2004p/ 1995-2004
(7) (8) (9) (10) (11) (12)
Unless otherwise indicated, the figures include equity, re-invested earnings, and inter-company loans. 1/ 2000-2003 data revised based on recent FDI survey and updates in administrative records. 2/ Excludes: (a) total FDI in Cambodia (1995-2000); (b) reinvested earnings in Myanmar (1995-2002); (c) reinvested earnings
(1995-2002 & 2004) and inter-company loans in the Philippines (2004); and (d) reinvested earnings (2004) and inter-company loans (1995-1996 & 2004) in Singapore ; includes privatization and asset sales under the Indonesian Bank Restructuring Agency program; figures for Myanmar cover the fiscal year ending in March of the following calendar year.
1/ 2000-2003 data revised based on recent FDI survey and updates in administrative records. 2/ Excludes: (a) total FDI in Cambodia (1995-2000); (b) reinvested earnings in Myanmar (1995-2002); (c) reinvested earnings
(1995-2002 & 2004) and inter-company loans in the Philippines (2004); and (d) reinvested earnings (2004) and inter-company loans (1995-1996 & 2004) in Singapore ; includes privatization and asset sales under the Indonesian Bank Restructuring Agency program; figures for Myanmar cover the fiscal year ending in March of the following calendar year.
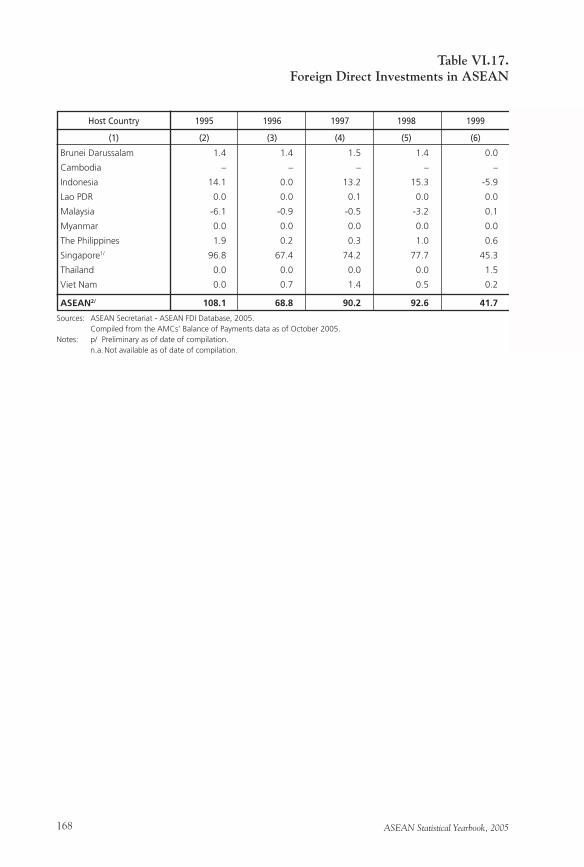
ASEAN Statistical Yearbook, 2005168
Table VI.17.Foreign Direct Investments in ASEAN
Sources: ASEAN Secretariat - ASEAN FDI Database, 2005. Compiled from the AMCs’ Balance of Payments data as of October 2005.Notes: p/ Preliminary as of date of compilation. n.a. Not available as of date of compilation.
Brunei Darussalam 1.4 1.4 1.5 1.4 0.0
Cambodia – – – – –
Indonesia 14.1 0.0 13.2 15.3 -5.9
Lao PDR 0.0 0.0 0.1 0.0 0.0
Malaysia -6.1 -0.9 -0.5 -3.2 0.1
Myanmar 0.0 0.0 0.0 0.0 0.0
The Philippines 1.9 0.2 0.3 1.0 0.6
Singapore1/ 96.8 67.4 74.2 77.7 45.3
Thailand 0.0 0.0 0.0 0.0 1.5
Viet Nam 0.0 0.7 1.4 0.5 0.2
ASEAN2/ 108.1 68.8 90.2 92.6 41.7
Host Country 1995 1996 1997 1998 1999
(1) (2) (3) (4) (5) (6)
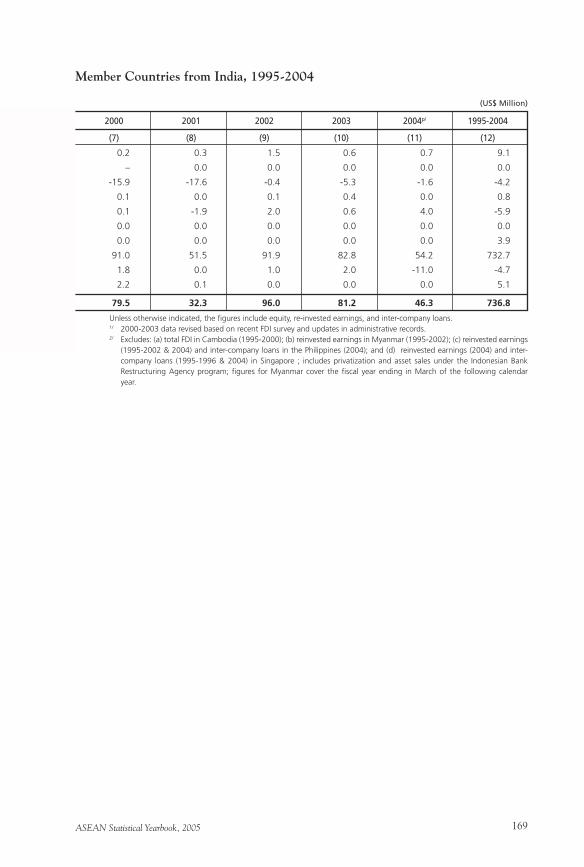
ASEAN Statistical Yearbook, 2005 169
Member Countries from India, 1995-2004
(US$ Million)
0.2 0.3 1.5 0.6 0.7 9.1
– 0.0 0.0 0.0 0.0 0.0
-15.9 -17.6 -0.4 -5.3 -1.6 -4.2
0.1 0.0 0.1 0.4 0.0 0.8
0.1 -1.9 2.0 0.6 4.0 -5.9
0.0 0.0 0.0 0.0 0.0 0.0
0.0 0.0 0.0 0.0 0.0 3.9
91.0 51.5 91.9 82.8 54.2 732.7
1.8 0.0 1.0 2.0 -11.0 -4.7
2.2 0.1 0.0 0.0 0.0 5.1
79.5 32.3 96.0 81.2 46.3 736.8
2000 2001 2002 2003 2004p/ 1995-2004
(7) (8) (9) (10) (11) (12)
Unless otherwise indicated, the figures include equity, re-invested earnings, and inter-company loans. 1/ 2000-2003 data revised based on recent FDI survey and updates in administrative records. 2/ Excludes: (a) total FDI in Cambodia (1995-2000); (b) reinvested earnings in Myanmar (1995-2002); (c) reinvested earnings
(1995-2002 & 2004) and inter-company loans in the Philippines (2004); and (d) reinvested earnings (2004) and inter-company loans (1995-1996 & 2004) in Singapore ; includes privatization and asset sales under the Indonesian Bank Restructuring Agency program; figures for Myanmar cover the fiscal year ending in March of the following calendar year.
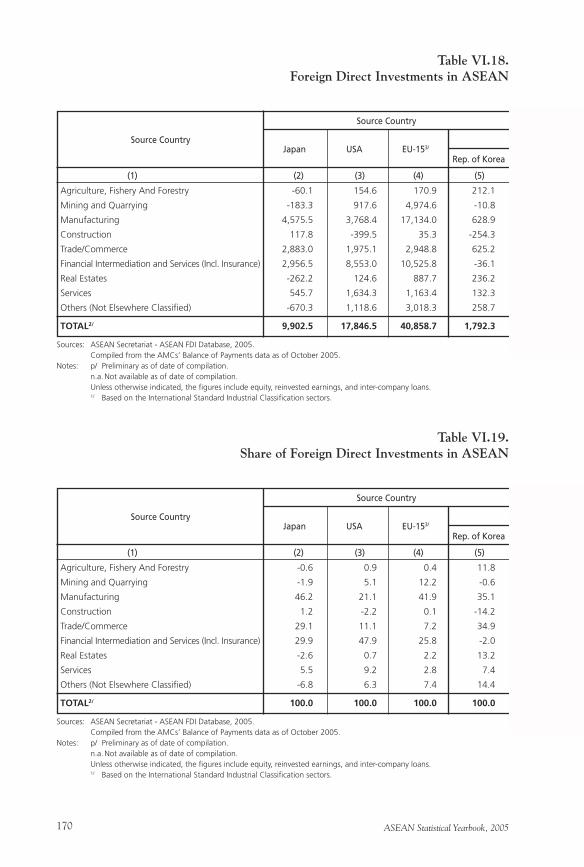
ASEAN Statistical Yearbook, 2005170
Table VI.18.Foreign Direct Investments in ASEAN
Japan USA EU-153/
(1) (2) (3) (4) (5)
Agriculture, Fishery And Forestry -60.1 154.6 170.9 212.1
Mining and Quarrying -183.3 917.6 4,974.6 -10.8
Manufacturing 4,575.5 3,768.4 17,134.0 628.9
Construction 117.8 -399.5 35.3 -254.3
Trade/Commerce 2,883.0 1,975.1 2,948.8 625.2
Financial Intermediation and Services (Incl. Insurance) 2,956.5 8,553.0 10,525.8 -36.1
Real Estates -262.2 124.6 887.7 236.2
Services 545.7 1,634.3 1,163.4 132.3
Others (Not Elsewhere Classified) -670.3 1,118.6 3,018.3 258.7
TOTAL2/ 9,902.5 17,846.5 40,858.7 1,792.3
Source Country
Source Country
Rep. of Korea
Sources: ASEAN Secretariat - ASEAN FDI Database, 2005. Compiled from the AMCs’ Balance of Payments data as of October 2005.Notes: p/ Preliminary as of date of compilation. n.a. Not available as of date of compilation. Unless otherwise indicated, the figures include equity, reinvested earnings, and inter-company loans. 1/ Based on the International Standard Industrial Classification sectors.
Table VI.19.Share of Foreign Direct Investments in ASEAN
Japan USA EU-153/
(1) (2) (3) (4) (5)
Agriculture, Fishery And Forestry -0.6 0.9 0.4 11.8
Mining and Quarrying -1.9 5.1 12.2 -0.6
Manufacturing 46.2 21.1 41.9 35.1
Construction 1.2 -2.2 0.1 -14.2
Trade/Commerce 29.1 11.1 7.2 34.9
Financial Intermediation and Services (Incl. Insurance) 29.9 47.9 25.8 -2.0
Real Estates -2.6 0.7 2.2 13.2
Services 5.5 9.2 2.8 7.4
Others (Not Elsewhere Classified) -6.8 6.3 7.4 14.4
TOTAL2/ 100.0 100.0 100.0 100.0
Source Country
Source Country
Rep. of Korea
Sources: ASEAN Secretariat - ASEAN FDI Database, 2005. Compiled from the AMCs’ Balance of Payments data as of October 2005.Notes: p/ Preliminary as of date of compilation. n.a. Not available as of date of compilation. Unless otherwise indicated, the figures include equity, reinvested earnings, and inter-company loans. 1/ Based on the International Standard Industrial Classification sectors.
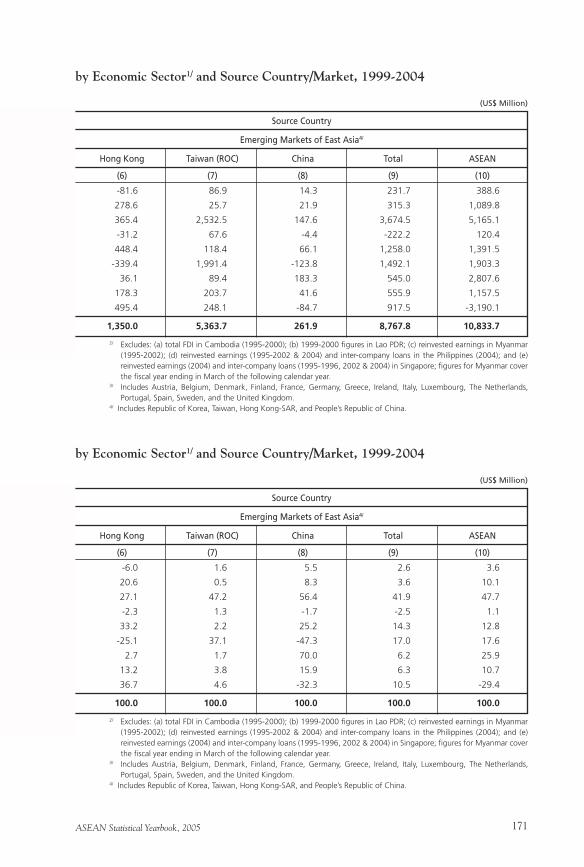
ASEAN Statistical Yearbook, 2005 171
by Economic Sector1/ and Source Country/Market, 1999-2004
(US$ Million)
Hong Kong Taiwan (ROC) China Total ASEAN
(6) (7) (8) (9) (10)
-6.0 1.6 5.5 2.6 3.6
20.6 0.5 8.3 3.6 10.1
27.1 47.2 56.4 41.9 47.7
-2.3 1.3 -1.7 -2.5 1.1
33.2 2.2 25.2 14.3 12.8
-25.1 37.1 -47.3 17.0 17.6
2.7 1.7 70.0 6.2 25.9
13.2 3.8 15.9 6.3 10.7
36.7 4.6 -32.3 10.5 -29.4
100.0 100.0 100.0 100.0 100.0
Source Country
Emerging Markets of East Asia4/
2/ Excludes: (a) total FDI in Cambodia (1995-2000); (b) 1999-2000 figures in Lao PDR; (c) reinvested earnings in Myanmar (1995-2002); (d) reinvested earnings (1995-2002 & 2004) and inter-company loans in the Philippines (2004); and (e) reinvested earnings (2004) and inter-company loans (1995-1996, 2002 & 2004) in Singapore; figures for Myanmar cover the fiscal year ending in March of the following calendar year.
3/ Includes Austria, Belgium, Denmark, Finland, France, Germany, Greece, Ireland, Italy, Luxembourg, The Netherlands, Portugal, Spain, Sweden, and the United Kingdom.
4/ Includes Republic of Korea, Taiwan, Hong Kong-SAR, and People’s Republic of China.
by Economic Sector1/ and Source Country/Market, 1999-2004
(US$ Million)
Hong Kong Taiwan (ROC) China Total ASEAN
(6) (7) (8) (9) (10)
-81.6 86.9 14.3 231.7 388.6
278.6 25.7 21.9 315.3 1,089.8
365.4 2,532.5 147.6 3,674.5 5,165.1
-31.2 67.6 -4.4 -222.2 120.4
448.4 118.4 66.1 1,258.0 1,391.5
-339.4 1,991.4 -123.8 1,492.1 1,903.3
36.1 89.4 183.3 545.0 2,807.6
178.3 203.7 41.6 555.9 1,157.5
495.4 248.1 -84.7 917.5 -3,190.1
1,350.0 5,363.7 261.9 8,767.8 10,833.7
Source Country
Emerging Markets of East Asia4/
2/ Excludes: (a) total FDI in Cambodia (1995-2000); (b) 1999-2000 figures in Lao PDR; (c) reinvested earnings in Myanmar (1995-2002); (d) reinvested earnings (1995-2002 & 2004) and inter-company loans in the Philippines (2004); and (e) reinvested earnings (2004) and inter-company loans (1995-1996, 2002 & 2004) in Singapore; figures for Myanmar cover the fiscal year ending in March of the following calendar year.
3/ Includes Austria, Belgium, Denmark, Finland, France, Germany, Greece, Ireland, Italy, Luxembourg, The Netherlands, Portugal, Spain, Sweden, and the United Kingdom.
4/ Includes Republic of Korea, Taiwan, Hong Kong-SAR, and People’s Republic of China.
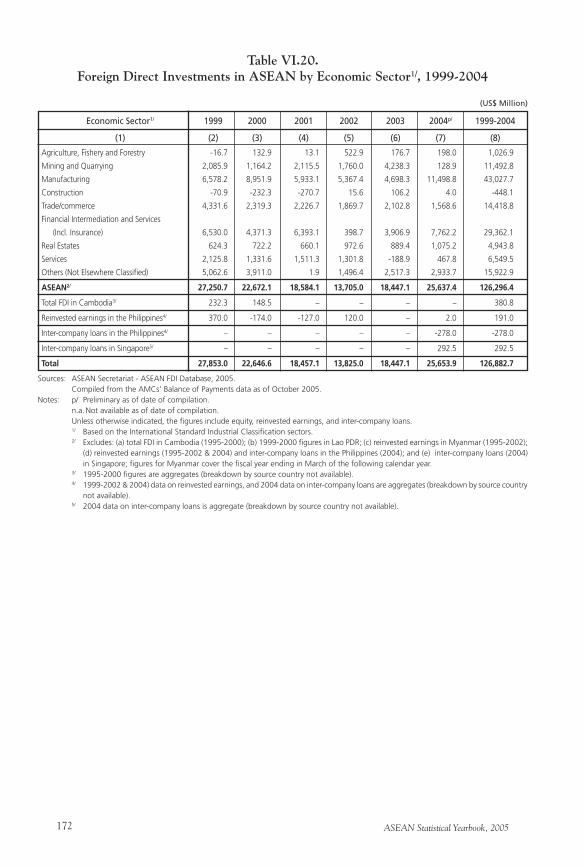
ASEAN Statistical Yearbook, 2005172
Table VI.20.Foreign Direct Investments in ASEAN by Economic Sector1/, 1999-2004
Sources: ASEAN Secretariat - ASEAN FDI Database, 2005. Compiled from the AMCs’ Balance of Payments data as of October 2005.Notes: p/ Preliminary as of date of compilation. n.a. Not available as of date of compilation. Unless otherwise indicated, the figures include equity, reinvested earnings, and inter-company loans. 1/ Based on the International Standard Industrial Classification sectors. 2/ Excludes: (a) total FDI in Cambodia (1995-2000); (b) 1999-2000 figures in Lao PDR; (c) reinvested earnings in Myanmar (1995-2002);
(d) reinvested earnings (1995-2002 & 2004) and inter-company loans in the Philippines (2004); and (e) inter-company loans (2004) in Singapore; figures for Myanmar cover the fiscal year ending in March of the following calendar year.
3/ 1995-2000 figures are aggregates (breakdown by source country not available). 4/ 1999-2002 & 2004) data on reinvested earnings, and 2004 data on inter-company loans are aggregates (breakdown by source country
not available). 5/ 2004 data on inter-company loans is aggregate (breakdown by source country not available).
Agriculture, Fishery and Forestry -16.7 132.9 13.1 522.9 176.7 198.0 1,026.9
Mining and Quarrying 2,085.9 1,164.2 2,115.5 1,760.0 4,238.3 128.9 11,492.8
Manufacturing 6,578.2 8,951.9 5,933.1 5,367.4 4,698.3 11,498.8 43,027.7
Construction -70.9 -232.3 -270.7 15.6 106.2 4.0 -448.1
Trade/commerce 4,331.6 2,319.3 2,226.7 1,869.7 2,102.8 1,568.6 14,418.8
Financial Intermediation and Services
(Incl. Insurance) 6,530.0 4,371.3 6,393.1 398.7 3,906.9 7,762.2 29,362.1
Real Estates 624.3 722.2 660.1 972.6 889.4 1,075.2 4,943.8
Services 2,125.8 1,331.6 1,511.3 1,301.8 -188.9 467.8 6,549.5
Others (Not Elsewhere Classified) 5,062.6 3,911.0 1.9 1,496.4 2,517.3 2,933.7 15,922.9
ASEAN2/ 27,250.7 22,672.1 18,584.1 13,705.0 18,447.1 25,637.4 126,296.4
Total FDI in Cambodia3/ 232.3 148.5 – – – – 380.8
Reinvested earnings in the Philippines4/ 370.0 -174.0 -127.0 120.0 – 2.0 191.0
Inter-company loans in the Philippines4/ – – – – – -278.0 -278.0
Inter-company loans in Singapore5/ – – – – – 292.5 292.5
Total 27,853.0 22,646.6 18,457.1 13,825.0 18,447.1 25,653.9 126,882.7
Economic Sector1/ 1999 2000 2001 2002 2003 2004p/ 1999-2004
(1) (2) (3) (4) (5) (6) (7) (8)
(US$ Million)
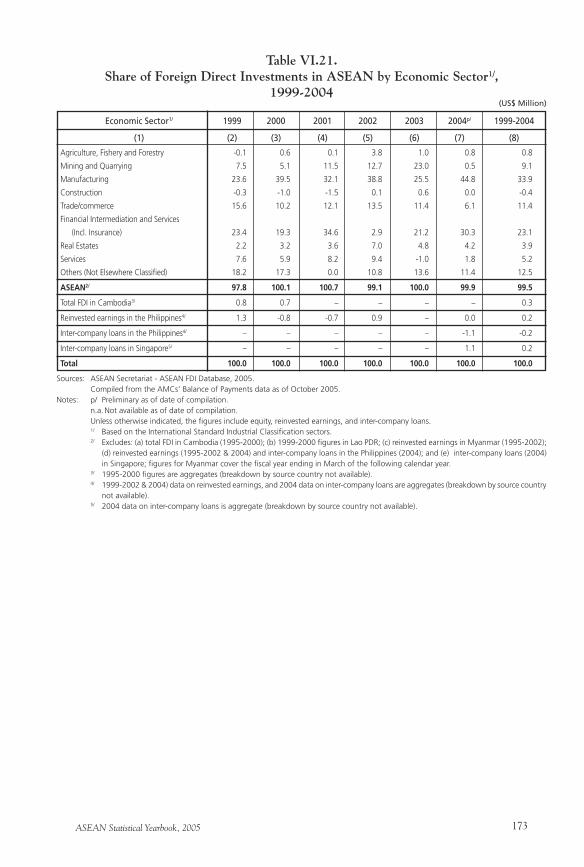
ASEAN Statistical Yearbook, 2005 173
Table VI.21.Share of Foreign Direct Investments in ASEAN by Economic Sector1/,
1999-2004
Sources: ASEAN Secretariat - ASEAN FDI Database, 2005. Compiled from the AMCs’ Balance of Payments data as of October 2005.Notes: p/ Preliminary as of date of compilation. n.a. Not available as of date of compilation. Unless otherwise indicated, the figures include equity, reinvested earnings, and inter-company loans. 1/ Based on the International Standard Industrial Classification sectors. 2/ Excludes: (a) total FDI in Cambodia (1995-2000); (b) 1999-2000 figures in Lao PDR; (c) reinvested earnings in Myanmar (1995-2002);
(d) reinvested earnings (1995-2002 & 2004) and inter-company loans in the Philippines (2004); and (e) inter-company loans (2004) in Singapore; figures for Myanmar cover the fiscal year ending in March of the following calendar year.
3/ 1995-2000 figures are aggregates (breakdown by source country not available). 4/ 1999-2002 & 2004) data on reinvested earnings, and 2004 data on inter-company loans are aggregates (breakdown by source country
not available). 5/ 2004 data on inter-company loans is aggregate (breakdown by source country not available).
Agriculture, Fishery and Forestry -0.1 0.6 0.1 3.8 1.0 0.8 0.8
Mining and Quarrying 7.5 5.1 11.5 12.7 23.0 0.5 9.1
Manufacturing 23.6 39.5 32.1 38.8 25.5 44.8 33.9
Construction -0.3 -1.0 -1.5 0.1 0.6 0.0 -0.4
Trade/commerce 15.6 10.2 12.1 13.5 11.4 6.1 11.4
Financial Intermediation and Services
(Incl. Insurance) 23.4 19.3 34.6 2.9 21.2 30.3 23.1
Real Estates 2.2 3.2 3.6 7.0 4.8 4.2 3.9
Services 7.6 5.9 8.2 9.4 -1.0 1.8 5.2
Others (Not Elsewhere Classified) 18.2 17.3 0.0 10.8 13.6 11.4 12.5
ASEAN2/ 97.8 100.1 100.7 99.1 100.0 99.9 99.5
Total FDI in Cambodia3/ 0.8 0.7 – – – – 0.3
Reinvested earnings in the Philippines4/ 1.3 -0.8 -0.7 0.9 – 0.0 0.2
Inter-company loans in the Philippines4/ – – – – – -1.1 -0.2
Inter-company loans in Singapore5/ – – – – – 1.1 0.2
Total 100.0 100.0 100.0 100.0 100.0 100.0 100.0
Economic Sector1/ 1999 2000 2001 2002 2003 2004p/ 1999-2004
(1) (2) (3) (4) (5) (6) (7) (8)
(US$ Million)

ASEAN Statistical Yearbook, 2005174
Table VI.22.1Foreign Direct Investments in ASEAN
Source: ASEAN Secretariat - ASEAN FDI Database, 2005. Compiled from the AMCs’ Balance of Payments data as of October 2005.Notes: p/ Preliminary as of date of compilation. n.a. Not available as of date of compilation. Unless otherwise indicated, the figures include equity, reinvested earnings, and inter-company loans. 1/ Excludes: (a) total FDI in Cambodia (1995-2000); (b) reinvested earnings in Myanmar (1995-2002); (c) reinvested earnings
(1995-2002 & 2004) and inter-company loans in the Philippines (2004); and (d) reinvested earnings (2004) and inter-company loans (1995-1996 & 2004) in Singapore ; includes privatization and asset sales under the Indonesian Bank Restructuring Agency program (2002); figures for Myanmar cover the fiscal year ending in March of the following calendar year.
2/ Includes Austria, Belgium, Denmark, Finland, France, Germany, Greece, Ireland, Italy, Luxembourg, The Netherlands, Portugal, Spain, Sweden, and the United Kingdom.
3/ Refers to the rest of Europe.
Cambodia Indonesia Lao PDR Malaysia8/
(1) (2) (3) (4) (5) (6)
ASEAN1/ 311.3 – 608.9 6.5 908.4
REST OF THE WORLD1/ 271.4 – 3,737.1 81.9 2,098.6
Asian NIEs 5.8 – 255.2 75.8 306.2
Hong Kong 4.8 – 106.8 0.0 52.1
South Korea 0.2 – 162.5 74.7 67.2
Taiwan (ROC) 0.8 – -14.1 1.1 186.9
China 0.0 – 5.7 1.5 13.5
India 1.4 – 14.1 0.0 -7.3
Japan 6.1 – 1,750.9 0.8 450.1
EU-152/ 224.9 – 636.2 0.9 435.7
Other EU3/ 0.1 – 146.5 0.0 5.9
Canada 0.0 – 0.0 2.6 18.9
USA 15.7 – 549.6 0.0 793.8
Australia 10.2 – 67.9 0.3 36.7
New Zealand 7.1 – 0.0 0.0 -0.7
All OTHERS4/ 0.0 – 311.1 0.0 45.9
Subtotal1/ 582.8 – 4,346.0 88.4 3,007.0
Total FDI in Cambodia5/ – 150.7 – – –
Reinvested earnings in the Philippines6/ – – – – –
Inter-company loans in the Philippines6/ – – – – –
Reinvested earnings in Singapore7/ – – – – –
Inter-company loans in Singapore7/ – – – – –
Total 582.8 150.7 4,346.0 88.4 3,007.0
Host Country
Source Country BruneiDarussalam
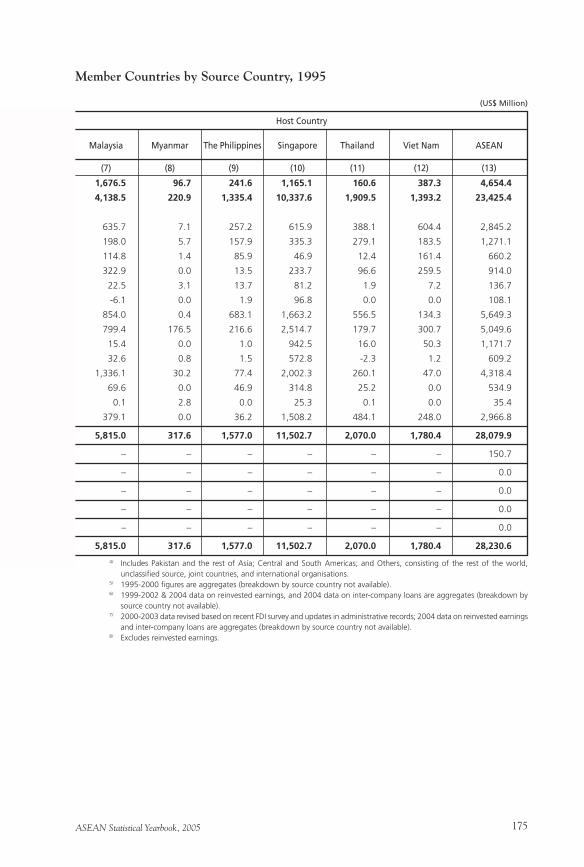
ASEAN Statistical Yearbook, 2005 175
Member Countries by Source Country, 1995
(US$ Million)
Malaysia Myanmar The Philippines Singapore Thailand Viet Nam ASEAN
(7) (8) (9) (10) (11) (12) (13)
1,676.5 96.7 241.6 1,165.1 160.6 387.3 4,654.4
4,138.5 220.9 1,335.4 10,337.6 1,909.5 1,393.2 23,425.4
635.7 7.1 257.2 615.9 388.1 604.4 2,845.2
198.0 5.7 157.9 335.3 279.1 183.5 1,271.1
114.8 1.4 85.9 46.9 12.4 161.4 660.2
322.9 0.0 13.5 233.7 96.6 259.5 914.0
22.5 3.1 13.7 81.2 1.9 7.2 136.7
-6.1 0.0 1.9 96.8 0.0 0.0 108.1
854.0 0.4 683.1 1,663.2 556.5 134.3 5,649.3
799.4 176.5 216.6 2,514.7 179.7 300.7 5,049.6
15.4 0.0 1.0 942.5 16.0 50.3 1,171.7
32.6 0.8 1.5 572.8 -2.3 1.2 609.2
1,336.1 30.2 77.4 2,002.3 260.1 47.0 4,318.4
69.6 0.0 46.9 314.8 25.2 0.0 534.9
0.1 2.8 0.0 25.3 0.1 0.0 35.4
379.1 0.0 36.2 1,508.2 484.1 248.0 2,966.8
5,815.0 317.6 1,577.0 11,502.7 2,070.0 1,780.4 28,079.9
– – – – – – 150.7
– – – – – – 0.0
– – – – – – 0.0
– – – – – – 0.0
– – – – – – 0.0
5,815.0 317.6 1,577.0 11,502.7 2,070.0 1,780.4 28,230.6
Host Country
4/ Includes Pakistan and the rest of Asia; Central and South Americas; and Others, consisting of the rest of the world, unclassified source, joint countries, and international organisations.
5/ 1995-2000 figures are aggregates (breakdown by source country not available). 6/ 1999-2002 & 2004 data on reinvested earnings, and 2004 data on inter-company loans are aggregates (breakdown by
source country not available). 7/ 2000-2003 data revised based on recent FDI survey and updates in administrative records; 2004 data on reinvested earnings
and inter-company loans are aggregates (breakdown by source country not available). 8/ Excludes reinvested earnings.
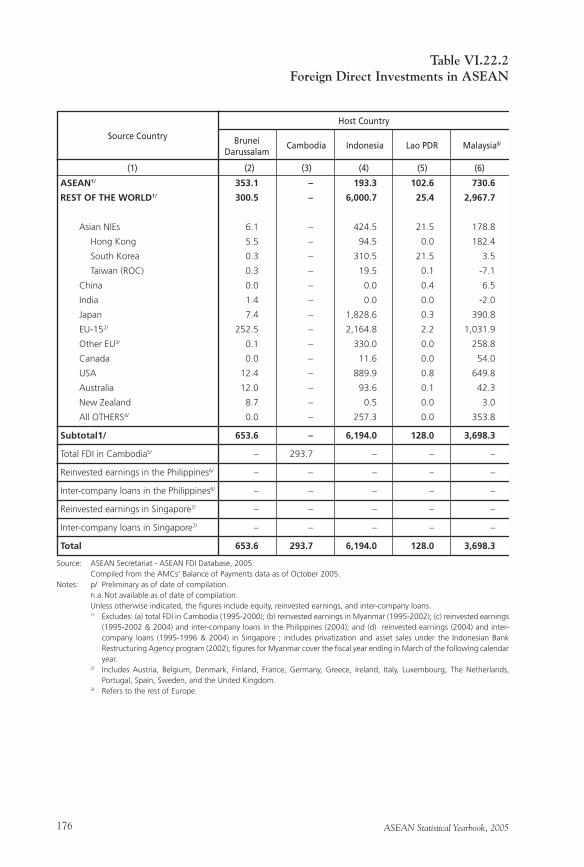
ASEAN Statistical Yearbook, 2005176
Table VI.22.2Foreign Direct Investments in ASEAN
Source: ASEAN Secretariat - ASEAN FDI Database, 2005. Compiled from the AMCs’ Balance of Payments data as of October 2005.Notes: p/ Preliminary as of date of compilation. n.a. Not available as of date of compilation. Unless otherwise indicated, the figures include equity, reinvested earnings, and inter-company loans. 1/ Excludes: (a) total FDI in Cambodia (1995-2000); (b) reinvested earnings in Myanmar (1995-2002); (c) reinvested earnings
(1995-2002 & 2004) and inter-company loans in the Philippines (2004); and (d) reinvested earnings (2004) and inter-company loans (1995-1996 & 2004) in Singapore ; includes privatization and asset sales under the Indonesian Bank Restructuring Agency program (2002); figures for Myanmar cover the fiscal year ending in March of the following calendar year.
2/ Includes Austria, Belgium, Denmark, Finland, France, Germany, Greece, Ireland, Italy, Luxembourg, The Netherlands, Portugal, Spain, Sweden, and the United Kingdom.
3/ Refers to the rest of Europe.
Cambodia Indonesia Lao PDR Malaysia8/
(1) (2) (3) (4) (5) (6)
ASEAN1/ 353.1 – 193.3 102.6 730.6
REST OF THE WORLD1/ 300.5 – 6,000.7 25.4 2,967.7
Asian NIEs 6.1 – 424.5 21.5 178.8
Hong Kong 5.5 – 94.5 0.0 182.4
South Korea 0.3 – 310.5 21.5 3.5
Taiwan (ROC) 0.3 – 19.5 0.1 -7.1
China 0.0 – 0.0 0.4 6.5
India 1.4 – 0.0 0.0 -2.0
Japan 7.4 – 1,828.6 0.3 390.8
EU-152/ 252.5 – 2,164.8 2.2 1,031.9
Other EU3/ 0.1 – 330.0 0.0 258.8
Canada 0.0 – 11.6 0.0 54.0
USA 12.4 – 889.9 0.8 649.8
Australia 12.0 – 93.6 0.1 42.3
New Zealand 8.7 – 0.5 0.0 3.0
All OTHERS4/ 0.0 – 257.3 0.0 353.8
Subtotal1/ 653.6 – 6,194.0 128.0 3,698.3
Total FDI in Cambodia5/ – 293.7 – – –
Reinvested earnings in the Philippines6/ – – – – –
Inter-company loans in the Philippines6/ – – – – –
Reinvested earnings in Singapore7/ – – – – –
Inter-company loans in Singapore7/ – – – – –
Total 653.6 293.7 6,194.0 128.0 3,698.3
Host Country
Source Country BruneiDarussalam
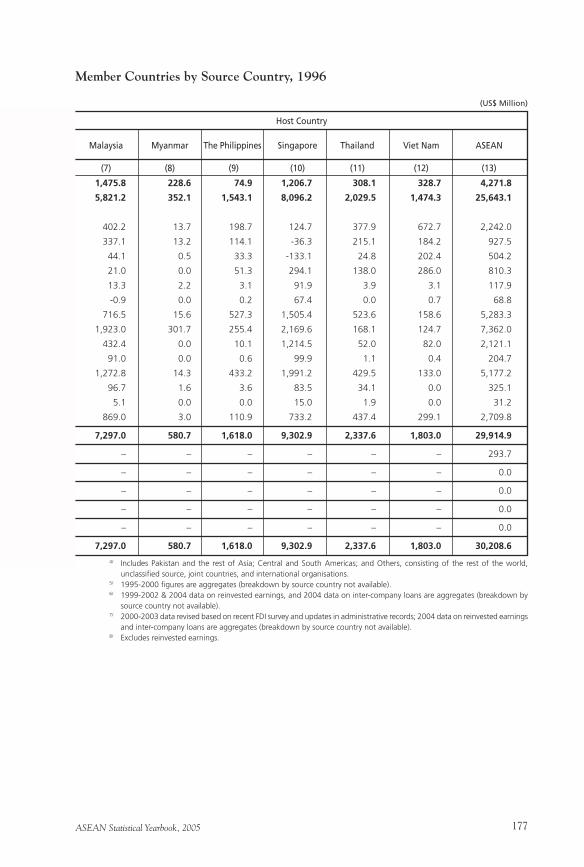
ASEAN Statistical Yearbook, 2005 177
Member Countries by Source Country, 1996
(US$ Million)
Malaysia Myanmar The Philippines Singapore Thailand Viet Nam ASEAN
(7) (8) (9) (10) (11) (12) (13)
1,475.8 228.6 74.9 1,206.7 308.1 328.7 4,271.8
5,821.2 352.1 1,543.1 8,096.2 2,029.5 1,474.3 25,643.1
402.2 13.7 198.7 124.7 377.9 672.7 2,242.0
337.1 13.2 114.1 -36.3 215.1 184.2 927.5
44.1 0.5 33.3 -133.1 24.8 202.4 504.2
21.0 0.0 51.3 294.1 138.0 286.0 810.3
13.3 2.2 3.1 91.9 3.9 3.1 117.9
-0.9 0.0 0.2 67.4 0.0 0.7 68.8
716.5 15.6 527.3 1,505.4 523.6 158.6 5,283.3
1,923.0 301.7 255.4 2,169.6 168.1 124.7 7,362.0
432.4 0.0 10.1 1,214.5 52.0 82.0 2,121.1
91.0 0.0 0.6 99.9 1.1 0.4 204.7
1,272.8 14.3 433.2 1,991.2 429.5 133.0 5,177.2
96.7 1.6 3.6 83.5 34.1 0.0 325.1
5.1 0.0 0.0 15.0 1.9 0.0 31.2
869.0 3.0 110.9 733.2 437.4 299.1 2,709.8
7,297.0 580.7 1,618.0 9,302.9 2,337.6 1,803.0 29,914.9
– – – – – – 293.7
– – – – – – 0.0
– – – – – – 0.0
– – – – – – 0.0
– – – – – – 0.0
7,297.0 580.7 1,618.0 9,302.9 2,337.6 1,803.0 30,208.6
Host Country
4/ Includes Pakistan and the rest of Asia; Central and South Americas; and Others, consisting of the rest of the world, unclassified source, joint countries, and international organisations.
5/ 1995-2000 figures are aggregates (breakdown by source country not available). 6/ 1999-2002 & 2004 data on reinvested earnings, and 2004 data on inter-company loans are aggregates (breakdown by
source country not available). 7/ 2000-2003 data revised based on recent FDI survey and updates in administrative records; 2004 data on reinvested earnings
and inter-company loans are aggregates (breakdown by source country not available). 8/ Excludes reinvested earnings.

ASEAN Statistical Yearbook, 2005178
Table VI.22.3Foreign Direct Investments in ASEAN
Source: ASEAN Secretariat - ASEAN FDI Database, 2005. Compiled from the AMCs’ Balance of Payments data as of October 2005.Notes: p/ Preliminary as of date of compilation. n.a. Not available as of date of compilation. Unless otherwise indicated, the figures include equity, reinvested earnings, and inter-company loans. 1/ Excludes: (a) total FDI in Cambodia (1995-2000); (b) reinvested earnings in Myanmar (1995-2002); (c) reinvested earnings
(1995-2002 & 2004) and inter-company loans in the Philippines (2004); and (d) reinvested earnings (2004) and inter-company loans (1995-1996 & 2004) in Singapore ; includes privatization and asset sales under the Indonesian Bank Restructuring Agency program (2002); figures for Myanmar cover the fiscal year ending in March of the following calendar year.
2/ Includes Austria, Belgium, Denmark, Finland, France, Germany, Greece, Ireland, Italy, Luxembourg, The Netherlands, Portugal, Spain, Sweden, and the United Kingdom.
3/ Refers to the rest of Europe.
Cambodia Indonesia Lao PDR Malaysia8/
(1) (2) (3) (4) (5) (6)
ASEAN1/ 384.9 – 272.5 64.4 1,217.7
REST OF THE WORLD1/ 316.8 – 4,405.5 21.9 1,738.3
Asian NIEs 7.6 – 477.7 5.6 231.9
Hong Kong 6.9 – 232.3 0.0 176.0
South Korea 0.3 – 237.6 5.4 -0.3
Taiwan (ROC) 0.4 – 7.7 0.2 56.2
China 0.0 – 8.0 2.7 23.0
India 1.5 – 13.2 0.1 -0.7
Japan 7.2 – 1,597.2 4.1 490.5
EU-152/ 264.7 – 2,582.3 2.6 211.5
Other EU3/ 0.1 – 419.3 0.0 23.8
Canada 0.0 – 56.1 0.2 19.8
USA 14.1 – -646.3 0.8 619.3
Australia 12.0 – 125.8 4.3 84.1
New Zealand 9.7 – 0.0 0.0 1.4
All OTHERS4/ 0.0 – -227.9 1.7 33.6
Subtotal1/ 701.7 – 4,678.0 86.3 2,956.0
Total FDI in Cambodia5/ – 168.1 – – –
Reinvested earnings in the Philippines6/ – – – – –
Inter-company loans in the Philippines6/ – – – – –
Reinvested earnings in Singapore7/ – – – – –
Inter-company loans in Singapore7/ – – – – –
Total 701.7 168.1 4,678.0 86.3 2,956.0
Host Country
Source Country BruneiDarussalam
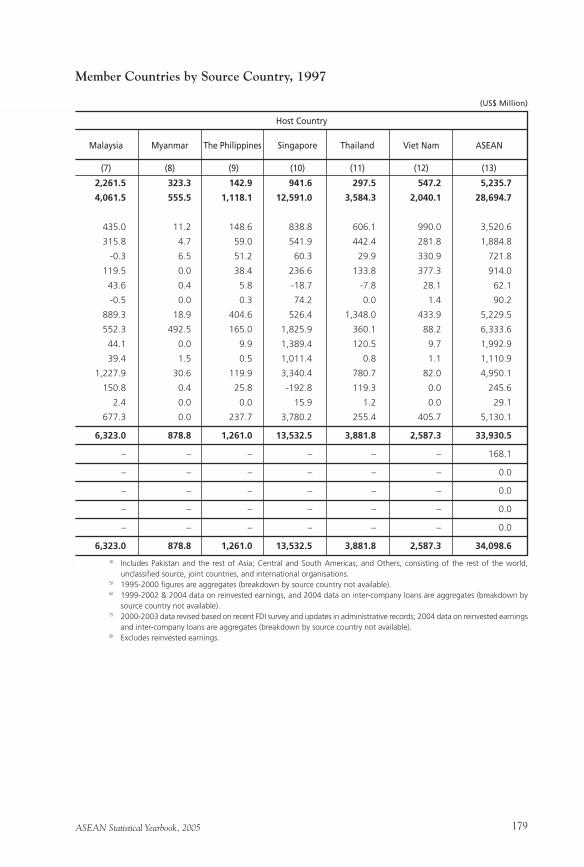
ASEAN Statistical Yearbook, 2005 179
Member Countries by Source Country, 1997
(US$ Million)
Malaysia Myanmar The Philippines Singapore Thailand Viet Nam ASEAN
(7) (8) (9) (10) (11) (12) (13)
2,261.5 323.3 142.9 941.6 297.5 547.2 5,235.7
4,061.5 555.5 1,118.1 12,591.0 3,584.3 2,040.1 28,694.7
435.0 11.2 148.6 838.8 606.1 990.0 3,520.6
315.8 4.7 59.0 541.9 442.4 281.8 1,884.8
-0.3 6.5 51.2 60.3 29.9 330.9 721.8
119.5 0.0 38.4 236.6 133.8 377.3 914.0
43.6 0.4 5.8 -18.7 -7.8 28.1 62.1
-0.5 0.0 0.3 74.2 0.0 1.4 90.2
889.3 18.9 404.6 526.4 1,348.0 433.9 5,229.5
552.3 492.5 165.0 1,825.9 360.1 88.2 6,333.6
44.1 0.0 9.9 1,389.4 120.5 9.7 1,992.9
39.4 1.5 0.5 1,011.4 0.8 1.1 1,110.9
1,227.9 30.6 119.9 3,340.4 780.7 82.0 4,950.1
150.8 0.4 25.8 -192.8 119.3 0.0 245.6
2.4 0.0 0.0 15.9 1.2 0.0 29.1
677.3 0.0 237.7 3,780.2 255.4 405.7 5,130.1
6,323.0 878.8 1,261.0 13,532.5 3,881.8 2,587.3 33,930.5
– – – – – – 168.1
– – – – – – 0.0
– – – – – – 0.0
– – – – – – 0.0
– – – – – – 0.0
6,323.0 878.8 1,261.0 13,532.5 3,881.8 2,587.3 34,098.6
Host Country
4/ Includes Pakistan and the rest of Asia; Central and South Americas; and Others, consisting of the rest of the world, unclassified source, joint countries, and international organisations.
5/ 1995-2000 figures are aggregates (breakdown by source country not available). 6/ 1999-2002 & 2004 data on reinvested earnings, and 2004 data on inter-company loans are aggregates (breakdown by
source country not available). 7/ 2000-2003 data revised based on recent FDI survey and updates in administrative records; 2004 data on reinvested earnings
and inter-company loans are aggregates (breakdown by source country not available). 8/ Excludes reinvested earnings.
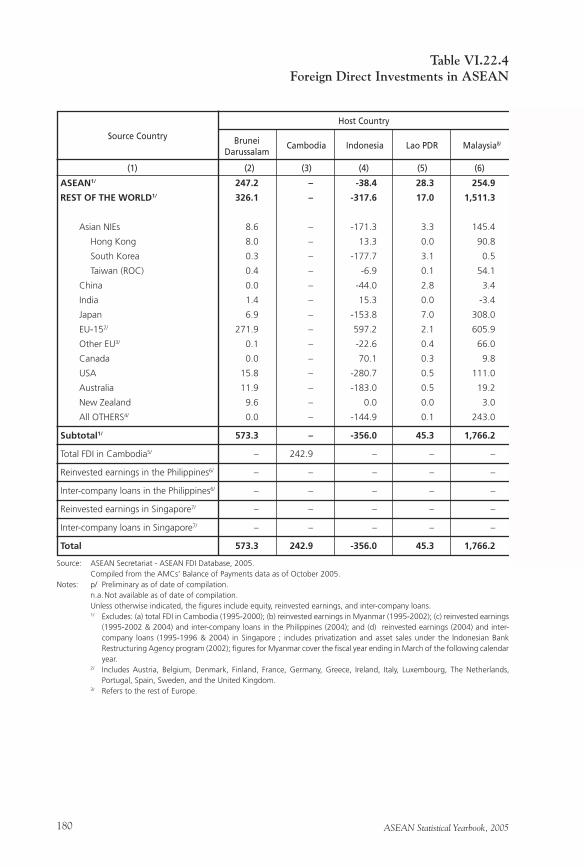
ASEAN Statistical Yearbook, 2005180
Table VI.22.4Foreign Direct Investments in ASEAN
Source: ASEAN Secretariat - ASEAN FDI Database, 2005. Compiled from the AMCs’ Balance of Payments data as of October 2005.Notes: p/ Preliminary as of date of compilation. n.a. Not available as of date of compilation. Unless otherwise indicated, the figures include equity, reinvested earnings, and inter-company loans. 1/ Excludes: (a) total FDI in Cambodia (1995-2000); (b) reinvested earnings in Myanmar (1995-2002); (c) reinvested earnings
(1995-2002 & 2004) and inter-company loans in the Philippines (2004); and (d) reinvested earnings (2004) and inter-company loans (1995-1996 & 2004) in Singapore ; includes privatization and asset sales under the Indonesian Bank Restructuring Agency program (2002); figures for Myanmar cover the fiscal year ending in March of the following calendar year.
2/ Includes Austria, Belgium, Denmark, Finland, France, Germany, Greece, Ireland, Italy, Luxembourg, The Netherlands, Portugal, Spain, Sweden, and the United Kingdom.
3/ Refers to the rest of Europe.
Cambodia Indonesia Lao PDR Malaysia8/
(1) (2) (3) (4) (5) (6)
ASEAN1/ 247.2 – -38.4 28.3 254.9
REST OF THE WORLD1/ 326.1 – -317.6 17.0 1,511.3
Asian NIEs 8.6 – -171.3 3.3 145.4
Hong Kong 8.0 – 13.3 0.0 90.8
South Korea 0.3 – -177.7 3.1 0.5
Taiwan (ROC) 0.4 – -6.9 0.1 54.1
China 0.0 – -44.0 2.8 3.4
India 1.4 – 15.3 0.0 -3.4
Japan 6.9 – -153.8 7.0 308.0
EU-152/ 271.9 – 597.2 2.1 605.9
Other EU3/ 0.1 – -22.6 0.4 66.0
Canada 0.0 – 70.1 0.3 9.8
USA 15.8 – -280.7 0.5 111.0
Australia 11.9 – -183.0 0.5 19.2
New Zealand 9.6 – 0.0 0.0 3.0
All OTHERS4/ 0.0 – -144.9 0.1 243.0
Subtotal1/ 573.3 – -356.0 45.3 1,766.2
Total FDI in Cambodia5/ – 242.9 – – –
Reinvested earnings in the Philippines6/ – – – – –
Inter-company loans in the Philippines6/ – – – – –
Reinvested earnings in Singapore7/ – – – – –
Inter-company loans in Singapore7/ – – – – –
Total 573.3 242.9 -356.0 45.3 1,766.2
Host Country
Source Country BruneiDarussalam
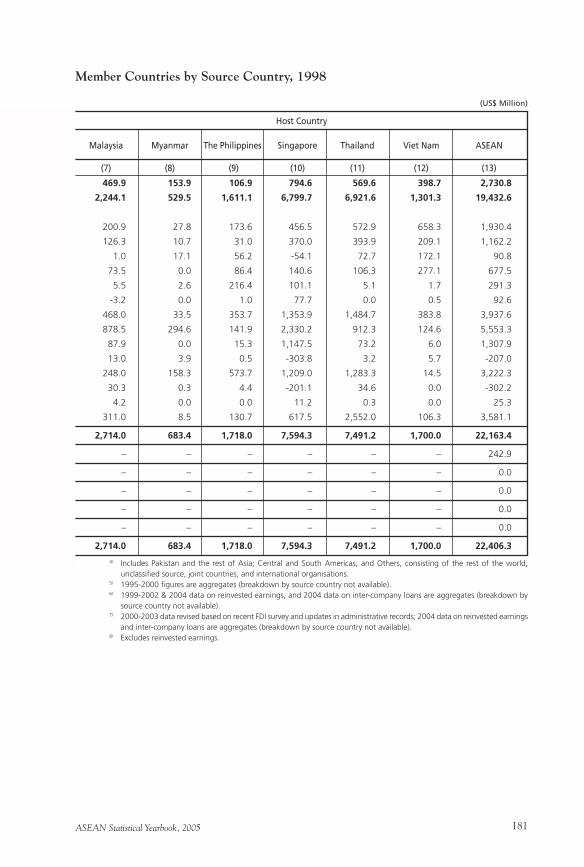
ASEAN Statistical Yearbook, 2005 181
Member Countries by Source Country, 1998
(US$ Million)
Malaysia Myanmar The Philippines Singapore Thailand Viet Nam ASEAN
(7) (8) (9) (10) (11) (12) (13)
469.9 153.9 106.9 794.6 569.6 398.7 2,730.8
2,244.1 529.5 1,611.1 6,799.7 6,921.6 1,301.3 19,432.6
200.9 27.8 173.6 456.5 572.9 658.3 1,930.4
126.3 10.7 31.0 370.0 393.9 209.1 1,162.2
1.0 17.1 56.2 -54.1 72.7 172.1 90.8
73.5 0.0 86.4 140.6 106.3 277.1 677.5
5.5 2.6 216.4 101.1 5.1 1.7 291.3
-3.2 0.0 1.0 77.7 0.0 0.5 92.6
468.0 33.5 353.7 1,353.9 1,484.7 383.8 3,937.6
878.5 294.6 141.9 2,330.2 912.3 124.6 5,553.3
87.9 0.0 15.3 1,147.5 73.2 6.0 1,307.9
13.0 3.9 0.5 -303.8 3.2 5.7 -207.0
248.0 158.3 573.7 1,209.0 1,283.3 14.5 3,222.3
30.3 0.3 4.4 -201.1 34.6 0.0 -302.2
4.2 0.0 0.0 11.2 0.3 0.0 25.3
311.0 8.5 130.7 617.5 2,552.0 106.3 3,581.1
2,714.0 683.4 1,718.0 7,594.3 7,491.2 1,700.0 22,163.4
– – – – – – 242.9
– – – – – – 0.0
– – – – – – 0.0
– – – – – – 0.0
– – – – – – 0.0
2,714.0 683.4 1,718.0 7,594.3 7,491.2 1,700.0 22,406.3
Host Country
4/ Includes Pakistan and the rest of Asia; Central and South Americas; and Others, consisting of the rest of the world, unclassified source, joint countries, and international organisations.
5/ 1995-2000 figures are aggregates (breakdown by source country not available). 6/ 1999-2002 & 2004 data on reinvested earnings, and 2004 data on inter-company loans are aggregates (breakdown by
source country not available). 7/ 2000-2003 data revised based on recent FDI survey and updates in administrative records; 2004 data on reinvested earnings
and inter-company loans are aggregates (breakdown by source country not available). 8/ Excludes reinvested earnings.
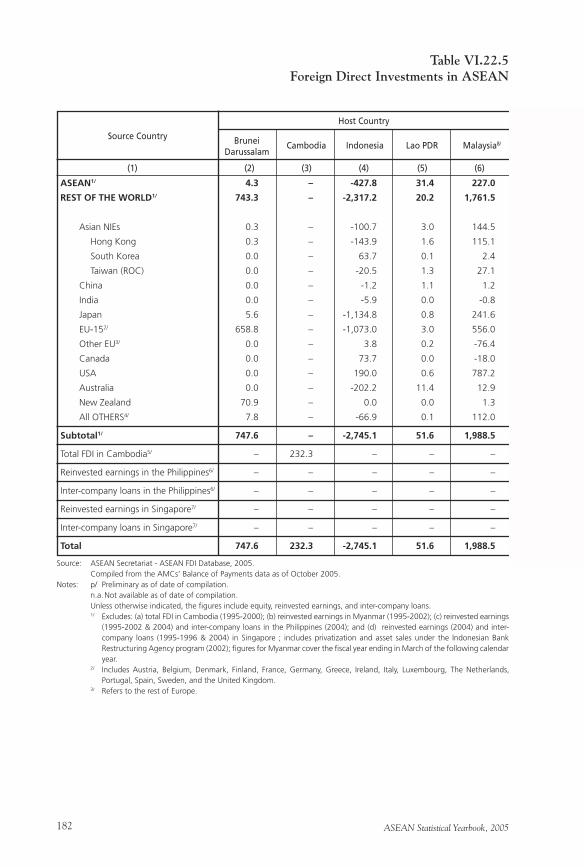
ASEAN Statistical Yearbook, 2005182
Table VI.22.5Foreign Direct Investments in ASEAN
Source: ASEAN Secretariat - ASEAN FDI Database, 2005. Compiled from the AMCs’ Balance of Payments data as of October 2005.Notes: p/ Preliminary as of date of compilation. n.a. Not available as of date of compilation. Unless otherwise indicated, the figures include equity, reinvested earnings, and inter-company loans. 1/ Excludes: (a) total FDI in Cambodia (1995-2000); (b) reinvested earnings in Myanmar (1995-2002); (c) reinvested earnings
(1995-2002 & 2004) and inter-company loans in the Philippines (2004); and (d) reinvested earnings (2004) and inter-company loans (1995-1996 & 2004) in Singapore ; includes privatization and asset sales under the Indonesian Bank Restructuring Agency program (2002); figures for Myanmar cover the fiscal year ending in March of the following calendar year.
2/ Includes Austria, Belgium, Denmark, Finland, France, Germany, Greece, Ireland, Italy, Luxembourg, The Netherlands, Portugal, Spain, Sweden, and the United Kingdom.
3/ Refers to the rest of Europe.
Cambodia Indonesia Lao PDR Malaysia8/
(1) (2) (3) (4) (5) (6)
ASEAN1/ 4.3 – -427.8 31.4 227.0
REST OF THE WORLD1/ 743.3 – -2,317.2 20.2 1,761.5
Asian NIEs 0.3 – -100.7 3.0 144.5
Hong Kong 0.3 – -143.9 1.6 115.1
South Korea 0.0 – 63.7 0.1 2.4
Taiwan (ROC) 0.0 – -20.5 1.3 27.1
China 0.0 – -1.2 1.1 1.2
India 0.0 – -5.9 0.0 -0.8
Japan 5.6 – -1,134.8 0.8 241.6
EU-152/ 658.8 – -1,073.0 3.0 556.0
Other EU3/ 0.0 – 3.8 0.2 -76.4
Canada 0.0 – 73.7 0.0 -18.0
USA 0.0 – 190.0 0.6 787.2
Australia 0.0 – -202.2 11.4 12.9
New Zealand 70.9 – 0.0 0.0 1.3
All OTHERS4/ 7.8 – -66.9 0.1 112.0
Subtotal1/ 747.6 – -2,745.1 51.6 1,988.5
Total FDI in Cambodia5/ – 232.3 – – –
Reinvested earnings in the Philippines6/ – – – – –
Inter-company loans in the Philippines6/ – – – – –
Reinvested earnings in Singapore7/ – – – – –
Inter-company loans in Singapore7/ – – – – –
Total 747.6 232.3 -2,745.1 51.6 1,988.5
Host Country
Source Country BruneiDarussalam
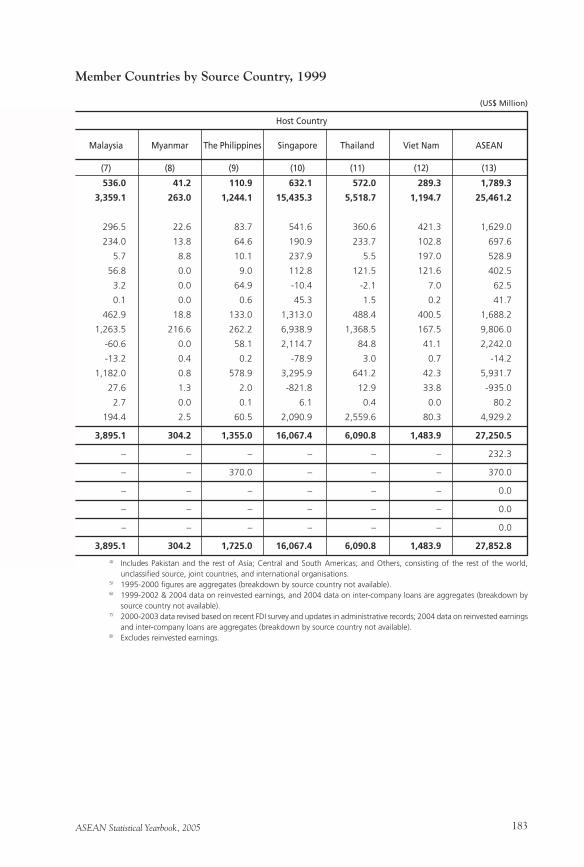
ASEAN Statistical Yearbook, 2005 183
Member Countries by Source Country, 1999
(US$ Million)
Malaysia Myanmar The Philippines Singapore Thailand Viet Nam ASEAN
(7) (8) (9) (10) (11) (12) (13)
536.0 41.2 110.9 632.1 572.0 289.3 1,789.3
3,359.1 263.0 1,244.1 15,435.3 5,518.7 1,194.7 25,461.2
296.5 22.6 83.7 541.6 360.6 421.3 1,629.0
234.0 13.8 64.6 190.9 233.7 102.8 697.6
5.7 8.8 10.1 237.9 5.5 197.0 528.9
56.8 0.0 9.0 112.8 121.5 121.6 402.5
3.2 0.0 64.9 -10.4 -2.1 7.0 62.5
0.1 0.0 0.6 45.3 1.5 0.2 41.7
462.9 18.8 133.0 1,313.0 488.4 400.5 1,688.2
1,263.5 216.6 262.2 6,938.9 1,368.5 167.5 9,806.0
-60.6 0.0 58.1 2,114.7 84.8 41.1 2,242.0
-13.2 0.4 0.2 -78.9 3.0 0.7 -14.2
1,182.0 0.8 578.9 3,295.9 641.2 42.3 5,931.7
27.6 1.3 2.0 -821.8 12.9 33.8 -935.0
2.7 0.0 0.1 6.1 0.4 0.0 80.2
194.4 2.5 60.5 2,090.9 2,559.6 80.3 4,929.2
3,895.1 304.2 1,355.0 16,067.4 6,090.8 1,483.9 27,250.5
– – – – – – 232.3
– – 370.0 – – – 370.0
– – – – – – 0.0
– – – – – – 0.0
– – – – – – 0.0
3,895.1 304.2 1,725.0 16,067.4 6,090.8 1,483.9 27,852.8
Host Country
4/ Includes Pakistan and the rest of Asia; Central and South Americas; and Others, consisting of the rest of the world, unclassified source, joint countries, and international organisations.
5/ 1995-2000 figures are aggregates (breakdown by source country not available). 6/ 1999-2002 & 2004 data on reinvested earnings, and 2004 data on inter-company loans are aggregates (breakdown by
source country not available). 7/ 2000-2003 data revised based on recent FDI survey and updates in administrative records; 2004 data on reinvested earnings
and inter-company loans are aggregates (breakdown by source country not available). 8/ Excludes reinvested earnings.

ASEAN Statistical Yearbook, 2005184
Table VI.22.6Foreign Direct Investments in ASEAN
Source: ASEAN Secretariat - ASEAN FDI Database, 2005. Compiled from the AMCs’ Balance of Payments data as of October 2005.Notes: p/ Preliminary as of date of compilation. n.a. Not available as of date of compilation. Unless otherwise indicated, the figures include equity, reinvested earnings, and inter-company loans. 1/ Excludes: (a) total FDI in Cambodia (1995-2000); (b) reinvested earnings in Myanmar (1995-2002); (c) reinvested earnings
(1995-2002 & 2004) and inter-company loans in the Philippines (2004); and (d) reinvested earnings (2004) and inter-company loans (1995-1996 & 2004) in Singapore ; includes privatization and asset sales under the Indonesian Bank Restructuring Agency program (2002); figures for Myanmar cover the fiscal year ending in March of the following calendar year.
2/ Includes Austria, Belgium, Denmark, Finland, France, Germany, Greece, Ireland, Italy, Luxembourg, The Netherlands, Portugal, Spain, Sweden, and the United Kingdom.
3/ Refers to the rest of Europe.
Cambodia Indonesia Lao PDR Malaysia8/
(1) (2) (3) (4) (5) (6)
ASEAN1/ 10.6 – -232.6 13.7 -111.6
REST OF THE WORLD1/ 538.6 – -4,317.4 20.3 897.6
Asian NIEs 0.3 – -70.7 1.5 20.8
Hong Kong 0.0 – -122.2 0.1 80.4
South Korea 0.0 – 56.4 0.1 -35.1
Taiwan (ROC) 0.3 – -4.9 1.3 -24.4
China 0.0 – -2.8 9.1 -1.0
India 0.2 – -15.9 0.1 -0.7
Japan 5.4 – -1,717.4 1.6 41.7
EU-152/ 526.1 – -1,094.5 3.8 378.3
Other EU3/ 0.1 – -201.4 0.4 -13.3
Canada 0.0 – 43.4 0.1 5.6
USA 0.0 – -1,178.7 0.0 500.9
Australia 0.1 – -108.2 3.6 -2.0
New Zealand 0.0 – 0.0 0.0 8.9
All OTHERS4/ 6.4 – 28.6 0.0 -41.6
Subtotal1/ 549.2 – -4,550.0 34.0 786.1
Total FDI in Cambodia5/ – 148.5 – – –
Reinvested earnings in the Philippines6/ – – – – –
Inter-company loans in the Philippines6/ – – – – –
Reinvested earnings in Singapore7/ – – – – –
Inter-company loans in Singapore7/ – – – – –
Total 549.2 148.5 -4,550.0 34.0 786.1
Host Country
Source Country BruneiDarussalam

ASEAN Statistical Yearbook, 2005 185
Member Countries by Source Country, 2000
(US$ Million)
Malaysia Myanmar The Philippines Singapore Thailand Viet Nam ASEAN
(7) (8) (9) (10) (11) (12) (13)
258.1 74.0 126.5 -78.8 389.0 202.4 763.1
3,529.5 134.0 1,392.5 16,564.2 2,961.2 1,086.3 21,909.1
315.6 9.0 49.2 252.6 486.6 415.6 1,459.8
294.5 4.5 45.9 471.8 331.3 103.1 1,128.9
-32.2 4.5 0.0 -151.7 -3.7 81.6 -45.0
53.4 0.0 3.4 -67.5 159.0 230.9 375.9
0.7 0.0 0.0 -168.6 7.2 21.0 -133.4
0.1 0.0 0.0 91.0 1.8 2.2 79.5
430.2 16.3 49.2 660.6 869.9 139.2 455.0
1,290.1 69.0 580.8 11,408.7 509.6 185.9 13,479.6
0.5 0.0 2.6 308.1 56.2 194.2 360.6
10.6 1.1 0.0 -470.4 9.5 8.1 -397.6
1,266.6 36.4 600.3 5,899.6 617.6 69.7 7,311.6
26.0 1.9 0.0 -268.1 26.6 15.2 -302.8
29.8 0.0 0.4 11.3 0.2 1.4 43.1
159.2 0.3 110.1 -1,160.6 376.1 33.8 -446.1
3,787.6 208.0 1,519.0 16,485.4 3,350.3 1,288.7 22,672.2
– – – – – – 148.5
– – -174.0 – – – -174.0
– – – – – – 0.0
– – – – – – 0.0
– – – – – – 0.0
3,787.6 208.0 1,345.0 16,485.4 3,350.3 1,288.7 22,646.7
Host Country
4/ Includes Pakistan and the rest of Asia; Central and South Americas; and Others, consisting of the rest of the world, unclassified source, joint countries, and international organisations.
5/ 1995-2000 figures are aggregates (breakdown by source country not available). 6/ 1999-2002 & 2004 data on reinvested earnings, and 2004 data on inter-company loans are aggregates (breakdown by
source country not available). 7/ 2000-2003 data revised based on recent FDI survey and updates in administrative records; 2004 data on reinvested earnings
and inter-company loans are aggregates (breakdown by source country not available). 8/ Excludes reinvested earnings.

ASEAN Statistical Yearbook, 2005186
Table VI.22.7Foreign Direct Investments in ASEAN
Source: ASEAN Secretariat - ASEAN FDI Database, 2005. Compiled from the AMCs’ Balance of Payments data as of October 2005.Notes: p/ Preliminary as of date of compilation. n.a. Not available as of date of compilation. Unless otherwise indicated, the figures include equity, reinvested earnings, and inter-company loans. 1/ Excludes: (a) reinvested earnings in Myanmar (1995-2002); (b) reinvested earnings (1995-2002 & 2004) and inter-company
loans in the Philippines (2004); and (c) reinvested earnings (2004) and inter-company loans (1995-1996 & 2004) in Singapore ; includes privatization and asset sales under the Indonesian Bank Restructuring Agency program (2002); figures for Myanmar cover the fiscal year ending in March of the following calendar year.
2/ Includes Austria, Belgium, Denmark, Finland, France, Germany, Greece, Ireland, Italy, Luxembourg, The Netherlands, Portugal, Spain, Sweden, and the United Kingdom.
3/ Refers to the rest of Europe.
Cambodia Indonesia Lao PDR Malaysia8/
(1) (2) (3) (4) (5) (6)
ASEAN1/ 10.6 37.2 -240.0 3.1 -804.8
REST OF THE WORLD1/ 515.8 112.2 -3,038.5 20.8 -1,132.5
Asian NIEs 1.4 69.9 -471.1 4.2 -685.5
Hong Kong 0.4 8.0 -177.7 0.1 -576.4
South Korea 0.0 2.2 -286.0 1.0 -88.4
Taiwan (ROC) 1.0 59.8 -7.5 3.1 -20.7
China 0.0 2.9 -1.5 11.8 12.2
India 0.3 0.0 -17.6 0.0 -2.5
Japan 4.3 -2.2 -1,101.5 0.6 -715.9
EU-152/ 504.5 9.8 -462.2 2.1 -331.9
Other EU3/ 0.2 0.0 52.1 0.1 -197.4
Canada 0.0 5.0 -21.0 0.0 -204.2
USA 0.0 1.3 -891.8 0.1 1,936.7
Australia 0.0 -2.6 -148.7 1.9 -79.4
New Zealand 0.0 0.0 0.0 0.0 -2.2
All OTHERS4/ 5.2 27.9 24.6 0.0 -862.5
Subtotal1/ 526.4 149.4 -3,278.5 23.9 -1,937.4
Total FDI in Cambodia5/ – – – – –
Reinvested earnings in the Philippines6/ – – – – –
Inter-company loans in the Philippines6/ – – – – –
Reinvested earnings in Singapore7/ – – – – –
Inter-company loans in Singapore7/ – – – – –
Total 526.4 149.4 -3,278.5 23.9 -1,937.4
Host Country
Source Country BruneiDarussalam
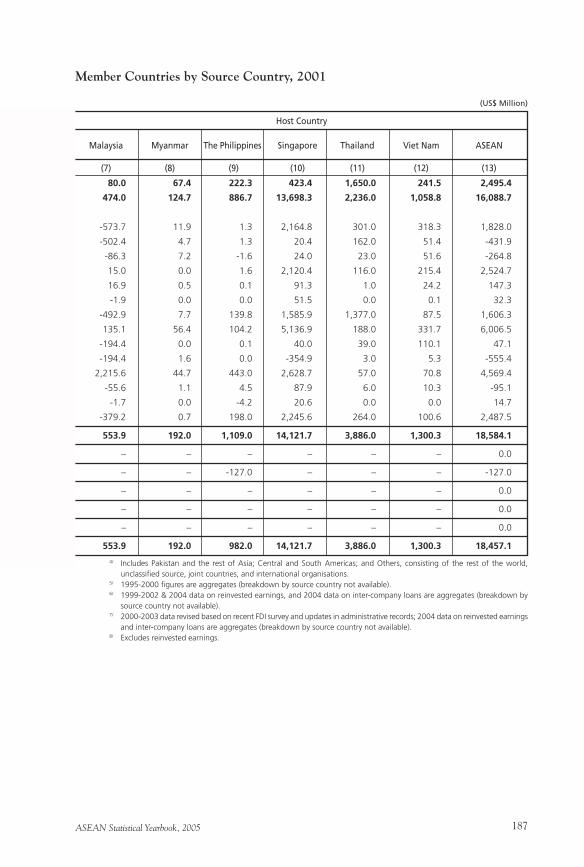
ASEAN Statistical Yearbook, 2005 187
Member Countries by Source Country, 2001
(US$ Million)
Malaysia Myanmar The Philippines Singapore Thailand Viet Nam ASEAN
(7) (8) (9) (10) (11) (12) (13)
80.0 67.4 222.3 423.4 1,650.0 241.5 2,495.4
474.0 124.7 886.7 13,698.3 2,236.0 1,058.8 16,088.7
-573.7 11.9 1.3 2,164.8 301.0 318.3 1,828.0
-502.4 4.7 1.3 20.4 162.0 51.4 -431.9
-86.3 7.2 -1.6 24.0 23.0 51.6 -264.8
15.0 0.0 1.6 2,120.4 116.0 215.4 2,524.7
16.9 0.5 0.1 91.3 1.0 24.2 147.3
-1.9 0.0 0.0 51.5 0.0 0.1 32.3
-492.9 7.7 139.8 1,585.9 1,377.0 87.5 1,606.3
135.1 56.4 104.2 5,136.9 188.0 331.7 6,006.5
-194.4 0.0 0.1 40.0 39.0 110.1 47.1
-194.4 1.6 0.0 -354.9 3.0 5.3 -555.4
2,215.6 44.7 443.0 2,628.7 57.0 70.8 4,569.4
-55.6 1.1 4.5 87.9 6.0 10.3 -95.1
-1.7 0.0 -4.2 20.6 0.0 0.0 14.7
-379.2 0.7 198.0 2,245.6 264.0 100.6 2,487.5
553.9 192.0 1,109.0 14,121.7 3,886.0 1,300.3 18,584.1
– – – – – – 0.0
– – -127.0 – – – -127.0
– – – – – – 0.0
– – – – – – 0.0
– – – – – – 0.0
553.9 192.0 982.0 14,121.7 3,886.0 1,300.3 18,457.1
Host Country
4/ Includes Pakistan and the rest of Asia; Central and South Americas; and Others, consisting of the rest of the world, unclassified source, joint countries, and international organisations.
5/ 1995-2000 figures are aggregates (breakdown by source country not available). 6/ 1999-2002 & 2004 data on reinvested earnings, and 2004 data on inter-company loans are aggregates (breakdown by
source country not available). 7/ 2000-2003 data revised based on recent FDI survey and updates in administrative records; 2004 data on reinvested earnings
and inter-company loans are aggregates (breakdown by source country not available). 8/ Excludes reinvested earnings.
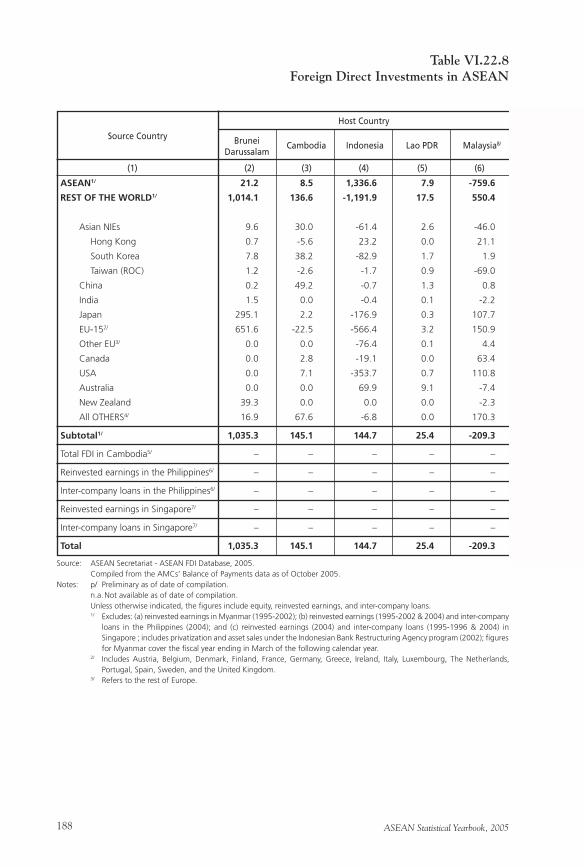
ASEAN Statistical Yearbook, 2005188
Table VI.22.8Foreign Direct Investments in ASEAN
Source: ASEAN Secretariat - ASEAN FDI Database, 2005. Compiled from the AMCs’ Balance of Payments data as of October 2005.Notes: p/ Preliminary as of date of compilation. n.a. Not available as of date of compilation. Unless otherwise indicated, the figures include equity, reinvested earnings, and inter-company loans. 1/ Excludes: (a) reinvested earnings in Myanmar (1995-2002); (b) reinvested earnings (1995-2002 & 2004) and inter-company
loans in the Philippines (2004); and (c) reinvested earnings (2004) and inter-company loans (1995-1996 & 2004) in Singapore ; includes privatization and asset sales under the Indonesian Bank Restructuring Agency program (2002); figures for Myanmar cover the fiscal year ending in March of the following calendar year.
2/ Includes Austria, Belgium, Denmark, Finland, France, Germany, Greece, Ireland, Italy, Luxembourg, The Netherlands, Portugal, Spain, Sweden, and the United Kingdom.
3/ Refers to the rest of Europe.
Cambodia Indonesia Lao PDR Malaysia8/
(1) (2) (3) (4) (5) (6)
ASEAN1/ 21.2 8.5 1,336.6 7.9 -759.6
REST OF THE WORLD1/ 1,014.1 136.6 -1,191.9 17.5 550.4
Asian NIEs 9.6 30.0 -61.4 2.6 -46.0
Hong Kong 0.7 -5.6 23.2 0.0 21.1
South Korea 7.8 38.2 -82.9 1.7 1.9
Taiwan (ROC) 1.2 -2.6 -1.7 0.9 -69.0
China 0.2 49.2 -0.7 1.3 0.8
India 1.5 0.0 -0.4 0.1 -2.2
Japan 295.1 2.2 -176.9 0.3 107.7
EU-152/ 651.6 -22.5 -566.4 3.2 150.9
Other EU3/ 0.0 0.0 -76.4 0.1 4.4
Canada 0.0 2.8 -19.1 0.0 63.4
USA 0.0 7.1 -353.7 0.7 110.8
Australia 0.0 0.0 69.9 9.1 -7.4
New Zealand 39.3 0.0 0.0 0.0 -2.3
All OTHERS4/ 16.9 67.6 -6.8 0.0 170.3
Subtotal1/ 1,035.3 145.1 144.7 25.4 -209.3
Total FDI in Cambodia5/ – – – – –
Reinvested earnings in the Philippines6/ – – – – –
Inter-company loans in the Philippines6/ – – – – –
Reinvested earnings in Singapore7/ – – – – –
Inter-company loans in Singapore7/ – – – – –
Total 1,035.3 145.1 144.7 25.4 -209.3
Host Country
Source Country BruneiDarussalam
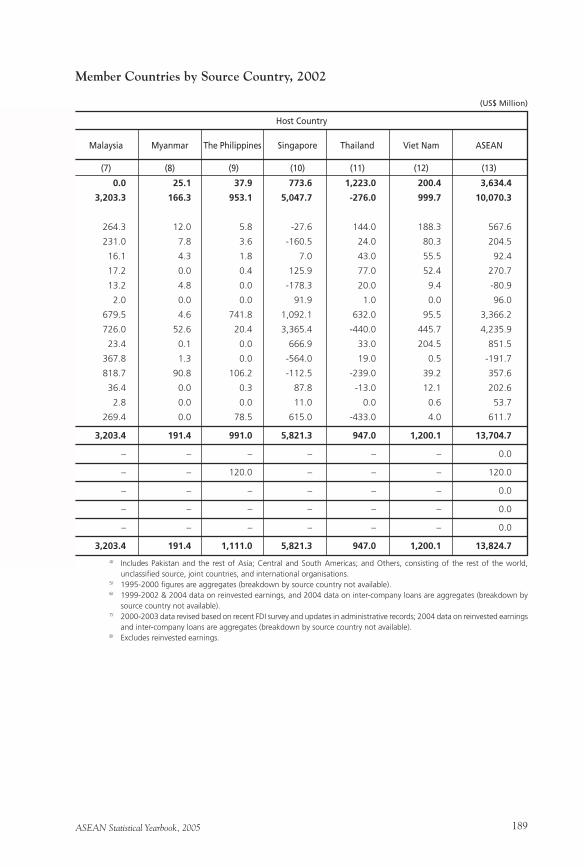
ASEAN Statistical Yearbook, 2005 189
Member Countries by Source Country, 2002
(US$ Million)
Malaysia Myanmar The Philippines Singapore Thailand Viet Nam ASEAN
(7) (8) (9) (10) (11) (12) (13)
0.0 25.1 37.9 773.6 1,223.0 200.4 3,634.4
3,203.3 166.3 953.1 5,047.7 -276.0 999.7 10,070.3
264.3 12.0 5.8 -27.6 144.0 188.3 567.6
231.0 7.8 3.6 -160.5 24.0 80.3 204.5
16.1 4.3 1.8 7.0 43.0 55.5 92.4
17.2 0.0 0.4 125.9 77.0 52.4 270.7
13.2 4.8 0.0 -178.3 20.0 9.4 -80.9
2.0 0.0 0.0 91.9 1.0 0.0 96.0
679.5 4.6 741.8 1,092.1 632.0 95.5 3,366.2
726.0 52.6 20.4 3,365.4 -440.0 445.7 4,235.9
23.4 0.1 0.0 666.9 33.0 204.5 851.5
367.8 1.3 0.0 -564.0 19.0 0.5 -191.7
818.7 90.8 106.2 -112.5 -239.0 39.2 357.6
36.4 0.0 0.3 87.8 -13.0 12.1 202.6
2.8 0.0 0.0 11.0 0.0 0.6 53.7
269.4 0.0 78.5 615.0 -433.0 4.0 611.7
3,203.4 191.4 991.0 5,821.3 947.0 1,200.1 13,704.7
– – – – – – 0.0
– – 120.0 – – – 120.0
– – – – – – 0.0
– – – – – – 0.0
– – – – – – 0.0
3,203.4 191.4 1,111.0 5,821.3 947.0 1,200.1 13,824.7
Host Country
4/ Includes Pakistan and the rest of Asia; Central and South Americas; and Others, consisting of the rest of the world, unclassified source, joint countries, and international organisations.
5/ 1995-2000 figures are aggregates (breakdown by source country not available). 6/ 1999-2002 & 2004 data on reinvested earnings, and 2004 data on inter-company loans are aggregates (breakdown by
source country not available). 7/ 2000-2003 data revised based on recent FDI survey and updates in administrative records; 2004 data on reinvested earnings
and inter-company loans are aggregates (breakdown by source country not available). 8/ Excludes reinvested earnings.

ASEAN Statistical Yearbook, 2005190
Table VI.22.9Foreign Direct Investments in ASEAN
Source: ASEAN Secretariat - ASEAN FDI Database, 2005. Compiled from the AMCs’ Balance of Payments data as of October 2005.Notes: p/ Preliminary as of date of compilation. n.a. Not available as of date of compilation. Unless otherwise indicated, the figures include equity, reinvested earnings, and inter-company loans. 1/ Excludes: (a) reinvested earnings in Myanmar (1995-2002); (b) reinvested earnings (1995-2002 & 2004) and inter-company
loans in the Philippines (2004); and (c) reinvested earnings (2004) and inter-company loans (1995-1996 & 2004) in Singapore ; includes privatization and asset sales under the Indonesian Bank Restructuring Agency program (2002); figures for Myanmar cover the fiscal year ending in March of the following calendar year.
2/ Includes Austria, Belgium, Denmark, Finland, France, Germany, Greece, Ireland, Italy, Luxembourg, The Netherlands, Portugal, Spain, Sweden, and the United Kingdom.
3/ Refers to the rest of Europe.
Cambodia Indonesia Lao PDR Malaysia8/
(1) (2) (3) (4) (5) (6)
ASEAN1/ 36.8 19.9 384.0 3.0 -5.3
REST OF THE WORLD1/ 3,086.2 64.1 -979.5 16.5 -353.4
Asian NIEs 5.2 6.2 -30.0 0.6 32.5
Hong Kong 3.4 5.5 -79.3 0.1 26.9
South Korea 1.4 1.0 47.7 0.4 1.1
Taiwan (ROC) 0.5 -0.3 1.6 0.1 4.5
China 0.2 26.2 -0.4 1.7 0.0
India 0.6 0.0 -5.3 0.4 -1.4
Japan 4.5 0.0 -604.3 2.3 7.6
EU-152/ 2,986.9 1.2 -207.4 1.7 -305.5
Other EU3/ 0.5 0.0 -22.7 0.1 71.7
Canada 0.3 0.0 -52.2 0.0 -3.4
USA 0.1 0.0 -52.2 0.7 -107.9
Australia 0.0 0.8 28.7 8.8 -16.9
New Zealand 86.8 0.0 0.0 0.0 0.0
All OTHERS4/ 1.1 29.7 -33.8 0.0 -30.2
Subtotal1/ 3,123.0 84.0 -595.6 19.5 -358.7
Total FDI in Cambodia5/ – – – – –
Reinvested earnings in the Philippines6/ – – – – –
Inter-company loans in the Philippines6/ – – – – –
Reinvested earnings in Singapore7/ – – – – –
Inter-company loans in Singapore7/ – – – – –
Total 3,123.0 84.0 -595.6 19.5 -358.7
Host Country
Source Country BruneiDarussalam
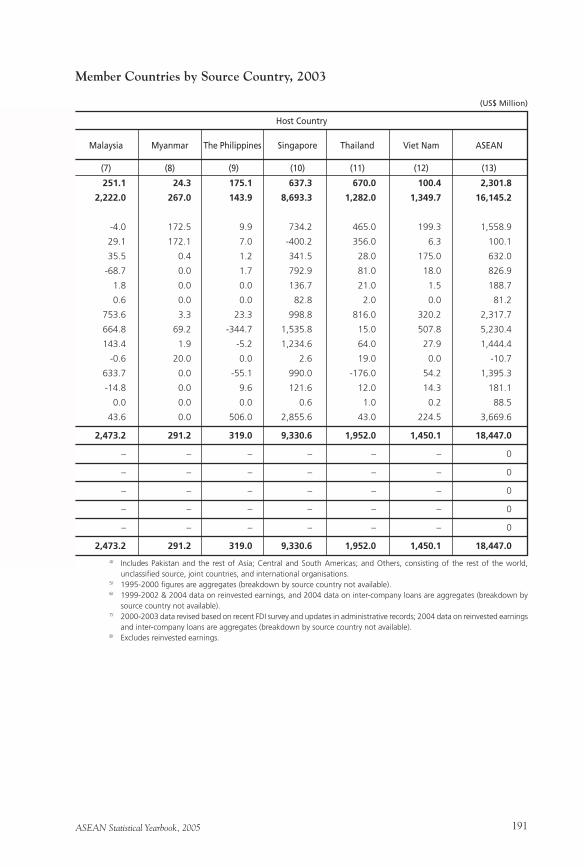
ASEAN Statistical Yearbook, 2005 191
Member Countries by Source Country, 2003
(US$ Million)
Malaysia Myanmar The Philippines Singapore Thailand Viet Nam ASEAN
(7) (8) (9) (10) (11) (12) (13)
251.1 24.3 175.1 637.3 670.0 100.4 2,301.8
2,222.0 267.0 143.9 8,693.3 1,282.0 1,349.7 16,145.2
-4.0 172.5 9.9 734.2 465.0 199.3 1,558.9
29.1 172.1 7.0 -400.2 356.0 6.3 100.1
35.5 0.4 1.2 341.5 28.0 175.0 632.0
-68.7 0.0 1.7 792.9 81.0 18.0 826.9
1.8 0.0 0.0 136.7 21.0 1.5 188.7
0.6 0.0 0.0 82.8 2.0 0.0 81.2
753.6 3.3 23.3 998.8 816.0 320.2 2,317.7
664.8 69.2 -344.7 1,535.8 15.0 507.8 5,230.4
143.4 1.9 -5.2 1,234.6 64.0 27.9 1,444.4
-0.6 20.0 0.0 2.6 19.0 0.0 -10.7
633.7 0.0 -55.1 990.0 -176.0 54.2 1,395.3
-14.8 0.0 9.6 121.6 12.0 14.3 181.1
0.0 0.0 0.0 0.6 1.0 0.2 88.5
43.6 0.0 506.0 2,855.6 43.0 224.5 3,669.6
2,473.2 291.2 319.0 9,330.6 1,952.0 1,450.1 18,447.0
– – – – – – 0
– – – – – – 0
– – – – – – 0
– – – – – – 0
– – – – – – 0
2,473.2 291.2 319.0 9,330.6 1,952.0 1,450.1 18,447.0
Host Country
4/ Includes Pakistan and the rest of Asia; Central and South Americas; and Others, consisting of the rest of the world, unclassified source, joint countries, and international organisations.
5/ 1995-2000 figures are aggregates (breakdown by source country not available). 6/ 1999-2002 & 2004 data on reinvested earnings, and 2004 data on inter-company loans are aggregates (breakdown by
source country not available). 7/ 2000-2003 data revised based on recent FDI survey and updates in administrative records; 2004 data on reinvested earnings
and inter-company loans are aggregates (breakdown by source country not available). 8/ Excludes reinvested earnings.
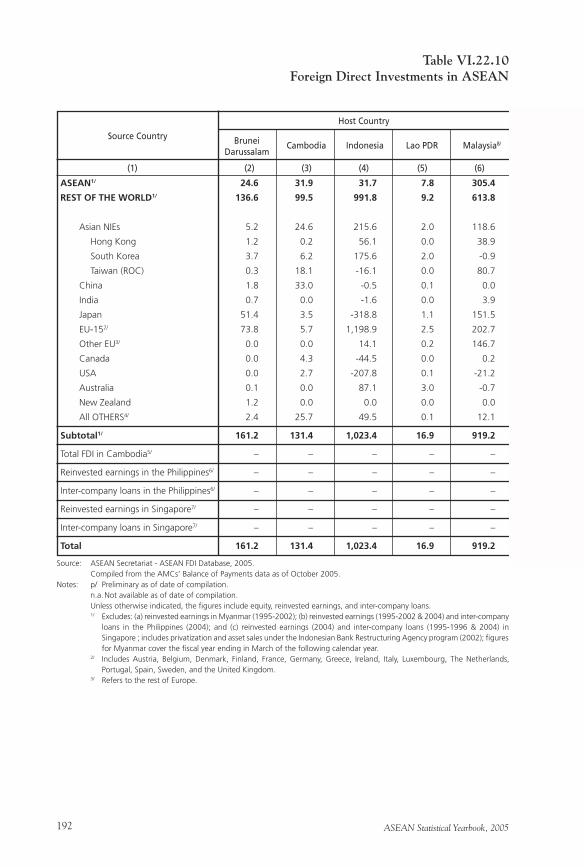
ASEAN Statistical Yearbook, 2005192
Table VI.22.10Foreign Direct Investments in ASEAN
Source: ASEAN Secretariat - ASEAN FDI Database, 2005. Compiled from the AMCs’ Balance of Payments data as of October 2005.Notes: p/ Preliminary as of date of compilation. n.a. Not available as of date of compilation. Unless otherwise indicated, the figures include equity, reinvested earnings, and inter-company loans. 1/ Excludes: (a) reinvested earnings in Myanmar (1995-2002); (b) reinvested earnings (1995-2002 & 2004) and inter-company
loans in the Philippines (2004); and (c) reinvested earnings (2004) and inter-company loans (1995-1996 & 2004) in Singapore ; includes privatization and asset sales under the Indonesian Bank Restructuring Agency program (2002); figures for Myanmar cover the fiscal year ending in March of the following calendar year.
2/ Includes Austria, Belgium, Denmark, Finland, France, Germany, Greece, Ireland, Italy, Luxembourg, The Netherlands, Portugal, Spain, Sweden, and the United Kingdom.
3/ Refers to the rest of Europe.
Cambodia Indonesia Lao PDR Malaysia8/
(1) (2) (3) (4) (5) (6)
ASEAN1/ 24.6 31.9 31.7 7.8 305.4
REST OF THE WORLD1/ 136.6 99.5 991.8 9.2 613.8
Asian NIEs 5.2 24.6 215.6 2.0 118.6
Hong Kong 1.2 0.2 56.1 0.0 38.9
South Korea 3.7 6.2 175.6 2.0 -0.9
Taiwan (ROC) 0.3 18.1 -16.1 0.0 80.7
China 1.8 33.0 -0.5 0.1 0.0
India 0.7 0.0 -1.6 0.0 3.9
Japan 51.4 3.5 -318.8 1.1 151.5
EU-152/ 73.8 5.7 1,198.9 2.5 202.7
Other EU3/ 0.0 0.0 14.1 0.2 146.7
Canada 0.0 4.3 -44.5 0.0 0.2
USA 0.0 2.7 -207.8 0.1 -21.2
Australia 0.1 0.0 87.1 3.0 -0.7
New Zealand 1.2 0.0 0.0 0.0 0.0
All OTHERS4/ 2.4 25.7 49.5 0.1 12.1
Subtotal1/ 161.2 131.4 1,023.4 16.9 919.2
Total FDI in Cambodia5/ – – – – –
Reinvested earnings in the Philippines6/ – – – – –
Inter-company loans in the Philippines6/ – – – – –
Reinvested earnings in Singapore7/ – – – – –
Inter-company loans in Singapore7/ – – – – –
Total 161.2 131.4 1,023.4 16.9 919.2
Host Country
Source Country BruneiDarussalam

ASEAN Statistical Yearbook, 2005 193
Member Countries by Source Country, 2004
(US$ Million)
Malaysia Myanmar The Philippines Singapore Thailand Viet Nam ASEAN
(7) (8) (9) (10) (11) (12) (13)
980.2 12.3 116.2 649.3 336.0 242.9 2,432.7
3,643.7 132.9 628.8 11,283.5 1,078.0 1,367.2 19,371.1
292.2 97.0 2.3 1,245.6 208.0 335.4 2,427.9
91.2 91.8 1.6 -14.1 61.0 55.9 344.9
101.5 5.2 -0.1 407.6 32.0 162.8 896.5
99.5 0.0 0.8 852.1 115.0 116.8 1,186.6
2.0 4.7 -0.2 98.3 1.0 85.6 225.9
4.0 0.0 0.0 54.2 -11.0 0.0 46.3
1,137.9 0.2 43.6 609.9 689.0 320.6 2,538.2
1,195.2 28.7 -12.0 2,361.8 69.0 497.0 5,420.5
334.2 0.0 2.0 465.7 107.0 14.0 937.2
12.2 2.0 0.3 107.6 9.0 1.2 92.1
638.2 0.0 90.2 4,495.2 -27.0 60.2 5,051.9
24.6 0.3 1.5 173.3 87.0 15.6 392.5
-0.3 0.0 0.0 -6.8 4.0 0.0 -1.9
3.4 0.0 501.0 1,678.7 -58.0 37.6 2,240.5
4,623.9 145.1 745.0 11,932.8 1,414.0 1,610.1 21,803.9
– – – – – – 0.0
– – 2.0 – – – 2.0
– – –278.0 – – – –278.0
– – 3,833.8 – – 3,833.8
– – 292.5 – – 292.5
4,623.9 145.1 469.0 16,059.1 1,414.0 1,610.1 25,654.2
Host Country
4/ Includes Pakistan and the rest of Asia; Central and South Americas; and Others, consisting of the rest of the world, unclassified source, joint countries, and international organisations.
5/ 1995-2000 figures are aggregates (breakdown by source country not available). 6/ 1999-2002 & 2004 data on reinvested earnings, and 2004 data on inter-company loans are aggregates (breakdown by
source country not available). 7/ 2000-2003 data revised based on recent FDI survey and updates in administrative records; 2004 data on reinvested earnings
and inter-company loans are aggregates (breakdown by source country not available). 8/ Excludes reinvested earnings.
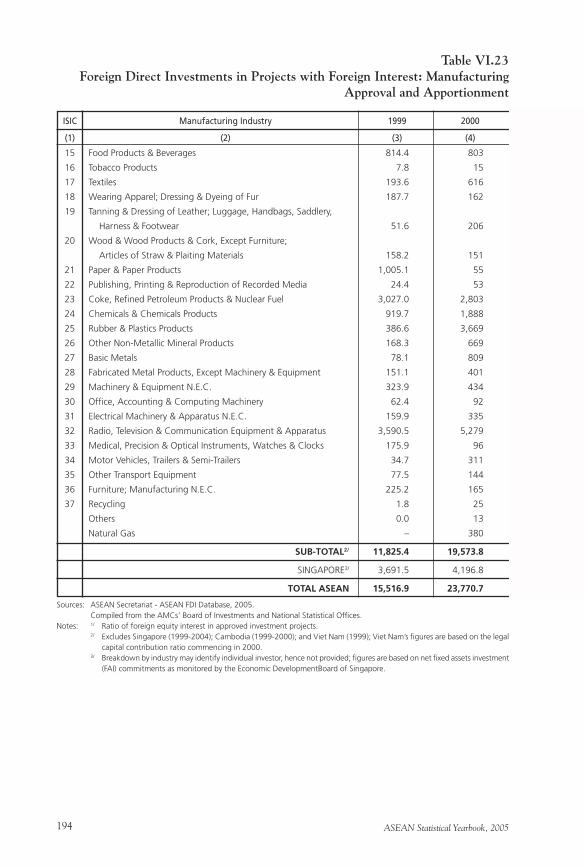
ASEAN Statistical Yearbook, 2005194
Sources: ASEAN Secretariat - ASEAN FDI Database, 2005. Compiled from the AMCs’ Board of Investments and National Statistical Offices.Notes: 1/ Ratio of foreign equity interest in approved investment projects. 2/ Excludes Singapore (1999-2004); Cambodia (1999-2000); and Viet Nam (1999); Viet Nam’s figures are based on the legal
capital contribution ratio commencing in 2000. 3/ Breakdown by industry may identify individual investor, hence not provided; figures are based on net fixed assets investment
(FAI) commitments as monitored by the Economic DevelopmentBoard of Singapore.
Table VI.23Foreign Direct Investments in Projects with Foreign Interest: Manufacturing
Approval and Apportionment
(1) (2) (3) (4)
15 Food Products & Beverages 814.4 803
16 Tobacco Products 7.8 15
17 Textiles 193.6 616
18 Wearing Apparel; Dressing & Dyeing of Fur 187.7 162
19 Tanning & Dressing of Leather; Luggage, Handbags, Saddlery,
Harness & Footwear 51.6 206
20 Wood & Wood Products & Cork, Except Furniture;
Articles of Straw & Plaiting Materials 158.2 151
21 Paper & Paper Products 1,005.1 55
22 Publishing, Printing & Reproduction of Recorded Media 24.4 53
23 Coke, Refined Petroleum Products & Nuclear Fuel 3,027.0 2,803
24 Chemicals & Chemicals Products 919.7 1,888
25 Rubber & Plastics Products 386.6 3,669
26 Other Non-Metallic Mineral Products 168.3 669
27 Basic Metals 78.1 809
28 Fabricated Metal Products, Except Machinery & Equipment 151.1 401
29 Machinery & Equipment N.E.C. 323.9 434
30 Office, Accounting & Computing Machinery 62.4 92
31 Electrical Machinery & Apparatus N.E.C. 159.9 335
32 Radio, Television & Communication Equipment & Apparatus 3,590.5 5,279
33 Medical, Precision & Optical Instruments, Watches & Clocks 175.9 96
34 Motor Vehicles, Trailers & Semi-Trailers 34.7 311
35 Other Transport Equipment 77.5 144
36 Furniture; Manufacturing N.E.C. 225.2 165
37 Recycling 1.8 25
Others 0.0 13
Natural Gas – 380
SUB-TOTAL2/ 11,825.4 19,573.8
SINGAPORE3/ 3,691.5 4,196.8
TOTAL ASEAN 15,516.9 23,770.7
ISIC Manufacturing Industry 1999 2000
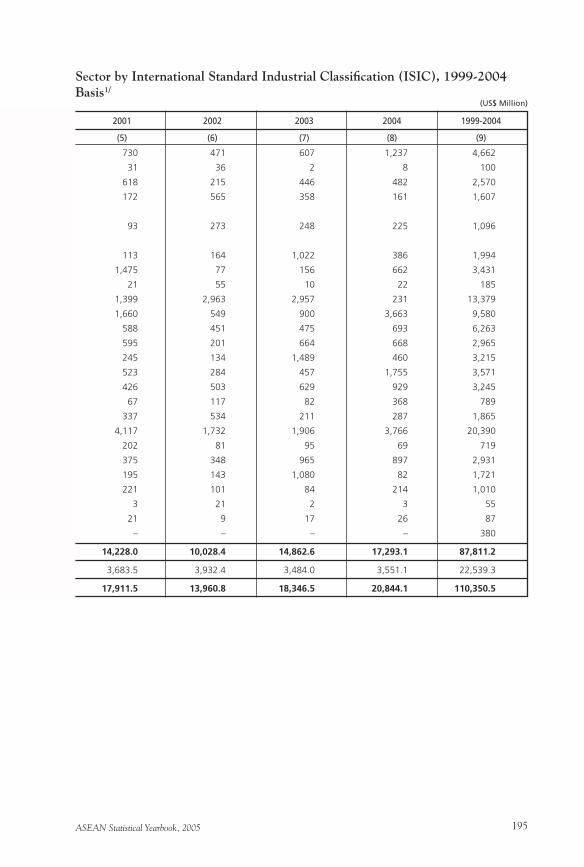
ASEAN Statistical Yearbook, 2005 195
Sector by International Standard Industrial Classification (ISIC), 1999-2004Basis1/
(US$ Million)
(5) (6) (7) (8) (9)
730 471 607 1,237 4,662
31 36 2 8 100
618 215 446 482 2,570
172 565 358 161 1,607
93 273 248 225 1,096
113 164 1,022 386 1,994
1,475 77 156 662 3,431
21 55 10 22 185
1,399 2,963 2,957 231 13,379
1,660 549 900 3,663 9,580
588 451 475 693 6,263
595 201 664 668 2,965
245 134 1,489 460 3,215
523 284 457 1,755 3,571
426 503 629 929 3,245
67 117 82 368 789
337 534 211 287 1,865
4,117 1,732 1,906 3,766 20,390
202 81 95 69 719
375 348 965 897 2,931
195 143 1,080 82 1,721
221 101 84 214 1,010
3 21 2 3 55
21 9 17 26 87
– – – – 380
14,228.0 10,028.4 14,862.6 17,293.1 87,811.2
3,683.5 3,932.4 3,484.0 3,551.1 22,539.3
17,911.5 13,960.8 18,346.5 20,844.1 110,350.5
2001 2002 2003 2004 1999-2004
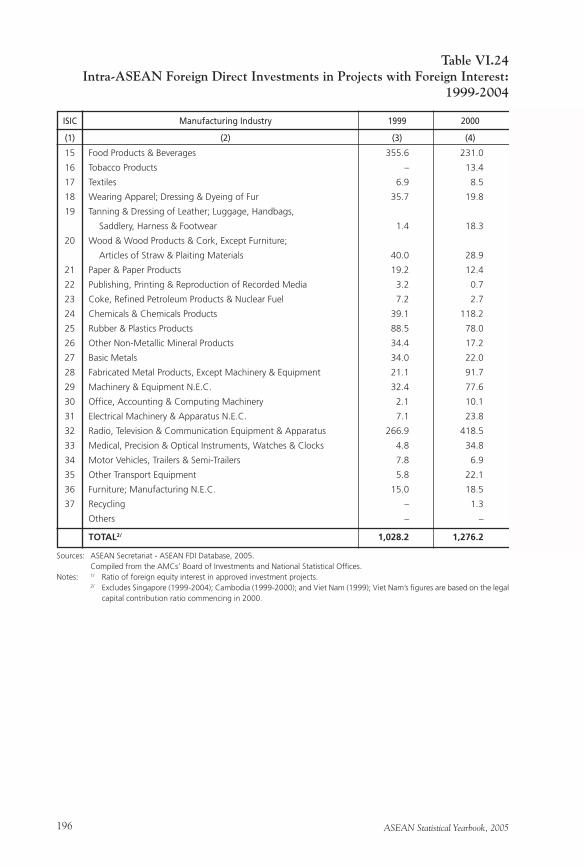
ASEAN Statistical Yearbook, 2005196
Sources: ASEAN Secretariat - ASEAN FDI Database, 2005. Compiled from the AMCs’ Board of Investments and National Statistical Offices.Notes: 1/ Ratio of foreign equity interest in approved investment projects. 2/ Excludes Singapore (1999-2004); Cambodia (1999-2000); and Viet Nam (1999); Viet Nam’s figures are based on the legal
capital contribution ratio commencing in 2000.
Table VI.24Intra-ASEAN Foreign Direct Investments in Projects with Foreign Interest:
1999-2004
(1) (2) (3) (4)
15 Food Products & Beverages 355.6 231.0
16 Tobacco Products – 13.4
17 Textiles 6.9 8.5
18 Wearing Apparel; Dressing & Dyeing of Fur 35.7 19.8
19 Tanning & Dressing of Leather; Luggage, Handbags,
Saddlery, Harness & Footwear 1.4 18.3
20 Wood & Wood Products & Cork, Except Furniture;
Articles of Straw & Plaiting Materials 40.0 28.9
21 Paper & Paper Products 19.2 12.4
22 Publishing, Printing & Reproduction of Recorded Media 3.2 0.7
23 Coke, Refined Petroleum Products & Nuclear Fuel 7.2 2.7
24 Chemicals & Chemicals Products 39.1 118.2
25 Rubber & Plastics Products 88.5 78.0
26 Other Non-Metallic Mineral Products 34.4 17.2
27 Basic Metals 34.0 22.0
28 Fabricated Metal Products, Except Machinery & Equipment 21.1 91.7
29 Machinery & Equipment N.E.C. 32.4 77.6
30 Office, Accounting & Computing Machinery 2.1 10.1
31 Electrical Machinery & Apparatus N.E.C. 7.1 23.8
32 Radio, Television & Communication Equipment & Apparatus 266.9 418.5
33 Medical, Precision & Optical Instruments, Watches & Clocks 4.8 34.8
34 Motor Vehicles, Trailers & Semi-Trailers 7.8 6.9
35 Other Transport Equipment 5.8 22.1
36 Furniture; Manufacturing N.E.C. 15.0 18.5
37 Recycling – 1.3
Others – –
TOTAL2/ 1,028.2 1,276.2
ISIC Manufacturing Industry 1999 2000
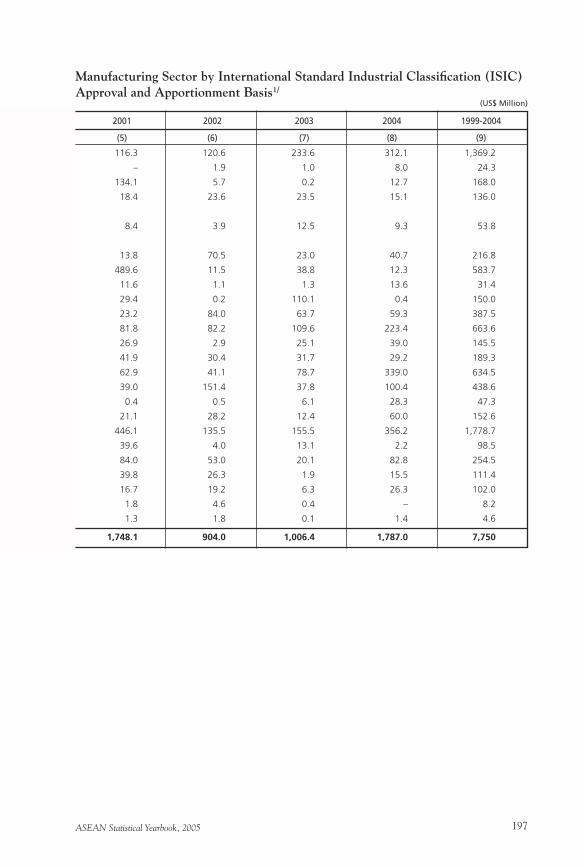
ASEAN Statistical Yearbook, 2005 197
Manufacturing Sector by International Standard Industrial Classification (ISIC)Approval and Apportionment Basis1/
(US$ Million)
(5) (6) (7) (8) (9)
116.3 120.6 233.6 312.1 1,369.2
– 1.9 1.0 8.0 24.3
134.1 5.7 0.2 12.7 168.0
18.4 23.6 23.5 15.1 136.0
8.4 3.9 12.5 9.3 53.8
13.8 70.5 23.0 40.7 216.8
489.6 11.5 38.8 12.3 583.7
11.6 1.1 1.3 13.6 31.4
29.4 0.2 110.1 0.4 150.0
23.2 84.0 63.7 59.3 387.5
81.8 82.2 109.6 223.4 663.6
26.9 2.9 25.1 39.0 145.5
41.9 30.4 31.7 29.2 189.3
62.9 41.1 78.7 339.0 634.5
39.0 151.4 37.8 100.4 438.6
0.4 0.5 6.1 28.3 47.3
21.1 28.2 12.4 60.0 152.6
446.1 135.5 155.5 356.2 1,778.7
39.6 4.0 13.1 2.2 98.5
84.0 53.0 20.1 82.8 254.5
39.8 26.3 1.9 15.5 111.4
16.7 19.2 6.3 26.3 102.0
1.8 4.6 0.4 – 8.2
1.3 1.8 0.1 1.4 4.6
1,748.1 904.0 1,006.4 1,787.0 7,750
2001 2002 2003 2004 1999-2004
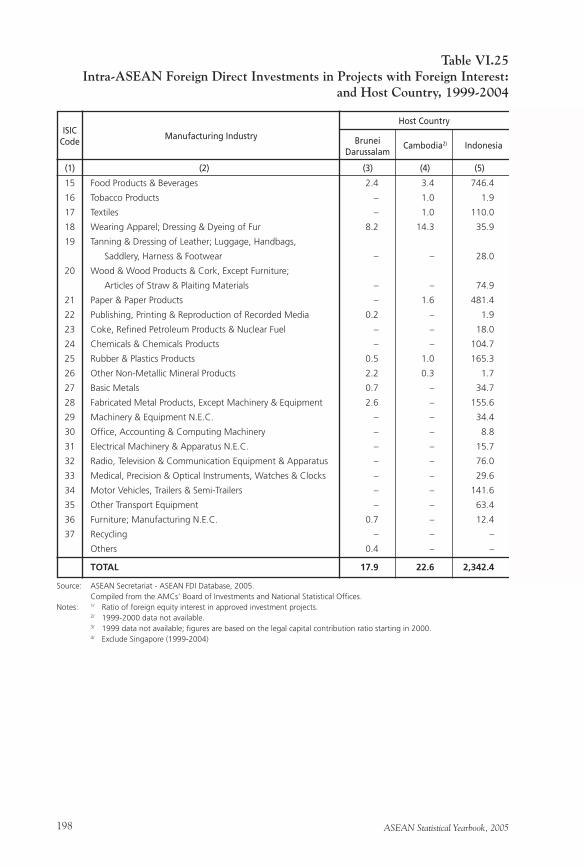
ASEAN Statistical Yearbook, 2005198
Table VI.25Intra-ASEAN Foreign Direct Investments in Projects with Foreign Interest:
and Host Country, 1999-2004
Source: ASEAN Secretariat - ASEAN FDI Database, 2005. Compiled from the AMCs’ Board of Investments and National Statistical Offices.Notes: 1/ Ratio of foreign equity interest in approved investment projects. 2/ 1999-2000 data not available. 3/ 1999 data not available; figures are based on the legal capital contribution ratio starting in 2000. 4/ Exclude Singapore (1999-2004)
Cambodia2) Indonesia
(1) (2) (3) (4) (5)
15 Food Products & Beverages 2.4 3.4 746.4
16 Tobacco Products – 1.0 1.9
17 Textiles – 1.0 110.0
18 Wearing Apparel; Dressing & Dyeing of Fur 8.2 14.3 35.9
19 Tanning & Dressing of Leather; Luggage, Handbags,
Saddlery, Harness & Footwear – – 28.0
20 Wood & Wood Products & Cork, Except Furniture;
Articles of Straw & Plaiting Materials – – 74.9
21 Paper & Paper Products – 1.6 481.4
22 Publishing, Printing & Reproduction of Recorded Media 0.2 – 1.9
23 Coke, Refined Petroleum Products & Nuclear Fuel – – 18.0
24 Chemicals & Chemicals Products – – 104.7
25 Rubber & Plastics Products 0.5 1.0 165.3
26 Other Non-Metallic Mineral Products 2.2 0.3 1.7
27 Basic Metals 0.7 – 34.7
28 Fabricated Metal Products, Except Machinery & Equipment 2.6 – 155.6
29 Machinery & Equipment N.E.C. – – 34.4
30 Office, Accounting & Computing Machinery – – 8.8
31 Electrical Machinery & Apparatus N.E.C. – – 15.7
32 Radio, Television & Communication Equipment & Apparatus – – 76.0
33 Medical, Precision & Optical Instruments, Watches & Clocks – – 29.6
34 Motor Vehicles, Trailers & Semi-Trailers – – 141.6
35 Other Transport Equipment – – 63.4
36 Furniture; Manufacturing N.E.C. 0.7 – 12.4
37 Recycling – – –
Others 0.4 – –
TOTAL 17.9 22.6 2,342.4
Host Country
Manufacturing Industry BruneiDarussalam
ISICCode
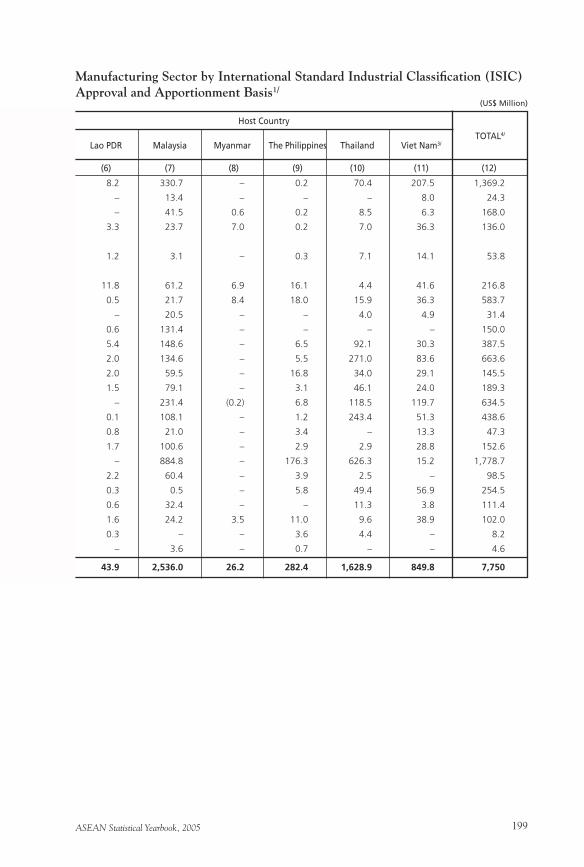
ASEAN Statistical Yearbook, 2005 199
Manufacturing Sector by International Standard Industrial Classification (ISIC)Approval and Apportionment Basis1/
(US$ Million)
Lao PDR Malaysia Myanmar The Philippines Thailand Viet Nam3/
(6) (7) (8) (9) (10) (11) (12)
8.2 330.7 – 0.2 70.4 207.5 1,369.2
– 13.4 – – – 8.0 24.3
– 41.5 0.6 0.2 8.5 6.3 168.0
3.3 23.7 7.0 0.2 7.0 36.3 136.0
1.2 3.1 – 0.3 7.1 14.1 53.8
11.8 61.2 6.9 16.1 4.4 41.6 216.8
0.5 21.7 8.4 18.0 15.9 36.3 583.7
– 20.5 – – 4.0 4.9 31.4
0.6 131.4 – – – – 150.0
5.4 148.6 – 6.5 92.1 30.3 387.5
2.0 134.6 – 5.5 271.0 83.6 663.6
2.0 59.5 – 16.8 34.0 29.1 145.5
1.5 79.1 – 3.1 46.1 24.0 189.3
– 231.4 (0.2) 6.8 118.5 119.7 634.5
0.1 108.1 – 1.2 243.4 51.3 438.6
0.8 21.0 – 3.4 – 13.3 47.3
1.7 100.6 – 2.9 2.9 28.8 152.6
– 884.8 – 176.3 626.3 15.2 1,778.7
2.2 60.4 – 3.9 2.5 – 98.5
0.3 0.5 – 5.8 49.4 56.9 254.5
0.6 32.4 – – 11.3 3.8 111.4
1.6 24.2 3.5 11.0 9.6 38.9 102.0
0.3 – – 3.6 4.4 – 8.2
– 3.6 – 0.7 – – 4.6
43.9 2,536.0 26.2 282.4 1,628.9 849.8 7,750
Host Country
TOTAL4/
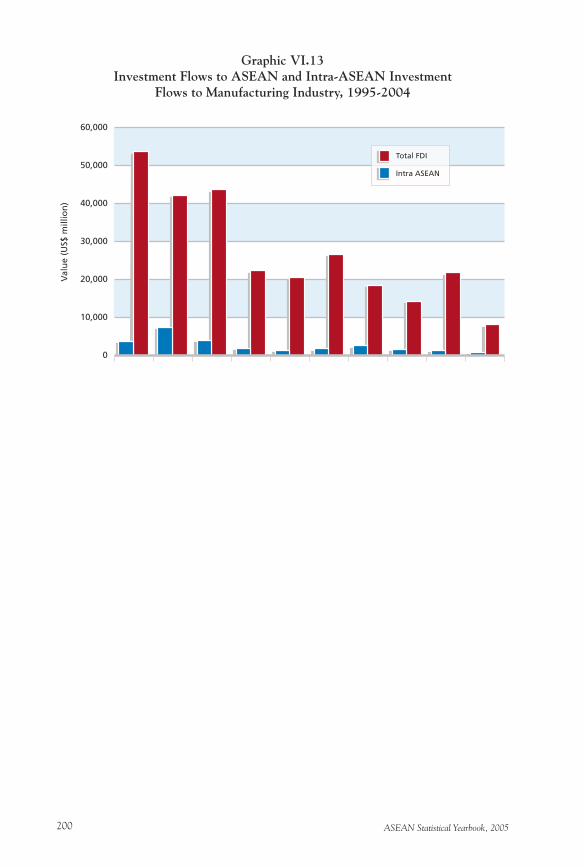
ASEAN Statistical Yearbook, 2005200
Graphic VI.13Investment Flows to ASEAN and Intra-ASEAN Investment
Flows to Manufacturing Industry, 1995-2004
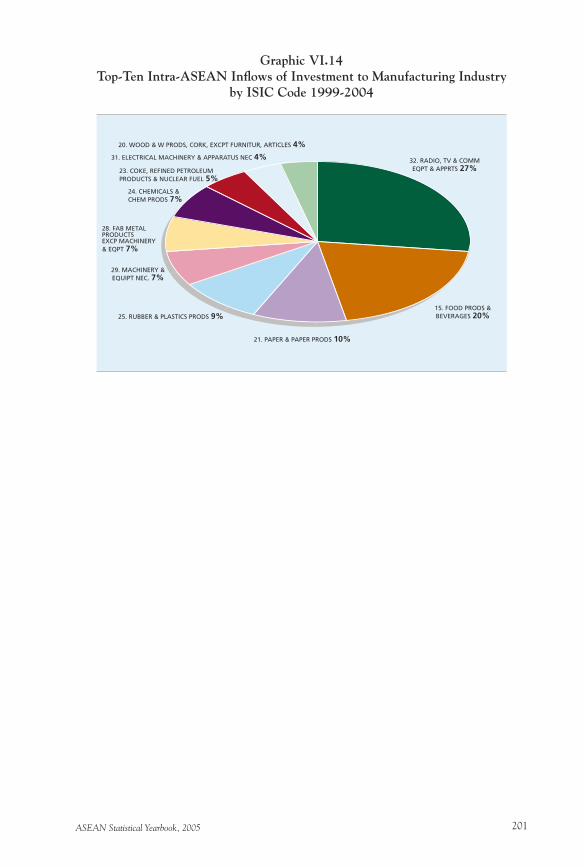
ASEAN Statistical Yearbook, 2005 201
Graphic VI.14Top-Ten Intra-ASEAN Inflows of Investment to Manufacturing Industry
by ISIC Code 1999-2004
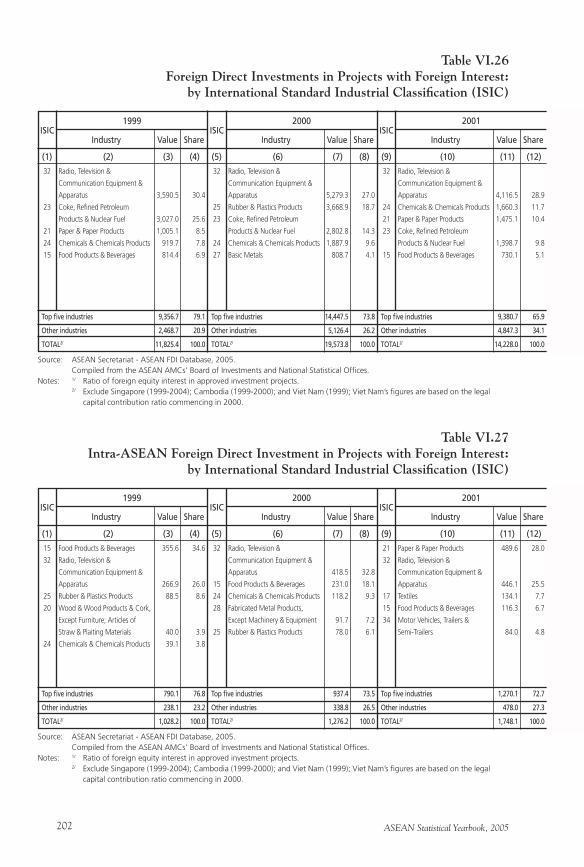
ASEAN Statistical Yearbook, 2005202
Source: ASEAN Secretariat - ASEAN FDI Database, 2005. Compiled from the ASEAN AMCs’ Board of Investments and National Statistical Offices.Notes: 1/ Ratio of foreign equity interest in approved investment projects. 2/ Exclude Singapore (1999-2004); Cambodia (1999-2000); and Viet Nam (1999); Viet Nam’s figures are based on the legal
capital contribution ratio commencing in 2000.
(1) (2) (3) (4)
32 Radio, Television &
Communication Equipment &
Apparatus 3,590.5 30.4
23 Coke, Refined Petroleum
Products & Nuclear Fuel 3,027.0 25.6
21 Paper & Paper Products 1,005.1 8.5
24 Chemicals & Chemicals Products 919.7 7.8
15 Food Products & Beverages 814.4 6.9
Top five industries 9,356.7 79.1
Other industries 2,468.7 20.9
TOTAL2/ 11,825.4 100.0
1999ISIC
Table VI.26Foreign Direct Investments in Projects with Foreign Interest:
by International Standard Industrial Classification (ISIC)
Industry Value Share
(5) (6) (7) (8)
32 Radio, Television &
Communication Equipment &
Apparatus 5,279.3 27.0
25 Rubber & Plastics Products 3,668.9 18.7
23 Coke, Refined Petroleum
Products & Nuclear Fuel 2,802.8 14.3
24 Chemicals & Chemicals Products 1,887.9 9.6
27 Basic Metals 808.7 4.1
Top five industries 14,447.5 73.8
Other industries 5,126.4 26.2
TOTAL2/ 19,573.8 100.0
2000ISIC
Industry Value Share
(9) (10) (11) (12)
32 Radio, Television &
Communication Equipment &
Apparatus 4,116.5 28.9
24 Chemicals & Chemicals Products 1,660.3 11.7
21 Paper & Paper Products 1,475.1 10.4
23 Coke, Refined Petroleum
Products & Nuclear Fuel 1,398.7 9.8
15 Food Products & Beverages 730.1 5.1
Top five industries 9,380.7 65.9
Other industries 4,847.3 34.1
TOTAL2/ 14,228.0 100.0
2001ISIC
Industry Value Share
Source: ASEAN Secretariat - ASEAN FDI Database, 2005. Compiled from the ASEAN AMCs’ Board of Investments and National Statistical Offices.Notes: 1/ Ratio of foreign equity interest in approved investment projects. 2/ Exclude Singapore (1999-2004); Cambodia (1999-2000); and Viet Nam (1999); Viet Nam’s figures are based on the legal
capital contribution ratio commencing in 2000.
(1) (2) (3) (4)
15 Food Products & Beverages 355.6 34.6
32 Radio, Television &
Communication Equipment &
Apparatus 266.9 26.0
25 Rubber & Plastics Products 88.5 8.6
20 Wood & Wood Products & Cork,
Except Furniture; Articles of
Straw & Plaiting Materials 40.0 3.9
24 Chemicals & Chemicals Products 39.1 3.8
Top five industries 790.1 76.8
Other industries 238.1 23.2
TOTAL2/ 1,028.2 100.0
1999ISIC
Table VI.27Intra-ASEAN Foreign Direct Investment in Projects with Foreign Interest:
by International Standard Industrial Classification (ISIC)
Industry Value Share
(5) (6) (7) (8)
32 Radio, Television &
Communication Equipment &
Apparatus 418.5 32.8
15 Food Products & Beverages 231.0 18.1
24 Chemicals & Chemicals Products 118.2 9.3
28 Fabricated Metal Products,
Except Machinery & Equipment 91.7 7.2
25 Rubber & Plastics Products 78.0 6.1
Top five industries 937.4 73.5
Other industries 338.8 26.5
TOTAL2/ 1,276.2 100.0
2000ISIC
Industry Value Share
(9) (10) (11) (12)
21 Paper & Paper Products 489.6 28.0
32 Radio, Television &
Communication Equipment &
Apparatus 446.1 25.5
17 Textiles 134.1 7.7
15 Food Products & Beverages 116.3 6.7
34 Motor Vehicles, Trailers &
Semi-Trailers 84.0 4.8
Top five industries 1,270.1 72.7
Other industries 478.0 27.3
TOTAL2/ 1,748.1 100.0
2001ISIC
Industry Value Share
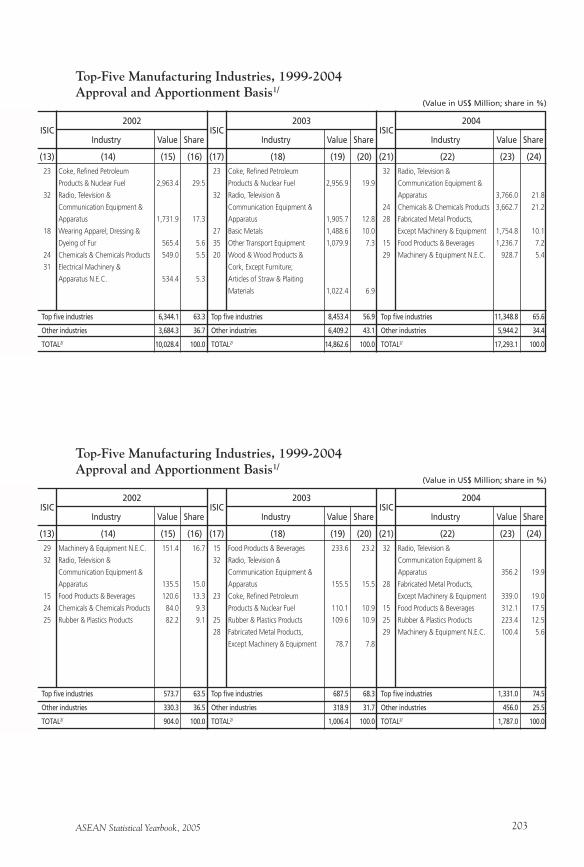
ASEAN Statistical Yearbook, 2005 203
Top-Five Manufacturing Industries, 1999-2004Approval and Apportionment Basis1/
(Value in US$ Million; share in %)
(13) (14) (15) (16)
23 Coke, Refined Petroleum
Products & Nuclear Fuel 2,963.4 29.5
32 Radio, Television &
Communication Equipment &
Apparatus 1,731.9 17.3
18 Wearing Apparel; Dressing &
Dyeing of Fur 565.4 5.6
24 Chemicals & Chemicals Products 549.0 5.5
31 Electrical Machinery &
Apparatus N.E.C. 534.4 5.3
Top five industries 6,344.1 63.3
Other industries 3,684.3 36.7
TOTAL2/ 10,028.4 100.0
2002ISIC
Industry Value Share
(17) (18) (19) (20)
23 Coke, Refined Petroleum
Products & Nuclear Fuel 2,956.9 19.9
32 Radio, Television &
Communication Equipment &
Apparatus 1,905.7 12.8
27 Basic Metals 1,488.6 10.0
35 Other Transport Equipment 1,079.9 7.3
20 Wood & Wood Products &
Cork, Except Furniture;
Articles of Straw & Plaiting
Materials 1,022.4 6.9
Top five industries 8,453.4 56.9
Other industries 6,409.2 43.1
TOTAL2/ 14,862.6 100.0
2003ISIC
Industry Value Share
(21) (22) (23) (24)
32 Radio, Television &
Communication Equipment &
Apparatus 3,766.0 21.8
24 Chemicals & Chemicals Products 3,662.7 21.2
28 Fabricated Metal Products,
Except Machinery & Equipment 1,754.8 10.1
15 Food Products & Beverages 1,236.7 7.2
29 Machinery & Equipment N.E.C. 928.7 5.4
Top five industries 11,348.8 65.6
Other industries 5,944.2 34.4
TOTAL2/ 17,293.1 100.0
2004ISIC
Industry Value Share
Top-Five Manufacturing Industries, 1999-2004Approval and Apportionment Basis1/
(Value in US$ Million; share in %)
(13) (14) (15) (16)
29 Machinery & Equipment N.E.C. 151.4 16.7
32 Radio, Television &
Communication Equipment &
Apparatus 135.5 15.0
15 Food Products & Beverages 120.6 13.3
24 Chemicals & Chemicals Products 84.0 9.3
25 Rubber & Plastics Products 82.2 9.1
Top five industries 573.7 63.5
Other industries 330.3 36.5
TOTAL2/ 904.0 100.0
2002ISIC
Industry Value Share
(17) (18) (19) (20)
15 Food Products & Beverages 233.6 23.2
32 Radio, Television &
Communication Equipment &
Apparatus 155.5 15.5
23 Coke, Refined Petroleum
Products & Nuclear Fuel 110.1 10.9
25 Rubber & Plastics Products 109.6 10.9
28 Fabricated Metal Products,
Except Machinery & Equipment 78.7 7.8
Top five industries 687.5 68.3
Other industries 318.9 31.7
TOTAL2/ 1,006.4 100.0
2003ISIC
Industry Value Share
(21) (22) (23) (24)
32 Radio, Television &
Communication Equipment &
Apparatus 356.2 19.9
28 Fabricated Metal Products,
Except Machinery & Equipment 339.0 19.0
15 Food Products & Beverages 312.1 17.5
25 Rubber & Plastics Products 223.4 12.5
29 Machinery & Equipment N.E.C. 100.4 5.6
Top five industries 1,331.0 74.5
Other industries 456.0 25.5
TOTAL2/ 1,787.0 100.0
2004ISIC
Industry Value Share

ASEAN Statistical Yearbook, 2005204
ASEAN Statistical Yearbook, 2005 205
Chapter VIITransport and Communication
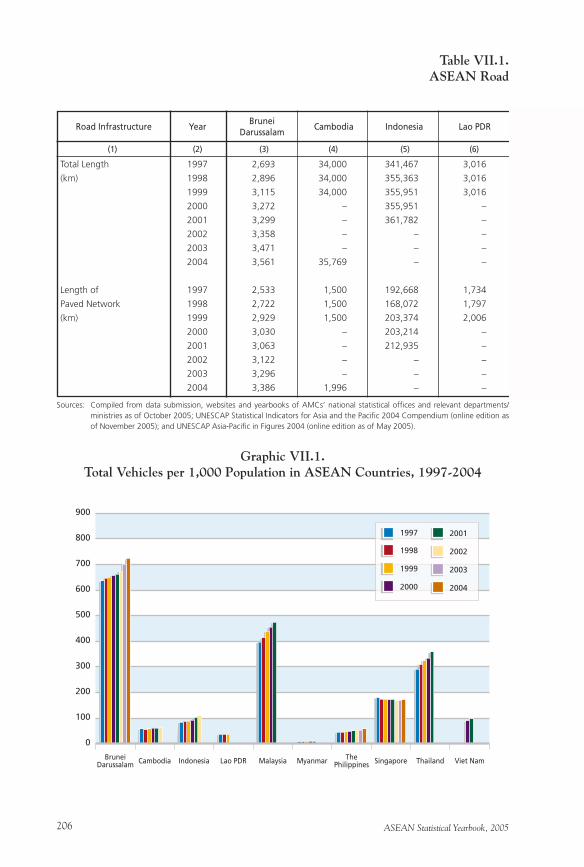
ASEAN Statistical Yearbook, 2005206
Total Length 1997 2,693 34,000 341,467 3,016
(km) 1998 2,896 34,000 355,363 3,016
1999 3,115 34,000 355,951 3,016
2000 3,272 – 355,951 –
2001 3,299 – 361,782 –
2002 3,358 – – –
2003 3,471 – – –
2004 3,561 35,769 – –
Length of 1997 2,533 1,500 192,668 1,734
Paved Network 1998 2,722 1,500 168,072 1,797
(km) 1999 2,929 1,500 203,374 2,006
2000 3,030 – 203,214 –
2001 3,063 – 212,935 –
2002 3,122 – – –
2003 3,296 – – –
2004 3,386 1,996 – –
Table VII.1.ASEAN Road
Road Infrastructure Year
(1) (2) (3) (4) (5) (6)
Sources: Compiled from data submission, websites and yearbooks of AMCs’ national statistical offices and relevant departments/ministries as of October 2005; UNESCAP Statistical Indicators for Asia and the Pacific 2004 Compendium (online edition as of November 2005); and UNESCAP Asia-Pacific in Figures 2004 (online edition as of May 2005).
Brunei Darussalam
Cambodia Indonesia Lao PDR
Graphic VII.1.Total Vehicles per 1,000 Population in ASEAN Countries, 1997-2004
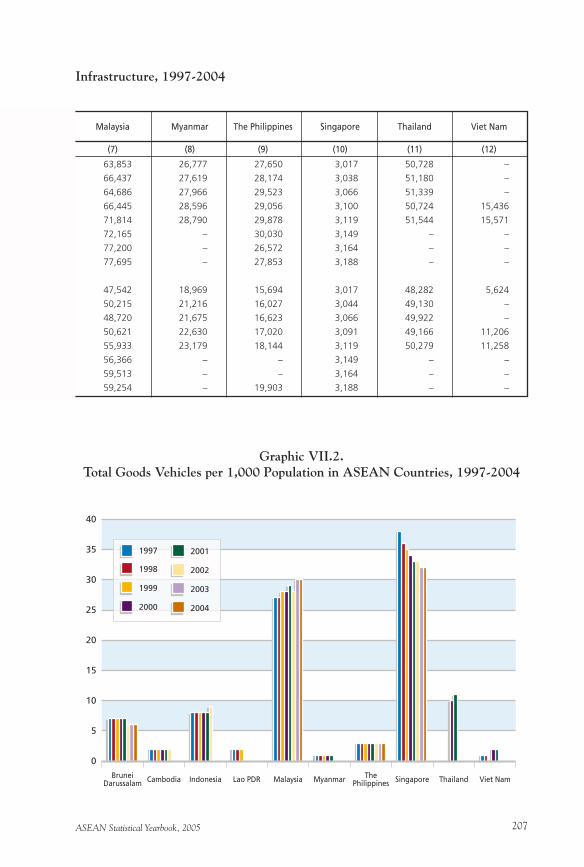
ASEAN Statistical Yearbook, 2005 207
Infrastructure, 1997-2004
63,853 26,777 27,650 3,017 50,728 –
66,437 27,619 28,174 3,038 51,180 –
64,686 27,966 29,523 3,066 51,339 –
66,445 28,596 29,056 3,100 50,724 15,436
71,814 28,790 29,878 3,119 51,544 15,571
72,165 – 30,030 3,149 – –
77,200 – 26,572 3,164 – –
77,695 – 27,853 3,188 – –
47,542 18,969 15,694 3,017 48,282 5,624
50,215 21,216 16,027 3,044 49,130 –
48,720 21,675 16,623 3,066 49,922 –
50,621 22,630 17,020 3,091 49,166 11,206
55,933 23,179 18,144 3,119 50,279 11,258
56,366 – – 3,149 – –
59,513 – – 3,164 – –
59,254 – 19,903 3,188 – –
Malaysia Myanmar The Philippines Singapore Thailand Viet Nam
(7) (8) (9) (10) (11) (12)
Graphic VII.2.Total Goods Vehicles per 1,000 Population in ASEAN Countries, 1997-2004
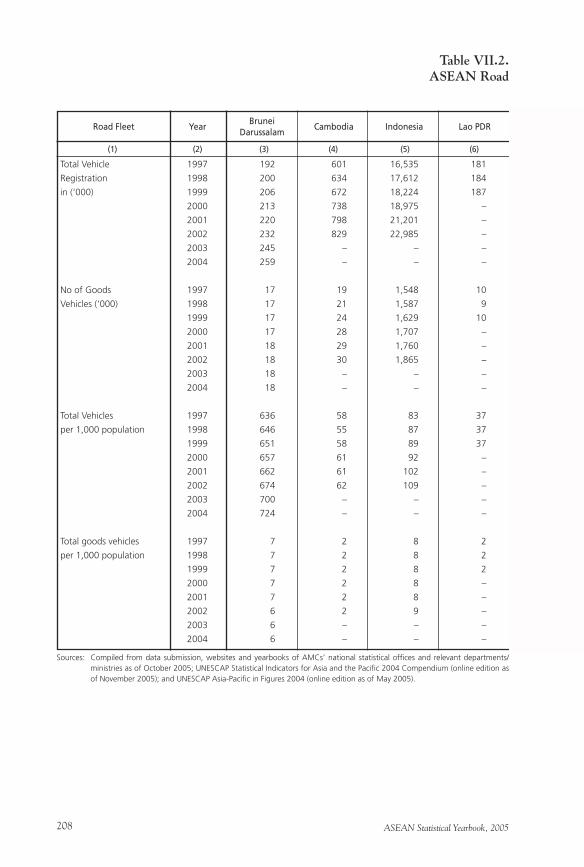
ASEAN Statistical Yearbook, 2005208
Table VII.2.ASEAN Road
Total Vehicle 1997 192 601 16,535 181
Registration 1998 200 634 17,612 184
in (‘000) 1999 206 672 18,224 187
2000 213 738 18,975 –
2001 220 798 21,201 –
2002 232 829 22,985 –
2003 245 – – –
2004 259 – – –
No of Goods 1997 17 19 1,548 10
Vehicles (‘000) 1998 17 21 1,587 9
1999 17 24 1,629 10
2000 17 28 1,707 –
2001 18 29 1,760 –
2002 18 30 1,865 –
2003 18 – – –
2004 18 – – –
Total Vehicles 1997 636 58 83 37
per 1,000 population 1998 646 55 87 37
1999 651 58 89 37
2000 657 61 92 –
2001 662 61 102 –
2002 674 62 109 –
2003 700 – – –
2004 724 – – –
Total goods vehicles 1997 7 2 8 2
per 1,000 population 1998 7 2 8 2
1999 7 2 8 2
2000 7 2 8 –
2001 7 2 8 –
2002 6 2 9 –
2003 6 – – –
2004 6 – – –
Road Fleet Year
(1) (2) (3) (4) (5) (6)
Sources: Compiled from data submission, websites and yearbooks of AMCs’ national statistical offices and relevant departments/ministries as of October 2005; UNESCAP Statistical Indicators for Asia and the Pacific 2004 Compendium (online edition as of November 2005); and UNESCAP Asia-Pacific in Figures 2004 (online edition as of May 2005).
Brunei Darussalam
Cambodia Indonesia Lao PDR
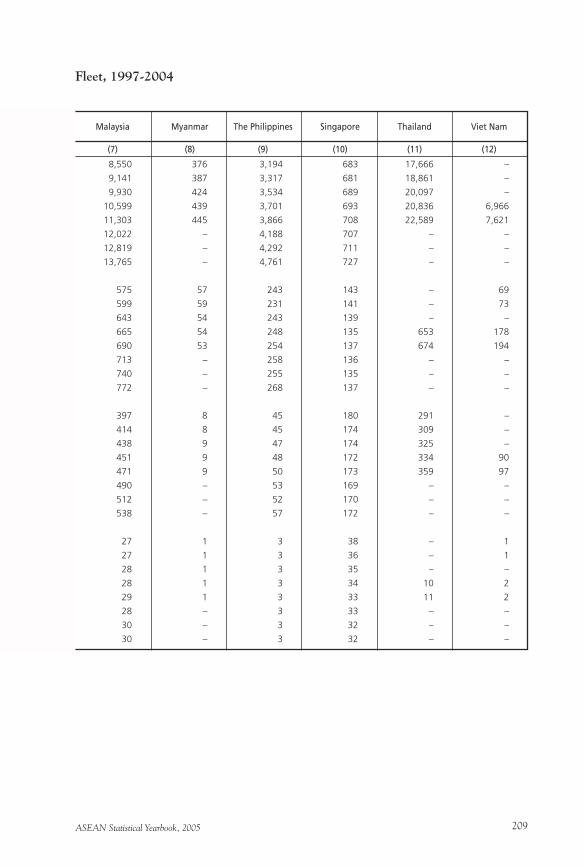
ASEAN Statistical Yearbook, 2005 209
Fleet, 1997-2004
8,550 376 3,194 683 17,666 –
9,141 387 3,317 681 18,861 –
9,930 424 3,534 689 20,097 –
10,599 439 3,701 693 20,836 6,966
11,303 445 3,866 708 22,589 7,621
12,022 – 4,188 707 – –
12,819 – 4,292 711 – –
13,765 – 4,761 727 – –
575 57 243 143 – 69
599 59 231 141 – 73
643 54 243 139 – –
665 54 248 135 653 178
690 53 254 137 674 194
713 – 258 136 – –
740 – 255 135 – –
772 – 268 137 – –
397 8 45 180 291 –
414 8 45 174 309 –
438 9 47 174 325 –
451 9 48 172 334 90
471 9 50 173 359 97
490 – 53 169 – –
512 – 52 170 – –
538 – 57 172 – –
27 1 3 38 – 1
27 1 3 36 – 1
28 1 3 35 – –
28 1 3 34 10 2
29 1 3 33 11 2
28 – 3 33 – –
30 – 3 32 – –
30 – 3 32 – –
Malaysia Myanmar The Philippines Singapore Thailand Viet Nam
(7) (8) (9) (10) (11) (12)
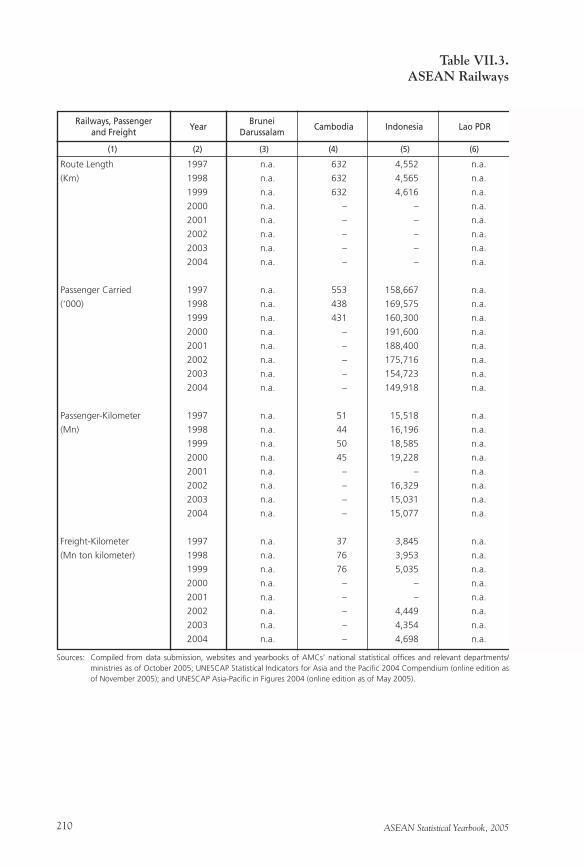
ASEAN Statistical Yearbook, 2005210
Table VII.3.ASEAN Railways
Route Length 1997 n.a. 632 4,552 n.a.
(Km) 1998 n.a. 632 4,565 n.a.
1999 n.a. 632 4,616 n.a.
2000 n.a. – – n.a.
2001 n.a. – – n.a.
2002 n.a. – – n.a.
2003 n.a. – – n.a.
2004 n.a. – – n.a.
Passenger Carried 1997 n.a. 553 158,667 n.a.
(‘000) 1998 n.a. 438 169,575 n.a.
1999 n.a. 431 160,300 n.a.
2000 n.a. – 191,600 n.a.
2001 n.a. – 188,400 n.a.
2002 n.a. – 175,716 n.a.
2003 n.a. – 154,723 n.a.
2004 n.a. – 149,918 n.a.
Passenger-Kilometer 1997 n.a. 51 15,518 n.a.
(Mn) 1998 n.a. 44 16,196 n.a.
1999 n.a. 50 18,585 n.a.
2000 n.a. 45 19,228 n.a.
2001 n.a. – – n.a.
2002 n.a. – 16,329 n.a.
2003 n.a. – 15,031 n.a.
2004 n.a. – 15,077 n.a.
Freight-Kilometer 1997 n.a. 37 3,845 n.a.
(Mn ton kilometer) 1998 n.a. 76 3,953 n.a.
1999 n.a. 76 5,035 n.a.
2000 n.a. – – n.a.
2001 n.a. – – n.a.
2002 n.a. – 4,449 n.a.
2003 n.a. – 4,354 n.a.
2004 n.a. – 4,698 n.a.
Railways, Passenger and Freight
(1) (2) (3) (4) (5) (6)
Sources: Compiled from data submission, websites and yearbooks of AMCs’ national statistical offices and relevant departments/ministries as of October 2005; UNESCAP Statistical Indicators for Asia and the Pacific 2004 Compendium (online edition as of November 2005); and UNESCAP Asia-Pacific in Figures 2004 (online edition as of May 2005).
Brunei Darussalam
Cambodia Indonesia Lao PDRYear
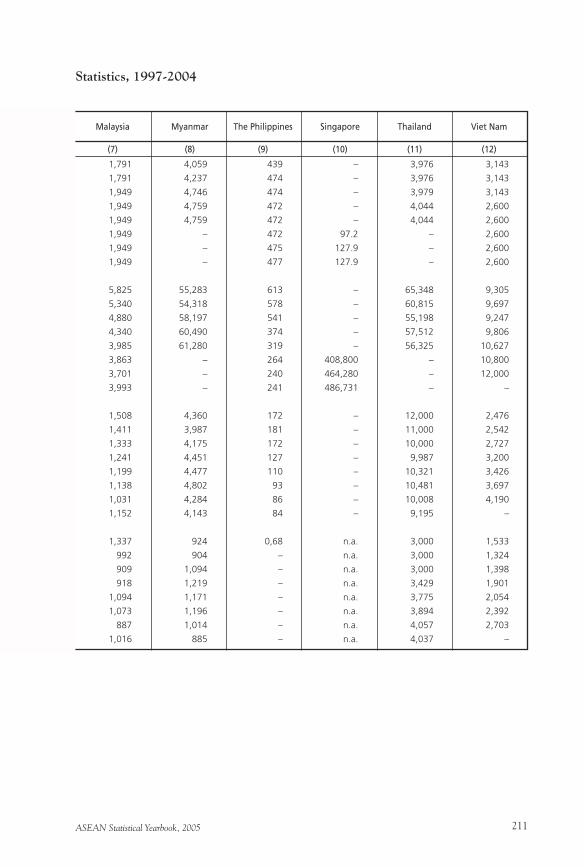
ASEAN Statistical Yearbook, 2005 211
Statistics, 1997-2004
1,791 4,059 439 – 3,976 3,143
1,791 4,237 474 – 3,976 3,143
1,949 4,746 474 – 3,979 3,143
1,949 4,759 472 – 4,044 2,600
1,949 4,759 472 – 4,044 2,600
1,949 – 472 97.2 – 2,600
1,949 – 475 127.9 – 2,600
1,949 – 477 127.9 – 2,600
5,825 55,283 613 – 65,348 9,305
5,340 54,318 578 – 60,815 9,697
4,880 58,197 541 – 55,198 9,247
4,340 60,490 374 – 57,512 9,806
3,985 61,280 319 – 56,325 10,627
3,863 – 264 408,800 – 10,800
3,701 – 240 464,280 – 12,000
3,993 – 241 486,731 – –
1,508 4,360 172 – 12,000 2,476
1,411 3,987 181 – 11,000 2,542
1,333 4,175 172 – 10,000 2,727
1,241 4,451 127 – 9,987 3,200
1,199 4,477 110 – 10,321 3,426
1,138 4,802 93 – 10,481 3,697
1,031 4,284 86 – 10,008 4,190
1,152 4,143 84 – 9,195 –
1,337 924 0,68 n.a. 3,000 1,533
992 904 – n.a. 3,000 1,324
909 1,094 – n.a. 3,000 1,398
918 1,219 – n.a. 3,429 1,901
1,094 1,171 – n.a. 3,775 2,054
1,073 1,196 – n.a. 3,894 2,392
887 1,014 – n.a. 4,057 2,703
1,016 885 – n.a. 4,037 –
Malaysia Myanmar The Philippines Singapore Thailand Viet Nam
(7) (8) (9) (10) (11) (12)
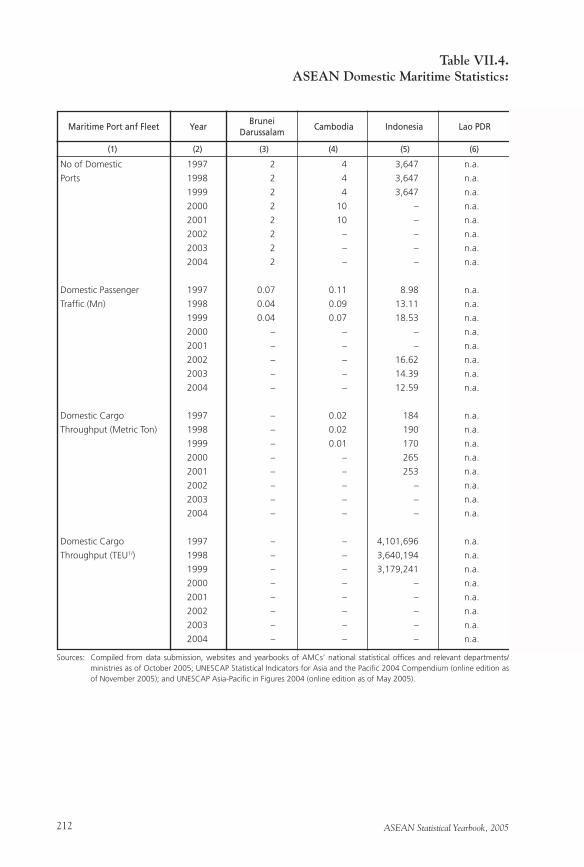
ASEAN Statistical Yearbook, 2005212
Table VII.4.ASEAN Domestic Maritime Statistics:
No of Domestic 1997 2 4 3,647 n.a.
Ports 1998 2 4 3,647 n.a.
1999 2 4 3,647 n.a.
2000 2 10 – n.a.
2001 2 10 – n.a.
2002 2 – – n.a.
2003 2 – – n.a.
2004 2 – – n.a.
Domestic Passenger 1997 0.07 0.11 8.98 n.a.
Traffic (Mn) 1998 0.04 0.09 13.11 n.a.
1999 0.04 0.07 18.53 n.a.
2000 – – – n.a.
2001 – – – n.a.
2002 – – 16.62 n.a.
2003 – – 14.39 n.a.
2004 – – 12.59 n.a.
Domestic Cargo 1997 – 0.02 184 n.a.
Throughput (Metric Ton) 1998 – 0.02 190 n.a.
1999 – 0.01 170 n.a.
2000 – – 265 n.a.
2001 – – 253 n.a.
2002 – – – n.a.
2003 – – – n.a.
2004 – – – n.a.
Domestic Cargo 1997 – – 4,101,696 n.a.
Throughput (TEU1/) 1998 – – 3,640,194 n.a.
1999 – – 3,179,241 n.a.
2000 – – – n.a.
2001 – – – n.a.
2002 – – – n.a.
2003 – – – n.a.
2004 – – – n.a.
Maritime Port anf Fleet
(1) (2) (3) (4) (5) (6)
Sources: Compiled from data submission, websites and yearbooks of AMCs’ national statistical offices and relevant departments/ministries as of October 2005; UNESCAP Statistical Indicators for Asia and the Pacific 2004 Compendium (online edition as of November 2005); and UNESCAP Asia-Pacific in Figures 2004 (online edition as of May 2005).
Brunei Darussalam
Cambodia Indonesia Lao PDRYear
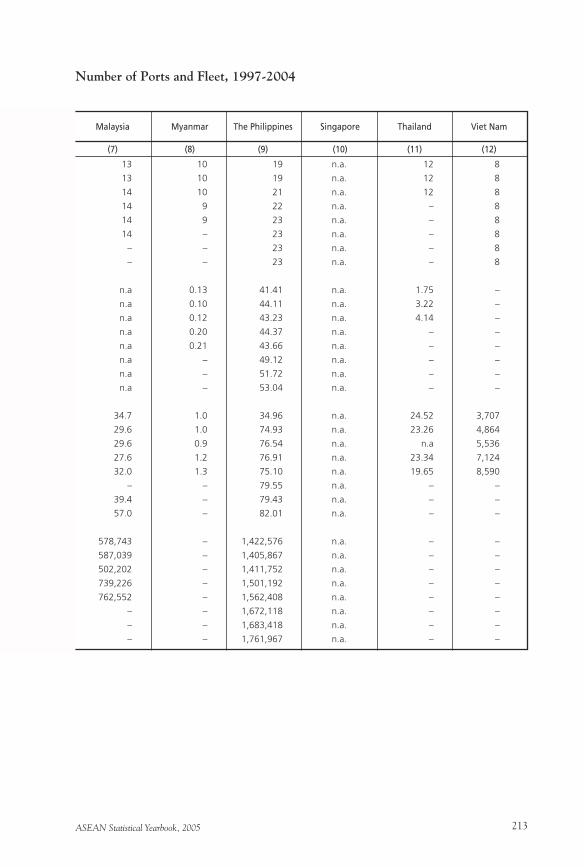
ASEAN Statistical Yearbook, 2005 213
Number of Ports and Fleet, 1997-2004
13 10 19 n.a. 12 8
13 10 19 n.a. 12 8
14 10 21 n.a. 12 8
14 9 22 n.a. – 8
14 9 23 n.a. – 8
14 – 23 n.a. – 8
– – 23 n.a. – 8
– – 23 n.a. – 8
n.a 0.13 41.41 n.a. 1.75 –
n.a 0.10 44.11 n.a. 3.22 –
n.a 0.12 43.23 n.a. 4.14 –
n.a 0.20 44.37 n.a. – –
n.a 0.21 43.66 n.a. – –
n.a – 49.12 n.a. – –
n.a – 51.72 n.a. – –
n.a – 53.04 n.a. – –
34.7 1.0 34.96 n.a. 24.52 3,707
29.6 1.0 74.93 n.a. 23.26 4,864
29.6 0.9 76.54 n.a. n.a 5,536
27.6 1.2 76.91 n.a. 23.34 7,124
32.0 1.3 75.10 n.a. 19.65 8,590
– – 79.55 n.a. – –
39.4 – 79.43 n.a. – –
57.0 – 82.01 n.a. – –
578,743 – 1,422,576 n.a. – –
587,039 – 1,405,867 n.a. – –
502,202 – 1,411,752 n.a. – –
739,226 – 1,501,192 n.a. – –
762,552 – 1,562,408 n.a. – –
– – 1,672,118 n.a. – –
– – 1,683,418 n.a. – –
– – 1,761,967 n.a. – –
Malaysia Myanmar The Philippines Singapore Thailand Viet Nam
(7) (8) (9) (10) (11) (12)
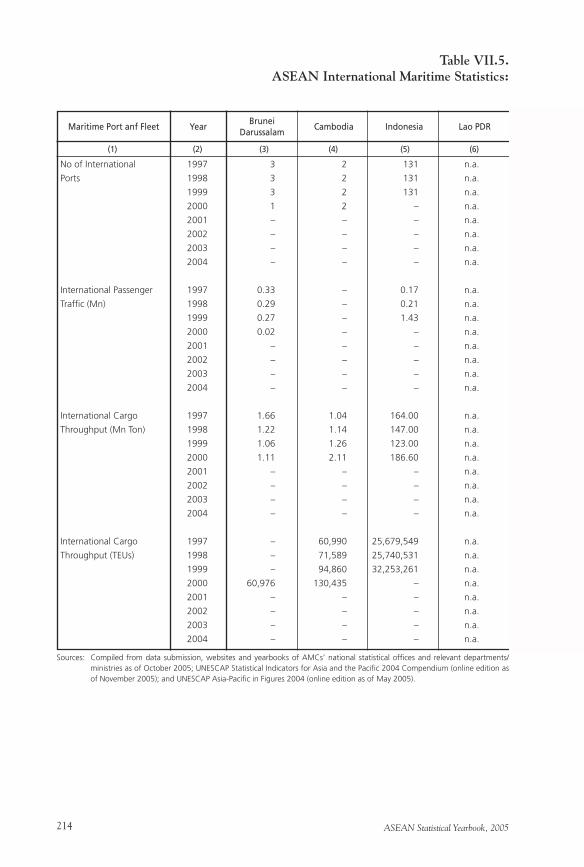
ASEAN Statistical Yearbook, 2005214
Table VII.5.ASEAN International Maritime Statistics:
No of International 1997 3 2 131 n.a.
Ports 1998 3 2 131 n.a.
1999 3 2 131 n.a.
2000 1 2 – n.a.
2001 – – – n.a.
2002 – – – n.a.
2003 – – – n.a.
2004 – – – n.a.
International Passenger 1997 0.33 – 0.17 n.a.
Traffic (Mn) 1998 0.29 – 0.21 n.a.
1999 0.27 – 1.43 n.a.
2000 0.02 – – n.a.
2001 – – – n.a.
2002 – – – n.a.
2003 – – – n.a.
2004 – – – n.a.
International Cargo 1997 1.66 1.04 164.00 n.a.
Throughput (Mn Ton) 1998 1.22 1.14 147.00 n.a.
1999 1.06 1.26 123.00 n.a.
2000 1.11 2.11 186.60 n.a.
2001 – – – n.a.
2002 – – – n.a.
2003 – – – n.a.
2004 – – – n.a.
International Cargo 1997 – 60,990 25,679,549 n.a.
Throughput (TEUs) 1998 – 71,589 25,740,531 n.a.
1999 – 94,860 32,253,261 n.a.
2000 60,976 130,435 – n.a.
2001 – – – n.a.
2002 – – – n.a.
2003 – – – n.a.
2004 – – – n.a.
Maritime Port anf Fleet
(1) (2) (3) (4) (5) (6)
Sources: Compiled from data submission, websites and yearbooks of AMCs’ national statistical offices and relevant departments/ministries as of October 2005; UNESCAP Statistical Indicators for Asia and the Pacific 2004 Compendium (online edition as of November 2005); and UNESCAP Asia-Pacific in Figures 2004 (online edition as of May 2005).
Brunei Darussalam
Cambodia Indonesia Lao PDRYear
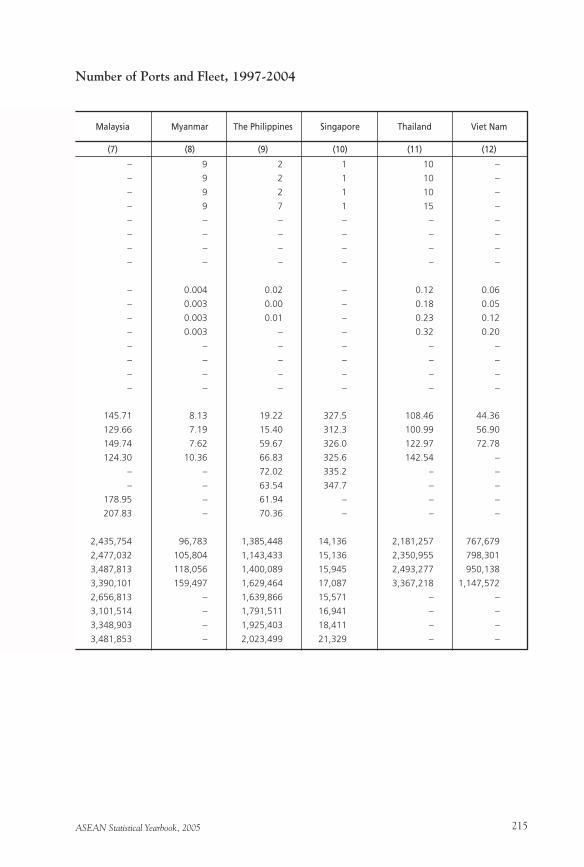
ASEAN Statistical Yearbook, 2005 215
Number of Ports and Fleet, 1997-2004
– 9 2 1 10 –
– 9 2 1 10 –
– 9 2 1 10 –
– 9 7 1 15 –
– – – – – –
– – – – – –
– – – – – –
– – – – – –
– 0.004 0.02 – 0.12 0.06
– 0.003 0.00 – 0.18 0.05
– 0.003 0.01 – 0.23 0.12
– 0.003 – – 0.32 0.20
– – – – – –
– – – – – –
– – – – – –
– – – – – –
145.71 8.13 19.22 327.5 108.46 44.36
129.66 7.19 15.40 312.3 100.99 56.90
149.74 7.62 59.67 326.0 122.97 72.78
124.30 10.36 66.83 325.6 142.54 –
– – 72.02 335.2 – –
– – 63.54 347.7 – –
178.95 – 61.94 – – –
207.83 – 70.36 – – –
2,435,754 96,783 1,385,448 14,136 2,181,257 767,679
2,477,032 105,804 1,143,433 15,136 2,350,955 798,301
3,487,813 118,056 1,400,089 15,945 2,493,277 950,138
3,390,101 159,497 1,629,464 17,087 3,367,218 1,147,572
2,656,813 – 1,639,866 15,571 – –
3,101,514 – 1,791,511 16,941 – –
3,348,903 – 1,925,403 18,411 – –
3,481,853 – 2,023,499 21,329 – –
Malaysia Myanmar The Philippines Singapore Thailand Viet Nam
(7) (8) (9) (10) (11) (12)
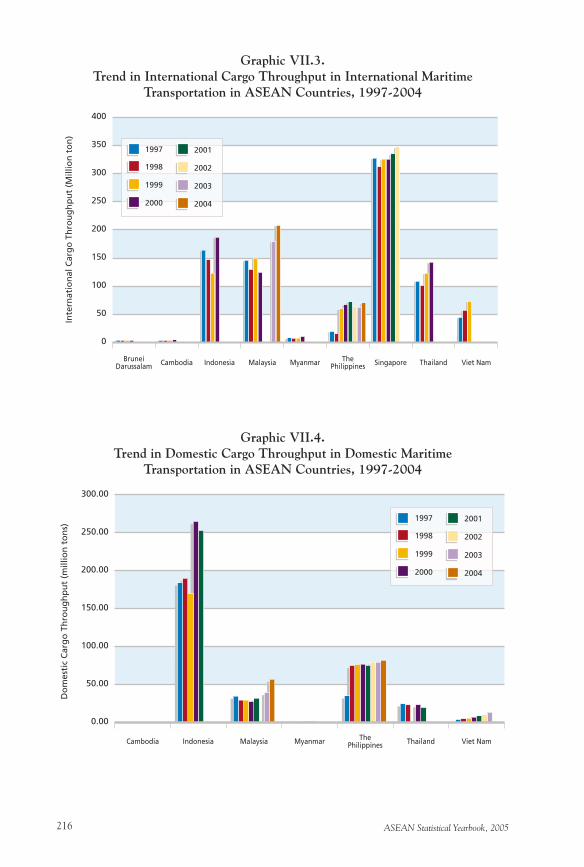
ASEAN Statistical Yearbook, 2005216
Graphic VII.3.Trend in International Cargo Throughput in International Maritime
Transportation in ASEAN Countries, 1997-2004
Graphic VII.4.Trend in Domestic Cargo Throughput in Domestic Maritime
Transportation in ASEAN Countries, 1997-2004
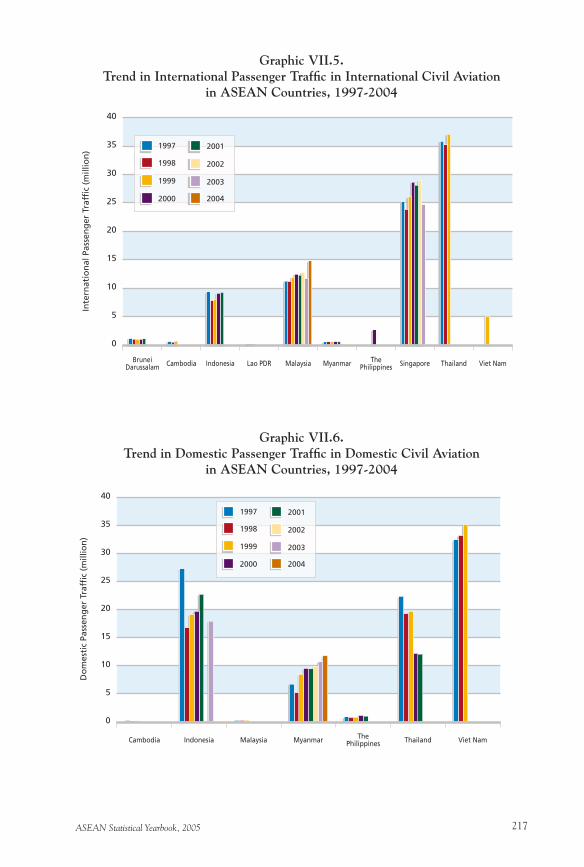
ASEAN Statistical Yearbook, 2005 217
Graphic VII.5.Trend in International Passenger Traffic in International Civil Aviation
in ASEAN Countries, 1997-2004
Graphic VII.6.Trend in Domestic Passenger Traffic in Domestic Civil Aviation
in ASEAN Countries, 1997-2004
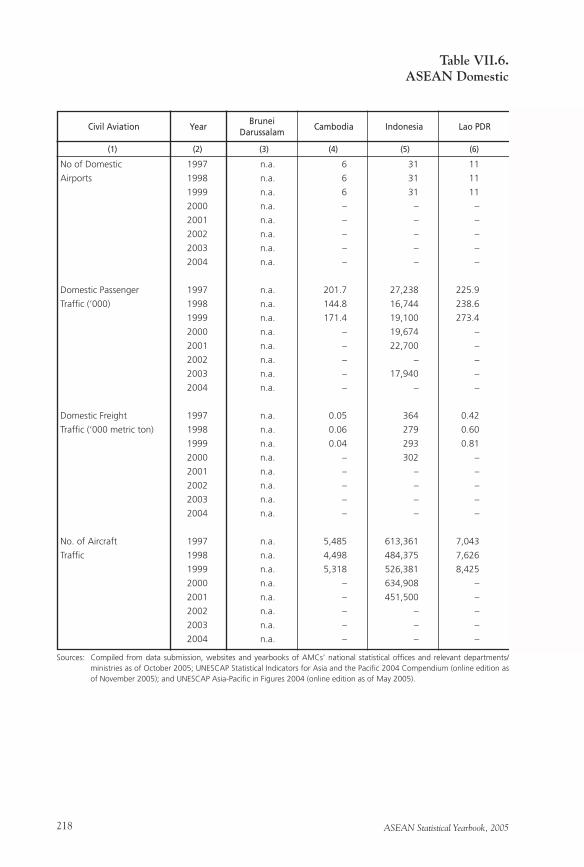
ASEAN Statistical Yearbook, 2005218
Table VII.6.ASEAN Domestic
No of Domestic 1997 n.a. 6 31 11
Airports 1998 n.a. 6 31 11
1999 n.a. 6 31 11
2000 n.a. – – –
2001 n.a. – – –
2002 n.a. – – –
2003 n.a. – – –
2004 n.a. – – –
Domestic Passenger 1997 n.a. 201.7 27,238 225.9
Traffic (‘000) 1998 n.a. 144.8 16,744 238.6
1999 n.a. 171.4 19,100 273.4
2000 n.a. – 19,674 –
2001 n.a. – 22,700 –
2002 n.a. – – –
2003 n.a. – 17,940 –
2004 n.a. – – –
Domestic Freight 1997 n.a. 0.05 364 0.42
Traffic (‘000 metric ton) 1998 n.a. 0.06 279 0.60
1999 n.a. 0.04 293 0.81
2000 n.a. – 302 –
2001 n.a. – – –
2002 n.a. – – –
2003 n.a. – – –
2004 n.a. – – –
No. of Aircraft 1997 n.a. 5,485 613,361 7,043
Traffic 1998 n.a. 4,498 484,375 7,626
1999 n.a. 5,318 526,381 8,425
2000 n.a. – 634,908 –
2001 n.a. – 451,500 –
2002 n.a. – – –
2003 n.a. – – –
2004 n.a. – – –
Civil Aviation
(1) (2) (3) (4) (5) (6)
Sources: Compiled from data submission, websites and yearbooks of AMCs’ national statistical offices and relevant departments/ministries as of October 2005; UNESCAP Statistical Indicators for Asia and the Pacific 2004 Compendium (online edition as of November 2005); and UNESCAP Asia-Pacific in Figures 2004 (online edition as of May 2005).
Brunei Darussalam
Cambodia Indonesia Lao PDRYear
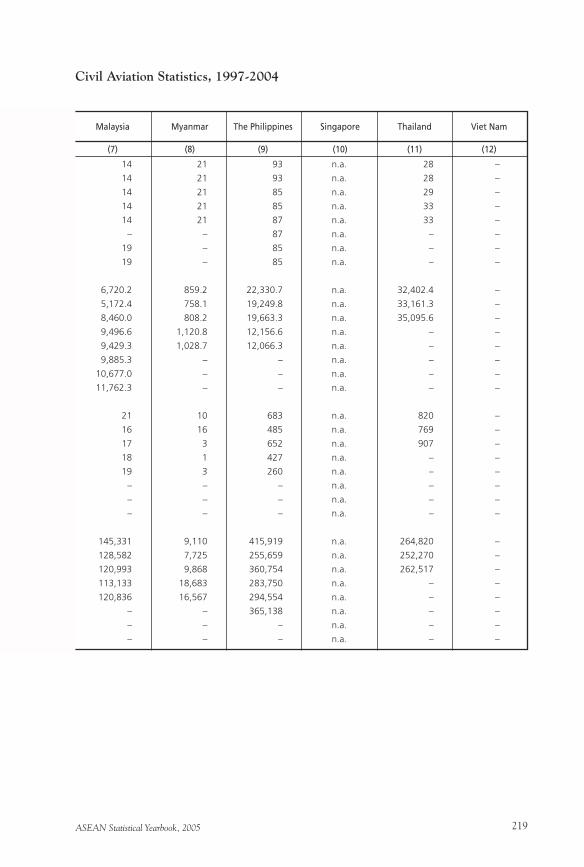
ASEAN Statistical Yearbook, 2005 219
Civil Aviation Statistics, 1997-2004
14 21 93 n.a. 28 –
14 21 93 n.a. 28 –
14 21 85 n.a. 29 –
14 21 85 n.a. 33 –
14 21 87 n.a. 33 –
– – 87 n.a. – –
19 – 85 n.a. – –
19 – 85 n.a. – –
6,720.2 859.2 22,330.7 n.a. 32,402.4 –
5,172.4 758.1 19,249.8 n.a. 33,161.3 –
8,460.0 808.2 19,663.3 n.a. 35,095.6 –
9,496.6 1,120.8 12,156.6 n.a. – –
9,429.3 1,028.7 12,066.3 n.a. – –
9,885.3 – – n.a. – –
10,677.0 – – n.a. – –
11,762.3 – – n.a. – –
21 10 683 n.a. 820 –
16 16 485 n.a. 769 –
17 3 652 n.a. 907 –
18 1 427 n.a. – –
19 3 260 n.a. – –
– – – n.a. – –
– – – n.a. – –
– – – n.a. – –
145,331 9,110 415,919 n.a. 264,820 –
128,582 7,725 255,659 n.a. 252,270 –
120,993 9,868 360,754 n.a. 262,517 –
113,133 18,683 283,750 n.a. – –
120,836 16,567 294,554 n.a. – –
– – 365,138 n.a. – –
– – – n.a. – –
– – – n.a. – –
Malaysia Myanmar The Philippines Singapore Thailand Viet Nam
(7) (8) (9) (10) (11) (12)
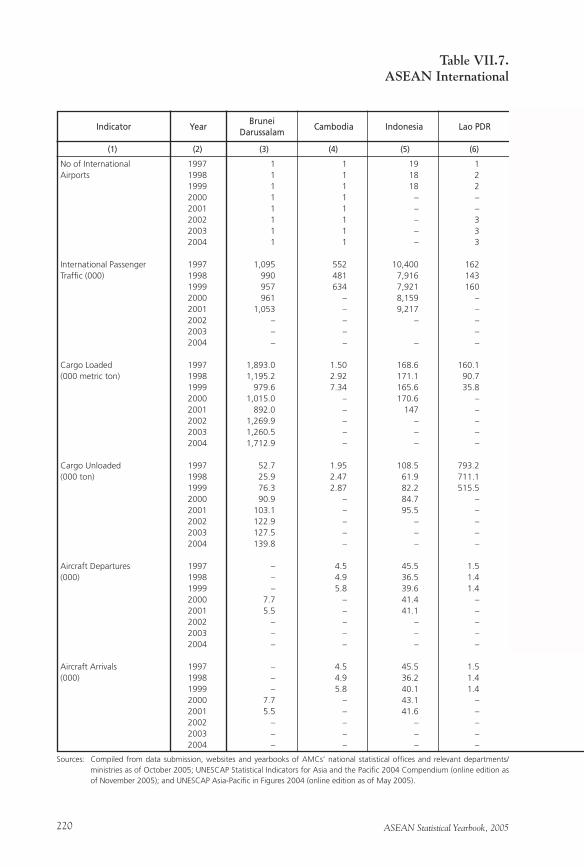
ASEAN Statistical Yearbook, 2005220
Table VII.7.ASEAN International
No of International 1997 1 1 19 1Airports 1998 1 1 18 2 1999 1 1 18 2 2000 1 1 – – 2001 1 1 – – 2002 1 1 – 3 2003 1 1 – 3 2004 1 1 – 3 International Passenger 1997 1,095 552 10,400 162Traffic (000) 1998 990 481 7,916 143 1999 957 634 7,921 160 2000 961 – 8,159 – 2001 1,053 – 9,217 – 2002 – – – – 2003 – – – 2004 – – – – Cargo Loaded 1997 1,893.0 1.50 168.6 160.1(000 metric ton) 1998 1,195.2 2.92 171.1 90.7 1999 979.6 7.34 165.6 35.8 2000 1,015.0 – 170.6 – 2001 892.0 – 147 – 2002 1,269.9 – – – 2003 1,260.5 – – – 2004 1,712.9 – – – Cargo Unloaded 1997 52.7 1.95 108.5 793.2(000 ton) 1998 25.9 2.47 61.9 711.1 1999 76.3 2.87 82.2 515.5 2000 90.9 – 84.7 – 2001 103.1 – 95.5 – 2002 122.9 – – – 2003 127.5 – – – 2004 139.8 – – – Aircraft Departures 1997 – 4.5 45.5 1.5(000) 1998 – 4.9 36.5 1.4 1999 – 5.8 39.6 1.4 2000 7.7 – 41.4 – 2001 5.5 – 41.1 – 2002 – – – – 2003 – – – – 2004 – – – – Aircraft Arrivals 1997 – 4.5 45.5 1.5(000) 1998 – 4.9 36.2 1.4 1999 – 5.8 40.1 1.4 2000 7.7 – 43.1 – 2001 5.5 – 41.6 – 2002 – – – – 2003 – – – – 2004 – – – –
Indicator
(1) (2) (3) (4) (5) (6)
Sources: Compiled from data submission, websites and yearbooks of AMCs’ national statistical offices and relevant departments/ministries as of October 2005; UNESCAP Statistical Indicators for Asia and the Pacific 2004 Compendium (online edition as of November 2005); and UNESCAP Asia-Pacific in Figures 2004 (online edition as of May 2005).
Brunei Darussalam
Cambodia Indonesia Lao PDRYear
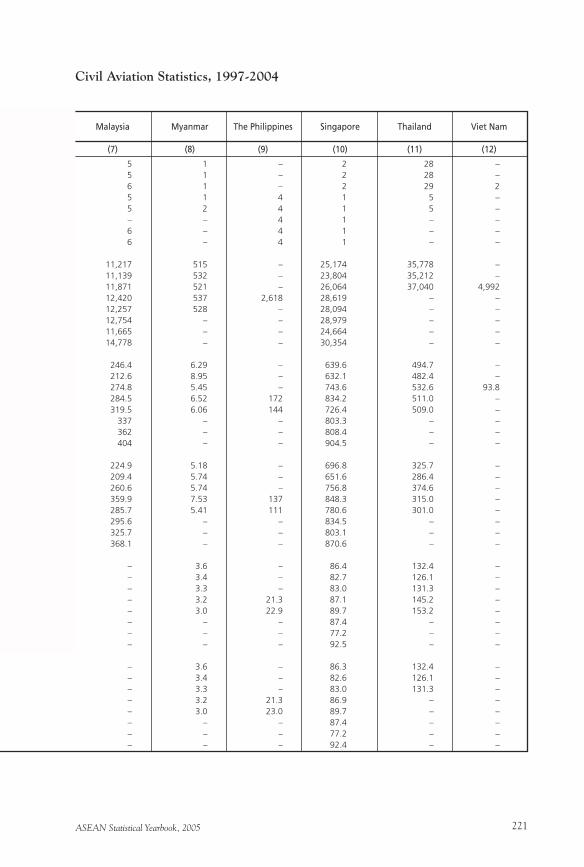
ASEAN Statistical Yearbook, 2005 221
Civil Aviation Statistics, 1997-2004
5 1 – 2 28 – 5 1 – 2 28 – 6 1 – 2 29 2 5 1 4 1 5 – 5 2 4 1 5 – – – 4 1 – – 6 – 4 1 – – 6 – 4 1 – – 11,217 515 – 25,174 35,778 – 11,139 532 – 23,804 35,212 – 11,871 521 – 26,064 37,040 4,992 12,420 537 2,618 28,619 – – 12,257 528 – 28,094 – – 12,754 – – 28,979 – – 11,665 – – 24,664 – – 14,778 – – 30,354 – – 246.4 6.29 – 639.6 494.7 – 212.6 8.95 – 632.1 482.4 – 274.8 5.45 – 743.6 532.6 93.8 284.5 6.52 172 834.2 511.0 – 319.5 6.06 144 726.4 509.0 – 337 – – 803.3 – – 362 – – 808.4 – – 404 – – 904.5 – – 224.9 5.18 – 696.8 325.7 – 209.4 5.74 – 651.6 286.4 – 260.6 5.74 – 756.8 374.6 – 359.9 7.53 137 848.3 315.0 – 285.7 5.41 111 780.6 301.0 – 295.6 – – 834.5 – – 325.7 – – 803.1 – – 368.1 – – 870.6 – – – 3.6 – 86.4 132.4 – – 3.4 – 82.7 126.1 – – 3.3 – 83.0 131.3 – – 3.2 21.3 87.1 145.2 – – 3.0 22.9 89.7 153.2 – – – – 87.4 – – – – – 77.2 – – – – – 92.5 – – – 3.6 – 86.3 132.4 – – 3.4 – 82.6 126.1 – – 3.3 – 83.0 131.3 – – 3.2 21.3 86.9 – – – 3.0 23.0 89.7 – – – – – 87.4 – – – – – 77.2 – – – – – 92.4 – –
Malaysia Myanmar The Philippines Singapore Thailand Viet Nam
(7) (8) (9) (10) (11) (12)

ASEAN Statistical Yearbook, 2005222

ASEAN Statistical Yearbook, 2005 223
Chapter VIIITourism

ASEAN Statistical Yearbook, 2005224
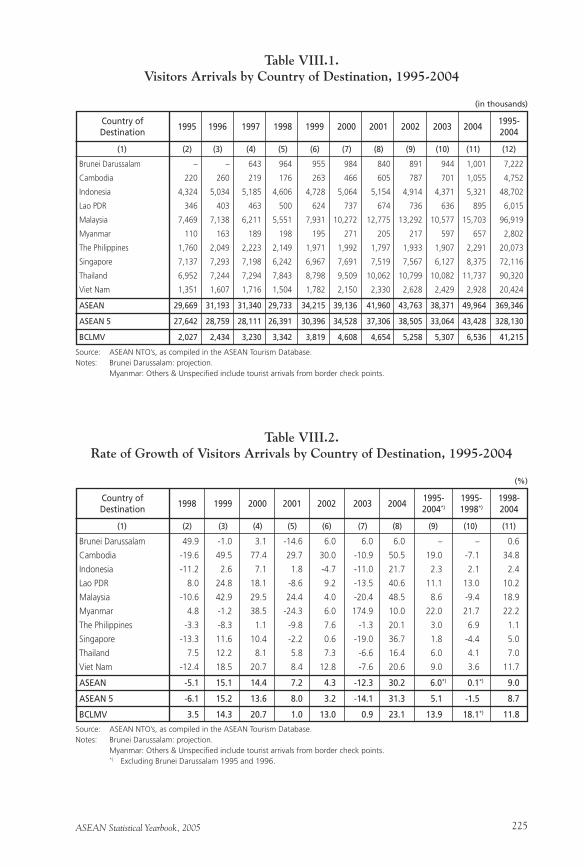
ASEAN Statistical Yearbook, 2005 225
Brunei Darussalam – – 643 964 955 984 840 891 944 1,001 7,222
Cambodia 220 260 219 176 263 466 605 787 701 1,055 4,752
Indonesia 4,324 5,034 5,185 4,606 4,728 5,064 5,154 4,914 4,371 5,321 48,702
Lao PDR 346 403 463 500 624 737 674 736 636 895 6,015
Malaysia 7,469 7,138 6,211 5,551 7,931 10,272 12,775 13,292 10,577 15,703 96,919
Myanmar 110 163 189 198 195 271 205 217 597 657 2,802
The Philippines 1,760 2,049 2,223 2,149 1,971 1,992 1,797 1,933 1,907 2,291 20,073
Singapore 7,137 7,293 7,198 6,242 6,967 7,691 7,519 7,567 6,127 8,375 72,116
Thailand 6,952 7,244 7,294 7,843 8,798 9,509 10,062 10,799 10,082 11,737 90,320
Viet Nam 1,351 1,607 1,716 1,504 1,782 2,150 2,330 2,628 2,429 2,928 20,424
ASEAN 29,669 31,193 31,340 29,733 34,215 39,136 41,960 43,763 38,371 49,964 369,346
ASEAN 5 27,642 28,759 28,111 26,391 30,396 34,528 37,306 38,505 33,064 43,428 328,130
BCLMV 2,027 2,434 3,230 3,342 3,819 4,608 4,654 5,258 5,307 6,536 41,215
Table VIII.1.Visitors Arrivals by Country of Destination, 1995-2004
Country of Destination
(1) (2) (3) (4) (5) (6) (7) (8) (9) (10) (11) (12)
(in thousands)
Source: ASEAN NTO’s, as compiled in the ASEAN Tourism Database.Notes: Brunei Darussalam: projection. Myanmar: Others & Unspecified include tourist arrivals from border check points.
1995 1996 1997 1998 1999 2000 2001 2002 2003 20041995-2004
Brunei Darussalam 49.9 -1.0 3.1 -14.6 6.0 6.0 6.0 – – 0.6
Cambodia -19.6 49.5 77.4 29.7 30.0 -10.9 50.5 19.0 -7.1 34.8
Indonesia -11.2 2.6 7.1 1.8 -4.7 -11.0 21.7 2.3 2.1 2.4
Lao PDR 8.0 24.8 18.1 -8.6 9.2 -13.5 40.6 11.1 13.0 10.2
Malaysia -10.6 42.9 29.5 24.4 4.0 -20.4 48.5 8.6 -9.4 18.9
Myanmar 4.8 -1.2 38.5 -24.3 6.0 174.9 10.0 22.0 21.7 22.2
The Philippines -3.3 -8.3 1.1 -9.8 7.6 -1.3 20.1 3.0 6.9 1.1
Singapore -13.3 11.6 10.4 -2.2 0.6 -19.0 36.7 1.8 -4.4 5.0
Thailand 7.5 12.2 8.1 5.8 7.3 -6.6 16.4 6.0 4.1 7.0
Viet Nam -12.4 18.5 20.7 8.4 12.8 -7.6 20.6 9.0 3.6 11.7
ASEAN -5.1 15.1 14.4 7.2 4.3 -12.3 30.2 6.0*) 0.1*) 9.0
ASEAN 5 -6.1 15.2 13.6 8.0 3.2 -14.1 31.3 5.1 -1.5 8.7
BCLMV 3.5 14.3 20.7 1.0 13.0 0.9 23.1 13.9 18.1*) 11.8
Table VIII.2.Rate of Growth of Visitors Arrivals by Country of Destination, 1995-2004
Country of Destination
(1) (2) (3) (4) (5) (6) (7) (8) (9) (10) (11)
(%)
Source: ASEAN NTO’s, as compiled in the ASEAN Tourism Database.Notes: Brunei Darussalam: projection. Myanmar: Others & Unspecified include tourist arrivals from border check points. *) Excluding Brunei Darussalam 1995 and 1996.
1998 1999 2000 2001 2002 2003 20041998-2004
1995-1998*)
1995-2004*)
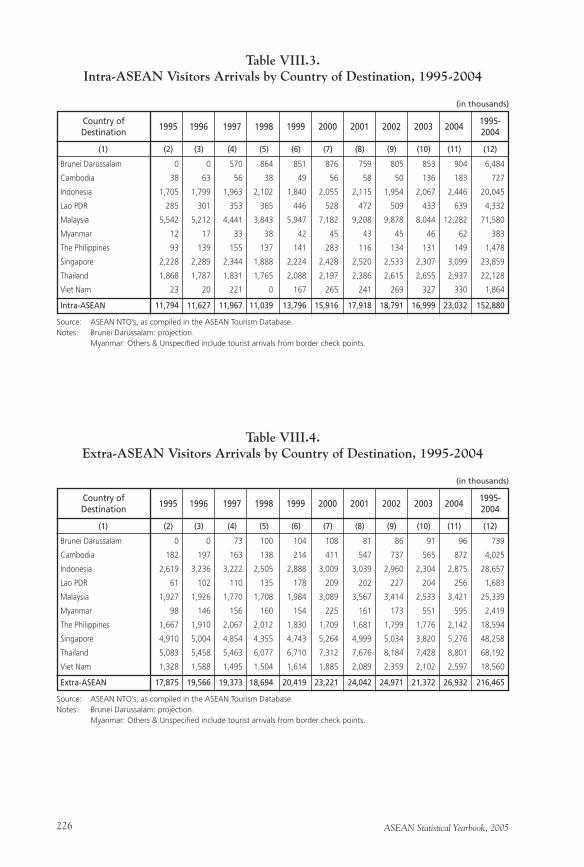
ASEAN Statistical Yearbook, 2005226
Brunei Darussalam 0 0 570 864 851 876 759 805 853 904 6,484
Cambodia 38 63 56 38 49 56 58 50 136 183 727
Indonesia 1,705 1,799 1,963 2,102 1,840 2,055 2,115 1,954 2,067 2,446 20,045
Lao PDR 285 301 353 365 446 528 472 509 433 639 4,332
Malaysia 5,542 5,212 4,441 3,843 5,947 7,182 9,208 9,878 8,044 12,282 71,580
Myanmar 12 17 33 38 42 45 43 45 46 62 383
The Philippines 93 139 155 137 141 283 116 134 131 149 1,478
Singapore 2,228 2,289 2,344 1,888 2,224 2,428 2,520 2,533 2,307 3,099 23,859
Thailand 1,868 1,787 1,831 1,765 2,088 2,197 2,386 2,615 2,655 2,937 22,128
Viet Nam 23 20 221 0 167 265 241 269 327 330 1,864
Intra-ASEAN 11,794 11,627 11,967 11,039 13,796 15,916 17,918 18,791 16,999 23,032 152,880
Table VIII.3.Intra-ASEAN Visitors Arrivals by Country of Destination, 1995-2004
Country of Destination
(1) (2) (3) (4) (5) (6) (7) (8) (9) (10) (11) (12)
(in thousands)
Source: ASEAN NTO’s, as compiled in the ASEAN Tourism Database.Notes: Brunei Darussalam: projection. Myanmar: Others & Unspecified include tourist arrivals from border check points.
1995 1996 1997 1998 1999 2000 2001 2002 2003 20041995-2004
Brunei Darussalam 0 0 73 100 104 108 81 86 91 96 739
Cambodia 182 197 163 138 214 411 547 737 565 872 4,025
Indonesia 2,619 3,236 3,222 2,505 2,888 3,009 3,039 2,960 2,304 2,875 28,657
Lao PDR 61 102 110 135 178 209 202 227 204 256 1,683
Malaysia 1,927 1,926 1,770 1,708 1,984 3,089 3,567 3,414 2,533 3,421 25,339
Myanmar 98 146 156 160 154 225 161 173 551 595 2,419
The Philippines 1,667 1,910 2,067 2,012 1,830 1,709 1,681 1,799 1,776 2,142 18,594
Singapore 4,910 5,004 4,854 4,355 4,743 5,264 4,999 5,034 3,820 5,276 48,258
Thailand 5,083 5,458 5,463 6,077 6,710 7,312 7,676 8,184 7,428 8,801 68,192
Viet Nam 1,328 1,588 1,495 1,504 1,614 1,885 2,089 2,359 2,102 2,597 18,560
Extra-ASEAN 17,875 19,566 19,373 18,694 20,419 23,221 24,042 24,971 21,372 26,932 216,465
Table VIII.4.Extra-ASEAN Visitors Arrivals by Country of Destination, 1995-2004
Country of Destination
(1) (2) (3) (4) (5) (6) (7) (8) (9) (10) (11) (12)
(in thousands)
Source: ASEAN NTO’s, as compiled in the ASEAN Tourism Database.Notes: Brunei Darussalam: projection. Myanmar: Others & Unspecified include tourist arrivals from border check points.
1995 1996 1997 1998 1999 2000 2001 2002 2003 20041995-2004
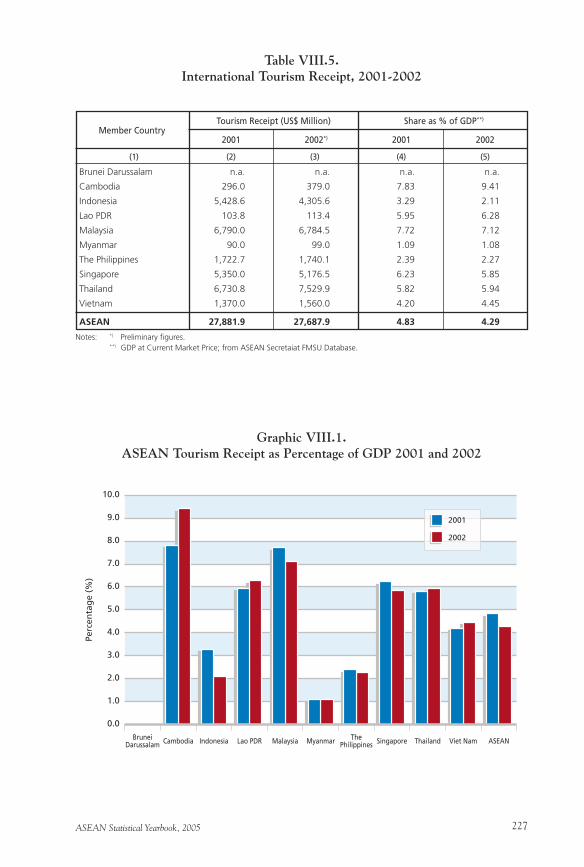
ASEAN Statistical Yearbook, 2005 227
Brunei Darussalam n.a. n.a. n.a. n.a.
Cambodia 296.0 379.0 7.83 9.41
Indonesia 5,428.6 4,305.6 3.29 2.11
Lao PDR 103.8 113.4 5.95 6.28
Malaysia 6,790.0 6,784.5 7.72 7.12
Myanmar 90.0 99.0 1.09 1.08
The Philippines 1,722.7 1,740.1 2.39 2.27
Singapore 5,350.0 5,176.5 6.23 5.85
Thailand 6,730.8 7,529.9 5.82 5.94
Vietnam 1,370.0 1,560.0 4.20 4.45
ASEAN 27,881.9 27,687.9 4.83 4.29
Tourism Receipt (US$ Million) Share as % of GDP**)
Table VIII.5.International Tourism Receipt, 2001-2002
Member Country
(1) (2) (3) (4) (5)
Notes: *) Preliminary figures. **) GDP at Current Market Price; from ASEAN Secretaiat FMSU Database.
2001 2002*) 2001 2002
Graphic VIII.1.ASEAN Tourism Receipt as Percentage of GDP 2001 and 2002

ASEAN Statistical Yearbook, 2005228
ASEAN 11,794 11,627 11,967 11,039
REST OF THE WORLD 17,875 19,566 19,373 18,694
ASIA (Other than ASEAN) 9,480 10,619 10,341 9,045
Hongkong 996 1,121 1,118 1,111
South Korea 1,120 1,388 1,267 596
Taiwan (ROC) 2,141 2,262 2,031 1,646
China 818 1,276 1,299 1,512
India 397 430 454 506
Japan 3,295 3,664 3,652 3,070
Other Asia 713 477 519 604
E U R O P E 4,298 4,349 4,478 4,499
France 574 549 565 559
Germany 849 855 864 817
Italy 268 262 262 253
Netherlands 320 430 323 279
Scandinavia 347 418 456 419
United Kingdom 1,032 1,056 1,114 1,231
Other Europe 907 779 894 941
AMERICAS 1,743 1,765 1,927 1,985
Canada 235 255 282 267
USA 1,443 1,441 1,577 1,637
Other Americas 66 70 68 80
OCEANIA 1,237 1,368 1,644 1,574
Australia 1,084 1,201 1,457 1,387
New Zealand 153 167 187 184
Other Oceania 0 0 0 3
OTHERS*) 1,117 1,466 983 1,591
TOTAL 29,669 31,193 31,340 29,733
Table VIII.6.Visitor Arrivals to ASEAN
Country of Destination 1995 1996 1997 1998
(1) (2) (3) (4) (5)
Source: ASEAN NTO’s, as compiled in the ASEAN Tourism Database.Notes: Brunei Darussalam: projection Myanmar: Others & Unspecified include tourist arrivals from border check points Scandinavia: Finland, Norway, and Sweden *) 2002 and 2003: includes Extra-ASEAN tourist arrivals of Brunei Darussalam, as data are not broken down by Country of
Origin which is (in thousands) 1117 (2002) and 1057 (2003).
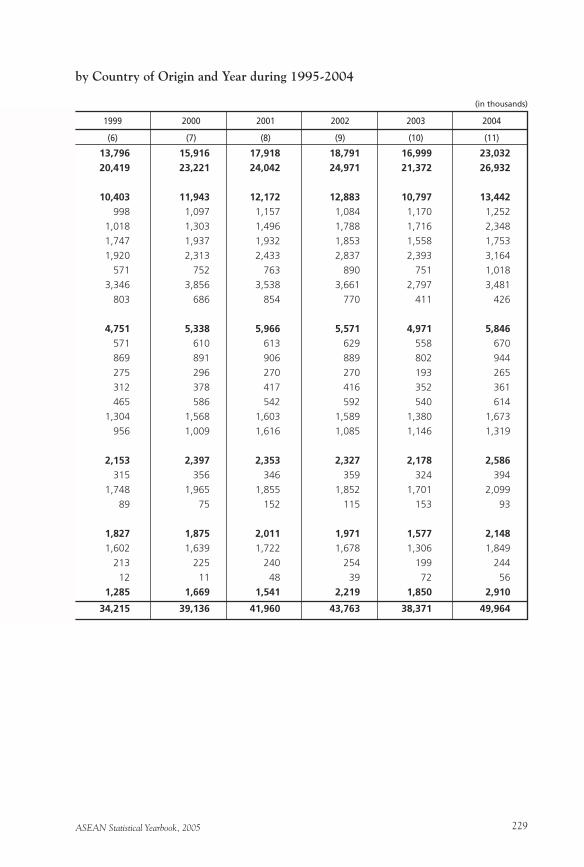
ASEAN Statistical Yearbook, 2005 229
(in thousands)
by Country of Origin and Year during 1995-2004
1999 2000 2001 2002 2003 2004
(6) (7) (8) (9) (10) (11)
13,796 15,916 17,918 18,791 16,999 23,032
20,419 23,221 24,042 24,971 21,372 26,932
10,403 11,943 12,172 12,883 10,797 13,442
998 1,097 1,157 1,084 1,170 1,252
1,018 1,303 1,496 1,788 1,716 2,348
1,747 1,937 1,932 1,853 1,558 1,753
1,920 2,313 2,433 2,837 2,393 3,164
571 752 763 890 751 1,018
3,346 3,856 3,538 3,661 2,797 3,481
803 686 854 770 411 426
4,751 5,338 5,966 5,571 4,971 5,846
571 610 613 629 558 670
869 891 906 889 802 944
275 296 270 270 193 265
312 378 417 416 352 361
465 586 542 592 540 614
1,304 1,568 1,603 1,589 1,380 1,673
956 1,009 1,616 1,085 1,146 1,319
2,153 2,397 2,353 2,327 2,178 2,586
315 356 346 359 324 394
1,748 1,965 1,855 1,852 1,701 2,099
89 75 152 115 153 93
1,827 1,875 2,011 1,971 1,577 2,148
1,602 1,639 1,722 1,678 1,306 1,849
213 225 240 254 199 244
12 11 48 39 72 56
1,285 1,669 1,541 2,219 1,850 2,910
34,215 39,136 41,960 43,763 38,371 49,964
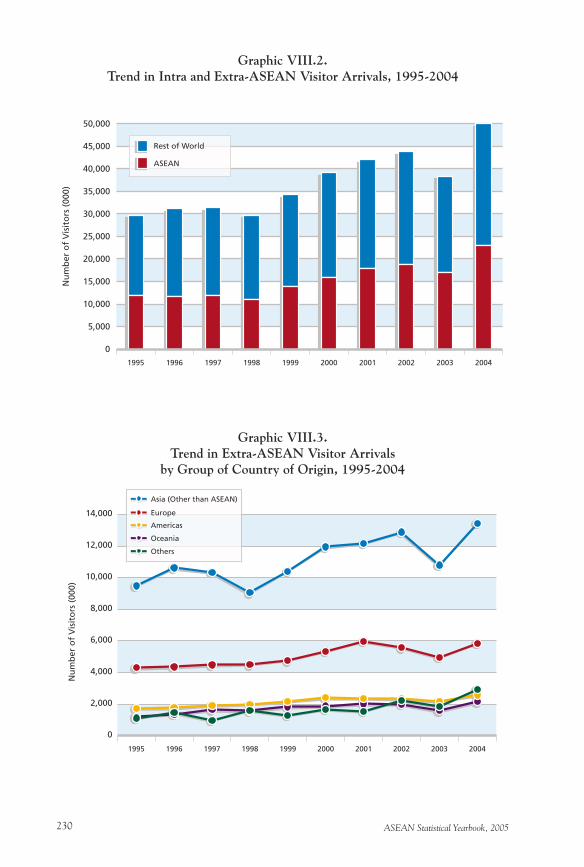
ASEAN Statistical Yearbook, 2005230
Graphic VIII.2.Trend in Intra and Extra-ASEAN Visitor Arrivals, 1995-2004
Graphic VIII.3.Trend in Extra-ASEAN Visitor Arrivals
by Group of Country of Origin, 1995-2004
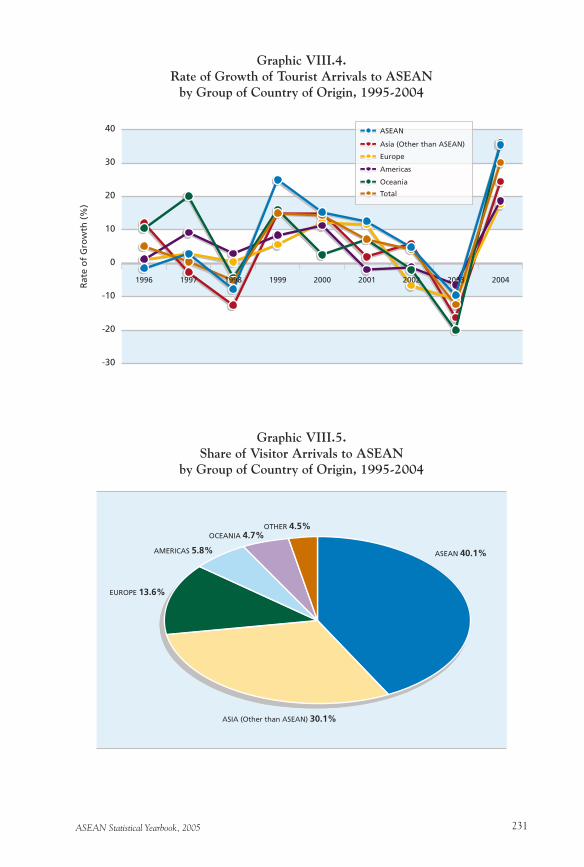
ASEAN Statistical Yearbook, 2005 231
Graphic VIII.4.Rate of Growth of Tourist Arrivals to ASEAN
by Group of Country of Origin, 1995-2004
Graphic VIII.5.Share of Visitor Arrivals to ASEAN
by Group of Country of Origin, 1995-2004
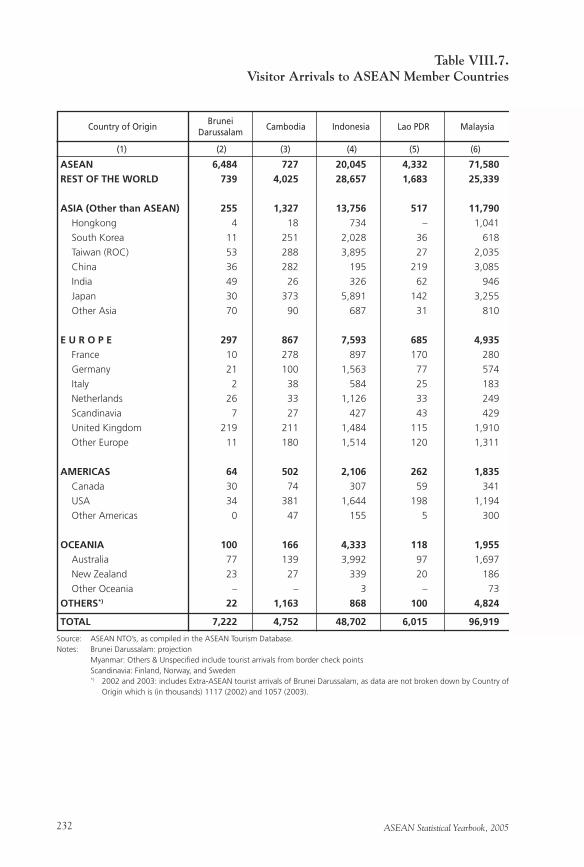
ASEAN Statistical Yearbook, 2005232
ASEAN 6,484 727 20,045 4,332 71,580
REST OF THE WORLD 739 4,025 28,657 1,683 25,339
ASIA (Other than ASEAN) 255 1,327 13,756 517 11,790
Hongkong 4 18 734 – 1,041
South Korea 11 251 2,028 36 618
Taiwan (ROC) 53 288 3,895 27 2,035
China 36 282 195 219 3,085
India 49 26 326 62 946
Japan 30 373 5,891 142 3,255
Other Asia 70 90 687 31 810
E U R O P E 297 867 7,593 685 4,935
France 10 278 897 170 280
Germany 21 100 1,563 77 574
Italy 2 38 584 25 183
Netherlands 26 33 1,126 33 249
Scandinavia 7 27 427 43 429
United Kingdom 219 211 1,484 115 1,910
Other Europe 11 180 1,514 120 1,311
AMERICAS 64 502 2,106 262 1,835
Canada 30 74 307 59 341
USA 34 381 1,644 198 1,194
Other Americas 0 47 155 5 300
OCEANIA 100 166 4,333 118 1,955
Australia 77 139 3,992 97 1,697
New Zealand 23 27 339 20 186
Other Oceania – – 3 – 73
OTHERS*) 22 1,163 868 100 4,824
TOTAL 7,222 4,752 48,702 6,015 96,919
Table VIII.7.Visitor Arrivals to ASEAN Member Countries
Cambodia Indonesia Lao PDR Malaysia
(1) (2) (3) (4) (5) (6)
Source: ASEAN NTO’s, as compiled in the ASEAN Tourism Database.Notes: Brunei Darussalam: projection Myanmar: Others & Unspecified include tourist arrivals from border check points Scandinavia: Finland, Norway, and Sweden *) 2002 and 2003: includes Extra-ASEAN tourist arrivals of Brunei Darussalam, as data are not broken down by Country of
Origin which is (in thousands) 1117 (2002) and 1057 (2003).
Country of OriginBrunei
Darussalam
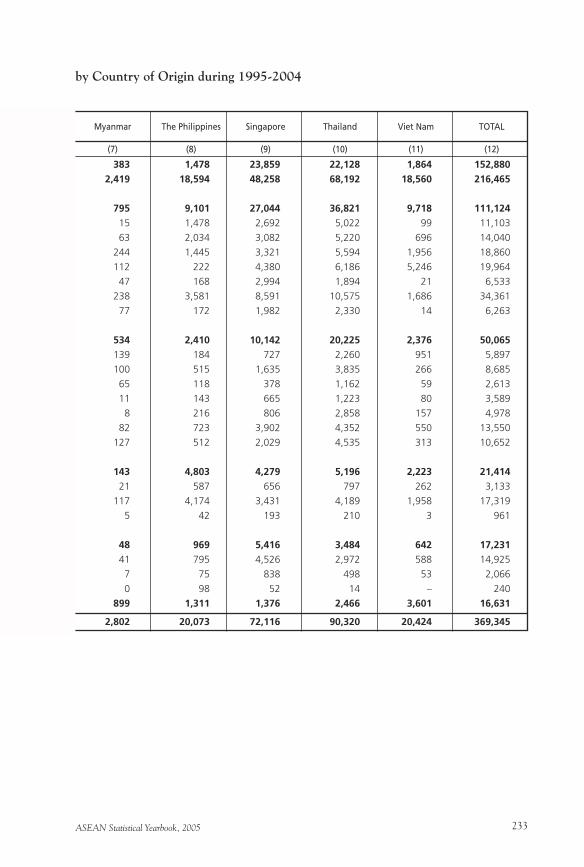
ASEAN Statistical Yearbook, 2005 233
by Country of Origin during 1995-2004
Myanmar The Philippines Singapore Thailand Viet Nam TOTAL
(7) (8) (9) (10) (11) (12)
383 1,478 23,859 22,128 1,864 152,880
2,419 18,594 48,258 68,192 18,560 216,465
795 9,101 27,044 36,821 9,718 111,124
15 1,478 2,692 5,022 99 11,103
63 2,034 3,082 5,220 696 14,040
244 1,445 3,321 5,594 1,956 18,860
112 222 4,380 6,186 5,246 19,964
47 168 2,994 1,894 21 6,533
238 3,581 8,591 10,575 1,686 34,361
77 172 1,982 2,330 14 6,263
534 2,410 10,142 20,225 2,376 50,065
139 184 727 2,260 951 5,897
100 515 1,635 3,835 266 8,685
65 118 378 1,162 59 2,613
11 143 665 1,223 80 3,589
8 216 806 2,858 157 4,978
82 723 3,902 4,352 550 13,550
127 512 2,029 4,535 313 10,652
143 4,803 4,279 5,196 2,223 21,414
21 587 656 797 262 3,133
117 4,174 3,431 4,189 1,958 17,319
5 42 193 210 3 961
48 969 5,416 3,484 642 17,231
41 795 4,526 2,972 588 14,925
7 75 838 498 53 2,066
0 98 52 14 – 240
899 1,311 1,376 2,466 3,601 16,631
2,802 20,073 72,116 90,320 20,424 369,345
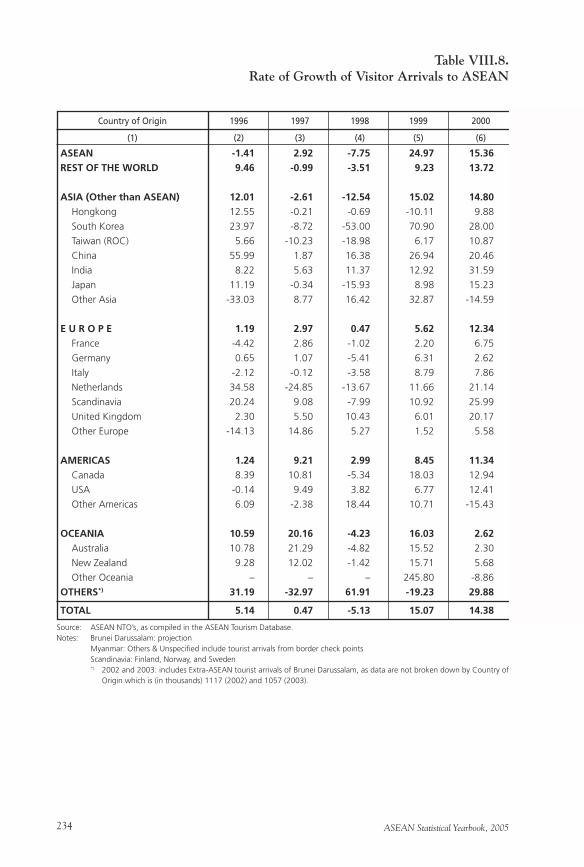
ASEAN Statistical Yearbook, 2005234
ASEAN -1.41 2.92 -7.75 24.97 15.36
REST OF THE WORLD 9.46 -0.99 -3.51 9.23 13.72
ASIA (Other than ASEAN) 12.01 -2.61 -12.54 15.02 14.80
Hongkong 12.55 -0.21 -0.69 -10.11 9.88
South Korea 23.97 -8.72 -53.00 70.90 28.00
Taiwan (ROC) 5.66 -10.23 -18.98 6.17 10.87
China 55.99 1.87 16.38 26.94 20.46
India 8.22 5.63 11.37 12.92 31.59
Japan 11.19 -0.34 -15.93 8.98 15.23
Other Asia -33.03 8.77 16.42 32.87 -14.59
E U R O P E 1.19 2.97 0.47 5.62 12.34
France -4.42 2.86 -1.02 2.20 6.75
Germany 0.65 1.07 -5.41 6.31 2.62
Italy -2.12 -0.12 -3.58 8.79 7.86
Netherlands 34.58 -24.85 -13.67 11.66 21.14
Scandinavia 20.24 9.08 -7.99 10.92 25.99
United Kingdom 2.30 5.50 10.43 6.01 20.17
Other Europe -14.13 14.86 5.27 1.52 5.58
AMERICAS 1.24 9.21 2.99 8.45 11.34
Canada 8.39 10.81 -5.34 18.03 12.94
USA -0.14 9.49 3.82 6.77 12.41
Other Americas 6.09 -2.38 18.44 10.71 -15.43
OCEANIA 10.59 20.16 -4.23 16.03 2.62
Australia 10.78 21.29 -4.82 15.52 2.30
New Zealand 9.28 12.02 -1.42 15.71 5.68
Other Oceania – – – 245.80 -8.86
OTHERS*) 31.19 -32.97 61.91 -19.23 29.88
TOTAL 5.14 0.47 -5.13 15.07 14.38
Table VIII.8.Rate of Growth of Visitor Arrivals to ASEAN
Country of Origin 1996 1997 1998 1999 2000
(1) (2) (3) (4) (5) (6)
Source: ASEAN NTO’s, as compiled in the ASEAN Tourism Database.Notes: Brunei Darussalam: projection Myanmar: Others & Unspecified include tourist arrivals from border check points Scandinavia: Finland, Norway, and Sweden *) 2002 and 2003: includes Extra-ASEAN tourist arrivals of Brunei Darussalam, as data are not broken down by Country of
Origin which is (in thousands) 1117 (2002) and 1057 (2003).
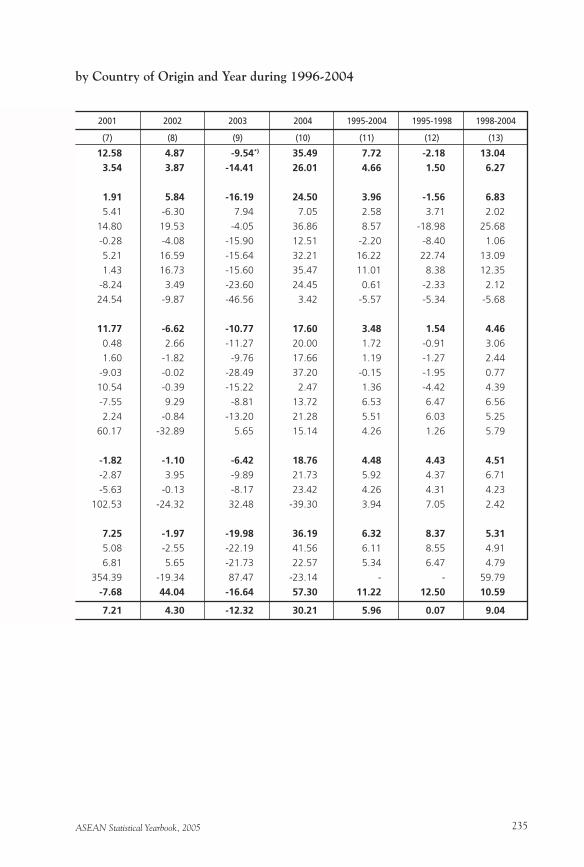
ASEAN Statistical Yearbook, 2005 235
by Country of Origin and Year during 1996-2004
2001 2002 2003 2004 1995-2004 1995-1998 1998-2004
(7) (8) (9) (10) (11) (12) (13)
12.58 4.87 -9.54*) 35.49 7.72 -2.18 13.04
3.54 3.87 -14.41 26.01 4.66 1.50 6.27
1.91 5.84 -16.19 24.50 3.96 -1.56 6.83
5.41 -6.30 7.94 7.05 2.58 3.71 2.02
14.80 19.53 -4.05 36.86 8.57 -18.98 25.68
-0.28 -4.08 -15.90 12.51 -2.20 -8.40 1.06
5.21 16.59 -15.64 32.21 16.22 22.74 13.09
1.43 16.73 -15.60 35.47 11.01 8.38 12.35
-8.24 3.49 -23.60 24.45 0.61 -2.33 2.12
24.54 -9.87 -46.56 3.42 -5.57 -5.34 -5.68
11.77 -6.62 -10.77 17.60 3.48 1.54 4.46
0.48 2.66 -11.27 20.00 1.72 -0.91 3.06
1.60 -1.82 -9.76 17.66 1.19 -1.27 2.44
-9.03 -0.02 -28.49 37.20 -0.15 -1.95 0.77
10.54 -0.39 -15.22 2.47 1.36 -4.42 4.39
-7.55 9.29 -8.81 13.72 6.53 6.47 6.56
2.24 -0.84 -13.20 21.28 5.51 6.03 5.25
60.17 -32.89 5.65 15.14 4.26 1.26 5.79
-1.82 -1.10 -6.42 18.76 4.48 4.43 4.51
-2.87 3.95 -9.89 21.73 5.92 4.37 6.71
-5.63 -0.13 -8.17 23.42 4.26 4.31 4.23
102.53 -24.32 32.48 -39.30 3.94 7.05 2.42
7.25 -1.97 -19.98 36.19 6.32 8.37 5.31
5.08 -2.55 -22.19 41.56 6.11 8.55 4.91
6.81 5.65 -21.73 22.57 5.34 6.47 4.79
354.39 -19.34 87.47 -23.14 - - 59.79
-7.68 44.04 -16.64 57.30 11.22 12.50 10.59
7.21 4.30 -12.32 30.21 5.96 0.07 9.04
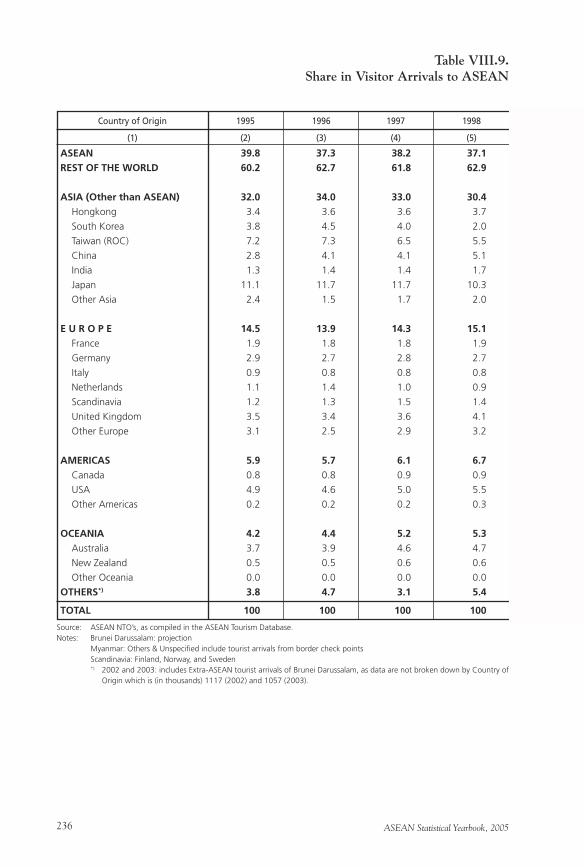
ASEAN Statistical Yearbook, 2005236
ASEAN 39.8 37.3 38.2 37.1
REST OF THE WORLD 60.2 62.7 61.8 62.9
ASIA (Other than ASEAN) 32.0 34.0 33.0 30.4
Hongkong 3.4 3.6 3.6 3.7
South Korea 3.8 4.5 4.0 2.0
Taiwan (ROC) 7.2 7.3 6.5 5.5
China 2.8 4.1 4.1 5.1
India 1.3 1.4 1.4 1.7
Japan 11.1 11.7 11.7 10.3
Other Asia 2.4 1.5 1.7 2.0
E U R O P E 14.5 13.9 14.3 15.1
France 1.9 1.8 1.8 1.9
Germany 2.9 2.7 2.8 2.7
Italy 0.9 0.8 0.8 0.8
Netherlands 1.1 1.4 1.0 0.9
Scandinavia 1.2 1.3 1.5 1.4
United Kingdom 3.5 3.4 3.6 4.1
Other Europe 3.1 2.5 2.9 3.2
AMERICAS 5.9 5.7 6.1 6.7
Canada 0.8 0.8 0.9 0.9
USA 4.9 4.6 5.0 5.5
Other Americas 0.2 0.2 0.2 0.3
OCEANIA 4.2 4.4 5.2 5.3
Australia 3.7 3.9 4.6 4.7
New Zealand 0.5 0.5 0.6 0.6
Other Oceania 0.0 0.0 0.0 0.0
OTHERS*) 3.8 4.7 3.1 5.4
TOTAL 100 100 100 100
Table VIII.9.Share in Visitor Arrivals to ASEAN
Country of Origin 1995 1996 1997 1998
(1) (2) (3) (4) (5)
Source: ASEAN NTO’s, as compiled in the ASEAN Tourism Database.Notes: Brunei Darussalam: projection Myanmar: Others & Unspecified include tourist arrivals from border check points Scandinavia: Finland, Norway, and Sweden *) 2002 and 2003: includes Extra-ASEAN tourist arrivals of Brunei Darussalam, as data are not broken down by Country of
Origin which is (in thousands) 1117 (2002) and 1057 (2003).
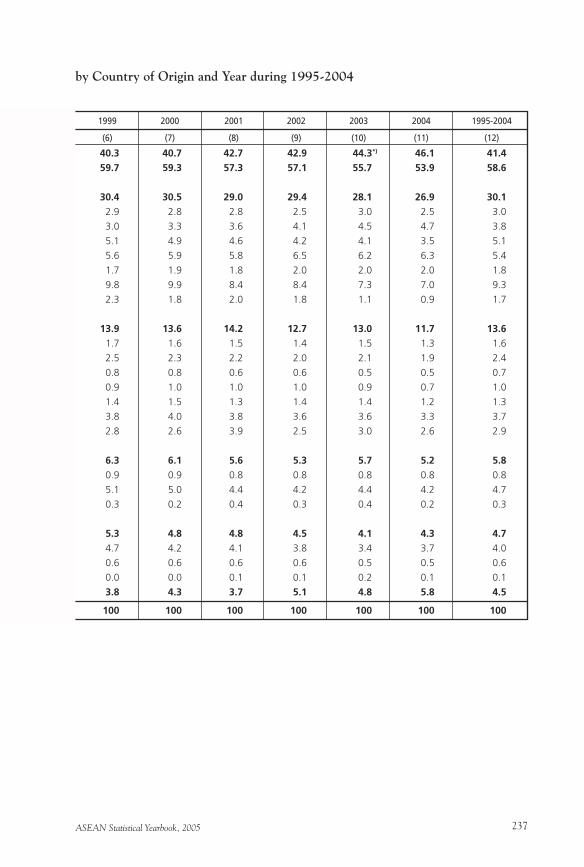
ASEAN Statistical Yearbook, 2005 237
by Country of Origin and Year during 1995-2004
1999 2000 2001 2002 2003 2004 1995-2004
(6) (7) (8) (9) (10) (11) (12)
40.3 40.7 42.7 42.9 44.3*) 46.1 41.4
59.7 59.3 57.3 57.1 55.7 53.9 58.6
30.4 30.5 29.0 29.4 28.1 26.9 30.1
2.9 2.8 2.8 2.5 3.0 2.5 3.0
3.0 3.3 3.6 4.1 4.5 4.7 3.8
5.1 4.9 4.6 4.2 4.1 3.5 5.1
5.6 5.9 5.8 6.5 6.2 6.3 5.4
1.7 1.9 1.8 2.0 2.0 2.0 1.8
9.8 9.9 8.4 8.4 7.3 7.0 9.3
2.3 1.8 2.0 1.8 1.1 0.9 1.7
13.9 13.6 14.2 12.7 13.0 11.7 13.6
1.7 1.6 1.5 1.4 1.5 1.3 1.6
2.5 2.3 2.2 2.0 2.1 1.9 2.4
0.8 0.8 0.6 0.6 0.5 0.5 0.7
0.9 1.0 1.0 1.0 0.9 0.7 1.0
1.4 1.5 1.3 1.4 1.4 1.2 1.3
3.8 4.0 3.8 3.6 3.6 3.3 3.7
2.8 2.6 3.9 2.5 3.0 2.6 2.9
6.3 6.1 5.6 5.3 5.7 5.2 5.8
0.9 0.9 0.8 0.8 0.8 0.8 0.8
5.1 5.0 4.4 4.2 4.4 4.2 4.7
0.3 0.2 0.4 0.3 0.4 0.2 0.3
5.3 4.8 4.8 4.5 4.1 4.3 4.7
4.7 4.2 4.1 3.8 3.4 3.7 4.0
0.6 0.6 0.6 0.6 0.5 0.5 0.6
0.0 0.0 0.1 0.1 0.2 0.1 0.1
3.8 4.3 3.7 5.1 4.8 5.8 4.5
100 100 100 100 100 100 100
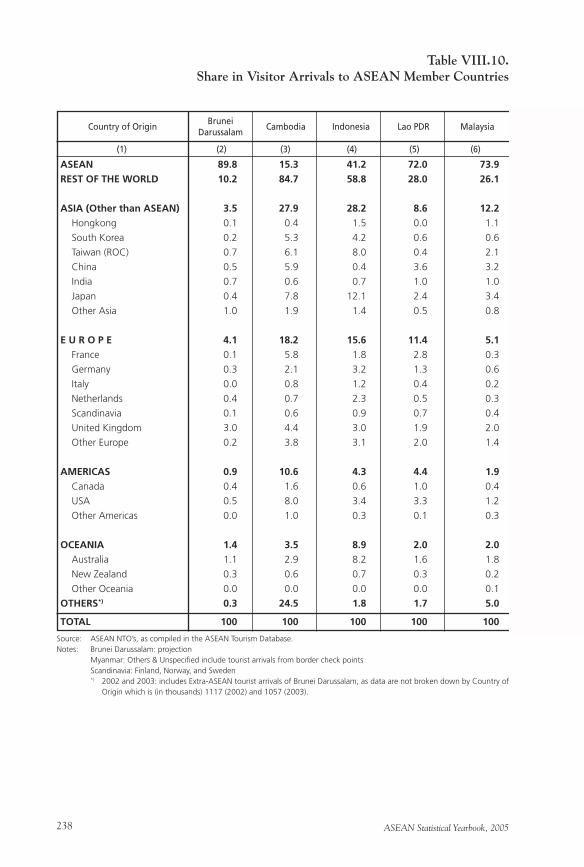
ASEAN Statistical Yearbook, 2005238
ASEAN 89.8 15.3 41.2 72.0 73.9
REST OF THE WORLD 10.2 84.7 58.8 28.0 26.1
ASIA (Other than ASEAN) 3.5 27.9 28.2 8.6 12.2
Hongkong 0.1 0.4 1.5 0.0 1.1
South Korea 0.2 5.3 4.2 0.6 0.6
Taiwan (ROC) 0.7 6.1 8.0 0.4 2.1
China 0.5 5.9 0.4 3.6 3.2
India 0.7 0.6 0.7 1.0 1.0
Japan 0.4 7.8 12.1 2.4 3.4
Other Asia 1.0 1.9 1.4 0.5 0.8
E U R O P E 4.1 18.2 15.6 11.4 5.1
France 0.1 5.8 1.8 2.8 0.3
Germany 0.3 2.1 3.2 1.3 0.6
Italy 0.0 0.8 1.2 0.4 0.2
Netherlands 0.4 0.7 2.3 0.5 0.3
Scandinavia 0.1 0.6 0.9 0.7 0.4
United Kingdom 3.0 4.4 3.0 1.9 2.0
Other Europe 0.2 3.8 3.1 2.0 1.4
AMERICAS 0.9 10.6 4.3 4.4 1.9
Canada 0.4 1.6 0.6 1.0 0.4
USA 0.5 8.0 3.4 3.3 1.2
Other Americas 0.0 1.0 0.3 0.1 0.3
OCEANIA 1.4 3.5 8.9 2.0 2.0
Australia 1.1 2.9 8.2 1.6 1.8
New Zealand 0.3 0.6 0.7 0.3 0.2
Other Oceania 0.0 0.0 0.0 0.0 0.1
OTHERS*) 0.3 24.5 1.8 1.7 5.0
TOTAL 100 100 100 100 100
Table VIII.10.Share in Visitor Arrivals to ASEAN Member Countries
Cambodia Indonesia Lao PDR Malaysia
(1) (2) (3) (4) (5) (6)
Source: ASEAN NTO’s, as compiled in the ASEAN Tourism Database.Notes: Brunei Darussalam: projection Myanmar: Others & Unspecified include tourist arrivals from border check points Scandinavia: Finland, Norway, and Sweden *) 2002 and 2003: includes Extra-ASEAN tourist arrivals of Brunei Darussalam, as data are not broken down by Country of
Origin which is (in thousands) 1117 (2002) and 1057 (2003).
Country of OriginBrunei
Darussalam
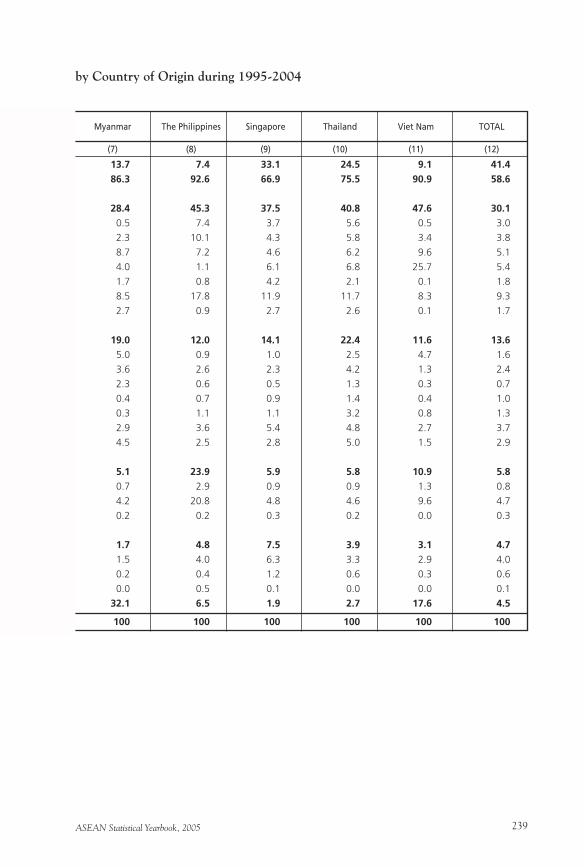
ASEAN Statistical Yearbook, 2005 239
by Country of Origin during 1995-2004
Myanmar The Philippines Singapore Thailand Viet Nam TOTAL
(7) (8) (9) (10) (11) (12)
13.7 7.4 33.1 24.5 9.1 41.4
86.3 92.6 66.9 75.5 90.9 58.6
28.4 45.3 37.5 40.8 47.6 30.1
0.5 7.4 3.7 5.6 0.5 3.0
2.3 10.1 4.3 5.8 3.4 3.8
8.7 7.2 4.6 6.2 9.6 5.1
4.0 1.1 6.1 6.8 25.7 5.4
1.7 0.8 4.2 2.1 0.1 1.8
8.5 17.8 11.9 11.7 8.3 9.3
2.7 0.9 2.7 2.6 0.1 1.7
19.0 12.0 14.1 22.4 11.6 13.6
5.0 0.9 1.0 2.5 4.7 1.6
3.6 2.6 2.3 4.2 1.3 2.4
2.3 0.6 0.5 1.3 0.3 0.7
0.4 0.7 0.9 1.4 0.4 1.0
0.3 1.1 1.1 3.2 0.8 1.3
2.9 3.6 5.4 4.8 2.7 3.7
4.5 2.5 2.8 5.0 1.5 2.9
5.1 23.9 5.9 5.8 10.9 5.8
0.7 2.9 0.9 0.9 1.3 0.8
4.2 20.8 4.8 4.6 9.6 4.7
0.2 0.2 0.3 0.2 0.0 0.3
1.7 4.8 7.5 3.9 3.1 4.7
1.5 4.0 6.3 3.3 2.9 4.0
0.2 0.4 1.2 0.6 0.3 0.6
0.0 0.5 0.1 0.0 0.0 0.1
32.1 6.5 1.9 2.7 17.6 4.5
100 100 100 100 100 100
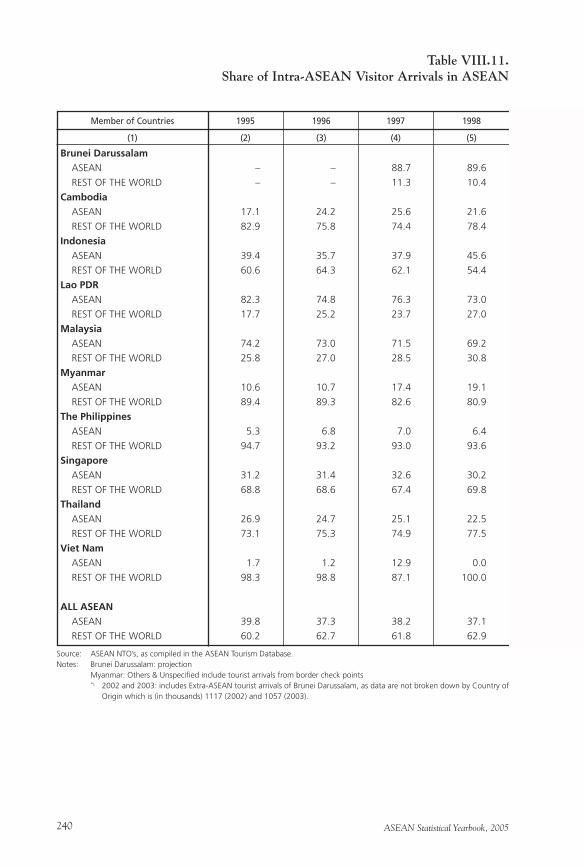
ASEAN Statistical Yearbook, 2005240
Table VIII.11.Share of Intra-ASEAN Visitor Arrivals in ASEAN
Brunei Darussalam
ASEAN – – 88.7 89.6
REST OF THE WORLD – – 11.3 10.4
Cambodia
ASEAN 17.1 24.2 25.6 21.6
REST OF THE WORLD 82.9 75.8 74.4 78.4
Indonesia
ASEAN 39.4 35.7 37.9 45.6
REST OF THE WORLD 60.6 64.3 62.1 54.4
Lao PDR
ASEAN 82.3 74.8 76.3 73.0
REST OF THE WORLD 17.7 25.2 23.7 27.0
Malaysia
ASEAN 74.2 73.0 71.5 69.2
REST OF THE WORLD 25.8 27.0 28.5 30.8
Myanmar
ASEAN 10.6 10.7 17.4 19.1
REST OF THE WORLD 89.4 89.3 82.6 80.9
The Philippines
ASEAN 5.3 6.8 7.0 6.4
REST OF THE WORLD 94.7 93.2 93.0 93.6
Singapore
ASEAN 31.2 31.4 32.6 30.2
REST OF THE WORLD 68.8 68.6 67.4 69.8
Thailand
ASEAN 26.9 24.7 25.1 22.5
REST OF THE WORLD 73.1 75.3 74.9 77.5
Viet Nam
ASEAN 1.7 1.2 12.9 0.0
REST OF THE WORLD 98.3 98.8 87.1 100.0
ALL ASEAN
ASEAN 39.8 37.3 38.2 37.1
REST OF THE WORLD 60.2 62.7 61.8 62.9
Member of Countries 1995 1996 1997 1998
(1) (2) (3) (4) (5)
Source: ASEAN NTO’s, as compiled in the ASEAN Tourism Database.Notes: Brunei Darussalam: projection Myanmar: Others & Unspecified include tourist arrivals from border check points *) 2002 and 2003: includes Extra-ASEAN tourist arrivals of Brunei Darussalam, as data are not broken down by Country of
Origin which is (in thousands) 1117 (2002) and 1057 (2003).
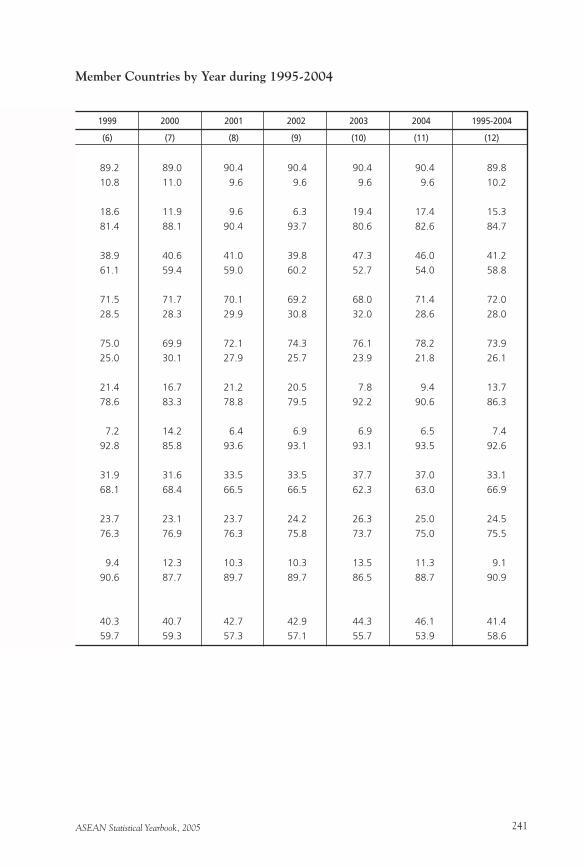
ASEAN Statistical Yearbook, 2005 241
Member Countries by Year during 1995-2004
1999 2000 2001 2002 2003 2004 1995-2004
(6) (7) (8) (9) (10) (11) (12)
89.2 89.0 90.4 90.4 90.4 90.4 89.8
10.8 11.0 9.6 9.6 9.6 9.6 10.2
18.6 11.9 9.6 6.3 19.4 17.4 15.3
81.4 88.1 90.4 93.7 80.6 82.6 84.7
38.9 40.6 41.0 39.8 47.3 46.0 41.2
61.1 59.4 59.0 60.2 52.7 54.0 58.8
71.5 71.7 70.1 69.2 68.0 71.4 72.0
28.5 28.3 29.9 30.8 32.0 28.6 28.0
75.0 69.9 72.1 74.3 76.1 78.2 73.9
25.0 30.1 27.9 25.7 23.9 21.8 26.1
21.4 16.7 21.2 20.5 7.8 9.4 13.7
78.6 83.3 78.8 79.5 92.2 90.6 86.3
7.2 14.2 6.4 6.9 6.9 6.5 7.4
92.8 85.8 93.6 93.1 93.1 93.5 92.6
31.9 31.6 33.5 33.5 37.7 37.0 33.1
68.1 68.4 66.5 66.5 62.3 63.0 66.9
23.7 23.1 23.7 24.2 26.3 25.0 24.5
76.3 76.9 76.3 75.8 73.7 75.0 75.5
9.4 12.3 10.3 10.3 13.5 11.3 9.1
90.6 87.7 89.7 89.7 86.5 88.7 90.9
40.3 40.7 42.7 42.9 44.3 46.1 41.4
59.7 59.3 57.3 57.1 55.7 53.9 58.6
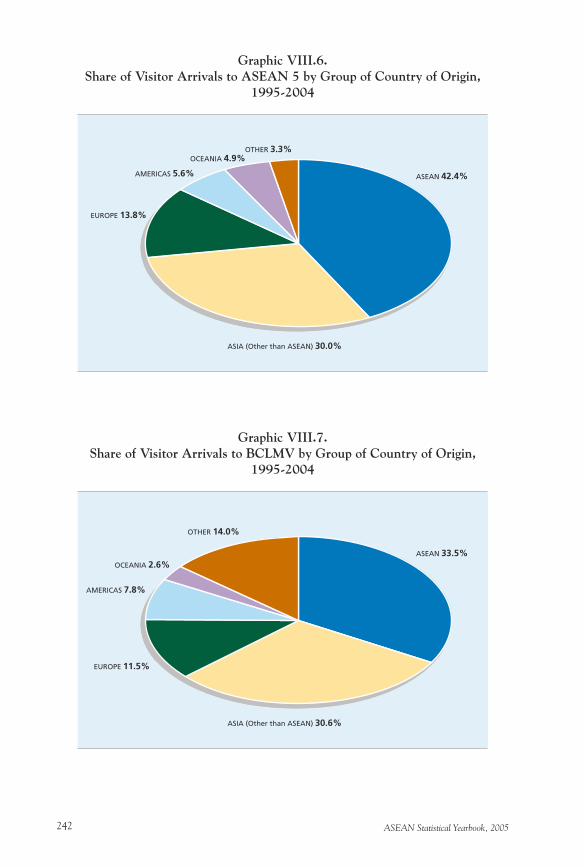
ASEAN Statistical Yearbook, 2005242
Graphic VIII.6.Share of Visitor Arrivals to ASEAN 5 by Group of Country of Origin,
1995-2004
Graphic VIII.7.Share of Visitor Arrivals to BCLMV by Group of Country of Origin,
1995-2004
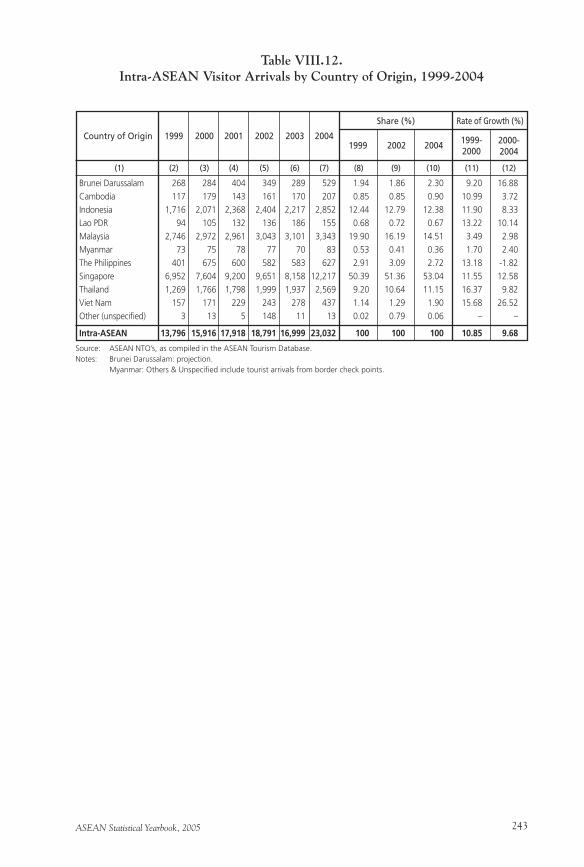
ASEAN Statistical Yearbook, 2005 243
Brunei Darussalam 268 284 404 349 289 529 1.94 1.86 2.30 9.20 16.88
Cambodia 117 179 143 161 170 207 0.85 0.85 0.90 10.99 3.72
Indonesia 1,716 2,071 2,368 2,404 2,217 2,852 12.44 12.79 12.38 11.90 8.33
Lao PDR 94 105 132 136 186 155 0.68 0.72 0.67 13.22 10.14
Malaysia 2,746 2,972 2,961 3,043 3,101 3,343 19.90 16.19 14.51 3.49 2.98
Myanmar 73 75 78 77 70 83 0.53 0.41 0.36 1.70 2.40
The Philippines 401 675 600 582 583 627 2.91 3.09 2.72 13.18 -1.82
Singapore 6,952 7,604 9,200 9,651 8,158 12,217 50.39 51.36 53.04 11.55 12.58
Thailand 1,269 1,766 1,798 1,999 1,937 2,569 9.20 10.64 11.15 16.37 9.82
Viet Nam 157 171 229 243 278 437 1.14 1.29 1.90 15.68 26.52
Other (unspecified) 3 13 5 148 11 13 0.02 0.79 0.06 – –
Intra-ASEAN 13,796 15,916 17,918 18,791 16,999 23,032 100 100 100 10.85 9.68
Table VIII.12.Intra-ASEAN Visitor Arrivals by Country of Origin, 1999-2004
Country of Origin 1999 2000 2001 2002 2003 2004
(1) (2) (3) (4) (5) (6) (7) (8) (9) (10) (11) (12)
Share (%)
1999-2000
2000-2004
Source: ASEAN NTO’s, as compiled in the ASEAN Tourism Database.Notes: Brunei Darussalam: projection. Myanmar: Others & Unspecified include tourist arrivals from border check points.
Rate of Growth (%)
1999 2002 2004
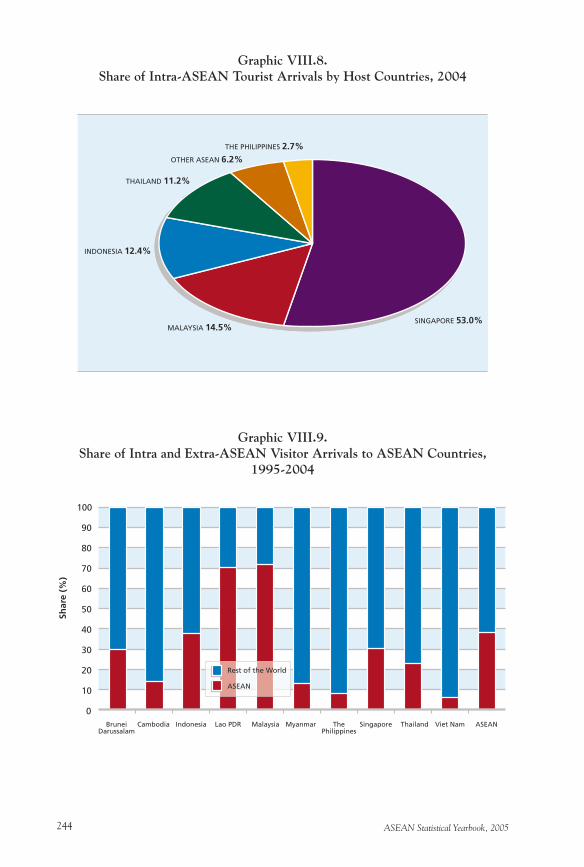
ASEAN Statistical Yearbook, 2005244
Graphic VIII.8.Share of Intra-ASEAN Tourist Arrivals by Host Countries, 2004
Graphic VIII.9.Share of Intra and Extra-ASEAN Visitor Arrivals to ASEAN Countries,
1995-2004
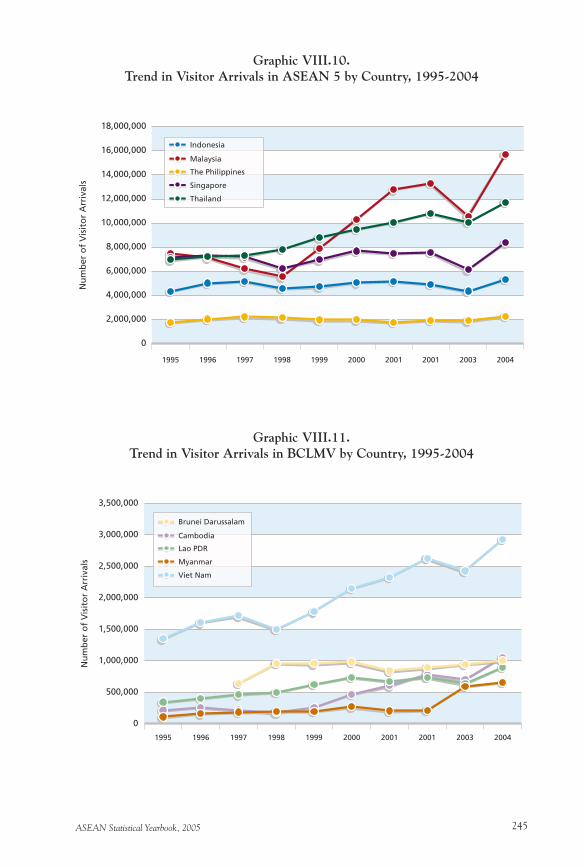
ASEAN Statistical Yearbook, 2005 245
Graphic VIII.10.Trend in Visitor Arrivals in ASEAN 5 by Country, 1995-2004
Graphic VIII.11.Trend in Visitor Arrivals in BCLMV by Country, 1995-2004
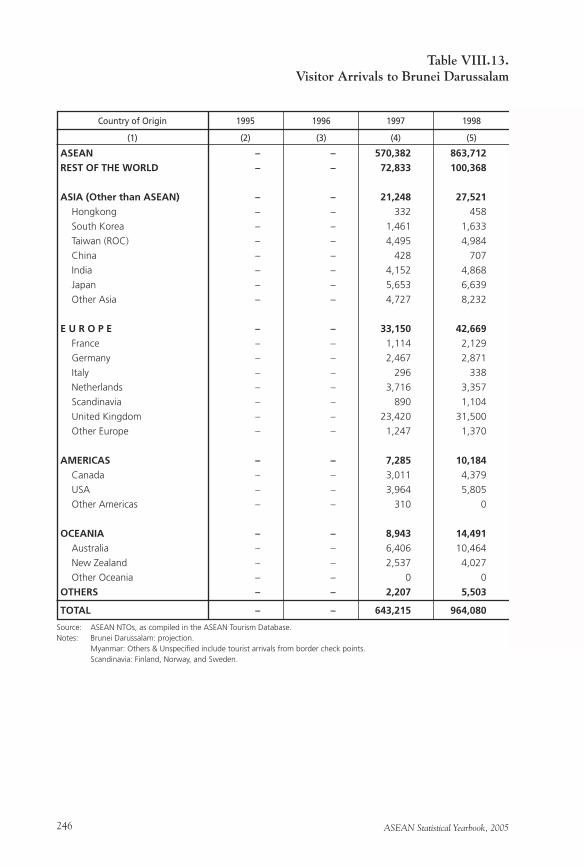
ASEAN Statistical Yearbook, 2005246
Table VIII.13.Visitor Arrivals to Brunei Darussalam
ASEAN – – 570,382 863,712
REST OF THE WORLD – – 72,833 100,368
ASIA (Other than ASEAN) – – 21,248 27,521
Hongkong – – 332 458
South Korea – – 1,461 1,633
Taiwan (ROC) – – 4,495 4,984
China – – 428 707
India – – 4,152 4,868
Japan – – 5,653 6,639
Other Asia – – 4,727 8,232
E U R O P E – – 33,150 42,669
France – – 1,114 2,129
Germany – – 2,467 2,871
Italy – – 296 338
Netherlands – – 3,716 3,357
Scandinavia – – 890 1,104
United Kingdom – – 23,420 31,500
Other Europe – – 1,247 1,370
AMERICAS – – 7,285 10,184
Canada – – 3,011 4,379
USA – – 3,964 5,805
Other Americas – – 310 0
OCEANIA – – 8,943 14,491
Australia – – 6,406 10,464
New Zealand – – 2,537 4,027
Other Oceania – – 0 0
OTHERS – – 2,207 5,503
TOTAL – – 643,215 964,080
Country of Origin 1995 1996 1997 1998
(1) (2) (3) (4) (5)
Source: ASEAN NTOs, as compiled in the ASEAN Tourism Database.Notes: Brunei Darussalam: projection. Myanmar: Others & Unspecified include tourist arrivals from border check points. Scandinavia: Finland, Norway, and Sweden.
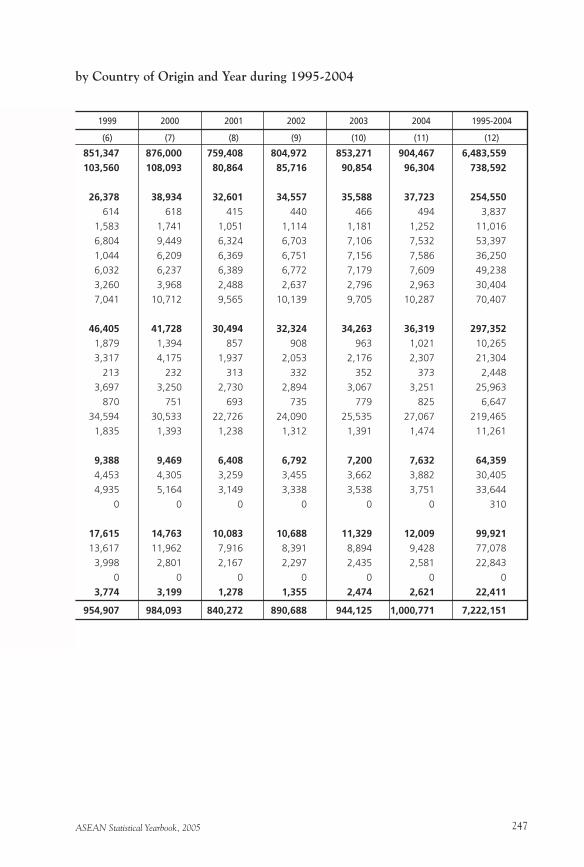
ASEAN Statistical Yearbook, 2005 247
by Country of Origin and Year during 1995-2004
1999 2000 2001 2002 2003 2004 1995-2004
(6) (7) (8) (9) (10) (11) (12)
851,347 876,000 759,408 804,972 853,271 904,467 6,483,559
103,560 108,093 80,864 85,716 90,854 96,304 738,592
26,378 38,934 32,601 34,557 35,588 37,723 254,550
614 618 415 440 466 494 3,837
1,583 1,741 1,051 1,114 1,181 1,252 11,016
6,804 9,449 6,324 6,703 7,106 7,532 53,397
1,044 6,209 6,369 6,751 7,156 7,586 36,250
6,032 6,237 6,389 6,772 7,179 7,609 49,238
3,260 3,968 2,488 2,637 2,796 2,963 30,404
7,041 10,712 9,565 10,139 9,705 10,287 70,407
46,405 41,728 30,494 32,324 34,263 36,319 297,352
1,879 1,394 857 908 963 1,021 10,265
3,317 4,175 1,937 2,053 2,176 2,307 21,304
213 232 313 332 352 373 2,448
3,697 3,250 2,730 2,894 3,067 3,251 25,963
870 751 693 735 779 825 6,647
34,594 30,533 22,726 24,090 25,535 27,067 219,465
1,835 1,393 1,238 1,312 1,391 1,474 11,261
9,388 9,469 6,408 6,792 7,200 7,632 64,359
4,453 4,305 3,259 3,455 3,662 3,882 30,405
4,935 5,164 3,149 3,338 3,538 3,751 33,644
0 0 0 0 0 0 310
17,615 14,763 10,083 10,688 11,329 12,009 99,921
13,617 11,962 7,916 8,391 8,894 9,428 77,078
3,998 2,801 2,167 2,297 2,435 2,581 22,843
0 0 0 0 0 0 0
3,774 3,199 1,278 1,355 2,474 2,621 22,411
954,907 984,093 840,272 890,688 944,125 1,000,771 7,222,151

ASEAN Statistical Yearbook, 2005248
Table VIII.14.Visitor Arrivals to Cambodia
ASEAN 37,625 63,062 56,133 38,046
REST OF THE WORLD 182,055 197,427 162,710 137,864
ASIA (Other than ASEAN) 111,385 105,522 85,314 61,203
Hongkong 1,656 2,070 1,785 2,596
South Korea 4,141 8,982 8,469 4,467
Taiwan (ROC) 22,422 35,329 28,116 18,239
China 22,886 22,029 17,282 18,035
India 1,158 2,148 2,000 1,195
Japan 21,629 33,039 25,362 13,386
Other Asia 37,493 1,925 2,300 3,285
E U R O P E 37,907 53,761 43,331 46,165
France 19,437 23,333 17,538 18,616
Germany 3,499 5,488 4,604 4,199
Italy 1,810 2,968 1,870 2,116
Netherlands 0 2,652 1,239 1,274
Scandinavia 0 1,302 1,224 1,305
United Kingdom 5,809 9,306 9,193 11,156
Other Europe 7,352 8,712 7,663 7,499
AMERICAS 21,538 27,812 24,561 22,324
Canada 3,692 5,143 3,716 3,298
USA 17,846 21,967 20,291 17,946
Other Americas 0 702 554 1,080
OCEANIA 7,968 9,431 8,758 8,172
Australia 6,634 7,508 7,237 6,777
New Zealand 1,334 1,923 1,521 1,395
Other Oceania 0 0 0 0
OTHERS 3,257 901 746 0
TOTAL 219,680 260,489 218,843 175,910
Country of Origin 1995 1996 1997 1998
(1) (2) (3) (4) (5)
Source: ASEAN NTOs, as compiled in the ASEAN Tourism Database.Notes: Brunei Darussalam: projection. Myanmar: Others & Unspecified include tourist arrivals from border check points. Scandinavia: Finland, Norway, and Sweden.
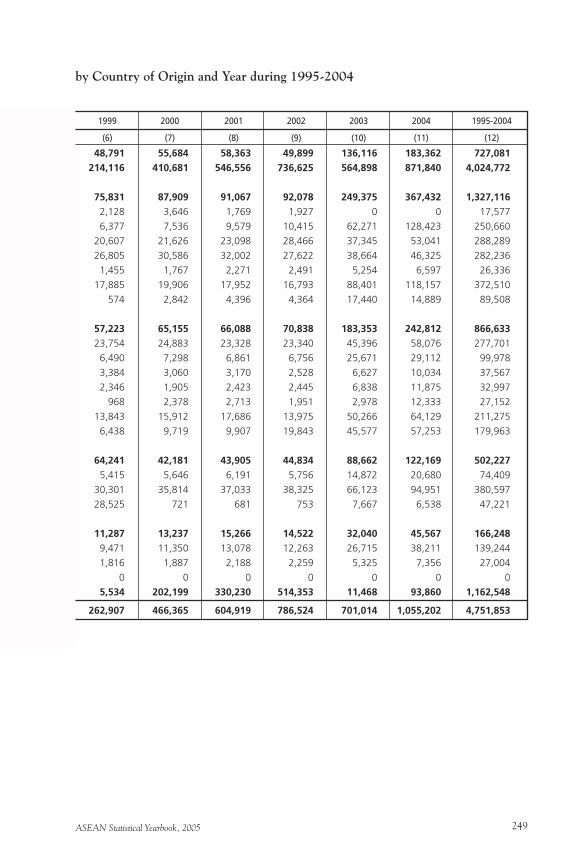
ASEAN Statistical Yearbook, 2005 249
by Country of Origin and Year during 1995-2004
1999 2000 2001 2002 2003 2004 1995-2004
(6) (7) (8) (9) (10) (11) (12)
48,791 55,684 58,363 49,899 136,116 183,362 727,081
214,116 410,681 546,556 736,625 564,898 871,840 4,024,772
75,831 87,909 91,067 92,078 249,375 367,432 1,327,116
2,128 3,646 1,769 1,927 0 0 17,577
6,377 7,536 9,579 10,415 62,271 128,423 250,660
20,607 21,626 23,098 28,466 37,345 53,041 288,289
26,805 30,586 32,002 27,622 38,664 46,325 282,236
1,455 1,767 2,271 2,491 5,254 6,597 26,336
17,885 19,906 17,952 16,793 88,401 118,157 372,510
574 2,842 4,396 4,364 17,440 14,889 89,508
57,223 65,155 66,088 70,838 183,353 242,812 866,633
23,754 24,883 23,328 23,340 45,396 58,076 277,701
6,490 7,298 6,861 6,756 25,671 29,112 99,978
3,384 3,060 3,170 2,528 6,627 10,034 37,567
2,346 1,905 2,423 2,445 6,838 11,875 32,997
968 2,378 2,713 1,951 2,978 12,333 27,152
13,843 15,912 17,686 13,975 50,266 64,129 211,275
6,438 9,719 9,907 19,843 45,577 57,253 179,963
64,241 42,181 43,905 44,834 88,662 122,169 502,227
5,415 5,646 6,191 5,756 14,872 20,680 74,409
30,301 35,814 37,033 38,325 66,123 94,951 380,597
28,525 721 681 753 7,667 6,538 47,221
11,287 13,237 15,266 14,522 32,040 45,567 166,248
9,471 11,350 13,078 12,263 26,715 38,211 139,244
1,816 1,887 2,188 2,259 5,325 7,356 27,004
0 0 0 0 0 0 0
5,534 202,199 330,230 514,353 11,468 93,860 1,162,548
262,907 466,365 604,919 786,524 701,014 1,055,202 4,751,853

ASEAN Statistical Yearbook, 2005250
Table VIII.15.Visitor Arrivals to Indonesia
ASEAN 1,705,227 1,798,740 1,963,281 2,101,671
REST OF THE WORLD 2,619,002 3,235,732 3,221,962 2,504,745
ASIA (Other than ASEAN) 1,209,838 1,770,360 1,560,246 1,138,186
Hongkong 93,163 123,312 103,450 53,500
South Korea 115,091 250,035 246,307 177,852
Taiwan (ROC) 352,797 607,015 404,929 281,959
China 38,895 21,739 0 0
India 31,968 26,947 26,418 40,850
Japan 486,278 665,711 706,942 469,409
Other Asia 91,646 75,601 72,200 114,616
E U R O P E 793,842 754,412 820,340 641,374
France 80,422 88,322 107,843 70,396
Germany 167,653 167,607 185,976 141,314
Italy 55,725 62,912 67,802 50,383
Netherlands 136,858 122,410 144,622 81,507
Scandinavia 39,480 37,749 41,443 38,255
United Kingdom 165,788 145,268 142,161 137,600
Other Europe 147,916 130,144 130,493 121,919
AMERICAS 201,149 244,497 208,726 201,488
Canada 30,700 32,244 27,075 25,091
USA 155,111 197,923 171,707 150,042
Other Americas 15,338 14,330 9,944 26,355
OCEANIA 348,833 413,552 577,918 427,133
Australia 320,494 380,475 539,156 394,543
New Zealand 28,339 33,077 38,762 32,590
Other Oceania 0 0 0 0
OTHERS 65,340 52,911 54,732 96,564
TOTAL 4,324,229 5,034,472 5,185,243 4,606,416
Country of Origin 1995 1996 1997 1998
(1) (2) (3) (4) (5)
Source: ASEAN NTOs, as compiled in the ASEAN Tourism Database.Notes: Brunei Darussalam: projection. Myanmar: Others & Unspecified include tourist arrivals from border check points. Scandinavia: Finland, Norway, and Sweden.
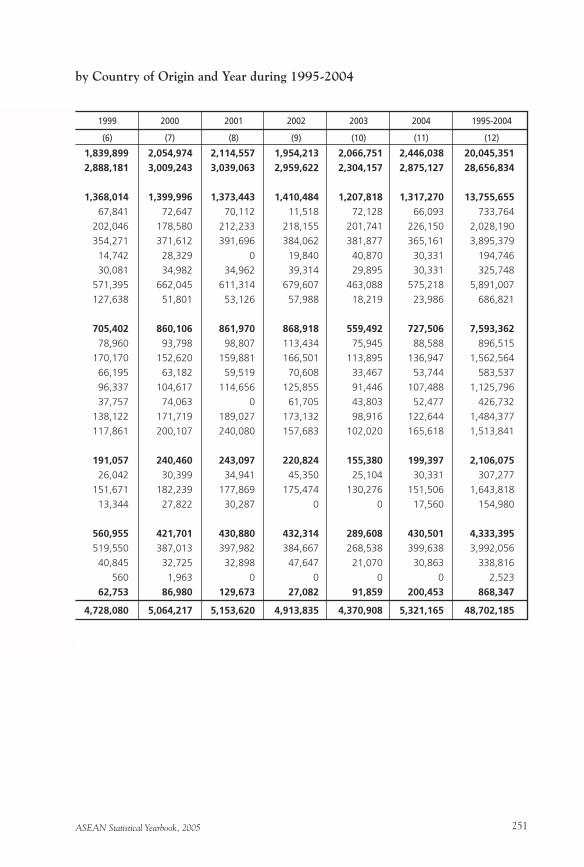
ASEAN Statistical Yearbook, 2005 251
by Country of Origin and Year during 1995-2004
1999 2000 2001 2002 2003 2004 1995-2004
(6) (7) (8) (9) (10) (11) (12)
1,839,899 2,054,974 2,114,557 1,954,213 2,066,751 2,446,038 20,045,351
2,888,181 3,009,243 3,039,063 2,959,622 2,304,157 2,875,127 28,656,834
1,368,014 1,399,996 1,373,443 1,410,484 1,207,818 1,317,270 13,755,655
67,841 72,647 70,112 11,518 72,128 66,093 733,764
202,046 178,580 212,233 218,155 201,741 226,150 2,028,190
354,271 371,612 391,696 384,062 381,877 365,161 3,895,379
14,742 28,329 0 19,840 40,870 30,331 194,746
30,081 34,982 34,962 39,314 29,895 30,331 325,748
571,395 662,045 611,314 679,607 463,088 575,218 5,891,007
127,638 51,801 53,126 57,988 18,219 23,986 686,821
705,402 860,106 861,970 868,918 559,492 727,506 7,593,362
78,960 93,798 98,807 113,434 75,945 88,588 896,515
170,170 152,620 159,881 166,501 113,895 136,947 1,562,564
66,195 63,182 59,519 70,608 33,467 53,744 583,537
96,337 104,617 114,656 125,855 91,446 107,488 1,125,796
37,757 74,063 0 61,705 43,803 52,477 426,732
138,122 171,719 189,027 173,132 98,916 122,644 1,484,377
117,861 200,107 240,080 157,683 102,020 165,618 1,513,841
191,057 240,460 243,097 220,824 155,380 199,397 2,106,075
26,042 30,399 34,941 45,350 25,104 30,331 307,277
151,671 182,239 177,869 175,474 130,276 151,506 1,643,818
13,344 27,822 30,287 0 0 17,560 154,980
560,955 421,701 430,880 432,314 289,608 430,501 4,333,395
519,550 387,013 397,982 384,667 268,538 399,638 3,992,056
40,845 32,725 32,898 47,647 21,070 30,863 338,816
560 1,963 0 0 0 0 2,523
62,753 86,980 129,673 27,082 91,859 200,453 868,347
4,728,080 5,064,217 5,153,620 4,913,835 4,370,908 5,321,165 48,702,185
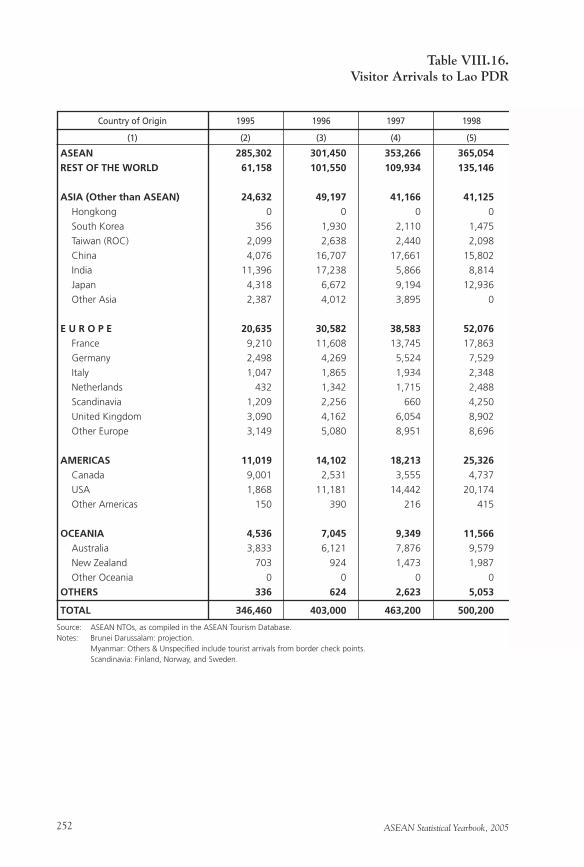
ASEAN Statistical Yearbook, 2005252
Table VIII.16.Visitor Arrivals to Lao PDR
ASEAN 285,302 301,450 353,266 365,054
REST OF THE WORLD 61,158 101,550 109,934 135,146
ASIA (Other than ASEAN) 24,632 49,197 41,166 41,125
Hongkong 0 0 0 0
South Korea 356 1,930 2,110 1,475
Taiwan (ROC) 2,099 2,638 2,440 2,098
China 4,076 16,707 17,661 15,802
India 11,396 17,238 5,866 8,814
Japan 4,318 6,672 9,194 12,936
Other Asia 2,387 4,012 3,895 0
E U R O P E 20,635 30,582 38,583 52,076
France 9,210 11,608 13,745 17,863
Germany 2,498 4,269 5,524 7,529
Italy 1,047 1,865 1,934 2,348
Netherlands 432 1,342 1,715 2,488
Scandinavia 1,209 2,256 660 4,250
United Kingdom 3,090 4,162 6,054 8,902
Other Europe 3,149 5,080 8,951 8,696
AMERICAS 11,019 14,102 18,213 25,326
Canada 9,001 2,531 3,555 4,737
USA 1,868 11,181 14,442 20,174
Other Americas 150 390 216 415
OCEANIA 4,536 7,045 9,349 11,566
Australia 3,833 6,121 7,876 9,579
New Zealand 703 924 1,473 1,987
Other Oceania 0 0 0 0
OTHERS 336 624 2,623 5,053
TOTAL 346,460 403,000 463,200 500,200
Country of Origin 1995 1996 1997 1998
(1) (2) (3) (4) (5)
Source: ASEAN NTOs, as compiled in the ASEAN Tourism Database.Notes: Brunei Darussalam: projection. Myanmar: Others & Unspecified include tourist arrivals from border check points. Scandinavia: Finland, Norway, and Sweden.
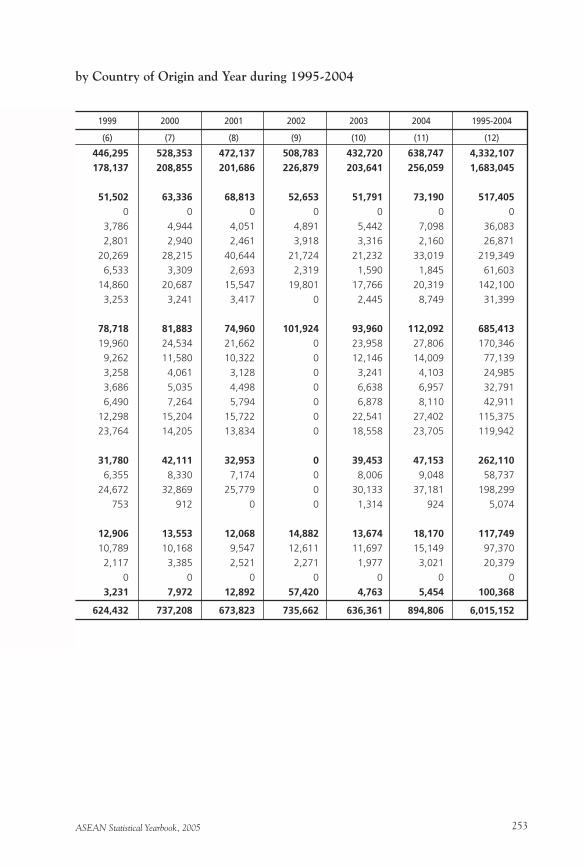
ASEAN Statistical Yearbook, 2005 253
by Country of Origin and Year during 1995-2004
1999 2000 2001 2002 2003 2004 1995-2004
(6) (7) (8) (9) (10) (11) (12)
446,295 528,353 472,137 508,783 432,720 638,747 4,332,107
178,137 208,855 201,686 226,879 203,641 256,059 1,683,045
51,502 63,336 68,813 52,653 51,791 73,190 517,405
0 0 0 0 0 0 0
3,786 4,944 4,051 4,891 5,442 7,098 36,083
2,801 2,940 2,461 3,918 3,316 2,160 26,871
20,269 28,215 40,644 21,724 21,232 33,019 219,349
6,533 3,309 2,693 2,319 1,590 1,845 61,603
14,860 20,687 15,547 19,801 17,766 20,319 142,100
3,253 3,241 3,417 0 2,445 8,749 31,399
78,718 81,883 74,960 101,924 93,960 112,092 685,413
19,960 24,534 21,662 0 23,958 27,806 170,346
9,262 11,580 10,322 0 12,146 14,009 77,139
3,258 4,061 3,128 0 3,241 4,103 24,985
3,686 5,035 4,498 0 6,638 6,957 32,791
6,490 7,264 5,794 0 6,878 8,110 42,911
12,298 15,204 15,722 0 22,541 27,402 115,375
23,764 14,205 13,834 0 18,558 23,705 119,942
31,780 42,111 32,953 0 39,453 47,153 262,110
6,355 8,330 7,174 0 8,006 9,048 58,737
24,672 32,869 25,779 0 30,133 37,181 198,299
753 912 0 0 1,314 924 5,074
12,906 13,553 12,068 14,882 13,674 18,170 117,749
10,789 10,168 9,547 12,611 11,697 15,149 97,370
2,117 3,385 2,521 2,271 1,977 3,021 20,379
0 0 0 0 0 0 0
3,231 7,972 12,892 57,420 4,763 5,454 100,368
624,432 737,208 673,823 735,662 636,361 894,806 6,015,152

ASEAN Statistical Yearbook, 2005254
Table VIII.17.Visitor Arrivals to Malaysia
Country of Origin 1995 1996 1997 1998
(1) (2) (3) (4) (5)
Source: ASEAN NTOs, as compiled in the ASEAN Tourism Database.Notes: Brunei Darussalam: projection. Myanmar: Others & Unspecified include tourist arrivals from border check points. Scandinavia: Finland, Norway, and Sweden.
ASEAN 5,542,087 5,212,294 4,440,532 3,843,111
REST OF THE WORLD 1,926,662 1,926,158 1,770,389 1,707,637
ASIA (Other than ASEAN) 1,149,957 1,017,143 931,109 767,029
Hongkong 146,603 144,302 103,153 90,148
South Korea 71,622 73,902 68,610 21,741
Taiwan (ROC) 293,896 236,501 207,776 159,747
China 103,130 135,743 158,679 159,852
India 27,701 31,959 28,948 33,751
Japan 330,725 353,204 308,902 252,178
Other Asia 176,280 41,532 55,041 49,612
E U R O P E 404,285 411,328 382,956 363,377
France 28,741 30,201 25,426 25,978
Germany 63,915 63,508 57,722 50,583
Italy 17,444 17,203 14,853 14,179
Netherlands 18,097 19,396 16,028 21,564
Scandinavia 33,430 30,304 43,293 33,751
United Kingdom 164,489 166,588 162,079 160,678
Other Europe 78,169 84,128 63,555 56,644
AMERICAS 136,405 145,991 137,164 121,569
Canada 29,223 33,807 32,196 30,082
USA 97,547 101,056 94,649 83,089
Other Americas 9,635 11,128 10,319 8,398
OCEANIA 155,674 169,457 145,867 164,623
Australia 136,300 150,026 129,262 145,162
New Zealand 19,374 19,431 16,605 19,461
Other Oceania 0 0 0 0
OTHERS 80,341 182,239 173,293 291,039
TOTAL 7,468,749 7,138,452 6,210,921 5,550,748
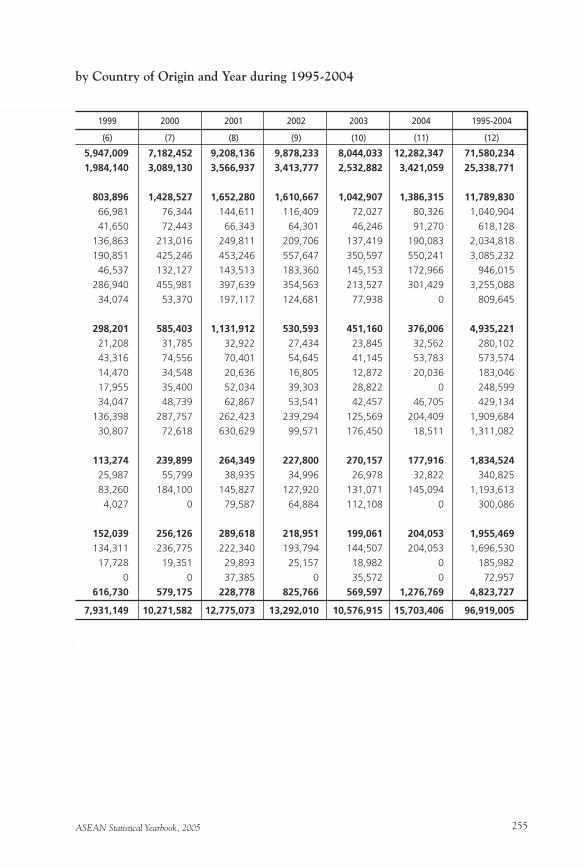
ASEAN Statistical Yearbook, 2005 255
by Country of Origin and Year during 1995-2004
1999 2000 2001 2002 2003 2004 1995-2004
(6) (7) (8) (9) (10) (11) (12)
5,947,009 7,182,452 9,208,136 9,878,233 8,044,033 12,282,347 71,580,234
1,984,140 3,089,130 3,566,937 3,413,777 2,532,882 3,421,059 25,338,771
803,896 1,428,527 1,652,280 1,610,667 1,042,907 1,386,315 11,789,830
66,981 76,344 144,611 116,409 72,027 80,326 1,040,904
41,650 72,443 66,343 64,301 46,246 91,270 618,128
136,863 213,016 249,811 209,706 137,419 190,083 2,034,818
190,851 425,246 453,246 557,647 350,597 550,241 3,085,232
46,537 132,127 143,513 183,360 145,153 172,966 946,015
286,940 455,981 397,639 354,563 213,527 301,429 3,255,088
34,074 53,370 197,117 124,681 77,938 0 809,645
298,201 585,403 1,131,912 530,593 451,160 376,006 4,935,221
21,208 31,785 32,922 27,434 23,845 32,562 280,102
43,316 74,556 70,401 54,645 41,145 53,783 573,574
14,470 34,548 20,636 16,805 12,872 20,036 183,046
17,955 35,400 52,034 39,303 28,822 0 248,599
34,047 48,739 62,867 53,541 42,457 46,705 429,134
136,398 287,757 262,423 239,294 125,569 204,409 1,909,684
30,807 72,618 630,629 99,571 176,450 18,511 1,311,082
113,274 239,899 264,349 227,800 270,157 177,916 1,834,524
25,987 55,799 38,935 34,996 26,978 32,822 340,825
83,260 184,100 145,827 127,920 131,071 145,094 1,193,613
4,027 0 79,587 64,884 112,108 0 300,086
152,039 256,126 289,618 218,951 199,061 204,053 1,955,469
134,311 236,775 222,340 193,794 144,507 204,053 1,696,530
17,728 19,351 29,893 25,157 18,982 0 185,982
0 0 37,385 0 35,572 0 72,957
616,730 579,175 228,778 825,766 569,597 1,276,769 4,823,727
7,931,149 10,271,582 12,775,073 13,292,010 10,576,915 15,703,406 96,919,005

ASEAN Statistical Yearbook, 2005256
Table VIII.18.Visitor Arrivals to Myanmar
Country of Origin 1995 1996 1997 1998
(1) (2) (3) (4) (5)
Source: ASEAN NTOs, as compiled in the ASEAN Tourism Database.Notes: Brunei Darussalam: projection. Myanmar: Others & Unspecified include tourist arrivals from border check points. Scandinavia: Finland, Norway, and Sweden.
ASEAN 11,659 17,488 32,890 37,696
REST OF THE WORLD 98,114 145,998 155,802 160,030
ASIA (Other than ASEAN) 52,632 72,456 87,974 87,539
Hongkong 0 1,391 1,340 1,652
South Korea 0 6,527 4,847 4,433
Taiwan (ROC) 0 23,180 32,791 34,478
China 0 2,540 6,047 8,561
India 603 1,818 3,302 4,281
Japan 16,095 31,048 34,553 28,672
Other Asia 35,934 5,952 5,094 5,462
E U R O P E 33,880 56,614 49,906 51,659
France 8,218 18,686 17,087 15,410
Germany 4,639 8,998 7,146 8,492
Italy 4,533 6,859 5,631 6,009
Netherlands 0 2,950 0 0
Scandinavia 0 0 0 0
United Kingdom 6,727 7,198 7,981 9,494
Other Europe 9,763 11,923 12,061 12,254
AMERICAS 9,103 10,773 11,565 12,695
Canada 1,189 1,564 1,688 1,998
USA 7,914 8,706 9,303 10,697
Other Americas 0 503 574 0
OCEANIA 2,499 3,519 4,064 5,305
Australia 1,863 2,923 3,422 4,593
New Zealand 636 596 642 712
Other Oceania 0 0 0 0
OTHERS 0 2,636 2,293 2,832
TOTAL 109,773 163,486 188,692 197,726

ASEAN Statistical Yearbook, 2005 257
by Country of Origin and Year during 1995-2004
1999 2000 2001 2002 2003 2004 1995-2004
(6) (7) (8) (9) (10) (11) (12)
41,782 45,169 43,450 44,608 46,337 61,933 383,012
153,640 225,496 161,412 172,604 550,678 594,977 2,418,751
87,019 87,018 81,535 81,027 74,013 84,117 795,330
1,598 1,742 1,408 1,277 1,667 3,020 15,095
5,885 7,423 7,581 7,890 8,399 10,405 63,390
32,977 32,098 26,020 22,849 19,645 20,424 244,462
12,148 14,336 16,788 17,732 15,564 17,890 111,606
5,083 5,605 5,572 5,691 6,291 8,357 46,603
25,319 21,930 20,118 20,744 18,799 20,296 237,574
4,009 3,884 4,048 4,844 3,648 3,725 76,600
49,680 53,222 52,669 63,768 58,763 63,452 533,613
13,594 13,313 12,461 14,108 13,125 13,372 139,374
9,039 9,920 11,450 12,952 13,341 14,112 100,089
6,925 6,852 6,618 7,908 6,129 7,924 65,388
6 2,049 20 2,518 1,933 2,018 11,494
1,752 954 1,154 1,124 1,241 1,415 7,640
9,267 9,020 8,424 8,620 7,848 7,720 82,299
9,097 11,114 12,542 16,538 15,146 16,891 127,329
12,611 15,202 16,492 17,640 16,426 20,182 142,689
1,879 2,022 2,340 2,476 2,519 2,828 20,503
10,270 12,669 13,524 14,477 13,256 16,432 117,248
462 511 628 687 651 922 4,938
4,207 4,719 5,074 5,911 5,734 7,061 48,093
3,643 4,120 4,442 5,194 4,950 6,069 41,219
562 596 627 710 771 984 6,836
2 3 5 7 13 8 38
123 65,335 5,642 4,258 395,742 420,165 899,026
195,422 270,665 204,862 217,212 597,015 656,910 2,801,763
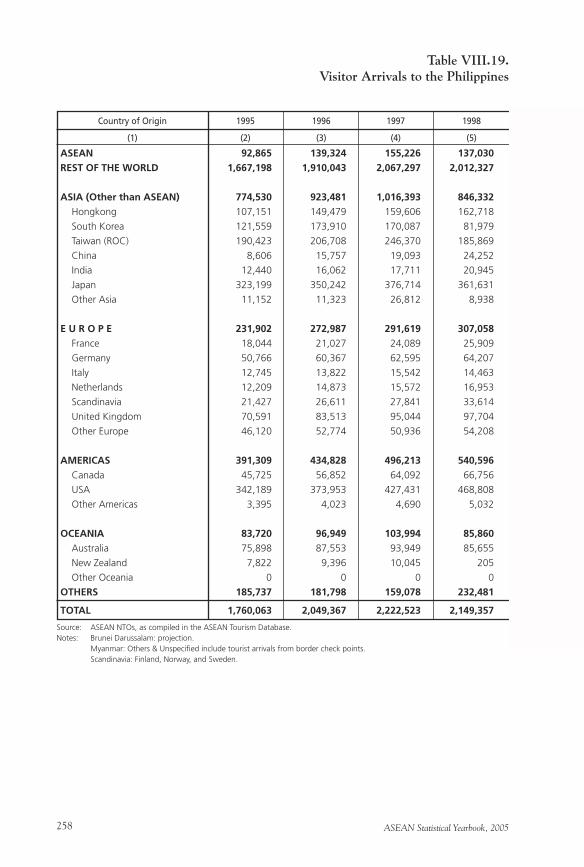
ASEAN Statistical Yearbook, 2005258
Table VIII.19.Visitor Arrivals to the Philippines
Country of Origin 1995 1996 1997 1998
(1) (2) (3) (4) (5)
Source: ASEAN NTOs, as compiled in the ASEAN Tourism Database.Notes: Brunei Darussalam: projection. Myanmar: Others & Unspecified include tourist arrivals from border check points. Scandinavia: Finland, Norway, and Sweden.
ASEAN 92,865 139,324 155,226 137,030
REST OF THE WORLD 1,667,198 1,910,043 2,067,297 2,012,327
ASIA (Other than ASEAN) 774,530 923,481 1,016,393 846,332
Hongkong 107,151 149,479 159,606 162,718
South Korea 121,559 173,910 170,087 81,979
Taiwan (ROC) 190,423 206,708 246,370 185,869
China 8,606 15,757 19,093 24,252
India 12,440 16,062 17,711 20,945
Japan 323,199 350,242 376,714 361,631
Other Asia 11,152 11,323 26,812 8,938
E U R O P E 231,902 272,987 291,619 307,058
France 18,044 21,027 24,089 25,909
Germany 50,766 60,367 62,595 64,207
Italy 12,745 13,822 15,542 14,463
Netherlands 12,209 14,873 15,572 16,953
Scandinavia 21,427 26,611 27,841 33,614
United Kingdom 70,591 83,513 95,044 97,704
Other Europe 46,120 52,774 50,936 54,208
AMERICAS 391,309 434,828 496,213 540,596
Canada 45,725 56,852 64,092 66,756
USA 342,189 373,953 427,431 468,808
Other Americas 3,395 4,023 4,690 5,032
OCEANIA 83,720 96,949 103,994 85,860
Australia 75,898 87,553 93,949 85,655
New Zealand 7,822 9,396 10,045 205
Other Oceania 0 0 0 0
OTHERS 185,737 181,798 159,078 232,481
TOTAL 1,760,063 2,049,367 2,222,523 2,149,357
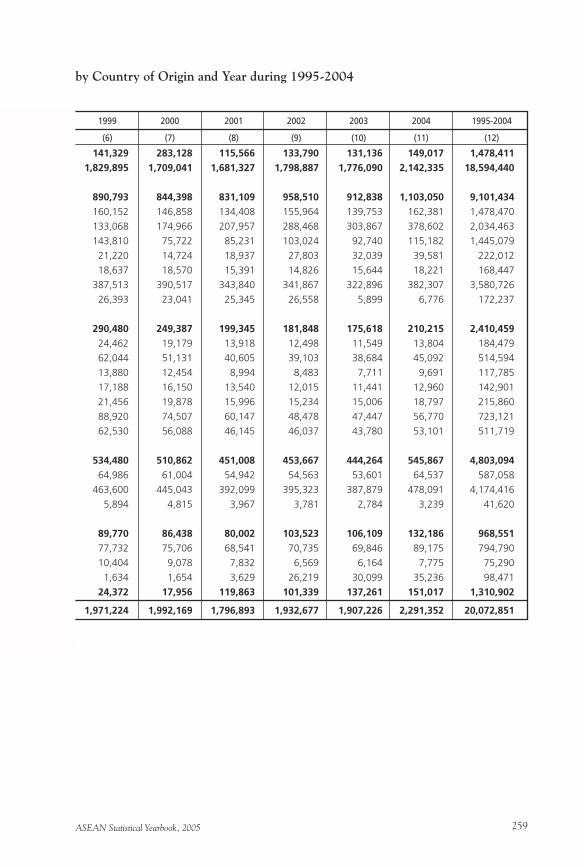
ASEAN Statistical Yearbook, 2005 259
by Country of Origin and Year during 1995-2004
1999 2000 2001 2002 2003 2004 1995-2004
(6) (7) (8) (9) (10) (11) (12)
141,329 283,128 115,566 133,790 131,136 149,017 1,478,411
1,829,895 1,709,041 1,681,327 1,798,887 1,776,090 2,142,335 18,594,440
890,793 844,398 831,109 958,510 912,838 1,103,050 9,101,434
160,152 146,858 134,408 155,964 139,753 162,381 1,478,470
133,068 174,966 207,957 288,468 303,867 378,602 2,034,463
143,810 75,722 85,231 103,024 92,740 115,182 1,445,079
21,220 14,724 18,937 27,803 32,039 39,581 222,012
18,637 18,570 15,391 14,826 15,644 18,221 168,447
387,513 390,517 343,840 341,867 322,896 382,307 3,580,726
26,393 23,041 25,345 26,558 5,899 6,776 172,237
290,480 249,387 199,345 181,848 175,618 210,215 2,410,459
24,462 19,179 13,918 12,498 11,549 13,804 184,479
62,044 51,131 40,605 39,103 38,684 45,092 514,594
13,880 12,454 8,994 8,483 7,711 9,691 117,785
17,188 16,150 13,540 12,015 11,441 12,960 142,901
21,456 19,878 15,996 15,234 15,006 18,797 215,860
88,920 74,507 60,147 48,478 47,447 56,770 723,121
62,530 56,088 46,145 46,037 43,780 53,101 511,719
534,480 510,862 451,008 453,667 444,264 545,867 4,803,094
64,986 61,004 54,942 54,563 53,601 64,537 587,058
463,600 445,043 392,099 395,323 387,879 478,091 4,174,416
5,894 4,815 3,967 3,781 2,784 3,239 41,620
89,770 86,438 80,002 103,523 106,109 132,186 968,551
77,732 75,706 68,541 70,735 69,846 89,175 794,790
10,404 9,078 7,832 6,569 6,164 7,775 75,290
1,634 1,654 3,629 26,219 30,099 35,236 98,471
24,372 17,956 119,863 101,339 137,261 151,017 1,310,902
1,971,224 1,992,169 1,796,893 1,932,677 1,907,226 2,291,352 20,072,851
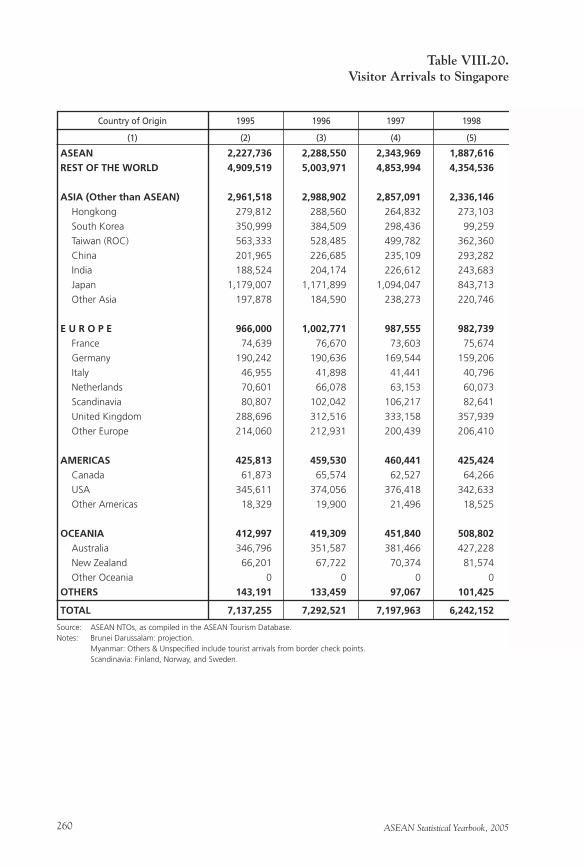
ASEAN Statistical Yearbook, 2005260
Table VIII.20.Visitor Arrivals to Singapore
Country of Origin 1995 1996 1997 1998
(1) (2) (3) (4) (5)
Source: ASEAN NTOs, as compiled in the ASEAN Tourism Database.Notes: Brunei Darussalam: projection. Myanmar: Others & Unspecified include tourist arrivals from border check points. Scandinavia: Finland, Norway, and Sweden.
ASEAN 2,227,736 2,288,550 2,343,969 1,887,616
REST OF THE WORLD 4,909,519 5,003,971 4,853,994 4,354,536
ASIA (Other than ASEAN) 2,961,518 2,988,902 2,857,091 2,336,146
Hongkong 279,812 288,560 264,832 273,103
South Korea 350,999 384,509 298,436 99,259
Taiwan (ROC) 563,333 528,485 499,782 362,360
China 201,965 226,685 235,109 293,282
India 188,524 204,174 226,612 243,683
Japan 1,179,007 1,171,899 1,094,047 843,713
Other Asia 197,878 184,590 238,273 220,746
E U R O P E 966,000 1,002,771 987,555 982,739
France 74,639 76,670 73,603 75,674
Germany 190,242 190,636 169,544 159,206
Italy 46,955 41,898 41,441 40,796
Netherlands 70,601 66,078 63,153 60,073
Scandinavia 80,807 102,042 106,217 82,641
United Kingdom 288,696 312,516 333,158 357,939
Other Europe 214,060 212,931 200,439 206,410
AMERICAS 425,813 459,530 460,441 425,424
Canada 61,873 65,574 62,527 64,266
USA 345,611 374,056 376,418 342,633
Other Americas 18,329 19,900 21,496 18,525
OCEANIA 412,997 419,309 451,840 508,802
Australia 346,796 351,587 381,466 427,228
New Zealand 66,201 67,722 70,374 81,574
Other Oceania 0 0 0 0
OTHERS 143,191 133,459 97,067 101,425
TOTAL 7,137,255 7,292,521 7,197,963 6,242,152
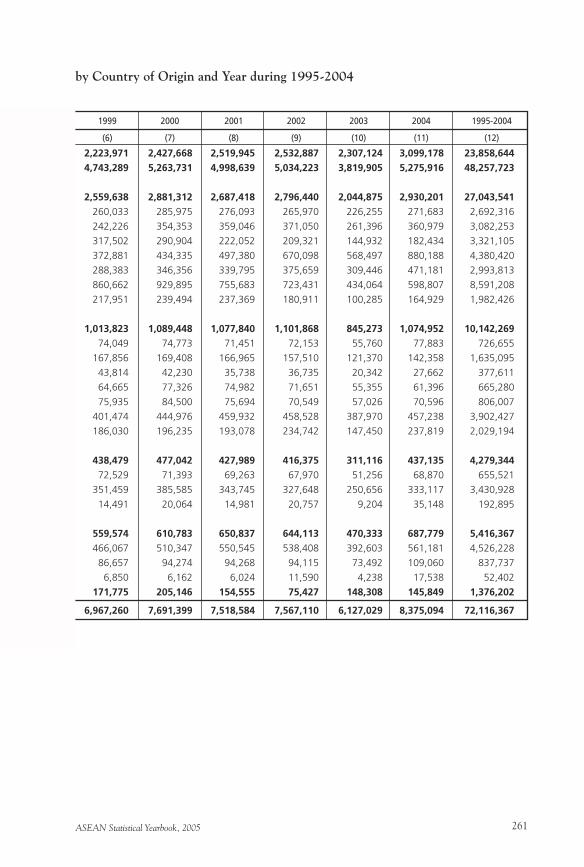
ASEAN Statistical Yearbook, 2005 261
by Country of Origin and Year during 1995-2004
1999 2000 2001 2002 2003 2004 1995-2004
(6) (7) (8) (9) (10) (11) (12)
2,223,971 2,427,668 2,519,945 2,532,887 2,307,124 3,099,178 23,858,644
4,743,289 5,263,731 4,998,639 5,034,223 3,819,905 5,275,916 48,257,723
2,559,638 2,881,312 2,687,418 2,796,440 2,044,875 2,930,201 27,043,541
260,033 285,975 276,093 265,970 226,255 271,683 2,692,316
242,226 354,353 359,046 371,050 261,396 360,979 3,082,253
317,502 290,904 222,052 209,321 144,932 182,434 3,321,105
372,881 434,335 497,380 670,098 568,497 880,188 4,380,420
288,383 346,356 339,795 375,659 309,446 471,181 2,993,813
860,662 929,895 755,683 723,431 434,064 598,807 8,591,208
217,951 239,494 237,369 180,911 100,285 164,929 1,982,426
1,013,823 1,089,448 1,077,840 1,101,868 845,273 1,074,952 10,142,269
74,049 74,773 71,451 72,153 55,760 77,883 726,655
167,856 169,408 166,965 157,510 121,370 142,358 1,635,095
43,814 42,230 35,738 36,735 20,342 27,662 377,611
64,665 77,326 74,982 71,651 55,355 61,396 665,280
75,935 84,500 75,694 70,549 57,026 70,596 806,007
401,474 444,976 459,932 458,528 387,970 457,238 3,902,427
186,030 196,235 193,078 234,742 147,450 237,819 2,029,194
438,479 477,042 427,989 416,375 311,116 437,135 4,279,344
72,529 71,393 69,263 67,970 51,256 68,870 655,521
351,459 385,585 343,745 327,648 250,656 333,117 3,430,928
14,491 20,064 14,981 20,757 9,204 35,148 192,895
559,574 610,783 650,837 644,113 470,333 687,779 5,416,367
466,067 510,347 550,545 538,408 392,603 561,181 4,526,228
86,657 94,274 94,268 94,115 73,492 109,060 837,737
6,850 6,162 6,024 11,590 4,238 17,538 52,402
171,775 205,146 154,555 75,427 148,308 145,849 1,376,202
6,967,260 7,691,399 7,518,584 7,567,110 6,127,029 8,375,094 72,116,367
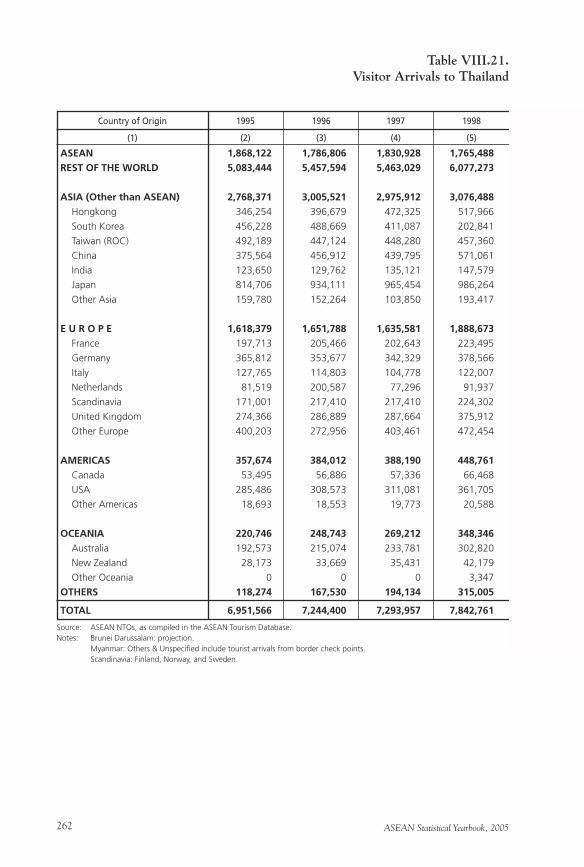
ASEAN Statistical Yearbook, 2005262
Table VIII.21.Visitor Arrivals to Thailand
Country of Origin 1995 1996 1997 1998
(1) (2) (3) (4) (5)
Source: ASEAN NTOs, as compiled in the ASEAN Tourism Database.Notes: Brunei Darussalam: projection. Myanmar: Others & Unspecified include tourist arrivals from border check points. Scandinavia: Finland, Norway, and Sweden.
ASEAN 1,868,122 1,786,806 1,830,928 1,765,488
REST OF THE WORLD 5,083,444 5,457,594 5,463,029 6,077,273
ASIA (Other than ASEAN) 2,768,371 3,005,521 2,975,912 3,076,488
Hongkong 346,254 396,679 472,325 517,966
South Korea 456,228 488,669 411,087 202,841
Taiwan (ROC) 492,189 447,124 448,280 457,360
China 375,564 456,912 439,795 571,061
India 123,650 129,762 135,121 147,579
Japan 814,706 934,111 965,454 986,264
Other Asia 159,780 152,264 103,850 193,417
E U R O P E 1,618,379 1,651,788 1,635,581 1,888,673
France 197,713 205,466 202,643 223,495
Germany 365,812 353,677 342,329 378,566
Italy 127,765 114,803 104,778 122,007
Netherlands 81,519 200,587 77,296 91,937
Scandinavia 171,001 217,410 217,410 224,302
United Kingdom 274,366 286,889 287,664 375,912
Other Europe 400,203 272,956 403,461 472,454
AMERICAS 357,674 384,012 388,190 448,761
Canada 53,495 56,886 57,336 66,468
USA 285,486 308,573 311,081 361,705
Other Americas 18,693 18,553 19,773 20,588
OCEANIA 220,746 248,743 269,212 348,346
Australia 192,573 215,074 233,781 302,820
New Zealand 28,173 33,669 35,431 42,179
Other Oceania 0 0 0 3,347
OTHERS 118,274 167,530 194,134 315,005
TOTAL 6,951,566 7,244,400 7,293,957 7,842,761
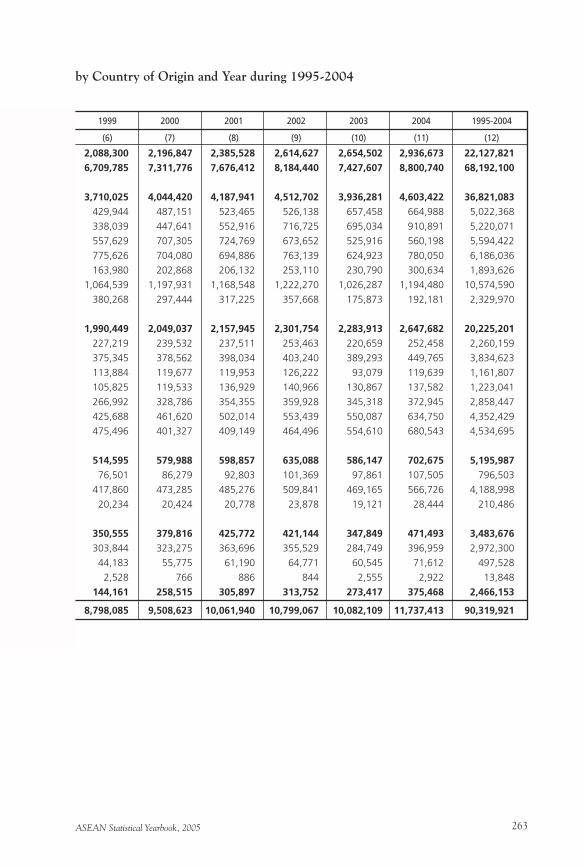
ASEAN Statistical Yearbook, 2005 263
by Country of Origin and Year during 1995-2004
1999 2000 2001 2002 2003 2004 1995-2004
(6) (7) (8) (9) (10) (11) (12)
2,088,300 2,196,847 2,385,528 2,614,627 2,654,502 2,936,673 22,127,821
6,709,785 7,311,776 7,676,412 8,184,440 7,427,607 8,800,740 68,192,100
3,710,025 4,044,420 4,187,941 4,512,702 3,936,281 4,603,422 36,821,083
429,944 487,151 523,465 526,138 657,458 664,988 5,022,368
338,039 447,641 552,916 716,725 695,034 910,891 5,220,071
557,629 707,305 724,769 673,652 525,916 560,198 5,594,422
775,626 704,080 694,886 763,139 624,923 780,050 6,186,036
163,980 202,868 206,132 253,110 230,790 300,634 1,893,626
1,064,539 1,197,931 1,168,548 1,222,270 1,026,287 1,194,480 10,574,590
380,268 297,444 317,225 357,668 175,873 192,181 2,329,970
1,990,449 2,049,037 2,157,945 2,301,754 2,283,913 2,647,682 20,225,201
227,219 239,532 237,511 253,463 220,659 252,458 2,260,159
375,345 378,562 398,034 403,240 389,293 449,765 3,834,623
113,884 119,677 119,953 126,222 93,079 119,639 1,161,807
105,825 119,533 136,929 140,966 130,867 137,582 1,223,041
266,992 328,786 354,355 359,928 345,318 372,945 2,858,447
425,688 461,620 502,014 553,439 550,087 634,750 4,352,429
475,496 401,327 409,149 464,496 554,610 680,543 4,534,695
514,595 579,988 598,857 635,088 586,147 702,675 5,195,987
76,501 86,279 92,803 101,369 97,861 107,505 796,503
417,860 473,285 485,276 509,841 469,165 566,726 4,188,998
20,234 20,424 20,778 23,878 19,121 28,444 210,486
350,555 379,816 425,772 421,144 347,849 471,493 3,483,676
303,844 323,275 363,696 355,529 284,749 396,959 2,972,300
44,183 55,775 61,190 64,771 60,545 71,612 497,528
2,528 766 886 844 2,555 2,922 13,848
144,161 258,515 305,897 313,752 273,417 375,468 2,466,153
8,798,085 9,508,623 10,061,940 10,799,067 10,082,109 11,737,413 90,319,921
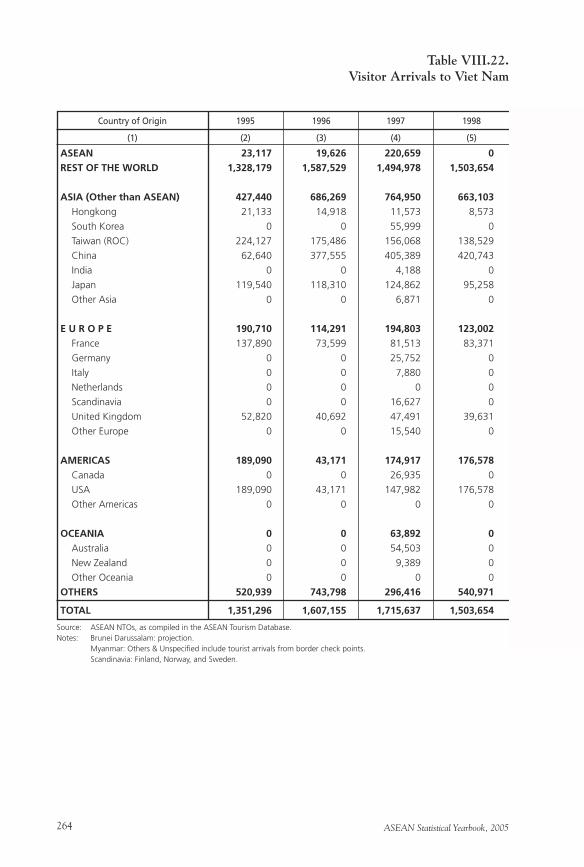
ASEAN Statistical Yearbook, 2005264
Table VIII.22.Visitor Arrivals to Viet Nam
Country of Origin 1995 1996 1997 1998
(1) (2) (3) (4) (5)
Source: ASEAN NTOs, as compiled in the ASEAN Tourism Database.Notes: Brunei Darussalam: projection. Myanmar: Others & Unspecified include tourist arrivals from border check points. Scandinavia: Finland, Norway, and Sweden.
ASEAN 23,117 19,626 220,659 0
REST OF THE WORLD 1,328,179 1,587,529 1,494,978 1,503,654
ASIA (Other than ASEAN) 427,440 686,269 764,950 663,103
Hongkong 21,133 14,918 11,573 8,573
South Korea 0 0 55,999 0
Taiwan (ROC) 224,127 175,486 156,068 138,529
China 62,640 377,555 405,389 420,743
India 0 0 4,188 0
Japan 119,540 118,310 124,862 95,258
Other Asia 0 0 6,871 0
E U R O P E 190,710 114,291 194,803 123,002
France 137,890 73,599 81,513 83,371
Germany 0 0 25,752 0
Italy 0 0 7,880 0
Netherlands 0 0 0 0
Scandinavia 0 0 16,627 0
United Kingdom 52,820 40,692 47,491 39,631
Other Europe 0 0 15,540 0
AMERICAS 189,090 43,171 174,917 176,578
Canada 0 0 26,935 0
USA 189,090 43,171 147,982 176,578
Other Americas 0 0 0 0
OCEANIA 0 0 63,892 0
Australia 0 0 54,503 0
New Zealand 0 0 9,389 0
Other Oceania 0 0 0 0
OTHERS 520,939 743,798 296,416 540,971
TOTAL 1,351,296 1,607,155 1,715,637 1,503,654
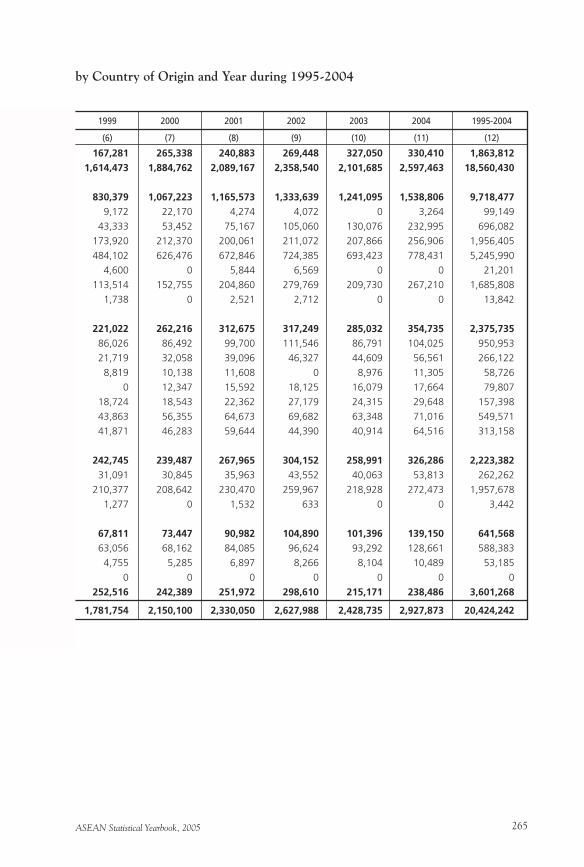
ASEAN Statistical Yearbook, 2005 265
by Country of Origin and Year during 1995-2004
1999 2000 2001 2002 2003 2004 1995-2004
(6) (7) (8) (9) (10) (11) (12)
167,281 265,338 240,883 269,448 327,050 330,410 1,863,812
1,614,473 1,884,762 2,089,167 2,358,540 2,101,685 2,597,463 18,560,430
830,379 1,067,223 1,165,573 1,333,639 1,241,095 1,538,806 9,718,477
9,172 22,170 4,274 4,072 0 3,264 99,149
43,333 53,452 75,167 105,060 130,076 232,995 696,082
173,920 212,370 200,061 211,072 207,866 256,906 1,956,405
484,102 626,476 672,846 724,385 693,423 778,431 5,245,990
4,600 0 5,844 6,569 0 0 21,201
113,514 152,755 204,860 279,769 209,730 267,210 1,685,808
1,738 0 2,521 2,712 0 0 13,842
221,022 262,216 312,675 317,249 285,032 354,735 2,375,735
86,026 86,492 99,700 111,546 86,791 104,025 950,953
21,719 32,058 39,096 46,327 44,609 56,561 266,122
8,819 10,138 11,608 0 8,976 11,305 58,726
0 12,347 15,592 18,125 16,079 17,664 79,807
18,724 18,543 22,362 27,179 24,315 29,648 157,398
43,863 56,355 64,673 69,682 63,348 71,016 549,571
41,871 46,283 59,644 44,390 40,914 64,516 313,158
242,745 239,487 267,965 304,152 258,991 326,286 2,223,382
31,091 30,845 35,963 43,552 40,063 53,813 262,262
210,377 208,642 230,470 259,967 218,928 272,473 1,957,678
1,277 0 1,532 633 0 0 3,442
67,811 73,447 90,982 104,890 101,396 139,150 641,568
63,056 68,162 84,085 96,624 93,292 128,661 588,383
4,755 5,285 6,897 8,266 8,104 10,489 53,185
0 0 0 0 0 0 0
252,516 242,389 251,972 298,610 215,171 238,486 3,601,268
1,781,754 2,150,100 2,330,050 2,627,988 2,428,735 2,927,873 20,424,242
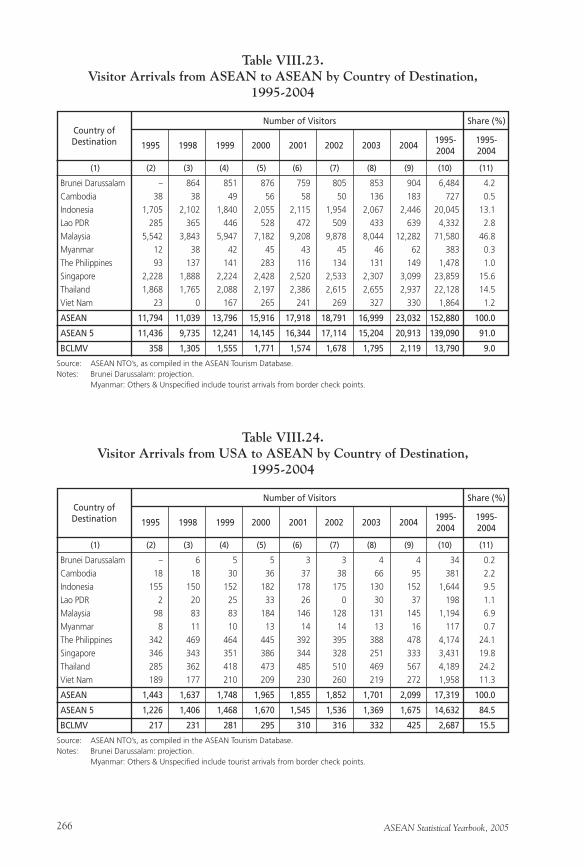
ASEAN Statistical Yearbook, 2005266
1995 1998 1999 2000 2001 2002 2003 2004
Table VIII.23.Visitor Arrivals from ASEAN to ASEAN by Country of Destination,
1995-2004
Country of Destination
(1) (2) (3) (4) (5) (6) (7) (8) (9) (10) (11)
1995-2004
1995-2004
Source: ASEAN NTO’s, as compiled in the ASEAN Tourism Database.Notes: Brunei Darussalam: projection. Myanmar: Others & Unspecified include tourist arrivals from border check points.
Number of Visitors Share (%)
Brunei Darussalam – 864 851 876 759 805 853 904 6,484 4.2
Cambodia 38 38 49 56 58 50 136 183 727 0.5
Indonesia 1,705 2,102 1,840 2,055 2,115 1,954 2,067 2,446 20,045 13.1
Lao PDR 285 365 446 528 472 509 433 639 4,332 2.8
Malaysia 5,542 3,843 5,947 7,182 9,208 9,878 8,044 12,282 71,580 46.8
Myanmar 12 38 42 45 43 45 46 62 383 0.3
The Philippines 93 137 141 283 116 134 131 149 1,478 1.0
Singapore 2,228 1,888 2,224 2,428 2,520 2,533 2,307 3,099 23,859 15.6
Thailand 1,868 1,765 2,088 2,197 2,386 2,615 2,655 2,937 22,128 14.5
Viet Nam 23 0 167 265 241 269 327 330 1,864 1.2
ASEAN 11,794 11,039 13,796 15,916 17,918 18,791 16,999 23,032 152,880 100.0
ASEAN 5 11,436 9,735 12,241 14,145 16,344 17,114 15,204 20,913 139,090 91.0
BCLMV 358 1,305 1,555 1,771 1,574 1,678 1,795 2,119 13,790 9.0
Table VIII.24.Visitor Arrivals from USA to ASEAN by Country of Destination,
1995-2004
Source: ASEAN NTO’s, as compiled in the ASEAN Tourism Database.Notes: Brunei Darussalam: projection. Myanmar: Others & Unspecified include tourist arrivals from border check points.
1995 1998 1999 2000 2001 2002 2003 2004
Country of Destination
(1) (2) (3) (4) (5) (6) (7) (8) (9) (10) (11)
1995-2004
1995-2004
Number of Visitors Share (%)
Brunei Darussalam – 6 5 5 3 3 4 4 34 0.2
Cambodia 18 18 30 36 37 38 66 95 381 2.2
Indonesia 155 150 152 182 178 175 130 152 1,644 9.5
Lao PDR 2 20 25 33 26 0 30 37 198 1.1
Malaysia 98 83 83 184 146 128 131 145 1,194 6.9
Myanmar 8 11 10 13 14 14 13 16 117 0.7
The Philippines 342 469 464 445 392 395 388 478 4,174 24.1
Singapore 346 343 351 386 344 328 251 333 3,431 19.8
Thailand 285 362 418 473 485 510 469 567 4,189 24.2
Viet Nam 189 177 210 209 230 260 219 272 1,958 11.3
ASEAN 1,443 1,637 1,748 1,965 1,855 1,852 1,701 2,099 17,319 100.0
ASEAN 5 1,226 1,406 1,468 1,670 1,545 1,536 1,369 1,675 14,632 84.5
BCLMV 217 231 281 295 310 316 332 425 2,687 15.5
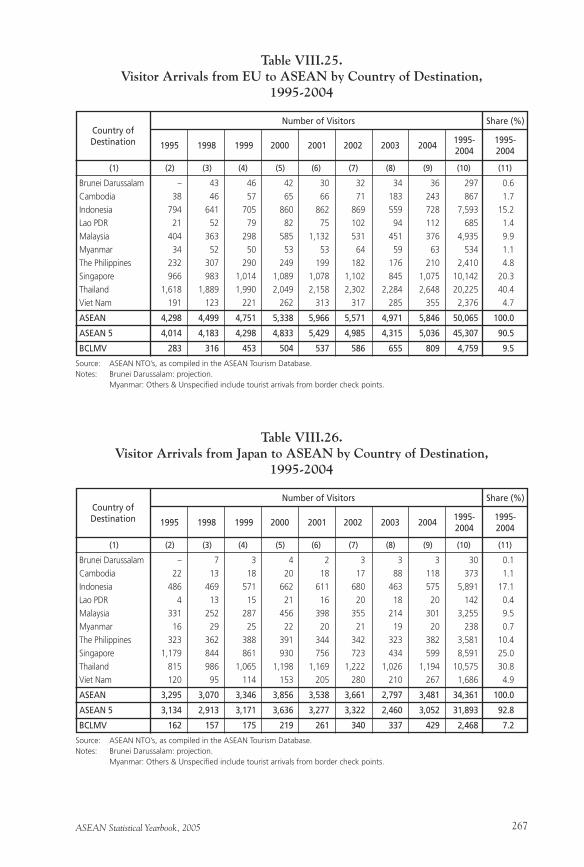
ASEAN Statistical Yearbook, 2005 267
1995 1998 1999 2000 2001 2002 2003 2004
Table VIII.25.Visitor Arrivals from EU to ASEAN by Country of Destination,
1995-2004
Country of Destination
(1) (2) (3) (4) (5) (6) (7) (8) (9) (10) (11)
1995-2004
1995-2004
Source: ASEAN NTO’s, as compiled in the ASEAN Tourism Database.Notes: Brunei Darussalam: projection. Myanmar: Others & Unspecified include tourist arrivals from border check points.
Number of Visitors Share (%)
Brunei Darussalam – 43 46 42 30 32 34 36 297 0.6
Cambodia 38 46 57 65 66 71 183 243 867 1.7
Indonesia 794 641 705 860 862 869 559 728 7,593 15.2
Lao PDR 21 52 79 82 75 102 94 112 685 1.4
Malaysia 404 363 298 585 1,132 531 451 376 4,935 9.9
Myanmar 34 52 50 53 53 64 59 63 534 1.1
The Philippines 232 307 290 249 199 182 176 210 2,410 4.8
Singapore 966 983 1,014 1,089 1,078 1,102 845 1,075 10,142 20.3
Thailand 1,618 1,889 1,990 2,049 2,158 2,302 2,284 2,648 20,225 40.4
Viet Nam 191 123 221 262 313 317 285 355 2,376 4.7
ASEAN 4,298 4,499 4,751 5,338 5,966 5,571 4,971 5,846 50,065 100.0
ASEAN 5 4,014 4,183 4,298 4,833 5,429 4,985 4,315 5,036 45,307 90.5
BCLMV 283 316 453 504 537 586 655 809 4,759 9.5
Table VIII.26.Visitor Arrivals from Japan to ASEAN by Country of Destination,
1995-2004
Source: ASEAN NTO’s, as compiled in the ASEAN Tourism Database.Notes: Brunei Darussalam: projection. Myanmar: Others & Unspecified include tourist arrivals from border check points.
1995 1998 1999 2000 2001 2002 2003 2004
Country of Destination
(1) (2) (3) (4) (5) (6) (7) (8) (9) (10) (11)
1995-2004
1995-2004
Number of Visitors Share (%)
Brunei Darussalam – 7 3 4 2 3 3 3 30 0.1
Cambodia 22 13 18 20 18 17 88 118 373 1.1
Indonesia 486 469 571 662 611 680 463 575 5,891 17.1
Lao PDR 4 13 15 21 16 20 18 20 142 0.4
Malaysia 331 252 287 456 398 355 214 301 3,255 9.5
Myanmar 16 29 25 22 20 21 19 20 238 0.7
The Philippines 323 362 388 391 344 342 323 382 3,581 10.4
Singapore 1,179 844 861 930 756 723 434 599 8,591 25.0
Thailand 815 986 1,065 1,198 1,169 1,222 1,026 1,194 10,575 30.8
Viet Nam 120 95 114 153 205 280 210 267 1,686 4.9
ASEAN 3,295 3,070 3,346 3,856 3,538 3,661 2,797 3,481 34,361 100.0
ASEAN 5 3,134 2,913 3,171 3,636 3,277 3,322 2,460 3,052 31,893 92.8
BCLMV 162 157 175 219 261 340 337 429 2,468 7.2
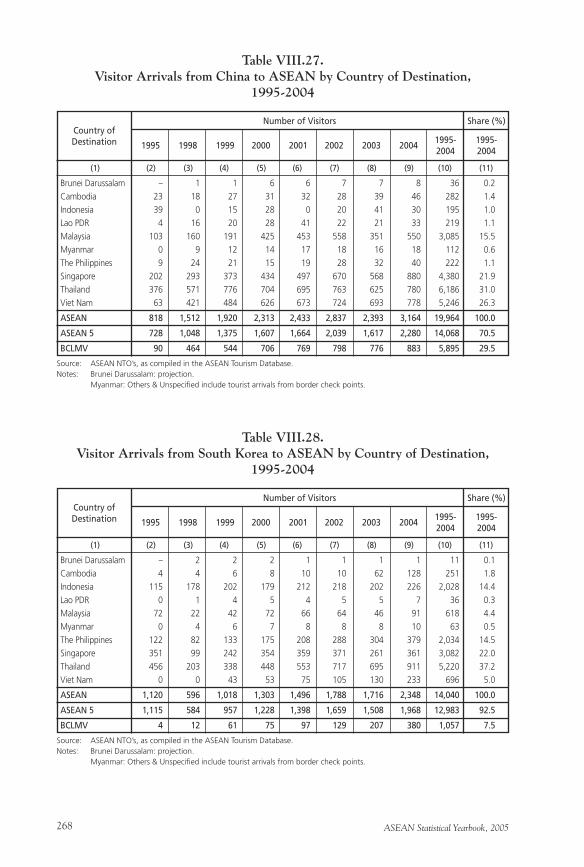
ASEAN Statistical Yearbook, 2005268
1995 1998 1999 2000 2001 2002 2003 2004
Table VIII.27.Visitor Arrivals from China to ASEAN by Country of Destination,
1995-2004
Country of Destination
(1) (2) (3) (4) (5) (6) (7) (8) (9) (10) (11)
1995-2004
1995-2004
Source: ASEAN NTO’s, as compiled in the ASEAN Tourism Database.Notes: Brunei Darussalam: projection. Myanmar: Others & Unspecified include tourist arrivals from border check points.
Number of Visitors Share (%)
Brunei Darussalam – 1 1 6 6 7 7 8 36 0.2
Cambodia 23 18 27 31 32 28 39 46 282 1.4
Indonesia 39 0 15 28 0 20 41 30 195 1.0
Lao PDR 4 16 20 28 41 22 21 33 219 1.1
Malaysia 103 160 191 425 453 558 351 550 3,085 15.5
Myanmar 0 9 12 14 17 18 16 18 112 0.6
The Philippines 9 24 21 15 19 28 32 40 222 1.1
Singapore 202 293 373 434 497 670 568 880 4,380 21.9
Thailand 376 571 776 704 695 763 625 780 6,186 31.0
Viet Nam 63 421 484 626 673 724 693 778 5,246 26.3
ASEAN 818 1,512 1,920 2,313 2,433 2,837 2,393 3,164 19,964 100.0
ASEAN 5 728 1,048 1,375 1,607 1,664 2,039 1,617 2,280 14,068 70.5
BCLMV 90 464 544 706 769 798 776 883 5,895 29.5
Table VIII.28.Visitor Arrivals from South Korea to ASEAN by Country of Destination,
1995-2004
Source: ASEAN NTO’s, as compiled in the ASEAN Tourism Database.Notes: Brunei Darussalam: projection. Myanmar: Others & Unspecified include tourist arrivals from border check points.
1995 1998 1999 2000 2001 2002 2003 2004
Country of Destination
(1) (2) (3) (4) (5) (6) (7) (8) (9) (10) (11)
1995-2004
1995-2004
Number of Visitors Share (%)
Brunei Darussalam – 2 2 2 1 1 1 1 11 0.1
Cambodia 4 4 6 8 10 10 62 128 251 1.8
Indonesia 115 178 202 179 212 218 202 226 2,028 14.4
Lao PDR 0 1 4 5 4 5 5 7 36 0.3
Malaysia 72 22 42 72 66 64 46 91 618 4.4
Myanmar 0 4 6 7 8 8 8 10 63 0.5
The Philippines 122 82 133 175 208 288 304 379 2,034 14.5
Singapore 351 99 242 354 359 371 261 361 3,082 22.0
Thailand 456 203 338 448 553 717 695 911 5,220 37.2
Viet Nam 0 0 43 53 75 105 130 233 696 5.0
ASEAN 1,120 596 1,018 1,303 1,496 1,788 1,716 2,348 14,040 100.0
ASEAN 5 1,115 584 957 1,228 1,398 1,659 1,508 1,968 12,983 92.5
BCLMV 4 12 61 75 97 129 207 380 1,057 7.5
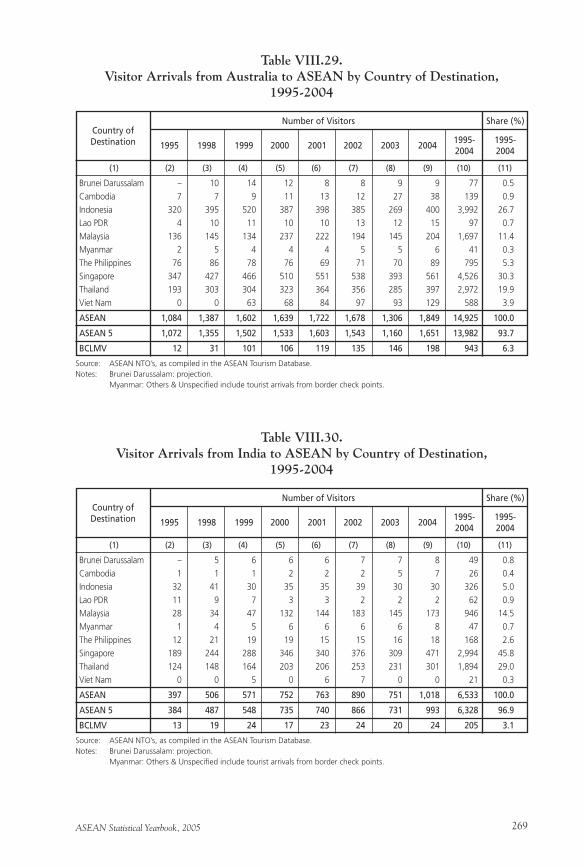
ASEAN Statistical Yearbook, 2005 269
1995 1998 1999 2000 2001 2002 2003 2004
Table VIII.29.Visitor Arrivals from Australia to ASEAN by Country of Destination,
1995-2004
Country of Destination
(1) (2) (3) (4) (5) (6) (7) (8) (9) (10) (11)
1995-2004
1995-2004
Source: ASEAN NTO’s, as compiled in the ASEAN Tourism Database.Notes: Brunei Darussalam: projection. Myanmar: Others & Unspecified include tourist arrivals from border check points.
Number of Visitors Share (%)
Brunei Darussalam – 10 14 12 8 8 9 9 77 0.5
Cambodia 7 7 9 11 13 12 27 38 139 0.9
Indonesia 320 395 520 387 398 385 269 400 3,992 26.7
Lao PDR 4 10 11 10 10 13 12 15 97 0.7
Malaysia 136 145 134 237 222 194 145 204 1,697 11.4
Myanmar 2 5 4 4 4 5 5 6 41 0.3
The Philippines 76 86 78 76 69 71 70 89 795 5.3
Singapore 347 427 466 510 551 538 393 561 4,526 30.3
Thailand 193 303 304 323 364 356 285 397 2,972 19.9
Viet Nam 0 0 63 68 84 97 93 129 588 3.9
ASEAN 1,084 1,387 1,602 1,639 1,722 1,678 1,306 1,849 14,925 100.0
ASEAN 5 1,072 1,355 1,502 1,533 1,603 1,543 1,160 1,651 13,982 93.7
BCLMV 12 31 101 106 119 135 146 198 943 6.3
Table VIII.30.Visitor Arrivals from India to ASEAN by Country of Destination,
1995-2004
Source: ASEAN NTO’s, as compiled in the ASEAN Tourism Database.Notes: Brunei Darussalam: projection. Myanmar: Others & Unspecified include tourist arrivals from border check points.
1995 1998 1999 2000 2001 2002 2003 2004
Country of Destination
(1) (2) (3) (4) (5) (6) (7) (8) (9) (10) (11)
1995-2004
1995-2004
Number of Visitors Share (%)
Brunei Darussalam – 5 6 6 6 7 7 8 49 0.8
Cambodia 1 1 1 2 2 2 5 7 26 0.4
Indonesia 32 41 30 35 35 39 30 30 326 5.0
Lao PDR 11 9 7 3 3 2 2 2 62 0.9
Malaysia 28 34 47 132 144 183 145 173 946 14.5
Myanmar 1 4 5 6 6 6 6 8 47 0.7
The Philippines 12 21 19 19 15 15 16 18 168 2.6
Singapore 189 244 288 346 340 376 309 471 2,994 45.8
Thailand 124 148 164 203 206 253 231 301 1,894 29.0
Viet Nam 0 0 5 0 6 7 0 0 21 0.3
ASEAN 397 506 571 752 763 890 751 1,018 6,533 100.0
ASEAN 5 384 487 548 735 740 866 731 993 6,328 96.9
BCLMV 13 19 24 17 23 24 20 24 205 3.1

ASEAN Statistical Yearbook, 2005270
ASEAN Statistical Yearbook, 2005 271
Chapter IXAgriculture

ASEAN Statistical Yearbook, 2005272
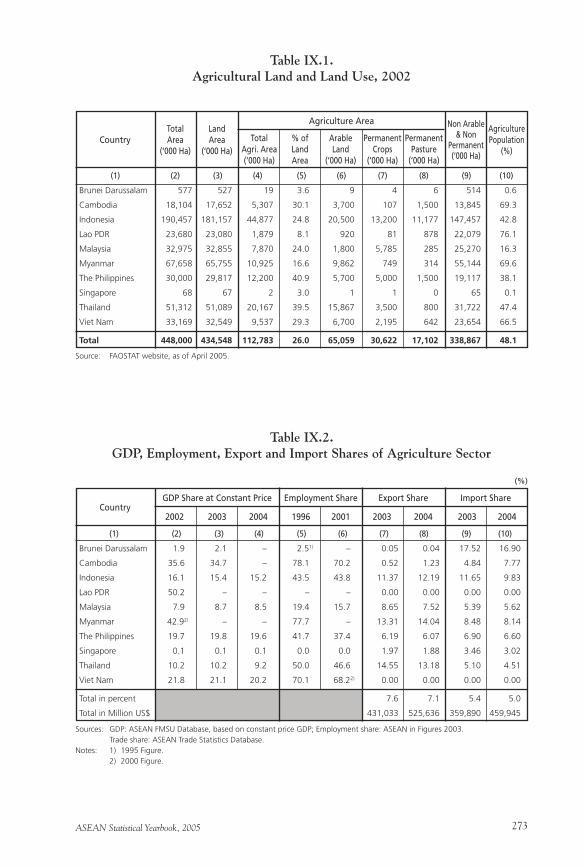
ASEAN Statistical Yearbook, 2005 273
Brunei Darussalam 577 527 19 3.6 9 4 6 514 0.6
Cambodia 18,104 17,652 5,307 30.1 3,700 107 1,500 13,845 69.3
Indonesia 190,457 181,157 44,877 24.8 20,500 13,200 11,177 147,457 42.8
Lao PDR 23,680 23,080 1,879 8.1 920 81 878 22,079 76.1
Malaysia 32,975 32,855 7,870 24.0 1,800 5,785 285 25,270 16.3
Myanmar 67,658 65,755 10,925 16.6 9,862 749 314 55,144 69.6
The Philippines 30,000 29,817 12,200 40.9 5,700 5,000 1,500 19,117 38.1
Singapore 68 67 2 3.0 1 1 0 65 0.1
Thailand 51,312 51,089 20,167 39.5 15,867 3,500 800 31,722 47.4
Viet Nam 33,169 32,549 9,537 29.3 6,700 2,195 642 23,654 66.5
Total 448,000 434,548 112,783 26.0 65,059 30,622 17,102 338,867 48.1
Total Area
(‘000 Ha)
Table IX.1.Agricultural Land and Land Use, 2002
Country
(1) (2) (3) (4) (5) (6) (7) (8) (9) (10)
Source: FAOSTAT website, as of April 2005.
Agriculture AreaLandArea
(‘000 Ha)Total
Agri. Area(‘000 Ha)
% ofLandArea
ArableLand
(‘000 Ha)
PermanentCrops
(‘000 Ha)
PermanentPasture
(‘000 Ha)
Non Arable& Non
Permanent(‘000 Ha)
AgriculturePopulation
(%)
2002 2003 2004 1996 2001 2003 2004 2003 2004
Table IX.2.GDP, Employment, Export and Import Shares of Agriculture Sector
Country
(1) (2) (3) (4) (5) (6) (7) (8) (9) (10)
Sources: GDP: ASEAN FMSU Database, based on constant price GDP; Employment share: ASEAN in Figures 2003. Trade share: ASEAN Trade Statistics Database.Notes: 1) 1995 Figure. 2) 2000 Figure.
(%)
GDP Share at Constant Price Employment Share Export Share Import Share
Brunei Darussalam 1.9 2.1 – 2.51) – 0.05 0.04 17.52 16.90
Cambodia 35.6 34.7 – 78.1 70.2 0.52 1.23 4.84 7.77
Indonesia 16.1 15.4 15.2 43.5 43.8 11.37 12.19 11.65 9.83
Lao PDR 50.2 – – – – 0.00 0.00 0.00 0.00
Malaysia 7.9 8.7 8.5 19.4 15.7 8.65 7.52 5.39 5.62
Myanmar 42.92) – – 77.7 – 13.31 14.04 8.48 8.14
The Philippines 19.7 19.8 19.6 41.7 37.4 6.19 6.07 6.90 6.60
Singapore 0.1 0.1 0.1 0.0 0.0 1.97 1.88 3.46 3.02
Thailand 10.2 10.2 9.2 50.0 46.6 14.55 13.18 5.10 4.51
Viet Nam 21.8 21.1 20.2 70.1 68.22) 0.00 0.00 0.00 0.00
Total in percent 7.6 7.1 5.4 5.0
Total in Million US$ 431,033 525,636 359,890 459,945
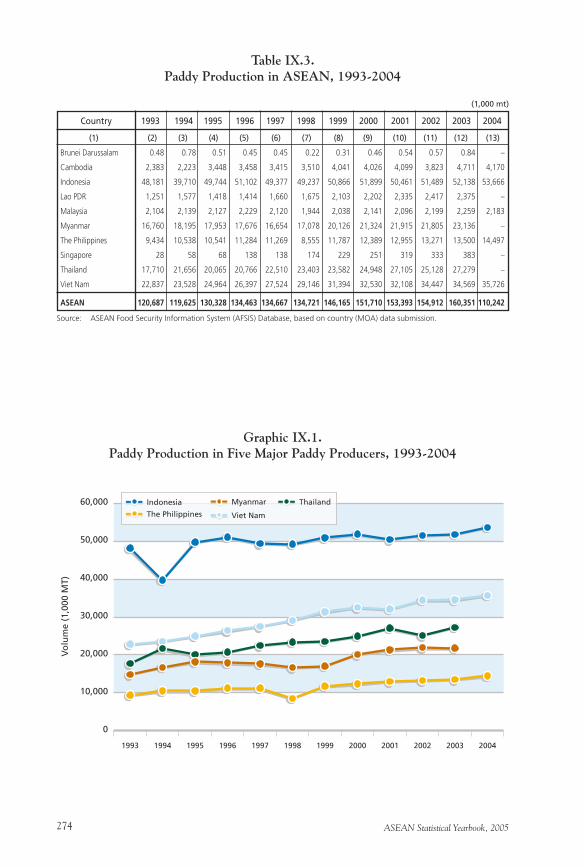
ASEAN Statistical Yearbook, 2005274
Brunei Darussalam 0.48 0.78 0.51 0.45 0.45 0.22 0.31 0.46 0.54 0.57 0.84 –
Cambodia 2,383 2,223 3,448 3,458 3,415 3,510 4,041 4,026 4,099 3,823 4,711 4,170
Indonesia 48,181 39,710 49,744 51,102 49,377 49,237 50,866 51,899 50,461 51,489 52,138 53,666
Lao PDR 1,251 1,577 1,418 1,414 1,660 1,675 2,103 2,202 2,335 2,417 2,375 –
Malaysia 2,104 2,139 2,127 2,229 2,120 1,944 2,038 2,141 2,096 2,199 2,259 2,183
Myanmar 16,760 18,195 17,953 17,676 16,654 17,078 20,126 21,324 21,915 21,805 23,136 –
The Philippines 9,434 10,538 10,541 11,284 11,269 8,555 11,787 12,389 12,955 13,271 13,500 14,497
Singapore 28 58 68 138 138 174 229 251 319 333 383 –
Thailand 17,710 21,656 20,065 20,766 22,510 23,403 23,582 24,948 27,105 25,128 27,279 –
Viet Nam 22,837 23,528 24,964 26,397 27,524 29,146 31,394 32,530 32,108 34,447 34,569 35,726
ASEAN 120,687 119,625 130,328 134,463 134,667 134,721 146,165 151,710 153,393 154,912 160,351 110,242
1993 1994 1995 1996 1997 1998 1999 2000 2001 2002 2003 2004
Table IX.3.Paddy Production in ASEAN, 1993-2004
Country
(1) (2) (3) (4) (5) (6) (7) (8) (9) (10) (11) (12) (13)
(1,000 mt)
Source: ASEAN Food Security Information System (AFSIS) Database, based on country (MOA) data submission.
Graphic IX.1.Paddy Production in Five Major Paddy Producers, 1993-2004
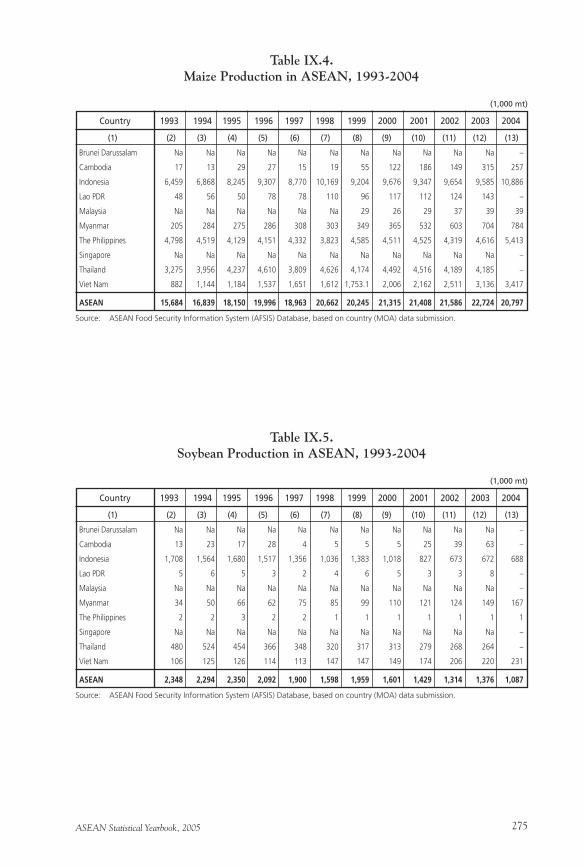
ASEAN Statistical Yearbook, 2005 275
Brunei Darussalam Na Na Na Na Na Na Na Na Na Na Na –
Cambodia 17 13 29 27 15 19 55 122 186 149 315 257
Indonesia 6,459 6,868 8,245 9,307 8,770 10,169 9,204 9,676 9,347 9,654 9,585 10,886
Lao PDR 48 56 50 78 78 110 96 117 112 124 143 –
Malaysia Na Na Na Na Na Na 29 26 29 37 39 39
Myanmar 205 284 275 286 308 303 349 365 532 603 704 784
The Philippines 4,798 4,519 4,129 4,151 4,332 3,823 4,585 4,511 4,525 4,319 4,616 5,413
Singapore Na Na Na Na Na Na Na Na Na Na Na –
Thailand 3,275 3,956 4,237 4,610 3,809 4,626 4,174 4,492 4,516 4,189 4,185 –
Viet Nam 882 1,144 1,184 1,537 1,651 1,612 1,753.1 2,006 2,162 2,511 3,136 3,417
ASEAN 15,684 16,839 18,150 19,996 18,963 20,662 20,245 21,315 21,408 21,586 22,724 20,797
1993 1994 1995 1996 1997 1998 1999 2000 2001 2002 2003 2004
Table IX.4.Maize Production in ASEAN, 1993-2004
Country
(1) (2) (3) (4) (5) (6) (7) (8) (9) (10) (11) (12) (13)
(1,000 mt)
Source: ASEAN Food Security Information System (AFSIS) Database, based on country (MOA) data submission.
Brunei Darussalam Na Na Na Na Na Na Na Na Na Na Na –
Cambodia 13 23 17 28 4 5 5 5 25 39 63 –
Indonesia 1,708 1,564 1,680 1,517 1,356 1,036 1,383 1,018 827 673 672 688
Lao PDR 5 6 5 3 2 4 6 5 3 3 8 –
Malaysia Na Na Na Na Na Na Na Na Na Na Na –
Myanmar 34 50 66 62 75 85 99 110 121 124 149 167
The Philippines 2 2 3 2 2 1 1 1 1 1 1 1
Singapore Na Na Na Na Na Na Na Na Na Na Na –
Thailand 480 524 454 366 348 320 317 313 279 268 264 –
Viet Nam 106 125 126 114 113 147 147 149 174 206 220 231
ASEAN 2,348 2,294 2,350 2,092 1,900 1,598 1,959 1,601 1,429 1,314 1,376 1,087
1993 1994 1995 1996 1997 1998 1999 2000 2001 2002 2003 2004
Table IX.5.Soybean Production in ASEAN, 1993-2004
Country
(1) (2) (3) (4) (5) (6) (7) (8) (9) (10) (11) (12) (13)
(1,000 mt)
Source: ASEAN Food Security Information System (AFSIS) Database, based on country (MOA) data submission.
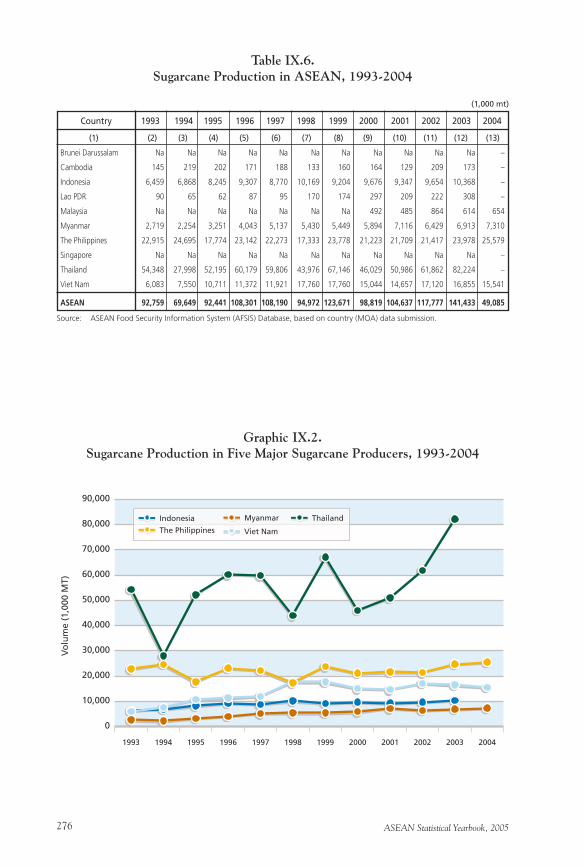
ASEAN Statistical Yearbook, 2005276
Brunei Darussalam Na Na Na Na Na Na Na Na Na Na Na –
Cambodia 145 219 202 171 188 133 160 164 129 209 173 –
Indonesia 6,459 6,868 8,245 9,307 8,770 10,169 9,204 9,676 9,347 9,654 10,368 –
Lao PDR 90 65 62 87 95 170 174 297 209 222 308 –
Malaysia Na Na Na Na Na Na Na 492 485 864 614 654
Myanmar 2,719 2,254 3,251 4,043 5,137 5,430 5,449 5,894 7,116 6,429 6,913 7,310
The Philippines 22,915 24,695 17,774 23,142 22,273 17,333 23,778 21,223 21,709 21,417 23,978 25,579
Singapore Na Na Na Na Na Na Na Na Na Na Na –
Thailand 54,348 27,998 52,195 60,179 59,806 43,976 67,146 46,029 50,986 61,862 82,224 –
Viet Nam 6,083 7,550 10,711 11,372 11,921 17,760 17,760 15,044 14,657 17,120 16,855 15,541
ASEAN 92,759 69,649 92,441 108,301 108,190 94,972 123,671 98,819 104,637 117,777 141,433 49,085
1993 1994 1995 1996 1997 1998 1999 2000 2001 2002 2003 2004
Table IX.6.Sugarcane Production in ASEAN, 1993-2004
Country
(1) (2) (3) (4) (5) (6) (7) (8) (9) (10) (11) (12) (13)
(1,000 mt)
Source: ASEAN Food Security Information System (AFSIS) Database, based on country (MOA) data submission.
Graphic IX.2.Sugarcane Production in Five Major Sugarcane Producers, 1993-2004
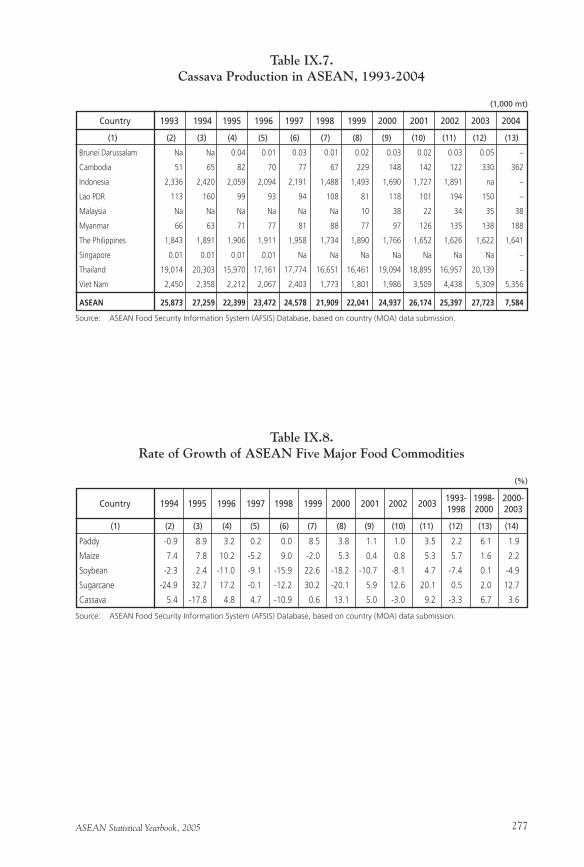
ASEAN Statistical Yearbook, 2005 277
Brunei Darussalam Na Na 0.04 0.01 0.03 0.01 0.02 0.03 0.02 0.03 0.05 –
Cambodia 51 65 82 70 77 67 229 148 142 122 330 362
Indonesia 2,336 2,420 2,059 2,094 2,191 1,488 1,493 1,690 1,727 1,891 na –
Lao PDR 113 160 99 93 94 108 81 118 101 194 150 –
Malaysia Na Na Na Na Na Na 10 38 22 34 35 38
Myanmar 66 63 71 77 81 88 77 97 126 135 138 188
The Philippines 1,843 1,891 1,906 1,911 1,958 1,734 1,890 1,766 1,652 1,626 1,622 1,641
Singapore 0.01 0.01 0.01 0.01 Na Na Na Na Na Na Na –
Thailand 19,014 20,303 15,970 17,161 17,774 16,651 16,461 19,094 18,895 16,957 20,139 –
Viet Nam 2,450 2,358 2,212 2,067 2,403 1,773 1,801 1,986 3,509 4,438 5,309 5,356
ASEAN 25,873 27,259 22,399 23,472 24,578 21,909 22,041 24,937 26,174 25,397 27,723 7,584
1993 1994 1995 1996 1997 1998 1999 2000 2001 2002 2003 2004
Table IX.7.Cassava Production in ASEAN, 1993-2004
Country
(1) (2) (3) (4) (5) (6) (7) (8) (9) (10) (11) (12) (13)
(1,000 mt)
Source: ASEAN Food Security Information System (AFSIS) Database, based on country (MOA) data submission.
Paddy -0.9 8.9 3.2 0.2 0.0 8.5 3.8 1.1 1.0 3.5 2.2 6.1 1.9
Maize 7.4 7.8 10.2 -5.2 9.0 -2.0 5.3 0.4 0.8 5.3 5.7 1.6 2.2
Soybean -2.3 2.4 -11.0 -9.1 -15.9 22.6 -18.2 -10.7 -8.1 4.7 -7.4 0.1 -4.9
Sugarcane -24.9 32.7 17.2 -0.1 -12.2 30.2 -20.1 5.9 12.6 20.1 0.5 2.0 12.7
Cassava 5.4 -17.8 4.8 4.7 -10.9 0.6 13.1 5.0 -3.0 9.2 -3.3 6.7 3.6
1994 1995 1996 1997 1998 1999 2000 2001 2002 2003
Table IX.8.Rate of Growth of ASEAN Five Major Food Commodities
Country
(1) (2) (3) (4) (5) (6) (7) (8) (9) (10) (11) (12) (13) (14)
(%)
Source: ASEAN Food Security Information System (AFSIS) Database, based on country (MOA) data submission.
1993- 1998- 2000- 1998 2000 2003
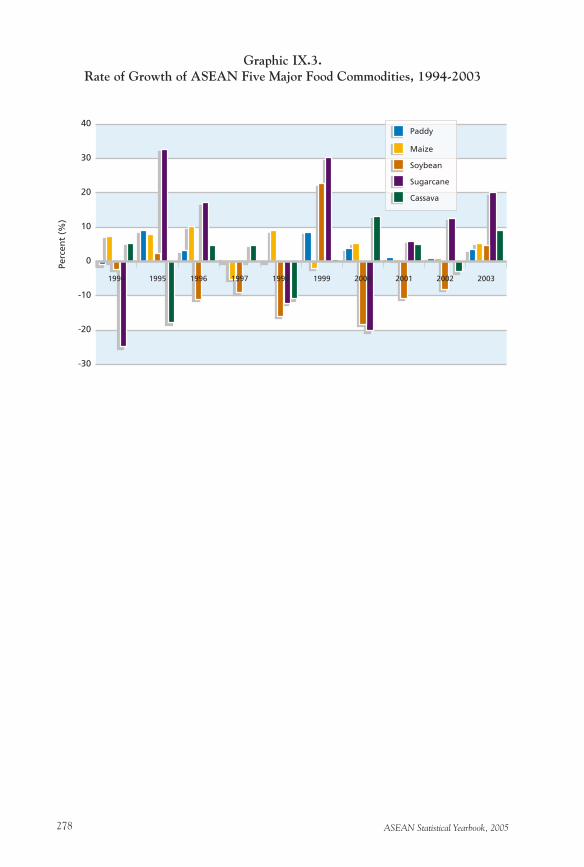
ASEAN Statistical Yearbook, 2005278
Graphic IX.3.Rate of Growth of ASEAN Five Major Food Commodities, 1994-2003
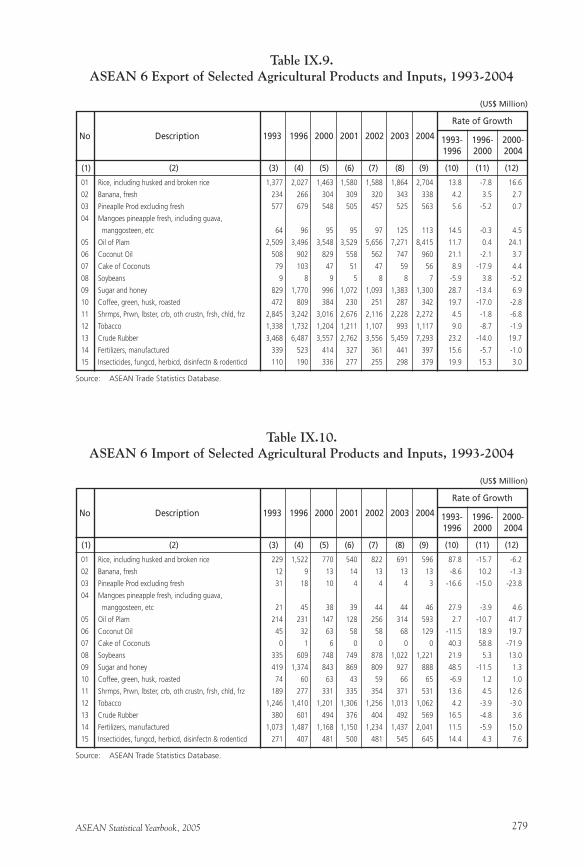
ASEAN Statistical Yearbook, 2005 279
01 Rice, including husked and broken rice 1,377 2,027 1,463 1,580 1,588 1,864 2,704 13.8 -7.8 16.6
02 Banana, fresh 234 266 304 309 320 343 338 4.2 3.5 2.7
03 Pineaplle Prod excluding fresh 577 679 548 505 457 525 563 5.6 -5.2 0.7
04 Mangoes pineapple fresh, including guava,
manggosteen, etc 64 96 95 95 97 125 113 14.5 -0.3 4.5
05 Oil of Plam 2,509 3,496 3,548 3,529 5,656 7,271 8,415 11.7 0.4 24.1
06 Coconut Oil 508 902 829 558 562 747 960 21.1 -2.1 3.7
07 Cake of Coconuts 79 103 47 51 47 59 56 8.9 -17.9 4.4
08 Soybeans 9 8 9 5 8 8 7 -5.9 3.8 -5.2
09 Sugar and honey 829 1,770 996 1,072 1,093 1,383 1,300 28.7 -13.4 6.9
10 Coffee, green, husk, roasted 472 809 384 230 251 287 342 19.7 -17.0 -2.8
11 Shrmps, Prwn, lbster, crb, oth crustn, frsh, chld, frz 2,845 3,242 3,016 2,676 2,116 2,228 2,272 4.5 -1.8 -6.8
12 Tobacco 1,338 1,732 1,204 1,211 1,107 993 1,117 9.0 -8.7 -1.9
13 Crude Rubber 3,468 6,487 3,557 2,762 3,556 5,459 7,293 23.2 -14.0 19.7
14 Fertilizers, manufactured 339 523 414 327 361 441 397 15.6 -5.7 -1.0
15 Insecticides, fungcd, herbicd, disinfectn & rodenticd 110 190 336 277 255 298 379 19.9 15.3 3.0
No
Table IX.9.ASEAN 6 Export of Selected Agricultural Products and Inputs, 1993-2004
Description
(1) (2) (3) (4) (5) (6) (7) (8) (9) (10) (11) (12)
(US$ Million)
1993 1996 2000 2001 2002 2003 2004 1993- 1996- 2000- 1996 2000 2004
Source: ASEAN Trade Statistics Database.
Rate of Growth
01 Rice, including husked and broken rice 229 1,522 770 540 822 691 596 87.8 -15.7 -6.2
02 Banana, fresh 12 9 13 14 13 13 13 -8.6 10.2 -1.3
03 Pineaplle Prod excluding fresh 31 18 10 4 4 4 3 -16.6 -15.0 -23.8
04 Mangoes pineapple fresh, including guava,
manggosteen, etc 21 45 38 39 44 44 46 27.9 -3.9 4.6
05 Oil of Plam 214 231 147 128 256 314 593 2.7 -10.7 41.7
06 Coconut Oil 45 32 63 58 58 68 129 -11.5 18.9 19.7
07 Cake of Coconuts 0 1 6 0 0 0 0 40.3 58.8 -71.9
08 Soybeans 335 609 748 749 878 1,022 1,221 21.9 5.3 13.0
09 Sugar and honey 419 1,374 843 869 809 927 888 48.5 -11.5 1.3
10 Coffee, green, husk, roasted 74 60 63 43 59 66 65 -6.9 1.2 1.0
11 Shrmps, Prwn, lbster, crb, oth crustn, frsh, chld, frz 189 277 331 335 354 371 531 13.6 4.5 12.6
12 Tobacco 1,246 1,410 1,201 1,306 1,256 1,013 1,062 4.2 -3.9 -3.0
13 Crude Rubber 380 601 494 376 404 492 569 16.5 -4.8 3.6
14 Fertilizers, manufactured 1,073 1,487 1,168 1,150 1,234 1,437 2,041 11.5 -5.9 15.0
15 Insecticides, fungcd, herbicd, disinfectn & rodenticd 271 407 481 500 481 545 645 14.4 4.3 7.6
No
Table IX.10.ASEAN 6 Import of Selected Agricultural Products and Inputs, 1993-2004
Description
(1) (2) (3) (4) (5) (6) (7) (8) (9) (10) (11) (12)
(US$ Million)
1993 1996 2000 2001 2002 2003 2004 1993- 1996- 2000- 1996 2000 2004
Source: ASEAN Trade Statistics Database.
Rate of Growth
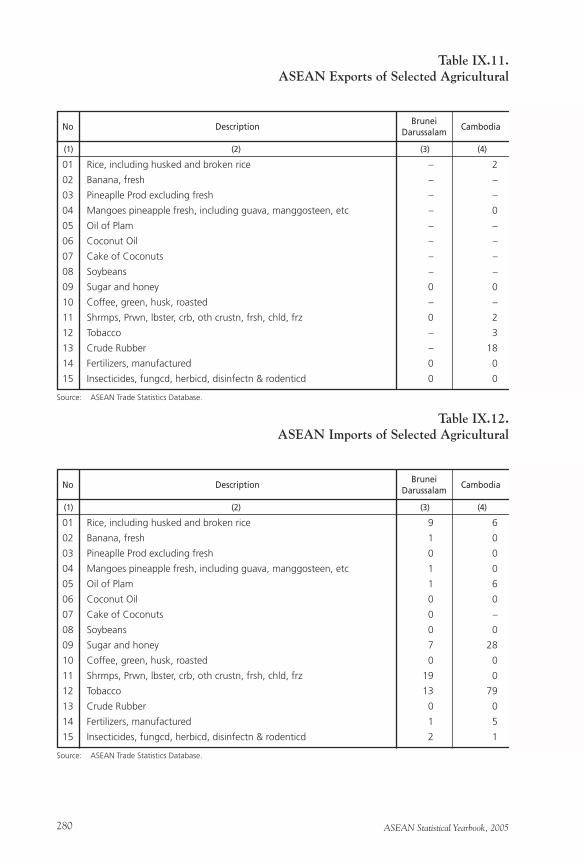
ASEAN Statistical Yearbook, 2005280
01 Rice, including husked and broken rice – 2
02 Banana, fresh – –
03 Pineaplle Prod excluding fresh – –
04 Mangoes pineapple fresh, including guava, manggosteen, etc – 0
05 Oil of Plam – –
06 Coconut Oil – –
07 Cake of Coconuts – –
08 Soybeans – –
09 Sugar and honey 0 0
10 Coffee, green, husk, roasted – –
11 Shrmps, Prwn, lbster, crb, oth crustn, frsh, chld, frz 0 2
12 Tobacco – 3
13 Crude Rubber – 18
14 Fertilizers, manufactured 0 0
15 Insecticides, fungcd, herbicd, disinfectn & rodenticd 0 0
Table IX.11.ASEAN Exports of Selected Agricultural
No
Source: ASEAN Trade Statistics Database.
(1) (2) (3) (4)
CambodiaDescriptionBrunei
Darussalam
Source: ASEAN Trade Statistics Database.
01 Rice, including husked and broken rice 9 6
02 Banana, fresh 1 0
03 Pineaplle Prod excluding fresh 0 0
04 Mangoes pineapple fresh, including guava, manggosteen, etc 1 0
05 Oil of Plam 1 6
06 Coconut Oil 0 0
07 Cake of Coconuts 0 –
08 Soybeans 0 0
09 Sugar and honey 7 28
10 Coffee, green, husk, roasted 0 0
11 Shrmps, Prwn, lbster, crb, oth crustn, frsh, chld, frz 19 0
12 Tobacco 13 79
13 Crude Rubber 0 0
14 Fertilizers, manufactured 1 5
15 Insecticides, fungcd, herbicd, disinfectn & rodenticd 2 1
Table IX.12.ASEAN Imports of Selected Agricultural
No
(1) (2) (3) (4)
CambodiaDescriptionBrunei
Darussalam

ASEAN Statistical Yearbook, 2005 281
Products and Inputs by Countries, 2001
1 0 91 0 0 1,578 1,673 1,580
0 8 – 297 0 3 309 309
76 9 – 134 13 274 505 505
5 9 – 63 1 16 95 95
1,081 2,335 – 0 71 43 3,529 3,529
112 20 – 418 7 2 558 558
15 0 – 36 – 0 51 51
0 4 – 0 1 0 5 5
64 102 6 58 47 801 1,078 1,072
188 3 – 0 12 26 230 230
1,008 175 85 149 54 1,289 2,763 2,676
275 215 6 36 617 68 1,220 1,211
787 496 9 13 144 1,322 2,790 2,762
127 142 – 35 5 18 327 327
58 51 0 4 111 54 278 277
(5) (6) (7) (8) (9) (10) (11) (12)
ThePhilippines
(US$ Million)
Indonesia Malaysia Myanmar Singapore Thailand Total ASEAN-6
Products and Inputs by Countries, 2001
135 141 1 137 118 0 547 540
0 0 – 0 13 0 14 14
0 0 – 0 2 0 4 4
3 16 0 0 19 0 39 39
0 38 47 10 80 0 181 128
0 50 2 0 4 0 56 54
– 0 – – – – 0 0
239 151 0 74 8 277 749 749
279 323 1 86 149 26 899 869
5 18 0 8 11 1 43 43
11 68 0 1 76 160 336 335
220 184 30 156 620 113 1,415 1,306
7 281 0 1 86 1 376 376
200 269 19 187 9 485 1,174 1,150
52 53 2 93 107 193 502 500
(5) (6) (7) (8) (9) (10) (11) (12)
ThePhilippines
(US$ Million)
Indonesia Malaysia Myanmar Singapore Thailand Total ASEAN-6

ASEAN Statistical Yearbook, 2005282
01 Rice, including husked and broken rice 0 4
02 Banana, fresh – –
03 Pineaplle Prod excluding fresh – –
04 Mangoes pineapple fresh, including guava, manggosteen, etc 0 –
05 Oil of Plam – 0
06 Coconut Oil – –
07 Cake of Coconuts – –
08 Soybeans 0 0
09 Sugar and honey 0 0
10 Coffee, green, husk, roasted – –
11 Shrmps, Prwn, lbster, crb, oth crustn, frsh, chld, frz 0 1
12 Tobacco – 4
13 Crude Rubber – 28
14 Fertilizers, manufactured 0 0
15 Insecticides, fungcd, herbicd, disinfectn & rodenticd 0 –
Table IX.13.ASEAN Exports of Selected Agricultural
No
Source: ASEAN Trade Statistics Database.
(1) (2) (3) (4)
CambodiaDescriptionBrunei
Darussalam
Source: ASEAN Trade Statistics Database.
01 Rice, including husked and broken rice 13 11
02 Banana, fresh 1 –
03 Pineaplle Prod excluding fresh 0 0
04 Mangoes pineapple fresh, including guava, manggosteen, etc 2 0
05 Oil of Plam 0 6
06 Coconut Oil 0 –
07 Cake of Coconuts 0 –
08 Soybeans 0 0
09 Sugar and honey 6 28
10 Coffee, green, husk, roasted 0 0
11 Shrmps, Prwn, lbster, crb, oth crustn, frsh, chld, frz 2 0
12 Tobacco 13 76
13 Crude Rubber 0 0
14 Fertilizers, manufactured 2 8
15 Insecticides, fungcd, herbicd, disinfectn & rodenticd 2 1
Table IX.14.ASEAN Imports of Selected Agricultural
No
(1) (2) (3) (4)
CambodiaDescriptionBrunei
Darussalam
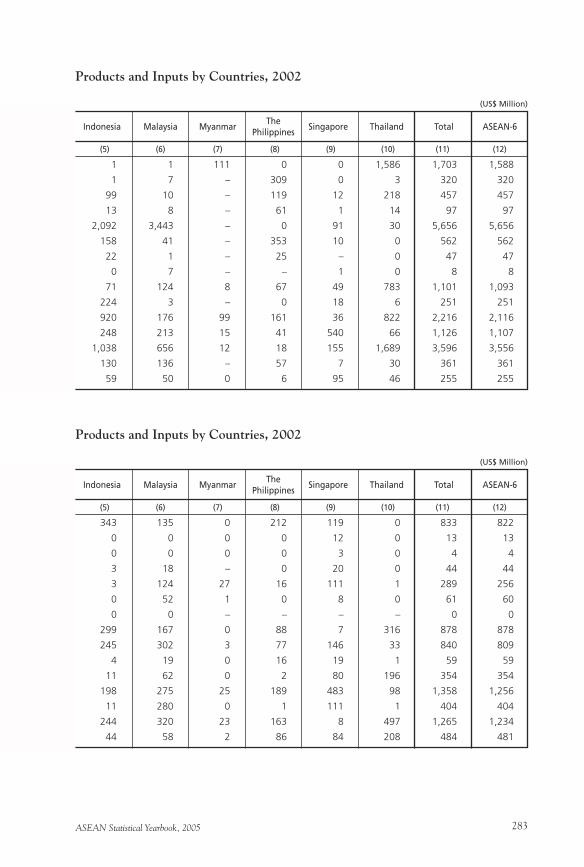
ASEAN Statistical Yearbook, 2005 283
Products and Inputs by Countries, 2002
1 1 111 0 0 1,586 1,703 1,588
1 7 – 309 0 3 320 320
99 10 – 119 12 218 457 457
13 8 – 61 1 14 97 97
2,092 3,443 – 0 91 30 5,656 5,656
158 41 – 353 10 0 562 562
22 1 – 25 – 0 47 47
0 7 – – 1 0 8 8
71 124 8 67 49 783 1,101 1,093
224 3 – 0 18 6 251 251
920 176 99 161 36 822 2,216 2,116
248 213 15 41 540 66 1,126 1,107
1,038 656 12 18 155 1,689 3,596 3,556
130 136 – 57 7 30 361 361
59 50 0 6 95 46 255 255
(5) (6) (7) (8) (9) (10) (11) (12)
ThePhilippines
(US$ Million)
Indonesia Malaysia Myanmar Singapore Thailand Total ASEAN-6
Products and Inputs by Countries, 2002
343 135 0 212 119 0 833 822
0 0 0 0 12 0 13 13
0 0 0 0 3 0 4 4
3 18 – 0 20 0 44 44
3 124 27 16 111 1 289 256
0 52 1 0 8 0 61 60
0 0 – – – – 0 0
299 167 0 88 7 316 878 878
245 302 3 77 146 33 840 809
4 19 0 16 19 1 59 59
11 62 0 2 80 196 354 354
198 275 25 189 483 98 1,358 1,256
11 280 0 1 111 1 404 404
244 320 23 163 8 497 1,265 1,234
44 58 2 86 84 208 484 481
(5) (6) (7) (8) (9) (10) (11) (12)
ThePhilippines
(US$ Million)
Indonesia Malaysia Myanmar Singapore Thailand Total ASEAN-6

ASEAN Statistical Yearbook, 2005284
01 Rice, including husked and broken rice – 1
02 Banana, fresh – –
03 Pineaplle Prod excluding fresh – –
04 Mangoes pineapple fresh, including guava, manggosteen, etc 0 –
05 Oil of Plam – 0
06 Coconut Oil – –
07 Cake of Coconuts – –
08 Soybeans – –
09 Sugar and honey 0 –
10 Coffee, green, husk, roasted – 0
11 Shrmps, Prwn, lbster, crb, oth crustn, frsh, chld, frz 1 1
12 Tobacco 0 2
13 Crude Rubber – 34
14 Fertilizers, manufactured 0 0
15 Insecticides, fungcd, herbicd, disinfectn & rodenticd 0 0
Table IX.15.ASEAN Exports of Selected Agricultural
No
Source: ASEAN Trade Statistics Database.
(1) (2) (3) (4)
CambodiaDescriptionBrunei
Darussalam
Source: ASEAN Trade Statistics Database.
01 Rice, including husked and broken rice 13 8
02 Banana, fresh 1 0
03 Pineaplle Prod excluding fresh 0 0
04 Mangoes pineapple fresh, including guava, manggosteen, etc 2 0
05 Oil of Plam 0 8
06 Coconut Oil 0 0
07 Cake of Coconuts – –
08 Soybeans 0 0
09 Sugar and honey 6 5
10 Coffee, green, husk, roasted 0 0
11 Shrmps, Prwn, lbster, crb, oth crustn, frsh, chld, frz 2 1
12 Tobacco 14 74
13 Crude Rubber 0 21
14 Fertilizers, manufactured 1 7
15 Insecticides, fungcd, herbicd, disinfectn & rodenticd 2 1
Table IX.16.ASEAN Imports of Selected Agricultural
No
(1) (2) (3) (4)
CambodiaDescriptionBrunei
Darussalam

ASEAN Statistical Yearbook, 2005 285
Products and Inputs by Countries, 2003
0 2 54 0 2 1,860 1,919 1,864
1 7 – 333 0 3 343 343
85 16 – 131 11 282 525 525
19 7 – 83 1 15 125 125
2,455 4,630 – – 126 61 7,271 7,271
154 79 – 505 9 0 747 747
22 1 – 36 – 0 59 59
0 7 – 0 1 0 8 8
70 128 2 90 48 1,047 1,385 1,383
259 2 – 0 22 4 287 287
933 213 97 144 23 914 2,326 2,228
210 227 22 59 421 74 1,014 991
1,495 943 20 33 194 2,795 5,512 5,458
183 174 – 49 5 30 441 441
49 73 0 6 122 47 298 297
(5) (6) (7) (8) (9) (10) (11) (12)
ThePhilippines
(US$ Million)
Indonesia Malaysia Myanmar Singapore Thailand Total ASEAN-6
Products and Inputs by Countries, 2003
291 120 0 153 110 2 699 691
0 0 0 – 12 0 13 13
0 0 – 0 3 0 4 4
4 18 – 0 20 0 44 44
2 148 71 16 141 5 392 313
4 57 1 0 7 0 69 68
0 0 – – – – 0 0
330 171 0 71 7 442 1,022 1,022
378 284 2 71 153 34 933 926
6 18 0 21 20 1 66 66
11 89 0 1 83 184 371 371
155 186 16 197 372 87 1,102 1,011
11 339 0 2 137 2 513 491
230 363 26 198 9 636 1,470 1,437
50 54 2 83 115 240 547 544
(5) (6) (7) (8) (9) (10) (11) (12)
ThePhilippines
(US$ Million)
Indonesia Malaysia Myanmar Singapore Thailand Total ASEAN-6

ASEAN Statistical Yearbook, 2005286
01 Rice, including husked and broken rice – 2
02 Banana, fresh – –
03 Pineaplle Prod excluding fresh – –
04 Mangoes pineapple fresh, including guava, manggosteen, etc 0 –
05 Oil of Plam 0 1
06 Coconut Oil – –
07 Cake of Coconuts – –
08 Soybeans 0 3
09 Sugar and honey 0 0
10 Coffee, green, husk, roasted 0 0
11 Shrmps, Prwn, lbster, crb, oth crustn, frsh, chld, frz 1 10
12 Tobacco 0 4
13 Crude Rubber – 36
14 Fertilizers, manufactured 0 –
15 Insecticides, fungcd, herbicd, disinfectn & rodenticd 0 0
Table IX.17.ASEAN Exports of Selected Agricultural
No
Source: ASEAN Trade Statistics Database.
(1) (2) (3) (4)
CambodiaDescriptionBrunei
Darussalam
Source: ASEAN Trade Statistics Database.
01 Rice, including husked and broken rice 19 8
02 Banana, fresh 1 –
03 Pineaplle Prod excluding fresh 0 0
04 Mangoes pineapple fresh, including guava, manggosteen, etc 2 0
05 Oil of Plam 1 7
06 Coconut Oil 0 0
07 Cake of Coconuts 0 –
08 Soybeans 0 0
09 Sugar and honey 7 7
10 Coffee, green, husk, roasted 0 0
11 Shrmps, Prwn, lbster, crb, oth crustn, frsh, chld, frz 2 9
12 Tobacco 15 82
13 Crude Rubber 0 0
14 Fertilizers, manufactured 1 8
15 Insecticides, fungcd, herbicd, disinfectn & rodenticd 2 1
Table IX.18.ASEAN Imports of Selected Agricultural
No
(1) (2) (3) (4)
CambodiaDescriptionBrunei
Darussalam
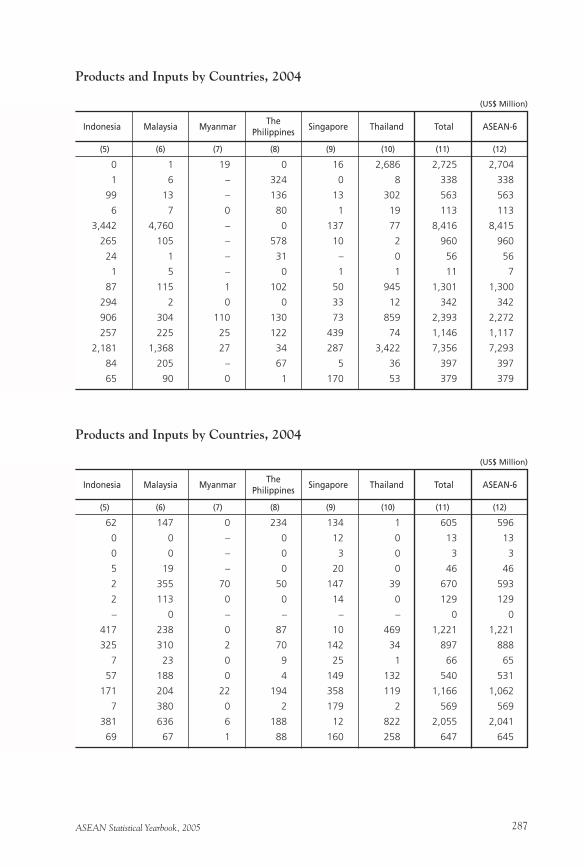
ASEAN Statistical Yearbook, 2005 287
Products and Inputs by Countries, 2004
0 1 19 0 16 2,686 2,725 2,704
1 6 – 324 0 8 338 338
99 13 – 136 13 302 563 563
6 7 0 80 1 19 113 113
3,442 4,760 – 0 137 77 8,416 8,415
265 105 – 578 10 2 960 960
24 1 – 31 – 0 56 56
1 5 – 0 1 1 11 7
87 115 1 102 50 945 1,301 1,300
294 2 0 0 33 12 342 342
906 304 110 130 73 859 2,393 2,272
257 225 25 122 439 74 1,146 1,117
2,181 1,368 27 34 287 3,422 7,356 7,293
84 205 – 67 5 36 397 397
65 90 0 1 170 53 379 379
(5) (6) (7) (8) (9) (10) (11) (12)
ThePhilippines
(US$ Million)
Indonesia Malaysia Myanmar Singapore Thailand Total ASEAN-6
Products and Inputs by Countries, 2004
62 147 0 234 134 1 605 596
0 0 – 0 12 0 13 13
0 0 – 0 3 0 3 3
5 19 – 0 20 0 46 46
2 355 70 50 147 39 670 593
2 113 0 0 14 0 129 129
– 0 – – – – 0 0
417 238 0 87 10 469 1,221 1,221
325 310 2 70 142 34 897 888
7 23 0 9 25 1 66 65
57 188 0 4 149 132 540 531
171 204 22 194 358 119 1,166 1,062
7 380 0 2 179 2 569 569
381 636 6 188 12 822 2,055 2,041
69 67 1 88 160 258 647 645
(5) (6) (7) (8) (9) (10) (11) (12)
ThePhilippines
(US$ Million)
Indonesia Malaysia Myanmar Singapore Thailand Total ASEAN-6
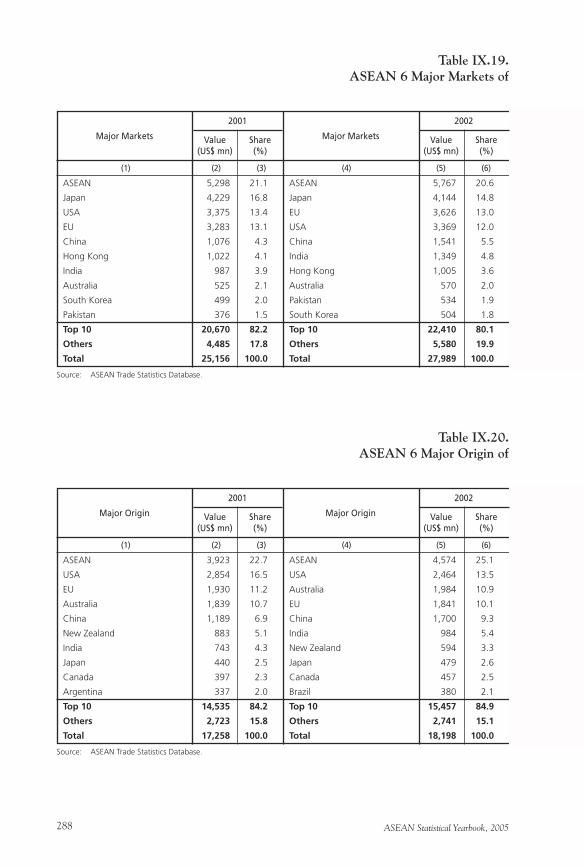
ASEAN Statistical Yearbook, 2005288
ASEAN 5,298 21.1 ASEAN 5,767 20.6
Japan 4,229 16.8 Japan 4,144 14.8
USA 3,375 13.4 EU 3,626 13.0
EU 3,283 13.1 USA 3,369 12.0
China 1,076 4.3 China 1,541 5.5
Hong Kong 1,022 4.1 India 1,349 4.8
India 987 3.9 Hong Kong 1,005 3.6
Australia 525 2.1 Australia 570 2.0
South Korea 499 2.0 Pakistan 534 1.9
Pakistan 376 1.5 South Korea 504 1.8
Top 10 20,670 82.2 Top 10 22,410 80.1
Others 4,485 17.8 Others 5,580 19.9
Total 25,156 100.0 Total 27,989 100.0
Table IX.19.ASEAN 6 Major Markets of
(1) (2) (3) (4) (5) (6)
Source: ASEAN Trade Statistics Database.
Major Markets
2001
Value Share (US$ mn) (%)
Major Markets
2002
Value Share (US$ mn) (%)
ASEAN 3,923 22.7 ASEAN 4,574 25.1
USA 2,854 16.5 USA 2,464 13.5
EU 1,930 11.2 Australia 1,984 10.9
Australia 1,839 10.7 EU 1,841 10.1
China 1,189 6.9 China 1,700 9.3
New Zealand 883 5.1 India 984 5.4
India 743 4.3 New Zealand 594 3.3
Japan 440 2.5 Japan 479 2.6
Canada 397 2.3 Canada 457 2.5
Argentina 337 2.0 Brazil 380 2.1
Top 10 14,535 84.2 Top 10 15,457 84.9
Others 2,723 15.8 Others 2,741 15.1
Total 17,258 100.0 Total 18,198 100.0
Table IX.20.ASEAN 6 Major Origin of
(1) (2) (3) (4) (5) (6)
Source: ASEAN Trade Statistics Database.
Major Origin
2001
Value Share (US$ mn) (%)
Major Origin
2002
Value Share (US$ mn) (%)
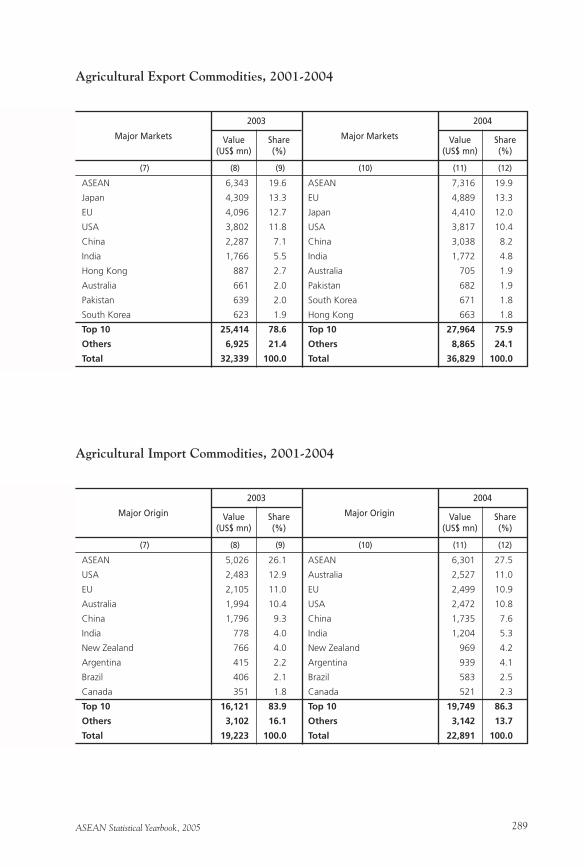
ASEAN Statistical Yearbook, 2005 289
Agricultural Export Commodities, 2001-2004
ASEAN 6,343 19.6 ASEAN 7,316 19.9
Japan 4,309 13.3 EU 4,889 13.3
EU 4,096 12.7 Japan 4,410 12.0
USA 3,802 11.8 USA 3,817 10.4
China 2,287 7.1 China 3,038 8.2
India 1,766 5.5 India 1,772 4.8
Hong Kong 887 2.7 Australia 705 1.9
Australia 661 2.0 Pakistan 682 1.9
Pakistan 639 2.0 South Korea 671 1.8
South Korea 623 1.9 Hong Kong 663 1.8
Top 10 25,414 78.6 Top 10 27,964 75.9
Others 6,925 21.4 Others 8,865 24.1
Total 32,339 100.0 Total 36,829 100.0
(7) (8) (9) (10) (11) (12)
Major Markets
2003
Value Share (US$ mn) (%)
Major Markets
2004
Value Share (US$ mn) (%)
Agricultural Import Commodities, 2001-2004
ASEAN 5,026 26.1 ASEAN 6,301 27.5
USA 2,483 12.9 Australia 2,527 11.0
EU 2,105 11.0 EU 2,499 10.9
Australia 1,994 10.4 USA 2,472 10.8
China 1,796 9.3 China 1,735 7.6
India 778 4.0 India 1,204 5.3
New Zealand 766 4.0 New Zealand 969 4.2
Argentina 415 2.2 Argentina 939 4.1
Brazil 406 2.1 Brazil 583 2.5
Canada 351 1.8 Canada 521 2.3
Top 10 16,121 83.9 Top 10 19,749 86.3
Others 3,102 16.1 Others 3,142 13.7
Total 19,223 100.0 Total 22,891 100.0
(7) (8) (9) (10) (11) (12)
Major Origin
2003
Value Share (US$ mn) (%)
Major Origin
2004
Value Share (US$ mn) (%)
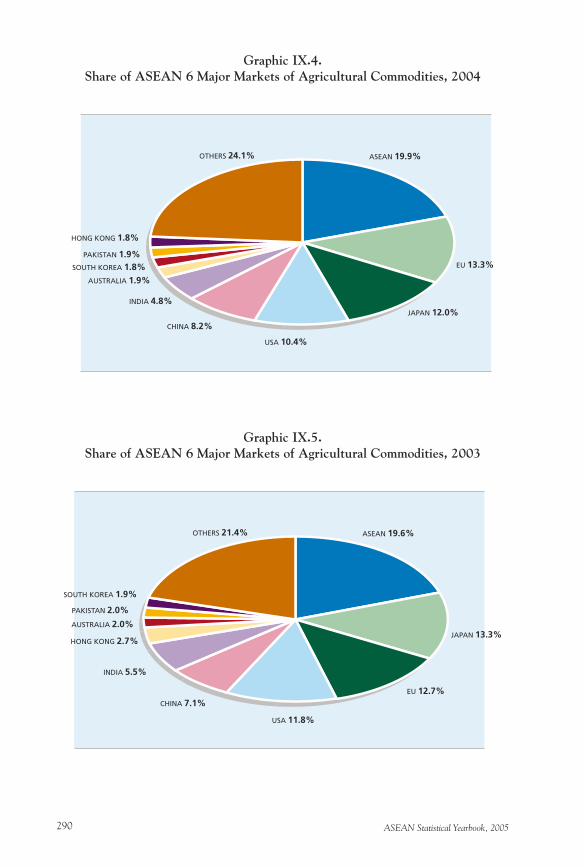
ASEAN Statistical Yearbook, 2005290
Graphic IX.4.Share of ASEAN 6 Major Markets of Agricultural Commodities, 2004
Graphic IX.5.Share of ASEAN 6 Major Markets of Agricultural Commodities, 2003
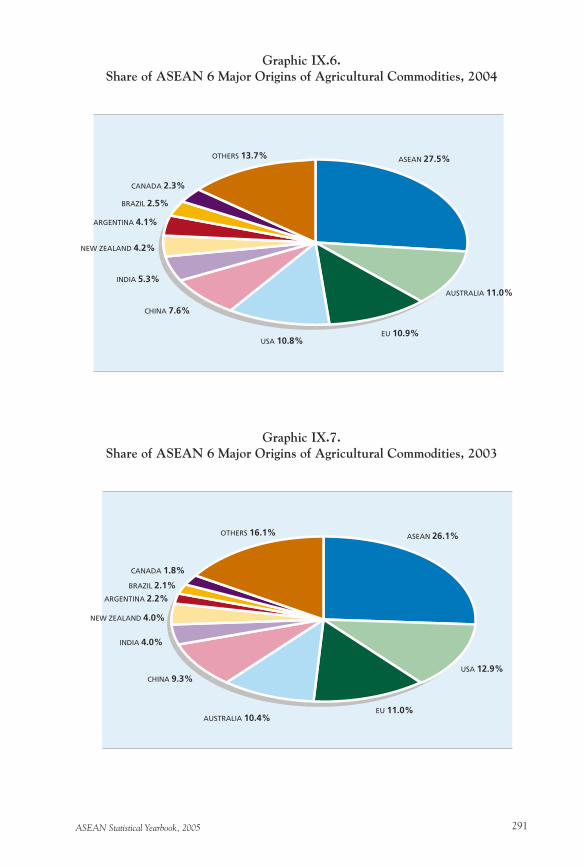
ASEAN Statistical Yearbook, 2005 291
Graphic IX.6.Share of ASEAN 6 Major Origins of Agricultural Commodities, 2004
Graphic IX.7.Share of ASEAN 6 Major Origins of Agricultural Commodities, 2003
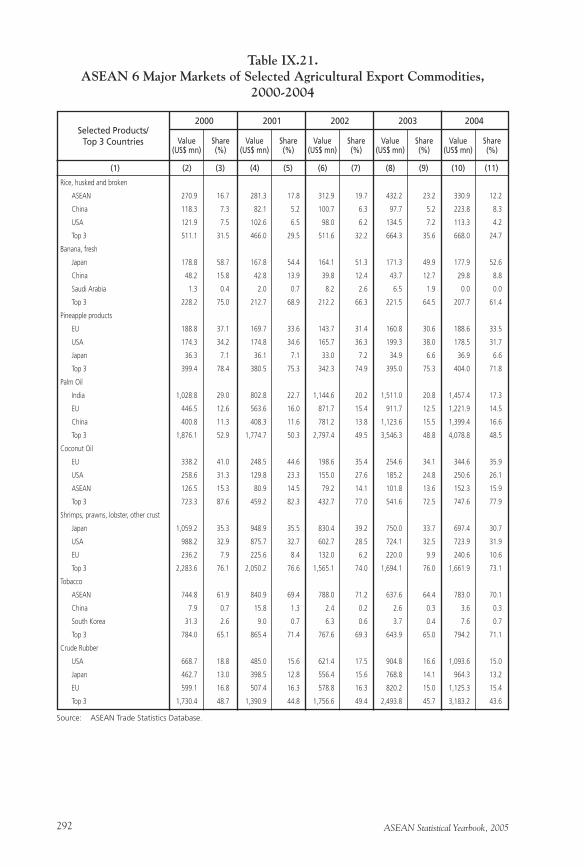
ASEAN Statistical Yearbook, 2005292
Rice, husked and broken
ASEAN 270.9 16.7 281.3 17.8 312.9 19.7 432.2 23.2 330.9 12.2
China 118.3 7.3 82.1 5.2 100.7 6.3 97.7 5.2 223.8 8.3
USA 121.9 7.5 102.6 6.5 98.0 6.2 134.5 7.2 113.3 4.2
Top 3 511.1 31.5 466.0 29.5 511.6 32.2 664.3 35.6 668.0 24.7
Banana, fresh
Japan 178.8 58.7 167.8 54.4 164.1 51.3 171.3 49.9 177.9 52.6
China 48.2 15.8 42.8 13.9 39.8 12.4 43.7 12.7 29.8 8.8
Saudi Arabia 1.3 0.4 2.0 0.7 8.2 2.6 6.5 1.9 0.0 0.0
Top 3 228.2 75.0 212.7 68.9 212.2 66.3 221.5 64.5 207.7 61.4
Pineapple products
EU 188.8 37.1 169.7 33.6 143.7 31.4 160.8 30.6 188.6 33.5
USA 174.3 34.2 174.8 34.6 165.7 36.3 199.3 38.0 178.5 31.7
Japan 36.3 7.1 36.1 7.1 33.0 7.2 34.9 6.6 36.9 6.6
Top 3 399.4 78.4 380.5 75.3 342.3 74.9 395.0 75.3 404.0 71.8
Palm Oil
India 1,028.8 29.0 802.8 22.7 1,144.6 20.2 1,511.0 20.8 1,457.4 17.3
EU 446.5 12.6 563.6 16.0 871.7 15.4 911.7 12.5 1,221.9 14.5
China 400.8 11.3 408.3 11.6 781.2 13.8 1,123.6 15.5 1,399.4 16.6
Top 3 1,876.1 52.9 1,774.7 50.3 2,797.4 49.5 3,546.3 48.8 4,078.8 48.5
Coconut Oil
EU 338.2 41.0 248.5 44.6 198.6 35.4 254.6 34.1 344.6 35.9
USA 258.6 31.3 129.8 23.3 155.0 27.6 185.2 24.8 250.6 26.1
ASEAN 126.5 15.3 80.9 14.5 79.2 14.1 101.8 13.6 152.3 15.9
Top 3 723.3 87.6 459.2 82.3 432.7 77.0 541.6 72.5 747.6 77.9
Shrimps, prawns, lobster, other crust
Japan 1,059.2 35.3 948.9 35.5 830.4 39.2 750.0 33.7 697.4 30.7
USA 988.2 32.9 875.7 32.7 602.7 28.5 724.1 32.5 723.9 31.9
EU 236.2 7.9 225.6 8.4 132.0 6.2 220.0 9.9 240.6 10.6
Top 3 2,283.6 76.1 2,050.2 76.6 1,565.1 74.0 1,694.1 76.0 1,661.9 73.1
Tobacco
ASEAN 744.8 61.9 840.9 69.4 788.0 71.2 637.6 64.4 783.0 70.1
China 7.9 0.7 15.8 1.3 2.4 0.2 2.6 0.3 3.6 0.3
South Korea 31.3 2.6 9.0 0.7 6.3 0.6 3.7 0.4 7.6 0.7
Top 3 784.0 65.1 865.4 71.4 767.6 69.3 643.9 65.0 794.2 71.1
Crude Rubber
USA 668.7 18.8 485.0 15.6 621.4 17.5 904.8 16.6 1,093.6 15.0
Japan 462.7 13.0 398.5 12.8 556.4 15.6 768.8 14.1 964.3 13.2
EU 599.1 16.8 507.4 16.3 578.8 16.3 820.2 15.0 1,125.3 15.4
Top 3 1,730.4 48.7 1,390.9 44.8 1,756.6 49.4 2,493.8 45.7 3,183.2 43.6
Table IX.21.ASEAN 6 Major Markets of Selected Agricultural Export Commodities,
2000-2004
Selected Products/Top 3 Countries
(1) (2) (3) (4) (5) (6) (7) (8) (9) (10) (11)
Source: ASEAN Trade Statistics Database.
2000 2001 2002 2003 2004
Value(US$ mn)
Share(%)
Value(US$ mn)
Share(%)
Value(US$ mn)
Share(%)
Value(US$ mn)
Share(%)
Value(US$ mn)
Share(%)
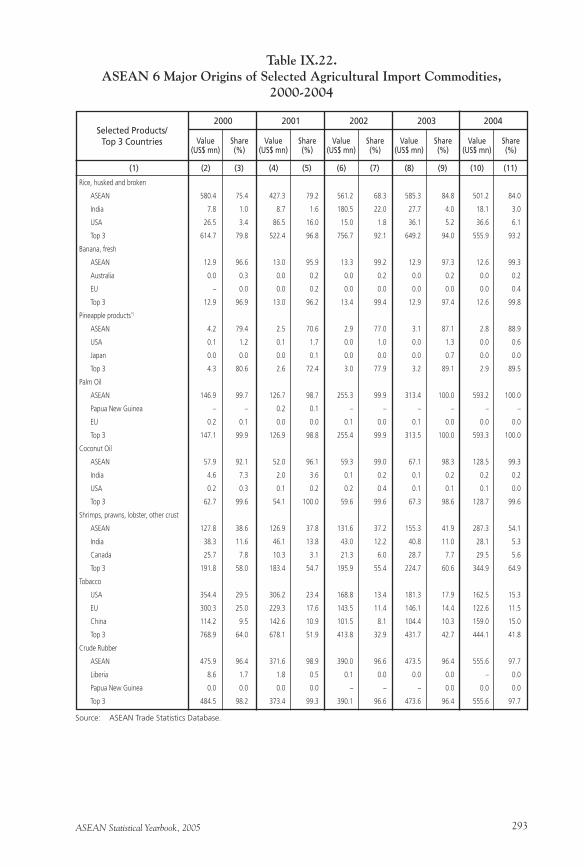
ASEAN Statistical Yearbook, 2005 293
Table IX.22.ASEAN 6 Major Origins of Selected Agricultural Import Commodities,
2000-2004
Rice, husked and broken
ASEAN 580.4 75.4 427.3 79.2 561.2 68.3 585.3 84.8 501.2 84.0
India 7.8 1.0 8.7 1.6 180.5 22.0 27.7 4.0 18.1 3.0
USA 26.5 3.4 86.5 16.0 15.0 1.8 36.1 5.2 36.6 6.1
Top 3 614.7 79.8 522.4 96.8 756.7 92.1 649.2 94.0 555.9 93.2
Banana, fresh
ASEAN 12.9 96.6 13.0 95.9 13.3 99.2 12.9 97.3 12.6 99.3
Australia 0.0 0.3 0.0 0.2 0.0 0.2 0.0 0.2 0.0 0.2
EU – 0.0 0.0 0.2 0.0 0.0 0.0 0.0 0.0 0.4
Top 3 12.9 96.9 13.0 96.2 13.4 99.4 12.9 97.4 12.6 99.8
Pineapple products*)
ASEAN 4.2 79.4 2.5 70.6 2.9 77.0 3.1 87.1 2.8 88.9
USA 0.1 1.2 0.1 1.7 0.0 1.0 0.0 1.3 0.0 0.6
Japan 0.0 0.0 0.0 0.1 0.0 0.0 0.0 0.7 0.0 0.0
Top 3 4.3 80.6 2.6 72.4 3.0 77.9 3.2 89.1 2.9 89.5
Palm Oil
ASEAN 146.9 99.7 126.7 98.7 255.3 99.9 313.4 100.0 593.2 100.0
Papua New Guinea – – 0.2 0.1 – – – – – –
EU 0.2 0.1 0.0 0.0 0.1 0.0 0.1 0.0 0.0 0.0
Top 3 147.1 99.9 126.9 98.8 255.4 99.9 313.5 100.0 593.3 100.0
Coconut Oil
ASEAN 57.9 92.1 52.0 96.1 59.3 99.0 67.1 98.3 128.5 99.3
India 4.6 7.3 2.0 3.6 0.1 0.2 0.1 0.2 0.2 0.2
USA 0.2 0.3 0.1 0.2 0.2 0.4 0.1 0.1 0.1 0.0
Top 3 62.7 99.6 54.1 100.0 59.6 99.6 67.3 98.6 128.7 99.6
Shrimps, prawns, lobster, other crust
ASEAN 127.8 38.6 126.9 37.8 131.6 37.2 155.3 41.9 287.3 54.1
India 38.3 11.6 46.1 13.8 43.0 12.2 40.8 11.0 28.1 5.3
Canada 25.7 7.8 10.3 3.1 21.3 6.0 28.7 7.7 29.5 5.6
Top 3 191.8 58.0 183.4 54.7 195.9 55.4 224.7 60.6 344.9 64.9
Tobacco
USA 354.4 29.5 306.2 23.4 168.8 13.4 181.3 17.9 162.5 15.3
EU 300.3 25.0 229.3 17.6 143.5 11.4 146.1 14.4 122.6 11.5
China 114.2 9.5 142.6 10.9 101.5 8.1 104.4 10.3 159.0 15.0
Top 3 768.9 64.0 678.1 51.9 413.8 32.9 431.7 42.7 444.1 41.8
Crude Rubber
ASEAN 475.9 96.4 371.6 98.9 390.0 96.6 473.5 96.4 555.6 97.7
Liberia 8.6 1.7 1.8 0.5 0.1 0.0 0.0 0.0 – 0.0
Papua New Guinea 0.0 0.0 0.0 0.0 – – – 0.0 0.0 0.0
Top 3 484.5 98.2 373.4 99.3 390.1 96.6 473.6 96.4 555.6 97.7
Selected Products/Top 3 Countries
(1) (2) (3) (4) (5) (6) (7) (8) (9) (10) (11)
Source: ASEAN Trade Statistics Database.
2000 2001 2002 2003 2004
Value(US$ mn)
Share(%)
Value(US$ mn)
Share(%)
Value(US$ mn)
Share(%)
Value(US$ mn)
Share(%)
Value(US$ mn)
Share(%)
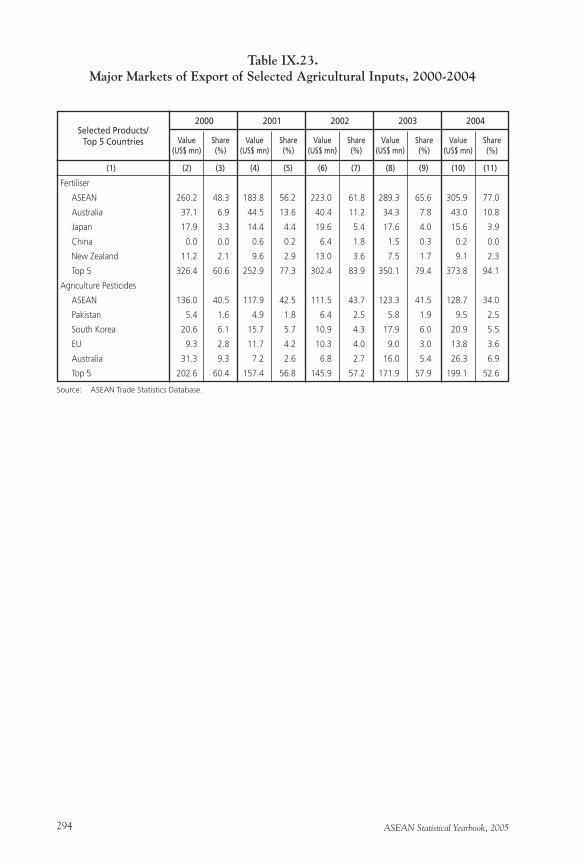
ASEAN Statistical Yearbook, 2005294
Fertiliser
ASEAN 260.2 48.3 183.8 56.2 223.0 61.8 289.3 65.6 305.9 77.0
Australia 37.1 6.9 44.5 13.6 40.4 11.2 34.3 7.8 43.0 10.8
Japan 17.9 3.3 14.4 4.4 19.6 5.4 17.6 4.0 15.6 3.9
China 0.0 0.0 0.6 0.2 6.4 1.8 1.5 0.3 0.2 0.0
New Zealand 11.2 2.1 9.6 2.9 13.0 3.6 7.5 1.7 9.1 2.3
Top 5 326.4 60.6 252.9 77.3 302.4 83.9 350.1 79.4 373.8 94.1
Agriculture Pesticides
ASEAN 136.0 40.5 117.9 42.5 111.5 43.7 123.3 41.5 128.7 34.0
Pakistan 5.4 1.6 4.9 1.8 6.4 2.5 5.8 1.9 9.5 2.5
South Korea 20.6 6.1 15.7 5.7 10.9 4.3 17.9 6.0 20.9 5.5
EU 9.3 2.8 11.7 4.2 10.3 4.0 9.0 3.0 13.8 3.6
Australia 31.3 9.3 7.2 2.6 6.8 2.7 16.0 5.4 26.3 6.9
Top 5 202.6 60.4 157.4 56.8 145.9 57.2 171.9 57.9 199.1 52.6
Table IX.23.Major Markets of Export of Selected Agricultural Inputs, 2000-2004
Selected Products/Top 5 Countries
(1) (2) (3) (4) (5) (6) (7) (8) (9) (10) (11)
Value(US$ mn)
Source: ASEAN Trade Statistics Database.
2000 2001 2002 2003 2004
Share(%)
Value(US$ mn)
Share(%)
Value(US$ mn)
Share(%)
Value(US$ mn)
Share(%)
Value(US$ mn)
Share(%)
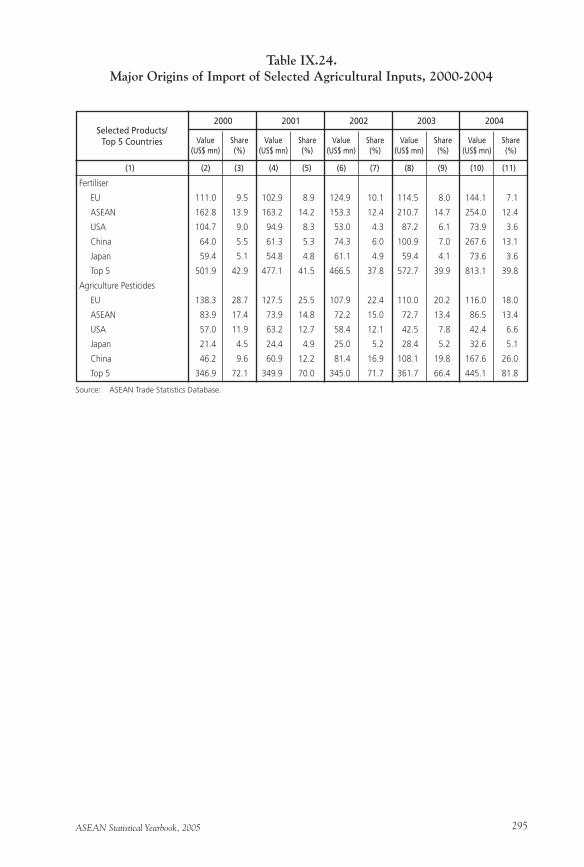
ASEAN Statistical Yearbook, 2005 295
Fertiliser
EU 111.0 9.5 102.9 8.9 124.9 10.1 114.5 8.0 144.1 7.1
ASEAN 162.8 13.9 163.2 14.2 153.3 12.4 210.7 14.7 254.0 12.4
USA 104.7 9.0 94.9 8.3 53.0 4.3 87.2 6.1 73.9 3.6
China 64.0 5.5 61.3 5.3 74.3 6.0 100.9 7.0 267.6 13.1
Japan 59.4 5.1 54.8 4.8 61.1 4.9 59.4 4.1 73.6 3.6
Top 5 501.9 42.9 477.1 41.5 466.5 37.8 572.7 39.9 813.1 39.8
Agriculture Pesticides
EU 138.3 28.7 127.5 25.5 107.9 22.4 110.0 20.2 116.0 18.0
ASEAN 83.9 17.4 73.9 14.8 72.2 15.0 72.7 13.4 86.5 13.4
USA 57.0 11.9 63.2 12.7 58.4 12.1 42.5 7.8 42.4 6.6
Japan 21.4 4.5 24.4 4.9 25.0 5.2 28.4 5.2 32.6 5.1
China 46.2 9.6 60.9 12.2 81.4 16.9 108.1 19.8 167.6 26.0
Top 5 346.9 72.1 349.9 70.0 345.0 71.7 361.7 66.4 445.1 81.8
Table IX.24.Major Origins of Import of Selected Agricultural Inputs, 2000-2004
Selected Products/Top 5 Countries
(1) (2) (3) (4) (5) (6) (7) (8) (9) (10) (11)
Value(US$ mn)
Source: ASEAN Trade Statistics Database.
2000 2001 2002 2003 2004
Share(%)
Value(US$ mn)
Share(%)
Value(US$ mn)
Share(%)
Value(US$ mn)
Share(%)
Value(US$ mn)
Share(%)
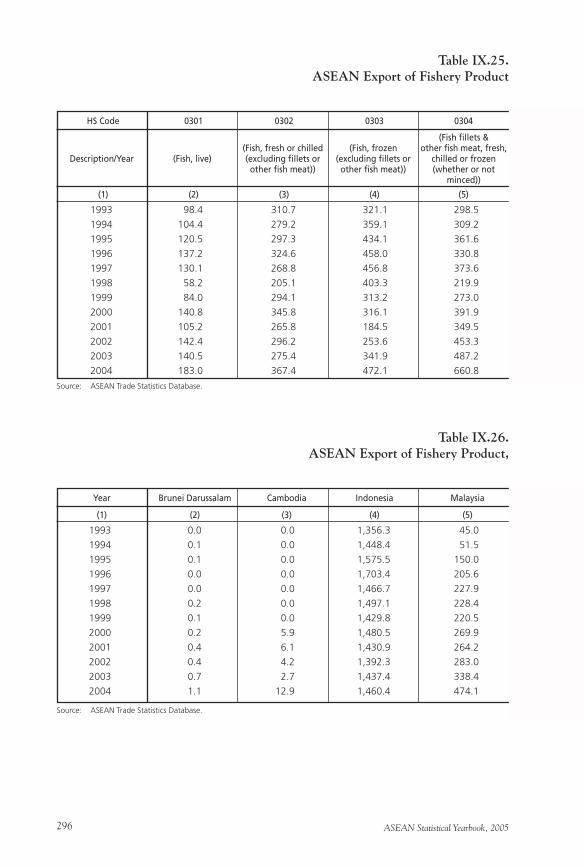
ASEAN Statistical Yearbook, 2005296
1993 98.4 310.7 321.1 298.5
1994 104.4 279.2 359.1 309.2
1995 120.5 297.3 434.1 361.6
1996 137.2 324.6 458.0 330.8
1997 130.1 268.8 456.8 373.6
1998 58.2 205.1 403.3 219.9
1999 84.0 294.1 313.2 273.0
2000 140.8 345.8 316.1 391.9
2001 105.2 265.8 184.5 349.5
2002 142.4 296.2 253.6 453.3
2003 140.5 275.4 341.9 487.2
2004 183.0 367.4 472.1 660.8
Table IX.25.ASEAN Export of Fishery Product
HS Code 0301 0302 0303 0304
(1) (2) (3) (4) (5)
Source: ASEAN Trade Statistics Database.
Description/Year (Fish, live)(Fish, fresh or chilled (excluding fillets or other fish meat))
(Fish, frozen (excluding fillets or other fish meat))
(Fish fillets & other fish meat, fresh,
chilled or frozen (whether or not
minced))
1993 0.0 0.0 1,356.3 45.0
1994 0.1 0.0 1,448.4 51.5
1995 0.1 0.0 1,575.5 150.0
1996 0.0 0.0 1,703.4 205.6
1997 0.0 0.0 1,466.7 227.9
1998 0.2 0.0 1,497.1 228.4
1999 0.1 0.0 1,429.8 220.5
2000 0.2 5.9 1,480.5 269.9
2001 0.4 6.1 1,430.9 264.2
2002 0.4 4.2 1,392.3 283.0
2003 0.7 2.7 1,437.4 338.4
2004 1.1 12.9 1,460.4 474.1
Table IX.26.ASEAN Export of Fishery Product,
Year Brunei Darussalam Cambodia Indonesia Malaysia
(1) (2) (3) (4) (5)
Source: ASEAN Trade Statistics Database.
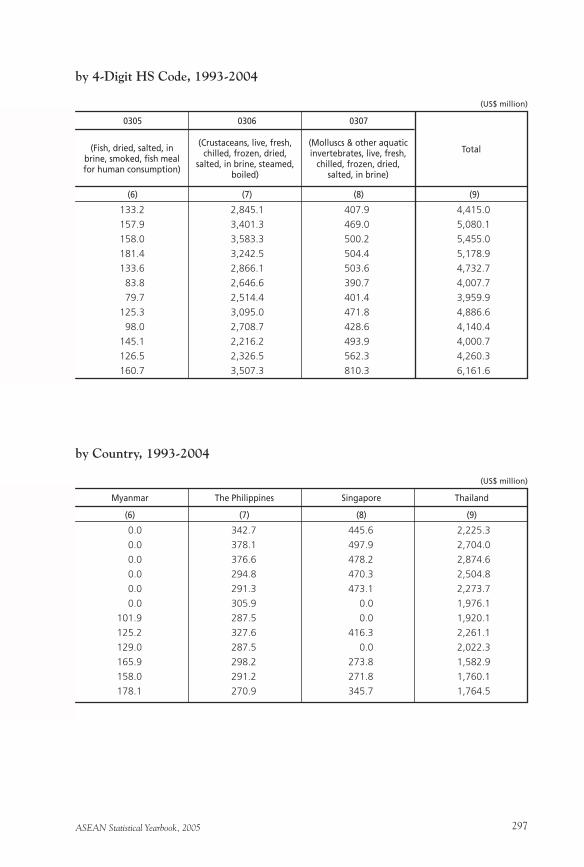
ASEAN Statistical Yearbook, 2005 297
by 4-Digit HS Code, 1993-2004
133.2 2,845.1 407.9 4,415.0
157.9 3,401.3 469.0 5,080.1
158.0 3,583.3 500.2 5,455.0
181.4 3,242.5 504.4 5,178.9
133.6 2,866.1 503.6 4,732.7
83.8 2,646.6 390.7 4,007.7
79.7 2,514.4 401.4 3,959.9
125.3 3,095.0 471.8 4,886.6
98.0 2,708.7 428.6 4,140.4
145.1 2,216.2 493.9 4,000.7
126.5 2,326.5 562.3 4,260.3
160.7 3,507.3 810.3 6,161.6
0305 0306 0307
(6) (7) (8) (9)
(US$ million)
Total(Fish, dried, salted, in brine, smoked, fish meal for human consumption)
(Crustaceans, live, fresh, chilled, frozen, dried,
salted, in brine, steamed, boiled)
(Molluscs & other aquatic invertebrates, live, fresh,
chilled, frozen, dried, salted, in brine)
by Country, 1993-2004
0.0 342.7 445.6 2,225.3
0.0 378.1 497.9 2,704.0
0.0 376.6 478.2 2,874.6
0.0 294.8 470.3 2,504.8
0.0 291.3 473.1 2,273.7
0.0 305.9 0.0 1,976.1
101.9 287.5 0.0 1,920.1
125.2 327.6 416.3 2,261.1
129.0 287.5 0.0 2,022.3
165.9 298.2 273.8 1,582.9
158.0 291.2 271.8 1,760.1
178.1 270.9 345.7 1,764.5
Myanmar The Philippines Singapore Thailand
(6) (7) (8) (9)
(US$ million)
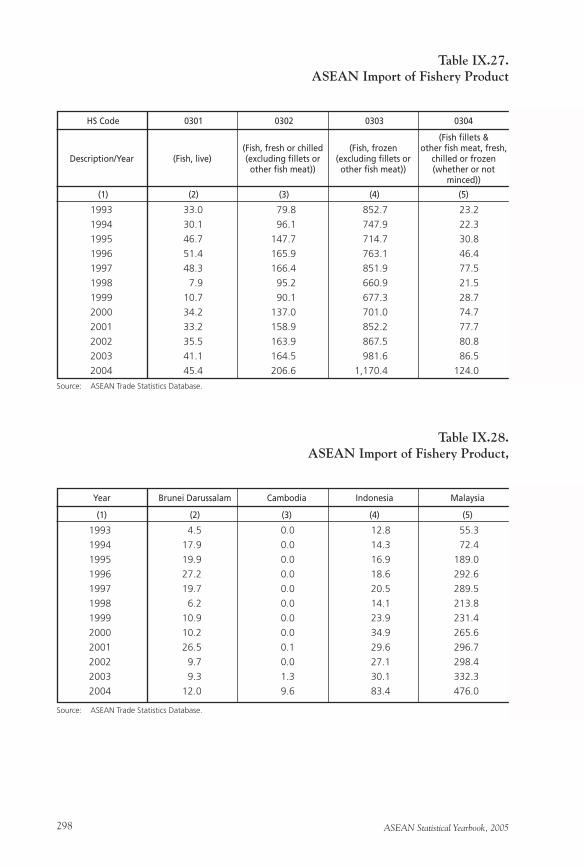
ASEAN Statistical Yearbook, 2005298
1993 33.0 79.8 852.7 23.2
1994 30.1 96.1 747.9 22.3
1995 46.7 147.7 714.7 30.8
1996 51.4 165.9 763.1 46.4
1997 48.3 166.4 851.9 77.5
1998 7.9 95.2 660.9 21.5
1999 10.7 90.1 677.3 28.7
2000 34.2 137.0 701.0 74.7
2001 33.2 158.9 852.2 77.7
2002 35.5 163.9 867.5 80.8
2003 41.1 164.5 981.6 86.5
2004 45.4 206.6 1,170.4 124.0
Table IX.27.ASEAN Import of Fishery Product
HS Code 0301 0302 0303 0304
(1) (2) (3) (4) (5)
Source: ASEAN Trade Statistics Database.
Description/Year (Fish, live)(Fish, fresh or chilled (excluding fillets or other fish meat))
(Fish, frozen (excluding fillets or other fish meat))
(Fish fillets & other fish meat, fresh,
chilled or frozen (whether or not
minced))
1993 4.5 0.0 12.8 55.3
1994 17.9 0.0 14.3 72.4
1995 19.9 0.0 16.9 189.0
1996 27.2 0.0 18.6 292.6
1997 19.7 0.0 20.5 289.5
1998 6.2 0.0 14.1 213.8
1999 10.9 0.0 23.9 231.4
2000 10.2 0.0 34.9 265.6
2001 26.5 0.1 29.6 296.7
2002 9.7 0.0 27.1 298.4
2003 9.3 1.3 30.1 332.3
2004 12.0 9.6 83.4 476.0
Table IX.28.ASEAN Import of Fishery Product,
Year Brunei Darussalam Cambodia Indonesia Malaysia
(1) (2) (3) (4) (5)
Source: ASEAN Trade Statistics Database.
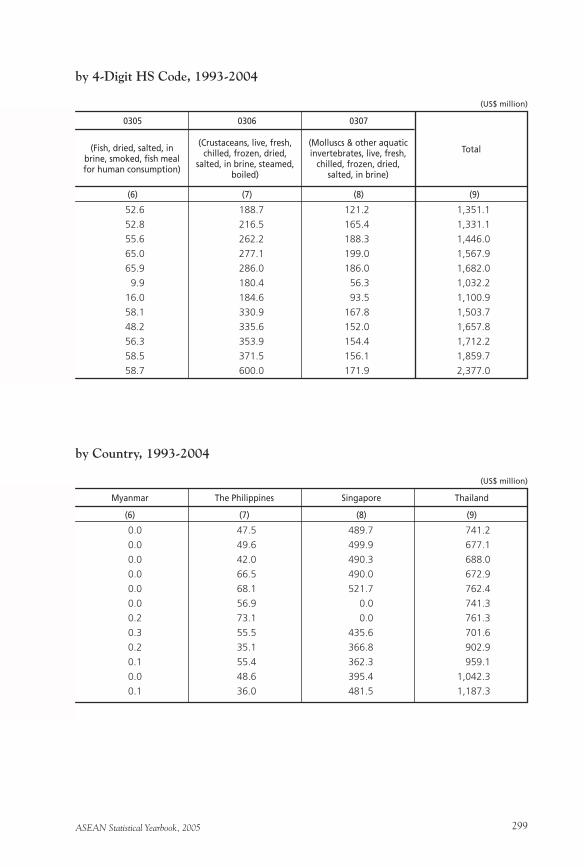
ASEAN Statistical Yearbook, 2005 299
by 4-Digit HS Code, 1993-2004
52.6 188.7 121.2 1,351.1
52.8 216.5 165.4 1,331.1
55.6 262.2 188.3 1,446.0
65.0 277.1 199.0 1,567.9
65.9 286.0 186.0 1,682.0
9.9 180.4 56.3 1,032.2
16.0 184.6 93.5 1,100.9
58.1 330.9 167.8 1,503.7
48.2 335.6 152.0 1,657.8
56.3 353.9 154.4 1,712.2
58.5 371.5 156.1 1,859.7
58.7 600.0 171.9 2,377.0
0305 0306 0307
(6) (7) (8) (9)
(US$ million)
Total(Fish, dried, salted, in brine, smoked, fish meal for human consumption)
(Crustaceans, live, fresh, chilled, frozen, dried,
salted, in brine, steamed, boiled)
(Molluscs & other aquatic invertebrates, live, fresh,
chilled, frozen, dried, salted, in brine)
by Country, 1993-2004
0.0 47.5 489.7 741.2
0.0 49.6 499.9 677.1
0.0 42.0 490.3 688.0
0.0 66.5 490.0 672.9
0.0 68.1 521.7 762.4
0.0 56.9 0.0 741.3
0.2 73.1 0.0 761.3
0.3 55.5 435.6 701.6
0.2 35.1 366.8 902.9
0.1 55.4 362.3 959.1
0.0 48.6 395.4 1,042.3
0.1 36.0 481.5 1,187.3
Myanmar The Philippines Singapore Thailand
(6) (7) (8) (9)
(US$ million)
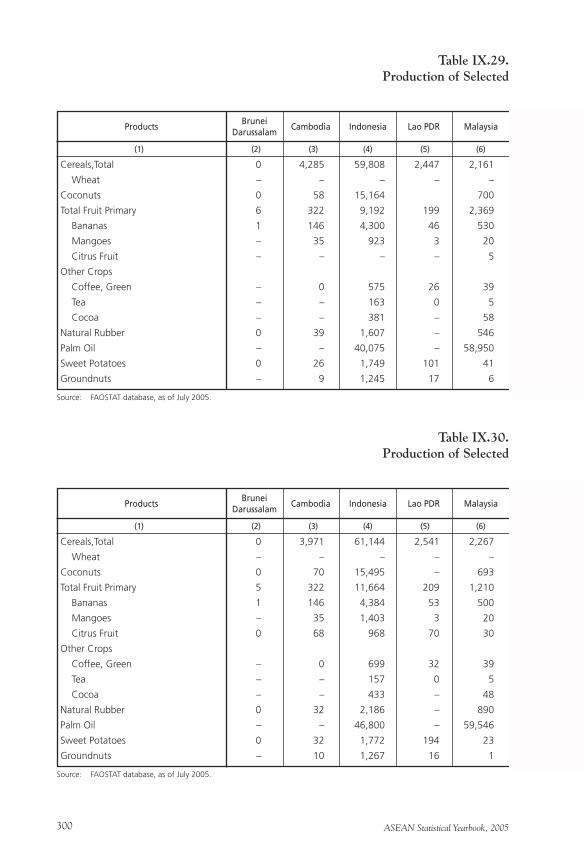
ASEAN Statistical Yearbook, 2005300
Cereals,Total 0 4,285 59,808 2,447 2,161
Wheat – – – – –
Coconuts 0 58 15,164 700
Total Fruit Primary 6 322 9,192 199 2,369
Bananas 1 146 4,300 46 530
Mangoes – 35 923 3 20
Citrus Fruit – – – – 5
Other Crops
Coffee, Green – 0 575 26 39
Tea – – 163 0 5
Cocoa – – 381 – 58
Natural Rubber 0 39 1,607 – 546
Palm Oil – – 40,075 – 58,950
Sweet Potatoes 0 26 1,749 101 41
Groundnuts – 9 1,245 17 6
Table IX.29.Production of Selected
(1) (2) (3) (4) (5) (6)
Source: FAOSTAT database, as of July 2005.
Products Cambodia Indonesia Lao PDR MalaysiaBrunei
Darussalam
Cereals,Total 0 3,971 61,144 2,541 2,267
Wheat – – – – –
Coconuts 0 70 15,495 – 693
Total Fruit Primary 5 322 11,664 209 1,210
Bananas 1 146 4,384 53 500
Mangoes – 35 1,403 3 20
Citrus Fruit 0 68 968 70 30
Other Crops
Coffee, Green – 0 699 32 39
Tea – – 157 0 5
Cocoa – – 433 – 48
Natural Rubber 0 32 2,186 – 890
Palm Oil – – 46,800 – 59,546
Sweet Potatoes 0 32 1,772 194 23
Groundnuts – 10 1,267 16 1
Table IX.30.Production of Selected
(1) (2) (3) (4) (5) (6)
Source: FAOSTAT database, as of July 2005.
Products Cambodia Indonesia Lao PDR MalaysiaBrunei
Darussalam
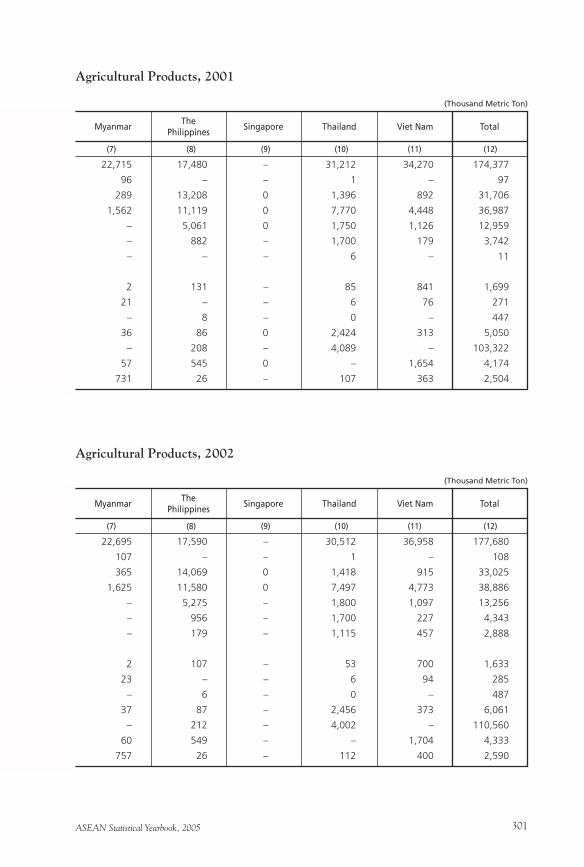
ASEAN Statistical Yearbook, 2005 301
Agricultural Products, 2001
22,715 17,480 – 31,212 34,270 174,377
96 – – 1 – 97
289 13,208 0 1,396 892 31,706
1,562 11,119 0 7,770 4,448 36,987
– 5,061 0 1,750 1,126 12,959
– 882 – 1,700 179 3,742
– – – 6 – 11
2 131 – 85 841 1,699
21 – – 6 76 271
– 8 – 0 – 447
36 86 0 2,424 313 5,050
– 208 – 4,089 – 103,322
57 545 0 – 1,654 4,174
731 26 – 107 363 2,504
(7) (8) (9) (10) (11) (12)
ThePhilippines
Singapore Thailand Viet Nam TotalMyanmar
(Thousand Metric Ton)
Agricultural Products, 2002
22,695 17,590 – 30,512 36,958 177,680
107 – – 1 – 108
365 14,069 0 1,418 915 33,025
1,625 11,580 0 7,497 4,773 38,886
– 5,275 – 1,800 1,097 13,256
– 956 – 1,700 227 4,343
– 179 – 1,115 457 2,888
2 107 – 53 700 1,633
23 – – 6 94 285
– 6 – 0 – 487
37 87 – 2,456 373 6,061
– 212 – 4,002 – 110,560
60 549 – – 1,704 4,333
757 26 – 112 400 2,590
(7) (8) (9) (10) (11) (12)
ThePhilippines
Singapore Thailand Viet Nam TotalMyanmar
(Thousand Metric Ton)
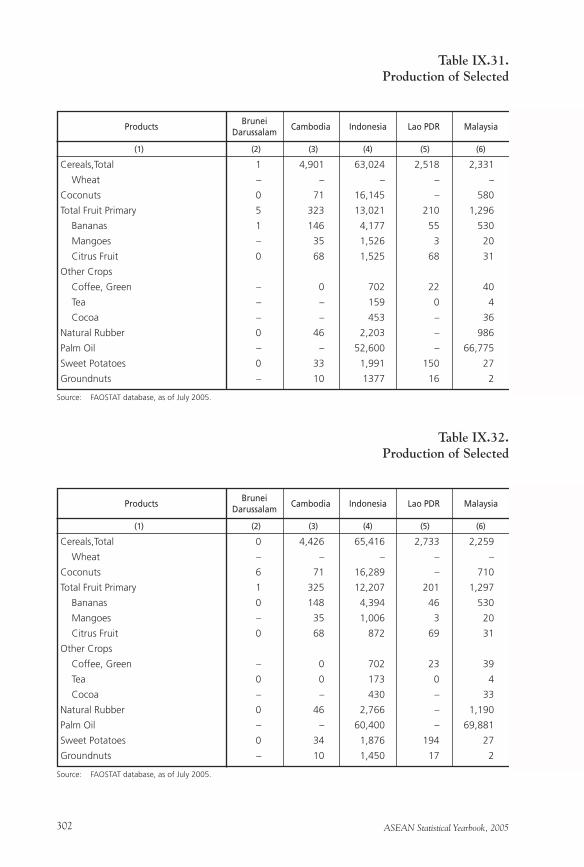
ASEAN Statistical Yearbook, 2005302
Cereals,Total 1 4,901 63,024 2,518 2,331
Wheat – – – – –
Coconuts 0 71 16,145 – 580
Total Fruit Primary 5 323 13,021 210 1,296
Bananas 1 146 4,177 55 530
Mangoes – 35 1,526 3 20
Citrus Fruit 0 68 1,525 68 31
Other Crops
Coffee, Green – 0 702 22 40
Tea – – 159 0 4
Cocoa – – 453 – 36
Natural Rubber 0 46 2,203 – 986
Palm Oil – – 52,600 – 66,775
Sweet Potatoes 0 33 1,991 150 27
Groundnuts – 10 1377 16 2
Table IX.31.Production of Selected
(1) (2) (3) (4) (5) (6)
Source: FAOSTAT database, as of July 2005.
Products Cambodia Indonesia Lao PDR MalaysiaBrunei
Darussalam
Cereals,Total 0 4,426 65,416 2,733 2,259
Wheat – – – – –
Coconuts 6 71 16,289 – 710
Total Fruit Primary 1 325 12,207 201 1,297
Bananas 0 148 4,394 46 530
Mangoes – 35 1,006 3 20
Citrus Fruit 0 68 872 69 31
Other Crops
Coffee, Green – 0 702 23 39
Tea 0 0 173 0 4
Cocoa – – 430 – 33
Natural Rubber 0 46 2,766 – 1,190
Palm Oil – – 60,400 – 69,881
Sweet Potatoes 0 34 1,876 194 27
Groundnuts – 10 1,450 17 2
Table IX.32.Production of Selected
(1) (2) (3) (4) (5) (6)
Source: FAOSTAT database, as of July 2005.
Products Cambodia Indonesia Lao PDR MalaysiaBrunei
Darussalam
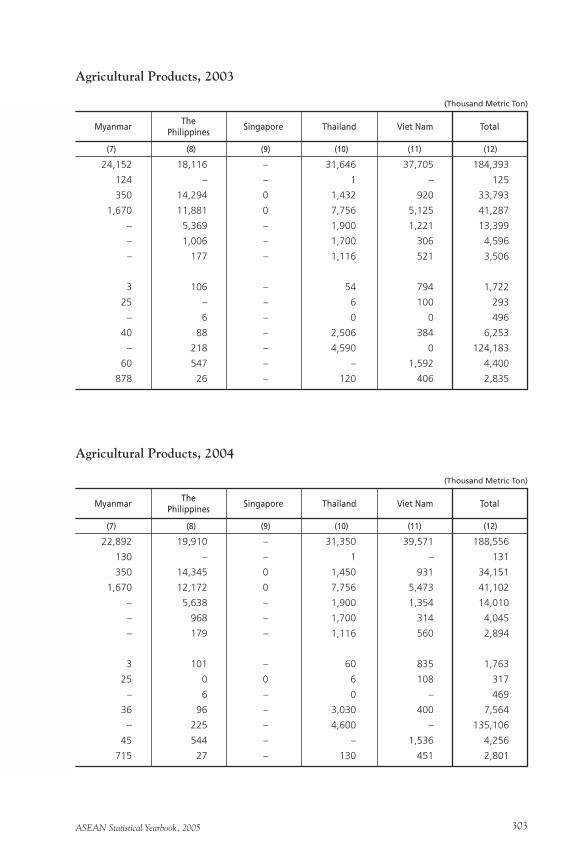
ASEAN Statistical Yearbook, 2005 303
Agricultural Products, 2003
24,152 18,116 – 31,646 37,705 184,393
124 – – 1 – 125
350 14,294 0 1,432 920 33,793
1,670 11,881 0 7,756 5,125 41,287
– 5,369 – 1,900 1,221 13,399
– 1,006 – 1,700 306 4,596
– 177 – 1,116 521 3,506
3 106 – 54 794 1,722
25 – – 6 100 293
– 6 – 0 0 496
40 88 – 2,506 384 6,253
– 218 – 4,590 0 124,183
60 547 – – 1,592 4,400
878 26 – 120 406 2,835
(7) (8) (9) (10) (11) (12)
ThePhilippines
Singapore Thailand Viet Nam TotalMyanmar
(Thousand Metric Ton)
Agricultural Products, 2004
22,892 19,910 – 31,350 39,571 188,556
130 – – 1 – 131
350 14,345 0 1,450 931 34,151
1,670 12,172 0 7,756 5,473 41,102
– 5,638 – 1,900 1,354 14,010
– 968 – 1,700 314 4,045
– 179 – 1,116 560 2,894
3 101 – 60 835 1,763
25 0 0 6 108 317
– 6 – 0 – 469
36 96 – 3,030 400 7,564
– 225 – 4,600 – 135,106
45 544 – – 1,536 4,256
715 27 – 130 451 2,801
(7) (8) (9) (10) (11) (12)
ThePhilippines
Singapore Thailand Viet Nam TotalMyanmar
(Thousand Metric Ton)
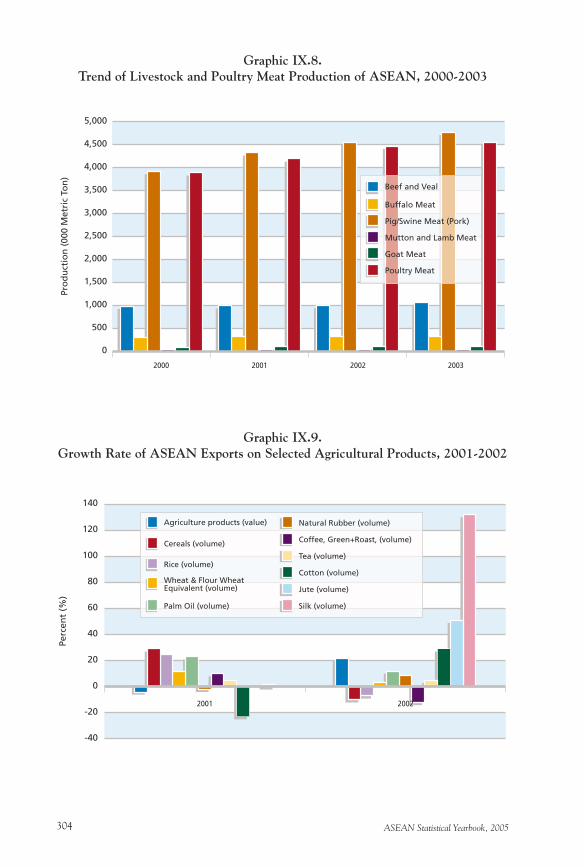
ASEAN Statistical Yearbook, 2005304
Graphic IX.8.Trend of Livestock and Poultry Meat Production of ASEAN, 2000-2003
Graphic IX.9.Growth Rate of ASEAN Exports on Selected Agricultural Products, 2001-2002
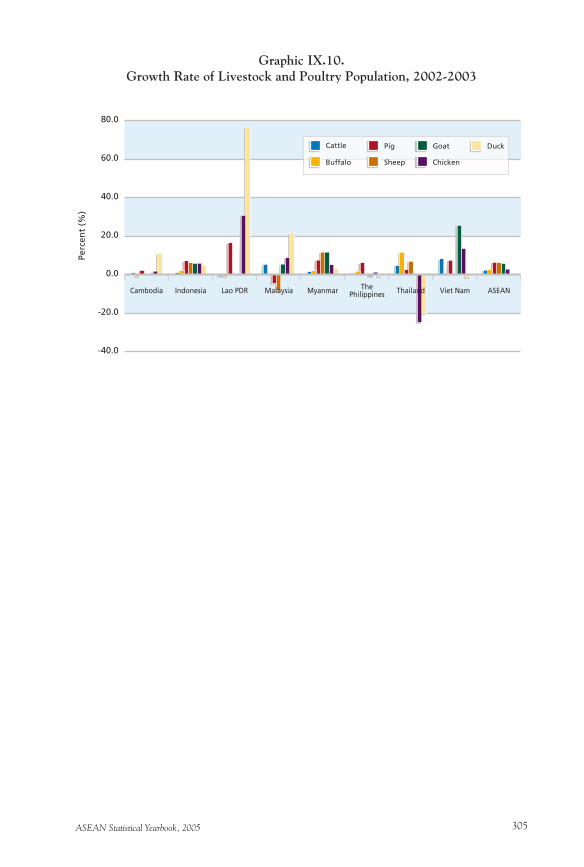
ASEAN Statistical Yearbook, 2005 305
Graphic IX.10.Growth Rate of Livestock and Poultry Population, 2002-2003
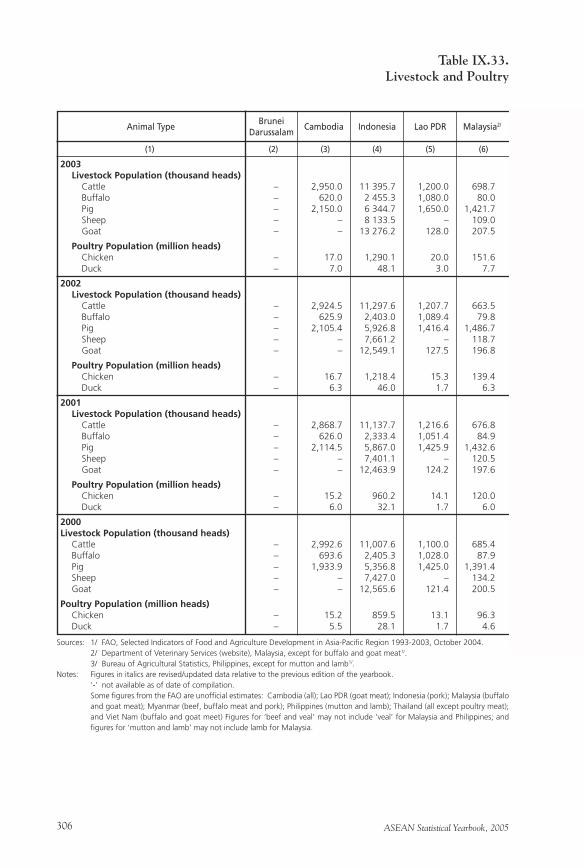
ASEAN Statistical Yearbook, 2005306
2003 Livestock Population (thousand heads) Cattle – 2,950.0 11 395.7 1,200.0 698.7 Buffalo – 620.0 2 455.3 1,080.0 80.0 Pig – 2,150.0 6 344.7 1,650.0 1,421.7 Sheep – – 8 133.5 – 109.0 Goat – – 13 276.2 128.0 207.5
Poultry Population (million heads) Chicken – 17.0 1,290.1 20.0 151.6 Duck – 7.0 48.1 3.0 7.7
2002 Livestock Population (thousand heads) Cattle – 2,924.5 11,297.6 1,207.7 663.5 Buffalo – 625.9 2,403.0 1,089.4 79.8 Pig – 2,105.4 5,926.8 1,416.4 1,486.7 Sheep – – 7,661.2 – 118.7 Goat – – 12,549.1 127.5 196.8
Poultry Population (million heads) Chicken – 16.7 1,218.4 15.3 139.4 Duck – 6.3 46.0 1.7 6.3
2001 Livestock Population (thousand heads) Cattle – 2,868.7 11,137.7 1,216.6 676.8 Buffalo – 626.0 2,333.4 1,051.4 84.9 Pig – 2,114.5 5,867.0 1,425.9 1,432.6 Sheep – – 7,401.1 – 120.5 Goat – – 12,463.9 124.2 197.6
Poultry Population (million heads) Chicken – 15.2 960.2 14.1 120.0 Duck – 6.0 32.1 1.7 6.0
2000 Livestock Population (thousand heads) Cattle – 2,992.6 11,007.6 1,100.0 685.4 Buffalo – 693.6 2,405.3 1,028.0 87.9 Pig – 1,933.9 5,356.8 1,425.0 1,391.4 Sheep – – 7,427.0 – 134.2 Goat – – 12,565.6 121.4 200.5
Poultry Population (million heads) Chicken – 15.2 859.5 13.1 96.3 Duck – 5.5 28.1 1.7 4.6
Table IX.33.Livestock and Poultry
(1) (2) (3) (4) (5) (6)
Sources: 1/ FAO, Selected Indicators of Food and Agriculture Development in Asia-Pacific Region 1993-2003, October 2004. 2/ Department of Veterinary Services (website), Malaysia, except for buffalo and goat meat1/. 3/ Bureau of Agricultural Statistics, Philippines, except for mutton and lamb1/.Notes: Figures in italics are revised/updated data relative to the previous edition of the yearbook. ‘-’ not available as of date of compilation. Some figures from the FAO are unofficial estimates: Cambodia (all); Lao PDR (goat meat); Indonesia (pork); Malaysia (buffalo
and goat meat); Myanmar (beef, buffalo meat and pork); Philippines (mutton and lamb); Thailand (all except poultry meat); and Viet Nam (buffalo and goat meet) Figures for ‘beef and veal’ may not include ‘veal’ for Malaysia and Philippines; and figures for ‘mutton and lamb’ may not include lamb for Malaysia.
Animal Type Cambodia Indonesia Lao PDR Malaysia2/Brunei Darussalam
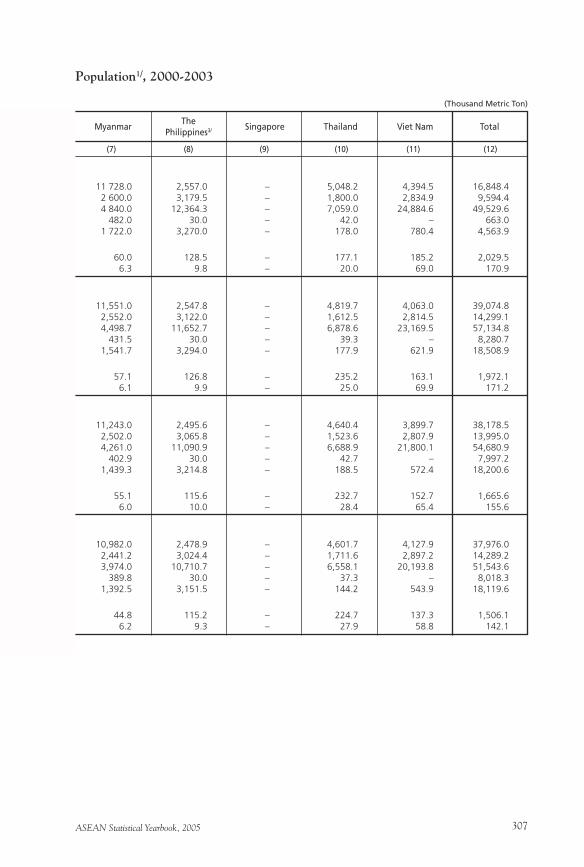
ASEAN Statistical Yearbook, 2005 307
Population1/, 2000-2003
11 728.0 2,557.0 – 5,048.2 4,394.5 16,848.4 2 600.0 3,179.5 – 1,800.0 2,834.9 9,594.4 4 840.0 12,364.3 – 7,059.0 24,884.6 49,529.6 482.0 30.0 – 42.0 – 663.0 1 722.0 3,270.0 – 178.0 780.4 4,563.9
60.0 128.5 – 177.1 185.2 2,029.5 6.3 9.8 – 20.0 69.0 170.9
11,551.0 2,547.8 – 4,819.7 4,063.0 39,074.8 2,552.0 3,122.0 – 1,612.5 2,814.5 14,299.1 4,498.7 11,652.7 – 6,878.6 23,169.5 57,134.8 431.5 30.0 – 39.3 – 8,280.7 1,541.7 3,294.0 – 177.9 621.9 18,508.9
57.1 126.8 – 235.2 163.1 1,972.1 6.1 9.9 – 25.0 69.9 171.2
11,243.0 2,495.6 – 4,640.4 3,899.7 38,178.5 2,502.0 3,065.8 – 1,523.6 2,807.9 13,995.0 4,261.0 11,090.9 – 6,688.9 21,800.1 54,680.9 402.9 30.0 – 42.7 – 7,997.2 1,439.3 3,214.8 – 188.5 572.4 18,200.6
55.1 115.6 – 232.7 152.7 1,665.6 6.0 10.0 – 28.4 65.4 155.6
10,982.0 2,478.9 – 4,601.7 4,127.9 37,976.0 2,441.2 3,024.4 – 1,711.6 2,897.2 14,289.2 3,974.0 10,710.7 – 6,558.1 20,193.8 51,543.6 389.8 30.0 – 37.3 – 8,018.3 1,392.5 3,151.5 – 144.2 543.9 18,119.6
44.8 115.2 – 224.7 137.3 1,506.1 6.2 9.3 – 27.9 58.8 142.1
(7) (8) (9) (10) (11) (12)
ThePhilippines3/ Singapore Thailand Viet Nam TotalMyanmar
(Thousand Metric Ton)
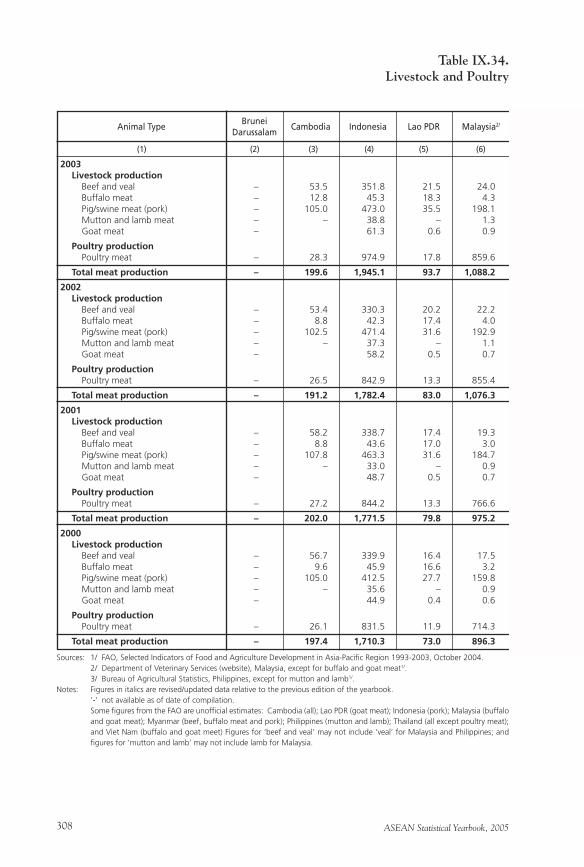
ASEAN Statistical Yearbook, 2005308
2003 Livestock production Beef and veal – 53.5 351.8 21.5 24.0 Buffalo meat – 12.8 45.3 18.3 4.3 Pig/swine meat (pork) – 105.0 473.0 35.5 198.1 Mutton and lamb meat – – 38.8 – 1.3 Goat meat – 61.3 0.6 0.9
Poultry production Poultry meat – 28.3 974.9 17.8 859.6
Total meat production – 199.6 1,945.1 93.7 1,088.2
2002 Livestock production Beef and veal – 53.4 330.3 20.2 22.2 Buffalo meat – 8.8 42.3 17.4 4.0 Pig/swine meat (pork) – 102.5 471.4 31.6 192.9 Mutton and lamb meat – – 37.3 – 1.1 Goat meat – 58.2 0.5 0.7
Poultry production Poultry meat – 26.5 842.9 13.3 855.4
Total meat production – 191.2 1,782.4 83.0 1,076.3
2001 Livestock production Beef and veal – 58.2 338.7 17.4 19.3 Buffalo meat – 8.8 43.6 17.0 3.0 Pig/swine meat (pork) – 107.8 463.3 31.6 184.7 Mutton and lamb meat – – 33.0 – 0.9 Goat meat – 48.7 0.5 0.7
Poultry production Poultry meat – 27.2 844.2 13.3 766.6
Total meat production – 202.0 1,771.5 79.8 975.2
2000 Livestock production Beef and veal – 56.7 339.9 16.4 17.5 Buffalo meat – 9.6 45.9 16.6 3.2 Pig/swine meat (pork) – 105.0 412.5 27.7 159.8 Mutton and lamb meat – – 35.6 – 0.9 Goat meat – 44.9 0.4 0.6
Poultry production Poultry meat – 26.1 831.5 11.9 714.3
Total meat production – 197.4 1,710.3 73.0 896.3
Table IX.34.Livestock and Poultry
(1) (2) (3) (4) (5) (6)
Sources: 1/ FAO, Selected Indicators of Food and Agriculture Development in Asia-Pacific Region 1993-2003, October 2004. 2/ Department of Veterinary Services (website), Malaysia, except for buffalo and goat meat1/. 3/ Bureau of Agricultural Statistics, Philippines, except for mutton and lamb1/.Notes: Figures in italics are revised/updated data relative to the previous edition of the yearbook. ‘-’ not available as of date of compilation. Some figures from the FAO are unofficial estimates: Cambodia (all); Lao PDR (goat meat); Indonesia (pork); Malaysia (buffalo
and goat meat); Myanmar (beef, buffalo meat and pork); Philippines (mutton and lamb); Thailand (all except poultry meat); and Viet Nam (buffalo and goat meet) Figures for ‘beef and veal’ may not include ‘veal’ for Malaysia and Philippines; and figures for ‘mutton and lamb’ may not include lamb for Malaysia.
Animal Type Cambodia Indonesia Lao PDR Malaysia2/Brunei Darussalam
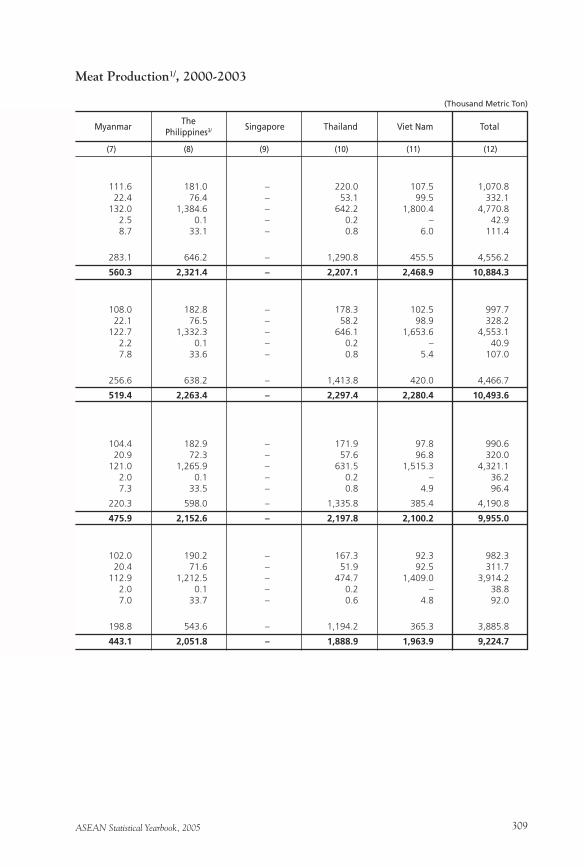
ASEAN Statistical Yearbook, 2005 309
Meat Production1/, 2000-2003
111.6 181.0 – 220.0 107.5 1,070.8 22.4 76.4 – 53.1 99.5 332.1 132.0 1,384.6 – 642.2 1,800.4 4,770.8 2.5 0.1 – 0.2 – 42.9 8.7 33.1 – 0.8 6.0 111.4
283.1 646.2 – 1,290.8 455.5 4,556.2
560.3 2,321.4 – 2,207.1 2,468.9 10,884.3
108.0 182.8 – 178.3 102.5 997.7 22.1 76.5 – 58.2 98.9 328.2 122.7 1,332.3 – 646.1 1,653.6 4,553.1 2.2 0.1 – 0.2 – 40.9 7.8 33.6 – 0.8 5.4 107.0
256.6 638.2 – 1,413.8 420.0 4,466.7
519.4 2,263.4 – 2,297.4 2,280.4 10,493.6
104.4 182.9 – 171.9 97.8 990.6 20.9 72.3 – 57.6 96.8 320.0 121.0 1,265.9 – 631.5 1,515.3 4,321.1 2.0 0.1 – 0.2 – 36.2 7.3 33.5 – 0.8 4.9 96.4
220.3 598.0 – 1,335.8 385.4 4,190.8
475.9 2,152.6 – 2,197.8 2,100.2 9,955.0
102.0 190.2 – 167.3 92.3 982.3 20.4 71.6 – 51.9 92.5 311.7 112.9 1,212.5 – 474.7 1,409.0 3,914.2 2.0 0.1 – 0.2 – 38.8 7.0 33.7 – 0.6 4.8 92.0
198.8 543.6 – 1,194.2 365.3 3,885.8
443.1 2,051.8 – 1,888.9 1,963.9 9,224.7
(7) (8) (9) (10) (11) (12)
ThePhilippines3/ Singapore Thailand Viet Nam TotalMyanmar
(Thousand Metric Ton)
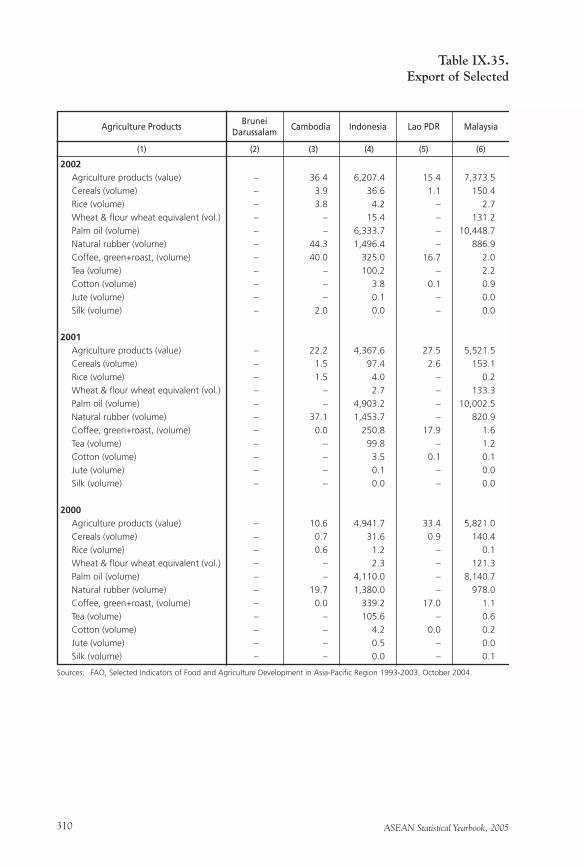
ASEAN Statistical Yearbook, 2005310
2002
Agriculture products (value) – 36.4 6,207.4 15.4 7,373.5
Cereals (volume) – 3.9 36.6 1.1 150.4
Rice (volume) – 3.8 4.2 – 2.7
Wheat & flour wheat equivalent (vol.) – – 15.4 – 131.2
Palm oil (volume) – – 6,333.7 – 10,448.7
Natural rubber (volume) – 44.3 1,496.4 – 886.9
Coffee, green+roast, (volume) – 40.0 325.0 16.7 2.0
Tea (volume) – – 100.2 – 2.2
Cotton (volume) – – 3.8 0.1 0.9
Jute (volume) – – 0.1 – 0.0
Silk (volume) – 2.0 0.0 – 0.0
2001 Agriculture products (value) – 22.2 4,367.6 27.5 5,521.5
Cereals (volume) – 1.5 97.4 2.6 153.1
Rice (volume) – 1.5 4.0 – 0.2
Wheat & flour wheat equivalent (vol.) – – 2.7 – 133.3
Palm oil (volume) – – 4,903.2 – 10,002.5
Natural rubber (volume) – 37.1 1,453.7 – 820.9
Coffee, green+roast, (volume) – 0.0 250.8 17.9 1.6
Tea (volume) – – 99.8 – 1.2
Cotton (volume) – – 3.5 0.1 0.1
Jute (volume) – – 0.1 – 0.0
Silk (volume) – – 0.0 – 0.0
2000
Agriculture products (value) – 10.6 4,941.7 33.4 5,821.0
Cereals (volume) – 0.7 31.6 0.9 140.4
Rice (volume) – 0.6 1.2 – 0.1
Wheat & flour wheat equivalent (vol.) – – 2.3 – 121.3
Palm oil (volume) – – 4,110.0 – 8,140.7
Natural rubber (volume) – 19.7 1,380.0 – 978.0
Coffee, green+roast, (volume) – 0.0 339.2 17.0 1.1
Tea (volume) – – 105.6 – 0.6
Cotton (volume) – – 4.2 0.0 0.2
Jute (volume) – – 0.5 – 0.0
Silk (volume) – – 0.0 – 0.1
Table IX.35.Export of Selected
(1) (2) (3) (4) (5) (6)
Sources: FAO, Selected Indicators of Food and Agriculture Development in Asia-Pacific Region 1993-2003, October 2004.
Agriculture Products Cambodia Indonesia Lao PDR MalaysiaBrunei
Darussalam
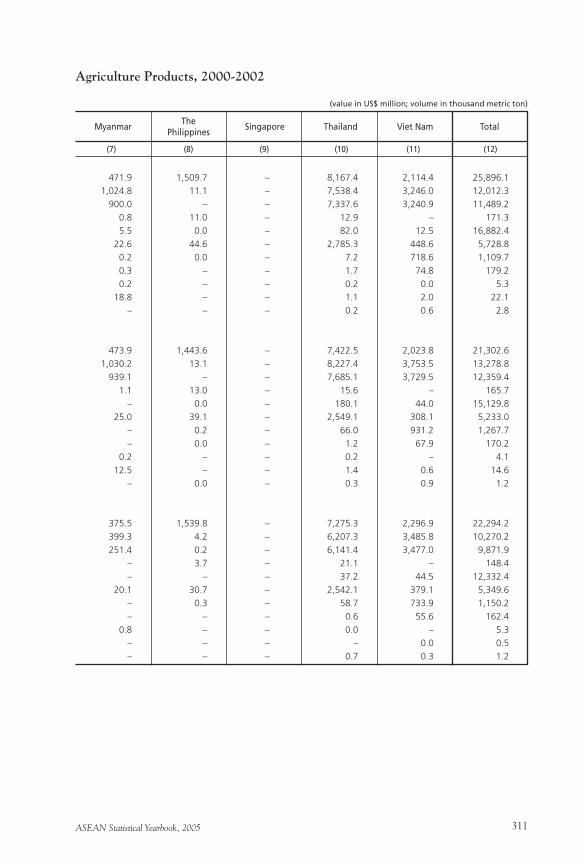
ASEAN Statistical Yearbook, 2005 311
Agriculture Products, 2000-2002
471.9 1,509.7 – 8,167.4 2,114.4 25,896.1
1,024.8 11.1 – 7,538.4 3,246.0 12,012.3
900.0 – – 7,337.6 3,240.9 11,489.2
0.8 11.0 – 12.9 – 171.3
5.5 0.0 – 82.0 12.5 16,882.4
22.6 44.6 – 2,785.3 448.6 5,728.8
0.2 0.0 – 7.2 718.6 1,109.7
0.3 – – 1.7 74.8 179.2
0.2 – – 0.2 0.0 5.3
18.8 – – 1.1 2.0 22.1
– – – 0.2 0.6 2.8
473.9 1,443.6 – 7,422.5 2,023.8 21,302.6
1,030.2 13.1 – 8,227.4 3,753.5 13,278.8
939.1 – – 7,685.1 3,729.5 12,359.4
1.1 13.0 – 15.6 – 165.7
– 0.0 – 180.1 44.0 15,129.8
25.0 39.1 – 2,549.1 308.1 5,233.0
– 0.2 – 66.0 931.2 1,267.7
– 0.0 – 1.2 67.9 170.2
0.2 – – 0.2 – 4.1
12.5 – – 1.4 0.6 14.6
– 0.0 – 0.3 0.9 1.2
375.5 1,539.8 – 7,275.3 2,296.9 22,294.2
399.3 4.2 – 6,207.3 3,485.8 10,270.2
251.4 0.2 – 6,141.4 3,477.0 9,871.9
– 3.7 – 21.1 – 148.4
– – – 37.2 44.5 12,332.4
20.1 30.7 – 2,542.1 379.1 5,349.6
– 0.3 – 58.7 733.9 1,150.2
– – – 0.6 55.6 162.4
0.8 – – 0.0 – 5.3
– – – – 0.0 0.5
– – – 0.7 0.3 1.2
(7) (8) (9) (10) (11) (12)
ThePhilippines
Singapore Thailand Viet Nam TotalMyanmar
(value in US$ million; volume in thousand metric ton)
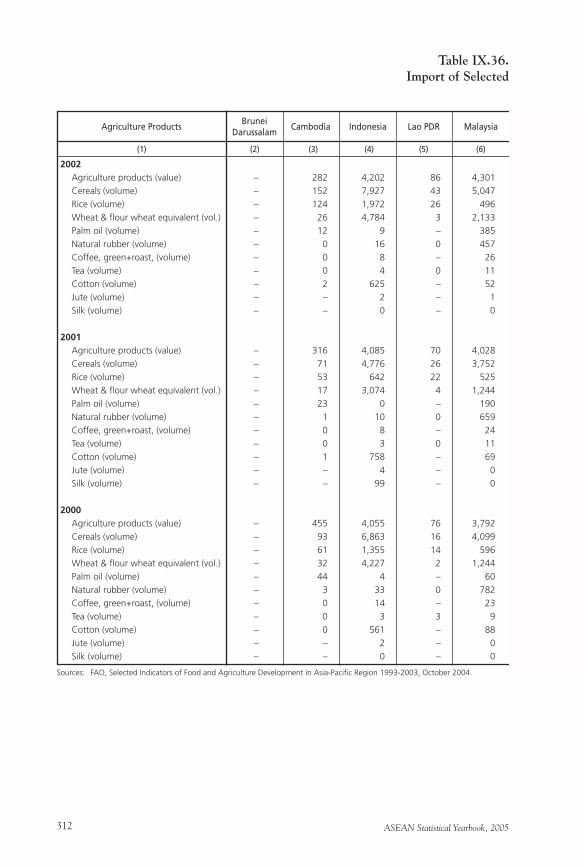
ASEAN Statistical Yearbook, 2005312
2002
Agriculture products (value) – 282 4,202 86 4,301
Cereals (volume) – 152 7,927 43 5,047
Rice (volume) – 124 1,972 26 496
Wheat & flour wheat equivalent (vol.) – 26 4,784 3 2,133
Palm oil (volume) – 12 9 – 385
Natural rubber (volume) – 0 16 0 457
Coffee, green+roast, (volume) – 0 8 – 26
Tea (volume) – 0 4 0 11
Cotton (volume) – 2 625 – 52
Jute (volume) – – 2 – 1
Silk (volume) – – 0 – 0
2001
Agriculture products (value) – 316 4,085 70 4,028
Cereals (volume) – 71 4,776 26 3,752
Rice (volume) – 53 642 22 525
Wheat & flour wheat equivalent (vol.) – 17 3,074 4 1,244
Palm oil (volume) – 23 0 – 190
Natural rubber (volume) – 1 10 0 659
Coffee, green+roast, (volume) – 0 8 – 24
Tea (volume) – 0 3 0 11
Cotton (volume) – 1 758 – 69
Jute (volume) – – 4 – 0
Silk (volume) – – 99 – 0
2000
Agriculture products (value) – 455 4,055 76 3,792
Cereals (volume) – 93 6,863 16 4,099
Rice (volume) – 61 1,355 14 596
Wheat & flour wheat equivalent (vol.) – 32 4,227 2 1,244
Palm oil (volume) – 44 4 – 60
Natural rubber (volume) – 3 33 0 782
Coffee, green+roast, (volume) – 0 14 – 23
Tea (volume) – 0 3 3 9
Cotton (volume) – 0 561 – 88
Jute (volume) – – 2 – 0
Silk (volume) – – 0 – 0
Table IX.36.Import of Selected
(1) (2) (3) (4) (5) (6)
Sources: FAO, Selected Indicators of Food and Agriculture Development in Asia-Pacific Region 1993-2003, October 2004.
Agriculture Products Cambodia Indonesia Lao PDR MalaysiaBrunei
Darussalam
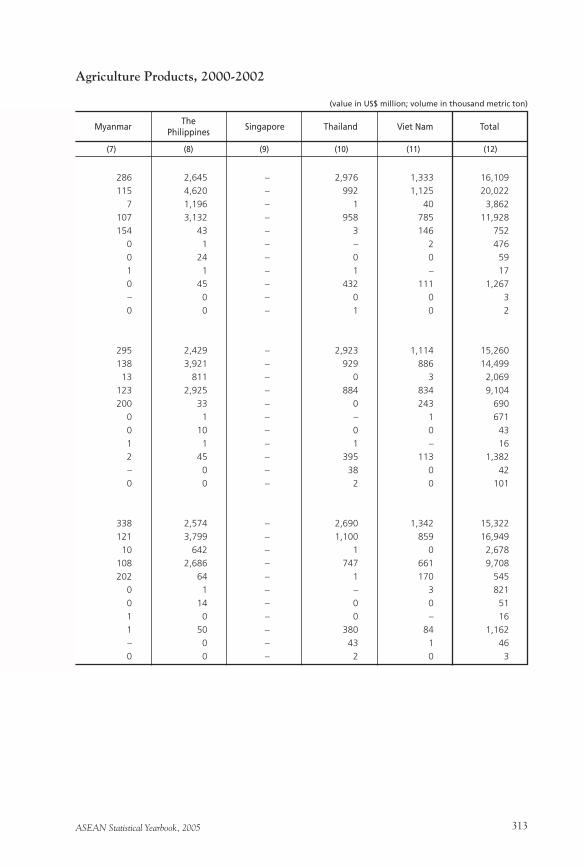
ASEAN Statistical Yearbook, 2005 313
Agriculture Products, 2000-2002
286 2,645 – 2,976 1,333 16,109
115 4,620 – 992 1,125 20,022
7 1,196 – 1 40 3,862
107 3,132 – 958 785 11,928
154 43 – 3 146 752
0 1 – – 2 476
0 24 – 0 0 59
1 1 – 1 – 17
0 45 – 432 111 1,267
– 0 – 0 0 3
0 0 – 1 0 2
295 2,429 – 2,923 1,114 15,260
138 3,921 – 929 886 14,499
13 811 – 0 3 2,069
123 2,925 – 884 834 9,104
200 33 – 0 243 690
0 1 – – 1 671
0 10 – 0 0 43
1 1 – 1 – 16
2 45 – 395 113 1,382
– 0 – 38 0 42
0 0 – 2 0 101
338 2,574 – 2,690 1,342 15,322
121 3,799 – 1,100 859 16,949
10 642 – 1 0 2,678
108 2,686 – 747 661 9,708
202 64 – 1 170 545
0 1 – – 3 821
0 14 – 0 0 51
1 0 – 0 – 16
1 50 – 380 84 1,162
– 0 – 43 1 46
0 0 – 2 0 3
(7) (8) (9) (10) (11) (12)
ThePhilippines
Singapore Thailand Viet Nam TotalMyanmar
(value in US$ million; volume in thousand metric ton)

ASEAN Statistical Yearbook, 2005314
ASEAN Statistical Yearbook, 2005 315
Chapter XManufacturing

ASEAN Statistical Yearbook, 2005316
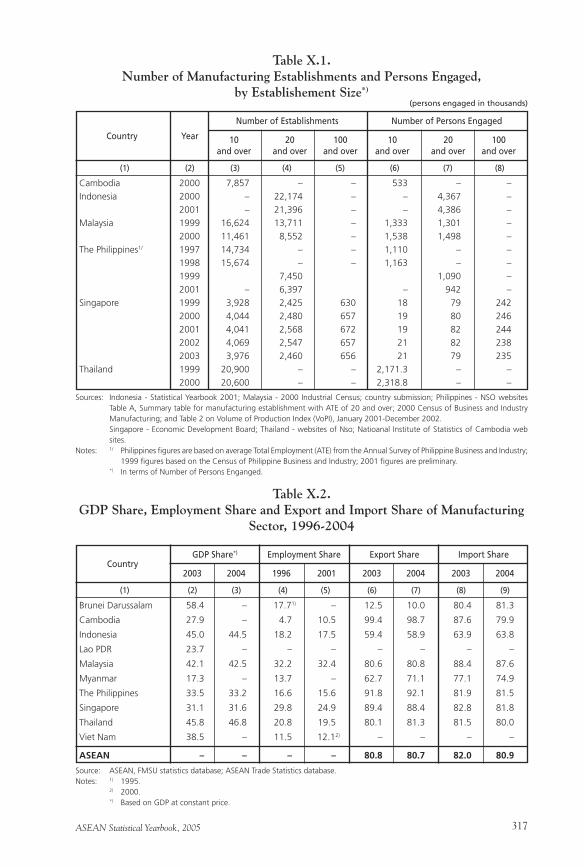
ASEAN Statistical Yearbook, 2005 317
Cambodia 2000 7,857 – – 533 – –
Indonesia 2000 – 22,174 – – 4,367 –
2001 – 21,396 – – 4,386 –
Malaysia 1999 16,624 13,711 – 1,333 1,301 –
2000 11,461 8,552 – 1,538 1,498 –
The Philippines1/ 1997 14,734 – – 1,110 – –
1998 15,674 – – 1,163 – –
1999 7,450 1,090 –
2001 – 6,397 – 942 –
Singapore 1999 3,928 2,425 630 18 79 242
2000 4,044 2,480 657 19 80 246
2001 4,041 2,568 672 19 82 244
2002 4,069 2,547 657 21 82 238
2003 3,976 2,460 656 21 79 235
Thailand 1999 20,900 – – 2,171.3 – –
2000 20,600 – – 2,318.8 – –
Table X.1.Number of Manufacturing Establishments and Persons Engaged,
by Establishement Size*)
Country Year
(1) (2) (3) (4) (5) (6) (7) (8)
Sources: Indonesia - Statistical Yearbook 2001; Malaysia - 2000 Industrial Census; country submission; Philippines - NSO websites Table A, Summary table for manufacturing establishment with ATE of 20 and over; 2000 Census of Business and Industry Manufacturing; and Table 2 on Volume of Production Index (VoPI), January 2001-December 2002.
Singapore - Economic Development Board; Thailand - websites of Nso; Natioanal Institute of Statistics of Cambodia web sites.
Notes: 1/ Philippines figures are based on average Total Employment (ATE) from the Annual Survey of Philippine Business and Industry; 1999 figures based on the Census of Philippine Business and Industry; 2001 figures are preliminary.
*) In terms of Number of Persons Enganged.
Number of Establishments Number of Persons Engaged
(persons engaged in thousands)
10 20 100 and over and over and over
10 20 100 and over and over and over
Brunei Darussalam 58.4 – 17.71) – 12.5 10.0 80.4 81.3
Cambodia 27.9 – 4.7 10.5 99.4 98.7 87.6 79.9
Indonesia 45.0 44.5 18.2 17.5 59.4 58.9 63.9 63.8
Lao PDR 23.7 – – – – – – –
Malaysia 42.1 42.5 32.2 32.4 80.6 80.8 88.4 87.6
Myanmar 17.3 – 13.7 – 62.7 71.1 77.1 74.9
The Philippines 33.5 33.2 16.6 15.6 91.8 92.1 81.9 81.5
Singapore 31.1 31.6 29.8 24.9 89.4 88.4 82.8 81.8
Thailand 45.8 46.8 20.8 19.5 80.1 81.3 81.5 80.0
Viet Nam 38.5 – 11.5 12.12) – – – –
ASEAN – – – – 80.8 80.7 82.0 80.9
Table X.2.GDP Share, Employment Share and Export and Import Share of Manufacturing
Sector, 1996-2004
Country
(1) (2) (3) (4) (5) (6) (7) (8) (9)
Source: ASEAN, FMSU statistics database; ASEAN Trade Statistics database.Notes: 1) 1995. 2) 2000. *) Based on GDP at constant price.
GDP Share*) Employment Share Export Share Import Share
2003 2004 1996 2001 2003 2004 2003 2004
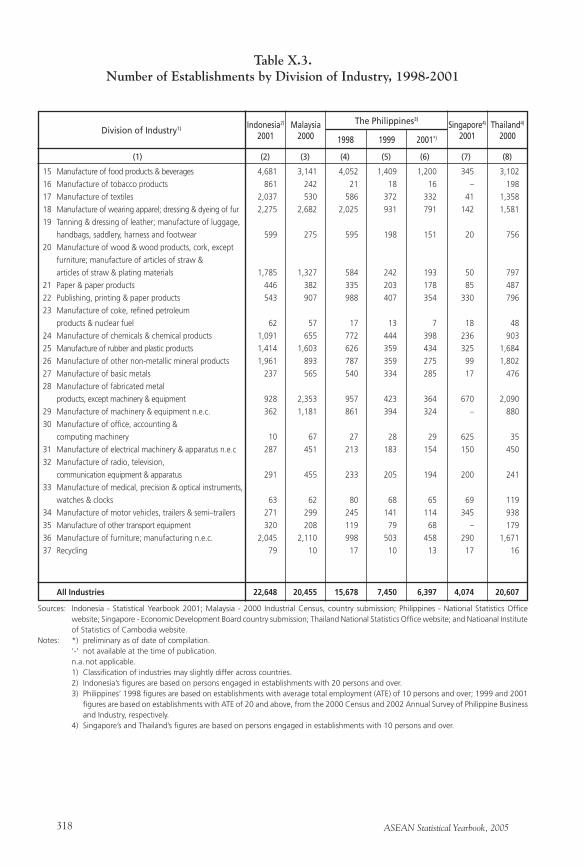
ASEAN Statistical Yearbook, 2005318
15 Manufacture of food products & beverages 4,681 3,141 4,052 1,409 1,200 345 3,102
16 Manufacture of tobacco products 861 242 21 18 16 – 198
17 Manufacture of textiles 2,037 530 586 372 332 41 1,358
18 Manufacture of wearing apparel; dressing & dyeing of fur 2,275 2,682 2,025 931 791 142 1,581
19 Tanning & dressing of leather; manufacture of luggage,
handbags, saddlery, harness and footwear 599 275 595 198 151 20 756
20 Manufacture of wood & wood products, cork, except
furniture; manufacture of articles of straw &
articles of straw & plating materials 1,785 1,327 584 242 193 50 797
21 Paper & paper products 446 382 335 203 178 85 487
22 Publishing, printing & paper products 543 907 988 407 354 330 796
23 Manufacture of coke, refined petroleum
products & nuclear fuel 62 57 17 13 7 18 48
24 Manufacture of chemicals & chemical products 1,091 655 772 444 398 236 903
25 Manufacture of rubber and plastic products 1,414 1,603 626 359 434 325 1,684
26 Manufacture of other non-metallic mineral products 1,961 893 787 359 275 99 1,802
27 Manufacture of basic metals 237 565 540 334 285 17 476
28 Manufacture of fabricated metal
products, except machinery & equipment 928 2,353 957 423 364 670 2,090
29 Manufacture of machinery & equipment n.e.c. 362 1,181 861 394 324 – 880
30 Manufacture of office, accounting &
computing machinery 10 67 27 28 29 625 35
31 Manufacture of electrical machinery & apparatus n.e.c 287 451 213 183 154 150 450
32 Manufacture of radio, television,
communication equipment & apparatus 291 455 233 205 194 200 241
33 Manufacture of medical, precision & optical instruments,
watches & clocks 63 62 80 68 65 69 119
34 Manufacture of motor vehicles, trailers & semi–trailers 271 299 245 141 114 345 938
35 Manufacture of other transport equipment 320 208 119 79 68 – 179
36 Manufacture of furniture; manufacturing n.e.c. 2,045 2,110 998 503 458 290 1,671
37 Recycling 79 10 17 10 13 17 16
All Industries 22,648 20,455 15,678 7,450 6,397 4,074 20,607
Table X.3.Number of Establishments by Division of Industry, 1998-2001
Division of Industry1)
(1) (2) (3) (4) (5) (6) (7) (8)
Sources: Indonesia - Statistical Yearbook 2001; Malaysia - 2000 Industrial Census, country submission; Philippines - National Statistics Office website; Singapore - Economic Development Board country submission; Thailand National Statistics Office website; and Natioanal Institute of Statistics of Cambodia website.
Notes: *) preliminary as of date of compilation. ‘-’ not available at the time of publication. n.a. not applicable. 1) Classification of industries may slightly differ across countries. 2) Indonesia’s figures are based on persons engaged in establishments with 20 persons and over. 3) Philippines’ 1998 figures are based on establishments with average total employment (ATE) of 10 persons and over; 1999 and 2001
figures are based on establishments with ATE of 20 and above, from the 2000 Census and 2002 Annual Survey of Philippine Business and Industry, respectively.
4) Singapore’s and Thailand’s figures are based on persons engaged in establishments with 10 persons and over.
Malaysia2000
Singapore4)
2001Thailand4)
2000Indonesia2)
2001
The Philippines3)
1998 1999 2001*)
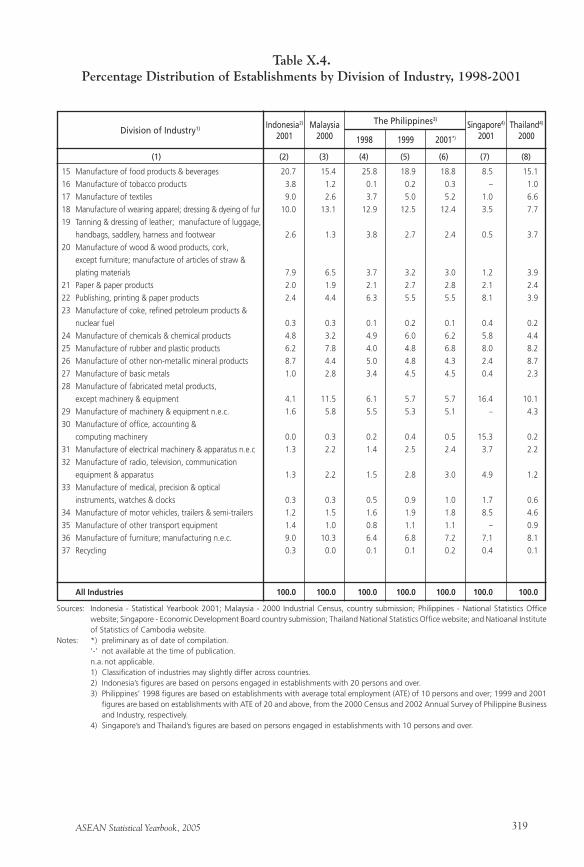
ASEAN Statistical Yearbook, 2005 319
15 Manufacture of food products & beverages 20.7 15.4 25.8 18.9 18.8 8.5 15.1
16 Manufacture of tobacco products 3.8 1.2 0.1 0.2 0.3 – 1.0
17 Manufacture of textiles 9.0 2.6 3.7 5.0 5.2 1.0 6.6
18 Manufacture of wearing apparel; dressing & dyeing of fur 10.0 13.1 12.9 12.5 12.4 3.5 7.7
19 Tanning & dressing of leather; manufacture of luggage,
handbags, saddlery, harness and footwear 2.6 1.3 3.8 2.7 2.4 0.5 3.7
20 Manufacture of wood & wood products, cork,
except furniture; manufacture of articles of straw &
plating materials 7.9 6.5 3.7 3.2 3.0 1.2 3.9
21 Paper & paper products 2.0 1.9 2.1 2.7 2.8 2.1 2.4
22 Publishing, printing & paper products 2.4 4.4 6.3 5.5 5.5 8.1 3.9
23 Manufacture of coke, refined petroleum products &
nuclear fuel 0.3 0.3 0.1 0.2 0.1 0.4 0.2
24 Manufacture of chemicals & chemical products 4.8 3.2 4.9 6.0 6.2 5.8 4.4
25 Manufacture of rubber and plastic products 6.2 7.8 4.0 4.8 6.8 8.0 8.2
26 Manufacture of other non-metallic mineral products 8.7 4.4 5.0 4.8 4.3 2.4 8.7
27 Manufacture of basic metals 1.0 2.8 3.4 4.5 4.5 0.4 2.3
28 Manufacture of fabricated metal products,
except machinery & equipment 4.1 11.5 6.1 5.7 5.7 16.4 10.1
29 Manufacture of machinery & equipment n.e.c. 1.6 5.8 5.5 5.3 5.1 – 4.3
30 Manufacture of office, accounting &
computing machinery 0.0 0.3 0.2 0.4 0.5 15.3 0.2
31 Manufacture of electrical machinery & apparatus n.e.c 1.3 2.2 1.4 2.5 2.4 3.7 2.2
32 Manufacture of radio, television, communication
equipment & apparatus 1.3 2.2 1.5 2.8 3.0 4.9 1.2
33 Manufacture of medical, precision & optical
instruments, watches & clocks 0.3 0.3 0.5 0.9 1.0 1.7 0.6
34 Manufacture of motor vehicles, trailers & semi-trailers 1.2 1.5 1.6 1.9 1.8 8.5 4.6
35 Manufacture of other transport equipment 1.4 1.0 0.8 1.1 1.1 – 0.9
36 Manufacture of furniture; manufacturing n.e.c. 9.0 10.3 6.4 6.8 7.2 7.1 8.1
37 Recycling 0.3 0.0 0.1 0.1 0.2 0.4 0.1
All Industries 100.0 100.0 100.0 100.0 100.0 100.0 100.0
Table X.4.Percentage Distribution of Establishments by Division of Industry, 1998-2001
Division of Industry1)
(1) (2) (3) (4) (5) (6) (7) (8)
Sources: Indonesia - Statistical Yearbook 2001; Malaysia - 2000 Industrial Census, country submission; Philippines - National Statistics Office website; Singapore - Economic Development Board country submission; Thailand National Statistics Office website; and Natioanal Institute of Statistics of Cambodia website.
Notes: *) preliminary as of date of compilation. ‘-’ not available at the time of publication. n.a. not applicable. 1) Classification of industries may slightly differ across countries. 2) Indonesia’s figures are based on persons engaged in establishments with 20 persons and over. 3) Philippines’ 1998 figures are based on establishments with average total employment (ATE) of 10 persons and over; 1999 and 2001
figures are based on establishments with ATE of 20 and above, from the 2000 Census and 2002 Annual Survey of Philippine Business and Industry, respectively.
4) Singapore’s and Thailand’s figures are based on persons engaged in establishments with 10 persons and over.
Malaysia2000
Singapore4)
2001Thailand4)
2000Indonesia2)
2001
The Philippines3)
1998 1999 2001*)
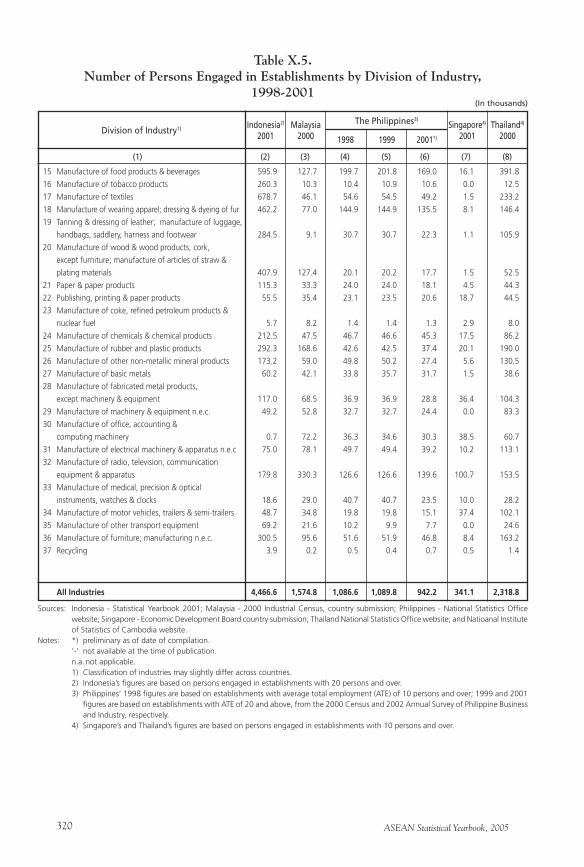
ASEAN Statistical Yearbook, 2005320
15 Manufacture of food products & beverages 595.9 127.7 199.7 201.8 169.0 16.1 391.8
16 Manufacture of tobacco products 260.3 10.3 10.4 10.9 10.6 0.0 12.5
17 Manufacture of textiles 678.7 46.1 54.6 54.5 49.2 1.5 233.2
18 Manufacture of wearing apparel; dressing & dyeing of fur 462.2 77.0 144.9 144.9 135.5 8.1 146.4
19 Tanning & dressing of leather; manufacture of luggage,
handbags, saddlery, harness and footwear 284.5 9.1 30.7 30.7 22.3 1.1 105.9
20 Manufacture of wood & wood products, cork,
except furniture; manufacture of articles of straw &
plating materials 407.9 127.4 20.1 20.2 17.7 1.5 52.5
21 Paper & paper products 115.3 33.3 24.0 24.0 18.1 4.5 44.3
22 Publishing, printing & paper products 55.5 35.4 23.1 23.5 20.6 18.7 44.5
23 Manufacture of coke, refined petroleum products &
nuclear fuel 5.7 8.2 1.4 1.4 1.3 2.9 8.0
24 Manufacture of chemicals & chemical products 212.5 47.5 46.7 46.6 45.3 17.5 86.2
25 Manufacture of rubber and plastic products 292.3 168.6 42.6 42.5 37.4 20.1 190.0
26 Manufacture of other non-metallic mineral products 173.2 59.0 49.8 50.2 27.4 5.6 130.5
27 Manufacture of basic metals 60.2 42.1 33.8 35.7 31.7 1.5 38.6
28 Manufacture of fabricated metal products,
except machinery & equipment 117.0 68.5 36.9 36.9 28.8 36.4 104.3
29 Manufacture of machinery & equipment n.e.c. 49.2 52.8 32.7 32.7 24.4 0.0 83.3
30 Manufacture of office, accounting &
computing machinery 0.7 72.2 36.3 34.6 30.3 38.5 60.7
31 Manufacture of electrical machinery & apparatus n.e.c 75.0 78.1 49.7 49.4 39.2 10.2 113.1
32 Manufacture of radio, television, communication
equipment & apparatus 179.8 330.3 126.6 126.6 139.6 100.7 153.5
33 Manufacture of medical, precision & optical
instruments, watches & clocks 18.6 29.0 40.7 40.7 23.5 10.0 28.2
34 Manufacture of motor vehicles, trailers & semi-trailers 48.7 34.8 19.8 19.8 15.1 37.4 102.1
35 Manufacture of other transport equipment 69.2 21.6 10.2 9.9 7.7 0.0 24.6
36 Manufacture of furniture; manufacturing n.e.c. 300.5 95.6 51.6 51.9 46.8 8.4 163.2
37 Recycling 3.9 0.2 0.5 0.4 0.7 0.5 1.4
All Industries 4,466.6 1,574.8 1,086.6 1,089.8 942.2 341.1 2,318.8
Table X.5.Number of Persons Engaged in Establishments by Division of Industry,
1998-2001
Division of Industry1)
(1) (2) (3) (4) (5) (6) (7) (8)
Sources: Indonesia - Statistical Yearbook 2001; Malaysia - 2000 Industrial Census, country submission; Philippines - National Statistics Office website; Singapore - Economic Development Board country submission; Thailand National Statistics Office website; and Natioanal Institute of Statistics of Cambodia website.
Notes: *) preliminary as of date of compilation. ‘-’ not available at the time of publication. n.a. not applicable. 1) Classification of industries may slightly differ across countries. 2) Indonesia’s figures are based on persons engaged in establishments with 20 persons and over. 3) Philippines’ 1998 figures are based on establishments with average total employment (ATE) of 10 persons and over; 1999 and 2001
figures are based on establishments with ATE of 20 and above, from the 2000 Census and 2002 Annual Survey of Philippine Business and Industry, respectively.
4) Singapore’s and Thailand’s figures are based on persons engaged in establishments with 10 persons and over.
Malaysia2000
Singapore4)
2001Thailand4)
2000Indonesia2)
2001
The Philippines3)
1998 1999 2001*)
(In thousands)
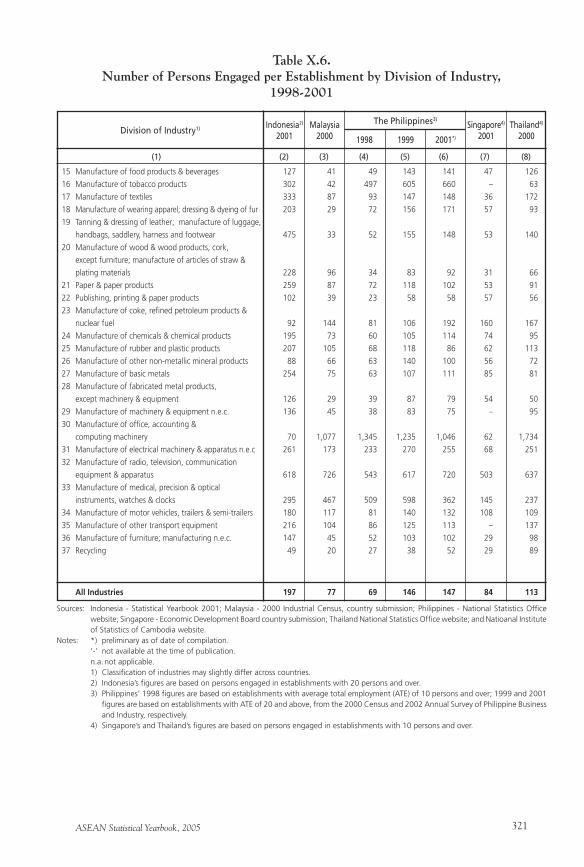
ASEAN Statistical Yearbook, 2005 321
15 Manufacture of food products & beverages 127 41 49 143 141 47 126
16 Manufacture of tobacco products 302 42 497 605 660 – 63
17 Manufacture of textiles 333 87 93 147 148 36 172
18 Manufacture of wearing apparel; dressing & dyeing of fur 203 29 72 156 171 57 93
19 Tanning & dressing of leather; manufacture of luggage,
handbags, saddlery, harness and footwear 475 33 52 155 148 53 140
20 Manufacture of wood & wood products, cork,
except furniture; manufacture of articles of straw &
plating materials 228 96 34 83 92 31 66
21 Paper & paper products 259 87 72 118 102 53 91
22 Publishing, printing & paper products 102 39 23 58 58 57 56
23 Manufacture of coke, refined petroleum products &
nuclear fuel 92 144 81 106 192 160 167
24 Manufacture of chemicals & chemical products 195 73 60 105 114 74 95
25 Manufacture of rubber and plastic products 207 105 68 118 86 62 113
26 Manufacture of other non-metallic mineral products 88 66 63 140 100 56 72
27 Manufacture of basic metals 254 75 63 107 111 85 81
28 Manufacture of fabricated metal products,
except machinery & equipment 126 29 39 87 79 54 50
29 Manufacture of machinery & equipment n.e.c. 136 45 38 83 75 – 95
30 Manufacture of office, accounting &
computing machinery 70 1,077 1,345 1,235 1,046 62 1,734
31 Manufacture of electrical machinery & apparatus n.e.c 261 173 233 270 255 68 251
32 Manufacture of radio, television, communication
equipment & apparatus 618 726 543 617 720 503 637
33 Manufacture of medical, precision & optical
instruments, watches & clocks 295 467 509 598 362 145 237
34 Manufacture of motor vehicles, trailers & semi-trailers 180 117 81 140 132 108 109
35 Manufacture of other transport equipment 216 104 86 125 113 – 137
36 Manufacture of furniture; manufacturing n.e.c. 147 45 52 103 102 29 98
37 Recycling 49 20 27 38 52 29 89
All Industries 197 77 69 146 147 84 113
Table X.6.Number of Persons Engaged per Establishment by Division of Industry,
1998-2001
Division of Industry1)
(1) (2) (3) (4) (5) (6) (7) (8)
Sources: Indonesia - Statistical Yearbook 2001; Malaysia - 2000 Industrial Census, country submission; Philippines - National Statistics Office website; Singapore - Economic Development Board country submission; Thailand National Statistics Office website; and Natioanal Institute of Statistics of Cambodia website.
Notes: *) preliminary as of date of compilation. ‘-’ not available at the time of publication. n.a. not applicable. 1) Classification of industries may slightly differ across countries. 2) Indonesia’s figures are based on persons engaged in establishments with 20 persons and over. 3) Philippines’ 1998 figures are based on establishments with average total employment (ATE) of 10 persons and over; 1999 and 2001
figures are based on establishments with ATE of 20 and above, from the 2000 Census and 2002 Annual Survey of Philippine Business and Industry, respectively.
4) Singapore’s and Thailand’s figures are based on persons engaged in establishments with 10 persons and over.
Malaysia2000
Singapore4)
2001Thailand4)
2000Indonesia2)
2001
The Philippines3)
1998 1999 2001*)
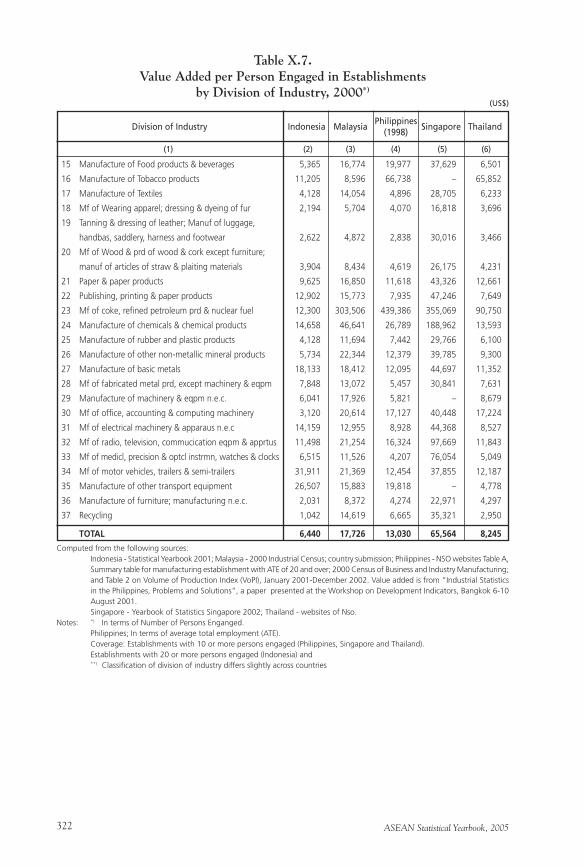
ASEAN Statistical Yearbook, 2005322
Table X.7.Value Added per Person Engaged in Establishments
by Division of Industry, 2000*)
(US$)
15 Manufacture of Food products & beverages 5,365 16,774 19,977 37,629 6,501
16 Manufacture of Tobacco products 11,205 8,596 66,738 – 65,852
17 Manufacture of Textiles 4,128 14,054 4,896 28,705 6,233
18 Mf of Wearing apparel; dressing & dyeing of fur 2,194 5,704 4,070 16,818 3,696
19 Tanning & dressing of leather; Manuf of luggage,
handbas, saddlery, harness and footwear 2,622 4,872 2,838 30,016 3,466
20 Mf of Wood & prd of wood & cork except furniture;
manuf of articles of straw & plaiting materials 3,904 8,434 4,619 26,175 4,231
21 Paper & paper products 9,625 16,850 11,618 43,326 12,661
22 Publishing, printing & paper products 12,902 15,773 7,935 47,246 7,649
23 Mf of coke, refined petroleum prd & nuclear fuel 12,300 303,506 439,386 355,069 90,750
24 Manufacture of chemicals & chemical products 14,658 46,641 26,789 188,962 13,593
25 Manufacture of rubber and plastic products 4,128 11,694 7,442 29,766 6,100
26 Manufacture of other non-metallic mineral products 5,734 22,344 12,379 39,785 9,300
27 Manufacture of basic metals 18,133 18,412 12,095 44,697 11,352
28 Mf of fabricated metal prd, except machinery & eqpm 7,848 13,072 5,457 30,841 7,631
29 Manufacture of machinery & eqpm n.e.c. 6,041 17,926 5,821 – 8,679
30 Mf of office, accounting & computing machinery 3,120 20,614 17,127 40,448 17,224
31 Mf of electrical machinery & apparaus n.e.c 14,159 12,955 8,928 44,368 8,527
32 Mf of radio, television, commucication eqpm & apprtus 11,498 21,254 16,324 97,669 11,843
33 Mf of medicl, precision & optcl instrmn, watches & clocks 6,515 11,526 4,207 76,054 5,049
34 Mf of motor vehicles, trailers & semi-trailers 31,911 21,369 12,454 37,855 12,187
35 Manufacture of other transport equipment 26,507 15,883 19,818 – 4,778
36 Manufacture of furniture; manufacturing n.e.c. 2,031 8,372 4,274 22,971 4,297
37 Recycling 1,042 14,619 6,665 35,321 2,950
TOTAL 6,440 17,726 13,030 65,564 8,245
Division of Industry Indonesia Malaysia
(1) (2) (3) (4) (5) (6)
Computed from the following sources: Indonesia - Statistical Yearbook 2001; Malaysia - 2000 Industrial Census; country submission; Philippines - NSO websites Table A,
Summary table for manufacturing establishment with ATE of 20 and over; 2000 Census of Business and Industry Manufacturing; and Table 2 on Volume of Production Index (VoPI), January 2001-December 2002. Value added is from “Industrial Statistics in the Philippines, Problems and Solutions”, a paper presented at the Workshop on Development Indicators, Bangkok 6-10 August 2001.
Singapore - Yearbook of Statistics Singapore 2002; Thailand - websites of Nso.Notes: *) In terms of Number of Persons Enganged. Philippines; In terms of average total employment (ATE). Coverage: Establishments with 10 or more persons engaged (Philippines, Singapore and Thailand). Establishments with 20 or more persons engaged (Indonesia) and **) Classification of division of industry differs slightly across countries
Philippines(1998)
Singapore Thailand
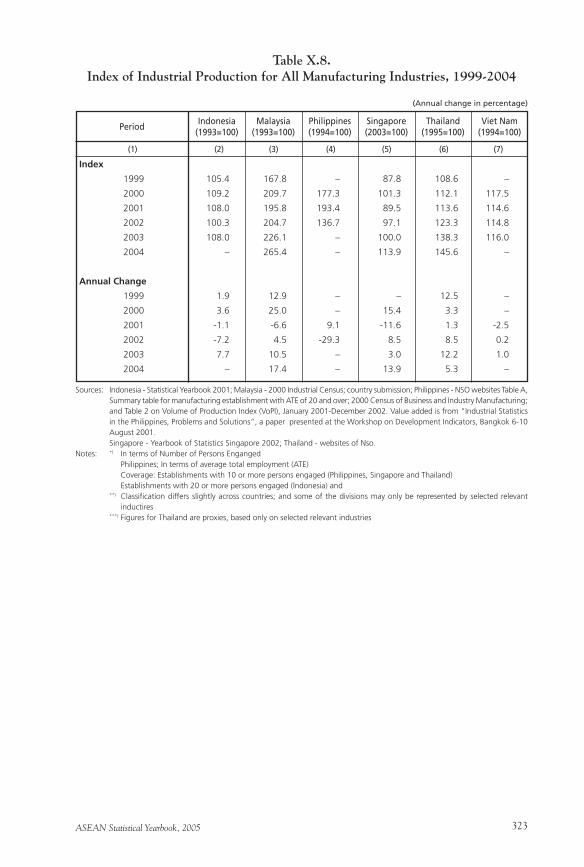
ASEAN Statistical Yearbook, 2005 323
Index
1999 105.4 167.8 – 87.8 108.6 –
2000 109.2 209.7 177.3 101.3 112.1 117.5
2001 108.0 195.8 193.4 89.5 113.6 114.6
2002 100.3 204.7 136.7 97.1 123.3 114.8
2003 108.0 226.1 – 100.0 138.3 116.0
2004 – 265.4 – 113.9 145.6 –
Annual Change
1999 1.9 12.9 – – 12.5 –
2000 3.6 25.0 – 15.4 3.3 –
2001 -1.1 -6.6 9.1 -11.6 1.3 -2.5
2002 -7.2 4.5 -29.3 8.5 8.5 0.2
2003 7.7 10.5 – 3.0 12.2 1.0
2004 – 17.4 – 13.9 5.3 –
Table X.8.Index of Industrial Production for All Manufacturing Industries, 1999-2004
Period
(1) (2) (3) (4) (5) (6) (7)
Sources: Indonesia - Statistical Yearbook 2001; Malaysia - 2000 Industrial Census; country submission; Philippines - NSO websites Table A, Summary table for manufacturing establishment with ATE of 20 and over; 2000 Census of Business and Industry Manufacturing; and Table 2 on Volume of Production Index (VoPI), January 2001-December 2002. Value added is from “Industrial Statistics in the Philippines, Problems and Solutions”, a paper presented at the Workshop on Development Indicators, Bangkok 6-10 August 2001.
Singapore - Yearbook of Statistics Singapore 2002; Thailand - websites of Nso. Notes: *) In terms of Number of Persons Enganged Philippines; In terms of average total employment (ATE) Coverage: Establishments with 10 or more persons engaged (Philippines, Singapore and Thailand) Establishments with 20 or more persons engaged (Indonesia) and **) Classification differs slightly across countries; and some of the divisions may only be represented by selected relevant
inductires ***) Figures for Thailand are proxies, based only on selected relevant industries
Philippines(1994=100)
Singapore(2003=100)
Thailand(1995=100)
Viet Nam(1994=100)
Malaysia(1993=100)
Indonesia(1993=100)
(Annual change in percentage)
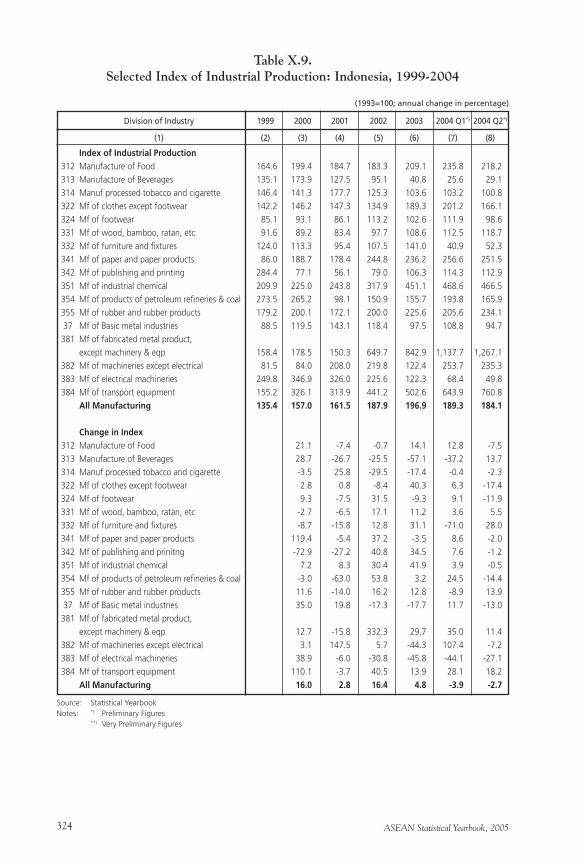
ASEAN Statistical Yearbook, 2005324
Table X.9.Selected Index of Industrial Production: Indonesia, 1999-2004
(1993=100; annual change in percentage)
Index of Industrial Production 312 Manufacture of Food 164.6 199.4 184.7 183.3 209.1 235.8 218.2
313 Manufacture of Beverages 135.1 173.9 127.5 95.1 40.8 25.6 29.1
314 Manuf processed tobacco and cigarette 146.4 141.3 177.7 125.3 103.6 103.2 100.8
322 Mf of clothes except footwear 142.2 146.2 147.3 134.9 189.3 201.2 166.1
324 Mf of footwear 85.1 93.1 86.1 113.2 102.6 111.9 98.6
331 Mf of wood, bamboo, ratan, etc 91.6 89.2 83.4 97.7 108.6 112.5 118.7
332 Mf of furniture and fixtures 124.0 113.3 95.4 107.5 141.0 40.9 52.3
341 Mf of paper and paper products 86.0 188.7 178.4 244.8 236.2 256.6 251.5
342 Mf of publishing and printing 284.4 77.1 56.1 79.0 106.3 114.3 112.9
351 Mf of industrial chemical 209.9 225.0 243.8 317.9 451.1 468.6 466.5
354 Mf of products of petroleum refineries & coal 273.5 265.2 98.1 150.9 155.7 193.8 165.9
355 Mf of rubber and rubber products 179.2 200.1 172.1 200.0 225.6 205.6 234.1
37 Mf of Basic metal industries 88.5 119.5 143.1 118.4 97.5 108.8 94.7
381 Mf of fabricated metal product,
except machinery & eqp 158.4 178.5 150.3 649.7 842.9 1,137.7 1,267.1
382 Mf of machineries except electrical 81.5 84.0 208.0 219.8 122.4 253.7 235.3
383 Mf of electrical machineries 249.8 346.9 326.0 225.6 122.3 68.4 49.8
384 Mf of transport equipment 155.2 326.1 313.9 441.2 502.6 643.9 760.8
All Manufacturing 135.4 157.0 161.5 187.9 196.9 189.3 184.1
Change in Index 312 Manufacture of Food 21.1 -7.4 -0.7 14.1 12.8 -7.5
313 Manufacture of Beverages 28.7 -26.7 -25.5 -57.1 -37.2 13.7
314 Manuf processed tobacco and cigarette -3.5 25.8 -29.5 -17.4 -0.4 -2.3
322 Mf of clothes except footwear 2.8 0.8 -8.4 40.3 6.3 -17.4
324 Mf of footwear 9.3 -7.5 31.5 -9.3 9.1 -11.9
331 Mf of wood, bamboo, ratan, etc -2.7 -6.5 17.1 11.2 3.6 5.5
332 Mf of furniture and fixtures -8.7 -15.8 12.8 31.1 -71.0 28.0
341 Mf of paper and paper products 119.4 -5.4 37.2 -3.5 8.6 -2.0
342 Mf of publishing and prinitng -72.9 -27.2 40.8 34.5 7.6 -1.2
351 Mf of industrial chemical 7.2 8.3 30.4 41.9 3.9 -0.5
354 Mf of products of petroleum refineries & coal -3.0 -63.0 53.8 3.2 24.5 -14.4
355 Mf of rubber and rubber products 11.6 -14.0 16.2 12.8 -8.9 13.9
37 Mf of Basic metal industries 35.0 19.8 -17.3 -17.7 11.7 -13.0
381 Mf of fabricated metal product,
except machinery & eqp 12.7 -15.8 332.3 29.7 35.0 11.4
382 Mf of machineries except electrical 3.1 147.5 5.7 -44.3 107.4 -7.2
383 Mf of electrical machineries 38.9 -6.0 -30.8 -45.8 -44.1 -27.1
384 Mf of transport equipment 110.1 -3.7 40.5 13.9 28.1 18.2
All Manufacturing 16.0 2.8 16.4 4.8 -3.9 -2.7
Division of Industry 1999 2000 2001 2002 2003 2004 Q1*) 2004 Q2*)
(1) (2) (3) (4) (5) (6) (7) (8)
Source: Statistical YearbookNotes: *) Preliminary Figures **) Very Preliminary Figures
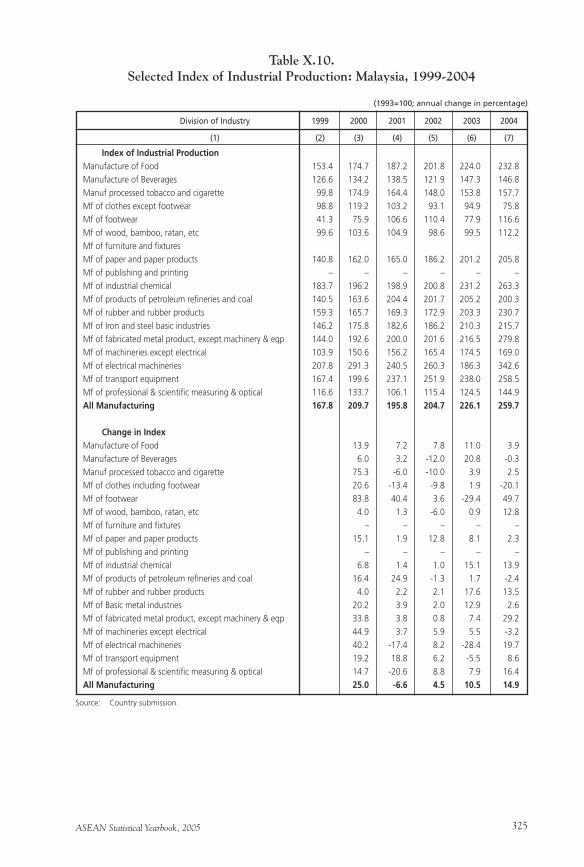
ASEAN Statistical Yearbook, 2005 325
Table X.10.Selected Index of Industrial Production: Malaysia, 1999-2004
(1993=100; annual change in percentage)
Index of Industrial ProductionManufacture of Food 153.4 174.7 187.2 201.8 224.0 232.8
Manufacture of Beverages 126.6 134.2 138.5 121.9 147.3 146.8
Manuf processed tobacco and cigarette 99.8 174.9 164.4 148.0 153.8 157.7
Mf of clothes except footwear 98.8 119.2 103.2 93.1 94.9 75.8
Mf of footwear 41.3 75.9 106.6 110.4 77.9 116.6
Mf of wood, bamboo, ratan, etc 99.6 103.6 104.9 98.6 99.5 112.2
Mf of furniture and fixtures
Mf of paper and paper products 140.8 162.0 165.0 186.2 201.2 205.8
Mf of publishing and printing – – – – – –
Mf of industrial chemical 183.7 196.2 198.9 200.8 231.2 263.3
Mf of products of petroleum refineries and coal 140.5 163.6 204.4 201.7 205.2 200.3
Mf of rubber and rubber products 159.3 165.7 169.3 172.9 203.3 230.7
Mf of Iron and steel basic industries 146.2 175.8 182.6 186.2 210.3 215.7
Mf of fabricated metal product, except machinery & eqp 144.0 192.6 200.0 201.6 216.5 279.8
Mf of machineries except electrical 103.9 150.6 156.2 165.4 174.5 169.0
Mf of electrical machineries 207.8 291.3 240.5 260.3 186.3 342.6
Mf of transport equipment 167.4 199.6 237.1 251.9 238.0 258.5
Mf of professional & scientific measuring & optical 116.6 133.7 106.1 115.4 124.5 144.9
All Manufacturing 167.8 209.7 195.8 204.7 226.1 259.7
Change in Index Manufacture of Food 13.9 7.2 7.8 11.0 3.9
Manufacture of Beverages 6.0 3.2 -12.0 20.8 -0.3
Manuf processed tobacco and cigarette 75.3 -6.0 -10.0 3.9 2.5
Mf of clothes including footwear 20.6 -13.4 -9.8 1.9 -20.1
Mf of footwear 83.8 40.4 3.6 -29.4 49.7
Mf of wood, bamboo, ratan, etc 4.0 1.3 -6.0 0.9 12.8
Mf of furniture and fixtures – – – – –
Mf of paper and paper products 15.1 1.9 12.8 8.1 2.3
Mf of publishing and printing – – – – –
Mf of industrial chemical 6.8 1.4 1.0 15.1 13.9
Mf of products of petroleum refineries and coal 16.4 24.9 -1.3 1.7 -2.4
Mf of rubber and rubber products 4.0 2.2 2.1 17.6 13.5
Mf of Basic metal industries 20.2 3.9 2.0 12.9 2.6
Mf of fabricated metal product, except machinery & eqp 33.8 3.8 0.8 7.4 29.2
Mf of machineries except electrical 44.9 3.7 5.9 5.5 -3.2
Mf of electrical machineries 40.2 -17.4 8.2 -28.4 19.7
Mf of transport equipment 19.2 18.8 6.2 -5.5 8.6
Mf of professional & scientific measuring & optical 14.7 -20.6 8.8 7.9 16.4
All Manufacturing 25.0 -6.6 4.5 10.5 14.9
Division of Industry 1999 2000 2001 2002 2003 2004
(1) (2) (3) (4) (5) (6) (7)
Source: Country submission.
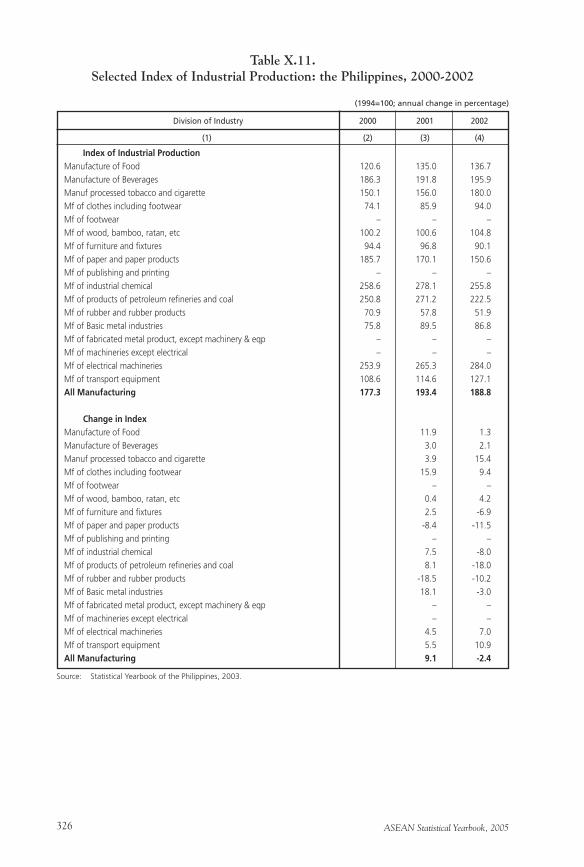
ASEAN Statistical Yearbook, 2005326
Table X.11.Selected Index of Industrial Production: the Philippines, 2000-2002
(1994=100; annual change in percentage)
Index of Industrial ProductionManufacture of Food 120.6 135.0 136.7
Manufacture of Beverages 186.3 191.8 195.9
Manuf processed tobacco and cigarette 150.1 156.0 180.0
Mf of clothes including footwear 74.1 85.9 94.0
Mf of footwear – – –
Mf of wood, bamboo, ratan, etc 100.2 100.6 104.8
Mf of furniture and fixtures 94.4 96.8 90.1
Mf of paper and paper products 185.7 170.1 150.6
Mf of publishing and printing – – –
Mf of industrial chemical 258.6 278.1 255.8
Mf of products of petroleum refineries and coal 250.8 271.2 222.5
Mf of rubber and rubber products 70.9 57.8 51.9
Mf of Basic metal industries 75.8 89.5 86.8
Mf of fabricated metal product, except machinery & eqp – – –
Mf of machineries except electrical – – –
Mf of electrical machineries 253.9 265.3 284.0
Mf of transport equipment 108.6 114.6 127.1
All Manufacturing 177.3 193.4 188.8
Change in Index Manufacture of Food 11.9 1.3
Manufacture of Beverages 3.0 2.1
Manuf processed tobacco and cigarette 3.9 15.4
Mf of clothes including footwear 15.9 9.4
Mf of footwear – –
Mf of wood, bamboo, ratan, etc 0.4 4.2
Mf of furniture and fixtures 2.5 -6.9
Mf of paper and paper products -8.4 -11.5
Mf of publishing and printing – –
Mf of industrial chemical 7.5 -8.0
Mf of products of petroleum refineries and coal 8.1 -18.0
Mf of rubber and rubber products -18.5 -10.2
Mf of Basic metal industries 18.1 -3.0
Mf of fabricated metal product, except machinery & eqp – –
Mf of machineries except electrical – –
Mf of electrical machineries 4.5 7.0
Mf of transport equipment 5.5 10.9
All Manufacturing 9.1 -2.4
Division of Industry 2000 2001 2002
(1) (2) (3) (4)
Source: Statistical Yearbook of the Philippines, 2003.
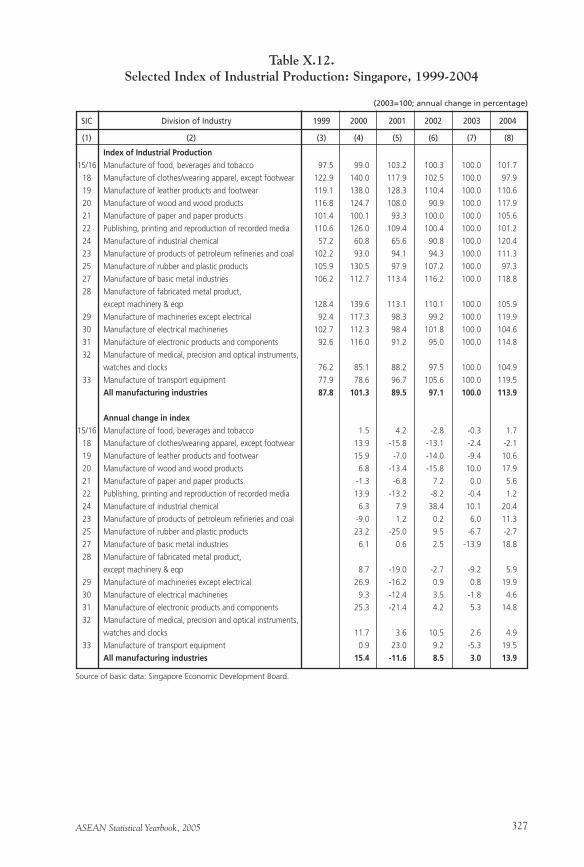
ASEAN Statistical Yearbook, 2005 327
Table X.12.Selected Index of Industrial Production: Singapore, 1999-2004
(2003=100; annual change in percentage)
Index of Industrial Production
15/16 Manufacture of food, beverages and tobacco 97.5 99.0 103.2 100.3 100.0 101.7
18 Manufacture of clothes/wearing apparel, except footwear 122.9 140.0 117.9 102.5 100.0 97.9
19 Manufacture of leather products and footwear 119.1 138.0 128.3 110.4 100.0 110.6
20 Manufacture of wood and wood products 116.8 124.7 108.0 90.9 100.0 117.9
21 Manufacture of paper and paper products 101.4 100.1 93.3 100.0 100.0 105.6
22 Publishing, printing and reproduction of recorded media 110.6 126.0 109.4 100.4 100.0 101.2
24 Manufacture of industrial chemical 57.2 60.8 65.6 90.8 100.0 120.4
23 Manufacture of products of petroleum refineries and coal 102.2 93.0 94.1 94.3 100.0 111.3
25 Manufacture of rubber and plastic products 105.9 130.5 97.9 107.2 100.0 97.3
27 Manufacture of basic metal industries 106.2 112.7 113.4 116.2 100.0 118.8
28 Manufacture of fabricated metal product,
except machinery & eqp 128.4 139.6 113.1 110.1 100.0 105.9
29 Manufacture of machineries except electrical 92.4 117.3 98.3 99.2 100.0 119.9
30 Manufacture of electrical machineries 102.7 112.3 98.4 101.8 100.0 104.6
31 Manufacture of electronic products and components 92.6 116.0 91.2 95.0 100.0 114.8
32 Manufacture of medical, precision and optical instruments,
watches and clocks 76.2 85.1 88.2 97.5 100.0 104.9
33 Manufacture of transport equipment 77.9 78.6 96.7 105.6 100.0 119.5
All manufacturing industries 87.8 101.3 89.5 97.1 100.0 113.9
Annual change in index
15/16 Manufacture of food, beverages and tobacco 1.5 4.2 -2.8 -0.3 1.7
18 Manufacture of clothes/wearing apparel, except footwear 13.9 -15.8 -13.1 -2.4 -2.1
19 Manufacture of leather products and footwear 15.9 -7.0 -14.0 -9.4 10.6
20 Manufacture of wood and wood products 6.8 -13.4 -15.8 10.0 17.9
21 Manufacture of paper and paper products -1.3 -6.8 7.2 0.0 5.6
22 Publishing, printing and reproduction of recorded media 13.9 -13.2 -8.2 -0.4 1.2
24 Manufacture of industrial chemical 6.3 7.9 38.4 10.1 20.4
23 Manufacture of products of petroleum refineries and coal -9.0 1.2 0.2 6.0 11.3
25 Manufacture of rubber and plastic products 23.2 -25.0 9.5 -6.7 -2.7
27 Manufacture of basic metal industries 6.1 0.6 2.5 -13.9 18.8
28 Manufacture of fabricated metal product,
except machinery & eqp 8.7 -19.0 -2.7 -9.2 5.9
29 Manufacture of machineries except electrical 26.9 -16.2 0.9 0.8 19.9
30 Manufacture of electrical machineries 9.3 -12.4 3.5 -1.8 4.6
31 Manufacture of electronic products and components 25.3 -21.4 4.2 5.3 14.8
32 Manufacture of medical, precision and optical instruments,
watches and clocks 11.7 3.6 10.5 2.6 4.9
33 Manufacture of transport equipment 0.9 23.0 9.2 -5.3 19.5
All manufacturing industries 15.4 -11.6 8.5 3.0 13.9
Division of Industry 1999 2000 2001 2002 2003 2004
(1) (2) (3) (4) (5) (6) (7) (8)
Source of basic data: Singapore Economic Development Board.
SIC
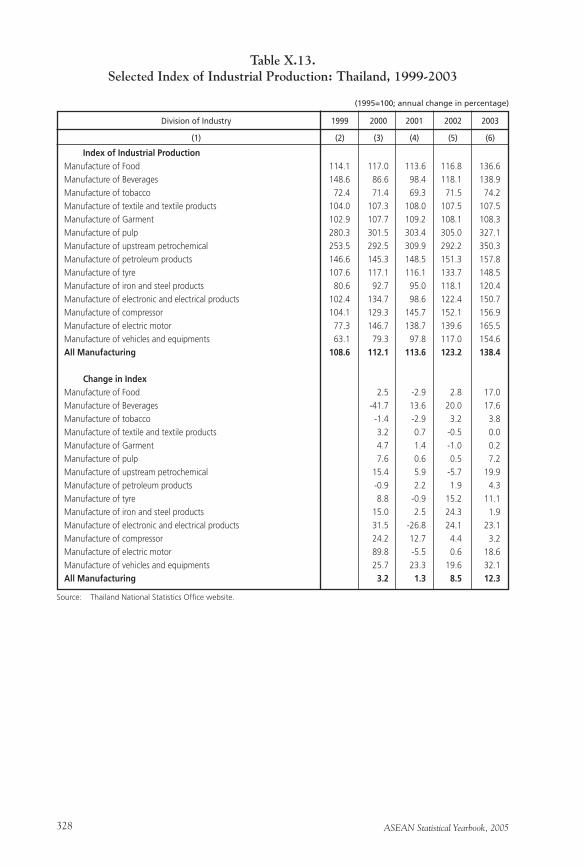
ASEAN Statistical Yearbook, 2005328
Table X.13.Selected Index of Industrial Production: Thailand, 1999-2003
(1995=100; annual change in percentage)
Index of Industrial ProductionManufacture of Food 114.1 117.0 113.6 116.8 136.6
Manufacture of Beverages 148.6 86.6 98.4 118.1 138.9
Manufacture of tobacco 72.4 71.4 69.3 71.5 74.2
Manufacture of textile and textile products 104.0 107.3 108.0 107.5 107.5
Manufacture of Garment 102.9 107.7 109.2 108.1 108.3
Manufacture of pulp 280.3 301.5 303.4 305.0 327.1
Manufacture of upstream petrochemical 253.5 292.5 309.9 292.2 350.3
Manufacture of petroleum products 146.6 145.3 148.5 151.3 157.8
Manufacture of tyre 107.6 117.1 116.1 133.7 148.5
Manufacture of iron and steel products 80.6 92.7 95.0 118.1 120.4
Manufacture of electronic and electrical products 102.4 134.7 98.6 122.4 150.7
Manufacture of compressor 104.1 129.3 145.7 152.1 156.9
Manufacture of electric motor 77.3 146.7 138.7 139.6 165.5
Manufacture of vehicles and equipments 63.1 79.3 97.8 117.0 154.6
All Manufacturing 108.6 112.1 113.6 123.2 138.4
Change in IndexManufacture of Food 2.5 -2.9 2.8 17.0
Manufacture of Beverages -41.7 13.6 20.0 17.6
Manufacture of tobacco -1.4 -2.9 3.2 3.8
Manufacture of textile and textile products 3.2 0.7 -0.5 0.0
Manufacture of Garment 4.7 1.4 -1.0 0.2
Manufacture of pulp 7.6 0.6 0.5 7.2
Manufacture of upstream petrochemical 15.4 5.9 -5.7 19.9
Manufacture of petroleum products -0.9 2.2 1.9 4.3
Manufacture of tyre 8.8 -0.9 15.2 11.1
Manufacture of iron and steel products 15.0 2.5 24.3 1.9
Manufacture of electronic and electrical products 31.5 -26.8 24.1 23.1
Manufacture of compressor 24.2 12.7 4.4 3.2
Manufacture of electric motor 89.8 -5.5 0.6 18.6
Manufacture of vehicles and equipments 25.7 23.3 19.6 32.1
All Manufacturing 3.2 1.3 8.5 12.3
Division of Industry 1999 2000 2001 2002 2003
(1) (2) (3) (4) (5) (6)
Source: Thailand National Statistics Office website.
ASEAN Statistical Yearbook, 2005 329
Chapter XIOther Social

ASEAN Statistical Yearbook, 2005330
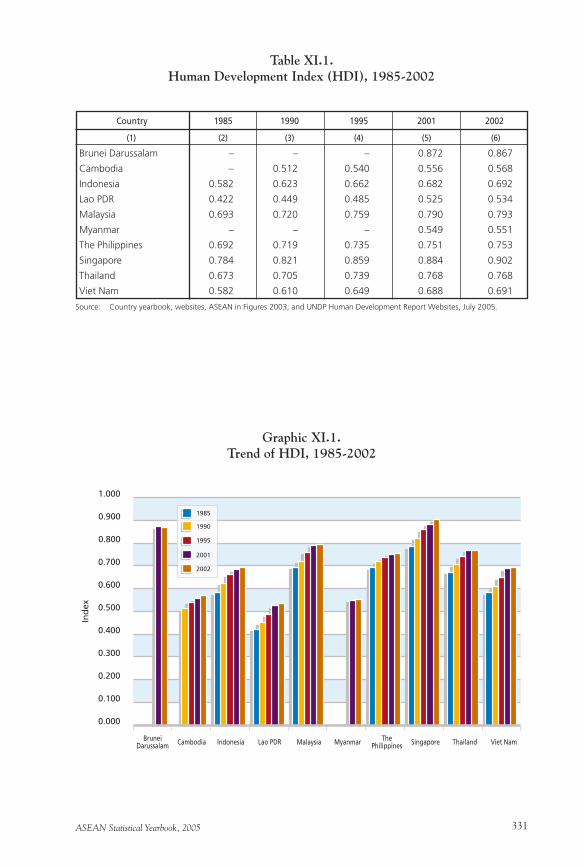
ASEAN Statistical Yearbook, 2005 331
Brunei Darussalam – – – 0.872 0.867
Cambodia – 0.512 0.540 0.556 0.568
Indonesia 0.582 0.623 0.662 0.682 0.692
Lao PDR 0.422 0.449 0.485 0.525 0.534
Malaysia 0.693 0.720 0.759 0.790 0.793
Myanmar – – – 0.549 0.551
The Philippines 0.692 0.719 0.735 0.751 0.753
Singapore 0.784 0.821 0.859 0.884 0.902
Thailand 0.673 0.705 0.739 0.768 0.768
Viet Nam 0.582 0.610 0.649 0.688 0.691
Table XI.1.Human Development Index (HDI), 1985-2002
Country
(1) (2) (3) (4) (5) (6)
Source: Country yearbook; websites, ASEAN in Figures 2003; and UNDP Human Development Report Websites, July 2005.
1985 1990 1995 2001 2002
Graphic XI.1.Trend of HDI, 1985-2002
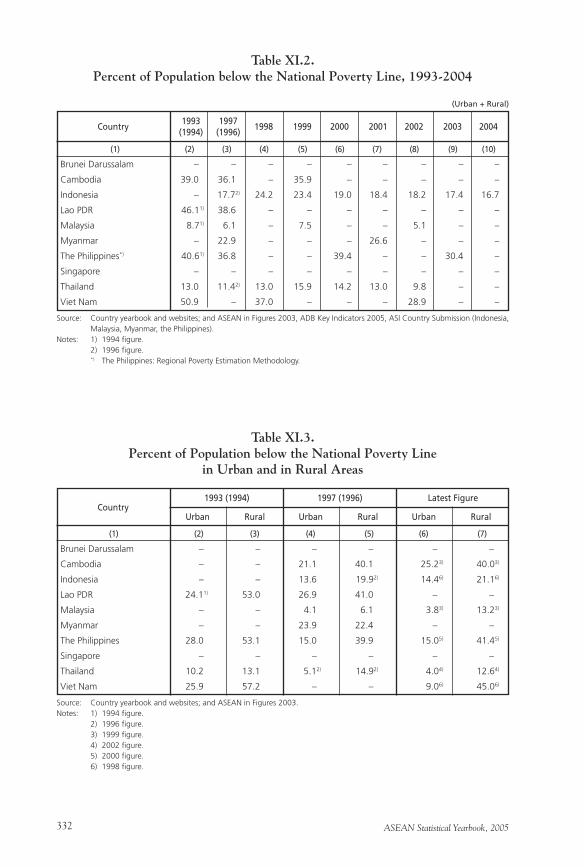
ASEAN Statistical Yearbook, 2005332
Brunei Darussalam – – – – – – – – –
Cambodia 39.0 36.1 – 35.9 – – – – –
Indonesia – 17.72) 24.2 23.4 19.0 18.4 18.2 17.4 16.7
Lao PDR 46.11) 38.6 – – – – – – –
Malaysia 8.71) 6.1 – 7.5 – – 5.1 – –
Myanmar – 22.9 – – – 26.6 – – –
The Philippines*) 40.61) 36.8 – – 39.4 – – 30.4 –
Singapore – – – – – – – – –
Thailand 13.0 11.42) 13.0 15.9 14.2 13.0 9.8 – –
Viet Nam 50.9 – 37.0 – – – 28.9 – –
1993 1997 (1994) (1996)
Table XI.2.Percent of Population below the National Poverty Line, 1993-2004
Country
(1) (2) (3) (4) (5) (6) (7) (8) (9) (10)
Source: Country yearbook and websites; and ASEAN in Figures 2003, ADB Key Indicators 2005, ASI Country Submission (Indonesia, Malaysia, Myanmar, the Philippines).
Notes: 1) 1994 figure. 2) 1996 figure. *) The Philippines: Regional Poverty Estimation Methodology.
1998 1999 2000 2001 2002 2003 2004
(Urban + Rural)
Brunei Darussalam – – – – – –
Cambodia – – 21.1 40.1 25.23) 40.03)
Indonesia – – 13.6 19.92) 14.46) 21.16)
Lao PDR 24.11) 53.0 26.9 41.0 – –
Malaysia – – 4.1 6.1 3.83) 13.23)
Myanmar – – 23.9 22.4 – –
The Philippines 28.0 53.1 15.0 39.9 15.05) 41.45)
Singapore – – – – – –
Thailand 10.2 13.1 5.12) 14.92) 4.04) 12.64)
Viet Nam 25.9 57.2 – – 9.06) 45.06)
Table XI.3.Percent of Population below the National Poverty Line
in Urban and in Rural Areas
Country
(1) (2) (3) (4) (5) (6) (7)
Source: Country yearbook and websites; and ASEAN in Figures 2003.Notes: 1) 1994 figure. 2) 1996 figure. 3) 1999 figure. 4) 2002 figure. 5) 2000 figure. 6) 1998 figure.
Urban Rural
1993 (1994) 1997 (1996) Latest Figure
Urban Rural Urban Rural
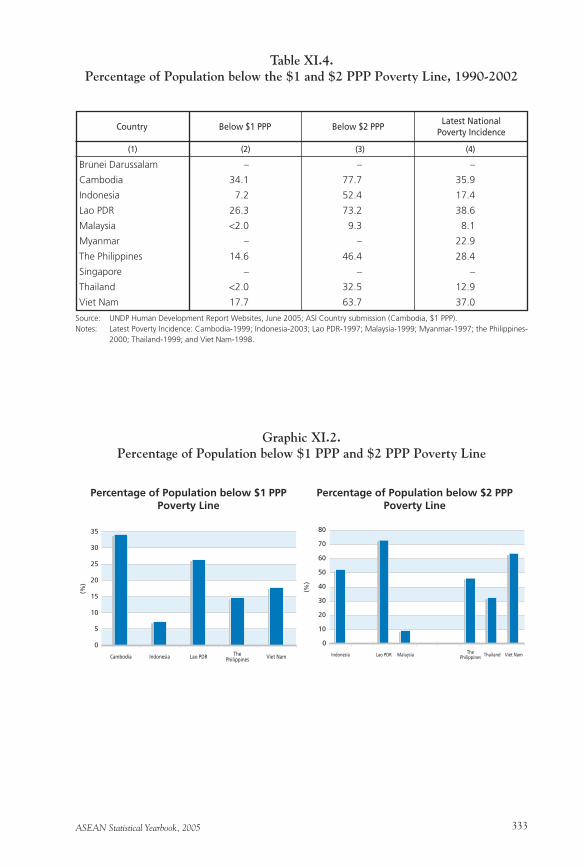
ASEAN Statistical Yearbook, 2005 333
Brunei Darussalam – – –
Cambodia 34.1 77.7 35.9
Indonesia 7.2 52.4 17.4
Lao PDR 26.3 73.2 38.6
Malaysia <2.0 9.3 8.1
Myanmar – – 22.9
The Philippines 14.6 46.4 28.4
Singapore – – –
Thailand <2.0 32.5 12.9
Viet Nam 17.7 63.7 37.0
Table XI.4.Percentage of Population below the $1 and $2 PPP Poverty Line, 1990-2002
Country
(1) (2) (3) (4)
Source: UNDP Human Development Report Websites, June 2005; ASI Country submission (Cambodia, $1 PPP).Notes: Latest Poverty Incidence: Cambodia-1999; Indonesia-2003; Lao PDR-1997; Malaysia-1999; Myanmar-1997; the Philippines-
2000; Thailand-1999; and Viet Nam-1998.
Below $1 PPP
Graphic XI.2.Percentage of Population below $1 PPP and $2 PPP Poverty Line
Below $2 PPPLatest National
Poverty Incidence
Percentage of Population below $1 PPPPoverty Line
Percentage of Population below $2 PPPPoverty Line
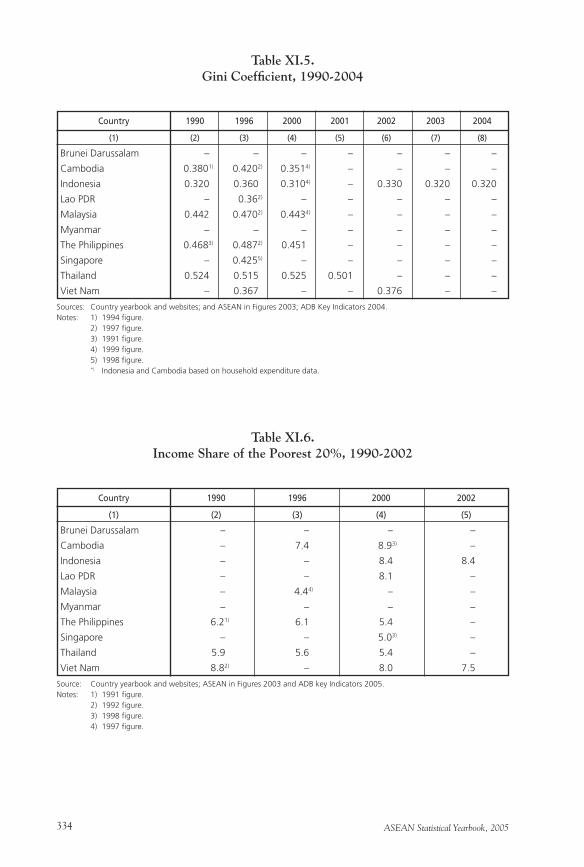
ASEAN Statistical Yearbook, 2005334
Brunei Darussalam – – – – – – –
Cambodia 0.3801) 0.4202) 0.3514) – – – –
Indonesia 0.320 0.360 0.3104) – 0.330 0.320 0.320
Lao PDR – 0.362) – – – – –
Malaysia 0.442 0.4702) 0.4434) – – – –
Myanmar – – – – – – –
The Philippines 0.4683) 0.4872) 0.451 – – – –
Singapore – 0.4255) – – – – –
Thailand 0.524 0.515 0.525 0.501 – – –
Viet Nam – 0.367 – – 0.376 – –
Table XI.5.Gini Coefficient, 1990-2004
Country 1990 1996 2000 2001 2002 2003 2004
(1) (2) (3) (4) (5) (6) (7) (8)
Sources: Country yearbook and websites; and ASEAN in Figures 2003; ADB Key Indicators 2004. Notes: 1) 1994 figure. 2) 1997 figure. 3) 1991 figure. 4) 1999 figure. 5) 1998 figure. *) Indonesia and Cambodia based on household expenditure data.
Brunei Darussalam – – – –
Cambodia – 7.4 8.93) –
Indonesia – – 8.4 8.4
Lao PDR – – 8.1 –
Malaysia – 4.44) – –
Myanmar – – – –
The Philippines 6.21) 6.1 5.4 –
Singapore – – 5.03) –
Thailand 5.9 5.6 5.4 –
Viet Nam 8.82) – 8.0 7.5
Table XI.6.Income Share of the Poorest 20%, 1990-2002
Country 1990 1996 2000 2002
(1) (2) (3) (4) (5)
Source: Country yearbook and websites; ASEAN in Figures 2003 and ADB key Indicators 2005.Notes: 1) 1991 figure. 2) 1992 figure. 3) 1998 figure. 4) 1997 figure.
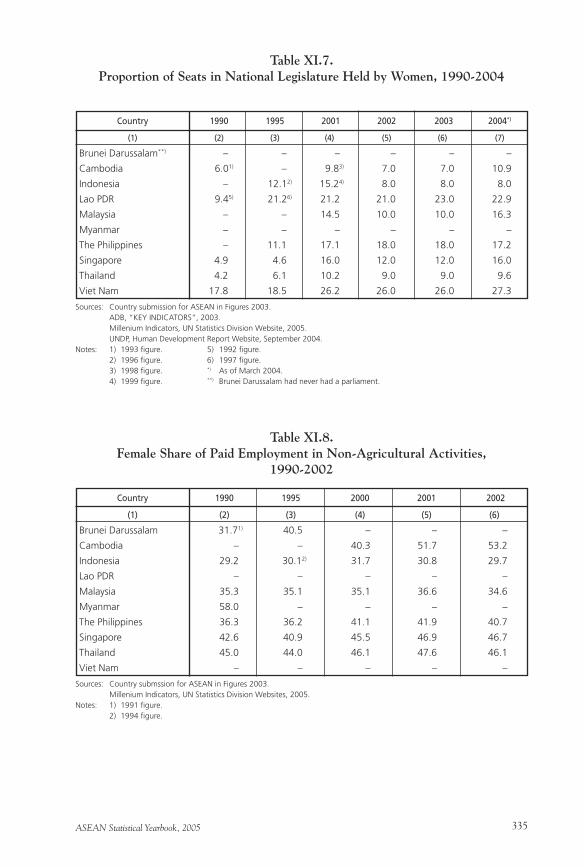
ASEAN Statistical Yearbook, 2005 335
Brunei Darussalam**) – – – – – –
Cambodia 6.01) – 9.83) 7.0 7.0 10.9
Indonesia – 12.12) 15.24) 8.0 8.0 8.0
Lao PDR 9.45) 21.26) 21.2 21.0 23.0 22.9
Malaysia – – 14.5 10.0 10.0 16.3
Myanmar – – – – – –
The Philippines – 11.1 17.1 18.0 18.0 17.2
Singapore 4.9 4.6 16.0 12.0 12.0 16.0
Thailand 4.2 6.1 10.2 9.0 9.0 9.6
Viet Nam 17.8 18.5 26.2 26.0 26.0 27.3
Table XI.7.Proportion of Seats in National Legislature Held by Women, 1990-2004
Country 1990 1995 2001 2002 2003 2004*)
(1) (2) (3) (4) (5) (6) (7)
Sources: Country submission for ASEAN in Figures 2003. ADB, “KEY INDICATORS”, 2003. Millenium Indicators, UN Statistics Division Website, 2005. UNDP, Human Development Report Website, September 2004.Notes: 1) 1993 figure. 5) 1992 figure. 2) 1996 figure. 6) 1997 figure. 3) 1998 figure. *) As of March 2004. 4) 1999 figure. **) Brunei Darussalam had never had a parliament.
Brunei Darussalam 31.71) 40.5 – – –
Cambodia – – 40.3 51.7 53.2
Indonesia 29.2 30.12) 31.7 30.8 29.7
Lao PDR – – – – –
Malaysia 35.3 35.1 35.1 36.6 34.6
Myanmar 58.0 – – – –
The Philippines 36.3 36.2 41.1 41.9 40.7
Singapore 42.6 40.9 45.5 46.9 46.7
Thailand 45.0 44.0 46.1 47.6 46.1
Viet Nam – – – – –
Table XI.8.Female Share of Paid Employment in Non-Agricultural Activities,
1990-2002
Country 1990 1995 2000 2001 2002
(1) (2) (3) (4) (5) (6)
Sources: Country submssion for ASEAN in Figures 2003. Millenium Indicators, UN Statistics Division Websites, 2005.Notes: 1) 1991 figure. 2) 1994 figure.
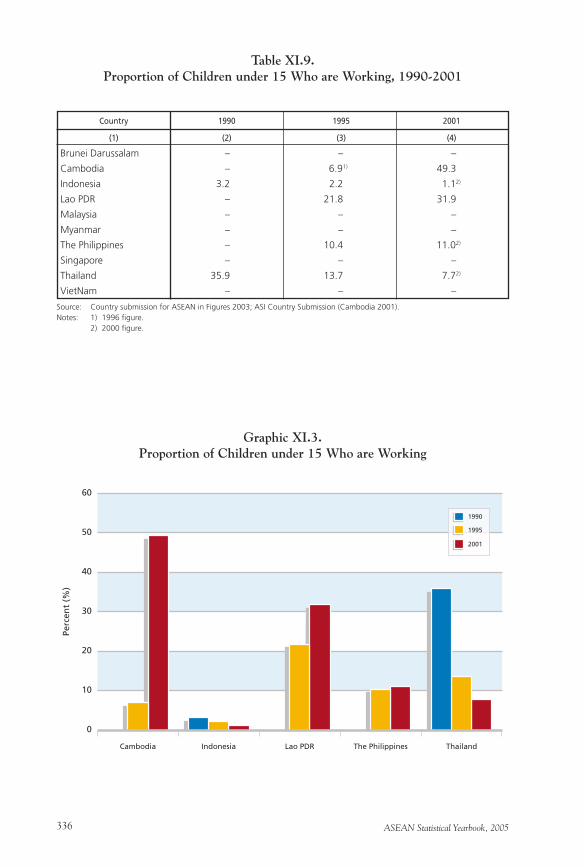
ASEAN Statistical Yearbook, 2005336
Brunei Darussalam – – –
Cambodia – 6.91) 49.3
Indonesia 3.2 2.2 1.12)
Lao PDR – 21.8 31.9
Malaysia – – –
Myanmar – – –
The Philippines – 10.4 11.02)
Singapore – – –
Thailand 35.9 13.7 7.72)
VietNam – – –
Table XI.9.Proportion of Children under 15 Who are Working, 1990-2001
(1) (2) (3) (4)
Source: Country submission for ASEAN in Figures 2003; ASI Country Submission (Cambodia 2001).Notes: 1) 1996 figure. 2) 2000 figure.
Country 1990 1995 2001
Graphic XI.3.Proportion of Children under 15 Who are Working
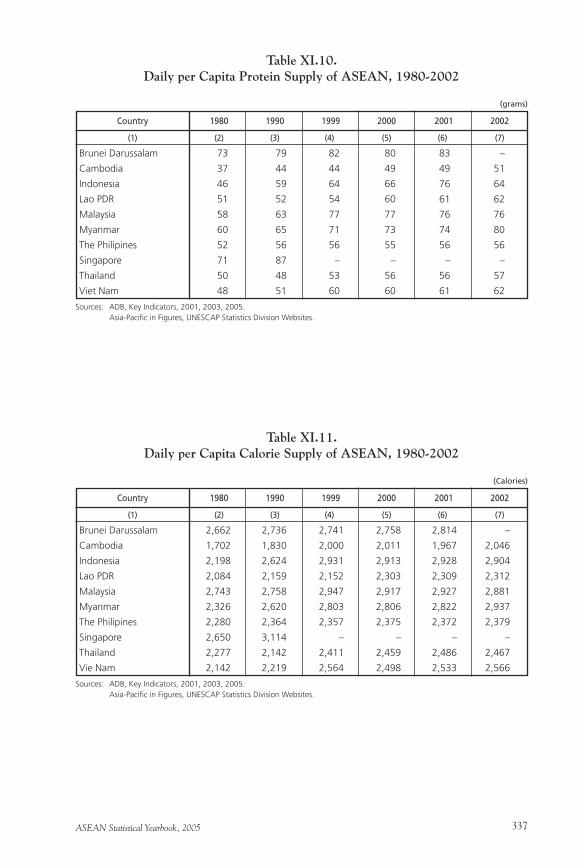
ASEAN Statistical Yearbook, 2005 337
Brunei Darussalam 73 79 82 80 83 –
Cambodia 37 44 44 49 49 51
Indonesia 46 59 64 66 76 64
Lao PDR 51 52 54 60 61 62
Malaysia 58 63 77 77 76 76
Myanmar 60 65 71 73 74 80
The Philipines 52 56 56 55 56 56
Singapore 71 87 – – – –
Thailand 50 48 53 56 56 57
Viet Nam 48 51 60 60 61 62
Table XI.10.Daily per Capita Protein Supply of ASEAN, 1980-2002
Country 1980 1990 1999 2000 2001 2002
(1) (2) (3) (4) (5) (6) (7)
Sources: ADB, Key Indicators, 2001, 2003, 2005. Asia-Pacific in Figures, UNESCAP Statistics Division Websites.
Brunei Darussalam 2,662 2,736 2,741 2,758 2,814 –
Cambodia 1,702 1,830 2,000 2,011 1,967 2,046
Indonesia 2,198 2,624 2,931 2,913 2,928 2,904
Lao PDR 2,084 2,159 2,152 2,303 2,309 2,312
Malaysia 2,743 2,758 2,947 2,917 2,927 2,881
Myanmar 2,326 2,620 2,803 2,806 2,822 2,937
The Philipines 2,280 2,364 2,357 2,375 2,372 2,379
Singapore 2,650 3,114 – – – –
Thailand 2,277 2,142 2,411 2,459 2,486 2,467
Vie Nam 2,142 2,219 2,564 2,498 2,533 2,566
Table XI.11.Daily per Capita Calorie Supply of ASEAN, 1980-2002
Country 1980 1990 1999 2000 2001 2002
(1) (2) (3) (4) (5) (6) (7)
Sources: ADB, Key Indicators, 2001, 2003, 2005. Asia-Pacific in Figures, UNESCAP Statistics Division Websites.
(grams)
(Calories)

ASEAN Statistical Yearbook, 2005338
ASEAN Statistical Yearbook, 2005 339
Chapter XIIOther Sectors

ASEAN Statistical Yearbook, 2005340
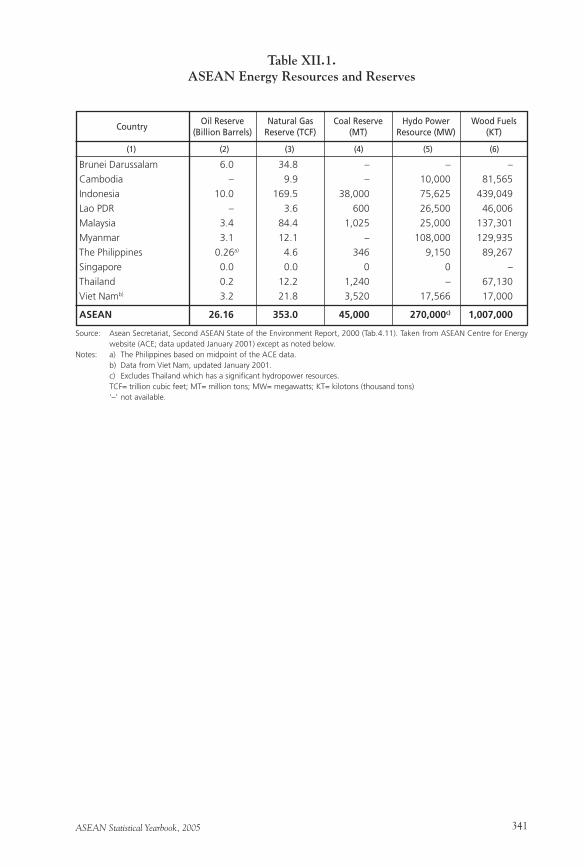
ASEAN Statistical Yearbook, 2005 341
Brunei Darussalam 6.0 34.8 – – –
Cambodia – 9.9 – 10,000 81,565
Indonesia 10.0 169.5 38,000 75,625 439,049
Lao PDR – 3.6 600 26,500 46,006
Malaysia 3.4 84.4 1,025 25,000 137,301
Myanmar 3.1 12.1 – 108,000 129,935
The Philippines 0.26a) 4.6 346 9,150 89,267
Singapore 0.0 0.0 0 0 –
Thailand 0.2 12.2 1,240 – 67,130
Viet Namb) 3.2 21.8 3,520 17,566 17,000
ASEAN 26.16 353.0 45,000 270,000c) 1,007,000
Table XII.1.ASEAN Energy Resources and Reserves
Country
(1) (2) (3) (4) (5) (6)
Source: Asean Secretariat, Second ASEAN State of the Environment Report, 2000 (Tab.4.11). Taken from ASEAN Centre for Energy website (ACE; data updated January 2001) except as noted below.
Notes: a) The Philippines based on midpoint of the ACE data. b) Data from Viet Nam, updated January 2001. c) Excludes Thailand which has a significant hydropower resources. TCF= trillion cubic feet; MT= million tons; MW= megawatts; KT= kilotons (thousand tons) ‘–’ not available.
Oil Reserve(Billion Barrels)
Natural Gas Reserve (TCF)
Coal Reserve(MT)
Wood Fuels(KT)
Hydo Power Resource (MW)
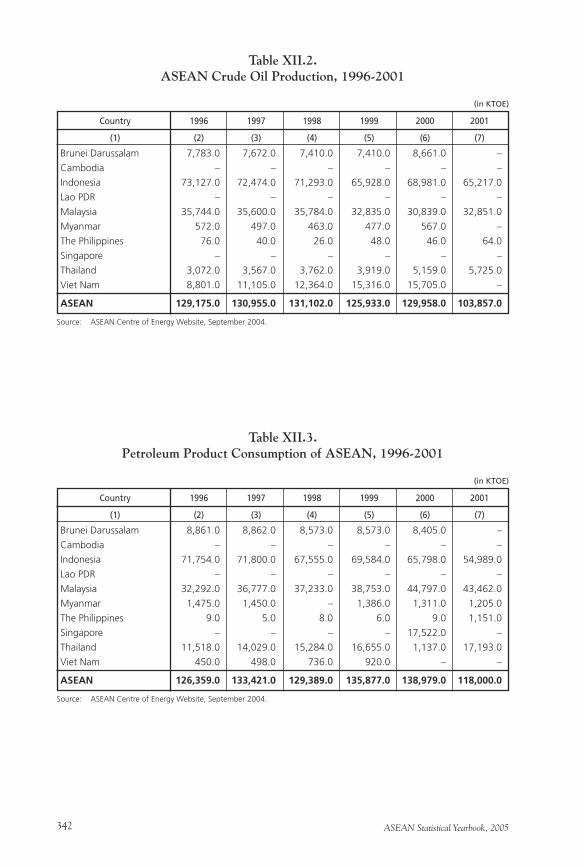
ASEAN Statistical Yearbook, 2005342
Brunei Darussalam 7,783.0 7,672.0 7,410.0 7,410.0 8,661.0 –
Cambodia – – – – – –
Indonesia 73,127.0 72,474.0 71,293.0 65,928.0 68,981.0 65,217.0
Lao PDR – – – – – –
Malaysia 35,744.0 35,600.0 35,784.0 32,835.0 30,839.0 32,851.0
Myanmar 572.0 497.0 463.0 477.0 567.0 –
The Philippines 76.0 40.0 26.0 48.0 46.0 64.0
Singapore – – – – – –
Thailand 3,072.0 3,567.0 3,762.0 3,919.0 5,159.0 5,725.0
Viet Nam 8,801.0 11,105.0 12,364.0 15,316.0 15,705.0 –
ASEAN 129,175.0 130,955.0 131,102.0 125,933.0 129,958.0 103,857.0
Table XII.2.ASEAN Crude Oil Production, 1996-2001
Country 1996 1997 1998 1999 2000 2001
(1) (2) (3) (4) (5) (6) (7)
Source: ASEAN Centre of Energy Website, September 2004.
(in KTOE)
Brunei Darussalam 8,861.0 8,862.0 8,573.0 8,573.0 8,405.0 –
Cambodia – – – – – –
Indonesia 71,754.0 71,800.0 67,555.0 69,584.0 65,798.0 54,989.0
Lao PDR – – – – – –
Malaysia 32,292.0 36,777.0 37,233.0 38,753.0 44,797.0 43,462.0
Myanmar 1,475.0 1,450.0 – 1,386.0 1,311.0 1,205.0
The Philippines 9.0 5.0 8.0 6.0 9.0 1,151.0
Singapore – – – – 17,522.0 –
Thailand 11,518.0 14,029.0 15,284.0 16,655.0 1,137.0 17,193.0
Viet Nam 450.0 498.0 736.0 920.0 – –
ASEAN 126,359.0 133,421.0 129,389.0 135,877.0 138,979.0 118,000.0
Table XII.3.Petroleum Product Consumption of ASEAN, 1996-2001
Country 1996 1997 1998 1999 2000 2001
(1) (2) (3) (4) (5) (6) (7)
Source: ASEAN Centre of Energy Website, September 2004.
(in KTOE)
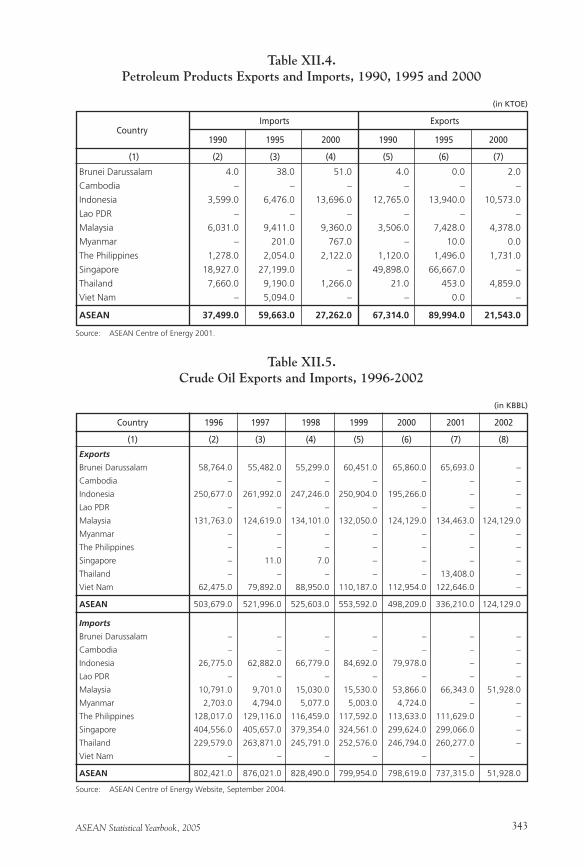
ASEAN Statistical Yearbook, 2005 343
Brunei Darussalam 4.0 38.0 51.0 4.0 0.0 2.0
Cambodia – – – – – –
Indonesia 3,599.0 6,476.0 13,696.0 12,765.0 13,940.0 10,573.0
Lao PDR – – – – – –
Malaysia 6,031.0 9,411.0 9,360.0 3,506.0 7,428.0 4,378.0
Myanmar – 201.0 767.0 – 10.0 0.0
The Philippines 1,278.0 2,054.0 2,122.0 1,120.0 1,496.0 1,731.0
Singapore 18,927.0 27,199.0 – 49,898.0 66,667.0 –
Thailand 7,660.0 9,190.0 1,266.0 21.0 453.0 4,859.0
Viet Nam – 5,094.0 – – 0.0 –
ASEAN 37,499.0 59,663.0 27,262.0 67,314.0 89,994.0 21,543.0
Table XII.4.Petroleum Products Exports and Imports, 1990, 1995 and 2000
Country
(1) (2) (3) (4) (5) (6) (7)
Source: ASEAN Centre of Energy 2001.
(in KTOE)
Exports
Brunei Darussalam 58,764.0 55,482.0 55,299.0 60,451.0 65,860.0 65,693.0 –
Cambodia – – – – – – –
Indonesia 250,677.0 261,992.0 247,246.0 250,904.0 195,266.0 – –
Lao PDR – – – – – – –
Malaysia 131,763.0 124,619.0 134,101.0 132,050.0 124,129.0 134,463.0 124,129.0
Myanmar – – – – – – –
The Philippines – – – – – – –
Singapore – 11.0 7.0 – – – –
Thailand – – – – – 13,408.0 –
Viet Nam 62,475.0 79,892.0 88,950.0 110,187.0 112,954.0 122,646.0 –
ASEAN 503,679.0 521,996.0 525,603.0 553,592.0 498,209.0 336,210.0 124,129.0
Imports
Brunei Darussalam – – – – – – –
Cambodia – – – – – – –
Indonesia 26,775.0 62,882.0 66,779.0 84,692.0 79,978.0 – –
Lao PDR – – – – – – –
Malaysia 10,791.0 9,701.0 15,030.0 15,530.0 53,866.0 66,343.0 51,928.0
Myanmar 2,703.0 4,794.0 5,077.0 5,003.0 4,724.0 – –
The Philippines 128,017.0 129,116.0 116,459.0 117,592.0 113,633.0 111,629.0 –
Singapore 404,556.0 405,657.0 379,354.0 324,561.0 299,624.0 299,066.0 –
Thailand 229,579.0 263,871.0 245,791.0 252,576.0 246,794.0 260,277.0 –
Viet Nam – – – – – –
ASEAN 802,421.0 876,021.0 828,490.0 799,954.0 798,619.0 737,315.0 51,928.0
Table XII.5.Crude Oil Exports and Imports, 1996-2002
Country 1996 1997 1998 1999 2000 2001 2002
(1) (2) (3) (4) (5) (6) (7) (8)
Source: ASEAN Centre of Energy Website, September 2004.
(in KBBL)
1990 1995 2000 1990 1995 2000
Imports Exports
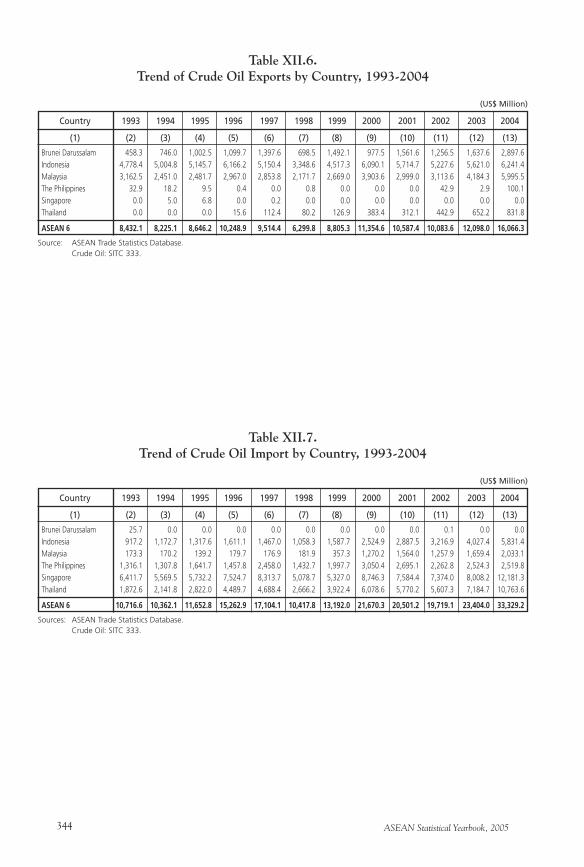
ASEAN Statistical Yearbook, 2005344
Table XII.6.Trend of Crude Oil Exports by Country, 1993-2004
(1) (2) (3) (4) (5) (6) (7) (8) (9) (10) (11) (12) (13)
Country 1993 1994 1995 1996 1997 1998 1999 2000 2001 2002 2003 2004
Brunei Darussalam 458.3 746.0 1,002.5 1,099.7 1,397.6 698.5 1,492.1 977.5 1,561.6 1,256.5 1,637.6 2,897.6Indonesia 4,778.4 5,004.8 5,145.7 6,166.2 5,150.4 3,348.6 4,517.3 6,090.1 5,714.7 5,227.6 5,621.0 6,241.4Malaysia 3,162.5 2,451.0 2,481.7 2,967.0 2,853.8 2,171.7 2,669.0 3,903.6 2,999.0 3,113.6 4,184.3 5,995.5The Philippines 32.9 18.2 9.5 0.4 0.0 0.8 0.0 0.0 0.0 42.9 2.9 100.1Singapore 0.0 5.0 6.8 0.0 0.2 0.0 0.0 0.0 0.0 0.0 0.0 0.0Thailand 0.0 0.0 0.0 15.6 112.4 80.2 126.9 383.4 312.1 442.9 652.2 831.8
ASEAN 6 8,432.1 8,225.1 8,646.2 10,248.9 9,514.4 6,299.8 8,805.3 11,354.6 10,587.4 10,083.6 12,098.0 16,066.3
Source: ASEAN Trade Statistics Database. Crude Oil: SITC 333.
(US$ Million)
Table XII.7.Trend of Crude Oil Import by Country, 1993-2004
(1) (2) (3) (4) (5) (6) (7) (8) (9) (10) (11) (12) (13)
Country 1993 1994 1995 1996 1997 1998 1999 2000 2001 2002 2003 2004
Brunei Darussalam 25.7 0.0 0.0 0.0 0.0 0.0 0.0 0.0 0.0 0.1 0.0 0.0Indonesia 917.2 1,172.7 1,317.6 1,611.1 1,467.0 1,058.3 1,587.7 2,524.9 2,887.5 3,216.9 4,027.4 5,831.4Malaysia 173.3 170.2 139.2 179.7 176.9 181.9 357.3 1,270.2 1,564.0 1,257.9 1,659.4 2,033.1The Philippines 1,316.1 1,307.8 1,641.7 1,457.8 2,458.0 1,432.7 1,997.7 3,050.4 2,695.1 2,262.8 2,524.3 2,519.8Singapore 6,411.7 5,569.5 5,732.2 7,524.7 8,313.7 5,078.7 5,327.0 8,746.3 7,584.4 7,374.0 8,008.2 12,181.3Thailand 1,872.6 2,141.8 2,822.0 4,489.7 4,688.4 2,666.2 3,922.4 6,078.6 5,770.2 5,607.3 7,184.7 10,763.6
ASEAN 6 10,716.6 10,362.1 11,652.8 15,262.9 17,104.1 10,417.8 13,192.0 21,670.3 20,501.2 19,719.1 23,404.0 33,329.2
Sources: ASEAN Trade Statistics Database. Crude Oil: SITC 333.
(US$ Million)
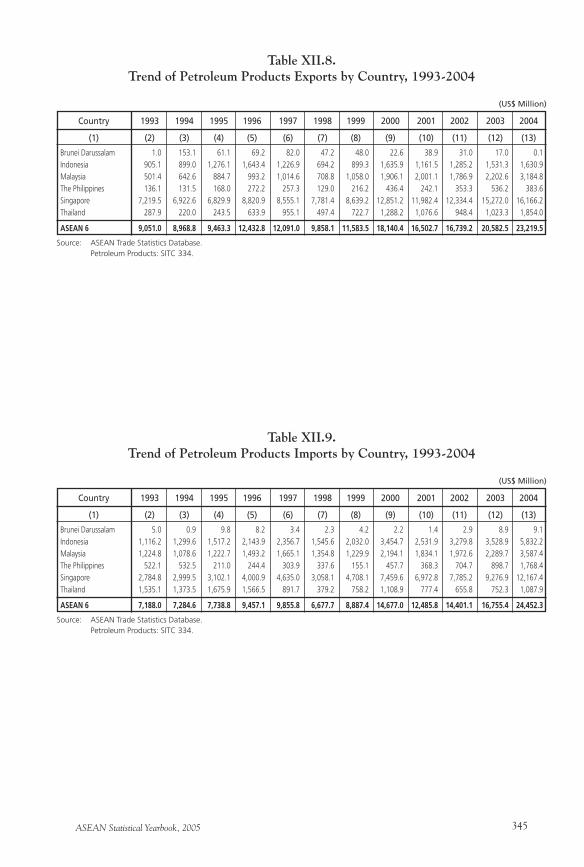
ASEAN Statistical Yearbook, 2005 345
Table XII.8.Trend of Petroleum Products Exports by Country, 1993-2004
(1) (2) (3) (4) (5) (6) (7) (8) (9) (10) (11) (12) (13)
Country 1993 1994 1995 1996 1997 1998 1999 2000 2001 2002 2003 2004
Brunei Darussalam 1.0 153.1 61.1 69.2 82.0 47.2 48.0 22.6 38.9 31.0 17.0 0.1Indonesia 905.1 899.0 1,276.1 1,643.4 1,226.9 694.2 899.3 1,635.9 1,161.5 1,285.2 1,531.3 1,630.9Malaysia 501.4 642.6 884.7 993.2 1,014.6 708.8 1,058.0 1,906.1 2,001.1 1,786.9 2,202.6 3,184.8The Philippines 136.1 131.5 168.0 272.2 257.3 129.0 216.2 436.4 242.1 353.3 536.2 383.6Singapore 7,219.5 6,922.6 6,829.9 8,820.9 8,555.1 7,781.4 8,639.2 12,851.2 11,982.4 12,334.4 15,272.0 16,166.2Thailand 287.9 220.0 243.5 633.9 955.1 497.4 722.7 1,288.2 1,076.6 948.4 1,023.3 1,854.0
ASEAN 6 9,051.0 8,968.8 9,463.3 12,432.8 12,091.0 9,858.1 11,583.5 18,140.4 16,502.7 16,739.2 20,582.5 23,219.5
Source: ASEAN Trade Statistics Database. Petroleum Products: SITC 334.
(US$ Million)
Table XII.9.Trend of Petroleum Products Imports by Country, 1993-2004
(1) (2) (3) (4) (5) (6) (7) (8) (9) (10) (11) (12) (13)
Country 1993 1994 1995 1996 1997 1998 1999 2000 2001 2002 2003 2004
Brunei Darussalam 5.0 0.9 9.8 8.2 3.4 2.3 4.2 2.2 1.4 2.9 8.9 9.1Indonesia 1,116.2 1,299.6 1,517.2 2,143.9 2,356.7 1,545.6 2,032.0 3,454.7 2,531.9 3,279.8 3,528.9 5,832.2Malaysia 1,224.8 1,078.6 1,222.7 1,493.2 1,665.1 1,354.8 1,229.9 2,194.1 1,834.1 1,972.6 2,289.7 3,587.4The Philippines 522.1 532.5 211.0 244.4 303.9 337.6 155.1 457.7 368.3 704.7 898.7 1,768.4Singapore 2,784.8 2,999.5 3,102.1 4,000.9 4,635.0 3,058.1 4,708.1 7,459.6 6,972.8 7,785.2 9,276.9 12,167.4Thailand 1,535.1 1,373.5 1,675.9 1,566.5 891.7 379.2 758.2 1,108.9 777.4 655.8 752.3 1,087.9
ASEAN 6 7,188.0 7,284.6 7,738.8 9,457.1 9,855.8 6,677.7 8,887.4 14,677.0 12,485.8 14,401.1 16,755.4 24,452.3
Source: ASEAN Trade Statistics Database. Petroleum Products: SITC 334.
(US$ Million)
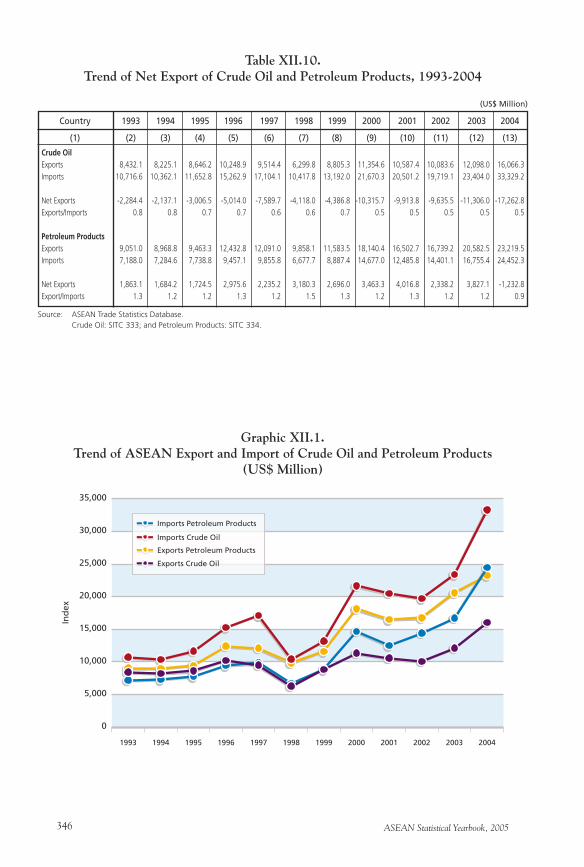
ASEAN Statistical Yearbook, 2005346
Table XII.10.Trend of Net Export of Crude Oil and Petroleum Products, 1993-2004
(1) (2) (3) (4) (5) (6) (7) (8) (9) (10) (11) (12) (13)
Country 1993 1994 1995 1996 1997 1998 1999 2000 2001 2002 2003 2004
Crude OilExports 8,432.1 8,225.1 8,646.2 10,248.9 9,514.4 6,299.8 8,805.3 11,354.6 10,587.4 10,083.6 12,098.0 16,066.3Imports 10,716.6 10,362.1 11,652.8 15,262.9 17,104.1 10,417.8 13,192.0 21,670.3 20,501.2 19,719.1 23,404.0 33,329.2
Net Exports -2,284.4 -2,137.1 -3,006.5 -5,014.0 -7,589.7 -4,118.0 -4,386.8 -10,315.7 -9,913.8 -9,635.5 -11,306.0 -17,262.8Exports/Imports 0.8 0.8 0.7 0.7 0.6 0.6 0.7 0.5 0.5 0.5 0.5 0.5
Petroleum ProductsExports 9,051.0 8,968.8 9,463.3 12,432.8 12,091.0 9,858.1 11,583.5 18,140.4 16,502.7 16,739.2 20,582.5 23,219.5Imports 7,188.0 7,284.6 7,738.8 9,457.1 9,855.8 6,677.7 8,887.4 14,677.0 12,485.8 14,401.1 16,755.4 24,452.3
Net Exports 1,863.1 1,684.2 1,724.5 2,975.6 2,235.2 3,180.3 2,696.0 3,463.3 4,016.8 2,338.2 3,827.1 -1,232.8Export/Imports 1.3 1.2 1.2 1.3 1.2 1.5 1.3 1.2 1.3 1.2 1.2 0.9
Source: ASEAN Trade Statistics Database. Crude Oil: SITC 333; and Petroleum Products: SITC 334.
(US$ Million)
Graphic XII.1.Trend of ASEAN Export and Import of Crude Oil and Petroleum Products
(US$ Million)
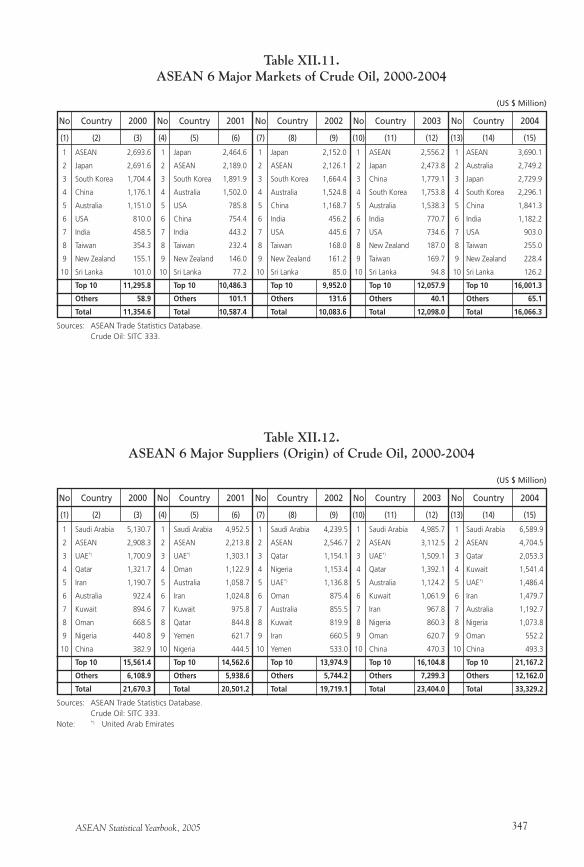
ASEAN Statistical Yearbook, 2005 347
1 ASEAN 2,693.6 1 Japan 2,464.6 1 Japan 2,152.0 1 ASEAN 2,556.2 1 ASEAN 3,690.1
2 Japan 2,691.6 2 ASEAN 2,189.0 2 ASEAN 2,126.1 2 Japan 2,473.8 2 Australia 2,749.2
3 South Korea 1,704.4 3 South Korea 1,891.9 3 South Korea 1,664.4 3 China 1,779.1 3 Japan 2,729.9
4 China 1,176.1 4 Australia 1,502.0 4 Australia 1,524.8 4 South Korea 1,753.8 4 South Korea 2,296.1
5 Australia 1,151.0 5 USA 785.8 5 China 1,168.7 5 Australia 1,538.3 5 China 1,841.3
6 USA 810.0 6 China 754.4 6 India 456.2 6 India 770.7 6 India 1,182.2
7 India 458.5 7 India 443.2 7 USA 445.6 7 USA 734.6 7 USA 903.0
8 Taiwan 354.3 8 Taiwan 232.4 8 Taiwan 168.0 8 New Zealand 187.0 8 Taiwan 255.0
9 New Zealand 155.1 9 New Zealand 146.0 9 New Zealand 161.2 9 Taiwan 169.7 9 New Zealand 228.4
10 Sri Lanka 101.0 10 Sri Lanka 77.2 10 Sri Lanka 85.0 10 Sri Lanka 94.8 10 Sri Lanka 126.2
Top 10 11,295.8 Top 10 10,486.3 Top 10 9,952.0 Top 10 12,057.9 Top 10 16,001.3
Others 58.9 Others 101.1 Others 131.6 Others 40.1 Others 65.1
Total 11,354.6 Total 10,587.4 Total 10,083.6 Total 12,098.0 Total 16,066.3
Sources: ASEAN Trade Statistics Database. Crude Oil: SITC 333.
(1) (2) (3)
No Country 2000
(US $ Million)
Table XII.11.ASEAN 6 Major Markets of Crude Oil, 2000-2004
(4) (5) (6)
No Country 2001
(7) (8) (9)
No Country 2002
(10) (11) (12)
No Country 2003
(13) (14) (15)
No Country 2004
1 Saudi Arabia 5,130.7 1 Saudi Arabia 4,952.5 1 Saudi Arabia 4,239.5 1 Saudi Arabia 4,985.7 1 Saudi Arabia 6,589.9
2 ASEAN 2,908.3 2 ASEAN 2,213.8 2 ASEAN 2,546.7 2 ASEAN 3,112.5 2 ASEAN 4,704.5
3 UAE*) 1,700.9 3 UAE*) 1,303.1 3 Qatar 1,154.1 3 UAE*) 1,509.1 3 Qatar 2,053.3
4 Qatar 1,321.7 4 Oman 1,122.9 4 Nigeria 1,153.4 4 Qatar 1,392.1 4 Kuwait 1,541.4
5 Iran 1,190.7 5 Australia 1,058.7 5 UAE*) 1,136.8 5 Australia 1,124.2 5 UAE*) 1,486.4
6 Australia 922.4 6 Iran 1,024.8 6 Oman 875.4 6 Kuwait 1,061.9 6 Iran 1,479.7
7 Kuwait 894.6 7 Kuwait 975.8 7 Australia 855.5 7 Iran 967.8 7 Australia 1,192.7
8 Oman 668.5 8 Qatar 844.8 8 Kuwait 819.9 8 Nigeria 860.3 8 Nigeria 1,073.8
9 Nigeria 440.8 9 Yemen 621.7 9 Iran 660.5 9 Oman 620.7 9 Oman 552.2
10 China 382.9 10 Nigeria 444.5 10 Yemen 533.0 10 China 470.3 10 China 493.3
Top 10 15,561.4 Top 10 14,562.6 Top 10 13,974.9 Top 10 16,104.8 Top 10 21,167.2
Others 6,108.9 Others 5,938.6 Others 5,744.2 Others 7,299.3 Others 12,162.0
Total 21,670.3 Total 20,501.2 Total 19,719.1 Total 23,404.0 Total 33,329.2
Sources: ASEAN Trade Statistics Database. Crude Oil: SITC 333.Note: *) United Arab Emirates
(1) (2) (3)
No Country 2000
(US $ Million)
Table XII.12.ASEAN 6 Major Suppliers (Origin) of Crude Oil, 2000-2004
(4) (5) (6)
No Country 2001
(7) (8) (9)
No Country 2002
(10) (11) (12)
No Country 2003
(13) (14) (15)
No Country 2004
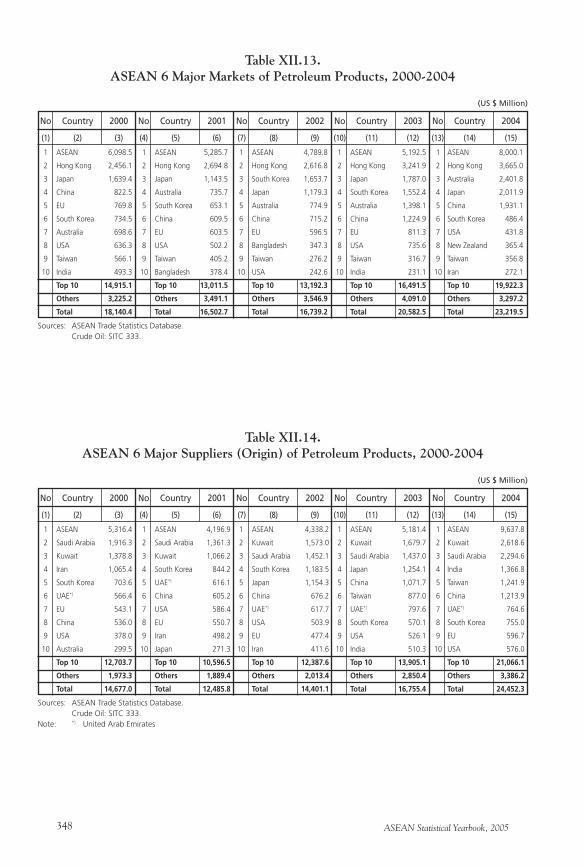
ASEAN Statistical Yearbook, 2005348
1 ASEAN 6,098.5 1 ASEAN 5,285.7 1 ASEAN 4,789.8 1 ASEAN 5,192.5 1 ASEAN 8,000.1
2 Hong Kong 2,456.1 2 Hong Kong 2,694.8 2 Hong Kong 2,616.8 2 Hong Kong 3,241.9 2 Hong Kong 3,665.0
3 Japan 1,639.4 3 Japan 1,143.5 3 South Korea 1,653.7 3 Japan 1,787.0 3 Australia 2,401.8
4 China 822.5 4 Australia 735.7 4 Japan 1,179.3 4 South Korea 1,552.4 4 Japan 2,011.9
5 EU 769.8 5 South Korea 653.1 5 Australia 774.9 5 Australia 1,398.1 5 China 1,931.1
6 South Korea 734.5 6 China 609.5 6 China 715.2 6 China 1,224.9 6 South Korea 486.4
7 Australia 698.6 7 EU 603.5 7 EU 596.5 7 EU 811.3 7 USA 431.8
8 USA 636.3 8 USA 502.2 8 Bangladesh 347.3 8 USA 735.6 8 New Zealand 365.4
9 Taiwan 566.1 9 Taiwan 405.2 9 Taiwan 276.2 9 Taiwan 316.7 9 Taiwan 356.8
10 India 493.3 10 Bangladesh 378.4 10 USA 242.6 10 India 231.1 10 Iran 272.1
Top 10 14,915.1 Top 10 13,011.5 Top 10 13,192.3 Top 10 16,491.5 Top 10 19,922.3
Others 3,225.2 Others 3,491.1 Others 3,546.9 Others 4,091.0 Others 3,297.2
Total 18,140.4 Total 16,502.7 Total 16,739.2 Total 20,582.5 Total 23,219.5
Sources: ASEAN Trade Statistics Database. Crude Oil: SITC 333.
(1) (2) (3)
No Country 2000
(US $ Million)
Table XII.13.ASEAN 6 Major Markets of Petroleum Products, 2000-2004
(4) (5) (6)
No Country 2001
(7) (8) (9)
No Country 2002
(10) (11) (12)
No Country 2003
(13) (14) (15)
No Country 2004
1 ASEAN 5,316.4 1 ASEAN 4,196.9 1 ASEAN 4,338.2 1 ASEAN 5,181.4 1 ASEAN 9,637.8
2 Saudi Arabia 1,916.3 2 Saudi Arabia 1,361.3 2 Kuwait 1,573.0 2 Kuwait 1,679.7 2 Kuwait 2,618.6
3 Kuwait 1,378.8 3 Kuwait 1,066.2 3 Saudi Arabia 1,452.1 3 Saudi Arabia 1,437.0 3 Saudi Arabia 2,294.6
4 Iran 1,065.4 4 South Korea 844.2 4 South Korea 1,183.5 4 Japan 1,254.1 4 India 1,366.8
5 South Korea 703.6 5 UAE*) 616.1 5 Japan 1,154.3 5 China 1,071.7 5 Taiwan 1,241.9
6 UAE*) 566.4 6 China 605.2 6 China 676.2 6 Taiwan 877.0 6 China 1,213.9
7 EU 543.1 7 USA 586.4 7 UAE*) 617.7 7 UAE*) 797.6 7 UAE*) 764.6
8 China 536.0 8 EU 550.7 8 USA 503.9 8 South Korea 570.1 8 South Korea 755.0
9 USA 378.0 9 Iran 498.2 9 EU 477.4 9 USA 526.1 9 EU 596.7
10 Australia 299.5 10 Japan 271.3 10 Iran 411.6 10 India 510.3 10 USA 576.0
Top 10 12,703.7 Top 10 10,596.5 Top 10 12,387.6 Top 10 13,905.1 Top 10 21,066.1
Others 1,973.3 Others 1,889.4 Others 2,013.4 Others 2,850.4 Others 3,386.2
Total 14,677.0 Total 12,485.8 Total 14,401.1 Total 16,755.4 Total 24,452.3
Sources: ASEAN Trade Statistics Database. Crude Oil: SITC 333.Note: *) United Arab Emirates
(1) (2) (3)
No Country 2000
(US $ Million)
Table XII.14.ASEAN 6 Major Suppliers (Origin) of Petroleum Products, 2000-2004
(4) (5) (6)
No Country 2001
(7) (8) (9)
No Country 2002
(10) (11) (12)
No Country 2003
(13) (14) (15)
No Country 2004
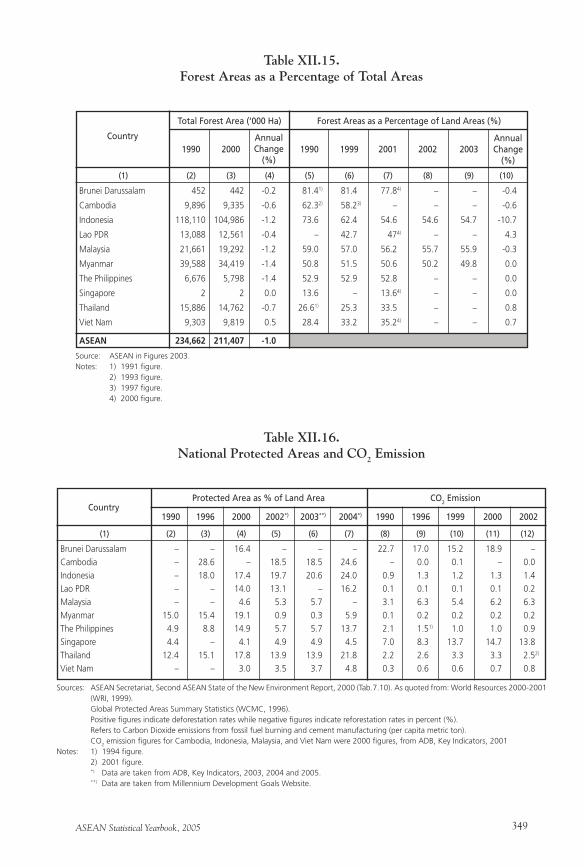
ASEAN Statistical Yearbook, 2005 349
Brunei Darussalam 452 442 -0.2 81.41) 81.4 77.84) – – -0.4
Cambodia 9,896 9,335 -0.6 62.32) 58.23) – – – -0.6
Indonesia 118,110 104,986 -1.2 73.6 62.4 54.6 54.6 54.7 -10.7
Lao PDR 13,088 12,561 -0.4 – 42.7 474) – – 4.3
Malaysia 21,661 19,292 -1.2 59.0 57.0 56.2 55.7 55.9 -0.3
Myanmar 39,588 34,419 -1.4 50.8 51.5 50.6 50.2 49.8 0.0
The Philippines 6,676 5,798 -1.4 52.9 52.9 52.8 – – 0.0
Singapore 2 2 0.0 13.6 – 13.64) – – 0.0
Thailand 15,886 14,762 -0.7 26.61) 25.3 33.5 – – 0.8
Viet Nam 9,303 9,819 0.5 28.4 33.2 35.24) – – 0.7
ASEAN 234,662 211,407 -1.0
Table XII.15.Forest Areas as a Percentage of Total Areas
Country
(1) (2) (3) (4) (5) (6) (7) (8) (9) (10)
Source: ASEAN in Figures 2003.Notes: 1) 1991 figure. 2) 1993 figure. 3) 1997 figure. 4) 2000 figure.
1990 2000Annual Change
(%)
Total Forest Area (‘000 Ha) Forest Areas as a Percentage of Land Areas (%)
1990 1999 2001 2002 2003Annual Change
(%)
Brunei Darussalam – – 16.4 – – – 22.7 17.0 15.2 18.9 –
Cambodia – 28.6 – 18.5 18.5 24.6 – 0.0 0.1 – 0.0
Indonesia – 18.0 17.4 19.7 20.6 24.0 0.9 1.3 1.2 1.3 1.4
Lao PDR – – 14.0 13.1 – 16.2 0.1 0.1 0.1 0.1 0.2
Malaysia – – 4.6 5.3 5.7 – 3.1 6.3 5.4 6.2 6.3
Myanmar 15.0 15.4 19.1 0.9 0.3 5.9 0.1 0.2 0.2 0.2 0.2
The Philippines 4.9 8.8 14.9 5.7 5.7 13.7 2.1 1.51) 1.0 1.0 0.9
Singapore 4.4 – 4.1 4.9 4.9 4.5 7.0 8.3 13.7 14.7 13.8
Thailand 12.4 15.1 17.8 13.9 13.9 21.8 2.2 2.6 3.3 3.3 2.52)
Viet Nam – – 3.0 3.5 3.7 4.8 0.3 0.6 0.6 0.7 0.8
Table XII.16.National Protected Areas and CO2 Emission
(1) (2) (3) (4) (5) (6) (7) (8) (9) (10) (11) (12)
Country
Sources: ASEAN Secretariat, Second ASEAN State of the New Environment Report, 2000 (Tab.7.10). As quoted from: World Resources 2000-2001 (WRI, 1999).
Global Protected Areas Summary Statistics (WCMC, 1996). Positive figures indicate deforestation rates while negative figures indicate reforestation rates in percent (%). Refers to Carbon Dioxide emissions from fossil fuel burning and cement manufacturing (per capita metric ton). CO
2 emission figures for Cambodia, Indonesia, Malaysia, and Viet Nam were 2000 figures, from ADB, Key Indicators, 2001
Notes: 1) 1994 figure. 2) 2001 figure. *) Data are taken from ADB, Key Indicators, 2003, 2004 and 2005. **) Data are taken from Millennium Development Goals Website.
1990 1996 2000 2002*) 2003**) 2004*) 1990 1996 1999 2000 2002
Protected Area as % of Land Area CO2 Emission
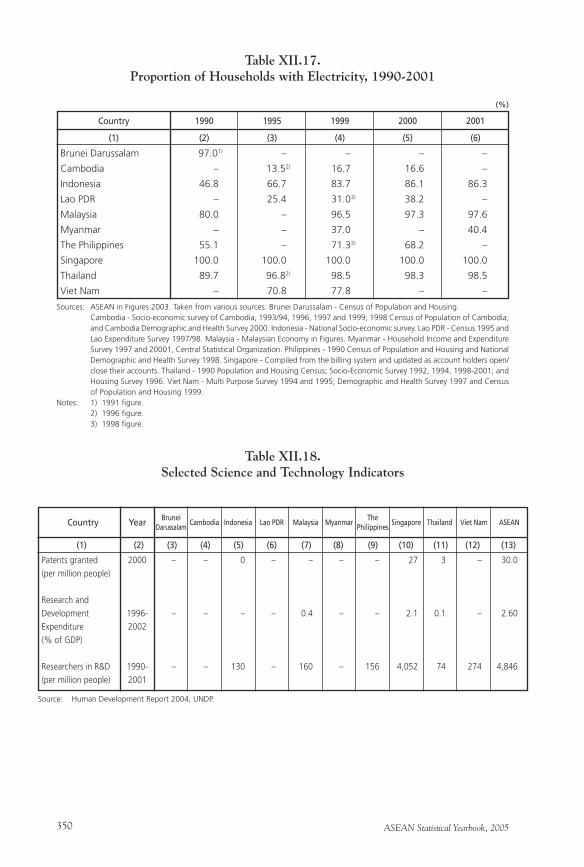
ASEAN Statistical Yearbook, 2005350
Brunei Darussalam 97.01) – – – –
Cambodia – 13.52) 16.7 16.6 –
Indonesia 46.8 66.7 83.7 86.1 86.3
Lao PDR – 25.4 31.03) 38.2 –
Malaysia 80.0 – 96.5 97.3 97.6
Myanmar – – 37.0 – 40.4
The Philippines 55.1 – 71.33) 68.2 –
Singapore 100.0 100.0 100.0 100.0 100.0
Thailand 89.7 96.82) 98.5 98.3 98.5
Viet Nam – 70.8 77.8 – –
Table XII.17.Proportion of Households with Electricity, 1990-2001
Country 1990 1995 1999 2000 2001
(1) (2) (3) (4) (5) (6)
Sources: ASEAN in Figures 2003. Taken from various sources: Brunei Darussalam - Census of Population and Housing. Cambodia - Socio-economic survey of Cambodia, 1993/94, 1996, 1997 and 1999; 1998 Census of Population of Cambodia;
and Cambodia Demographic and Health Survey 2000. Indonesia - National Socio-economic survey. Lao PDR - Census 1995 and Lao Expenditure Survey 1997/98. Malaysia - Malaysian Economy in Figures. Myanmar - Household Income and Expenditure Survey 1997 and 20001, Central Statistical Organization. Philippines - 1990 Census of Population and Housing and National Demographic and Health Survey 1998. Singapore - Compiled from the billing system and updated as account holders open/close their accounts. Thailand - 1990 Population and Housing Census; Socio-Economic Survey 1992, 1994, 1998-2001; and Housing Survey 1996. Viet Nam - Multi Purpose Survey 1994 and 1995; Demographic and Health Survey 1997 and Census of Population and Housing 1999.
Notes: 1) 1991 figure. 2) 1996 figure. 3) 1998 figure.
(%)
Patents granted 2000 – – 0 – – – – 27 3 – 30.0
(per million people)
Research and
Development 1996- – – – – 0.4 – – 2.1 0.1 – 2.60
Expenditure 2002
(% of GDP)
Researchers in R&D 1990- – – 130 – 160 – 156 4,052 74 274 4,846
(per million people) 2001
Table XII.18.Selected Science and Technology Indicators
(1) (2) (3) (4) (5) (6) (7) (8) (9) (10) (11) (12) (13)
Country Year
Source: Human Development Report 2004, UNDP.
BruneiDarussalam
Cambodia Indonesia Lao PDR Malaysia MyanmarThe
PhilippinesSingapore Thailand Viet Nam ASEAN
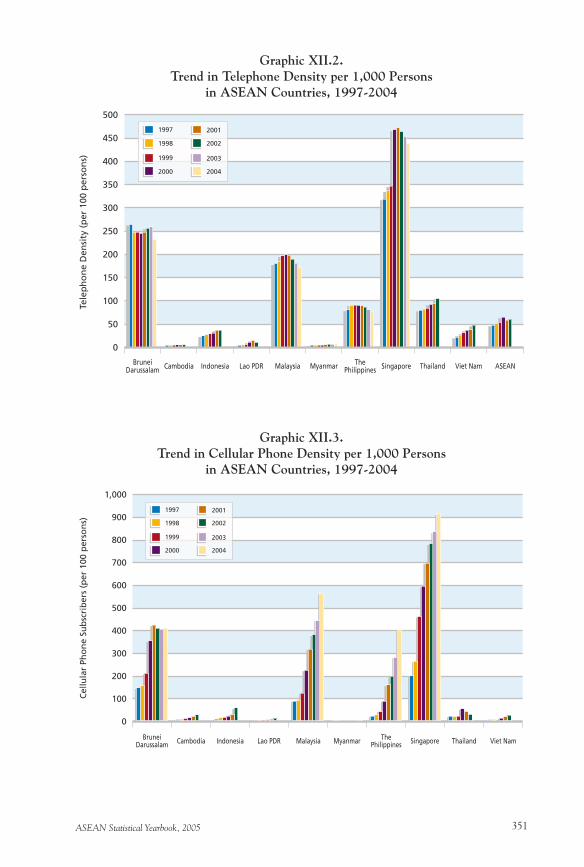
ASEAN Statistical Yearbook, 2005 351
Graphic XII.2.Trend in Telephone Density per 1,000 Persons
in ASEAN Countries, 1997-2004
Graphic XII.3.Trend in Cellular Phone Density per 1,000 Persons
in ASEAN Countries, 1997-2004
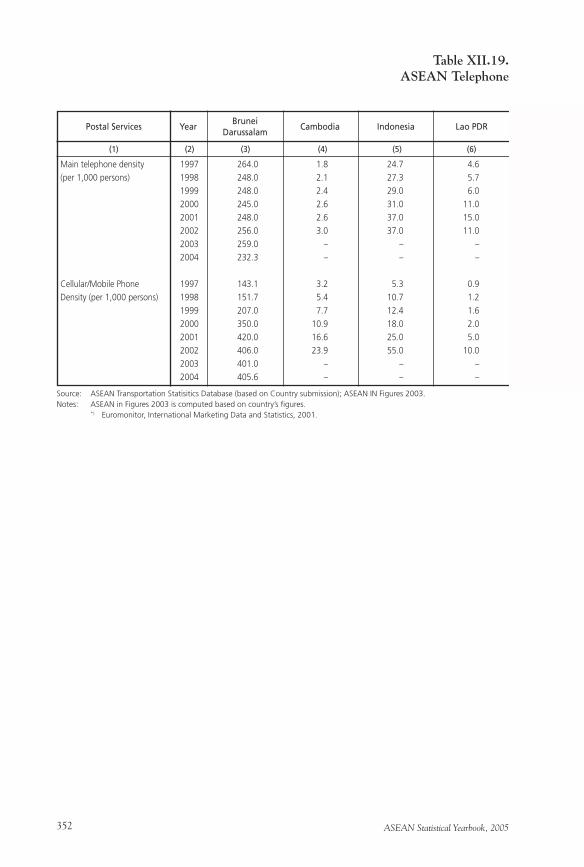
ASEAN Statistical Yearbook, 2005352
Main telephone density 1997 264.0 1.8 24.7 4.6
(per 1,000 persons) 1998 248.0 2.1 27.3 5.7
1999 248.0 2.4 29.0 6.0
2000 245.0 2.6 31.0 11.0
2001 248.0 2.6 37.0 15.0
2002 256.0 3.0 37.0 11.0
2003 259.0 – – –
2004 232.3 – – –
Cellular/Mobile Phone 1997 143.1 3.2 5.3 0.9
Density (per 1,000 persons) 1998 151.7 5.4 10.7 1.2
1999 207.0 7.7 12.4 1.6
2000 350.0 10.9 18.0 2.0
2001 420.0 16.6 25.0 5.0
2002 406.0 23.9 55.0 10.0
2003 401.0 – – –
2004 405.6 – – –
Table XII.19.ASEAN Telephone
Postal Services Year
(1) (2) (3) (4) (5) (6)
Source: ASEAN Transportation Statisitics Database (based on Country submission); ASEAN IN Figures 2003.Notes: ASEAN in Figures 2003 is computed based on country’s figures. *) Euromonitor, International Marketing Data and Statistics, 2001.
Brunei Darussalam
Cambodia Indonesia Lao PDR
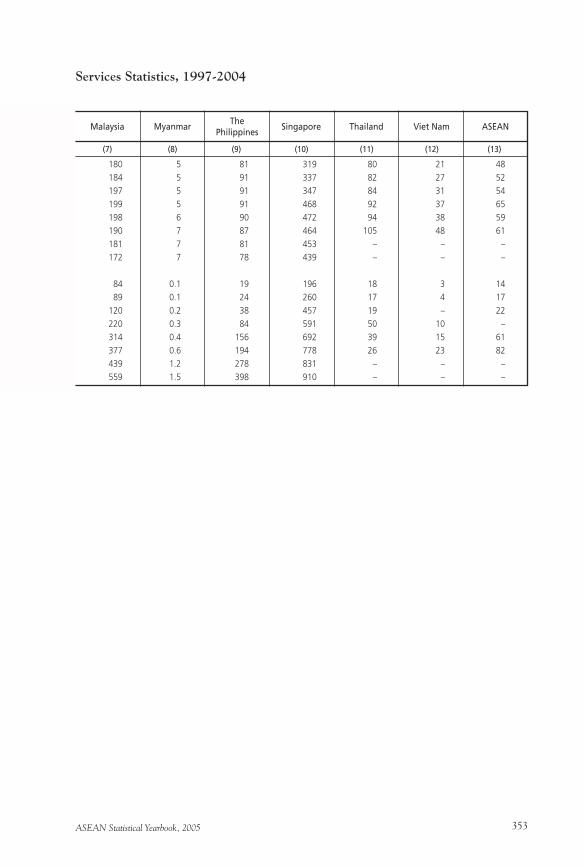
ASEAN Statistical Yearbook, 2005 353
180 5 81 319 80 21 48
184 5 91 337 82 27 52
197 5 91 347 84 31 54
199 5 91 468 92 37 65
198 6 90 472 94 38 59
190 7 87 464 105 48 61
181 7 81 453 – – –
172 7 78 439 – – –
84 0.1 19 196 18 3 14
89 0.1 24 260 17 4 17
120 0.2 38 457 19 – 22
220 0.3 84 591 50 10 –
314 0.4 156 692 39 15 61
377 0.6 194 778 26 23 82
439 1.2 278 831 – – –
559 1.5 398 910 – – –
Services Statistics, 1997-2004
Malaysia Myanmar
(7) (8) (9) (10) (11) (12) (13)
ThePhilippines
Singapore Thailand Viet Nam ASEAN
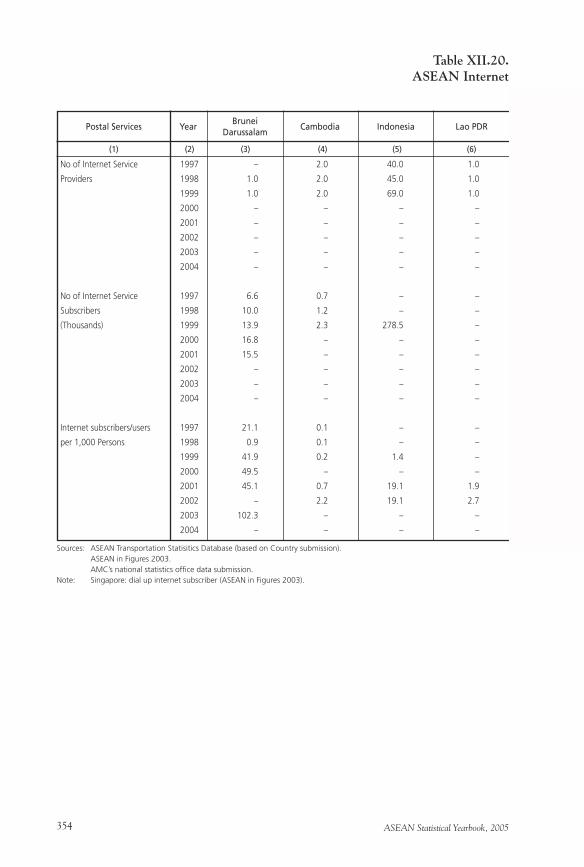
ASEAN Statistical Yearbook, 2005354
No of Internet Service 1997 – 2.0 40.0 1.0
Providers 1998 1.0 2.0 45.0 1.0
1999 1.0 2.0 69.0 1.0
2000 – – – –
2001 – – – –
2002 – – – –
2003 – – – –
2004 – – – –
No of Internet Service 1997 6.6 0.7 – –
Subscribers 1998 10.0 1.2 – –
(Thousands) 1999 13.9 2.3 278.5 –
2000 16.8 – – –
2001 15.5 – – –
2002 – – – –
2003 – – – –
2004 – – – –
Internet subscribers/users 1997 21.1 0.1 – –
per 1,000 Persons 1998 0.9 0.1 – –
1999 41.9 0.2 1.4 –
2000 49.5 – – –
2001 45.1 0.7 19.1 1.9
2002 – 2.2 19.1 2.7
2003 102.3 – – –
2004 – – – –
Table XII.20.ASEAN Internet
Postal Services Year
(1) (2) (3) (4) (5) (6)
Sources: ASEAN Transportation Statisitics Database (based on Country submission). ASEAN in Figures 2003. AMC’s national statistics office data submission.Note: Singapore: dial up internet subscriber (ASEAN in Figures 2003).
Brunei Darussalam
Cambodia Indonesia Lao PDR
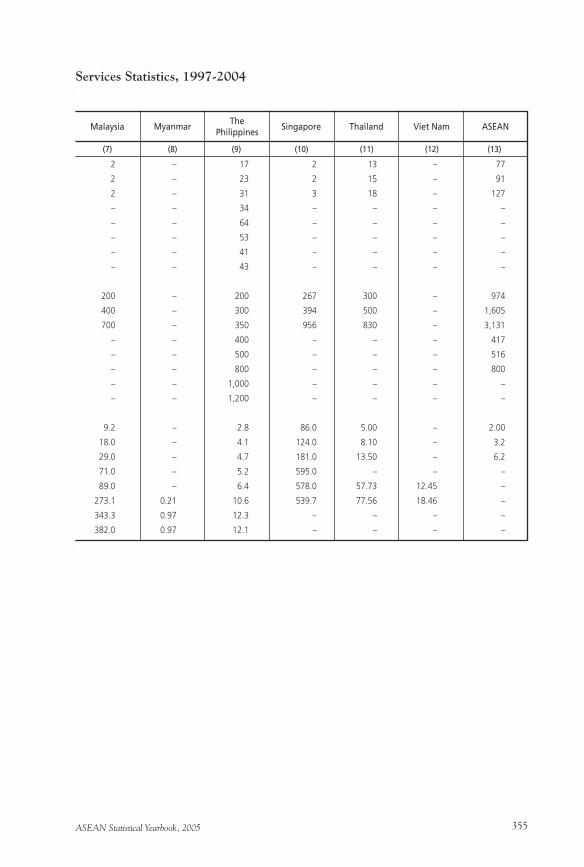
ASEAN Statistical Yearbook, 2005 355
2 – 17 2 13 – 77
2 – 23 2 15 – 91
2 – 31 3 18 – 127
– – 34 – – – –
– – 64 – – – –
– – 53 – – – –
– – 41 – – – –
– – 43 – – – –
200 – 200 267 300 – 974
400 – 300 394 500 – 1,605
700 – 350 956 830 – 3,131
– – 400 – – – 417
– – 500 – – – 516
– – 800 – – – 800
– – 1,000 – – – –
– – 1,200 – – – –
9.2 – 2.8 86.0 5.00 – 2.00
18.0 – 4.1 124.0 8.10 – 3.2
29.0 – 4.7 181.0 13.50 – 6.2
71.0 – 5.2 595.0 – – –
89.0 – 6.4 578.0 57.73 12.45 –
273.1 0.21 10.6 539.7 77.56 18.46 –
343.3 0.97 12.3 – – – –
382.0 0.97 12.1 – – – –
Services Statistics, 1997-2004
Malaysia Myanmar
(7) (8) (9) (10) (11) (12) (13)
ThePhilippines
Singapore Thailand Viet Nam ASEAN

ASEAN Statistical Yearbook, 2005356