technical specifications - ineine.cv/.../2017/02/statistical-yearbook-cv-2015_en.pdfthis document,...
TRANSCRIPT


1

2
Technical Specifications Instituto Nacional de Estatística
Cabo Verde, Statistical Yearbook 2015
President
António dos Reis Duarte
Editor
Instituto Nacional de Estatística Av. Cidade de Lisboa, nº 18, Cx. Postal 116, Praia Tel.: +238 261 38 27 * Fax: +238 261 16 56 E-mail: [email protected]
Design and composition
Instituto Nacional de Estatística
Coordination
Amândio J. Carvalho Furtado [email protected]
Ana Angelina F. Gomes Furtado [email protected] Date of Publication
November 2015
© Copyright 2015 Instituto Nacional de Estatística User Support
Diffusion Division Email: [email protected]
Translation Dulce Abrantes Photos
Topic Authorship
Health Obtained from (www.freepik.com)
Industry Trade and Services Photomontage from the base image (obtained from www.freepik.com)

3
Partner Entities Ministry of Internal Affairs (MAI) Ministry of Education and Sports (MED) Ministry of Employment, Youth and Employment (MJEDRH)
Ministry of Health (MS) Ministry of Finance and Planning (MFP) Ministry of Rural Development (MDR) Bank of Cabo Verde (BCV) National Institute for Fisheries Development (INDP) National Social Welfare Institution (INPS) Institute for Roads (IE) Publication sponsored by World Bank Special Contribution
António Baptista

4
Conventional signs
… Confidential data
- Not available
E Estimate
P Provisional value
Note: Sums may not equal totals due to rounding.
Acronyms and Abbreviations
AAC – Civil Aviation Agency
ANMCV –National Association of Municipalities
ASA –Airports and Air Safety
CAE – Classification of Economic Activities
CSMJ –Higher Judiciary Council
DNA –National Directorate for Environment
DR –District Census
ENAPOR –National Company of Ports
FAO – Food and Agriculture Organization
INE – Instituto Nacional de Estatística/ National Statistics Institute
INPS –National Social Security Institute
MAHOT –Ministry of Environment Housing and Spatial Planning
MAI –Ministry of Internal Affairs
MDR –Ministry of Rural Development
MED –Ministry of Education and Sports
MESCI –Ministry of Higher Education Science and Innovation
MJEDRH –Ministry of Youth Employment and Development of Human Resources
MS –Ministry of Health
SEN –National Statistical System

5
Preface
It is with great satisfaction that the National Institute of Statistics (INE) presents the Statistical
Yearbook of Cabo Verde (AECV) that is intended to serve as an important publication,
comprehensive and of reference, providing statistical data on various aspects of the reality of
the Cabo Verdean Society.
The Statistical Yearbook is a public service publication, very particular, that many NSI edit,
representing a synthesis of all the official statistics on the state of the respective country's
society.
The fundamental objective of AECV is to work as a "gateway" to our country's Official Statistics,
providing a "reference publication" of INE, by serving as the best card-to-visit.
The first AECV, after a period of more than two decades is borne by the INE as a particular
reference publication since, unlike other publications, within the sector, is addressed far more
to the public than to the experts, presenting a summary of the official national statistical
production.
Thus, the AECV seeks a balance on meeting the needs of this heterogeneity of users, by
reflecting the involvement of all relevant and pertinent expertise within INE.
The AECV was drawn from a set of official statistics produced by the National Statistics
Institute, by other Officials Statistics Producers (BCV and INE delegate Bodies) and
information provided by other public bodies, and the raw material for the production of these
statistics is the information provided by citizens, businesses and organizations and public
sector services, through answers to their censuses and surveys, and data from administrative
sources, which allows it to continue its mission to “produce and disseminate so efficiently,
quality official statistical information [reliable, timely and punctual] necessary for the objective
knowledge of a changing society, which helps Cabo Verdeans to get to know their country,
their people, their resources, their economy, their society and their culture.”
It should be noted that the reference period throughout this edition of AECV is not uniform, and
the temporal scope is 2010-2015.
This publication is divided into 10 chapters: Territory; Population and Social Conditions; Health;
Education; Economy and Finance; External Trade; Industry, Trade and Services; Agriculture
and Fisheries; Environment; and Political Participation - which, in turn, are explained in more
detail in the respective subchapters.
INE thanks the valuable cooperation of all the institutions that provided information for the
contents of this Yearbook and, especially, the professionalism of the technicians involved that
make this first edition possible. Finally, requests its users that submit all criticisms and
suggestions they deem relevant to improve AECV next edition.
António dos Reis Duarte President


7
Presentation
This document, Cabo Verde Statistical Yearbook 2015 (AECV 2015), delivers statistical information provided by various bodies of statistical production that are part of the National Statistical System (NSS) as well as other institutions that are not part of NSS, which have also provided information contained in this yearbook. The information highlighted in this document refer to the most recent period possible, (2015 - depending on data availability) and the vast majority of the data covers the period 2010-2014. Consisting of thirty-six subchapters, gathered in ten themes (Territory, Population and Social Conditions, Health, Education, Economy and Finance, Industry, Commerce and Services, Foreign Trade, Agriculture and Fisheries, Environment and Political Participation) also provides a brief analysis for each theme based on the data in order to assist the user in reading and understanding of the information contained. The structure of the tables usually presents data in time series, giving emphasis to the most recent year data being disaggregated at the level of municipalities or the islands (and where possible the breakdown in terms of sex, or the means of residence) allowing comparability between different entities over time. The yearbook 2015 besides the printed version can also be found in the digital version (PDF) disseminated on the official website of INE - free access (http://www.ine.cv) the user has easy access (can download / view the document at any time). The AECV 2015 is drafted according to the rules of the new Spelling Agreement.

8
The Instituto Nacional de Estatística
Mission The mission of the National Institute of Statistics (INE) is to produce and disseminate efficiently, official quality statistical information (reliable, current and timely) necessary for the objective knowledge of a changing society, to help the Cabo Verdeans better understand their country, their people, their resources, their economy, their society and their culture.
Vision INE seeks to be recognized as a statistical institution of reference:
As a producer and supplier of official quality statistical information,
As a technically independent and credible organization;
For the contribution to the promotion of statistical literacy;
By engaging in effective international cooperation. Values INE guides its action by the following values:
Professionalism: employee performance is driven by demanding principles of professionalism and ethics governing the official national statistical activity.
Commitment to Quality: Of the products and official statistical services, keeping in mind that the activity of each one of the technical staff contributes to the production of quality products and services, defined by the criteria of relevance, accuracy, timeliness, punctuality, accessibility, clarity, comparability, consistency and comprehensiveness.
Guidance for users: Corresponds to the notion that the current and potential users of official statistical information are the reason INE to exist, which involves the allocation of a very high value to users' needs and the usefulness of joint work, in order to meet your expectations.
Openness to Society: Willingness to give continuous attention to changes in society, in order to adapt and above all, to anticipate the products and official statistical services, to the changing needs of users.
Efficiency: Management based on the principle of cost / benefit analysis, implementing technical and methodological processes that can effectively optimize the use of all available resources.
Respect for Primary Information Providers: High regard by respondents that provide individual data for the production of official statistics, finding technical solutions to meet the growing needs of official quality statistical information, minimizing the burden on respondents.
Motivation and Human Resources Development: INE guides management decisions and actions based on motivation and professional development of its technicians.
Innovation: INE values and encourages cognitive thinking activities that challenge conventions, towards the continuous improvement of methods, processes, official statistical products and services in order to improve efficiency and effectiveness.

9
Index
Conventional signs ................................................................................................................ 4
Acronyms and Abbreviations ................................................................................................. 4
Preface .................................................................................................................................. 5
Presentation .......................................................................................................................... 7
The Instituto Nacional de Estatística ...................................................................................... 8
The Territory of Cabo Verde ................................................................................................ 24
Territory Physical Aspects ................................................................................................ 25
Administrative Division of the Country .............................................................................. 27
Statistical Division (Census Districts/Enumeration Area) .................................................. 28
Transport Infrastucture ..................................................................................................... 29
National Road Network ................................................................................................. 29
National Airport Infrastructure ....................................................................................... 29
National Port Infrastructure ........................................................................................... 30
Population density ............................................................................................................ 30
Cities and Villages in Cabo Verde .................................................................................... 32
Population and Social Conditions ........................................................................................ 36
Population ........................................................................................................................ 36
Age Structure of the Population .................................................................................... 38
Migrations ..................................................................................................................... 41
Labour Market .................................................................................................................. 45
Unemployment ............................................................................................................. 52
Social Protection .............................................................................................................. 57
Poverty and living conditions ............................................................................................ 63
Justice and Security ......................................................................................................... 65
Health .................................................................................................................................. 72
Infrastructure and Resources Allocated to the Health Services ........................................ 73
Birth and Fertility .............................................................................................................. 80
Fertility in Adolescence ................................................................................................. 81
Vaccination coverage ....................................................................................................... 83
Mortality ........................................................................................................................... 85
Education ............................................................................................................................. 98
Population Education Level .............................................................................................. 98

10
Literacy rate ................................................................................................................... 100
Schooling rate ................................................................................................................ 104
Transition/Conclusion ..................................................................................................... 107
Drop out and Failure ....................................................................................................... 108
Failure ........................................................................................................................ 109
Economy and Finance ....................................................................................................... 112
National Accounts .......................................................................................................... 112
Annual national accounts ............................................................................................ 112
Gross Domestic Product per Island ................................................................................ 115
Companies ..................................................................................................................... 117
Prices ............................................................................................................................. 122
Monetary and Financial Sector ....................................................................................... 124
National ATM Network Activity .................................................................................... 127
Public finances ........................................................................................................... 131
Industry, Trade and Services ............................................................................................. 140
Industry .......................................................................................................................... 140
Domestic Trade .............................................................................................................. 143
Tourism .......................................................................................................................... 148
Tourist offer ................................................................................................................ 148
Tourist demand ........................................................................................................... 150
Tourism Satellite Accounts ......................................................................................... 154
Transports ...................................................................................................................... 164
Land transport ............................................................................................................ 164
Maritime transport ....................................................................................................... 167
Air transport ................................................................................................................ 168
Access indicators and use of Information and Communication Technologies (ICT) ........ 171
Families and access to ICTs ....................................................................................... 171
Population and use of ICTs ......................................................................................... 173
External Trade ................................................................................................................... 180
Imports ........................................................................................................................... 180
Imports of goods ......................................................................................................... 180
Import of services ....................................................................................................... 184
Exports ........................................................................................................................... 185
Exports of goods ......................................................................................................... 185
Services Export........................................................................................................... 188
Agriculture and Fisheries ................................................................................................... 194

11
Agriculture ...................................................................................................................... 194
Agricultural population ................................................................................................ 194
Farm Structure ............................................................................................................ 196
Agricultural production (in the strict sense) ................................................................. 200
Animal Production ....................................................................................................... 205
Forestry ...................................................................................................................... 207
Fisheries ........................................................................................................................ 209
Environment ...................................................................................................................... 214
Political Participation .......................................................................................................... 220
Women in politics ........................................................................................................... 220
Political Participation Indicators ...................................................................................... 221
Election Results ................................................................................................................. 223

12

13
Tables Index Table 1 - Location and Maximum Altitude of major elevations (mountain) of Cabo Verde .... 25
Table 2 - Maximum Length and Width, and Surface per island ........................................... 25
Table 3 - Location of the Outermost Points (Latitude and Longitude and location) per island
............................................................................................................................................ 26
Table 4 - Administrative Division of Cabo Verde (1975-2005) .............................................. 27
Table 5 - Number of Census Districts (CD) per island and municipality (2010) .................... 28
Table 6 - Extension and Classification of the National Road Network (2013) ....................... 29
Table 7 - Identification, Classification, Location and runway size (length and width) of Cabo
Verde's airports and aerodromes ......................................................................................... 29
Table 8 - Identification and Location of Cabo Verde Ports .................................................. 30
Table 9 - Population density (Inhabitants / km2) per island (2011-2015) .............................. 31
Table 10 - Identification and Designation of Cabo Verde Cities (2015) ................................ 32
Table 11 - Identification and Location of Cabo Verde Towns (2015) .................................... 33
Table 12- Resident population in Cabo Verde by municipality (2011-2015) ......................... 36
Table 13 - Annual rate of natural growth (TCN), Average Annual Growth Rate (TCMA) and
Life Expectancy at Birth (2011-2015) ................................................................................... 37
Table 14 - Population according to sex and age group (2011-2015) .................................... 38
Table 15 - Average age of the population by municipality (2011-2015) ................................ 39
Table 16 - Gender Ratio (2010-2014) .................................................................................. 40
Table 17 - Dependency ratio (total, Youth, Elderly) aging index and longevity (2011-2015) . 40
Table 18 - Proportion of resident population in Cabo Verde according to "Nationality" (2010-
2014) ................................................................................................................................... 41
Table 19 - Foreign population residing in Cabo Verde by municipality (2010-2014) ............. 42
Table 20 - Migration Balance (2011 – 2015) ........................................................................ 43
Table 21 - Proportion of population by marital status, on the island (2010-2014) ................. 44
Table 22 - Population aged 15 or more according to the situation in economic activity (2012-
2014) ................................................................................................................................... 45
Table 23 - Working population by means of residence and Gender (2012-2014) ................. 45
Table 24 - Structure of employees by sector of activity (2012-2014) .................................... 46
Table 25 - Employed population by main professions (2012-2014) ...................................... 46
Table 26 - Employed population according to participation in the labor market, according to
area by economic activity branch (2012-2014) ..................................................................... 47
Table 27 - Activity rate according to gender by municipality (2012-2014) ............................. 48
Table 28 - Activity rate according to the means of residence by municipality (2012-2014) ... 49
Table 29 - Activity rate according to the area and gender by age group (2012-2014)........... 50
Table 30 - Occupancy rate or population employment ratio according to gender by
municipality (2012-2014) ...................................................................................................... 51
Table 31 - Unemployment rate by municipality (2010-2014) ................................................ 52
Table 32 - Youth unemployment rate (15-24 years) by municipality ..................................... 53
Table 33 - Unemployment rate according to gender and area by municipality (2012-2014) . 54
Table 34 - Unemployment rate according to Age Group, Gender and area by municipality
(2014) .................................................................................................................................. 55
Table 35 - INPS members by category (2010-2014) ............................................................ 57
Table 36 - Members with open rights in INPS by island (2012-2014) ................................... 58
Table 37 - INPS members by gender and category, (1983 – 2014)...................................... 59
Table 38 - INPS active taxpayers registered by category .................................................... 60

14
Table 39 - Costs (CVE thousands) with the main social security family benefits (2010-2014)
............................................................................................................................................ 60
Table 40 - Beneficiaries and monitoring of internal evaluations according to the beneficiary
island of origin, (2013 – 2014) .............................................................................................. 61
Table 41 - Patients evacuated abroad, according to medical specialty (2014) ..................... 61
Table 42 - Pensions average amount (in CVE) by type (1012-2014) .................................... 62
Table 43 - Poverty incidence according to area, by identical areas (IDRF 2001/02) and
Municipality (QUIBB 2007) ................................................................................................... 63
Table 44 - Poverty depth, according to area by identical areas (IDRF 2001/02) and (QUIBB
2007) ................................................................................................................................... 64
Table 45 - Poverty intensity rate, according to the area by identical areas (IDRF 2001/02)
and (QUIBB 2007) ............................................................................................................... 64
Table 46 - Crime occurring per 100.000 inhabitants, (2008-2013)........................................ 65
Table 47 - Proportion of crime perpetrators according to age by municipality (2013) ........... 65
Table 48 - Number of pending and brought incivil proceedings by court (2014-2015) .......... 66
Table 49 - Number and Percentage of tried_civil proceedings by court (2014-2015) ......... ..67
Table 50 - State General Budget (SGB) and the Ministry of Health Budget (2005-2013) ..... 72
Table 51 - Health infrastructure according to major health facilities by municipality (2009 -
2013) ................................................................................................................................... 73
Table 52 - Health infrastructure by type of health structures by municipality (2013) ............. 74
Table 53 - Number of doctors, Ratio Doctor / 10,000 inhabitants, number of nurses and Ratio
Nurses / 10,000 inhabitants (2009-2013) ............................................................................. 75
Table 54 - Doctors and Nurses Ratio (*) per 10 000 inhabitants per municipality (2013) ...... 76
Table 55 - Number of hospital beds according to health facilities by municipality (2009-2013)
............................................................................................................................................ 77
Table 56 - vaccination coverage of pregnant women receiving tetanus shot by municipality
(2013) .................................................................................................................................. 78
Table 57 - Number of births attended by trained professionals (doctors and nurses) in health
facilities (2009-2013)............................................................................................................ 79
Table 58 - Number of Births, assisted Births and Proportion of births attended by trained
health professionals - doctors and nurses (2009 – 2013) ..................................................... 79
Table 59 - Synthetic Fertility Index, Gross Birth Rate, Gross Reproduction Rate and Net
Reproduction Rate 2011 - 2015 ........................................................................................... 80
Table 60 - Recorded number of pregnant women, pregnant women and the proportion of
pregnant women by age group (10-19 years) according to the Health Centers / Municipalities
(2013) .................................................................................................................................. 81
Table 61 - Coverage rate of prenatal and post partum medical appointments (2009 – 2013)
............................................................................................................................................ 82
Table 62 - Proportion of vaccinated children under 1 year of age, according to types of
vaccine by municipality (2013) ............................................................................................. 83
Table 63 - Medical appointments of vaccinated children under one year and prenatal
consultations by municipality (2009 – 2013) ......................................................................... 84
Table 64 - Maternal Mortality Rate and Gross Mortality Rate (2009-2013) ........................... 85
Table 65 - Mortality rate and its components (Infant Mortality, Neonatal Premature, Neonatal
Late, Post Neonatal and children under the age of 5 (2009 – 2013) ..................................... 86
Table 66 - Mortality (Deaths and Mortality Rate) according to gender by municipality (2013)
............................................................................................................................................ 86

15
Table 67 - Deaths and Mortality Rate, according to gender and main mortality causes (2013)
............................................................................................................................................ 87
Table 68 - Deaths and mortality rate according to gender, by age group (2013) .................. 87
Table 69 - Infant mortality (rate) according to main causes (2009-2013) .............................. 88
Table 70 - Infant mortality and its components - Early Neonatal, late neonatal and post-
neonatal - by municipality (2013) ......................................................................................... 88
Table 71 - Number of cases, incidence (per 100,000) deaths, mortality rate and mortality rate
associated with malaria (2008-2013) ................................................................................... 89
Table 72 - Incidence (per 100,000), prevalence (per 100,000), Deaths and mortality rate (per
100,000) associated with tuberculosis (2008 - 2013) ........................................................... 89
Table 73 - Incidence and prevalence rates per 100,000 associated with tuberculosis by
municipality (2013) ............................................................................................................... 90
Table 74 - HIV detection rate and mortality (2009 – 2013) ................................................... 90
Table 75 – HIV infection cases reported by age group and gender in 2013 ......................... 91
Table 76 - Drug sales offices and pharmacies (public and private) and health facilities by
municipality (2010-2013) ...................................................................................................... 92
Table 77 - Public expenditure (in millions of Escudos and proportion) of medicinal product by
municipality (2013) ............................................................................................................... 93
Table 78 - Nível de instrução da População, por Sexo, Meio de Residência e Concelho
Population education level, by gender, area and Municipality (2010-2014) .......................... 99
Table 79 - Literacy rate of the population (15 and over) and Youth Literacy Rate (15-14
years) according to gender, by residence and municipality (2010-2014) ............................ 100
Table 80 - Educational/teaching establishments (2010-2014) ............................................ 101
Table 81 - Professionals / teachers according to the level of education (2010-2014) ......... 102
Table 82 - Students enrolled by level of education (2010-2014) ......................................... 103
Table 83 - Schooling Rate (Gross and Net) according to the level of education by
municipality (2010-2014) .................................................................................................... 104
Table 84 - Net enrollment ratio in primary education, by gender (2010-2014) .................... 105
Table 85 - Net enrollment ratio in secondary education, by gender (2010-2014) ................ 105
Table 86 - Gross schooling rate parity by municipality (2010-2014) ................................... 106
Table 87 - Primary School Transition rate to Secondary (2010-2014) ................................ 107
Table 88 - Dropout rate by level of education and gender by municipality (2010-2014) ...... 108
Table 89 - Failure rate by level of education and gender by municipality (2010-2014) ....... 109
Table 90 - Gross Domestic Product - Current prices in millions of escudos (2010-2014) ... 113
Table 91 - Gross Domestic Product - Constant prices in millions of escudos (2010-2014) . 113
Table 92 - GDP structure by Business Sector (2010-2014) ................................................ 113
Table 93 - GDP growth rate - nominal and real (2010-2014) .............................................. 113
Table 94 - Percentage composition of GVA - nominal (2010-2014) .................................... 114
Table 95 - Gross Fixed Capital Formation as a percentage of GDP (GFCF / GDP) and final
consumption expenditure as a percentage of GDP (FC / GDP), (2009-2012) .................... 114
Table 96 - Gross national available income (GNAI), gross income available per capita and
National Savings (2007-2012) ............................................................................................ 114
Table 97 – GDP per Island (2007-2012) ............................................................................ 115
Table 98 - GDP per capita per island (2007-2012) ............................................................. 116
Table 99 - Companies according to the type of accounting and turnover organization (2007-
2013) ................................................................................................................................. 117
Table 100 - Number of Companies per islands (2007-2013) .............................................. 117
Table 101 - Persons employed in companies according to islands (2007-2013) ................ 118
16
Table 102 - Companies according to the type of legal form (2007-2013) ........................... 118
Table 103 - Companies according to the step of service staff, (2007-2013) ....................... 119
Table 104 - Proportion of sole proprietorships companies and companies with less than 10
employees (2007-2013) ..................................................................................................... 119
Table 105 - Companies, service staff and the Turnover by municipality in the last two
business censuses (2007 and 2012) .................................................................................. 120
Table 106 - Companies, service staff in businesses and turnover of the companies according
to NACE-Rev.1 (2007-2013) .............................................................................................. 121
Table 107 - Consumer Price Index (2007-2014) ................................................................ 122
Table 108 - Inflation rate (2007-2014) ................................................................................ 123
Table 109 – bank deposits (2010-2014) ............................................................................. 124
Table 110 – Bank credit (2010-2014) ................................................................................. 124
Table 111 – Interest rates (2010-2014) .............................................................................. 125
Table 112 - Monetary Survey, (2010-2014) ........................................................................ 125
Table 113 - Remittance of emigrants by country of residence (2010-2014) ........................ 126
Table 114 - Remittance of emigrants from European countries, (2010-2014) .................... 126
Table 115 - ATMs per 10,000 inhabitants and cards produced, (2010-2014) ..................... 127
Table 116 - Transactions by debit card at ATM terminals (ATMs) and point of sales terminals
(POS) in Millions of CVE (2010-2014) ................................................................................ 127
Table 117 - Financial statistics, (2010-2014) ...................................................................... 128
Table 118 - Summary of Payment Means and Instruments, (2009-2013)........................... 129
Table 119 – Balance of Payments, (2005-2014) ................................................................ 130
Table 120 - Public revenues - Accumulated values in million CVE (2010-2014) ................. 131
Table 121 - Public Expenditure - Cumulative Amounts in million CVE (2010-2014) ........... 132
Table 122 - Summary of State Financial Operations - Accumulated values in million CVE
(2010-2014) ....................................................................................................................... 133
Table 123 - Industry sector companies by NACE Division - Rev.1 (2009- 2013) ................ 140
Table 124 - Number of staff employed in the companies of the industry sectors per Division
of CEA (Classification of Economic Activities) - Rev.1, (2009-2013) .................................. 141
Table 125 - Turnover (in thousand CVE) of the industry sector Companies per Division of
NACE - Rev.1 (2009-2013) ................................................................................................ 142
Table 126 - Company Structure of the Trade sector (2013) ............................................... 143
Table 127 - Commercial units according to their size - Micro Small Medium and Large
Enterprises (2013) ............................................................................................................. 143
Table 128 - Trade companies in the sector according to level of personal service (2013) .. 143
Table 129 - Turnover (in millions of ECV) of trade enterprises by economic activity (NACE
Rev. 1 groups) and number of persons engaged in the service (2013) .............................. 144
Table 130 - Trade sector companies according to levels of legal form (2013) .................... 144
Table 131 - Trade companies - wholesale and retail trade with and without food
predominance (2009-2013) ................................................................................................ 144
Table 132 - Sales volume (in millions CVE) of trade companies - wholesale and retail with
and without food predominance (2009-2013) ..................................................................... 145
Table 133 - Employed staff in trade companies - wholesale and retail with and without food
predominance (2009-2013) ................................................................................................ 145
Table 134 - Turnover (in millions of CVE) of trade companies by islands (2009-2013) ....... 145
Table 135 - Employed staff in trade sectors companies by islands (2009-2013) ................ 146
Table 136 - Trade sector companies, by islands (2009-2013) ............................................ 146
Table 137 - Trade sector companies according to municipalities (2013) ............................ 147

17
Table 138 - Number of establishments, bedrooms, beds, accommodation capacity and
personnel employed (2010 - 2014) .................................................................................... 148
Table 139 - Number of Establishments by type of accommodation establishment (2010 –
2014) ................................................................................................................................. 148
Table 140 - Persons employed by type of tourist accommodation establishment (2010 –
2014) ................................................................................................................................. 148
Table 141 - Number of hotel establishments by Island (2010 – 2014) ................................ 149
Table 142 - Employed staff in the tourist accommodation establishments by island (2010 –
2014) ................................................................................................................................. 149
Table 143 - Guests by type of tourist accommodation establishment (2010 – 2014) .......... 150
Table 144 - Guests in tourist accommodation establishments by guests' country of habitual
residence (2010 – 2014) .................................................................................................... 150
Table 145 - Guests per inhabitant, Proportion of foreign guests and Proportion of overnight
stays in the main accommodation establishments (2010 - 2014) ....................................... 151
Table 146 - Overnight stays in tourist accommodation establishments by country of habitual
residence of the guest (2010 – 2014) ................................................................................. 151
Table 147 - Overnight stays by type of accommodation establishments (2010-2014) ........ 151
Table 148 - Overnight stays in tourist accommodation establishments per Island (2010 –
2014) ................................................................................................................................. 152
Table 149 - Annual guests and overnight stays variation rate (2010 – 2014) ..................... 152
Table 150 - Average stay of guests per country of habitual residence (2010 – 2014)......... 153
Table 151 - Average stay in hotel establishments by type of tourist accommodation
establishment (2010 – 2014) .............................................................................................. 153
Table 152 - Bed occupancy rate by type of tourist accommodation establishment, (2010 –
2014) ................................................................................................................................. 154
Table 153 - Bed occupancy rate (%) per Island (2010-2014 .............................................. 154
Table 154 - Tourist sector's contribution to GDP - Thousand CVE (2011 – 2014) .............. 155
Table 155 - National tourism consumption per products and components - Thousand CVE
(2011) ................................................................................................................................ 155
Table 156 - Production account of tourism branches - Thousand CVE (2011) ................... 156
Table 157 - Detail of production and intermediate consumption of branches of activity by type
of products and inputs (thousand CVE) (2011) .................................................................. 157
Table 158 - Employment by activity sectors (2011) ............................................................ 159
Table 159 - The contribution of tourism in the economy: direct and total effects on GDP and
its components (2011) ....................................................................................................... 159
Table 160 - Part of tourism in all the products produced by the tourism industry in thousands
CVE (2011) ........................................................................................................................ 160
Table 161 - Number of road accidents per municipality (2010 – 2012) ............................... 164
Table 162 - Number of deaths in road accidents (2010 -2012) ........................................... 165
Table 163 - Number of injured in road accidents per municipality (2010 – 2012) ............... 166
Table 164 - Passenger movement in national ports (2010 – 2014) .................................... 167
Table 165 - Cargo / goods movement in national ports (2010-2014) .................................. 167
Table 166 - Passenger movement by type of traffic according to airports (2010-2014) ...... 168
Table 167 - Aircraft movements by type of traffic according to airports (2010-2014) .......... 169
Table 168 - Cargo movement (in kg) per airports (2010 -2014) .......................................... 169
Table 169 - Postal Movement (in kg) per airports (2010 – 2014) ........................................ 170
Table 170 - Air accidents and victims ................................................................................. 170

18
Table 171 - Proportion of households with access to fixed telephone service and mobile
telephone service, by residence and municipality (2012-2014) .......................................... 171
Table 172 - Proportion of households according to access / ownership of TV, cable TV,
Computer, Tablet/Ipad and Internet access per Residence and Municipality (2012-2014).. 172
Table 173 - Proportion of the population aged 10 years or more who has used a computer
(laptop, desktop, Ipad or tablet) or who has used Internet in the last three months (2014). 173
Table 174 - Imports of goods by Rating by Broad Economic Categories - BEC (2010-2014)…
.......................................................................................................................................... 180
Table 175 - Imports of goods per island (2009-2013) ......................................................... 181
Table 176 - Imports of goods according to economic zones (2010-2014)........................... 181
Table 177 - Imports of goods by (main) countries of Origin (2010-2014) ............................ 182
Table 178 - Proportion of imports - by category of suppliers (2010-2014) .......................... 182
Table 179 - Imports (Million CVE) by customs office (2010-2014) ...................................... 183
Table 180 - Imports (Millions of CVE) by type of services (2010-2014) .............................. 184
Table 181 - Exports of goods, by classification of Broad Economic Categories (2010-2014)..
.......................................................................................................................................... 185
Table 182 - Companies which export goods per island (2009-2013) .................................. 185
Table 183 - Exports of goods per economic zones (2010-2014) ........................................ 186
Table 184 - Exports of goods per main destination countries (201-2014) ........................... 186
Table 185 - Proportion of exports to the main types / customer classification in total exports
(2010-2014) ....................................................................................................................... 187
Table 186 - Exports (Millions CVE) by customs office (2010-2014) .................................... 188
Table 187 - Exports (Millions of CVE) by type of services (2010-2014) .............................. 188
Table 188 - Coverage rate of imports by exports (2010-2014) ........................................... 189
Table 189 - Agricultural population by gender per island (1988 e 2004) ............................. 195
Table 190 - Proportion of the agricultural population by gender and average size of farm
families by island (1988 e 2004) ........................................................................................ 196
Table 191 - Farm structure per island (1988 e 2004) ......................................................... 197
Table 192 - Farm structure according to type per island (2004) ......................................... 197
Table 193 - Family farm holdings according to agricultural activities per island (2004) ....... 197
Table 194 - Family farm parcels according to farming operation per island (2004) ............. 198
Table 195 - Proportion of family farm household representatives by gender (1978-2004). . 198
Table 196 - Arable land in liters, according to class per Island /Municipality (2004) ........... 199
Table 197 - Parcels of family farms according to operation form per island (2004) ............ 200
Table 198 - Estimated production (tons) Vegetables and Roots and Tubers crops (2010 –
2014) ................................................................................................................................. 201
Table 199 - Estimated production (tonnes) by type of fruit crops (2010-2014).................... 202
Table 200 - Estimated production (Ton.) of cash crops (2010 – 2014) ............................... 203
Table 201 - Estimated production (tons) of rainfed crops (2010 – 2014) ............................ 203
Table 202 - Total production, average maize production (tons) in the last 5 years, per island
(2010-2014) ....................................................................................................................... 204
Table 203 - Livestock by species and year (1994/95-2008) ............................................... 205
Table 204 - Livestock species per island (2004) ................................................................ 206
Table 205 - Meat production estimate (tons) (2010 – 2014) ............................................... 206
Table 206 - Estimated total, slaughter rate, total slaughtered and meat production (tons) of
major species (2014) ......................................................................................................... 206
Table 207 - Milk estimated production (in liters) (2010 – 2014) .......................................... 207
Table 208 - Eggs estimate production (Unit) (2010 – 2014) ............................................... 207

19
Table 209 - Area covered by woody vegetation and forest and their proportions by island. 207
Table 210 - Biomass Forager Production Estimate (2013) ................................................. 208
Table 211 - Wooded area (in hectares) burned in forest fires per island (2011 – 2015) ..... 208
Table 212 - Number of vessels (boats) and artisanal fishing fishermen per island (2011) .. 209
Table 213 - Number of vessels and fisherman of industrial / semi-industrial fishing per island
(2011) ................................................................................................................................ 209
Table 214 - Nominal catches of fish (in tons) according to the type of fishing for main species
.......................................................................................................................................... 210
Table 215 - Fish import - weight and value (2010-2014) .................................................... 210
Table 216 - Fish exports - weight and value (2010-2014) .................................................. 211
Table 217 - Area and proportion of protected areas (Land and marine) by municipality (2015)
.......................................................................................................................................... 214
Table 218 - Proportion of population using an improved drinking water source .................. 215
Table 219 - Proportion of the population using improved sanitation facilities (1990, 2000,
2010, 2012-2014) .............................................................................................................. 216
Table 220 - Proportion of urban population living in rundown or precarious houses (2000,
2010, 2013-2014) .............................................................................................................. 217
Table 221 - Number and Proportion of seats held by women in national parliament .......... 220
Table 222 - Number and Proportion of women within the Executive Power ...................... 220
Table 223 - Indicators of participation in legislative elections (2011) .................................. 221
Table 224 - Indicators of participation in the 2nd round of the presidential elections by
electoral constituency (2011) ............................................................................................. 222
Table 225 - Indicators of participation in local elections by electoral constituency (2012) ... 222
Table 226 - Results of the 2nd round of elections for President of the Republic (2011) ...... 223
Table 227 - Results of legislative elections (2011) ............................................................. 224
Table 228 - Election results for the Municipal Councils according to political parties / groups
by electoral constituency (2012) ........................................................................................ 225

20
21
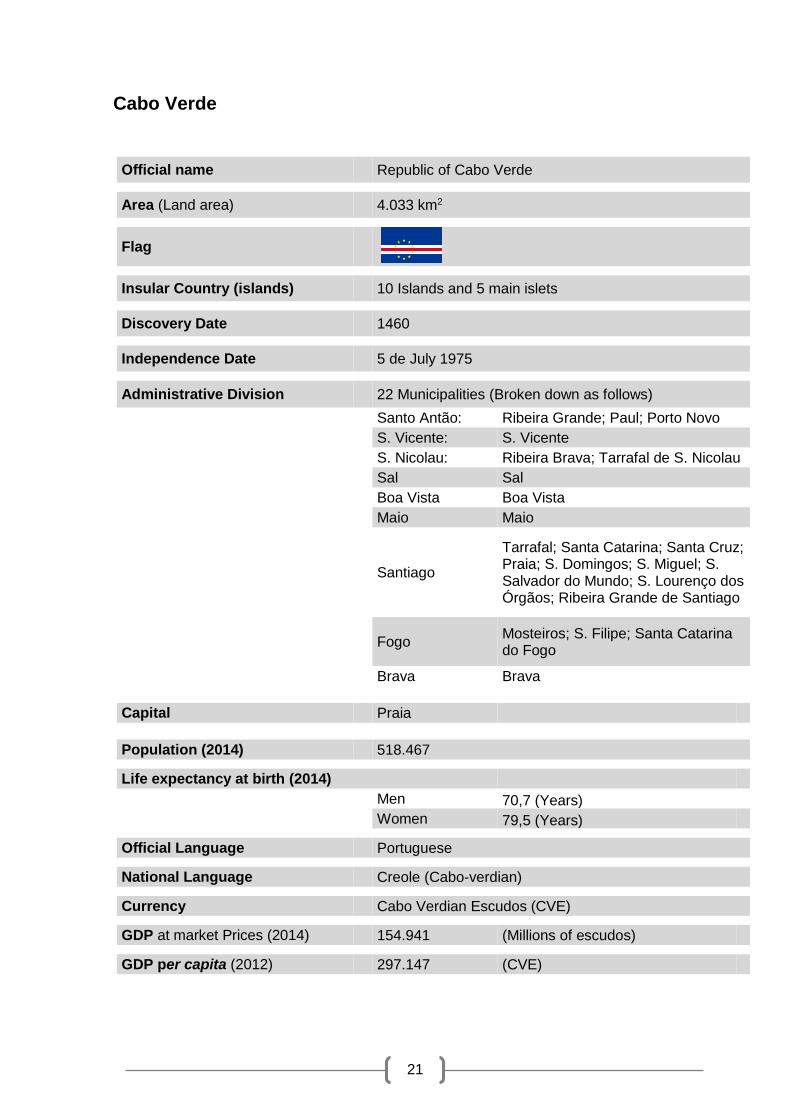
Cabo Verde
Official name Republic of Cabo Verde
Area (Land area) 4.033 km2
Flag
Insular Country (islands) 10 Islands and 5 main islets
Discovery Date 1460
Independence Date 5 de July 1975
Administrative Division 22 Municipalities (Broken down as follows)
Santo Antão: Ribeira Grande; Paul; Porto Novo
S. Vicente: S. Vicente
S. Nicolau: Ribeira Brava; Tarrafal de S. Nicolau
Sal Sal
Boa Vista Boa Vista
Maio Maio
Santiago
Tarrafal; Santa Catarina; Santa Cruz; Praia; S. Domingos; S. Miguel; S. Salvador do Mundo; S. Lourenço dos Órgãos; Ribeira Grande de Santiago
Fogo Mosteiros; S. Filipe; Santa Catarina do Fogo
Brava Brava
Capital Praia
Population (2014) 518.467
Life expectancy at birth (2014)
Men 70,7 (Years)
Women 79,5 (Years)
Official Language Portuguese
National Language Creole (Cabo-verdian)
Currency Cabo Verdian Escudos (CVE)
GDP at market Prices (2014) 154.941 (Millions of escudos)
GDP per capita (2012) 297.147 (CVE)


23

24
The statistical yearbook presents in this chapter, the territory as its theme. It is intended to present the main data on the physical aspects of the territory, on the administrative division of the transport infrastructure and also on human occupation, especially in occupation and density dimensions.
The Territory of Cabo Verde
Small archipelagic country, formed by ten islands (Santo Antao, Sao Vicente, Santa Luzia, São Nicolau, Sal, Boa Vista, Maio, Santiago, Fogo and Brava) and five main islets (Branco, Raso Luis Carneiro, Grande and de Cima) with an approximate area of 4,033 km2 are located between the parallels 14º 23 'and 17º 12' North latitude and the meridians of 22º 40 'and 25º 22' to the west of Greenwich. Atlantic Islands of volcanic origin, are at a distance of about 500 km from Senegal promontory that
gives the country its name. In geomorphological terms, mainly two groups of islands can be distinguished, first the mountainous islands (Santo Antão, São Vicente, Santa Luzia, São Nicolau, Santiago, Fogo and Brava) predominantly mountainous landscapes with altitudes that reach 2829 meters and very rugged reliefs and secondly the flat islands (Sal, Boavista and Maio) characterized by almost non-existence of mountainous reliefs and where you can find extensive white sand beaches lapped by the turquoise Atlantic. They appear as the westernmost point of Africa (17 ° 02'40.9 "N 25 ° 21'39.5 W - island of Santo Antão) the islands are shown arranged in a horseshoe shape and due to its geographical location (includes the group of Sahel countries) has an arid and semi-arid, warm and dry climate, with average annual temperature of around 25 ° C, low rainfall, we can identify two seasons that define the climate of the islands: the time of breezes (dry season - December to June) and the rainy season, which is usually between August to October, and July is the month of transition). Discovered between 1460 1462, by navigators in the service of the portuguese crown, under the sovereignty of Portugal for a period of about 500 years, the islands were the stage for a great miscegenation, and cross-influences, giving rise to a culture and way of being Creole. On 5 July 1975 the country gained its independence and since then has made a path for the development and has recorded several achievements on different fronts and is now a Middle Income Country.

25
Territory Physical Aspects
Thanks to its volcanic origin and insular nature, the archipelago of Cabo Verde (composed of ten islands nine of which inhabited) and the island of Santiago with 991 km2, representing about 24.6% of the national territory, the largest island, the island of Santo Antão follows, with 19.3% of the territory. The smallest is the island of Santa Luzia, with about 35 Km2 which represents around 0,9% of the territory of the country. The highest point of the archipelago is on Fogo Island, where the peak of the volcano reaches an altitude of 2829 meters. Table 1 - Location and Maximum Altitude of major elevations (mountain) of Cabo Verde
Islands Designation
(Mount) Geographical situation Predominant
Orientation Altitude
(m) Latitude Longitude
Santo Antão Tope da Coroa 17º 02' 05'' N 25º 18' 00'' W Noroeste-Sueste 1.979
S. Vicente Monte Verde 14º 52' 01' N 24º 65' 31'' W Norte-Sul 774
S. Nicolau Monte Gordo Noroeste-Sueste 1.304
Sal Monte Grande Nordeste-Sudoeste 406
Boa Vista Santo António …… 378
Maio Monte Penoso Leste-Oeste 436
Santiago Pico de Antónia 15º 02' 52'' N 23º 38' 42'' W Nordeste-Sudoeste 1.392
Fogo Pico do Fogo 14º 56' 52'' N 24º 21' 11'' W 2.829
Brava Fontainhas 14º 50' 54'' N 24º 42' 54'' W Leste-Oeste 976
Source: Statistical Yearbook of Cabo Verde, 1946 Table 2 - Maximum Length and Width, and Surface per island
Island/Islet Maximum lenght (m)
Maximum width (m)
Surface Km2
Santo Antão 42.750 23.970 779
S. Vicente 24.250 16.250 227
Santa Luzia 12.370 5.320 35
Islet Branco 3.975 1.270 3
Islet Raso 3.600 2.770 7
S. Nicolau 44.500 22.000 343
Sal 29.700 11.800 216
Boa Vista 28.900 30.800 620
Maio 24.100 16.300 269
Santiago 54.900 28.800 991
Fogo 26.300 23.900 476
Brava 10.500 9.310 64
Islet Grande 2.350 1.850 2
Islet Luís de Carneiro 1.950 500 0
Islet de Cima 2.400 750 1 Source: Anuário Statistical Yearbook of Cabo Verde, 1946

26
Table 3 – Location of the Outermost Points (Latitude and Longitude and location) per island
Islands
Latitude Longitude
Outermost Points Reference Points Outermost Points Reference Points
North South Extreme North Extreme South East West Extreme East Extreme West
Santo Antão 17º 12' N 16º 55' N Ponta do Sol Ponta Cais dos Fortes 24º 58' W 25º 22' W Ponta de Salina Ponta do Chão de Mangrande
S. Vicente 16º 55' N 16º 46' N Ponta Marigou Ponta Sul 24º 52' W 25º 06 W Ponta Calhau Ponta Machado
Santa Luzia 16º 48' N 16º 44' N Ponta dos Piquinhos
Ponta da Lage do Espia
24º 41' W 24º 48' W Ponta Mãe Grande Ponta Branca
S. Nicolau 16º 41' N 16º 29' N Baixa do Espechim
Ponta da Vermelharia 24º 01' W 24º 26' W Ponta Calheta Ponta Brouco
Sal 16º 51' N 16º 35' N Ponta Norte Ponta do Sinó 22º 52' W 23º 00' W Ponta de Morrinho Vermelho
Ilhéu de Rabo de Junco
Boa Vista 16º 14' N 15º 58' N Ponta do Sol Ponta Tarafe 22º 40' W 22º 58' W Ilhéu do Baluarte Ponta Varandinha
Maio 15º 20' N 15º 07' N Porto Cais Ponta Jampala 23º 06 W 23º 15' W Rosto de Vento Ponta Banconi
Santiago 15º 20' N 14º 54' N Ponta Moreira Ponta Temerosa 23º 26' W 23º 48' W Ponta S. Lourenço Ponta da Janela
Fogo 15º 04' N 14º 49' N Fio do Monte Vermelho
Ponta do Pescadeiro 24º 31' W 24º 17' W Ponta do Vale de Cavaleiros
Praia da Casinha
Brava 14º 54'N 14º 48' N Ponta do Insenso Ponta Nhô Martinho 24º 40' W 24º 46' W Ponta Rei Fernando Ponta Prainha
Source: Statistical Yearbook of Cabo Verde 1946

27
Administrative Division of the Country
Inherited from the colonial period, the administrative division of the country, has seen some changes over the years especially after independence. It should be noted that in 1975 (the year of independence) in terms of administrative division, the country was divided into 14 municipalities, and from 2005 to date, comprises 22 municipalities, 3 on the island of Santo Antão (13.6 %), three on Fogo island (13.6%), 9 the island of Santiago (40.9%) and the remaining islands corresponding to one municipality (S. Vicente, Sal, Boa Vista, Maio and Brava). Table 4 – Administrative Division of Cabo Verde (1975-2005)
1975 1991 1993 1996 2005
Ribeira Grande Ribeira Grande Ribeira Grande Ribeira Grande Ribeira Grande
Paul Paul Paul Paul Paul
Porto Novo Porto Novo Porto Novo Porto Novo Porto Novo
S. Vicente S. Vicente S. Vicente S. Vicente S. Vicente
S. Nicolau S. Nicolau S. Nicolau S. Nicolau Ribeira Brava
Sal Sal Sal Sal Tarrafal S. Nicolau
Boa Vista Boa Vista Boa Vista Boa Vista Sal
Maio Maio Maio Maio Boa Vista
Tarrafal Tarrafal Tarrafal Tarrafal Maio
Santa Catarina Santa Catarina Santa Catarina Santa Catarina Tarrafal
Santa Cruz Santa Cruz Santa Cruz Santa Cruz Santa Catarina
Praia Praia Praia Praia Santa Cruz
Fogo Mosteiros S. Domingos S. Domingos Praia
Brava S. Filipe Mosteiros S. Miguel S. Domingos
Brava S. Filipe Mosteiros S. Miguel
---- ---- Brava S. Filipe S. Salvador do Mundo
---- ---- ---- Brava S. Lourenço dos Órgãos
---- ---- ---- ----
Ribeira Grande de Santiago
---- ---- ---- ---- Mosteiros
---- ---- ---- ---- S. Filipe
---- ---- ---- ---- Santa Catarina do Fogo
---- ---- ---- ---- Brava No. of Municipalities
14 15 16 17 22

28
Statistical Division (Census Districts/Enumeration Area)
In the context of the National Statistical System (NSS) and pursuing purely statistical purposes, the National Statistics Institute (INE) refers to the codification of administrative units of the territory, establishing from this hierarchy, smaller territorial units _, building statistical division or Census Districts (CD) whose structure has a 6-digit code representing four hierarchical levels (1st level the islands, 2nd level the municipalities, 3rd level the Freguesia (civil parishes) and finally the CD's). Currently (for statistical purposes) the country is divided into 948 CD’s, about 51.9% on the Island of Santiago, followed by São Vicente (15.5%), Santo Antão (9.2 %) and Brava, the island with the lowest proportion of CD's (1.4%).
Table 5 – Number of Census Districts (CD) per island and municipality (2010)
Island Municipality No. CD's
Santo Antão
Ribeira Grande 38
Paul 12
Porto Novo 38
S. Vicente S. Vicente 147
S. Nicolau Ribeira Brava 21
Tarrafal de S. Nicolau 17
Sal Sal 52
Boa Vista Boavista 22
Maio Maio 18
Santiago
Tarrafal 47
Santa Catarina 84
Santa Cruz 44
Praia 217
S. Domingos 23
S. Miguel 32
S. Salvador do Mundo 15
S. Lourenço dos Órgãos 13
Ribeira Grande Santiago 17
Fogo
Mosteiros 18
S. Filipe 49
Santa Catarina do Fogo 11
Brava Brava 13 Source: INE’s Geospatial Database

29
Transport Infrastucture
In terms of the road network in 2013, the country had about 1046.4 km long, 37% of which on the island of Santiago and 20.4% in Santo Antão Island. What is noticeable is that the distribution of the road network has a certain proportionality depending on the size of the surface of each island. Currently, the country already has four international airports on the islands of Santiago, Boa Vista, Sal and São Vicente. The other islands, except Brava island, the island of Santo Antão and Santa Luzia, has an airport for domestic flights. Also, it should be noted that all the islands except the island of Santa Luzia (which is not inhabited) offer port infrastructure.
National Road Network
Table 6 - Extension and Classification of the National Road Network (2013)
Island Extension (km) Class (in Km) Remaining
(Without classification) 1st Class 2nd Class 3rd Class
Santo Antão 213,98 74,30 0,00 139,68
São Vicente 54,81 8,58 25,85 11,29 9,092
São Nicolau 94,10 25,96 5,00 63,15 0
Sal 39,06 39,06 0,00 0,00 0
Boa Vista 51,92 7,04 0,00 24,27 20,602
Maio 48,43 0,00 0,00 48,43 0
Santiago 389,71 167,41 8,19 214,11 0
Fogo 144,29 60,00 1,25 83,03 0
Brava 10,15 10,15
Total 1.046,439 382,352 40,281 594,112 29,694
Source: Institute for Roads
National Airport Infrastructure
Table 7 - Identification, Classification, Location and runway size (length and width) of Cabo Verde's airports and aerodromes
Island Designation Classification Location Runway (in meters)
Latitude Longitude Lenght Width
S. Vicente International Airport Cesária Évora
International 16º 50' 01'' N 25º 03' 17'' W 2.000 45
S. Nicolau Aerodrome of Preguiça (S. Nicolau)
Domestic 16º 35' 17''N 24º 17' 03 W 1.400 30
Sal International Airport Amílcar Cabral
International 16º 44' 15'' N 22º 57' 00'' W 3.000 45
Boa Vista International Airport Aristides Pereira
International 16º 08' 14'' N 22º 53' 19'' W 2.100 45
Maio Aerodrome of Maio Domestic 15º 09' 21'' N 23º 12' 49'' W 1.200 30
Santiago International Airport Nelson Mandela
International 14º 56' 28'' N 23º 29' 05'' W 2.100 45
Fogo Aerodrome of S. Filipe Domestic 14º 53' 06 N 24º 28' 48'' W 1.350 30
Source: Agency for Civil Aviation

30
National Port Infrastructure
Table 8 - Identification and Location of Cabo Verde Ports
Islands Municipalities Designation Location
Latitude Longitude
Santo Antão Porto Novo Porto Novo 17º 01' 1.65" N 25º 03' 31.94" W
S. Vicente S. Vicente Porto Grande 16º 53' 27.05" N 24º 59' 46.09" W
S. Nicolau Tarrafal de S. Nicolau Porto do Tarrafal 16º 33' 59.35" N 24º 21' 35.77" W
Sal Sal Porto da Palmeira 16º 45' 17.33" N 22º 58' 58.73" W
Boa Vista Boa Vista Porto de Sal Rei 16º 10' 40.88" N 22º 55' 26.40" W
Maio Maio Porto Inglês 15º 08' 30.93" N 23º 13' 9.23" W
Santiago Praia Porto da Praia 14º 54' 38.41" N 23º 29' 55.85" W
Fogo S. Filipe Porto Vale Cavaleiros 14º 55' 13.40" N 24º 30' 15.20" W
Brava Brava Porto da Furna 14º 53' 16.49" N 24º 40' 41.07" W Source: ENAPOR
Population density
Based on population data (Demographic projections 2010-2030) it can be seen that population density has increased steadily, growing at around 5% between 2011 and 2015, reaching this last year, the value of 130, 13 inhabitants / km2 at country level. However, in 2015, there is the diversity of values for each island, where we can highlight the island of São Vicente as the most densely populated of Cabo Verde (356.9 inhabitants per km2) followed by Santiago Island (296.8 inhabitants per km2) and Sal (156.2 inhabitants per km2). In the national context, these islands are the ones with more pressure of population on the resources available. Regarding the group of less densely populated islands (Boa Vista - 23.3 inhabitants per km2), (Maio - 25.9 inhabitants per km2) and (S. Nicolau - 36.2 Km2) the island of Boa Vista (which unlike the islands S. Nicolau and Maio, which have known, in recent years, a situation of stagnation or decline of the population) that has undergone, in recent years, rapid population growth and hence a significant increase in population density of 16.49 inhabitants per km2 in 2011 to 23.31 inhabitants per km2 in 2015 (an increase of 41.4% from 2011 and 2015) but remains the least densely populated island in the country. It should also be noted the islands of Santo Antão, São Nicolau, Fogo and Brava that showed a reduction in terms of this indicator, the result mainly of the migration process (internal and external) that takes place in these Islands.

31
Table 9 - Population density (Inhabitants / km2) per island (2011-2015)
Land area
Km2
Population Density
2011 2012 2013 2014 2015
Cabo Verde 4.033 123,96 125,46 127,00 128,56 130,13
Santo Antão 779 55,55 54,62 53,74 52,88 52,05
S. Vicente 227 340,92 345,04 349,08 353,04 356,89
S. Nicolau 343 37,24 36,99 36,74 36,48 36,22
Sal 216 127,47 134,70 141,92 149,11 156,24
Boa Vista 620 16,49 18,16 19,86 21,57 23,31
Maio 269 25,85 25,78 25,77 25,82 25,95
Santiago 991 281,50 285,23 289,03 292,90 296,81
Fogo 476 77,44 76,85 76,29 75,77 75,29
Brava 64 92,99 91,98 90,99 90,00 89,03 Source: Land area of the islands – Statistical Yearbook of Cabo Verde Population – INE
Chart 1 - Population density (inhabitants / km2) per island (2015)
Source: Land area of the islands – Statistical Yearbook of Cabo Verde Population – INE
23
26
36
52
75
89
156
297
357
00 100 200 300 400
Boa Vista
Maio
S. Nicolau
Santo Antão
Fogo
Brava
Sal
Santiago
S. Vicente
Hab./Km2

32
Cities and Villages in Cabo Verde
With the entry into force of Law No. 77 / VII / 2010 (OB No. 32 of August 23, 2010) Cabo Verde, which until then had 6 cities (Praia, Mindelo, Assomada, São Filipe, Porto Novo and Santiago city of Cabo Verde), has then expanded to 24 cities, distributed according to the municipalities (except for Ribeira Grande and sal with two cities each) i.e. 9 cities in Santiago, 4 in Santo Antão, 3 in Fogo, 2 in Sal, 2 in São Nicolau and 1 in each of the remaining islands. Recently with the approval of Decree-Law No. 45/2015, 19 locations on all islands except S. Vicente, are now cities. Table 10 – Identification and Designation of Cabo Verde Cities (2015)
Island Municipality Designation
Santo Antão
Ribeira Grande Cidade de Ponta do Sol
Cidade de Povoação
Paul Cidade das Pombas
Porto Novo Cidade de Porto Novo
S. Vicente S. Vicente Cidade de Mindelo
S. Nicolau Ribeira Brava Cidade da Ribeira Brava
Tarrafal de S. Nicolau Cidade de Tarrafal de S. Nicolau
Sal Sal Cidade dos Espargos
Cidade de Santa Maria
Boa Vista Boa Vista Cidade de Sal Rei
Maio Maio Cidade do Porto Inglês
Santiago
Tarrafal Cidade de Tarrafal
Santa Catarina Cidade de Assomada
Santa Cruz Cidade de Pedra Badejo
Praia Cidade da Praia
S. Domingos Cidade da Várzea da Igreja
S. Miguel Cidade da Calheta de S. Miguel
S. Salvador do Mundo Cidade de Achada Igreja
S. Lourenço dos Órgãos Cidade de João Teves
Ribeira Grande de Santiago Cidade de Santiago de Cabo Verde
Fogo
Mosteiros Cidade da Igreja
S. Filipe Cidade de S. Filipe
Santa Catarina do Fogo Cidade de Cova Figueira
Brava Brava Cidade de Nova Sintra Source: O.B. No. 32 - Series I (Law No. 77 / VII / 2010)

33
Table 11 - Identification and Location of Cabo Verde Towns (2015)
Island Municipality Localities
Santo Antão Ribeira Grande
Chã de Igreja
Coculi
Porto Novo Ribeira das Patas
S. Nicolau Ribeira Brava
Fajã de Baixo
Juncalinho
Tarrafal de S. Nicolau Praia Branca
Sal Sal Palmeira
Boa Vista Boa Vista Rabil
Maio Maio Calheta
Barreiro
Santiago
Tarrafal Ribeira das Pratas
Achada Tenda
Santa Catarina
Chã de Tanque
Achada Falcão
Ribeira da Barca
S. Miguel Achada do Monte
Fogo S. Filipe Ponta Verde
Patim
Brava Brava Nossa Senhora do Monte
Source: O.B. No. 55 – Series I (Decree-law No. 45/2015)


35

36
Population and Social Conditions
Population
The population of Cabo Verde has grown continuously over the past 5 years. In 2015, it was
estimated a number of 524,833 people residents, an increase of 6,336 people compared to
2014, corresponding to a growth rate of 1.23%.
The analysis by Municipality indicates that Praia and São Vicente have higher concentrations of the population, representing, in 2015, 28.9% and 15.4% of the total, respectively. Smaller population concentrations were registered in the municipalities of S. Nicolau de Tarrafal (1%) and Santa Catarina do Fogo (1.1%). Table 12- Resident population in Cabo Verde by municipality (2011-2015)
Municipality 2011 2012 2013 2014 2015
Cabo Verde 499.929 505.983 512.173 518.467 524.833
Ribeira Grande 18.532 18.129 17.748 17.375 17.017
Paul 6.809 6.616 6.433 6.261 6.099
Porto Novo 17.931 17.807 17.681 17.556 17.431
S. Vicente 77.389 78.325 79.241 80.140 81.014
Ribeira Brava 7.515 7.431 7.347 7.262 7.182
Tarrafal de S. Nicolau 5.257 5.256 5.254 5.249 5.242
Sal 27.534 29.096 30.655 32.208 33.747
Boavista 10.226 11.262 12.313 13.376 14.451
Maio 6.952 6.934 6.932 6.947 6.980
Tarrafal 18.559 18.488 18.424 18.367 18.314
Santa Catarina 43.741 44.052 44.387 44.745 45.123
Santa Cruz 26.654 26.579 26.509 26.436 26.360
Praia 136.237 139.993 143.787 147.607 151.436
S. Domingos 13.902 13.936 13.970 14.004 14.037
Calheta de S. Miguel 15.481 15.271 15.067 14.867 14.671
S. Salvador do Mundo 8.689 8.680 8.670 8.661 8.652
S. Lourenço dos Órgãos 7.344 7.288 7.233 7.179 7.127
Ribeira Grande de Santiago 8.363 8.372 8.385 8.399 8.415
Mosteiros 9.512 9.468 9.428 9.394 9.364
S. Filipe 22.035 21.806 21.587 21.384 21.194
Santa Catarina do Fogo 5.316 5.307 5.299 5.290 5.279
Brava 5.951 5.887 5.823 5.760 5.698
Source: INE

37
The natural growth rate (TCN) increased from 1.5% in 2011 to 1.4% in 2015. The average
annual growth rate (CAGR) maintained the same value in 2015 (1.2%) presented in 2011. it is
noted a significant difference for County; with the exception of S. Vicente, Sal, Boa Vista, Maio,
Santa Catarina Santiago, Praia and São Domingos (which had a positive TCMA), all other
municipalities had a negative TCMA. In terms of TCN all municipalities have grown positively,
with the highest growth registered in Sal Island (2.2%) and the lowest growth in Ribeira Grande
de Santo Antao (0.6%) and Ribeira Brava S. Nicolau (0.7%).
Life expectancy at birth for female individuals is higher than the male's. In 2015, life expectancy for men was 71.7 years, while for women was 79.9 years, indicating a difference of 8.2 years.
Table 13 - Annual rate of natural growth (TCN), Average Annual Growth Rate (TCMA) and Life Expectancy at Birth (2011-2015)
Annual rate of natural growth
(TCN) (%)
Average Annual Growth Rate (TCMA) (%)
Life expectancy at birth (years)
e0 (Male) e0 (Female)
2011 1,52 1,19 69,9 79,2
2012 1,49 1,21 70,3 79,4
2013 1,46 1,22 70,7 79,5
2014 1,43 1,23 71,1 79,7
2015
Cabo Verde 1,38 1,23 71,5 79,9
Ribeira Grande 0,62 -2,06 71,5 79,9
Paul 0,8 -2,59 71,5 79,9
Porto Novo 1,14 -0,71 71,5 79,9
S. Vicente 1,18 1,09 71,5 79,9
Ribeira Brava 0,65 1,10 71,5 79,9
Tarrafal S. Nicolau 1,26 -0,15 71,5 79,9
Sal 2,17 4,78 71,5 79,9
Boa Vista 1,64 8,04 71,5 79,9
Maio 0,92 0,48 71,5 79,9
Tarrafal 1,41 -0,29 71,5 79,9
Santa catarina 1,25 0,84 71,5 79,9
Santa Cruz 1,40 -0,29 71,5 79,9
Praia 1,67 2,59 71,5 79,9
S. Domingos 1,32 0,24 71,5 79,9
S. Miguel 1,14 -1,32 71,5 79,9
S. Salvador do Mundo 1,23 -0,11 71,5 79,9
S. Lourenço dos Órgãos 0,87 -0,72 71,5 79,9
Ribeira Grande de Santiago 1,23 0,19 71,5 79,9
Mosteiros 1,27 -0,32 71,5 79,9
S. Filipe 1,11 -0,89 71,5 79,9
Santa Catarina do Fogo 1,43 -0,21 71,5 79,9
Brava 1,18 -1,08 71,5 79,9
Source: INE

38
Age Structure of the Population
As for the age structure of the population by age (population according to age groups and sex),
it appears that in 2015 the number of young people (people between 0 and 14 years of age)
was 154,232 (29.4 % of total resident population). The group of 15 to 24 has 104,771 (20.0%
of the total) and the estimated value for people aged 25 to 64 was 237,235 (45.2%). Regarding
the elderly (people aged 65 or more years old), it was estimated a value of 28,597 (5.4% of
the total).
Regarding the gender based structure, the weight of the female population was higher than
the male population over these years, with the exception of 2015 in which male individuals
accounted for half of the resident population.
Table 14 - Population according to sex and age group (2011-2015)
2011 2012 2013 2014 2015
Male Female Male Female Male Female Male Female Male Female
Total 247.813 252.112 251.384 254.600 255.031 257.139 258.744 259.723 262.501 262.334
0-4 years 25.605 25.499 25.441 25.073 25.450 24.816 25.885 24.984 26.298 25.129
5-9 years 25.983 26.094 26.009 26.136 26.071 26.205 25.881 26.016 25.632 25.764
10-14 years 27.077 26.562 26.731 26.309 26.278 26.041 25.866 25.782 25.660 25.749
15-19 years 28.737 28.442 27.983 27.673 27.204 26.838 26.532 25.866 25.600 24.763
20-24 years 27.942 26.547 28.179 26.813 28.304 26.937 27.957 26.866 27.690 26.718
25-29 years 24.148 21.910 25.135 22.870 26.032 23.690 26.924 24.544 27.719 25.175
30-34 years 19.763 17.160 20.789 17.785 21.781 18.639 22.813 19.589 23.857 20.743
35-39 years 15.240 13.888 15.957 14.437 16.804 14.920 17.990 15.672 18.915 16.274
40-44 years 13.353 13.382 13.522 13.169 13.740 13.122 13.875 13.023 14.372 13.123
45-49 years 11.900 12.738 12.289 13.094 12.572 13.192 12.655 13.138 12.733 13.025
50-54 years 8.598 10.068 9.280 10.631 9.981 11.158 10.679 11.688 10.985 11.903
55-59 years 5.066 7.626 5.506 7.990 6.108 8.594 6.686 9.032 7.602 9.606
60-64 years 2.796 3.890 3.152 4.549 3.517 5.224 4.023 6.088 4.419 6.784
65-69 years 2.383 3.593 2.431 3.627 2.385 3.557 2.242 3.221 2.288 3.259
70-74 years 2.982 4.778 2.617 4.190 2.287 3.621 2.195 3.474 2.081 3.251
75-79 years 2.726 4.351 2.730 4.404 2.751 4.421 2.682 4.346 2.644 4.382
80-84 years 2.098 3.084 2.125 3.191 2.173 3.350 2.152 3.414 2.104 3.359
85-89 years 924 1.422 1.043 1.610 1.137 1.757 1.221 1.853 1.349 2.102
90-94 years 351 659 325 617 315 612 344 678 406 735
95+ years 141 419 140 432 141 445 142 449 147 490
Source: INE

39
The average age of the population of Cabo Verde has been around around 27.4 years between
2011 and 2015. In 2015 this indicator reached the average value of 28, a slight increase
compared to the year 2014. By municipality, it is noted that in 2015, Santa Cruz comes up with
lower average age (25.9 years), and Ribeira Grande with the highest average age of the
population (32.4 years).
Table 15 - Average age of the population by municipality (2011-2015)
2011
2012
2013
2014
2015
Cabo Verde 26,87 27,16 27,45 27,74 28,01
Ribeira Grande 30,92 31,26 31,69 32,06 32,43
Paul 29,56 29,97 30,40 30,82 31,26
Porto Novo 28,56 28,93 29,26 29,60 29,94
S. Vicente 29,08 29,38 29,67 29,98 30,28
Ribeira Brava 31,03 31,38 31,66 32,02 32,29
Tarrafal S. Nicolau 28,39 28,70 28,97 29,31 29,59
Sal 25,55 25,74 25,94 26,16 26,39
Boa Vista 28,11 28,00 27,97 27,99 28,06
Maio 28,73 29,17 29,55 30,05 30,48
Tarrafal 26,14 26,53 26,90 27,31 27,65
Santa Catarina 25,91 26,25 26,59 26,90 27,18
Santa Cruz 24,51 24,84 25,19 25,56 25,88
Praia 25,58 25,89 26,19 26,48 26,78
S. Domingos 25,60 25,87 26,15 26,40 26,69
S. Miguel 26,25 26,68 27,10 27,50 27,90
S. Salvador do Mundo 26,45 26,72 26,99 27,23 27,46
S. Lourenço dos Órgãos 27,86 28,13 28,43 28,72 28,98
Ribeira Grande Santiago 25,58 25,88 26,24 26,58 26,92
Mosteiros 26,69 26,91 27,17 27,39 27,59
S. Filipe 27,16 27,44 27,75 28,06 28,38
Santa catarina do Fogo 25,68 25,72 25,86 25,96 26,11
Brava 28,01 28,28 28,63 28,97 29,29 Source: INE

40
Table 16 – Gender Ratio (2010-2014)
Gender Ratio
2010 97,9 2011 98,3 2012 98,7 2013 99,2 2014 99,6 2015 Cabo Verde 100,1
Ribeira Grande 116,8
Paul 131,6 Porto Novo 108,9 S. Vicente 102,5 Ribeira Brava 111,7 Tarrafal de S. Nicolau 108,3 Sal 114,3 Boavista 143,0 Maio 96,2 Tarrafal 83,1 Santa Catarina 96,5 Santa Cruz 96,5 Praia 97,6 S. Domingos 98,1 S. Miguel 83,4 S. Salvador do Mundo 94,1 S. Lourenço dos Órgãos 98,0 Ribeira Grande de Santiago 95,4 Mosteiros 93,0 S. Filipe 95,1 Santa Catarina do Fogo 100,9 Brava 96,6
Source: INE The total dependency ratio has been decreasing continuously in the past five years, mainly due to the significant number of men and women of working age compared to the population of children and the elderly. In 2010 this indicator showed a value of 61.8% and increased to 53.5% in 2015. In terms of youth dependency ratio and the old-age dependency the situation is similar to the total dependency ratio, that is, both have been decreasing over time Table 17 - Dependency ratio (total, Youth, Elderly) aging index and longevity (2011-2015)
2011 2012 2013 2014 2015
Overall Dependency Index 59,6 57,7 56 54,5 53,5
Youth Dependency Index 50,1 48,5 47,2 46 45,1
Old Age Dependency Index 9,6 9,2 8,8 8,5 8,4
Aging Index 19,1 18,9 18,7 18,4 18,5
Longevity Index 54,1 56,4 59,1 60,8 62,0
Source: INE
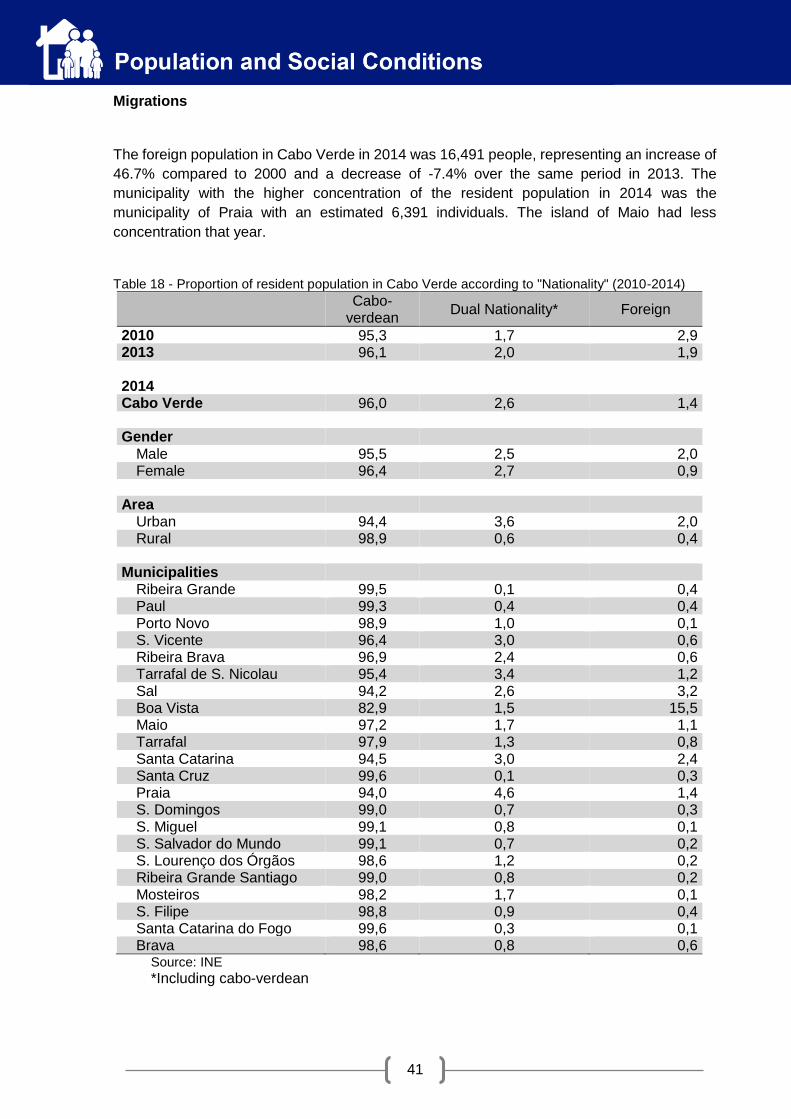
41
Migrations
The foreign population in Cabo Verde in 2014 was 16,491 people, representing an increase of
46.7% compared to 2000 and a decrease of -7.4% over the same period in 2013. The
municipality with the higher concentration of the resident population in 2014 was the
municipality of Praia with an estimated 6,391 individuals. The island of Maio had less
concentration that year.
Table 18 - Proportion of resident population in Cabo Verde according to "Nationality" (2010-2014)
Cabo-
verdean Dual Nationality* Foreign
2010 95,3 1,7 2,9 2013 96,1 2,0 1,9 2014 Cabo Verde 96,0 2,6 1,4 Gender
Male 95,5 2,5 2,0 Female 96,4 2,7 0,9
Area
Urban 94,4 3,6 2,0 Rural 98,9 0,6 0,4
Municipalities
Ribeira Grande 99,5 0,1 0,4 Paul 99,3 0,4 0,4 Porto Novo 98,9 1,0 0,1 S. Vicente 96,4 3,0 0,6 Ribeira Brava 96,9 2,4 0,6 Tarrafal de S. Nicolau 95,4 3,4 1,2 Sal 94,2 2,6 3,2 Boa Vista 82,9 1,5 15,5 Maio 97,2 1,7 1,1 Tarrafal 97,9 1,3 0,8 Santa Catarina 94,5 3,0 2,4 Santa Cruz 99,6 0,1 0,3 Praia 94,0 4,6 1,4 S. Domingos 99,0 0,7 0,3 S. Miguel 99,1 0,8 0,1 S. Salvador do Mundo 99,1 0,7 0,2 S. Lourenço dos Órgãos 98,6 1,2 0,2 Ribeira Grande Santiago 99,0 0,8 0,2 Mosteiros 98,2 1,7 0,1 S. Filipe 98,8 0,9 0,4 Santa Catarina do Fogo 99,6 0,3 0,1 Brava 98,6 0,8 0,6
Source: INE
*Including cabo-verdean

42
Table 19 - Foreign population residing in Cabo Verde by municipality (2010-2014)
2000 2010 2013 2014
Cabo Verde 11.240 11.225 17.806 16.491
Ribeira Grande 276 - 112 -
Paul - - - -
Porto novo 146 - 209 171
S. Vicente 1.965 1.347 2.742 2.180
Ribeira Brava - - - -
Tarrafal de S. Nicolau 199 - 158 130
Sal 635 1.572 2.003 1.538
Boa Vista 133 1.010 1.942 2.239
Maio - - 147 116
Tarrafal 408 - 422 464
Santa Catarina 896 898 1.494 2.038
Santa Cruz 542 - 249 170
Praia 4.878 4.715 7.262 6.391
S. Domingos 160 - 149 171
S. Miguel 179 - 162 148
S. Salvador do Mundo - - - -
S. Lourenço dos Órgãos - - - -
Ribeira Grande de Santiago - - - -
Mosteiros 147 - - -
S. Filipe 302 - 263 169
Santa Catarina do Fogo 0 - - -
Brava 286 - - -
Other 89 1.684 510 566
Source: INE

43
The migration balance in Cabo Verde continued to be negative, ie, there are more people leaving the country than entering. However, in terms of trend, it is noted that this deficit has been declining, from -1,822 in 2011 to -1,010 in 2015, a decrease of -44.6%.
Table 20 – Migration Balance (2011 – 2015)
Migration Balance
(inhabitants)
2011 -1822
2012 -1598
2013 -1409
2014 -1212
2015
Cabo Verde -1010
Ribeira Grande -466
Paul -212
Porto Novo -326
São Vicente -74
Ribeira Brava -127
Tarrafal S. Nicolau -74
Sal 840
Boa Vista 856
Maio -30
Tarrafal -312
Santa catarina -181
Santa Cruz -445
Praia 1369
S. Domingos -151
S. Miguel -365
S. Salvador do Mundo -116
S. Lourenço dos Órgãos -114
Ribeira Grande de Santiago -88
Mosteiros -149
S. Filipe -427
Santa Catarina do Fogo -86
Brava -130 Source: INE

44
Table 21 - Proportion of population by marital status, on the island (2010-2014)
Marital Status
Single Married Unmarried Partners
Divorced Separated Widow/er
2010 45,8 12,7 26,1 12,3 0,5 2,4
2012 50,2 13,9 23,2 0,5 8,0 4,1
2013 49,3 13,1 24,0 0,7 9,0 3,9
2014
Cabo Verde 49,9 12,5 23,8 0,9 9,3 3,7
Gender
Male 55,5 12,3 23,7 0,9 6,4 1,2
Female 44,4 12,6 23,9 0,8 12,0 6,2
Area
Urban 47,7 12,5 24,9 1,1 10,8 3,0
Rural 54,1 12,5 21,7 0,3 6,3 5,1
Municipalities
Ribeira Grande 57,4 12,1 19,7 1,1 2,6 7,1
Paul 63,6 8,3 25,0 0,1 0,2 2,9
Porto Novo 49,9 9,6 24,4 0,4 10,4 5,3
S. Vicente 46,0 11,0 24,3 1,8 13,8 3,2
Ribeira Brava 58,8 14,2 18,8 1,0 2,0 5,2
Tarrafal de S. Nicolau 51,3 14,0 22,2 0,5 7,5 4,5
Sal 43,4 8,9 37,2 0,8 7,8 2,0
Boa Vista 55,2 9,8 33,0 0,3 0,3 1,4
Maio 48,2 17,2 22,6 0,5 6,8 4,7
Tarrafal 52,5 15,0 17,3 0,5 8,4 6,4
Santa Catarina 51,0 15,7 20,7 0,3 7,8 4,5
Santa Cruz 55,6 11,7 20,2 0,0 8,8 3,7
Praia 47,9 12,5 24,4 1,1 11,5 2,6
S. Domingos 58,2 10,3 21,5 0,2 6,3 3,4
S. Miguel 56,9 18,0 17,3 0,1 1,6 6,1
S. Salvador do Mundo 63,8 12,4 15,8 0,0 2,4 5,5
S. Lourenço dos Órgãos 63,7 12,5 15,3 0,1 1,7 6,7
Ribeira Grande Santiago 57,2 11,9 23,3 0,1 4,4 3,1
Mosteiros 41,6 15,8 26,7 0,5 11,6 3,8
S. Filipe 43,5 13,2 24,0 1,4 12,5 5,4
Santa Catarina do Fogo 38,8 18,4 29,0 0,6 9,7 3,5
Brava 46,5 14,5 23,8 0,4 11,4 3,3
Source: INE
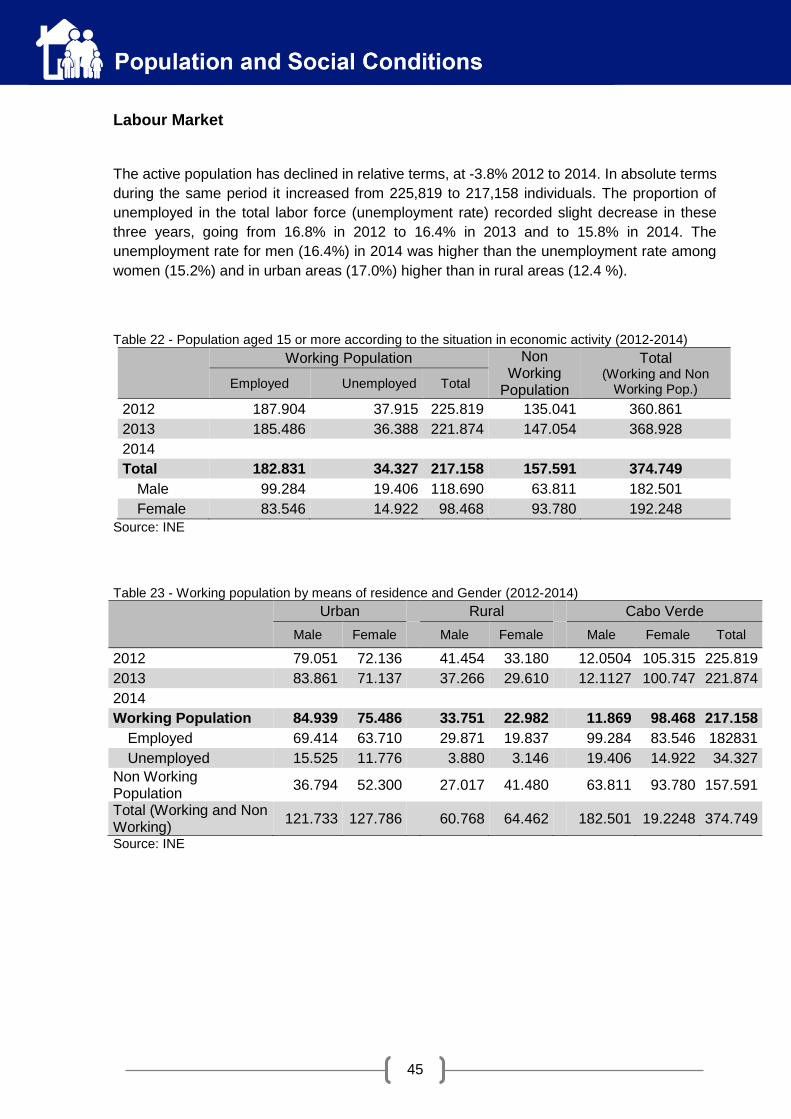
45
Labour Market
The active population has declined in relative terms, at -3.8% 2012 to 2014. In absolute terms
during the same period it increased from 225,819 to 217,158 individuals. The proportion of
unemployed in the total labor force (unemployment rate) recorded slight decrease in these
three years, going from 16.8% in 2012 to 16.4% in 2013 and to 15.8% in 2014. The
unemployment rate for men (16.4%) in 2014 was higher than the unemployment rate among
women (15.2%) and in urban areas (17.0%) higher than in rural areas (12.4 %).
Table 22 - Population aged 15 or more according to the situation in economic activity (2012-2014)
Working Population Non Working
Population
Total (Working and Non
Working Pop.) Employed Unemployed Total
2012 187.904 37.915 225.819 135.041 360.861
2013 185.486 36.388 221.874 147.054 368.928
2014
Total 182.831 34.327 217.158 157.591 374.749
Male 99.284 19.406 118.690 63.811 182.501
Female 83.546 14.922 98.468 93.780 192.248
Source: INE
Table 23 - Working population by means of residence and Gender (2012-2014)
Urban Rural Cabo Verde
Male Female Male Female Male Female Total
2012 79.051 72.136 41.454 33.180 12.0504 105.315 225.819
2013 83.861 71.137 37.266 29.610 12.1127 100.747 221.874
2014
Working Population 84.939 75.486 33.751 22.982 11.869 98.468 217.158
Employed 69.414 63.710 29.871 19.837 99.284 83.546 182831
Unemployed 15.525 11.776 3.880 3.146 19.406 14.922 34.327
Non Working Population
36.794 52.300 27.017 41.480 63.811 93.780 157.591
Total (Working and Non Working)
121.733 127.786 60.768 64.462 182.501 19.2248 374.749
Source: INE

46
Of the three (3) economic activity sectors, the tertiary sector has shown the highest rate of
employees, with an average of around 61% between 2012 and 2014. In 2014, this sector
showed an employment rate of 65.5%, 5.1 pp more than in 2013. Meanwhile, in the primary
sector the rate has been declining, dropping from 23% in 2013 to 16.7% in 2014 (decrease of
-6.3 pp).
Table 24 - Structure of employees by sector of activity (2012-2014)
Sector of Activity 2012 2013 2014
Primary 25,5 23,0 16,7
Secondary 17,3 16,6 17,8
Tertiary 57,2 60,4 65,5
Source: INE
The type of profession that has shown greater degree of employability according to 2014 data,
is the group of "elementary professions", by around 26.3%, followed by "Personal services,
protection, security and sellers", by around 23.4%, and "skilled workers in industry,
construction and craftsmen" by around 14%.
Table 25 - Employed population by main professions (2012-2014)
Main Professions 2012 2013 2014
Military 0,1 0,2 0,1
Legislators, executives, directors and executive managers 3,2 2,5 1,8
Professionals 7,8 8,7 10,4
Technicians and associate professionals 5,4 4,9 5,2
Administrative staff 3,2 4,0 4,5
Personal services, protection, security and sellers 22,7 22,5 23,4
Skilled workers in agriculture, fishing and forestrya 14,0 15,1 8,6
Skilled industrial workers, construction and craftsmen 12,2 13,4 14,0
Plant, machine and assembly operators 4,4 4,5 5,6
Elementary professions 27,0 24,3 26,3 Source: INE
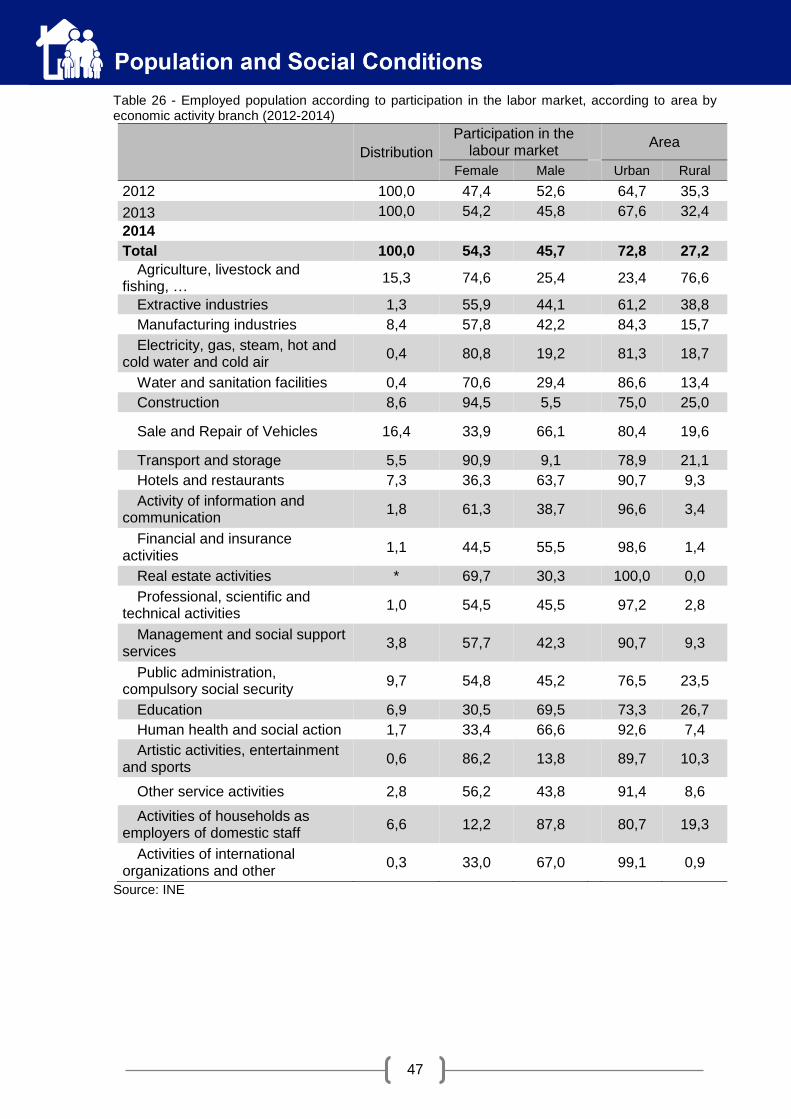
47
Table 26 - Employed population according to participation in the labor market, according to area by economic activity branch (2012-2014)
Distribution
Participation in the labour market
Area
Female Male Urban Rural
2012 100,0 47,4 52,6 64,7 35,3
2013 100,0 54,2 45,8 67,6 32,4
2014
Total 100,0 54,3 45,7 72,8 27,2
Agriculture, livestock and fishing, …
15,3 74,6 25,4 23,4 76,6
Extractive industries 1,3 55,9 44,1 61,2 38,8
Manufacturing industries 8,4 57,8 42,2 84,3 15,7
Electricity, gas, steam, hot and cold water and cold air
0,4 80,8 19,2 81,3 18,7
Water and sanitation facilities 0,4 70,6 29,4 86,6 13,4
Construction 8,6 94,5 5,5 75,0 25,0
Sale and Repair of Vehicles 16,4 33,9 66,1 80,4 19,6
Transport and storage 5,5 90,9 9,1 78,9 21,1
Hotels and restaurants 7,3 36,3 63,7 90,7 9,3
Activity of information and communication
1,8 61,3 38,7 96,6 3,4
Financial and insurance activities
1,1 44,5 55,5 98,6 1,4
Real estate activities * 69,7 30,3 100,0 0,0
Professional, scientific and technical activities
1,0 54,5 45,5 97,2 2,8
Management and social support services
3,8 57,7 42,3 90,7 9,3
Public administration, compulsory social security
9,7 54,8 45,2 76,5 23,5
Education 6,9 30,5 69,5 73,3 26,7
Human health and social action 1,7 33,4 66,6 92,6 7,4
Artistic activities, entertainment and sports
0,6 86,2 13,8 89,7 10,3
Other service activities 2,8 56,2 43,8 91,4 8,6
Activities of households as employers of domestic staff
6,6 12,2 87,8 80,7 19,3
Activities of international organizations and other
0,3 33,0 67,0 99,1 0,9
Source: INE

48
The activity rate in Cabo Verde decreased from 60.1% in 2013 to 57.9% in 2014, representing
a decrease of -2.2 pp. By gender, it appears that this rate is higher among men than among
women. The municipality with the lowest activity rate in 2014 was São Lourenço dos Orgãos
while Sal Island presented a higher value, around 81%.
In terms of area, it appears that from 2012 to 2014, this rate was higher in the urban areas
than in the rural areas. In 2014 the rate was around 64.3% in urban areas, while in rural areas
the rate was around 45.3%. Most municipalities display a higher activity rate in the urban areas
compared to the rural areas, except for the municipalities of Porto Novo, S. Vicente, and Santa
Catarina do Fogo.
As expected, the lowest activity rate is concentrated on individuals of the 65 age bracket
(elderly) (10.9%) and the highest rate in individuals in the 35 to 39 age bracket ( 82.9%).
Table 27 - Activity rate according to gender by municipality (2012-2014)
Gender
Male Female Both
2012 69,0 56,6 62,6
2013 67,1 53,5 60,1
2014
Cabo Verde 65,0 51,2 57,9
Ribeira Grande 53,7 32,0 43,7
Paul 61,8 36,3 51,0
Porto Novo 71,9 50,0 61,4
S. Vicente 69,7 48,9 59,5
Ribeira Brava 60,9 36,1 49,2
Tarrafal de S. Nicolau 65,6 50,9 58,5
Sal 87,1 74,5 81,0
Boa Vista 83,7 73,3 79,6
Maio 58,9 38,1 48,3
Tarrafal 51,8 49,1 50,2
Santa Catarina 48,3 38,5 43,0
Santa Cruz 65,2 45,4 54,7
Praia 68,1 64,7 66,3
S. Domingos 55,5 37,3 46,0
S. Miguel 46,3 35,3 39,8
S. Salvador do Mundo 68,5 50,7 58,9
S. Lourenço dos Órgãos 43,5 31,1 37,1
Ribeira Grande Santiago 57,1 44,6 50,5
Mosteiros 61,1 27,1 43,8
S. Filipe 52,3 34,1 42,6
Santa Catarina do Fogo 72,3 38,1 54,8
Brava 57,3 30,9 43,5
Source: INE

49
Table 28 - Activity rate according to the means of residence by municipality (2012-2014)
Area
Cabo Verde Urban Rural
2012 65,1 58,1 62,6
2013 63,7 53,3 60,1
2014
Cabo Verde 64,3 45,3 57,9
Ribeira Grande 59,8 38,3 43,7
Paul 57,2 49,4 51,0
Porto Novo 60,6 62,8 61,4
S. Vicente 59,4 61,6 59,5
Ribeira Brava 60,4 46,3 49,2
Tarrafal de S. Nicolau 58,7 57,6 58,5
Sal 81,7 75,4 81,0
Boa Vista 82,2 69,0 79,6
Maio 64,5 41,0 48,3
Tarrafal 61,2 43,3 50,2
Santa Catarina 61,9 36,6 43,0
Santa Cruz 55,6 54,0 54,7
Praia 66,3 * 66,3
S. Domingos 55,0 42,9 46,0
S. Miguel 40,5 39,4 39,8
S. Salvador do Mundo 60,8 58,6 58,9
S. Lourenço dos Órgãos 47,6 35,6 37,1
Ribeira Grande Santiago 60,3 48,7 50,5
Mosteiros 46,8 41,6 43,8
S. Filipe 52,5 36,3 42,6
Santa Catarina do Fogo 47,5 57,0 54,8
Brava 56,0 40,6 43,5
Source: INE
*According to the cartographic update carried out in 2013, the municipality of Praia is entirely urban

50
Table 29 - Activity rate according to the area and gender by age group (2012-2014)
Age Groups Urban Rural Cabo Verde
Male Female Both Male Female Both Male Female Both
2012 70,1 60,3 65,1 66,9 49,9 58,1 69,0 56,6 62,6
2013 70,0 57,5 63,7 61,3 45,7 53,3 67,1 53,5 60,1
2014
Total 69,8 59,1 64,3 55,5 35,7 45,3 65,0 51,2 57,9
15-19 years 13,7 12,4 13,1 19,0 9,8 14,7 15,9 11,3 13,7
20-24 years 67,7 58,8 63,2 56,7 30,5 44,9 63,7 49,8 57,0
25-29 years 83,6 73,4 78,6 71,5 47,2 60,4 80,1 66,6 73,6
30-34 years 88,1 80,9 84,5 77,7 60,8 69,1 85,1 75,0 80,0
35-39 years 90,3 83,8 86,9 82,3 59,3 70,5 88,3 77,9 82,9
40-44 years 91,9 80,6 85,8 78,4 57,0 67,3 87,7 73,7 80,2
45-49 years 89,8 79,4 84,9 78,2 54,8 65,7 86,3 70,5 78,6
50-54 years 79,0 69,5 74,3 78,1 46,5 60,7 78,8 61,5 69,8
55-59 years 78,5 46,1 60,9 61,4 44,8 51,4 73,1 45,6 57,6
60-64 years 57,2 29,1 41,0 52,1 26,7 34,7 55,8 28,2 38,9
65 + years 19,8 7,2 12,3 15,3 5,2 9,1 17,8 6,3 10,9
Source: INE

51
Regarding the occupancy rate, ie, the employment-population ratio, there was an increase of
1.5 pp. in 2014. This growth was achieved both in males (1.3 pp) as in females (1.5 pp.). By
municipality, Ribeira Grande de Santo Antao had lower occupancy rate in 2014, reaching a
value of 31.7%.
Table 30 - Occupancy rate or population employment ratio according to gender by municipality (2012-2014)
Municipality 2012 2013 2014
Male Female Both Male Female Both Male Female Both
Cabo Verde 57,1 47,3 52,1 55,7 45,0 50,3 54,4 43,5 48,8
Ribeira Grande 40,5 24,1 32,9 32,3 22,5 27,8 40,0 22,2 31,7
Paul 52,5 28,1 41,9 56,5 24,3 42,5 47,4 24,9 37,9
Porto Novo 54,7 30,9 43,6 51,7 31,2 41,9 59,6 39,8 50,1
S. Vicente 52,5 41,0 46,6 56,3 40,5 48,6 60,3 42,8 51,8
Ribeira Brava 47,0 30,4 39,0 45,3 27,8 36,6 54,1 32,4 43,9
Tarrafal S. Nicolau 62,6 42,2 52,7 57,4 45,2 51,5 59,4 47,3 53,6
Sal 67,4 60,4 64,1 74,1 64,2 69,4 75,2 63,0 69,4
Boa Vista 64,2 62,5 63,5 80,1 63,5 73,4 72,3 54,7 65,3
Maio 58,9 38,3 48,0 61,9 39,9 50,5 47,9 34,0 40,8
Tarrafal 60,6 60,2 60,4 55,2 53,2 54,0 46,3 42,2 43,9
Santa Catarina 60,2 50,6 55,0 60,3 50,9 55,1 41,1 32,6 36,5
Santa Cruz 67,1 53,8 60,3 54,5 48,1 51,1 54,2 40,1 46,7
Praia 54,7 51,5 53,0 51,5 47,2 49,3 51,8 54,0 53,0
S. Domingos 51,2 35,4 42,9 51,7 32,2 41,6 53,4 33,5 43,0
S. Miguel 67,7 63,1 65,0 62,5 58,3 60,0 42,0 31,5 35,8
S. Salvador Mundo 71,3 60,7 65,5 65,1 50,2 56,9 65,8 46,9 55,6
S. Lourenço dos Órgãos 57,0 42,7 49,4 44,5 30,6 37,2 39,3 27,9 33,4
Ribeira Grande Santiago 51,9 37,4 44,0 42,6 29,1 35,5 52,6 40,8 46,3
Mosteiros 64,8 26,6 45,0 67,2 31,3 48,4 57,6 22,8 39,9
S. Filipe 65,4 53,6 59,1 54,4 50,0 52,1 48,6 31,0 39,2
Santa Catarina do Fogo 56,1 25,3 40,7 67,5 37,0 52,5 69,4 35,5 52,1
Brava 49,9 30,0 39,6 41,4 24,8 32,8 49,0 24,1 36,0
Source: INE

52
Unemployment
The unemployment rate in Cabo Verde has gone from 10.7% in 2010 to 15.8% in 2014, an
increase of 5.1 pp. Compared to the year 2013, this rate decreased by -0.6 pp. The youth
unemployment rate (14-24 years) continues to grow, increasing from 34.6% in 2013 to 50.8%
in 2014, representing an increase of 16.2 pp.
Regarding the unemployment rate by gender it turns out that it is lower in females than in
males. In 2014, unemployment among women was around 15.2% and among men was around
16.3%.
In the rural area unemployment rate was 12.4% and in the urban areas was 17%. However, when analyzed by municipality, it appears that Santa Catarina do Fogo is the municipality that showed the lowest unemployment rate in 2014 (5%), while the Ribeira Grande de Santo Antão had the highest rate of around 27.4%.
Table 31 - Unemployment rate by municipality (2010-2014)
2010 2012 2013 2014
Cabo Verde 10,7 16,8 16,4 15,8
Ribeira Grande 7,3 21,0 10,1 27,4
Paul 10,0 24,8 16,5 25,7
Porto Novo 9,9 19,5 20,6 18,4
S. Vicente 14,8 28,9 22,1 13,0
Ribeira Brava 4,7 18,8 23,7 10,8
Tarrafal S. Nicolau 9,4 15,8 17,7 8,4
Sal 10,8 17,7 10,9 14,4
Boa Vista 5,7 14,3 11,9 17,9
Maio 8,3 8,7 8,2 15,5
Tarrafal 10,1 7,8 11,6 12,6
Santa Catarina 9,9 13,4 8,8 15,1
Santa Cruz 10,9 10,2 12,3 14,6
Praia 11,3 17,2 22,8 20,0
S. Domingos 8,8 16,6 17,0 6,5
S. Miguel 10,6 3,0 4,9 9,9
S. Salvador do Mundo 4,6 3,0 5,4 5,6
S. Lourenço dos Órgãos 9,4 9,4 9,6 9,9
Ribeira Grande de Santiago 8,0 14,3 17,2 8,2
Mosteiros 6,7 1,5 3,0 8,9
S. Filipe 8,7 8,2 7,9 8,0
Santa Catarina do Fogo 6,4 13,0 3,4 5,0
Brava 9,6 14,0 5,5 17,3 Source: INE

53
Table 32 - Youth unemployment rate (15-24 years) by municipality
2010 2012 2013 2014
Cabo Verde 21,3 32,1 34,6 35,8
Ribeira Grande 15,0 38,0 26,2 50,8
Paul 17,1 58,4 34,3 50,8
Porto Novo 19,3 30,9 37,0 36,2
S. Vicente 29,9 49,7 49,9 29,5
Ribeira Brava 11,2 33,4 41,1 15,8
Tarrafal S. Nicolau 18,4 34,5 31,5 19,0
Sal 20,8 37,4 32,0 34,1
Boa Vista 10,4 25,6 23,8 34,0
Maio 16,5 20,1 22,0 41,2
Tarrafal 17,7 14,1 25,4 25,9
Santa Catarina 18,7 18,8 15,4 31,3
Santa Cruz 19,3 20,2 29,2 28,7
Praia 25,0 42,7 49,0 48,2
S. Domingos 18,7 35,7 43,6 22,7
S. Miguel 17,1 3,3 6,9 23,1
S. Salvador do Mundo 10,0 4,5 11,7 12,6
S. Lourenço dos Órgãos 22,2 25,0 31,1 24,5
Ribeira Grande de Santiago 16,8 32,2 32,8 19,9
Mosteiros 14,4 2,0 7,2 21,5
S. Filipe 16,2 21,0 20,0 17,0
Santa Catarina do Fogo 10,4 23,2 2,8 8,8
Brava 19,0 32,4 21,0 50,9
Source: INE

54
Table 33 - Unemployment rate according to gender and area by municipality (2012-2014)
Gender Area
Male Female
Urban Rural Total
2012 17,2 16,4 19,1 12,1 16,8
2013 16,9 15,7 19,2 10 16,4
2014
Cabo Verde 16,3 15,2 17,0 12,4 15,8
Ribeira Grande 25,6 30,8 29,8 26,1 27,4
Paul 23,3 31,4 18,7 27,8 25,7
Porto Novo 17,1 20,4 23,4 10,8 18,4
S. Vicente 13,5 12,3 13,6 6,4 13,0
Ribeira Brava 11,1 10,3 8,7 11,5 10,8
Tarrafal de S. Nicolau 9,5 7,0 7,7 11,9 8,4
Sal 13,6 15,4 14,1 17,1 14,4
Boa Vista 13,6 25,4 16,3 25,6 17,9
Maio 18,7 10,7 15,1 15,8 15,5
Tarrafal 10,6 14,2 16,1 9,5 12,6
Santa Catarina 15,0 15,2 13,1 16,3 15,1
Santa Cruz 16,8 11,8 19,2 11,3 14,6
Praia 23,9 16,5 20,0 * 20,0
S. Domingos 3,7 10,2 6,3 6,6 6,5
S. Miguel 9,2 10,6 20,4 2,9 9,9
S. Salvador do Mundo 4,0 7,5 8,8 5,1 5,6
S. Lourenço dos Órgãos 9,6 10,3 12,3 9,4 9,9
Ribeira Grande Santiago 8,0 8,4 9,0 8,0 8,2
Mosteiros 5,6 16,0 10,3 7,8 8,9
S. Filipe 7,2 9,0 8,2 7,7 8,0
Santa Catarina do Fogo 4,0 6,9 10,1 3,8 5,0
Brava 14,5 22,1 10,3 19,6 17,3
Source: INE

55
Table 34 - Unemployment rate according to Age Group, Gender and area by municipality (2014)
Age group (in years) Gender Area
15 - 24 15 - 34 35 - 64 65 & + Male Female Urban Rural Total
Cabo Verde 35,8 23,9 7,8 0,7 16,3 15,2 17,0 12,4 15,8
Ribeira Grande 50,8 38,6 19,6 0,0 25,6 30,8 29,8 26,1 27,4
Paul 50,8 35,6 18,2 0,0 23,3 31,4 18,7 27,8 25,7
Porto Novo 36,2 30,8 7,6 6,0 17,1 20,4 23,4 10,8 18,4
S. Vicente 29,5 19,3 7,6 0,0 13,5 12,3 13,6 6,4 13,0
Ribeira Brava 15,8 18,0 5,4 0,0 11,1 10,3 8,7 11,5 10,8
Tarrafal S. Nicolau 19,0 11,9 5,2 0,0 9,5 7,0 7,7 11,9 8,4
Sal 34,1 18,2 9,7 0,0 13,6 15,4 14,1 17,1 14,4
Boavista 34,0 21,5 11,9 27,4 13,6 25,4 16,3 25,6 17,9
Maio 41,2 27,7 7,7 0,0 18,7 10,7 15,1 15,8 15,5
Tarrafal 25,9 19,6 6,4 0,0 10,6 14,2 16,1 9,5 12,6
Santa Catarina 31,3 21,8 7,5 0,0 15,0 15,2 13,1 16,3 15,1
Santa Cruz 28,7 23,9 4,1 0,0 16,8 11,8 19,2 11,3 14,6
Praia 48,2 31,7 8,1 0,0 23,9 16,5 20,0 * 20,0
S. Domingos 22,7 11,8 1,7 0,0 3,7 10,2 6,3 6,6 6,5
S. Miguel 23,1 16,4 4,2 0,0 9,2 10,6 20,4 2,9 9,9
S. Salvador do Mundo 12,6 10,2 1,4 0,0 4,0 7,5 8,8 5,1 5,6
S. Lourenço dos Órgãos 24,5 18,1 2,7 0,0 9,6 10,3 12,3 9,4 9,9
Ribeira Grande Santiago 19,9 13,4 3,2 0,0 8,0 8,4 9,0 8,0 8,2
Mosteiros 21,5 15,3 3,2 0,0 5,6 16,0 10,3 7,8 8,9
S. Filipe 17,0 10,9 5,3 0,0 7,2 9,0 8,2 7,7 8,0
Santa Catarina do Fogo 8,8 8,3 1,1 0,0 4,0 6,9 10,1 3,8 5,0
Brava 50,9 23,6 11,5 0,0 14,5 22,1 10,3 19,6 17,3
Source: INE

56

57
Social Protection
The number of members in the National Social Security Institute (INPS) increased from
169,290 people in 2010 to 197,991 people in 2014, an increase of 28,701 members and an
increase of 17%. Compared to 2013, the number of members at INPS increased 1.9% in 2014.
It is noted also that most members refer to "Family of insured and pensioners with open right",
with 49.5% and "active Policy holders" with 36.6%.
When analyzed by gender, it appears that there are more INPS female members than men
members. In 2014 there was a total of 99,536 female members and 98 456 male members,
that is 50.3% and 49.7% of the total, respectively.
Table 35 - INPS members by category (2010-2014)
Type of Members 2010 2011 2012 2013 2014P
Active policy holders 68 239 72 729 74 506 72 686 72 409
Employees 45 167 48 031 48 815 47 447 47 536
Self-employed 962 1 787 2 054 1 852 1 588
Civil servisse scheme 22 110 22 911 23 637 23 387 23 285
Active INPS pensioners 5 351 5 617 5 952 6 091 6 961
Old age* 2 397 2 508 2 657 2 773 3 519
Disability 1 196 1 238 1 265 1 286 1 311
Survivor’s pension 1 758 1 871 2 030 2 032 2 131
Civil service pensioners 3 865 4 026 4 199 4 476 4 597
Family members of policy holders and pensioners with open right
76 681 79 492 89 971 94 891 97 956
Ascendants 3 610 3 695 3 849 4 050 4 285
Descendants 68 023 70 600 81 440 85 904 88 500
Spouses 5 048 5 197 4 682 4 937 5 171
Agreement Scheme 15 154 15 432 15 972 16 098 16 068
Pensioners and Migrant Workers 6 159 6 129 6 634 6 692 6 808
Membres of the family with open right 8 995 9 303 9 338 9 406 9 260
Total 169 290 177 296 190 600
194 242
197 991
* Comprises interim and supplementary pensioners Source: INPS P: provisional data

58
Table 36 - Members with open rights in INPS by island (2012-2014)
R 2012P 2013P 2014P
Cabo Verde 190.600 194.242 197.991
Santo Antão 11.125 11.113 10.991
S. Vicente 36.521 37.135 37.922
S. Nicolau 5.627 5.463 5.585
Sal 18.649 19.053 19.784
Boa Vista 6.376 6.616 6.740
Maio 2.555 2.756 2.764
Santiago 100.305 102.180 103.944
Fogo 8.368 8.843 9.113
Brava 1.072 1.078 1.144
Estrangeiro 2 5 4 Source: INPS P: provisional data

59
Table 37 – INPS members by gender and category, (1983 – 2014)
Type of Members 2012 2013 2014
Female Male Total Female Male Total Female Male Total
Policy holders 33.481 41.025 74.506 33.181 39.505 72.686 33.312 39.098 72.409
Employees’Scheme 21.010 27.805 48.815 21.014 26.433 47.447 21.303 26.234 47.536
Domestic workers 807 33 840 866 42 908 1.001 43 1.044
Self-employed Scheme 1.030 1.024 2.054 898 954 1.852 763 825 1.588
Civil service scheme 11.441 12.196 23.637 11.269 12.118 23.387 11.246 12.039 23.285
Current scheme 8.098 8.371 16.469 7.629 8.129 15.758 7.361 7.906 15.267
New scheme 3.343 3.825 7.168 3.640 3.989 7.629 3.885 4.133 8.018
INPS pensioners 2.630 3.322 5.952 2.726 3.365 6.091 3.180 3.781 6.961
Old age* 1.424 622 2.046 1.449 598 2.047 1.563 583 2.146
Disability 255 1.010 1.265 263 1.023 1.286 278 1.033 1.311
Survivor’s pension 951 1.690 2.641 1.014 1.744 2.758 1.339 2.165 3.504
Civil service pensioners* 1.940 2.259 4.199 2.118 2.358 4.476 2.148 2.449 4.597
Policy Holders family members and open right pensioners
47.121 42.850 89.971 49.535 45.356 94.891 51.078 46.878 97.956
Ascendants 3.316 533 3.849 3.489 561 4.050 3.681 604 4.285
Descendants 39.317 42.123 81.440 41.340 44.564 85.904 42.503 45.997 88.500
Spouses 4.488 194 4.682 4.706 231 4.937 4.894 277 5.171
Agreements Scheme 9.775 6.197 15.972 9.814 6.284 16.098 9.818 6.250 16.068
Pensioners and Migrant Workers 2.260 4.374 6.634 2.322 4.370 6.692 2.417 4.391 6.808
Family members with open right 7.515 1.823 9.338 7.492 1.914 9.406 7.401 1.859 9.260
Total 94.947 95.653 190.600 97.374 96.868 194.242 99.536 98.456 197.991
* Includes provisional and additional pensioners Source: INPS

60
Table 38 – INPS active taxpayers registered by category
Taxpayers 2010 2011 2012 2013 2014P
Employers’ contribution (General scheme) 4.190 4.224 4.334 4.302 4.306
Public Administration 327 328 324 311 296
Domestic taxpayers 377 585 713 789 917
Self-employed worker 962 1.760 2.054 1.852 1.588 Source: INPS
Table 39 - Costs (CVE thousands) with the main social security family benefits (2010-2014)
2010 2011 2012 2013 2014
Costs of benefits 2.746.064 3.012.334 3.147.453 3.307.364 3.451.391
Sickness and Maternity 1.475.704 1.631.055 1.741.960 1.705.016 1.530.755
Sickness benefit 130.710 110.036 106.927 118.756 115.224
Maternity benefit 55.920 59.123 73.691 72.433 83.164
Hospital and medical assistance
348.843 349.854 428.151 408.758 373.731
Medical Care 546.205 598.415 598.874 576.123 490.292
Prosthesis and Orthopaedic
87.481 99.492 108.199 104.521 112.668
Transport and Stay 251.738 403.786 425.644 424.425 349.684
Standard Expenditure 54.807 10.349 474 0 5.992
Deferred Benefits 1.077.820 1.125.444 1.127.153 1.301.588 1.531.761
Old age 500.061 512.458 523.554 608.873 832.582
Disability 414.912 445.386 441.396 499.010 502.307
Survivor 162.847 167.600 162.203 193.705 196.872
Family Benefits and Supplementary Allowances
192.540 255.835 278.340 300.760 388.875
Family Benefits 171.790 222.837 243.499 265.359 363.720
Breast feeding Allowance 12.437 20.417 21.836 22.252 14.019
Disability Allowance 2.736 4.562 5.406 5.516 4.983
Funeral Allowance 5.577 8.019 7.599 7.633 6.153
Source: INPS

61
Table 40 - Beneficiaries and monitoring of internal evaluations according to the beneficiary island of origin, (2013 – 2014)
Island of origin
2013 2014
Evacuees
Accomp. persons Total Evacuees
Accomp. persons Total
Santo Antão 611 65 676 322 79 401
S. Vicente 31 5 36 27 15 42
S. Nicolau 378 18 396 311 113 424
Sal 511 154 665 441 177 618
Boavista 442 64 506 243 74 317
Maio 136 47 183 79 27 106
Fogo 285 102 387 234 72 306
Brava 63 27 90 46 15 61
Total 2.457 482 2.939 1.703 572 2.275 Source: INPS
Table 41 - Patients evacuated abroad, according to medical specialty (2014)
Medical Specialty 2014
Cardiology 44
Oncology 43
Neurosurgery 42
Ophthalmology 27
Orthopedics/Traumatology 18
Nephrology 15
Urology 14
Hematology 11
Gastroenterology 10
Medical Paediatrics 6
Plastic Surgery 3
Autoimmune Disease 3
Neurology 3
Pneumology 3
Pediatric Cardiology 2
Surgery 2
Pediatric Surgery 2
Endocrinology 2
Thoracic surgery 1
Diabetes 1
Electrophysiology 1
Rehabilitation medicine 1
Pediatric Oncology 1
Post Transplant 1
Total 256
Source: INPS

62
Table 42 – Pensions average amount (in CVE) by type (1012-2014)
Pensioners by gender 2012 2013 2014
Amount (CVE)
Old age pension 20.816 21.301 23.801
Female 17.140 17.460 20.069
Male 22.917 23.591 26.120
Disability pension 37.429 38.338 39.685
Female 34.514 34.604 33.493
Male 38.188 39.337 41.033
Survivors pension 9.065 9.292 9.375
Female 9.423 9.965 10.031
Male 8.177 7.527 7.497
Grand Total 20.968 21.321 21.720
Female 14.881 15.364 15.902
Male 25.736 26.161 26.736
Source: INPS

63
Poverty and living conditions
In 2007 the percentage of the poor, the population living below the poverty line (people living on less than $ 49,485 per year) was 26.6% (QUIBB, 2007), the highest incidence was in the municipality of Santa Catarina do Fogo (59%) and the lowest in Sal Island (4%). According to the QUIBB 2007 data, the depth of poverty was 8.1%, while in urban areas the figure was 3.3% and in rural areas 14.3%. Regarding the intensity of poverty, this reached the value of 3.4% in 2007, in urban areas came to 1.3% whereas in rural areas reached the value of 6.3%. Table 43 - Poverty incidence according to area, by identical areas (IDRF 2001/02) and Municipality (QUIBB 2007)
Poverty Incidence
Urban Rural National
Areas 2001/02
Praia 11,5 15,1 11,6
The rest of Santiago 23,3 46,1 41,5
Santo Antão 24,1 56,2 45,6
S. Vicente 13,1 20,3 13,6
Fogo 9,4 47,6 39,0
Other islands 6,9 25,3 14,3
2007
Cabo Verde 13,2 44,3 26,6
Ribeira Grande 17,2 50,9 44,0
Paul 26,2 64,0 54,1
Porto Novo 26,7 60,4 43,5
S. Vicente 13,1 20,3 13,6
Ribeira Brava - 24,5 18,2
Tarrafal de S. Nicolau 21,6 25,1 22,7
Sal 3,0 12,6 4,0
Boa Vista 7,3 8,8 8,0
Maio 9,4 18,6 15,0
Tarrafal 15,3 56,0 42,1
Santa Catarina 13,5 48,2 42,8
Santa Cruz 32,9 53,4 46,0
Praia 11,5 15,1 11,6
S. Domingos 10,4 41,6 37,8
S. Miguel 36,3 51,2 45,9
S. Lourenço dos Órgãos - 34,8 34,8
S. Salvador do Mundo - 24,1 24,1
Ribeira Grande de Santiago - 39,3 39,3
Mosteiros 11,4 52,6 51,7
S. Filipe 9,4 40,0 28,8
Santa Catarina do Fogo - 59,0 59,0
Brava 14,4 42,1 35,1
Source: INE

64
Table 44 - Poverty depth, according to area by identical areas (IDRF 2001/02) and (QUIBB 2007)
Poverty Depth
Urban Rural National
Areas 2001/02
Praia 2,7 3,9 2,7
The rest of Santiago 6,9 14,9 13,3
Santo Antão 6,3 18,5 14,4
S. Vicente 3,1 5,0 3,2
Fogo 3,3 16,0 13,2
Other islands 1,5 7,4 3,9
2007
Cabo Verde 3,3 14,3 8,1
Source: INE
Table 45 - Poverty intensity rate, according to the area by identical areas (IDRF 2001/02) and (QUIBB 2007)
Intensity of poverty
Urban Rural National
Areas 2001/02
Praia 1,0 1,4 1,0
The rest of Santiago 2,9 6,6 5,8
Santo Antão 2,3 8,3 6,3
S. Vicente 1,1 2,0 1,2
Fogo 1,4 7,1 5,9
Other islands 0,5 3,2 1,6
2007 (QUIBB)
Cabo Verde 1,3 6,3 3,4
Source: INE

65
Justice and Security
The number of homicide incidents in Cabo Verde rose from 39 in 2010 to 56 in 2012, reflecting
an increase of 43.6%. The municipality with the highest incidents logging has been Praia,
followed by São Vicente, where in 2012, 29 and 7 instances of homicide, were logged
respectively.
Table 46 – Crime occurring per 100.000 inhabitants, (2008-2013)
Year Incidents Population Incidents/ 100.000 Inhab
2008 20.807 483.589 4.303
2009 21.967 488.787 4.494
2010 20.604 494.040 4.171
2011 22.152 499.929 4.431
2012 24.444 505.983 4.831
2013 22.991 512.173 4.489 Source: MAI
Table 47 - Proportion of crime perpetrators according to age by municipality (2013)
Age Group
< 16 16-20 21-30 31-45 45>
Cabo Verde 2,0 13,7 44,4 30,7 9,3
Ribeira Grande 2,6 9,2 36,1 35,5 16,6
Paul 1,8 12,2 38,1 33,1 14,7
Porto Novo 1,7 19,0 39,3 27,7 12,3
S. Vicente 1,2 10,8 50,0 30,8 7,2
Ribeira Brava 5,9 5,9 16,8 52,1 19,2
Tarrafal de S. Nicolau 4,0 8,9 42,6 34,7 9,9
Sal 1,1 8,3 40,5 41,3 8,8
Boa Vista 1,4 13,2 50,2 32,2 2,9
Maio 0,5 17,4 42,4 29,2 10,5
Tarrafal 1,6 10,4 42,1 33,5 12,4
Santa Catarina 1,2 5,5 68,8 19,1 5,4
Santa Cruz 2,7 15,9 39,2 30,2 12,0
Praia 2,4 20,7 44,0 25,9 7,0
S. Domingos 4,5 10,3 34,2 45,2 5,8
S. Miguel 2,5 7,5 38,1 27,5 24,4
S. Salvador do Mundo 3,5 13,9 35,1 31,2 16,3
S. Lourenço dos Órgãos 0,0 19,2 41,6 34,4 4,8
Ribeira Grande Santiago 1,8 7,9 48,2 29,8 12,3
Mosteiros 1,8 11,4 37,9 37,4 11,4
S. Filipe 2,6 17,2 37,9 31,4 11,4
Santa Catarina do Fogo 3,6 10,9 44,4 23,2 17,9
Brava 0,9 13,7 44,4 30,7 9,3 Source: MAI
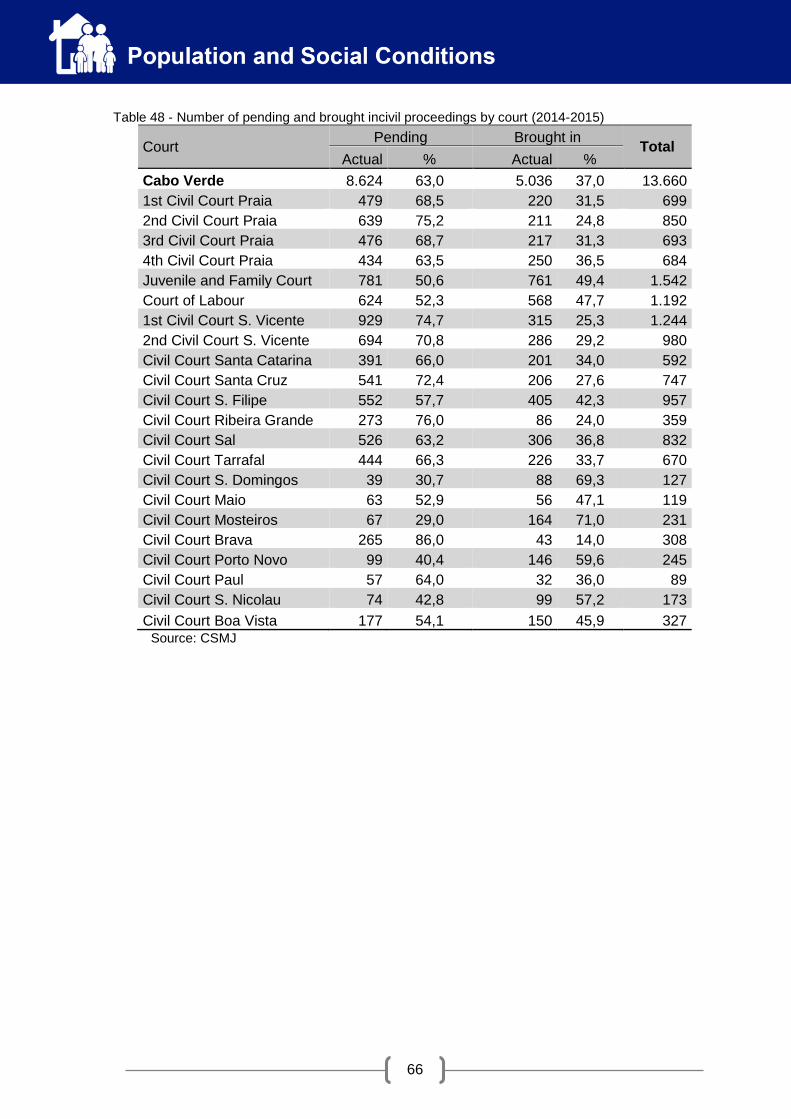
66
Table 48 - Number of pending and brought incivil proceedings by court (2014-2015)
Court Pending Brought in
Total Actual % Actual %
Cabo Verde 8.624 63,0 5.036 37,0 13.660
1st Civil Court Praia 479 68,5 220 31,5 699
2nd Civil Court Praia 639 75,2 211 24,8 850
3rd Civil Court Praia 476 68,7 217 31,3 693
4th Civil Court Praia 434 63,5 250 36,5 684
Juvenile and Family Court 781 50,6 761 49,4 1.542
Court of Labour 624 52,3 568 47,7 1.192
1st Civil Court S. Vicente 929 74,7 315 25,3 1.244
2nd Civil Court S. Vicente 694 70,8 286 29,2 980
Civil Court Santa Catarina 391 66,0 201 34,0 592
Civil Court Santa Cruz 541 72,4 206 27,6 747
Civil Court S. Filipe 552 57,7 405 42,3 957
Civil Court Ribeira Grande 273 76,0 86 24,0 359
Civil Court Sal 526 63,2 306 36,8 832
Civil Court Tarrafal 444 66,3 226 33,7 670
Civil Court S. Domingos 39 30,7 88 69,3 127
Civil Court Maio 63 52,9 56 47,1 119
Civil Court Mosteiros 67 29,0 164 71,0 231
Civil Court Brava 265 86,0 43 14,0 308
Civil Court Porto Novo 99 40,4 146 59,6 245
Civil Court Paul 57 64,0 32 36,0 89
Civil Court S. Nicolau 74 42,8 99 57,2 173
Civil Court Boa Vista 177 54,1 150 45,9 327 Source: CSMJ

67
Table 49 - Number and Percentage of tried_civil proceedings by court (2014-2015)
Court Actual %
Cabo Verde 5.035 36,9
1st Civil Court Praia 354 50,6
2nd Civil Court Praia 231 27,2
3rd Civil Court Praia 181 26,1
4th Civil Court Praia 309 45,2
Juvenile and Family Court 679 44,0
Court of Labour 400 33,6
1st Civil Court S. Vicente 589 47,3
2nd Civil court S. Vicente 211 21,5
Civil Court Santa Catarina 305 51,5
Civil Court Santa Cruz 176 23,6
Civil Court S. Filipe 324 33,9
Civil Court Ribeira Grande 80 22,3
Civil Court Sal 242 29,1
Civil Court Tarrafal 249 37,2
Civil Court S. Domingos 51 40,2
Civil Court Maio 82 68,9
Civil Court Mosteiros 153 66,2
Civil Court Brava 24 7,8
Civil Court Porto Novo 133 54,3
Civil Court Paul 46 51,7
Civil Court S. Nicolau 95 54,9
Civil Court Boa Vista 121 37,0 Source: CSMJ

68
Indicators and calculation method Annual average growth rate - is the population variation observed in a given period of time, compared to the average population in this period, expressed as rate per 100 inhabitants.
𝑇𝐶𝑀𝐴 =𝑃𝑡 − 𝑃0
[𝑃0 + 𝑃𝑡]/2× 100
𝑃0 - Population at inception point
𝑃𝑡 – Population at finishing point
Natural growth rate - is the natural balance observed in a given period, compared to the average population in this period, also expressed as rate per 100 inhabitants.
𝑇𝐶𝑁 =SN
[𝑃0 + 𝑃𝑡]/2× 100
SN is the natural balance between the initial and final point
Life expectancy at birth - is the average number of years a person can expect to live at birth, if age mortality rates observed at the time remain. Gender ratio - is the ratio of the actual male and female population, expressed as rate per 100 women.
𝑅𝑀 =𝐻
𝑀× 100
where H is the male population and M the female population.
Dependency ratio - the number of individuals under 15 years and the number of individuals
aged 65 years or more existing for every 100 individuals between 15 and 64 years.
𝐼𝐷 =𝑃𝑜𝑝 < 15 𝑦𝑒𝑎𝑟𝑠 + 𝑃𝑜𝑝 ≥ 65 𝑦𝑒𝑎𝑟𝑠
𝑃𝑜𝑝 15 − 64 𝑦𝑒𝑎𝑟𝑠× 100
Total dependency ratio - relationship between the young and elderly (dependent population)
and the labour force (adult), usually defined as the ratio between the number of people
between 0 and 14 years along with people aged 65 or more and the number of people aged
15 and 64 years.
𝐼𝐷𝑇 =𝑃𝑜𝑝 < 15 𝑦𝑒𝑎𝑟𝑠 + 𝑃𝑜𝑝 ≥ 65 𝑦𝑒𝑎𝑟𝑠
𝑃𝑜𝑝 15 − 64 𝑦𝑒𝑎𝑟𝑠× 100

69
Youth dependency ratio - the relationship between young people and the labour force,
usually defined as the ratio between the number of people between 0 and 14 years and the
number of people aged between 15 and 64 years.
𝐼𝐷𝐽 =𝑃𝑜𝑝 < 15 𝑦𝑒𝑎𝑟𝑠
𝑃𝑜𝑝 15 − 64 𝑦𝑒𝑎𝑟𝑠× 100
Old age dependency ratio - the relationship between the elderly population and the labour
force, usually defined as the ratio between the number of people aged 65 or more and the
number of people aged between 15 and 64 years.
𝐼𝐷𝐼 =𝑃𝑜𝑝 ≥ 65 𝑦𝑒𝑎𝑟𝑠
𝑃𝑜𝑝 15 − 64 𝑦𝑒𝑎𝑟𝑠× 100
Ageing index - number of individuals aged 65 or more years that exist for every 100 individuals
younger than 15 years. That is, the relationship between old and young.
𝐼𝐷𝐼 =𝑃𝑜𝑝 ≥ 65 𝑦𝑒𝑎𝑟𝑠
𝑃𝑜𝑝 < 15 𝑦𝑒𝑎𝑟𝑠× 100
Longevity Index - the relationship between two groups of elderly people, one aged over 65
and the other aged over 75 years. Usually defined as the ratio between the number of people
aged over 75 years and the number of people aged over 65 years.
𝐼𝐿 =𝑃𝑜𝑝 ≥ 75 𝑦𝑒𝑎𝑟𝑠
𝑃𝑜𝑝 ≥ 65 𝑦𝑒𝑎𝑟𝑠× 100
Migratory balance - the difference between the number of people entering and leaving the
country during the year.
Poverty headcount index (P0) or poverty rate. If there are "n" people in the dependent
population and that "q" among them are poor, or who have a level of annual consumption per
capita "Yi" below the poverty threshold "Z" (ie "Yi <Z" "q" individuals), the poverty rate is H =
q/n.
Poverty gap índex (P1). This indicator is equal to the average of the differences between the
poverty threshold and the consumption level of the poor, and is expressed as a percentage of
the poverty threshold.

70
Severity rate or gravity index (P2). It takes into account not only the distance separating the
poor from of the poverty line (deviation / poverty gap), but also the inequality among the poor.
Assigns a greater weighting to more distant households of the poverty threshold.
For more information see: Publications: QUIBB Reports 2001/2002 and QUIBB 2007 Demographic projections of Cabo Verde 2010-2030 Reports Continuous Multiobjective Survey Modules (IMC 2012 the 2014 - Living Conditions,
Migration, Labour Market) Annual reports of the INPS Annual reports on the situation of justice in Cabo Verde Crime statistics (MIA)
www.ine.cv www.inps.cv www.mai.gov.cv

71

72
Health
This chapter of the yearbook covers the health sector indicators, a sector which has always deserved special attention from decision-makers in Cabo Verde, showing a distinct positive evolution in the various indicators, some presented in this yearbook. Regarding the State General Budget (SGB), Cabo Verde applied on average from 2005 to and 2013, about 7.1% in the health sector. Although in absolute terms there has been a 26% increase in funding for health, it is clear that participation in the general Budget decreased by 0.47 percentage points from 2005 to 2013. From 2011 to 2013, the health budget decreased in absolute terms (-17%) although in relative terms, there has been an increase in 0.28 percentage points in the participation in the SGB. Table 50 – State General Budget (SGB) and the Ministry of Health Budget (2005-2013)
Years
State General Budget (SGB)
Budget of the Ministry of Health (BMH) %
(BMH/GSB) Total (Millions in CVE) Total (Millions of CVE)
2005 35.285 2.670 7,57
2006 40.689 3.175 7,80
2007 40.154 3.210 7,99
2008 44.595 3.369 7,55
2009 52.003 3.438 6,61
2010 61.913 3.563 5,75
2011 59 422 4.055 6,82
2012 57.172 3.772 6,60
2013 47.322 3.361 7,10
Source: Ministry of Finance

73
Infrastructure and Resources Allocated to the Health Services
In terms of health infrastructure in 2013, the country has two central hospitals located in Praia and S. Vicente, 4 Regional Hospitals distributed amongst the municipalities of Ribeira Grande de Santo Antão, Sal, Santa Catarina and São Filipe and 28 health facilities, which in turn increased by 64.7% from 2009 to 2013. the Basic health Units are installed in all municipalities and are essential infrastructure in the implementation of health policy in the country. Table 51 - Health infrastructure according to major health facilities by municipality (2009 -2013)
Health Facilities
Central Hospitals
Regional Hospitals
Health Centers
2009 2 3 17
2010 2 3 17
2011 2 3 17
2012 2 3 17
2013
Cabo Verde 2 4 28
Ribeira Grande 0 1 0
Paul 0 0 1
Porto Novo 0 0 1
S. Vicente 1 0 5
Ribeira Brava 0 0 1
Tarrafal S. Nicolau 0 0 1
Sal 0 1 0
Boa Vista 0 0 1
Maio 0 0 1
Tarrafal 0 0 1
Santa Catarina 0 1 1
Santa Cruz 0 0 1
Praia 1 0 6
S. Domingos 0 0 1
S. Miguel 0 0 1
S. Salvador do Mundo 0 0 1
S. Lourenço dos Órgãos 0 0 1
Ribeira Grande Santiago 0 0 1
Mosteiros 0 0 1
S. Filipe 0 1 0
Santa Catarina do Fogo 0 0 1
Brava 0 0 1
Source: Ministry of Health
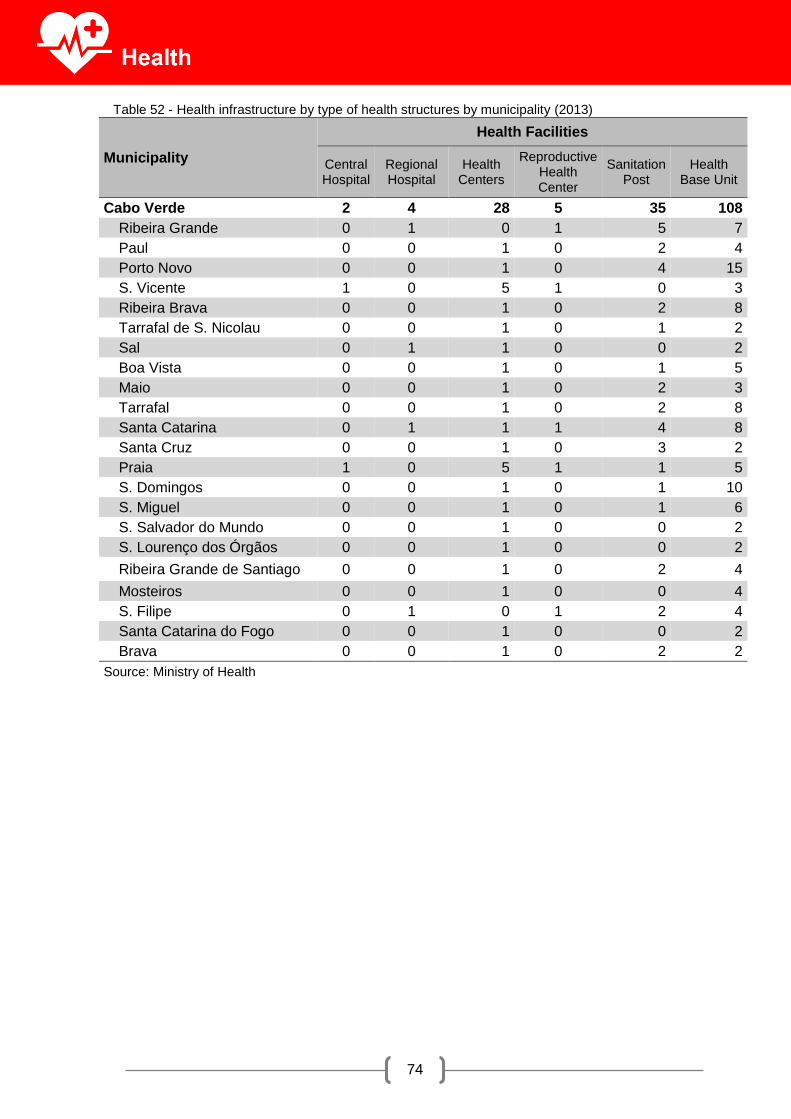
74
Table 52 - Health infrastructure by type of health structures by municipality (2013)
Municipality
Health Facilities
Central Hospital
Regional Hospital
Health Centers
Reproductive Health Center
Sanitation Post
Health Base Unit
Cabo Verde 2 4 28 5 35 108
Ribeira Grande 0 1 0 1 5 7
Paul 0 0 1 0 2 4
Porto Novo 0 0 1 0 4 15
S. Vicente 1 0 5 1 0 3
Ribeira Brava 0 0 1 0 2 8
Tarrafal de S. Nicolau 0 0 1 0 1 2
Sal 0 1 1 0 0 2
Boa Vista 0 0 1 0 1 5
Maio 0 0 1 0 2 3
Tarrafal 0 0 1 0 2 8
Santa Catarina 0 1 1 1 4 8
Santa Cruz 0 0 1 0 3 2
Praia 1 0 5 1 1 5
S. Domingos 0 0 1 0 1 10
S. Miguel 0 0 1 0 1 6
S. Salvador do Mundo 0 0 1 0 0 2
S. Lourenço dos Órgãos 0 0 1 0 0 2
Ribeira Grande de Santiago 0 0 1 0 2 4
Mosteiros 0 0 1 0 0 4
S. Filipe 0 1 0 1 2 4
Santa Catarina do Fogo 0 0 1 0 0 2
Brava 0 0 1 0 2 2
Source: Ministry of Health

75
With respect to human resources allocated to health facilities, Cabo Verde had 308 doctors and 594 nurses in 2013, representing an increase of 23% and 20%, respectively, compared to the year 2009. It should be noted that the number of doctors and nurses has consistently increased in the country, so that in 2013p.p, the ratio Doctor per 10 thousand inhabitants and nurses per 10,000 inhabitants would be at 6.01 and 11.6 p.p, respectively. São Vicente is the island / Municipality where both the doctor ratio per 10 thousand inhabitants as the ratio of nurses per 10,000 inhabitants are higher, of 10.73 and 19.2 p.p, respectively. Howeverp.p, there are notable regional diferences p.p, as there are municipalities with limited coverage of doctors and nurses, for example, the municipality of São Salvador do Mundo, Ribeira Grande de Santiago and São Domingos. Table 53 - Number of doctors, Ratio Doctor / 10,000 inhabitants, number of nurses and Ratio Nurses / 10,000 inhabitants (2009-2013)
Year Population No. Of Doctors
Ratio Doctor/ Inhabit.
No. Nurses Ration Nurses/
Inhabit.
2009 508.633 251 4,93 496 9,75
2010 491.683 292 5,94 543 11,04
2011 499.929 292 5,84 543 10,86
2012 505.983 260 5,14 551 10,89
2013 512.173 308 6,01 594 11,60 Source: Ministry of Health

76
Table 54 - Doctors and Nurses Ratio (*) per 10 000 inhabitants per municipality (2013)
Municipality Number
of Doctors
Ratio Doctor/inhabitant
Number of Nurses
Ratio Nurses/Inhabitants
Cabo Verde 308 6,01 594 11,60
Ribeira Grande 8 4,51 34 19,16
Paul 1 1,55 6 9,33
Porto Novo 5 2,83 13 7,35
S. Vicente 85 10,73 152 19,18
Ribeira Brava 2 2,72 11 14,97
Tarrafal S. Nicolau 1 1,90 7 13,32
Sal 12 3,91 23 7,50
Boavista 3 2,44 9 7,31
Maio 2 2,89 8 11,54
Tarrafal 3 1,63 11 5,97
Santa Catarina 26 5,86 44 9,91
Santa Cruz 5 1,89 13 4,90
Praia 132 9,18 196 13,63
S. Domingos 2 1,43 4 2,86
S. Miguel 4 2,65 7 4,65
S. Salvador do Mundo 1 1,15 5 5,77
S. Lourenço dos Órgãos 1 1,38 5 6,91
Ribeira Grande de Santiago 1 1,19 2 2,39
Mosteiros 2 2,12 6 6,36
S. Filipe 9 4,17 29 13,43
Santa Catarina do Fogo 1 1,89 2 3,77
Brava 2 3,43 7 12,02
Source: Ministry of Health

77
The number of hospital beds in health facilities has come to 1,072 beds in 2013 (+ 10.5% of that recorded in 2009). These beds are distributed into 526 in central hospitals, 244 and 302 in regional hospitals in healths centers scattered in all municipalities. Table 55 - Number of hospital beds according to health facilities by municipality (2009-2013)
No of Beds
Central Hospitals
Regional Hospitals
Health Centers
Total
2009 553 194 266 1.013
2010 540 208 287 1.035
2011 561 201 319 1.081
2012 563 211 345 1.119
2013
Cabo Verde 526 244 302 1.072
Ribeira Grande - 64 - 64
Paul - - 15 15
Porto Novo - - 29 29
S. Vicente 201 - 0 201
Ribeira Brava - - 24 24
Tarrafal S. Nicolau - - 30 30
Sal - 45 - 45
Boavista - - 28 28
Maio - - 30 30
Tarrafal - - 26 26
Santa Catarina - 81 0 81
Santa Cruz - - 34 34
Praia 325 - 0 325
S. Domingos - - 17 17
S. Miguel - - 19 19
S. Salvador do Mundo - - 0 0
S. Lourenço dos Órgãos - - 0 0
Ribeira Grande Santiago - - 0 0
Mosteiros - - 37 37
S. Filipe - 54 - 54
Santa Catarina do Fogo - - 0 0
Brava - - 13 13
Source: Ministry of Health

78
Data from 2013 indicate that, in national terms, many pregnant had not regularly received the tetanus vaccines. This situation becomes more critical as they advance in pregnancy, that is, in the first months of pregnancy the percentage of pregnant women who have received vaccines is significantly higher than that registered in the last months of pregnancy. This result although it had differences between the islands, demonstrate the same behavioral pattern in all municipalities of the country. Table 56 - vaccination coverage of pregnant women receiving tetanus shot by municipality (2013)
Municipalities Estimate Pregnant
Women
Vaccination Coverage (%)
VAT 1 VAT 2 VAT 3 VAT 4 VAT 5
Cabo Verde 10.556 34,1 30,1 12,6 10,5 9,9
Ribeira Grande 276 33,3 15,9 11,2 12,0 11,6
Paul 103 17,6 15,6 15,6 16,6 18,5
Porto Novo 328 27,8 26,2 10,1 12,8 13,7
S. Vicente 1.426 17,2 22,2 9,5 8,4 9,0
Ribeira Brava 114 35,1 22,8 3,5 9,6 10,5
Tarrafal S. Nicolau 104 32,7 32,7 11,1 8,7 15,4
Sal 808 6,7 12,0 2,8 9,5 8,0
Boavista 265 43,1 50,2 6,8 18,9 10,2
Maio 109 37,6 36,7 23,9 11,0 3,7
Tarrafal 355 27,0 23,1 15,8 8,7 6,2
Santa Catarina 863 45,4 45,2 12,0 14,0 12,5
Santa Cruz 556 29,3 28,6 9,9 10,1 6,3
Praia 3.363 43,7 33,2 16,3 11,4 9,8
S. Domingos 283 16,3 9,5 3,2 3,5 2,5
S. Miguel 286 44,5 33,3 45,9 3,2 35,7
S. Salvador Mundo 179 28,0 25,2 3,4 5,0 7,3
S. Lourenço dos Órgãos 122 107,7 68,2 13,2 7,4 3,3
Ribeira Grande de Santiago 166 45,2 33,7 3,6 5,4 5,4
Mosteiros 193 32,1 28,0 6,7 9,3 8,8
S. Filipe 420 39,8 42,4 14,1 13,8 7,6
Santa Catarina do Fogo 120 28,4 20,1 13,4 8,4 11,7
Brava 120 47,3 59,0 13,3 10,0 2,5
Source: Ministry of Health

79
The number of births attended by trained professionals (doctors and nurses) in health facilities increased from 9,861 in 2009 to 9,745 in 2013, a decrease of 1.2% due to the reduction in the number of births. In the year 2013, about 92.3% of births were attended by trained professionals, however, in 2011 this figure was 98.7%. Table 57 - Number of births attended by trained professionals (doctors and nurses) in health facilities (2009-2013)
2009 2010 2011 2012 2013
Cabo Verde 9.861 10.033 10.200 9.840 9.745
Ribeira Grande 279 268 391 344 342
Paul 66 72 39 24 22
Porto Novo 143 185 173 188 157
S. Vicente 1.797 1.783 1.647 1.688 1.522
S. Nicolau 154 130 148 126 118
Sal 482 611 615 596 550
Boavista 60 60 60 60 77
Maio 82 63 60 56 76
Tarrafal 194 180 196 191 186
Santa Catarina 981 1.272 1.406 1 287 1.421
Santa Cruz 334 316 349 338 300
Praia 4.387 4.234 4.190 3.983 4.135
S. Domingos 42 32 35 32 35
S. Miguel 103 95 87 70 66
S. Lourenço dos Órgãos - - - 4 -
Mosteiros 144 153 150 133 116
S. Filipe 507 489 538 604 505
Santa Catarina do Fogo - - - 22 17
Brava 106 90 116 94 100
Source: Ministry of Health
Table 58 - Number of Births, assisted Births and Proportion of births attended by trained health professionals - doctors and nurses (2009 – 2013)
Year Births Assisted
Births (%)
2009 13.044 9.861 75,6
2010 10.184 10.033 98,5
2011 10.339 10.200 98,7
2012 10.465 9.840 94,0
2013 10.556 9.745 92,3
Source: Ministry of Health

80
Birth and Fertility
Indicators related to the Synthetic Fertility Index (SFI), Gross Birth Rate (GBR), Net Reproduction Rate Rate (GRR) and Net Reproduction Rate Gross Birth Rate (NOR) showed a decrease in 2015 compared to the values observed in 2011. Sao Vicente Island had the lowest values (except in the case of the municipality of Ribeira Grande de Santo Antão, which showed a lower Gross Birth Rate (15%) while the Municipality of Santa Catarina do Fogo, has shown the highest values in the indicators, with the exception of the island of Sal with the highest Gross Birth Rate (24.9%) in 2015. Table 59 - Synthetic Fertility Index, Gross Birth Rate, Gross Reproduction Rate and Net Reproduction Rate 2011 - 2015
Synthetic Fertility Index (SFI)
Gross Birth Rate (GBR)
Gross Reproduction Rate (GRR)
Net Reproduction Rate (NOR)
2011 2,60 20,49 1,16 1,14
2012 2,37 20,56 1,16 1,13
2013 2,36 20,56 1,15 1,12
2014 2,34 20,48 1,14 1,11
2015
Cabo Verde 2,32 20,34 1,13 1,11
Ribeira Grande 2,61 15,01 1,27 1,24
Paul 2,83 15,24 1,38 1,35
Porto Novo 2,53 18,33 1,23 1,20
S. Vicente 1,97 17,65 0,96 0,94
Ribeira Brava 2,33 15,34 1,14 1,11
Tarrafal de S. Nicolau 2,75 19,43 1,34 1,31
Sal 2,69 24,91 1,31 1,28
Boa Vista 2,31 20,18 1,13 1,10
Maio 2,06 15,46 1,01 0,98
Tarrafal 2,19 19,50 1,07 1,04
Santa Catarina 2,13 19,72 1,04 1,01
Santa Cruz 2,39 20,91 1,16 1,14
Praia 2,35 22,91 1,15 1,12
S. Domingos 2,61 20,15 1,27 1,24
S. Miguel 2,26 19,34 1,10 1,08
S. Salvador do Mundo 2,74 20,53 1,34 1,30
S. Lourenço dos Órgãos 2,31 17,09 1,13 1,10
Ribeira Grande de Santiago 2,39 19,47 1,16 1,14
Mosteiros 2,30 20,82 1,12 1,09
S. Filipe 2,40 19,34 1,17 1,14
Santa Catarina do Fogo 2,99 22,23 1,46 1,42
Brava 2,60 20,32 1,27 1,24 Source: INE (Demographic Projections 2010-2030)

81
Fertility in Adolescence
In 2013, the proportion of young people who got pregnant early, showed a rate of 4.2% for adolescents aged 14 to 16 years, more pronounced in the municipalities of Santa Cruz (7.7%) and Paul (7, 5%). For the age group of 17 to 19 years the rate was 15.9% however the municipalities of Paul and São Domingos showed the highest values of 25.4% and 23.8%, respectively. The pre-natal medical appointments coverage rate increased by 6.3 percentage points from 2009 to 2013, standing at 94.7%. Generally pregnant women attend on average about 4.4 antenatal medical appointments. The same trend was observed in relation to the coverage rate of postpartum medical appointments, which increased from 46.8% in 2009 to 48.8% in 2013. When analyzing the data broken down by municipality, one can see a clear regional heterogeneity in terms of attendance at postpartum visits.
Table 60 - Recorded number of pregnant women, pregnant women and the proportion of pregnant women by age group (10-19 years) according to the Health Centers / Municipalities (2013)
Recorded Number
of Pregnant Women
Age of Pregnant Women (Early Pregnancy)
10 - 13 Years 14 - 16 Years
(17 - 19 years)
No (%) No (%) No (%)
Cabo Verde 10.004 4 0 424 4,2 1 586 15,9
Ribeira Grande 253 … … 14 5,5 42 16,6
Paul 67 … … 5 7,5 17 25,4
Porto Novo 299 … … 22 7,4 64 21,4
S. Vicente 1.285 … … 59 4,6 182 14,2
Ribeira Brava 115 … … 7 6,1 23 20
Tarrafal de S. Nicolau 100 … … 5 5 16 16
Sal 614 … … 13 2,1 74 12,1
Boa Vista 355 … … … … 34 9,6
Maio 110 … … … … 21 19,1
Tarrafal 333 … … 16 4,8 70 21
Santa Catarina 1.089 … … 61 5,6 215 19,7
Santa Cruz 416 … … 32 7,7 89 21,4
Praia 3.524 … … 127 3,6 509 14,4
S. Domingos 105 … … 7 6,7 25 23,8
S. Miguel 261 … … 8 3,1 31 11,9
S. Salvador do Mundo 75 … … … … 21 28
S. Lourenço dos Órgãos 98 … … 0 0 20 20,4
Ribeira Grande de Santiago 96 … … 4 4,2 19 19,8
Mosteiros 166 … … 10 6 15 9
S. Filipe 454 … … 19 4,2 71 15,6
Santa Catarina do Fogo 76 … … 5 6,6 11 14,5
Brava 113 … … 5 4,4 17 15
Source: Ministry of Health

82
The medical appointments of children under 1 year of age increased considerably, and from 2009 to 2013, increased about 29.2% and in 2013 stood at 98.3%. Also reported an increase in the average of the medical appointments, which went from 7.8 in 2019 to 9.9 in 2013, a variation of 26.9% in that period. In terms of municipalities, to point out that Ribeira Grande de Santiago stands out by the negative, with smaller numbers regarding this indicator. Regarding the proportion of vaccinated children under 1 year of age, we note that in 2013, all vaccines have had a more than 90% coverage rate. Specifically, the values were 94% for BCG, polio 93.2% to 93.1% to Pentavalent and 90,70% to Measles. These data indicate the great effort that the country has made towards achieving universal coverage of vaccinated children. Table 61 – Coverage rate of prenatal and post partum medical appointments (2009 – 2013)
Prenatal appointments
Postpartum appointments
Coverage rate 1st
appointments
Average of appointments
Coverage rate of 1st appointments
2009 88,4 5 46,8
2010 87,4 4,7 51,9
2011 90,9 4,4 44,3
2012 77,1 4,3 36,4
2013
Cabo Verde 94,7 4,4 48,8
Ribeira Grande 85,8 3,8 80,2
Paul 59,8 4,3 119,9
Porto Novo 89,5 5,2 92
S. Vicente 90,3 7,3 53,9
Ribeira Brava 99,1 4,3 66,1
Tarrafal de S. Nicolau 93,5 4,1 71
Sal 77,6 2,6 37,1
Boa Vista 143,7 5,4 32,1
Maio 100,9 4,5 48,2
Tarrafal 116,6 5,5 48
Santa Catarina 126,1 4,8 45,2
Santa Cruz 74,8 3,4 66,8
Praia 104,8 4 35,1
S. Domingos 37,1 2 29,5
S. Miguel 73,5 3,9 112,3
S. Salvador do Mundo 42 2,7 -
S. Lourenço dos Órgãos 80,6 3,8 96,9
Ribeira Grande Santiago 57,8 1,2 0
Mosteiros 86 4,5 39,2
S. Filipe 108,2 4 20,9
Santa Catarina do Fogo 63,6 4 46,1
Brava 93,9 5,3 14,2
Source: Ministry of Health

83
Vaccination coverage
Table 62 - Proportion of vaccinated children under 1 year of age, according to types of vaccine by municipality (2013)
Municipalities Children <1 year
Vaccination Coverage (%)
BCG1 Polio 3 Pentavalent32 Measles Compl.
Vaccinated
CABO VERDE 10 556 94 93,2 93,1 90,7 90,1
Ribeira Grande 276 117,4 90 90 92,7 92,7
Paul 103 0 94,7 94,7 100,2 104,7
Porto Novo 328 57,7 109,3 109,3 102,6 105,9
S. Vicente 1 426 110,6 85,5 85,5 84,3 84,5
Ribeira Brava 114 57,9 107,2 107,2 104,6 103,7
Tarrafal S. Nicolau 104 59,6 97,2 97,2 94,3 101
Sal 808 68,7 75,6 75,6 70,7 70
Boa Vista 265 39,3 115,2 115,2 119,3 110,3
Maio 109 68,8 112,1 112,1 96,8 96,8
Tarrafal 355 61,1 86,3 86,3 86,3 85,4
Santa Catarina 863 149,8 104,5 104,2 102,5 101,2
Santa Cruz 556 63,1 102,1 102,1 97,2 96,6
Praia 3 363 118,6 94,3 94 91 90,3
S. Domingos 283 17,7 73,2 73,2 71,1 70,7
S. Miguel 286 89,3 105,6 105,6 103,4 103,4
S. Salvador do Mundo 179 17,3 66,8 66,8 61,2 56,7
S. Lourenço dos Órgãos 122 4,1 109,4 109,4 129,3 129,3
Ribeira Grande de Santiago 166 7,8 57,7 57,7 43,2 39,6
Mosteiros 193 78,2 106,1 106,1 102,8 102,8
S. Filipe 420 106,5 98,4 98,4 103,3 101,7
Santa Catarina do Fogo 120 61,9 81,9 81,9 86,1 86,1
Brava 120 80,6 113,1 113,1 88,2 88,2
Source: Ministry of Health
1 BCG - Bacillus Calmette-Guérin (vaccine for tuberculosis) 2 The pentavalent vaccine (DTP + Hib + HB) protects against Diphtheria, Tetanus, Pertussis
(whooping cough), serious infections by Haemophilus influenzae type b (including meningitis) and hepatitis B
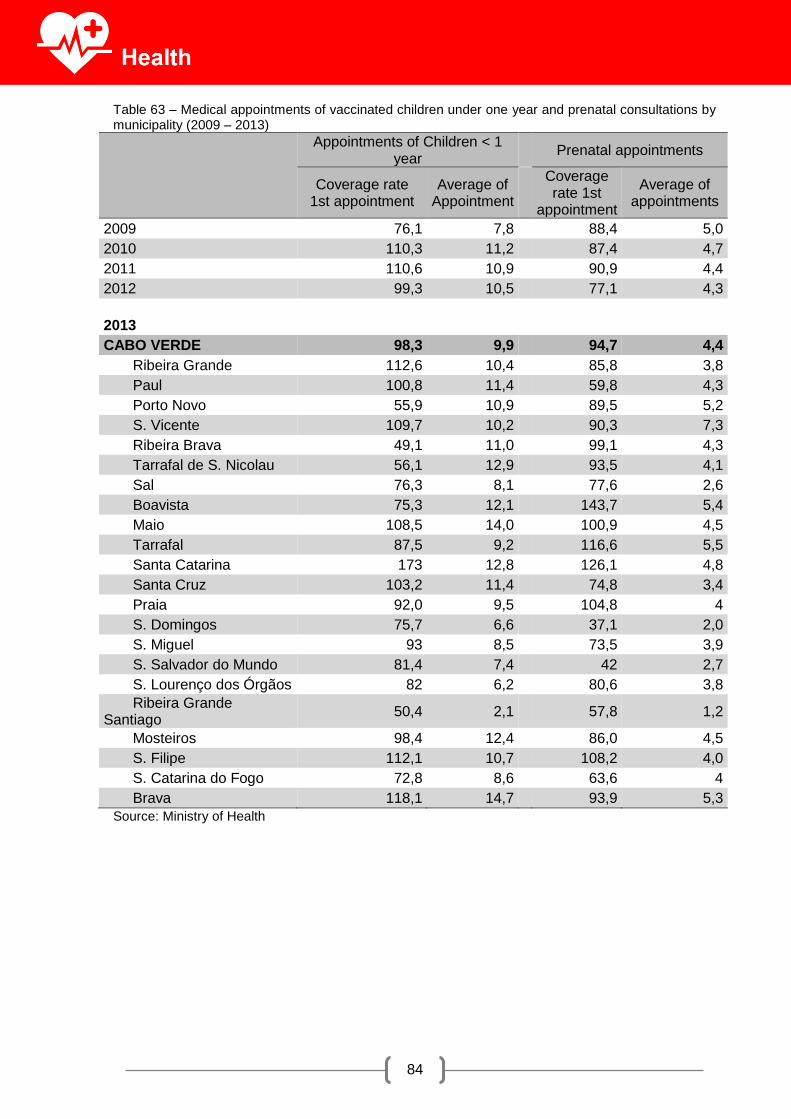
84
Table 63 – Medical appointments of vaccinated children under one year and prenatal consultations by municipality (2009 – 2013)
Appointments of Children < 1 year
Prenatal appointments
Coverage rate 1st appointment
Average of Appointment
Coverage rate 1st
appointment
Average of appointments
2009 76,1 7,8 88,4 5,0
2010 110,3 11,2 87,4 4,7
2011 110,6 10,9 90,9 4,4
2012 99,3 10,5 77,1 4,3
2013
CABO VERDE 98,3 9,9 94,7 4,4
Ribeira Grande 112,6 10,4 85,8 3,8
Paul 100,8 11,4 59,8 4,3
Porto Novo 55,9 10,9 89,5 5,2
S. Vicente 109,7 10,2 90,3 7,3
Ribeira Brava 49,1 11,0 99,1 4,3
Tarrafal de S. Nicolau 56,1 12,9 93,5 4,1
Sal 76,3 8,1 77,6 2,6
Boavista 75,3 12,1 143,7 5,4
Maio 108,5 14,0 100,9 4,5
Tarrafal 87,5 9,2 116,6 5,5
Santa Catarina 173 12,8 126,1 4,8
Santa Cruz 103,2 11,4 74,8 3,4
Praia 92,0 9,5 104,8 4
S. Domingos 75,7 6,6 37,1 2,0
S. Miguel 93 8,5 73,5 3,9
S. Salvador do Mundo 81,4 7,4 42 2,7
S. Lourenço dos Órgãos 82 6,2 80,6 3,8
Ribeira Grande Santiago
50,4 2,1 57,8 1,2
Mosteiros 98,4 12,4 86,0 4,5
S. Filipe 112,1 10,7 108,2 4,0
S. Catarina do Fogo 72,8 8,6 63,6 4
Brava 118,1 14,7 93,9 5,3
Source: Ministry of Health

85
Mortality
The Maternal Mortality Rate showed wide variation in values over the period 2004 and 2013. The lowest value was recorded in 2012, which reached 9.6 per 100,000 live newborns, but in 2009 this rate reached a maximum of 53.7. In 2013, this rate showed a value of 37.9 per 100,000 live newborns. In terms of Gross Mortality Rate one notes a downward trend, but with considerable variations during the period 2004-2013, during which the displayed average value was 5.19%. In 2013, there were 2,531 deaths, representing a mortality rate of 4.9%. Men accounted for 57% of deaths and also have a higher mortality rate (5.7%) compared with women (4.2%). Diseases of the circulatory system are the main cause of death (27.6%) both among men (23.6%) and women (32.9). It is further noted that the incidence of causes of death presents some differences in gender. Men are 21 times more likely to die due to mental illness and behavior, as well as in relation to death due to external causes, injuries and poisoning. Perinatal disorders were the main causes of infant mortality in 2013. Infant deaths occurred mainly in the early neonatal period (62.4%), late neonatal (12.4%) and post-neonatal with 25.2%. This indicator shows great disparities in regional terms. Table 64 - Maternal Mortality Rate and Gross Mortality Rate (2009-2013)
Mortality rate
Maternal (per 100.000 live births)
Gross Mortality Rate (General Mortality)
2009 53,7 5,2
2010 49,1 4,8
2011 48,4 5,1
2012 9,6 5,2
2013 37,9 4,9
Source: Ministry of Health Chart 2 - Gross Mortality Rate (2009-2013)
Source: Ministry of Health
5,2
4,8
5,1
5,2
4,9
4,6
4,7
4,8
4,9
5
5,1
5,2
5,3
2009 2010 2011 2012 2013

86
Table 65 - Mortality rate and its components (Infant Mortality, Neonatal Premature, Neonatal Late, Post Neonatal and children under the age of 5 (2009 – 2013)
Mortality rate
Infant (*) Early neonatal (0 to 6 days)*
Late neonatal (7 to 27 days)*
Post Neonatal (28 to 364 days) *
< than 5 Years *
2009 20,1 11,2 2,5 6,4 23,7
2010 22,9 11,2 3,1 8,5 26,3
2011 23 14,1 2,3 6,6 26,2
2012 22,3 11,7 3,7 7 26,3
2013 21,4 13,4 2,7 5,4 23,6
* per 1,000 live births according to demographic projections of INE Source: Ministry of Health Table 66 - Mortality (Deaths and Mortality Rate) according to gender by municipality (2013)
Total Male Female
Deaths Rates Deaths Rates Deaths Rates
Cabo Verde 2.531 4,9 1.443 5,7 1.088 4,2
Ribeira Grande 165 9,3 102 10,8 63 7,6
Paul 42 6,5 33 9,1 9 3,2
Porto Novo 112 6,3 72 7,8 40 4,7
S. Vicente 462 5,8 253 6,3 209 5,3
Ribeira Brava 57 7,8 32 8,4 25 7,1
Tarrafal S. Nicolau 51 9,7 32 11,7 19 7,5
Sal 103 3,4 64 3,9 39 2,7
Boavista 33 2,7 20 2,8 13 2,6
Maio 35 5,0 18 5,3 17 4,8
Tarrafal 100 5,4 41 4,9 59 5,9
Santa Catarina 246 5,5 131 6,2 115 4,9
Santa Cruz 98 3,7 60 4,6 38 2,8
Praia 546 3,8 306 4,3 240 3,3
S. Domingos 59 4,2 33 4,8 26 3,7
S. Miguel 67 4,4 39 5,7 28 3,4
S. Salvador do Mundo 51 5,9 32 7,7 19 4,2
S. Lourenço dos Órgãos 37 5,1 16 4,5 21 5,7
Ribeira Grande de Santiago 34 4,1 20 4,9 14 3,2
Mosteiros 49 5,2 24 5,3 25 5,1
S. Filipe 103 4,8 62 5,9 41 3,7
Santa Catarina do Fogo 27 5,1 14 5,3 13 4,9
Brava 37 6,4 28 9,8 9 3,0
From another country 17 ---- 11 ---- 6 ----
Source: Ministry of Health

87
Table 67 – Deaths and Mortality Rate, according to gender and main mortality causes (2013)
Death causes CID Total Male Female
Deaths Rate Deaths Rate Deaths Rate
Circulatory system diseases I00-I99 699 136,5 341 133,7 358 139,2
Tumors or neoplasms C00-D48 358 69,9 191 74,9 167 64,9
Respiratory disorders J00-J99 262 51,2 152 59,6 110 42,8
Poorly defined symptoms R00-R99 236 46,1 109 42,7 127 49,4
Infectious and parasitic A00-B99 197 38,5 110 43,1 87 33,8
Perinatal disorders P00-P96 149 29,1 90 35,3 59 22,9
External causes V01-Y98 123 24 106 41,6 17 6,6
Injuries and poisonings S00-T98 110 21,5 93 36,5 17 6,6
Digestive tract diseases K00-K93 92 18 61 23,9 31 12,1
Metab / Endoc / nutritional diseases E00-E90 86 16,8 41 16,1 45 17,5
Mental and behavioral disorders F00-F99 68 13,3 65 25,5 3 1,2
Genito-urinary diseases N00-N99 63 12,3 36 14,1 27 10,5
Nervous system diseases G00-G99 38 7,4 23 9 15 5,8
Congenital malformations Q00-Q99 30 5,9 15 5,9 15 5,8
Blood diseases and hematopoietic organs
D50-D89 14 2,7 9 3,5 5 1,9
Pregnancy, childbirth and puerperium O00-O99 4 - - - 4
Skin and subcutaneous tissue diseases
L00-L99 2 0,4 1 0,4 1 0,4
Source: Ministry of Health
Table 68 - Deaths and mortality rate according to gender, by age group (2013)
Age Group Male Female Total
Deaths Rate Deaths Rate Deaths Rate
0-4 years 145 5,7 104 4,2 249 5,0
5-9 years 5 0,2 3 0,1 8 0,2
10-14 years 5 0,2 4 0,2 9 0,2
15-49 years 377 2,6 124 0,9 501 1,8
50-64 years 249 12,7 118 4,7 367 8,2
65 years + 662 59,2 735 41,4 1 397 48,3
Total 1 443 5,7 1 088 4,2 2 531 4,9
Source: Ministry of Health

88
Table 69 - Infant mortality (rate) according to main causes (2009-2013)
Causes of death (grouped) 2009 2010 2011 2012 2013
Total 100 100 100 100 100
Perinatal disorders 56,1 52,4 61,8 60,5 65,9
Congenital anomalies 7,6 9,4 12,2 9,4 10,6
Infectious and parasitic 14,9 17,6 10,9 12,9 9,3
Respiratory diseases 9,5 8,2 6,3 3,4 5,8
Symptoms and poorly defined signs 2,7 3 2,1 3,9 0,9
Circulatory system diseases … 1,3 1,7 0,4 1,3
Central nervous system disorders 3,8 3,9 1,3 2,6 1,3
Injuries and poisonings 2,3 1,7 1,3 4,3 2,2
Metabolic, endocrine and nutritional diseases
… 1,7 0,8 1,7 0,9
Other causes 3,1 0,9 1,7 1,3 1,8
Source: Ministry of Health
Table 70 - Infant mortality and its components - Early Neonatal, late neonatal and post-neonatal - by municipality (2013)
Death
Infant Early neonatal Late
neonatal
Post-neonatal
No No % No % No %
Cabo Verde 226 141 62,4 28 12,4 57 25,2
Ribeira Grande 3 0 0,0 1 33,3 2 66,7
Paul 2 1 50,0 0 0,0 1 50,0
Porto Novo 6 4 66,7 0 0,0 2 33,3
S. Vicente 27 21 77,8 2 7,4 4 14,8
Ribeira Brava 3 0 0,0 1 33,3 2 66,7
Tarrafal S. Nicolau 0 0 0,0 0 0,0 0 0,0
Sal 10 7 70,0 0 0,0 3 30,0
Boa Vista 5 2 40,0 0 0,0 3 60,0
Maio 5 4 80,0 0 0,0 1 20,0
Tarrafal 9 3 33,3 2 22,2 4 44,4
Santa Catarina 24 14 58,3 4 16,7 6 25,0
Santa Cruz 13 8 61,5 0 0,0 5 38,5
Praia 85 55 64,7 13 15,3 17 20,0
S. Domingos 3 1 33,3 1 33,3 1 33,3
S. Miguel 7 3 42,9 1 14,3 3 42,9
S. Salvador do Mundo 2 1 50,0 1 50 0 0,0
S. Lourenço dos Órgãos 2 2 100,0 0 0,0 0 0,0
Ribeira Grande de Santiago 2 2 100,0 0 0,0 0 0,0
Mosteiros 3 2 66,7 0 0,0 1 33,3
S. Filipe 11 8 72,7 2 18,2 1 9,1
S. Catarina do Fogo 1 0 0,0 0 0,0 1 100,0
Brava 3 3 100 0 0,0 0 0,0
Source: Ministry of Health

89
Over recent years the country has regularly recorded malaria cases. In 2013 there have been 46 cases, with an incidence of 9 per 100 thousand inhabitants. This year there has been no death, however, in 2011, of the 36 cases reported, with an incidence of 7.2 per 100 thousand inhabitants, there were 3 deaths, indicating a mortality rate of 0.2 per 100 thousand inhabitants and a fatality rate of 8.3%. Table 71 - Number of cases, incidence (per 100,000) deaths, mortality rate and mortality rate associated with malaria (2008-2013)
Year Population Cases (No)
Incidence (per 100.000)
Deaths Mortality rate (per 100.000)
Fatality rate (%)
2008 479.743 46 9,6 1 0,2 2,2
2009 485.677 66 13,6 2 0,4 3
2010 491.683 47 9,6 1 0,2 2,1
2011 499.929 36 7,2 3 0,6 8,3
2012 505.983 36 7,1 1 0,2 2,8
2013 512.173 46 9 0 0 0
Source: Ministry of Health
The number of tuberculosis cases has reduced significantly in recent years. From 2012 to 2013, the decrease was -39.3%. In 2013, 244 new cases of tuberculosis have been recorded, with an incidence of 55.6 per 100 thousand inhabitants. The prevalence was 61.9 per 100 thousand inhabitants and 15 deaths were recorded, representing a mortality rate of 2.9 per 100 thousand inhabitants. In 2011 there was a higher mortality rate (4.9 for every 100 thousand) on 25 deaths. The municipality of Paul recorded, in 2013, higher incidence rates (171) and prevalence (187) for tuberculosis. Also, the island of Maio showed high values in relation to these two indicators, compared to the other municipalities of the country. It should be noted that the Municipality of Mosteiros did not register any cases in 2013. Table 72 - Incidence (per 100,000), prevalence (per 100,000), Deaths and mortality rate (per 100,000) associated with tuberculosis (2008 - 2013)
Year Population New
cases TB Recorded cases
Incidence (per 100.000)
Prevalence (per 100.000)
Deaths Mortality rate (per
100.000)
2008 485.677 319 352 65,7 72,5 16 3,3
2009 491.683 338 365 68,7 74,2 21 4,3
2010 499.929 373 400 74,6 80 25 5
2011 505.983 402 421 79,4 83,2 25 4,9
2013 512.173 244 315 55,6 61,9 15 2,9
Source: Ministry of Health

90
Table 73 - Incidence and prevalence rates per 100,000 associated with tuberculosis by municipality (2013)
Incidence rate (per 100.000)
Prevalence rate (per 100.000)
Cabo Verde 56 62
Ribeira Grande 56 79
Paul 171 187
Porto Novo 0 17
S. Vicente 68 103
S. Nicolau 63 79
Sal 16 26
Boa Vista 8 73
Maio 101 130
Tarrafal 5 22
Santa Catarina 9 26
Santa Cruz 9 12
Praia 40 81
S. Domingos 14 36
S. Miguel 40 46
Mosteiros 0 0
S. Filipe 30 41
Brava 34 34
Source: Ministry of Health
The HIV detection rate from 2009 to 2013, recorded an increase of 21.6 percentage points and stood in 2013 at 87.3 per 100 thousand inhabitants in 2013, and in the same year, 447 new cases have been identified. Mortality also increased over the same period, with a value of 16.4 per 100,000 inhabitants in 2013, corresponding to 84 deaths registered that year. It can be seen that the reported cases of HIV infection are more frequent in the age groups from 25 to 50 years. Women show a higher percentage of lower ages (15 to 34 years), mainly due to screening tests on a regular basis for routine medical prenatal appointments, while men show higher percentage from 35 to 54 years. Table 74 – HIV detection rate and mortality (2009 – 2013)
Year Population New cases Detection rate (per 100.000)
Deaths Mortality rate
(per 100.000)
2009 485.677 319 65,7 74 12,7
2010 491.683 411 83,6 65 15,2
2011 499.929 399 79,8 60 12
2012 505.983 351 69,4 79 15,6
2013 512.173 447 87,3 84 16,4
Source: Ministry of Health

91
Table 75 – HIV infection cases reported by age group and gender in 2013
Age Group Gender
Not specified Total
Male Female No %
0 - 14 (years) 7 5 0 12 2,7
15 - 24 (years) 7 52 0 59 13,2
25 - 34 (years) 28 94 0 122 27,3
35- 44 (years) 46 51 0 97 21,7
45 - 54 (years) 47 43 0 90 20,1
55 - 64 (years) 25 20 0 45 10,1
65 e + (years) 11 11 0 22 4,9
Total 171 276 0 447 100
Source: Ministry of Health

92
In terms of sales of medicinal products, the country recorded in 2013, 71 medicines sales units spread across all municipalities. This year there were also about 147 private health facilities. Also, more than 227 million Cape Verdean escudos were spent in terms of public spending on medicine products, highlighting the Municipality of Praia and São Vicente, both accounting for 37.2% the total number of expenditures. Table 76 - Drug sales offices and pharmacies (public and private) and health facilities by municipality (2010-2013)
Municipality Sale Points Pharmacies Private Health
Units Public Private Total
2010 6 30 33 63 142
2011 7 33 34 67 142
2012 7 33 34 67 147
2013
Cabo Verde 2 32 37 69 147
Ribeira Grande 0 1 1 2 6
Paul 0 1 0 1 1
Porto Novo 0 1 2 3 4
S. Vicente 0 5 6 11 38
Ribeira Brava 0 1 1 2 3
Tarrafal S. Nicolau 0 1 1 2 0
Sal 0 1 3 4 8
Boavista 0 1 1 2 4
Maio 0 1 1 2 2
Tarrafal 0 1 2 3 1
Santa Catarina 1 1 3 4 8
Santa Cruz 0 1 1 2 2
Praia 0 7 9 16 63
S. Domingos 0 1 1 2 0
S. Miguel 0 1 1 2 0
S. Salvador do Mundo 0 1 1 2 0
S. Lourenço dos Órgãos 0 1 0 1 0
Ribeira Grande Santiago 0 1 1 2 0
Mosteiros 0 1 1 2 0
S. Filipe 0 1 1 2 7
Santa Catarina do Fogo 0 1 0 1 0
Brava 1 1 0 1 0
Source: Ministry of Health

93
Table 77 - Public expenditure (in millions of Escudos and proportion) of medicinal product by municipality (2013)
2013
Value (Millions CVE) %
Cabo Verde 227,344 100,00
Ribeira Grande 12,614 5,55
Paul 4,174 1,84
Porto Novo 12,188 5,36
S. Vicente 36,599 16,10
Ribeira Brava 5,603 2,46
Tarrafal S. Nicolau 4,591 2,02
Sal 7,796 3,43
Boavista 5,925 2,61
Maio 3,978 1,75
Tarrafal 7,354 3,23
Santa Catarina 7,874 3,46
Santa Cruz 10,587 4,66
Praia 47,899 21,07
S. Domingos 6,052 2,66
S. Miguel 5,797 2,55
S. Salvador do Mundo 5,332 2,35
S. Lourenço dos Órgãos 8,782 3,86
Ribeira Grande de Santiago 2,653 1,17
Mosteiros 6,104 2,68
S. Filipe 17,702 7,79
Santa Catarina do Fogo 3,547 1,56
Brava 4,190 1,84
Source: Ministry of Health
Obs.: Excludes the central hospitals and HRSN

94
Indicators
Designation Calculation
Child mortality rate (MDG)
No of child deaths under 1 year of age x 1.000
No of live births
Early Neonatal Mortality Rate
No of child deaths aged 0 to 6 days of full life x 1.000
Total number of live births
Late Neonatal Mortality Rate
No of child deaths from 7 to 27 days of full life x 1.000
Total number of live births
Perinatal Mortality Rate Sum of the number of fetal deaths (22 weeks gestation or more)
and child deaths aged 0-6 full days of life x 1.000
No of total births (live births plus
fetal deaths of 22 weeks and over gestation)
Post-neonatal Mortality rate (late infant mortality rate)
No of child deaths from 28 to 364 full days of life x 1.000
No of live births
Youth Mortality Rate No of child deaths aged 1 to 4 years of age x 1.000
Total number of children aged 1 to 4 years old
Under five mortality rate (MDG)
No. of children deaths under 5 years x 1.000
Total number of live births
Maternal Mortality Rate (MDG)
No of female deaths by direct obstetric causes x 100.000
Live births
Gross Mortality Rate or Overall Mortality Rate
Total number of residents deaths x 1.000
Total resident population
Gross Birth Rate Tota number of residente live births x 1.000
Total resident population
AIDS Incidence Rate No of new AIDS cases, confirmed in residents x 100.000
Total resident population
AIDS Prevalence Rate Total number of AIDS cases on record (cumulative) x 100.000
Total resident population
AIDS Mortality Rate No of deaths by AIDS x 100.000
Total resident population
Tuberculosis Incidence Rate (MDG)
No. of new cases of tuberculosis (all forms) x 100.000
Total resident population

95
Indicators
Designation Calculation
Tuberculosis Prevalence Rate (MDG)
Total number of tuberculosis cases on record (all forms) x 10.000
Total resident population
Mortality rate by Tuberculosis (MDG)
No. of deaths of residents by tuberculosis x 100.000
Total resident population
Malaria Incidence Rate (MDG)
No. of new malaria cases x 100.000
Total resident population
Malaria Mortality rate (MDG)
No. of malaria deaths x 100.000
Total resident population
Malaria Mortality Rate No. of malaria deaths x 100
Total malaria cases
Coverage rate of first-time medical appointments in the 1st year of life
No. of first medical appointments given to children under one year of age x 100
Total of children under one year of age
Coverage rate of at least 1 prenatal medical appointment (MDG)
No. of first medical appointments attended by pregnant women x 100
Total estimated pregnant women
Coverage rate of postnatal medical appointments
No. of first medical appointments attended by women in the postpartum
x 100
Total estimated pregnant women
Proportion of births attended by trained Health Personnel (ODM)
No. of deliveries assisted by experts (physicians, nurses and midwives) x 100
Total number of births
Rate of fully vaccinated children (Vaccination coverage in the First Year of Life)
No. of children under one year of age
with the basic scheme of complete vaccination x 100
Total of children under one year of age
For more information see: Publications: Statistical Report 2013: Population Health situation Statistical Report 2012: Population Health situation Statistical Report 2011: Population Health situation www.minsaude.gov.cv www.ine.cv


97

98
Education
Education has always been an important pillar for growth and sustainability of the economy of Cabo Verde. Successive governments since independence have spared no effort so that the country can currently boast a remarkable reputation of "success in sub-Saharan Africa" in relation to education indicators. Challenged by the United Nations, the country has met all the Millennium Development Goals in the area of education and currently, education indicators clearly show all deployed efforts. This yearbook theme aims to present a framework concerning the level of education, the literacy rate, the number of establishments, industry professionals, school enrollment, school dropouts and repetition rates, which are the main indicators that allow measuring the development of the education sector.
Population Education Level
The education level is an important indicator to measure education in the country. 2014 data indicate that in terms of the percentage of the population that never attended school, there was a reduction of 4.6 percentage points from 2010 to 2014. In 2014 only 8.3% of the populationdeclared never attended school. Similar results can be found in terms of the percentage of the population that is attending primary, secondary and higher education because in 2014 the figures indicate that the population attending primary school increased by 3.3 percentage points, as well as the population attending secondary and higher education, with an increase of 7.6 and 3.7 percentage points from 2010 to 2014, respectively. Regarding Pre-school, there is a decrease, taking into account that only 3.4% of the population was attending this level of pre-school education, compared with the 4.6% recorded in 2010. The data also indicate that differences remain in terms of gender and living environment of the population, ie comparing male and female gender, it appears that in relation to the proportion of people who never attended an educational institution, women are at a disadvantage compared to men because women rate values in these conditions is more than double that of men. The same applies to the rural population, where the rate of 12.3% is well above the 6.2% rate recorded in the urban environment. These differences are not so evident in relation to the percentage of the population enrolled in primary and secondary education, however, it shows that the rural population has higher rates in terms of population attending preschool and primary education. The Municipality of Ribeira Grande presented the highest percentage (14.6%) of the population that never attended school.

99
Table 78 - Nível de instrução da População, por Sexo, Meio de Residência e Concelho Population education level, by gender, area and Municipality (2010-2014)
Has
never attended
Is attending or has ever attended
Pre-school
Literacy Primary Secondary Bachelor degree
Post graduate degree
2010 12,9 4,6 1,7 41,4 32,7 1,0 5,1
2012 9,3 3,2 1,4 44,4 33,7 1,3 6,7
2013 8,5 3,3 1,5 42,5 35,3 1,7 7,2
2014
Cabo Verde 8,3 3,4 1,7 44,7 40,3 1,0 8,8
Gender
Male 5,1 3,7 1,1 46,4 40,4 0,7 7,7
Female 11,4 3,0 2,4 42,9 40,3 1,4 10,0
Area
Urban 6,2 3,1 1,4 40,8 41,5 1,3 11,9
Rural 12,3 3,9 2,5 52,8 37,9 0,4 2,4
Municipality
Ribeira Grande 14,6 2,9 2,5 54,5 36,0 0,6 3,5
Paul 11,9 4,1 7,0 52,5 32,0 1,2 3,2
Porto Novo 9,8 3,5 7,6 47,6 37,1 0,9 3,3
S. Vicente 7,6 2,9 1,0 45,1 39,2 0,9 11,0
Ribeira Brava 10,6 2,3 1,2 60,6 32,0 1,3 2,5
Tarrafal de S. Nicolau 9,9 4,7 2,1 54,8 33,7 0,9 3,8
Sal 3,0 4,1 0,5 44,6 44,2 1,9 4,7
Boa Vista 6,2 2,5 0,2 47,7 43,3 1,4 5,0
Maio 8,2 3,2 5,2 50,7 36,1 1,8 2,9
Tarrafal 10,6 2,5 3,6 48,8 40,9 0,4 3,9
Santa Catarina 10,3 2,9 1,8 45,5 42,6 0,5 6,7
Santa Cruz 11,9 4,8 2,4 43,1 45,2 0,8 3,6
Praia 5,0 3,1 0,9 37,5 41,0 1,3 16,2
S. Domingos 8,8 3,1 3,0 46,0 42,2 0,3 5,4
S. Miguel 14,1 3,6 5,1 42,0 42,3 0,6 6,3
S. Salvador do Mundo 13,1 3,5 1,3 46,3 45,7 0,5 2,6
S. Lourenço dos Órgãos 9,1 3,4 0,9 45,5 42,3 0,6 7,3
Ribeira Grande Santiago 13,3 3,8 1,5 51,3 39,7 0,2 3,5
Mosteiros 8,8 3,9 1,9 52,7 38,7 1,3 1,5
S. Filipe 11,7 6,0 1,0 55,5 34,1 1,4 2,0
Santa Catarina do Fogo 13,6 5,3 1,4 58,6 32,8 0,5 1,2
Brava 11,1 1,7 0,4 59,0 35,7 1,5 1,7
Source: INE

100
Literacy rate
The literacy rate for the population over 15 years of age indicates that in 2014 there was, in general, an increase of 3.7 percentage points when compared to 2010. The literacy rate was 86.5% in general and specifically, men had a rate of 91% and women 82%. It should be pointed out that the female population has had a higher relative increase, recording a value of 4.7 percentage points higher than in 2010. These results indicate an effort to reduce disparities in access to education and can be best evidenced when analyzing data regarding the youth literacy rate (aged 15 to 24 years) in 2014 which increased from 2010 to 2014. Important qualitative information should be highlighted, ie rates are similar for men and women, reflecting the prior implemented effort to achieve greater gender equity, both regarding area and education.
Table 79 - Literacy rate of the population (15 and over) and Youth Literacy Rate (15-24 years) according to gender, by residence and municipality (2010-2014)
Literacy rate Youth Literacy Rate
(Population aged 15 years or more)
(Population aged 15-24 years)
Total Male Female Total Male Female
2010 82,8 88,4 77,4 96,3 97,4 96,9
2012 85,3 90,5 80,5 98,1 97,9 98,4
2013 87,2 91 83,4 97,8 97,2 98,4
2014
Cabo Verde 86,5 91,0 82,1 97,8 97,4 98,3
Area
Urban 89,5 93,1 86,1 98 97,1 98,9
Rural 80,3 87,0 74,1 97,6 97,8 97,3
Municipality
Ribeira Grande 78,1 84,4 70,8 97,4 96,9 98,0
Paul 76,9 84,3 66,7 97,9 96,5 100,0
Porto Novo 75,6 81,4 69,3 97,2 96,9 97,7
S. Vicente 85,9 88,3 83,2 98,2 97,3 99,3
Ribeira Brava 86,8 92,1 81,0 96,9 97,7 95,7
Tarrafal de S. Nicolau 82,1 88,1 75,7 96,5 96,6 96,4
Sal 93,5 94,6 92,3 98,3 97,3 99,2
Boa Vista 93,5 95,8 89,9 98,9 100,0 97,4
Maio 84,0 91,2 77,1 97,4 96,1 98,8
Tarrafal 80,6 88,7 74,8 97,5 98,1 96,9
Santa Catarina 84,0 90,5 78,4 97,4 98,3 96,5
Santa Cruz 83,6 89,5 78,4 97,9 98,2 97,5
Praia 91,7 95,2 88,6 97,8 96,8 98,8
S. Domingos 86,3 93,4 79,9 99,2 99,5 98,9
S. Miguel 80,1 88,0 74,6 98,3 98,2 98,4
S. Salvador do Mundo 78,2 87,3 70,4 96,9 95,5 98,5
S. Lourenço dos Órgãos 86,1 92,1 80,5 98,0 97,0 99,4
Ribeira Grande Santiago 76,7 85,2 69,2 97,1 97,4 96,7

101
Mosteiros 84,1 91,2 77,3 99,0 98,8 99,2
S. Filipe 84,9 91,7 78,9 97,6 96,9 98,4
Santa Catarina do Fogo 79,8 88,1 71,9 97,3 97,6 97,0
Brava 87,1 89,5 85,0 96,8 95,2 98,5
Source: INE
In the year 2014 were registered about 526 educational establishments/pre-school, 420 primary school units and 50 secondary schools. The tables show an increase in 26 pre-school units, a decrease of 7 primary education units and an increase of 5 secondary schools from 2010 to 2014. This dynamic led to an increase in hiring 158 teachers for preschool, reduction of 44 teachers in primary education and an increase in hiring teachers for secondary education. Table 80 – Educational/teaching establishments (2010-2014)
Education level
Preschool Primary Secondary
2009/10 500 427 45
2010/11 504 420 49
2011/12 507 420 48
2012/13 516 417 49
2013/14
Cabo Verde 526 420 50
Ribeira Grande 31 29 2
Paul 11 14 1
Porto Novo 23 26 3
S. Vicente 29 32 5
Ribeira Brava 8 15 2
Tarrafal S. Nicolau 7 6 1
Sal 12 8 2
Boa Vista 13 9 1
Maio 12 12 1
Tarrafal 25 22 2
Santa Catarina 52 43 3
Santa Cruz 37 23 1
Praia 104 44 12
S. Domingos 32 27 2
S. Miguel 23 17 2
S. Salvador do Mundo 11 13 1
S. Lourenço dos Órgãos 18 10 1
Ribeira Grande Santiago 14 14 1
Mosteiros 14 11 1
S. Filipe 28 24 3
Santa Catarina Fogo 11 10 1
Brava 11 11 2 Source: Ministry of Education and Sports

102
Table 81 - Professionals / teachers according to the level of education (2010-2014)
Level of Education
Preschool Primary Secondary
2009/10 1.093 3.009 2.675
2010/11 1.116 2.972 2.787
2011/12 1.113 2.956 2.910
2012/13 1.212 2.955 2.932
2013/14
Cabo Verde 1.251 2.965 2.989
Ribeira Grande 40 147 114
Paul 16 55 41
Porto Novo 33 130 126
S. Vicente 140 336 455
Ribeira Brava 19 58 52
Tarrafal S. Nicolau 17 36 32
Sal 63 116 102
Boa Vista 37 50 46
Maio 23 54 34
Tarrafal 58 133 126
Santa Catarina 95 278 354
Santa Cruz 76 194 125
Praia 331 606 765
S. Domingos 47 121 102
S. Miguel 49 130 132
S. Salvador do Mundo 15 65 54
S. Lourenço dos Órgãos 27 59 61
Ribeira Grande Santiago 22 63 45
Mosteiros 28 62 41
S. Filipe 72 171 117
Santa Catarina Fogo 19 48 23
Brava 24 53 42 Source: Ministry of Education and Sports

103
The data indicate that in relation to students enrolled in 2014 there were about 22,144 students in preschool, 65,954 students attending primary school and about 52,427 students enrolled in secondary education. These figures were the result of an increase in 512 new students in preschool (increase of 2.4% compared to 2010), a decrease of 5,180 pupils in primary education (7.3%) as well as a reduction of about 976 students in the secondary level (1.8%) in the period from 2010 to 2014. Table 82 - Students enrolled by level of education (2010-2014)
Level of Education
Preschool Primary Secondary
2009/10 21.632 71.134 53.403
2010/11 22.610 69.115 53.691
2011/12 21.933 67.903 53.545
2012/13 22.052 66.665 53.632
2013/14
Cabo Verde 22.144 65.954 52.427
Ribeira Grande 632 2.095 1.792
Paul 221 777 687
Porto Novo 700 2.330 1.860
S. Vicente 3.118 8.666 6.497
Ribeira Brava 355 1.097 715
Tarrafal S. Nicolau 308 767 474
Sal 1.362 3.372 1.943
Boa Vista 698 1.071 648
Maio 349 889 683
Tarrafal 822 2.488 2.403
Santa Catarina 1.640 5.968 5.988
Santa Cruz 1.235 4.130 2.964
Praia 6.281 17.865 14.091
S. Domingos 688 2.204 1.890
S. Miguel 737 2.185 2.311
S. Salvador do Mundo 271 1.288 963
S. Lourenço dos Órgãos 344 1.068 1.201
Ribeira Grande Santiago 361 1.187 881
Mosteiros 453 1.337 930
S. Filipe 960 3.382 2.439
Santa Catarina Fogo 257 925 487
Brava 352 863 580 Source: Ministry of Education and Sports

104
Schooling rate
The gross enrollment rate for primary education was 105.4% in the year 2014. This figure although lower than what had been recorded in 2010 indicates that enrollments offer in primary education is sufficient to meet the demand for registration of the age group for primary education. With regard to secondary education, the gross enrollment rate despite having increased compared to 2010, showed a value of 82.9% and because it is less than 100%, it shows dissonance between the demand and supply of vacancies for students from secondary education age group. The lowest value was recorded in the municipality of Santa Catarina do Fogo, where this indicator showed a value of 61.6%. Table 83 - Schooling Rate (Gross and Net) according to the level of education by municipality (2010-2014)
Gross Schooling Rate Net Schooling Rate
Primary education
Secondary Education
Primary
Education Secondary Education
2009/10* 111,1 75,6 94,5 65,1
2010/11 109,6 77,9 93,7 66,8
2011/12 108,5 79,9 94,2 68,3
2012/13 106,5 82,3 93,1 69,4
2013/14
Cabo Verde 105,4 82,9 92,9 70,1
Ribeira Grande 101,7 76,5 89,8 65,5
Paul 103,5 82,0 91,5 67,7
Porto Novo 109,7 79,2 96,3 65,3
S. Vicente 103,8 78,9 91,3 69,0
Ribeira Brava 123,0 84,2 107,2 73,2
Tarrafal de S. Nicolau 115,9 73,4 101,4 61,8
Sal 100,3 74,2 90,7 66,8
Boa Vista 99,1 74,0 88,2 62,6
Maio 106,0 76,5 90,2 63,5
Tarrafal 97,2 83,1 86,8 68,2
Santa Catarina 107,3 91,0 91,7 71,9
Santa Cruz 104,3 75,3 91,6 64,5
Praia 103,8 89,1 93,8 77,3
S. Domingos 115,4 90,4 103,6 73,9
S. Miguel 104,6 88,2 90,7 71,9
S. Salvador do Mundo 108,4 67,9 89,5 57,8
S. Lourenço dos Órgãos 113,1 112,2 97,9 88,0
Ribeira Grande Santiago 106,2 68,4 90,2 52,9
Mosteiros 98,6 71,7 88,5 63,5
S. Filipe 114,8 79,7 96,2 66,1
Santa Catarina do Fogo 116,8 61,6 93,3 52,9
Brava 114,7 76,0 105,3 67,7
Source: Ministry of Education and Sports
* Indicators were updated only at national level

105
The net enrollment rate showed a value of 0.93 for primary education and 0.7 for secondary education in 2014. These figures indicate that for primary education the value is high, however, with regard to secondary education, although having increased by about 5 percentage points, it is noted that 70% of young people are enrolled in the education level of their age group. Table 84 - Net enrollment ratio in primary education, by gender (2010-2014)
Gender Academic years
2009/10* 2010/11 2011/12 2012/13 2013/14
Both 94,5 93,7 94,2 93,1 92,9
Female 93,8 92,5 92,6 91,7 91,3
Male 95,2 94,9 95,7 94,6 94,5 Source: Ministry of Education and Sports
Table 85 - Net enrollment ratio in secondary education, by gender (2010-2014)
Gender Academic years
2009/10* 2010/11 2011/12 2012/13 2013/14
Both 65,1 66,8 68,3 69,4 70,1
Female 69,9 70,9 73,0 74,1 74,8
Male 60,3 62,6 63,7 64,7 65,5
Source: Ministry of Education and Sports

106
Table 86 - Gross schooling rate parity by municipality (2010-2014)
Level of Education
Primary Secondary
2009/10 0,93 1,16
2010/11 0,93 1,13
2011/12 0,91 1,14
2012/13 0,91 1,13
2013/14
Cabo Verde 0,91 1,12
Ribeira Grande 0,91 1,27
Paul 0,97 1,26
Porto Novo 0,95 1,21
S. Vicente 0,94 1,19
Ribeira Brava 0,88 1,24
Tarrafal S. Nicolau 0,94 1,09
Sal 0,88 1,12
Boa Vista 0,92 1,12
Maio 0,80 1,31
Tarrafal 0,91 1,07
Santa Catarina 0,87 1,04
Santa Cruz 0,92 1,16
Praia 0,93 1,11
S. Domingos 0,91 1,10
S. Miguel 0,90 1,12
S. Salvador do Mundo 0,82 1,13
S. Lourenço dos Órgãos 0,94 1,19
Ribeira Grande Santiago 0,92 1,15
Mosteiros 0,92 1,15
S. Filipe 0,90 0,99
Santa Catarina Fogo 0,85 1,18
Brava 0,97 0,91 Source: Ministry of Education and Sports

107
Transition/Conclusion
In terms of the Primary School Transition rate to Secondary, the data indicate that 87% of pupils carried over from the primary to secondary school in the year 2014. The lowest value was recorded in the Municipality of Paul, where the transition rate was 0.71. Table 87 - Primary School Transition rate to Secondary (2010-2014)
Level of education
2009/10* 2010/11 2011/12 2012/13 2013/14
Cabo Verde 0,86 0,88 0,87 0,86 0,87
Ribeira Grande 0,91 0,83 0,84 0,82 0,81
Paul 0,77 0,75 0,76 0,80 0,71
Porto Novo 0,82 0,79 0,79 0,82 0,85
S. Vicente 0,86 0,90 0,90 0,89 0,88
Ribeira Brava 0,78 0,80 0,80 0,80 0,83
Tarrafal de S. Nicolau 0,78 0,75 0,67 0,75 0,79
Sal 0,87 0,87 0,90 0,88 0,91
Boa Vista 0,84 0,87 0,96 1,02 0,88
Maio 0,87 0,74 0,74 0,88 0,83
Tarrafal 0,84 0,82 0,96 0,83 0,87
Santa Catarina 0,94 0,95 0,97 0,86 0,96
Santa Cruz 0,79 1,07 0,81 0,82 0,84
Praia 0,97 0,94 0,94 0,95 0,94
S. Domingos 0,82 0,87 0,85 0,76 0,76
S. Miguel 0,86 0,95 0,93 0,94 0,93
S. Salvador do Mundo 0,59 0,57 0,70 0,71 0,73
S. Lourenço dos Órgãos 0,92 1,03 0,95 0,75 0,84
Ribeira Grande de Santiago 0,72 0,62 0,64 0,71 0,63
Mosteiros 0,75 0,75 0,85 0,85 0,81
S. Filipe 0,73 0,77 0,68 0,79 0,81
Santa Catarina Fogo 0,48 0,52 0,70 0,64 0,69
Brava 0,87 0,96 0,84 0,86 0,86
Source: Ministry of Education and Sports

108
Drop out and Failure
In 2014, the dropout rate in primary education was 1.1%, an amount that is 0.6 percentage points lower than what was recorded in 2010. The drop out has higher incidence among males both in primary and secondary education. The dropout rate registered in secondary education was 5.8% and men (6,9%) showed a slightly higher rate than women (4.8%). It should be noted that there was, in 2014, a reduction of about 2 percentage points in the dropout rate in secondary education, when compared with 2010 figures. In 2014, The municipalities of São Filipe (13%), Paul (11.1%), Brava (11%), Boa Vista (10.2%) and Tarrafal de S. Nicolau (10.1%) presented the higher values in terms of dropout rate in secondary. The municipalities of São Domingos (3.1%) São Vicente (3.5%) and Praia (3.9%) have showed the lowest values. The Boavista Island showed higher values in terms of dropout for secondary education.
Table 88 - Dropout rate by level of education and gender by municipality (2010-2014)
Primary Education Secondary Education
Total Male Female Total Male Female
2009/10 1,7 1,9 1,5 7,8 9,0 6,8
2010/11 1,7 2,0 1,4 7,3 8,7 6,1
2011/12 1,6 2,0 1,3 6,9 8,2 5,7
2012/13 1,6 1,9 1,3 7,4 8,8 6,1
2013/14
Cabo Verde 1,1 1,4 0,9 5,8 6,9 4,8
Ribeira Grande 0,2 0,4 0,0 7,4 8,3 6,5
Paul 0,9 1,0 0,8 11,1 15,7 6,8
Porto Novo 0,4 0,5 0,4 5,6 6,3 5,1
S. Vicente 1,2 1,3 1,0 3,5 3,8 3,3
Ribeira Brava 0,7 0,8 0,6 5,5 7,0 4,0
Tarrafal S. Nicolau 1,4 2,6 0,3 10,1 12,0 8,3
Sal 1,5 2,0 0,8 8,4 11,6 5,7
Boa Vista 1,1 0,9 1,3 10,2 11,8 8,8
Maio 0,1 0,2 - 4,7 6,0 3,6
Tarrafal 0,9 0,9 0,9 7,0 8,5 5,6
Santa Catarina 1,5 1,8 1,2 7,3 10,0 4,8
Santa Cruz 1,1 1,1 1,1 4,7 4,9 4,5
Praia 1,2 1,5 0,9 3,9 4,4 3,5
S. Domingos 0,4 0,5 0,2 3,1 3,8 2,6
S. Miguel 1,6 2,1 1,2 5,5 6,6 4,6
S. Salvador do Mundo 0,8 0,9 0,7 5,4 7,6 3,5
S. Lourenço dos Órgãos 1,0 1,6 0,4 4,2 4,6 3,9
Ribeira Grande Santiago 1,2 1,6 0,7 6,6 7,6 5,7
Mosteiros 1,4 2,0 0,8 6,9 8,7 5,2
S. Filipe 1,5 1,8 1,3 13,0 13,0 13,0
Santa Catarina Fogo 2,1 1,8 2,3 9,4 12,3 6,9
Brava 1,6 1,3 2,0 11,0 10,4 11,7 Source: Ministry of Education and Sports

109
Failure
Regarding the failure rate, it is noted that although having decreased from 24.9% in 2010 to 24% in 2014 the failure rate in the secondary still represents a high value. Failure to pass the secondary affects more men (27.1%) than women (21.1%). In primary education around 8.6% of students have failed. The failure occurs more among men (10.8%) than among women (6.2%). The Municipality of Santa Catarina do Fogo presented the highest failure values in terms of primary education, while for secondary education it was the Municipality of Santa Cruz.
Table 89 - Failure rate by level of education and gender by municipality (2010-2014)
Primary Education Secondary Education
Total Male Female Total Male Female
2009/10 10,5 12,8 8 24,9 27,4 22,7
2010/11 10,3 12,4 8 25,2 27,1 23,5
2011/12 9,8 11,9 7,5 25,6 28,5 22,9
2012/13 9,3 11,4 6,9 24,7 27,4 22,3
2013/14
Cabo Verde 8,6 10,8 6,2 24,0 27,1 21,2
Ribeira Grande 7,3 9,8 4,2 20,9 23,9 18,4
Paul 9,1 10,5 7,6 16,3 20,5 12,4
Porto Novo 10,4 13,0 7,6 17,2 19,9 15,0
S. Vicente 8,4 10,9 5,8 27,6 30,7 24,9
Ribeira Brava 9,9 14,2 4,8 17,6 20,8 14,7
Tarrafal S. Nicolau 8,7 10,1 7,4 23,2 26,6 19,9
Sal 9,1 11,5 6,3 19,4 22,2 16,9
Boa Vista 12,0 16,1 7,9 20,7 21,6 19,9
Maio 9,1 10,0 8,1 18,3 21,4 15,9
Tarrafal 6,5 8,0 5,0 24,8 28,3 21,5
Santa Catarina 9,5 10,8 7,9 25,8 28,4 23,4
Santa Cruz 10,2 13,7 6,4 30,2 35,3 25,9
Praia 7,0 8,5 5,3 25,2 28,9 21,8
S. Domingos 8,0 11,4 4,0 30,8 32,3 29,5
S. Miguel 10,8 13,7 7,8 19,4 21,9 17,2
S. Salvador do Mundo 7,3 8,7 5,7 22,5 25,5 20,0
S. Lourenço dos Órgãos 11,8 14,7 8,4 12,0 15,9 8,2
Ribeira Grande Santiago 7,3 9,3 5,2 22,2 25,9 18,9
Mosteiros 6,1 7,2 5,0 21,0 24,1 18,0
S. Filipe 10,6 13,2 7,5 21,1 22,9 19,1
Santa Catarina Fogo 17,0 17,9 15,9 18,3 16,7 19,7
Brava 8,1 10,1 5,8 21,9 25,2 18,4
Source: Ministry of Education and Sports

110
Indicators
Designation Calculation
Transition rate =
Number of enrolled students (new entries) in the 1st year of secondary education
Number of students in the final year of primary education
Gross enrollment rate (TBE)
=
Total students attending a certain level of education (BE, SEC) regardless of age
Population of the official age group to attend this level
Net enrollment rate (TLE)
=
Total students of the age group theoretically recommended to attend a certain level
Population of the corresponding age group
Parity index (F/M) TBA
= TBA Girls
TBA Boys
Parity index (F/M) TBA
= TLE Girls
TLE Boys
Failure percentage
= Total failed students in a given school year
Total enrolled students in the same school year
Dropout percentage
= Total dropouts in a given year of study
Total enrolled students in the same school year
For more information see: Publications:
Yearbooks of Education (Ministry of Education and Sports) Key Indicators of Education (Ministry of Education and Sports) Multiobjective Continuous Survey Modules Reports (IMC 2012 the 2014 - Living Conditions,
Labour Market) www.minedu.gov.cv www.ine.cv

111

112
Economy and Finance
In this chapter of the yearbook, are presented the indicators of the economy and finances. The data that are presented in detail allow identifying the structural changes in the country while more information is made available on the dynamics observed in the economy, particularly in relation to economic growth, as measured by the evolution of the Gross Domestic Product (GDP). Other indicators related to investment, savings, business dynamics, inflation, monetary sector, banking indicators and the country's external accounts are presented in various tables and highlight the evolution of the national economy.
National Accounts
Annual national accounts
Taking into account the decline in inflation, real GDP was higher than the nominal GDP in 2014, whereby the annual rate of change was 1.8% for real GDP, against 1.3% recorded for the nominal GDP this year. This growth is due mainly to the positive evolution of the activity sectors, fishing (24.9%), extraction (7.1%), electricity (16.2%), construction (10.7%), trade (5.6 %), telecommunications (5.3%), Business Services and Public Administration (20.3%).
Chart 3 - Accumulated Variation (%) of the GAV in volume of sectors of activity, (2013-2014)
The data indicate that in 2014 the GDP at market prices continued the registered growth trend in recent years and the period from 2010 to 2014, grew by 11.8%. This growth is largely due to the excellent performance of the tertiary sector, which has increased by 16.6% in the same period. In terms of contribution to nominal GDP it should be noted that in 2014, the tertiary sector has contributed to 63.8%, while the primary sector and the secondary have contributed to 8.0% and 16.2%, respectively.
-30%
-20%
-10%
0%
10%
20%
30%
AGR PESC EXTR. I.TRA ELEC CONS COM TRAN ALJR TELC SFIN IMOS SEMP APU
2013/12 2014/13

113
Table 90 - Gross Domestic Product - Current prices in millions of escudos (2010-2014)
2010 2011 2012 2013E 2014E
Primary Sector 11.779 12.214 13.249 13.284 12.407
Secondary Sector 24.441 25.666 25.017 24.388 25.202
Tertiary Sector 84.751 89.645 93.464 96.284 98.819
Total GVA 120.970 127.525 131.730 133.956 136.428
Taxes, net of subsidies, on products 17.598 20.399 18.621 19.025 18.514
GDP 138.569 147.924 150.351 152.981 154.941 E- Estimates Source: INE
Table 91 - Gross Domestic Product - Constant prices in millions of escudos (2010-2014)
2010 2011 2012 2013E 2014E
Primary Sector 11.848 12.334 13.172 12.998 12.484
Secondary Sector 21.549 21.926 21.413 21.069 22.097
Tertiary Sector 80.470 83.000 86.377 88.370 91.200
Total GVA 113.843 117.263 120.762 121.951 125.018
Taxes, net of subsidies, on products 16.499 18.248 16.276 16.472 15.994
GDP 130.317 135.489 136.955 138.339 140.887
E- Estimates Source: INE
Table 92 - GDP structure by Business Sector (2010-2014)
2010 2011 2012 2013E 2014E
Primary Sector 9,1 9,1 9,6 9,4 8,9
Secondary Sector 16,5 16,2 15,6 15,2 15,7
Tertiary Sector 61,7 61,3 63,1 63,9 64,7
Total GVA
GDP structure by Business Sector 12,7 13,5 11,9 11,9 11,4
GDP 100,0 100,0 100,0 100,0 100,0
Source: INE
Table 93 - GDP growth rate - nominal and real (2010-2014)
Nominal GDP (%) Real GDP (%)
2010 2,0 1,5 2011 6,8 4,0 2012 1,6 1,1
2013E 1,7 1,0
2014E 1,3 1,8
E- Estimates Source: INE

114
When analyzing the tables of the contribution of different sectors in the Gross Value Added (GVA), there is a major structural change in the primary and secondary sector that have decreased their participation in the VAB composition, in favor of the tertiary sector, which contribution has increased by 2.3 percentage points from 2010 to 2014. As shown in the table below, the last year of the series, this sector reached 72.4% of GVA.
Table 94 - Percentage composition of GVA - nominal (2010-2014)
2010 2011 2012 2013 2014
Primary Sector 9,7 9,6 10,1 9,9 9,1
Secondary Sector 20,2 20,1 19,0 18,2 18,5
Tertiary Sector 70,1 70,3 71,0 71,9 72,4
Total GVA 100,0 100,0 100,0 100,0 100,0 Source: INE
From 2010 to 2012 both the investment, the average gross fixed capital formation indicator, and savings, decreased by 15.6% and 10.9% respectively.
Table 95 - Gross Fixed Capital Formation as a percentage of GDP (GFCF / GDP) and final consumption expenditure as a percentage of GDP (FC / GDP), (2009-2012)
GFCF / GDP (%) CF / GDP (%)
2009 38,5 82,1
2010 45,2 81,5
2011 46,7 81,3
2012 35,1 82,2 Source: INE
Table 96 - Gross national available income (GNAI), gross income available per capita and National Savings (2007-2012)
GNAI (Millions of CVE)
GNAI per capita US$
National Savings
Amount (Millions of CVE)
%
2007 143.668 3.731,6 45.601,5 31,7
2008 155.055 4.256,1 50.452,1 32,5
2009 156.600 4.036,2 45.052,8 28,8
2010 160.579 3.903,0 47.714,4 29,7
2011 170.784 4.309,2 50.519,2 29,6
2012 166.136 3.825,1 42.517,2 25,6 Source: INE

115
Gross Domestic Product per Island
From 2010 to 2012, GDP showed a positive variation in all of the islands, however, most notably the island of Boavista, which showed a variation of 30.3% in the period. In terms of relative share, we note that the island of Santiago contributed 53.2% to GDP in 2012, followed by the island of São Vicente with 15.2%. Figure 1 - GDP at current prices (Millions of Escudos) per Island (2012)
Source: INE
Table 97 – GDP per Island (2007-2012)
GDP Per Island (Milions of Escudos)
2007 2008 2009 2010 2011 2012
Cabo Verde 121.974 134.698 135.879 138.569 147.924 150.351
Santo Antão 8.139 8.783 9.071 9.114 9.626 9.297
S. Vicente 19.639 22.000 21.696 22.635 24.015 22.905
S. Nicolau 2.736 3.085 3.366 3.273 3.415 3.137
Sal 15.581 17.635 15.181 15.847 16.388 16.258
Boa Vista 3.008 3.814 4.869 6.024 6.368 7.851
Maio 1.594 1.756 1.822 1.791 1.917 1.871
Santiago 63.823 69.474 71.710 71.981 77.124 79.954
Fogo 6.293 6.910 6.908 6.686 7.702 7.834
Brava 1.162 1.242 1.256 1.217 1.368 1.244 Source: INE
GDP per island (2012) Millions ECV

116
The per capita GDP of Cabo Verde, increased during the period 2010 to 2012, 5.9%. During this period, the islands of São Vicente, São Nicolau and Sal had negative growth rates of GDP per capita, the most significant drop observed on Sal Island (8.2%). The highest values of GDP per capita were recorded on the islands of Boa Vista and Sal, where tourism has greater dynamism. The GDP per capita of 697,162 escudos found on the island of Boa Vista in 2012 is more than triple the amount recorded in Brava island that year. This indicates that there are significant regional differences in economic growth in the country. Table 98 - GDP per capita per Island (2007-2012)
GDP per capita (Escudos)
2007 2008 2009 2010 2011 2012
Cabo Verde 255.396 278.539 277.992 280.481 295.890 297.147
Santo Antão 179.859 195.596 203.999 207.031 222.463 218.479
S. Vicente 265.264 293.595 286.651 296.140 310.318 292.437
S. Nicolau 207.508 235.608 259.399 254.574 267.408 247.248
Sal 705.096 755.140 616.359 610.194 595.209 558.758
Boa Vista 410.455 481.668 570.105 654.273 622.722 697.162
Maio 228.990 251.622 260.978 256.450 275.739 269.850
Santiago 240.900 258.504 263.569 261.399 276.459 282.865
Fogo 167.783 184.507 185.106 179.844 208.936 214.163
Brava 184.735 200.155 205.516 202.219 229.865 211.311 Source: INE

117
Companies
The dynamics of the business sector is an important indicator in the economy. The analysis of the tables shows that from 2007 to 2013 the number of companies increased by 20.4% during the same period the Turnover increased by around 32%. In 2013 most of the companies were located on the islands of Santiago (44.1%) and São Vicente (19.8%).
Table 99 - Companies according to the type of accounting and turnover organization (2007-2013)
Companies Turnover
(Millions ECV) With Accounting
No Accounting
Total
2007 1.888 5.624 7.512 191.285
2008 2.196 5.669 7.865 200.347
2009 2.573 6.024 8.597 205.113
2010 2.959 5.940 8.899 230.552
2011 3.197 5.760 8.957 258.441
2012 3.067 6.110 9.177 250.822
2013
Cabo Verde 3.125 5.924 9.049 252.599
Santo Antão 100 657 757 3.288
S. Vicente 687 1.103 1.790 68.700
S. Nicolau 45 314 359 1.080
Sal 579 335 914 48.408
Boa Vista 221 168 389 6.507
Maio 34 113 147 546
Santiago 1.406 2.582 3.988 121.753
Fogo 42 536 578 1.992
Brava 11 116 127 324
Source: INE
Table 100 - Number of Companies per islands (2007-2013)
2007 2008 2009 2010 2011 2012 2013
Cabo Verde 7.512 7.865 8.597 8.899 8.957 9.177 9.049
Santo Antão 522 564 576 618 608 804 757
S. Vicente 1.531 1.584 1.725 1.744 1.719 1.807 1.790
S. Nicolau 306 327 359 404 313 328 359
Sal 775 867 883 931 932 910 914
Boavista 202 257 201 241 303 373 389
Maio 185 180 264 203 215 211 147
Santiago 3.233 3.381 3.769 3.928 4.056 4.062 3.988
Fogo 621 522 614 656 665 553 578
Brava 136 184 205 174 146 129 127
Source: INE The number of persons employed increased 9.5% from 2007 to 2013 however, this result was not uniform in the country because, the islands of Boa Vista and Santo Antão showed positive

118
growth of about 66.9% and 27.9%, respectively in terms of persons employed from 2007 to 2013. the island of Maio showed the highest negative growth in the analyzed period (26.5%). Table 101 - Persons employed in companies according to islands (2007-2013)
2007 2008 2009 2010 2011 2012 2013
Cabo Verde 46.567 47.771 50.190 52.079 53.394 51.411 50.975
Santo Antão 1.378 1.463 1.592 1.795 1.749 1.833 1.763
S. Vicente 11.247 11.337 11.843 11.973 12.334 12.249 12.218
S. Nicolau 725 806 851 868 924 712 706
Sal 6.938 8.268 7.767 8.113 8.100 7.508 8.436
Boa Vista 1.270 1.637 1.640 1.984 2.376 1.965 2.119
Maio 491 506 583 556 627 458 361
Santiago 22.640 21.833 23.855 24.724 25.474 25.011 23.779
Fogo 1.590 1.598 1.717 1.738 1.518 1.411 1.364
Brava 288 323 341 327 292 264 229
Source: INE
The data indicate that in 2013, 74.5% of companies were sole proprietorships. Also found that 86.7% of companies had between 1 and 5 employees. This pattern was found in all the islands of the country.
Table 102 - Companies according to the type of legal form (2007-2013)
Type of legal form
ENI (sole proprietorship)
PLC (Private Limited Companies)
Private Limited Companies and Others
2007 5.926 1.272 314
2008 5.683 1.463 719
2009 6.584 1.601 412
2010 6.769 1.724 406
2011 6.699 1.898 360
2012 6.884 1.899 394
2013
Cabo Verde 6.750 1.915 384
Santo Antão 671 78 8
S. Vicente 1.347 378 65
S. Nicolau 334 24 1
Sal 484 356 74
Boa Vista 222 154 13
Maio 116 30 1
Santiago 2.921 856 211
Fogo 538 31 9
Brava 117 8 2
Source: INE

119
Table 103 - Companies according to the step of service staff, (2007-2013)
Step of service staff
1 - 5 6 - 10 11 - 20 21 and up
2007 6.289 657 281 285
2008 6.622 661 287 295
2009 7.324 683 275 316
2010 7.495 750 328 326
2011 7.738 587 319 312
2012 7.907 648 328 294
2013
Cabo Verde 7.847 614 302 286
Santo Antão 727 19 7 4
São Vicente 1.512 136 71 71
São Nicolau 342 11 5 1
Sal 741 85 45 43
Boa Vista 333 27 16 13
Maio 135 8 3 1
Santiago 3.399 295 144 150
Fogo 537 28 10 3
Brava 121 5 1 0 Source: INE
Table 104 - Proportion of sole proprietorships companies and companies with less than 10 employees (2007-2013)
Proportion of sole proprietorships companies (%
total number) Proportion of companies with less
than 10 people employed (%)
2007 79 92
2008 72 93
2009 77 93
2010 76 93
2011 75 93
2012 75 93
2013
Cabo Verde 75 94
Santo Antão 89 99
S. Vicente 75 92
S. Nicolau 93 98
Sal 53 90
Boa Vista 57 93
Maio 79 97
Santiago 73 93
Fogo 93 98
Brava 92 99
Source: INE

120
Censuses allow providing information to more detailed geographical levels because they are comprehensive operations. In the table below we can observe the municipalities with the highest concentration of companies, on personnel employed and turnover.
Table 105 - Companies, service staff and the Turnover by municipality in the last two business censuses (2007 and 2012)
Number of Companies
Service Staff Turnover
2007 2012 2007 2012 2007 2012
Cabo Verde 7.512 9.177 46.567 51.411 191.285 250.822
Ribeira Grande 254 356 722 789 732 1.505
Paul 76 139 120 226 80 310
Porto Novo 192 306 536 803 555 1.532
S. Vicente 1.531 1.808 11.247 12.256 48.245 72.154
Ribeira Brava 204 203 473 432 545 646
Tarrafal de S. Nicolau 102 125 252 280 451 537
Sal 775 910 6.938 7.508 26.870 38.910
Boa Vista 202 373 1.270 1.965 3.371 7.688
Maio 184 211 489 458 535 688
Tarrafal 213 264 654 539 687 605
Santa Catarina 412 527 1.286 1.313 1.794 2.139
Santa Cruz 232 261 676 713 893 557
Praia 1.932 2.485 18.961 21.231 103.307 119.504
S. Domingos 118 157 258 414 375 828
S. Miguel 155 183 426 386 419 450
S. Salvador do Mundo 49 54 92 90 35 34
S. Lourenço dos Órgãos 54 64 128 159 484 139
Ribeira Grande de Santiago 69 68 160 173 172 190
Mosteiros 164 158 313 263 159 269
S. Filipe 387 325 1.117 1.026 1.221 1.722
Santa Catarina do Fogo 69 71 159 123 75 88
Brava 136 129 288 264 279 326
Source: INE
Although in some sections of the NACE where still prevail unincorporated family businesses, it is clear their poor representation at the level of business statistics, in particular in Sections A and B and section H, the organization of the sections by economic activity sector provides a good indication of the structure of the Cabo Verdean economy where the services sector (sections G to S) is responsible for more than 2/3 of the GDP.

121
Table 106 - Companies, service staff in businesses and turnover of the companies according to NACE-Rev.1 (2007-2013)
Companies Service Staff Turnover
2007 7.512 46.567 191.285
2008 7.865 47.771 200.347
2009 8.597 50.190 205.113
2010 8.899 52.079 230.552
2011 8.957 53.394 258.441
2012 9.177 51.411 250.822
2013
Cabo Verde 9.049 50.975 252.599
A - Agriculture, forestry and fishing 23 183 2.993
B - Mining and quarrying 13 106 184
C - Manufacturing 925 6.750 19.193
D - Electricity, gas, steam and air conditioning supply
11 877 9.542
E - Water supply; sewerage; waste managment and remediation activities
20 389 2.529
F - Construction 265 3.750 25.326
G - Wholesale and retail trade; repair of motor vehicles and motorcycles
4.281 12.253 93.843
H - Transporting and storage 119 3.645 17.418
I - Accommodation and food service activities
1.334 9.118 33.924
J - Information and communication 186 1.950 12.695
K - Financial and insurance activities 37 1.510 18.454
L - Real estate activities 241 918 4.174
M - Professional, scientific and technical activities
420 1.261 2.146
N - Administrative and support service activities
244 4.444 6.868
P - Education 149 1.763 1.374
Q - Human health and social work activities
128 530 806
R - Arts, entertainment and recreation
85 473 502
S - Other services activities 568 1.055 630
Source: INE

122
Prices
The dynamics of the Consumer Price Index (CPI) is interpreted as an indicator of inflation and allows the measurement of changes in the cost of living in the country. The country in 2014 recorded a deflation of 0.2% which means that the most sought class of goods have undergone price reduction.
Table 107 - Consumer Price Index (2007-2014)
Index (CPI)
2007 100,0
2008 106,8
2009 107,8
2010 110,1
2011 115,0
2012 117,9
2013 119,7
2014
Cabo Verde 119,4
01 - Food and non-alcoholic beverages 122,1
02 - Alcoholic beverages and tobacco 121,7
03 - Clothing and footwear 119,3
04 - Housing, water, electricity, gas and other fuels 127,4
05 - Furnishings, household equipment and routine household maintenance
121,4
06 - Health 116,9
07 - Transport 111,2
08 - Communication 79,6
09 - Recreation and culture 90,2
10 - Education 98,1
11 - Restaurants and hotels 131,9
12 - Miscellaneous goods and services 134,9
Source: INE

123
Table 108 - Inflation rate (2007-2014)
Inflation rate
2007 4,5
2008 6,8
2009 1,0
2010 2,1
2011 4,5
2012 2,5
2013 1,5
2014
Cabo Verde -0,2
01 - Food and non-alcoholic beverages -1,2
02 - Alcoholic beverages and tobacco 1,3
03 - Clothing and footwear 1,5
04 - Housing, water, electricity, gas and other fuels -0,2
05 - Furnishings, household equipment and routine household maintenance
1,2
06 - Health 1,3
07 - Transport -1,8
08 - Communication 0,8
09 - Recreation and culture -1,2
10 - Education -0,7
11 - Restaurants and hotels -0,2
12 - Miscellaneous goods and services 4,8
Source: INE

124
Monetary and Financial Sector
When analyzing the evolution of bank deposits it can be seen that there was an increase of 33.3% in the period from 2010 and 2014 being the increase of savings deposits of emigrants one of the contributing factors, which in the same period increased by 39.7% .
Table 109 – Bank deposits (2010-2014)
Year
Deposits
Total Term and savings deposits of which:
Other Emigrants Residents term deposits
2010 99.481 33.608 24.357 41.516
2011 98.560 36.969 23.786 37.805
2012 106.854 40.305 25.992 40.557
2013 121.889 43.632 31.271 46.986
2014 132.638 46.944 33.415 52.279
Source: Bank of Cabo verde
In terms of borrowing, it is noted that, although having grown less than the deposits in the period 2010-2014, credit has increased 23.4% and most of it, about 77.1% in 2014, as credit to the economy. Table 110 - Bank credit (2010-2014)
Year Net Domestic Credit
Total GG Net Credit Credit to the Economy
2010 100.330 16.848 83.481
2011 112.326 18.992 93.334
2012 116.452 22.851 93.601
2013 120.795 25.285 95.510
2014 123.782 28.357 95.425
Source: Bank of Cabo verde
From 2010 to 2014, short-term interest rates (up to one year) decreased by 0.5 percentage points for credit and 0.2 percentage points for deposits. As for the period between 1 and 2 years there was an increase of 1.4 percentage points for credit and 0.6 percentage points for deposits. This resulted in an increase of the spread (the difference between the interest charged on loans and the interest paid on deposits) for contracts of 1 to 2 years, by 0.8 percentage points, compared to contracts up to one year there was a reduction of 0.3 percentage points from 2010 to 2014.

125
Table 111 – Interest rates (2010-2014)
Year
Interest rates
Credit Deposits
181 days - 1 year 1 - 2 years 181 days - 1 year 1 - 2 years Emigrants
(181 days - 1 year)
2010 9,0 10,1 4,5 4,1 4,1
2011 9,5 10,1 4,2 4,7 4,2
2012 9,3 10,0 3,8 4,9 3,7
2013 9,0 10,4 4,3 4,9 4,2
2014 8,5 11,5 4,3 4,7 4,7 Source: Bank of Cabo Verde Observation: From February 5, 1996 interest rates were fully liberalized. Before liberalization, the rates used in
emigrant accounts (CVE) were equal to the rates of residents plus a margin of 0.5%
In the period 2010-2014, the net foreign assets increased by 49.8% as well as the money supply, which has increased by 30.8%in the same period.
Table 112 - Monetary Survey, (2010-2014)
Years
Ativos Externos Líquidos Other Net
Assets
Money supply
Total BCV Commercial
banks Total
Money (M1)
Near Money
character
2010 29.417 31.056 -1.639 -18.084 111.663 43.565 68.098
2011 21.296 27.659 -6.364 -18.297 115.325 39.132 76.193
2012 26.197 32.288 -6.091 -20.059 122.590 41.073 81.517
2013 36.168 38.006 -1.838 -20.883 136.080 47.782 88.298
2014 44.061 46.366 -2.304 -21.838 146.005 54.174 91.831
Source: Bank of Cabo Verde GG – General Government Observation: By December 2009, the Monetary Survey integrated the information of the five bank financial
institutions. From December 2010, in addition to the central bank's information became to include the information from seven of the eight commercial banks that are part of the national banking system. However, from December 2012, it moved to cover data from all banking institutions of the system.
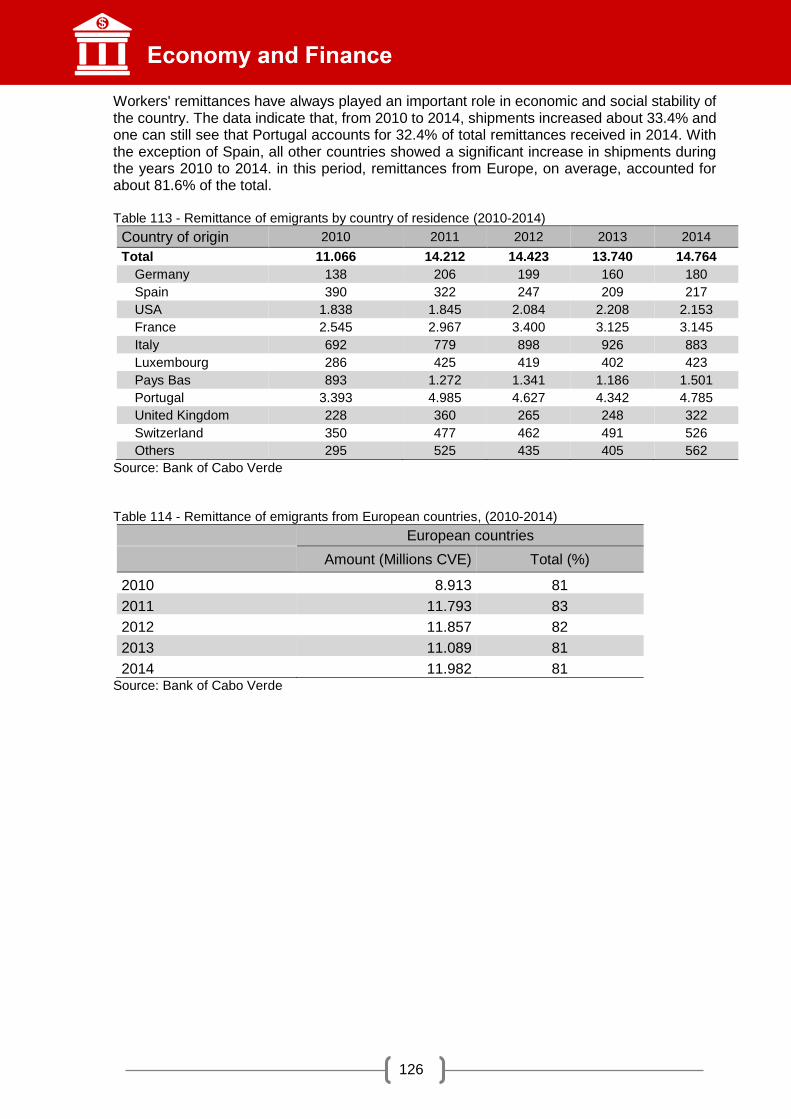
126
Workers' remittances have always played an important role in economic and social stability of the country. The data indicate that, from 2010 to 2014, shipments increased about 33.4% and one can still see that Portugal accounts for 32.4% of total remittances received in 2014. With the exception of Spain, all other countries showed a significant increase in shipments during the years 2010 to 2014. in this period, remittances from Europe, on average, accounted for about 81.6% of the total. Table 113 - Remittance of emigrants by country of residence (2010-2014)
Country of origin 2010 2011 2012 2013 2014
Total 11.066 14.212 14.423 13.740 14.764
Germany 138 206 199 160 180
Spain 390 322 247 209 217
USA 1.838 1.845 2.084 2.208 2.153
France 2.545 2.967 3.400 3.125 3.145
Italy 692 779 898 926 883
Luxembourg 286 425 419 402 423
Pays Bas 893 1.272 1.341 1.186 1.501
Portugal 3.393 4.985 4.627 4.342 4.785
United Kingdom 228 360 265 248 322
Switzerland 350 477 462 491 526
Others 295 525 435 405 562
Source: Bank of Cabo Verde
Table 114 - Remittance of emigrants from European countries, (2010-2014)
European countries
Amount (Millions CVE) Total (%)
2010 8.913 81
2011 11.793 83
2012 11.857 82
2013 11.089 81
2014 11.982 81 Source: Bank of Cabo Verde

127
National ATM Network Activity
The banking sector has shown a diversification in terms of services provided to customers. There is the decentralization of banking activities through greater use of the debit card. The data indicate that the number of credit transactions and has increased considerably and from 2010 to 2014 there was an overall increase of 95% in transactions and 57.9% in terms of financial turnover, with particular emphasis on shopping movements at the POS. In fact, 92.4% of transactions with cartão24 in 2014 were for withdrawal or payment at POS. Transactions with international card also increased considerably from 2010 to 2014.
Table 115 - ATMs per 10,000 inhabitants and cards produced, (2010-2014)
Year ATMs per 10,000 Inhabitants. Number of cards produced
2010 2,9 109.108
2011 3,0 75.168
2012 3,2 59.093
2013 3,2 79.830
2014 3,3 86.361 Source: BCV, SISP
Table 116 - Transactions by debit card at ATM terminals (ATMs) and point of sales terminals (POS) in Millions of CVE (2010-2014)
2010 2011 2012 2013 2014
Amount Value Amount Value Amount Value Amount Value Amount Value
With Cartão Vinti4 6.306.326 30.010 8.035.046 36.894 9.104.270 39.816 10.605.027 43.989 12.300.308 47.374
Withdrawals 3.872.938 21.088 4.469.002 23.988 4.686.930 24.739 4.962.101 25.866 5.264.674 25.695
Transferers 11.793 377 16.755 531 20.460 583 25.964 715 30.219 849
Mbile charging 707.631 329 949.171 385 948.379 356 988.728 359 891.515 333
Payment services 4.373 92 4.828 250 4.450 144 6.457 106 13.783 171
POS Payments 1.709.591 8.124 2.595.290 11.741 3.421.099 13.978 4.621.777 16.943 6.100.117 20.326
With International Card 177.229 2.890 208.280 2.588 313.422 3.878 388.318 4.742 444.521 9.030
Withdrawals 124.724 2.144 145.239 1.730 220.240 2.588 269.142 3.162 288.010 3.351
POS Payments 52.505 746 63.041 858 93.182 1.290 119.176 1.581 156.511 1.971
Source: SISP
Although the number of banking institutions has not registered increase since 2010, it is noticed that there was an increase in the number of sub-branches (8.6%), of the ATMs (21.3%) and POS terminal number (117.8 %). Means and payment instruments showed a positive development from 2009 to 2013. Virtually all means of payment increased transaction volume as well as the amounts involved.

128
Table 117 - Financial statistics, (2010-2014)
Year
Rede Multibanco
Credit Institutions Sub-branches/Agencies
ATM machine
POS Terminal
Transactions with Debit Card (CVE million) *
No No No No POS ATM
2010 8 105 141 1 985 8 165 22 228
2011 8 109 151 2 613 11 755 25 201
2012 8 111 162 2 990 14 211 25 641
2013 8 113 163 3 687 16 866 26 840
2014 8 114 171 4 324 20 277 28 546
Source: Bank of Cabo Verde
Observation: Includes withdrawals (ATM), transfers, utility payments, mobile phone charging and other operations.

129
Table 118 - Summary of Payment Means and Instruments, (2009-2013)
2009 2010 2011 2012 2013
Volume Value Volume Value Volume Value Volume Value Volume Value
Transfers 1.087.647 224.156 1.607.511 218.949 1.466.948 167.014 2.134.391 256.670 2.972.810 450.998
Interbank 57.797 63.099 84.070 75.025 115.669 75.949 272.845 82.845 419.938 87.084
Interbank 1.029.850 161.057 1.523.441 143.925 1.351.279 91.065 1.861.546 173.825 2.552.872 363.914
Credit Cards
Use in ATM 3.587.604 19.318 4.439.276 22.228 5.440.727 25.201 5.463.403 25.641 5.964.143 27.052
Withdrawals 3.179.758 18.770 3.906.686 21.616 4.469.002 23.988 4.688.415 24.739 4.969.359 25.866
Transfers 8.767 306 10.931 354 16.754 531 19.438 573 25.964 715
Payment services 2.500 13 4.343 16 4.507 247 2.565 10 6.457 106
Carregamento Telemóvel 395.857 227 517.316 241 948.652 421 748.735 284 960.094 347
Other operations 722 2 1.812 14 4.250 34 2.269 18
Use in POS 1.146.085 5.336 1.731.656 8.165 2.629.413 11.755 3.670.156 14.211 4.612.696 16.866
International Cards 198.063 2.514 191.664 2.366 208.280 2.588 322.635 3.775 383.963 4.732
Source: BCV, SISP

130
The balance of payments registers all transactions between residents and non-residents. Cabo Verde has a structural deficit in the current
account, mainly due to the significant number imports of goods that even with the positive balance in the services account (due to the dynamism
of tourism) and current transfers balance, is not enough to be compensated.
The capital and financial balance that is the channel through which the external financing of the economy is processed, experienced a positive
evolution, mainly by increasing Foreign Direct Investment.
Table 119 – Balance of Payments, (2005-2014)
Years
Current Account Capital and Financial Balance
Errors and Omissions
Overall Balance
Total Goods Services Income Current Transfers Total Capital Account
Financial Account
2005 -3.568 -30.960 5.438 -2.995 24.949 8.509 1.852 6.657 24 4.965
2006 -7.214 -40.694 11.612 -3.515 25.383 13.015 1.540 11.476 -758 5.044
2007 -15.787 -53.243 15.762 -2.530 24.224 22.707 2.148 20.559 200 7.120
2008 -18.467 -57.233 18.404 -3.540 23.902 25.166 2.084 23.082 -4.445 2.254
2009 -19.800 -53.735 12.782 -3.442 24.596 21.750 3.670 18.080 -2.502 -551
2010 -18.722 -56.822 16.529 -6.710 28.281 27.877 3.311 24.566 -6.937 2.218
2011 -23.943 -67.206 20.449 -5.655 28.469 20.524 985 19.539 -65 -3.484
2012 -20.022 -57.394 21.546 -6.396 22.221 25.877 1.122 24.754 -1.797 4.058
2013 -6.893 -52.531 28.601 -5.367 22.404 14.395 533 13.862 -1.898 5.604
2014 -12.455 -50.967 24.205 -7.714 22.021 20.838 659 20.179 -538 7.845
Source: Bank of Cabo Verde Standard Representation according to the 5th IMF Manual

131
Public finances
In this period the current revenues of the State showed a downward trend due to fluctuations occurred in two of its main components: taxes and
transfers.
Table 120 - Public revenues - Accumulated values in million CVE (2010-2014)
2010 2011 2012 2013 2014
Taxes 26.241,3 29.580,7 27.572,8 28.099,5 27.465,1
Income tax 7.892,2 8.678,3 8.615,5 8.595,7 8.051,4
Taxes on goods and services 12.014,8 13.839,6 12.511,9 13.135,6 12.847,7
Taxes on international transactions 5.633,6 6.227,7 5.777,7 5.699,7 5.754,4
Other taxes 700,7 835,1 667,6 668,0 810,8
Social Security 41,9 36,5 41,3 43,1 55,3
Transfers 9.489,9 4.361,9 4.202,5 4.023,6 2.608,2
Other revenues 3.955,6 3.956,1 4.871,6 5.550,2 5.279,9
Property income 315,6 339,0 383,9 476,1 180,9
Sale of goods and services 3.077,0 3.142,8 3.873,9 3.896,7 3.958,4
Fines and penalties 316,6 257,3 332,4 510,9 704,3
Other transfers 0,0 84,9 195,2 31,9 92,9
Other miscellaneous and unspecified income 246,5 132,2 86,1 634,5 343,4
Overall income 39.728,7 37.935,3 36.688,2 37.716,4 35.408,4
Source: Ministry of Finance The data show the upward trend of total expenditure with emphasis on current expenditure. The items that have had greater participation in the
evolution of current expenditure are: the staff costs, current interest, social benefits and transfers.

132
Table 121 - Public Expenditure - Cumulative Amounts in million CVE (2010-2014)
2010 2011 2012 2013 2014
Expenses with personnel 14.809,5 15.679,3 15.885,9 16.600,7 16.885,4
Fixed and permanent wages 14.282,6 14.917,4 15.114,0 15.666,9 15.796,8
Social Security 526,9 761,9 771,9 933,8 1.088,6
Purchase of goods and services 5.171,4 5.247,5 4.994,9 5.061,5 5.136,4
Current interest 2.172,7 2.276,3 2.857,7 3.383,3 3.444,0
Foreign debt 699,1 851,5 1.142,4 1.438,2 1.518,3
Domestic debt 1.460,0 1.424,8 1.715,3 1.877,7 1.909,7
Other expenses 13,6 0,0 0,0 67,3 16,0
Subsidies 751,8 994,1 274,5 101,0 106,5
Current transfers 4.938,8 4.308,6 4.057,2 4.074,5 4.392,7
To foreign governments 0,0 0,0 254,2 223,4 0,0
International bodies 410,3 204,1 277,4 247,6 168,4
Public Administration 4.528,5 4.104,6 3.525,6 3.603,4 4.224,3
Social benefits 3.071,2 3.797,7 3.917,9 4.150,4 4.315,3
Other current expenses 2.183,5 2.025,1 2.421,1 2.052,7 2.323,4
Expenses 33.098,9 34.328,7 34.409,2 35.424,1 36.603,8
Value to adjust 693,7
Payment on account of the Funds 0,0 0,0 0,0 0,0 0,0
Total expenditure 33.098,9 34.328,7 34.409,2 35.424,1 37.297,4
Source: Ministry of Finance

133
Table 122 - Summary of State Financial Operations - Accumulated values in million CVE (2010-2014)
2010 2011 2012 2013 2014
Total revenue 39.728,7 37.935,3 36.688,2 37.716,4 35.408,4
Current revenue 30.242,8 33.658,3 32.638,3 33.947,2 33.027,8
Capital revenue 9.485,9 4.277,0 4.049,9 3.769,2 2.380,7
Total expenditure 33.098,9 34.328,7 34.409,2 35.424,1 37.297,4
Operating expenses 27.496,6 28.813,9 29.740,8 30.953,4 32.018,2
Current or capital expenditure 5.602,3 5.514,8 4.668,4 4.470,7 5.279,2
Gross Operating Result 6.629,7 3.606,6 2.279,0 2.292,4 -1.889,0
Non-financial assets 21.810,2 17.158,7 20.878,0 16.601,0 9.486,7
Purchase of non-financial assets 21.810,5 17.208,8 20.879,7 16.614,6 9.876,0
Nonfinancial assets sale 0,3 50,1 1,6 13,6 389,3
Overall balance -15.180,5 -13.552,1 -18.599,1 -14.308,6 -11.375,6
Financing 14.663,2 13.826,0 19.106,5 14.090,0 10.915,3
Financial Assets -848,7 -2.568,3 -2.551,7 -6.817,2 -4.736,5
Financial Liabilities 15.511,8 16.394,2 21.658,2 20.907,2 15.651,8
Net domestic 988,2 2.157,5 3.907,6 1.199,2 1.044,6
Net Foreign 14.523,6 14.236,8 17.750,6 19.707,9 14.607,2
Funding differential/gap -517,3 273,9 507,4 -218,6 -460,3
Source: Ministry of Finance

134
Indicators and definition
Balance of payments consists of the accounting records of financial flows on all transactions
of that country with the rest of the world for a certain period of time (usually a year).
Trade balance records all transactions in goods between residents and non-residents of that
country processed over a period of time (usually a year)
Final consumption is the value of all individual goods and services purchased added to the value of collective services provided by government to the community or a large community groups. Actual final consumption of of public administrations are the expenses incurred by the government of a collective nature services. Actual final consumption of households are the consumption expenditures of the households consumption held by social transfers in kind from government units or non-profit institutions serving households.
Exports of goods and services are goods sold (valued at FOB prices ie including only the
cost of domestic marketing to the port of exit of the goods) and services provided to non-residents.
Gross Fixed Capital Formation (GFCF) covers the acquisitions less disposals made by residents producers of fixed assets during a given period and certain additions to the value of non-produced assets realized by the productive activity of production or institutional units. Imports of goods and services are purchased goods (valued at CIF prices, ie including the price of goods, the cost of insurance and freight) and services provided by the countries that make up the rest of the world.
Taxes are compulsory, unrequited payments, in cash or in kind, made by institutional units to
government units.
Taxes on production and imports are taxes, fees and contributions paid by production units, on the basis of established legal norms, and that focus on the production, marketing, import and export of goods and services and the use of inputs.
Taxes on products taxes, fees and contributions levied on goods and services when they are produced or imported, distributed, sold, transferred or otherwise made available by their owners.
Taxes on production are taxes that sustain the economic agents due to its activity, regardless
of the amount or value of goods and services produced or sold.
Income tax is the annual tax amount that applies on income, profits and actual or presumed capital gains of individuals, societies, families or private administrations. They include taxes on property, land or real estate, provided that they are used as estimating basis of the income of their owners

135
Value added tax is a tax on goods and services collected in stages by companies and ultimately, it is fully charged to final consumers. Financial intermediation is the activity in which an institutional unit acquires assets and incurs on its own account in liabilities through financial market transactions. The assets and liabilities of the financial intermediaries have different characteristics, as in the process of financial intermediation, the funds are transformed or repackaged with the maturity, scale, risk, etc. Current prices are the prices of production or acquisition at the time of the transaction.
Gross domestic product at market prices is the sum of gross value added of the various institutional sectors or areas of activity, increased taxes less subsidies on products. It can be defined in three ways: 1) GDP mp is equal to the sum of gross value added of the various institutional sectors or fields of activity, plus taxes less subsidies on products. Saving is the part of disposable income that is not allocated to final consumption expenditure. If saving is positive, non-spent income is used for the acquisition of assets or reduction of liabilities. If saving is negative, certain assets are liquidated or certain liabilities increase.
Gross national income is the gross domestic product plus net income of inputs sent (received) to (from) the rest of the world.
Gross National Income (GNI) at market prices represents total primary income receivable by resident institutional units: emplyee compensation, taxes on production and imports less subsidies, property income (receivable less payable), exploration surplus (gross or net) and mixed income (gross or net).
Household savings rate measures the portion of disposable income that is not used in final
consumption, which is calculated by the ratio of gross saving and disposable income, adjusted by the change in net equity of households in pension funds.
Transfers are transactions in which an institutional unit provides a good, service or asset to another institutional unit without receiving any goods, services or assets in return.
Current transfers are not classified as transfers of capital, they directly affect the available income and can influence the consumption of goods and services.
Capital transfers are transfers in kind or in cash, in which the ownership of an asset is transferred from one institutional unit to another or when the cash is transferred to enable the receiver to acquire an asset.
Value added is the value that the activity adds to goods and services consumed in the production process. It is the contribution to gross domestic product by the various economic activities, obtained by the difference between the value of production and intermediate consumption absorbed by these activities. Company is an entity (corresponding to a legal unit or the smallest grouping of legal or institutional units) provided organizational and decision-making autonomy in the allocation of resources to their production activities, performing one or more activities in one or more locations.

136
Main economic activity means the activity that is the most important in all the activities carried out by the economic activity. The determination of economic activity is based on the following criteria:
1. Turnover;
2. Service staff;
3. Production.
Company number of employees means the number of people who, in this period, effectively participated in the company's activity, regardless of the bond they have, whether or not they receive a wage.
Price Index Consumer
The Consumer Price Index (CPI) is an indicator that is designed to measure changes over time in the prices of a set of goods and services considered as representative of the resident population consumption structure in Cabo Verde. The CPI is not, therefore, an indicator of price levels registered between different periods but rather an indicator of its range. The current consumption structure series of the CPI (2007 = 100) as well as the goods and services which are the indicator of the basket were extrapolated based on the Survey of expenses and revenue Families conducted from October 2001 and October 2002. CPI is classified into twelve classes of products (Individual consumption rating by Objective) and the compilation results from the aggregation of three regional price indexes (Santiago, São Vicente and Santo Antão). More information about this series of the CPI may be obtained by consulting the methodological note of the indicator: "Price Index Consumer Base 2007 (IPC07) Methodology", Directorate of National Accounts, Economic Statistics and Services, Prices Division Cabo Verde's Institute for Statistics, available on the Portal of the National Statistical System through the address www.ine.cv ou www.statline.cv.
Foreign Net Assets include gross external assets and external liabilities of short, medium and
long term of the Bank of Cabo Verde and depositary corporations.
The Domestic Net Credit includes:
The net credit to the Government includes: Gross credit to the Central Government,
including the consolidation of Securities and Financial Mobilization deducted from loans
and deposits of the central governments, and local institutions and autonomous
services and the National Social Security Institute (INPS).
Credit to Economy comprises loans granted to private non-financial companies by
depository corporations to non-financial public companies, on individuals, other non-
monetary financial institutions and non-financial non-profit institutions serving
households.
Other Net Assets register: other assets and liabilities; capital accounts, interbank
flows; value fluctuations.

137
Money supply (M2) = M1 + Quasi Monetray Liabilities
Monetary Liabilities (M1) includes: notes and coins in circulation (by the public), currency issuance minus cash in depository corporations) and demand deposits of private non-financial corporations, nonfinancial public enterprises, individuals, immigrants, other non-monetary financial institutions. Quasi Monetary Liabilities (Quasi Currency) - savings deposits and term deposits in national currency of residents, including immigrants, time deposits in foreign currency from emigrants, foreign currency deposits from residents, public debt securities repurchase agreements, deposits for collateral operations and checks and orders to pay.
The interest rates charged on passive and active operations of commercial banks are effective interest rates calculated as a weighted average of the rates by the corresponding amounts. They are sorted by type and term and are expressed as a percentage. This information is reported to the Bank of Cabo Verde on a monthly basis by commercial banks. Interest rates on Treasury securities, expressed as a percentage, result from a weighted average of the placement rates of securities in the primary market. For more information see: www.minfin.gov.cv www.bcv.cv www.ine.cv


139

140
Industry, Trade and Services
This chapter consists of statistics relating to trade, industry, tourism, transport, information and communication science and technology. Each theme key indicators will be presented, it is to enable a deeper and more detailed insight into the characteristics of each sector and to enable a finding on the evolution of the most relevant indicators.
Industry
Of the 916 industry companies in 2013, 18.9% work in the field of food industries and 26% in the manufacture of furniture and mattresses. With regard to service personnel, food industries employ about 33.3% of all staff who work in the industry. Companies from the food industries and industries of beverages contribute 39.9% and 20.1% respectively in the total turnover of the industrial activity.
Table 123 - Industry sector companies by NACE Division - Rev.1 (2009- 2013)
NACE division - Rev.1 2009 2010 2011 2012 2013
Total 746 760 768 977 916
08 - Other Extractive Industries 11 10 13 12 13
10 - Food Industries 141 149 141 169 173
11 – Beverages Industries 72 67 82 123 91
12 - Tobacco Industries 1 1 1 1 1
13 - Textile Manufacturing 3 2 1 1 1
14 - Garment Industry 57 55 56 80 81 15 - Leather Industry and products for the leather industry and
footwear industry 3 3 2 4 1
16 - Wood Industry, Except Furniture, Cork and Works 128 110 103 109 111
17 - Pulp, paper and board industry and its articles 0 0 0 0 1
18 - Printing and reproduction of recorded media 24 28 31 43 37
19 - Manufacture of coke, refined petroleum products and… 1 1 1 1 1
20 - Manufacture of chemicals and chemical products 8 11 15 11 11 21 - Manufacture of basic pharmaceutical products and
pharmaceutical preparations 2 1 1 1 1
22 - Manufacture of rubber and plastic products 3 2 3 3 2
23 - Manufacture of other non-metallic mineral products 32 39 40 40 37 25 - Manufacture of fabricated metal products, except
machinery and equipment 102 98 99 110 109
26 - Manufacture of computer, electronic and optical products 1 2 2 2 1
31 - Manufacture of furniture Manufacturing 153 174 170 261 238
32 - Manufacturing industries 4 7 7 6 6 Source: INE

141
Table 124 - Number of staff employed in the companies of the industry sectors per Division of CEA (Classification of Economic Activities) - Rev.1, (2009-2013)
Division of CEA - Rev.1 2009 2010 2011 2012 2013
Total 6.828 7.034 6.670 6.792 6.856
08 - Other Extractive Industries 147 124 116 107 106
10 - Food industries 1.931 1.895 2.068 1.987 2.172
11 – Beverages Industries 550 624 593 758 724
12 – Tobacco Industries … … … ... …
13 - Manufacture of textile products 6 … … ... …
14 – Garment Industry 565 412 245 336 321 15 - Manufacture of leather and related products and
Footwear Industry 11 12 … 236 … 16 - Manufacture of wood and of products of wood and
cork, except furniture 440 493 488 326 295
17 - Pulp, paper and board industry and paper products …
18 - Printing and reproduction of recorded media 244 334 341 338 309 19 - Manufacture of coke, refined petroleum products and
... … … … … …
20 - Manufacture of chemicals and chemical products 156 159 205 190 184 21 - Manufacture of basic pharmaceutical products and
pharmaceutical preparations … … … ... …
22 - Manufacture of rubber and plastic products 50 … 69 68 …
23 - Manufacture of other non-metallic mineral products 430 542 453 401 422 25 - Manufacture of fabricated metal products, except
machinery and equipment 873 924 771 837 807 26 - Manufacture of computer, electronic and optical
products … … … ... …
31 - Manufacture of furniture Manufacturing 680 802 662 808 720
32 - Manufacturing industries 21 23 23 15 15 Source: INE

142
Table 125 - Turnover (in thousand CVE) of the industry sector Companies per Division of NACE - Rev.1 (2009-2013)
Division of CEA - Rev.1 2009 2010 2011 2012 2013
Cabo Verde 15.657.945 18.066.203 18.878.474 18.708.702 18.895.060
08 - Other mining and quarrying 434.166 372.238 429.762 294.353 183.710
10 - Manufacture of food products 3.653.359 5.965.309 7.513.787 7.319.500 7.541.194
11 - Manufacture of beverages 2.790.598 3.422.178 3.686.111 3.727.885 3.791.507
12 - Manufacture of tobacco products … … … ... …
13 - Manufacture of textiles 3.852 … … ... …
14 - Manufacture of wearing apparel 403.258 507.126 381.689 319.228 353.571
15 - Manufacture of leather and related products and Manufacture of footwear
3.140 1.751 … 394.955 …
16 - Manufacture of wood, except furniture, cork, straw and plaiting materials
451.890 384.465 283.231 345.661 252.327
17 - Manufacture of pulp, paper and paperboard and paper products
… … … … …
18 - Printing and reproduction of recorded media
506.279 627.190 572.148 429.385 423.456
19 - Manufacture of coke and refined petroleum products and...
… … … … …
20 - Manufacture of chemicals and chemical products
1.044.167 1.105.221 1.166.774 1.610.087 1.674.453
21 - Manufacture of basic pharmaceutical products and pharmaceutical preparations
… … … ... …
22 - Manufacture of rubber and plastic products
40.804 … 140.507 140.632 …
23 - Manufacture of other non-metallic mineral products
1.293.237 1.682.603 1.463.500 1.199.342 976.658
25 - Manufacture of fabricated metal products, except machinery and equipment
1.183.366 1.346.192 1.424.559 1.460.600 1.248.191
26 - Manufacture of computer, electronic and optical products and Manufacture of communication equipment
… … … ... …
31 - Manufacture of furniture and Manufacture of mattresses
535.728 656.101 807.568 633.503 628.365
32 - Other manufacturing 30.264 24.894 11.358 5.239 5.914
Source: INE

143
Domestic Trade
In 2013 the 4,281 companies engaged in trade, 88% of them are in retail trade and employ about 68% of personnel working in trade. However, the retail companies account for only 31% of trade turnover, and trade roughly accounts for 66% of the sector's turnover.
Table 126 - Company Structure of the Trade sector (2013)
Effective Service Staff Turnover
No % No % Value
(Milllions of CVE)
%
Cabo Verde 4.281 100 12.253 100 93.843 100
45 - Wholesale and retail trade and repair of motor vehicles
256 6 1.047 9 3.058 3
46 - Wholesale trade 244 6 2.836 23 61.686 66
47 - Retail trade 3.781 88 8.371 68 29.099 31
Source: INE
Please note that 85.7% of companies in the trade sector are sole proprietorships, 81.5% are considered micro companies and 92.6% of companies engaged in trade have up to 5 people employed. Units with more than 21 employees contributed at 69.2% of the trade turnover.
Table 127 - Commercial units according to their size - Micro Small Medium and Large Enterprises (2013)
Dimensão das unidades comerciais
Micro Pequena Média & Grande
45 - Wholesale and retail trade and repair of motor vehicles 176 59 21 46 - Wholesale trade, except of motor vehicles and motorcycles 75 96 73 47 - Retail trade, except of motor vehicles and motorcycles 3.239 394 148
Source: INE
Table 128 - Trade companies in the sector according to level of personal service (2013)
Age groups of persons engaged in the service
1 - 5 6 - 10 11 - 20 21 e mais
Cabo Verde 3.964 190 73 54 45 - Wholesale and retail trade and repair of motor vehicles 212 27 12 5
46 - Wholesale Trade 167 26 21 30
47 – Retail Trade 3.585 137 40 19

144
Table 129 - Turnover (in millions of ECV) of trade enterprises by economic activity (NACE Rev. 1 groups) and number of persons engaged in the service (2013)
Age groups of persons engaged in the service
1 - 5 6 - 10 11 - 20 21 and more 45 - Wholesale and retail trade and repair of motor vehicles and motorcycles 1.246 240 331 1.241 46 - Wholesale trade, except of motor vehicles and motorcycles 3.162 1.945 2.921 53.657 47 - Retail trade, except of motor vehicles and motorcycles 9.276 5.666 4.135 10.022
Source: INE Table 130 - Trade sector companies according to levels of legal form (2013)
rank of legal form
Sole Proprietorship
Company Limited
Company
Private Limited Company and
other
Cabo Verde 3.670 548 63
45 - Sale of motor vehicles and Maintenance and
repair of motor vehicles 189 57 10
46 - Wholesale Trade 94 130 20
47 - Retail Trade 3.387 361 33
Source: INE Most of the companies (68.4%) is involved in the trade of food, employs about 53.4% of total personnel employed in the sector and contributes about 44% to the total turnover of commercial activity.
Table 131 - Trade companies - wholesale and retail trade with and without food predominance (2009-2013)
2009 2010 2011 2012 2013
Cabo Verde 4.478 4.578 4.502 4.366 4.281
Retail Trade companies with food predominance 3.040 3.137 3.138 2.801 2.813
Wholesale Trade companies with food predominance 158 169 168 128 115
Retail Trade companies without food predominance 67 69 63 73 59
Other trade companies 1.213 1.203 1.133 1.364 1.294
Source: INE
Source: INE

145
Table 132 - Sales volume (in millions CVE) of trade companies - wholesale and retail with and without food predominance (2009-2013)
2009 2010 2011 2012 2013
Cabo Verde 84.004 93.772 103.228 97.308 93.843
Retail Trade companies with food predominance 14.376 13.458 18.412 13.870 13.552 Wholesale Trade companies with food predominance 23.457 20.476 26.981 27.570 27.827 Retail Trade companies without food predominance 457 457 220 306 311
Other trade companies 45.714 59.381 57.614 55.562 52.154
Source: INE
Table 133 - Employed staff in trade companies - wholesale and retail with and without food predominance (2009-2013)
2009 2010 2011 2012 2013
Cabo Verde 13.633 14.650 14.351 12.847 12.253
Retail Trade companies with food predominance 5.063 5.679 5.049 5.378 5.112
Wholesale Trade companies with food predominance 1.399 1.435 1.413 1.611 1.437
Retail Trade companies without food predominance 234 231 246 239 154
Other trade companies 6.937 7.304 7.643 5.619 5.550
Source: INE From 2009 to 2013 the nominal value of the commercial sector turnover increased by 11.7% and in 2013 reached the value of 93 843 million escudos. The turnover of companies in the trade sector has great regional heterogeneity; in 2013 only the islands of Santiago and São Vicente accounted jointly for 85.8% of the country's business volume. Table 134 - Turnover (in millions of CVE) of trade companies by islands (2009-2013)
2009 2010 2011 2012 2013
Cabo Verde 84.004 93.772 103.228 97.308 93.843
Santo Antão 1.508 2.066 2.419 1.903 1.963
São Vicente 30.387 35.076 42.648 42.613 39.389
São Nicolau 788 951 764 554 696
Sal 5.853 6.618 7.822 7.290 7.533
Boavista 740 2.873 1.015 1.042 1.161
Maio 428 402 465 364 305
Santiago 42.864 44.430 46.200 41.936 41.173
Fogo 1.123 1.016 1.587 1.346 1.379
Brava 312 339 307 260 245
Source: INE

146
Of the 12,253 persons employed in the trade sector in 2013, 49.6% were on the island of Santiago, which is also home to 43.8% of commercial companies in the country. In the period 2009-2013, in general terms, a decrease of 10.1% was recorded in the total number of persons employed in trade.
Table 135 – Employed staff in trade sectors companies by islands (2009-2013)
2009 2010 2011 2012 2013
Cabo Verde 13.633 14.650 14.351 12.847 12.253
Santo Antão 732 891 928 790 740
S. Vicente 2.943 3.254 3.131 3.033 3.027
S. Nicolau 316 422 362 357 385
Sal 1.519 1.469 1.491 966 992
Boavista 106 245 326 270 253
Maio 291 252 375 197 120
Santiago 6.693 7.103 6.774 6.513 6.074
Fogo 841 846 769 604 573
Brava 191 167 195 117 89 Source: INE
Except for the islands of Boavista and Santo Antão, all other islands presented a decrease in the number of companies dedicated to trade. Overall, there was a 4% decrease in the number of commercial businesses from 2009 to 2013, ie a reduction of 197 companies. The island of Maio presented higher decrease in absolute terms (-123 companies), and in relative terms (68%). Table 136 - Trade sector companies, by islands (2009-2013)
2009 2010 2011 2012 2013
Cabo Verde 4.478 4.578 4.502 4.366 4.281
Santo Antão 387 427 422 464 450
S. Vicente 958 959 944 899 887
S. Nicolau 246 264 171 188 233
Sal 311 335 329 315 308
Boavista 18 28 91 120 117
Maio 181 142 136 103 58
Santiago 1.880 1.936 1.928 1.926 1.877
Fogo 366 399 397 296 312
Brava 130 88 83 55 38 Source: INE

147
Table 137 - Trade sector companies according to municipalities (2013)
45 - Trade, maintenance
and repair of motor vehicles
46 - Wholesale trade
47 – Retail trade
Cabo Verde 258 247 3.781
Ribeira Grande 4 3 152
Paul 5 3 92
Porto Novo 5 … 187
S, Vicente 46 56 785
Ribeira Brava … 7 127
Tarrafal de S. Nicolau 10 … 88
Sal 22 35 251
Boa Vista 8 5 104
Maio … … 55
Tarrafal 0 0 112
Santa Catarina 14 16 203
Santa Cruz 0 6 140
Praia 98 100 832
S. Domingos 14 0 111
S. Miguel 8 … 99
S. Salvador do Mundo 0 0 39
S. Lourenço dos Órgãos 4 6 40
Ribeira Grande de Santiago 0 0 34
Mosteiros 0 0 70
S. Filipe 15 4 192
Santa Catarina do Fogo … 0 30
Brava 0 0 38
Source: INE

148
Tourism
Tourist offer
Tourism indicators showed a similar dynamic in almost all the islands and in all areas. In the period from 2010 to 2014, the number of rooms increased about 84%, the number of beds and the accommodation capacity increased 59.6% and 67.2%, respectively. Table 138 - Number of establishments, bedrooms, beds, accommodation capacity and personnel employed (2010 - 2014)
2010 2011 2012 2013 2014
No. of Establishments 178 195 207 222 229
No. of Bedrooms 5.891 7.901 8.522 9.058 10.839
No. of Beds 11.397 14.076 14.999 15.995 18.188
Accomodation capacity 13.862 17.025 18.194 19.428 23.171
Personnel employed 4.058 5.178 5.385 5.755 6.282 Source: INE
Table 139 - Number of Establishments by type of accommodation establishment (2010 – 2014)
Type of establishment 2010 2011 2012 2013 2014
Total 178 195 207 222 229
Hotels 41 44 48 54 54
Guesthouses 61 67 69 71 70
Hostels 7 8 7 12 8
Apartment hotels 12 13 14 14 21
Holiday villages 9 10 11 11 7
Residential 48 53 58 60 69 Source: INE
The personal service increased 54.8% from 2010 to 2014, and hotels accounted for 80.3% of the 6,282 of people employed in tourism establishments in 2014. Employment in establishments increased in all the islands of the country and the islands of Sal and Boavista taken together employ 74.9% of people.
Table 140 - Persons employed by type of tourist accommodation establishment (2010 – 2014)
Type of establishment 2010 2011 2012 2013 2014
Total 4.058 5.178 5.385 5.755 6.282 Hotels 3.105 4.047 4.252 4.651 5.042 Guesthouses 350 385 397 382 390 Hostels 44 49 46 67 54 Apartment hotels 124 129 146 147 271 Holiday villages 227 319 286 275 262 Residential 208 249 258 233 263
Source: INE

149
In the period 2010-2014 it is observed an increase in the number of tourist establishment of about 28.7% in general terms and the island of Santo Antão showed greater progress, with 16 of the 51 new establishments that have emerged since 2010. The new establishments that have emerged in this period are predominantly (66.7%) residentials and hotels.
Table 141 - Number of hotel establishments by Island (2010 – 2014)
Island 2010 2011 2012 2013 2014
Total 178 195 207 222 229
Santo Antão 25 29 32 39 41
S. Vicente 27 32 33 32 37
S. Nicolau 6 8 8 7 9
Sal 27 27 30 31 30
Boavista 19 21 22 20 21
Maio 4 7 7 7 8
Santiago 42 43 46 50 51
Fogo 23 22 21 26 23
Brava 5 6 8 10 9 Source: INE
Table 142 - Employed staff in the tourist accommodation establishments by island (2010 – 2014)
Island 2010 2011 2012 2013 2014
Total 4.058 5.178 5.385 5.755 6.282
Santo Antão 143 181 209 213 203
S. Vicente 324 365 369 384 425
S. Nicolau 20 34 35 28 35
Sal 1.654 2.027 2.104 2.469 2.938
Boavista 1.152 1.776 1.802 1.766 1.768
Maio 17 22 23 25 21
Santiago 639 643 705 712 755
Fogo 94 114 114 130 110
Brava 15 16 24 28 27
Source: INE

150
Tourist demand
During the reporting period, the number of guests in the year 2014 amounted to 539,621, representing an increase of 41.3% compared to 2010. In 2014, the hotel have accommodated 86.8% of the total. Guests who visited Cabo Verde this year came mainly from the United Kingdom (18%), Germany (12.8%), France (11.5%) and Portugal (11.1%). It is further noted some diversification of guests, the fact that "other countries" have significantly increased their contribution in terms of guests and in 2014 they already accounted for 20% of the total.
Table 143 - Guests by type of tourist accommodation establishment (2010 – 2014)
Type of establishment 2010 2011 2012 2013 2014
Total 381.831 475.294 533.877 552.144 539.621
Hotels 313.179 404.323 453.589 476.552 468.341
Guesthouses 14.325 23.261 27.805 27.161 22.109
Hostels 6.512 4.044 5.034 4.722 4.330
Apartment hotels 8.311 5.593 7.658 8.653 8.415
Holiday villages 11.959 14.727 14.379 9.822 15.983
Residential 27.545 23.346 25.412 25.234 20.443 Source: INE
Table 144 - Guests in tourist accommodation establishments by guests' country of habitual residence (2010 – 2014)
Country of habitual residence 2010 2011 2012 2013 2014
Total 381.831 475.294 533.877 552.144 539.621
Cabo Verde
Cabo-Verdeans 39.117 42.646 49.358 46.981 44.018
Foreigners 6.628 4.375 2.252 2.289 1.871
Foreign
South Africa 218 2.819 278 1.321 351
Germany 48.920 60.495 67.306 74.238 68.834
Austria 962 1.772 1.571 1.980 2.215
Belgium +Netherlands 21.655 24.169 34.608 46.556 50.943
Spain 7.514 13.787 12.714 9.741 8.165
United States 3.188 3.711 4.906 4.209 3.401
France 43.496 66.641 69.593 74.239 61.992
United Kingdom 72.019 90.481 115.238 94.709 96.865
Italy 40.717 56.378 30.345 30.769 28.029
Portugal 60.277 65.693 67.790 58.070 60.161
Switzerland 2.054 6.008 3.767 4.134 5.260
Other countries 35.066 36.319 74.151 102.908 107.516 Source: INE

151
Table 145 - Guests per inhabitant, Proportion of foreign guests and Proportion of overnight stays in the main accommodation establishments (2010 - 2014)
Year Guests per inhabitant
Proportion of foreign guests in %
Proportion of overnight stays in hotels in %
2010 0,77 88,10 91,51
2011 0,95 89,76 92,15
2012 1,06 91,03 91,76
2013 1,08 90,75 91,52
2014 1,04 91,84 91,30
Source: INE Overnights showed a similar trend to the number of guests. In the period 2010-2014 it is observed an increase of 45.8% in overnight stays, and 91.3% occurred in hotels and the islands of Sal and Boavista accounted for 89.3% of the total in 2014.
Table 146 - Overnight stays in tourist accommodation establishments by country of habitual residence of the guest (2010 – 2014)
Country of habitual residence 2010 2011 2012 2013 2014
Total 2.342.282 2.827.562 3.334.275 3.436.111 3.414.832 Cabo Verde
Cabo-verdeanos 105.616 109.198 141.693 142.568 122.688 Foreigners 19.103 14.455 8.058 13.615 7.873
Foreign South Africa 663 14.540 851 3.796 1.653 Germany 370.359 426.532 495.341 528.136 511.329 Austria 5.397 13.208 9.282 10.877 13.172 Belgium + Netherlands 159.061 171.851 245.814 326.580 385.717 Spain 32.450 61.217 62.873 45.758 37.905 United States 10.162 12.988 12.286 12.837 9.605 France 241.527 293.334 300.622 317.955 285.160 United Kingdom 610.465 766.740 1.057.852 836.425 839.485 Italy 278.261 397.473 215.113 218.026 199.474 Portugal 299.228 335.688 318.099 323.956 316.365 Switzerland 9.604 41.936 18.060 29.943 28.319
Other countries 200.386 168.402 448.331 625.639 656.087 Source: INE
Table 147 - Overnight stays by type of accommodation establishments (2010-2014)
Type of establishment 2010 2011 2012 2013 2014
Total 2.342.282 2.827.562 3.334.275 3.436.111 3.414.832
Hotels 2.143.311 2.605.654 3.059.596 3.144.564 3.117.767
Guesthouses 49.246 58.965 70.764 93.240 68.899
Hostels 13.986 7.079 9.696 16.078 13.728
Apartment hotels 19.013 22.929 28.050 39.414 46.355
Holiday Villages 43.934 79.911 93.941 62.073 105.912
Residential 72.792 53.024 72.228 80.742 62.171
Source: INE

152
Table 148 - Overnight stays in tourist accommodation establishments per Island (2010 – 2014)
Island 2010 2011 2012 2013 2014
Total 2.342.282 2.827.562 3.334.275 3.436.111 3.414.832 S. Vicente 60.085 66.650 86.380 99.328 98.622 Sal 1.104.004 1.214.066 1.406.543 1.481.980 1.577.406 Boavista 1.000.271 1.334.108 1.579.412 1.553.125 1.470.899 Santiago 114.804 130.632 145.864 173.620 161.339 Restantes Ilhas 63.118 82.106 116.076 128.058 106.566
Source: INE
Table 149 - Annual guests and overnight stays variation rate (2010 – 2014)
Overnight Guests
2010 15,9 15,6
2011 20,7 24,5
2012 17,9 12,3
2013 3,1 3,4
2014
Total -0,6 -2,3
Hotels -0,9 -1,7
Guesthouses -26,1 -18,6
Hostels -14,6 -8,3
Apartment hotels 17,6 -2,8
Holiday villages 70,6 62,7
Residential -23,0 -19,0 Source: INE

153
From 2010 to 2014, there is an increase in stays, which increased from 5.7 to 6 nights, an increase of 5.3% in that period. UK tourists are those remaining more days in the country; on average in the year 2014, they have remained 8.6 nights.
Table 150 - Average stay of guests per country of habitual residence (2010 – 2014)
Country of habitual residence 2010 2011 2012 2013 2014
Total 5,7 5,7 6,0 5,9 6,0
Cabo Verde
Cabo-verdeans 2,6 2,5 2,7 2,8 2,6
Foreigners 2,8 3,2 3,3 5,4 3,6
Foreign
South Africa 3,0 5,1 2,9 2,7 3,9
Germany 6,4 6,9 7,2 6,5 7,1
Austria 5,2 7,2 5,6 5,2 5,7
Belgim + Netherlands 7,2 7,0 7,0 6,8 7,3
Spain 4,0 4,1 4,6 4,4 4,4
United States 3,0 3,3 2,4 2,9 2,7
France 5,4 4,2 4,1 4,0 4,2
United Kingdom 8,3 8,4 9,1 8,8 8,6
Italy 6,0 6,7 6,7 6,6 6,7
Portugal 4,7 4,9 4,4 5,2 5,0
Switzerland 4,3 6,8 4,5 6,4 5,0
Other countries 5,3 4,4 5,7 5,7 5,7
Source: INE
Table 151 - Average stay in hotel establishments by type of tourist accommodation establishment (2010 – 2014)
Type of establishment 2010 2011 2012 2013 2014
Total 5,7 5,7 6,0 5,9 6,0
Hotels 6,4 6,3 6,5 6,3 6,4
Guesthouses 2,9 2,4 2,5 3,1 2,9
Hostels 2,0 1,7 1,9 3,1 2,9
Apartment Hotels 3,9 3,8 3,4 4,1 4,8
Holiday Villages 3,2 4,7 5,1 5,4 6,5
Residential 2,5 2,2 2,5 3,0 2,8
Source: INE

154
There was an increase of 6% in the bed occupancy rate, in the period 2010 to 2014, but it has decreased in the last four years. In 2014 the rate was 53%, and in hotels has reached 62%. The highest values were found on the island of Boavista that in 2014 had a rate of 76%, the lowest rate recorded in the period under review, contrasting with the highest value (83%) observed in 2011. Table 152 - Bed occupancy rate by type of tourist accommodation establishment, (2010 – 2014)
Type of establishment 2010 2011 2012 2013 2014
Total 50 58 57 56 53
Hotels 60 69 66 65 62
Guesthouses 18 17 18 22 16
Hostels 23 14 20 28 23
Apartment hotels 12 17 23 28 24
Holiday Villages 19 33 23 23 28
Residential 20 19 21 23 18 Source: INE
Table 153 - Bed occupancy rate (%) per Island (2010-2014
Island 2010 2011 2012 2013 2014
Total 50 58 57 56 53
S. Vicente 18 19 23 25 24
Sal 50 61 57 58 56
Boa Vista 79 83 82 81 76
Santiago 23 25 26 25 23
Restantes Ilhas 18 21 18 … … Source: INE
Tourism Satellite Accounts
Tourism has given a major contribution to the economic growth of the country, as evidenced by the evolution of the tourism GDP that grew between 2011 and 2014, 17.9% higher than the value of total GDP growth (5.1%), to point out that tourism has a clear contribution to the national economy growth. The Tourism contribution to the country's GDP rose from 18.71% in 2011 to 20.97% in 2014, but in 2013 the contribution was 21.91%, definately showing that it is an important sector for the country. It may also be mentioned the fact that tourism has contributed about 20.1% for the total of jobs in the country in 2013.

155
Table 154 - Tourist sector's contribution to GDP - Thousand CVE (2011 – 2014)
2011 2012E 2013E 2014E
Tourism GDP (nominal) 27.671.470 31.859.208 33.439.112 32.619.642
Total GDP (Nominal) 147.924.171 150.351.281 152.639.960 155.521.655
% (Tourism GDP/Total GDP) 18,71% 21,19% 21,91% 20,97%
Volume Index (Tourism GDP) 100,00 112,33 103,41 97,74
Volume índex (total GDP) 100,00 101,08 101,05 102,74 Interannual variation (Ind. Vol. Tourism GDP)
12,33% -7,94% -5,48%
Interannual variation (Ind. Vol. Total GDP) 1,08% -0,04% 1,68%
Interannual variation (Tourism GDP) 15,13% 4,96% -2,45%
Interannual variation (Total GDP) 1,64% 1,52% 1,89%
Tourism Job positions 34.246 36.781 37.240 ND
Total job positions 178.577 187.904 185.366 ND
% (Touristic jobs/Total job positions) 19,18% 19,57% 20,09% ND
(E) Estimates. Source: INE
Table 155 – National tourism consumption per products and components - Thousand CVE (2011)
Year 2011
Total national tourism
consumption (1+2+3+4)
Inbound tourist
consumption (1)
Tourist consumption Households
(2)
Intermediate Tourist
consumption (Business
Tourism) (3)
Public Administration spending on
tourism consumption
(4)
Typical products 32.751.475 21.388.218 6.800.822 4.464.366 98.069
Accommodation services 10.910.896 8.275.359 1.934.190 701.347 0
Hotels and related 9.178.392 7.993.309 483.736 701.347 0
Real estate rental services 1.732.504 282.050 1.450.454 0 0
Restaurants and related 7.337.569 5.544.823 1.315.675 477.071 0
Passengers transport 11.541.140 5.937.850 2.956.499 2.646.791 0
Overland passenger transport 1.710.126 570.951 799.643 339.533 0
Maritime passenger transport 246.557 86.221 124.772 35.564 0
Air passenger transport 9.584.457 5.280.679 2.032.085 2.271.693 0
Travel agencies services 1.117.591 485.190 346.722 285.680 0
Supporting transport services 1.108.927 786.532 13.986 308.409 0
Rent a Car 435.079 265.716 124.293 45.069 0
Cultural, recreational and sports services
202.205 92.747 109.458 0 0
Public Administration Tourism services
98.069 0 0 0 98.069
Non typical products 12.107.282 6.928.796 5.115.447 63.039 0
Goods 8.356.203 4.827.042 3.529.161 0 0
Goods distribution margins 2.187.842 1.425.900 761.943 0 0
Other services 1.563.237 675.855 824.344 63.039 0
Total production (basic prices) 44.858.758 28.317.014 11.916.269 4.527.405 98.069
Source: INE

156
Table 156 - Production account of tourism branches - Thousand CVE (2011)
Year 2011
Production (basic prices)
(1)
Intermediate consumption
(buying prices 2)
Gros Added Value (basic prices) (3=1-
2)
Hotels and related 13.797.225 8.953.311 4.843.914
Real estate activities 15.750.032 3.640.449 12.109.583
Restaurants and related 4.488.978 3.436.610 1.052.368
Overland passenger transport 8.550.631 4.025.035 4.525.596
Maritime passenger transport 273.952 194.690 79.262
Air transport 8.594.194 8.081.732 512.462
Travel agencies 898.678 665.673 233.005
Supporting transport services 8.469.983 2.028.687 6.441.296
Rent a Car 435.079 263.084 171.995
Cultural, recreational and sports services 433.207 213.914 219.293
Total typical sector activities 61.691.958 31.503.184 30.188.774
Total non typical sector activities 196.014.266 98.678.059 97.336.207
Total 257.706.224 130.181.243 127.524.981
Source: INE

157
Table 157 - Detail of production and intermediate consumption of branches of activity by type of products and inputs (thousand CVE) (2011)
Year 2011
Hotels and related
Real estate rental services
Restaurants and related
Overland passengers
transport
Maritime passengers
transport Air transport
Travel agencies
Typical products 13.716.509 15.750.032 4.034.537 8.550.631 273.952 8.594.194 898.678
Accommodation services 9.107.460 15.750.032 0 0 0 0 0
Hotels and related 9.107.460 0 0 0 0 0 0 Real estate rental services 0 15.750.032 0 0 0 0 0
Restaurants and related 4.609.049 0 4.034.537 0 0 0 0
Passengers transports 0 0 8.550.631 273.952 8.594.194 0
Overland passengers transport 0 0 0 8.550.631 0 0 0
Maritime passengers transport 0 0 0 0 273.952 0 0
Air passengers transport 0 0 0 0 0 8.594.194 0
Travel agencies services 0 0 0 0 0 0 898.678
Supporting transport services 0 0 0 0 0 0 0 Rent a car 0 0 0 0 0 0 0
Cultural, recreational and sports services 0 0 0 0 0 0 0
Public Administration Tourism services 0 0 0 0 0 0 0 Non typical products 80.716 0 454.441 0 0 0 0 Goods 0 0 0 0 0 0 0
Goods distribution margins 80.716 0 454.441 0 0 0 0
Other services 0 0 0 0 0 0 0
Total national production (basic prices) 13.797.225 15.750.032 4.488.978 8.550.631 273.952 8.594.194 898.678
Agricultural and fishing products 1.287.832 0 549.691 0 0 0 0
Mining and manufacturing products 4.198.335 829.452 1.891.063 3.726.553 121.621 3.532.071 105.544
Eletricity and water 1.178.086 34.392 375.398 6.877 4.283 33.340 10.455
Construction 129.928 358.020 23.820 0 0 21.518 5.207
Trade repair 7.863 1.026 2.424 151.708 2.548 366 925
Transport telecommunications 1.249.051 883.789 179.271 64.022 20.927 2.041.848 326.863
Hotels and restaurants 80.366 195.704 41.873 5.045 1.693 361.124 24.453
Real estate services 76.286 50.082 127.381 2.413 5.058 34.384 142.179
Other services 745.564 1.287.982 245.688 68.418 38.560 2.057.081 50.046
Net taxes on products
Total intermediate consumption (buying prices) 8.953.311 3.640.449 3.436.610 4.025.035 194.690 8.081.732 665.673
Total Gross Added Value (basic prices) 4.843.914 12.109.583 1.052.368 4.525.596 79.262 512.462 233.005
Source: INE
Continuação

158
Table 157 - Detail of production and intermediate consumption of branches of activity by type of products and inputs (thousand CVE) (2011))
Year 2011
Supporting transport services
Rent a car Cultural, recreational and sports activities
Total typical activity sectors
Total non typical activity sectors
Total Production
Typical products 8.469.518 435.079 400.581 61.123.711 757.219 61.880.929
Accommodation services 0 0 0 24.857.492 250.053 25.107.545
Hotels and related 0 0 0 9.107.460 16.159 9.123.620 Real estate rental services 0 0 0 15.750.032 233.893 15.983.925
Restaurants and related 0 0 0 8.643.585 21.338 8.664.924
Passengers transport 0 0 0 17.418.777 13.896 17.432.673
Overland passengers transport 0 0 0 8.550.631 13.896 8.564.527
Maritime passengers transport 0 0 0 273.952 273.952
Air passengers transport 0 0 0 8.594.194 8.594.194
Travel agencies services 0 0 0 898.678 65.466 964.144
Supporting transport services 8.469.518 0 0 8.469.518 130.402 8.599.920
Rent a car 0 435.079 0 435.079 131.958 567.037
Cultural, recreational and sports services 0 0 400.581 400.581 46.036 446.617
Public Administration Tourism services 0 0 0 0 98.069 98.069 Non typical products 465 0 32.626 568.248 194.435.191 195.003.439
Goods 0 0 0 46.196.694 46.196.694
Goods distribution margins 465 0 31.465 567.087 31.731.536 32.298.623
Other services 0 0 1.161 1.161 116.506.962 116.508.123
Total national production (basic prices) 8.469.983 435.079 433.207 61.691.958 195.192.410 257.706.224
Agricultural and fishing products 0 0 0 1.837.523 3.824.426 5.661.949
Mining and manufacturing products 573.125 115.902 41.371 15.135.038 42.141.561 57.276.599
Electricity and water 407.207 7.792 11.406 2.069.236 3.977.487 6.046.723
Construction 0 8.401 950 547.844 9.861.168 10.409.012
Trade repair 6.548 1.092 426 174.927 249.392 424.319
Transport telecommunications 552.060 90.491 20.773 5.429.095 17.406.568 22.835.663
Hotels and restaurants 54.282 7.286 12.520 784.345 2.051.850 2.836.195
Real Estate services 22.842 12.794 64.501 537.920 4.445.141 4.983.060
Other services 412.622 19.327 61.968 4.987.257 14.720.466 19.707.722
Net taxes on products 0 0
Total intermediate consumption (buying prices) 2.028.687 263.084 213.914 31.503.184 98.678.059 130.181.243
Total Gross Added Value (basic prices) 6.441.296 171.995 219.293 30.188.774 96.514.351 127.524.981
Source: INE
Conclusion

159
Table 158 - Employment by activity sectors (2011)
Year 2011
Total Personnel
employed
Remunerated Personnel employed
Non Remunerated
Personnel employed
Hotels and related 4.527 4.453 73
Real estate rental services 963 769 194
Restaurants and related 3.985 1.968 2.017
Overland passengers transport 4.787 3.829 957
Maritime passengers transport 230 230
Air transport 962 962
Travel agencies 595 583 12
Supporting transport services 2.035 2.029 6
Rent a Car 291 291
Cultural, recreational and sports activities
1.195 355 840
Total branches of typical activities 19.569 15.470 4.099
Total branches of non typical activities 158.529 132.931 25.599
Total 178.099 148.401 29.698
Source: INE
Table 159 - The contribution of tourism in the economy: direct and total effects on GDP and its components (2011)
Direct effects:
(Thousand CVE)
Direct effects:
(%)
Total effects:
(Thousand CVE)
Total effects:
(%)
Gross Domestic Product at market prices for Demand
27.671.470 18,7 27.671.470 18,7
Spending on final Consumption by Residents in the Economic territory
12.392.920 13,4 12.392.920 13,4
Spending on final consumption of Public Administrations and non-profit institutions
98.069 0,4 98.069 0,4
Gross capital formation 6.143.007 8,7 6.143.007 8,7
Exports of goods and services 29.732.865 63,9 29.732.865 63,9
Imports of goods and services 20.695.392 27,0 20.695.392 27,0
Gross Domestic Product at market prices for Supply
16.702.641 11,3 27.671.470 18,7
Gross Added Value at basic prices 12.306.508 9,7 20.698.494 16,2
Taxes (net) on Products 4.396.133 21,6 6.972.976 34,2
Production 36.823.605 14,3 53.553.048 20,8
Employment (jobs) 19.569 11,9 34.246 19,2
Source: INE

160
Table 160 - Tourism share in all the products produced by the typical tourism activity sectors in thousand CVE (2011)
Year 2011
Hotels and related Real estate rental
services Restaurants and
related Overland passenger
transport
Maritime passenger transport
Total Tourism
share Total
Tourism share
Total Tourism share
Total Tourism share
Total Tourism share
Typical products 13.716.509 13.486.057 15.750.032 1.732.504 4.034.537 2.824.176 8.550.631 1.710.126 273.952 246.557
Accommodation services 9.107.460 9.107.460 15.750.032 1.732.504 0 0 0 0 0 0
Hotels and related 9.107.460 9.107.460 0 0 0 0 0 0 0
Real estate rental services 0 0 15.750.032 1.732.504 0 0 0 0 0 0
Restaurants and related 4.609.049 4.378.596 0 0 4.034.537 2.824.176 0 0 0 0
Passengers transport 0 0 0 0 0 0 8.550.631 1.710.126 273.952 246.557
Overland transport of passengers 0 0 0 0 0 0 8.550.631 1.710.126 0 0
Maritime passenger transport 0 0 0 0 0 0 0 0 273.952 246.557
Air passenger transport 0 0 0 0 0 0 0 0 0 0
Travel agency services 0 0 0 0 0 0 0 0 0 0
Supporting transport services 0 0 0 0 0 0 0 0 0 0
Rent a Car 0 0 0 0 0 0 0 0 0 0
Cultural, recreational and sporting services 0 0 0 0 0 0 0 0 0 0
Public Administrations Tourist market services 0 0 0 0 0 0 0 0 0 0
Non typical products 80.716 80.716 0 0 454.441 350.178 0 0 0 0
Goods 0 0 0 0 0 0 0 0 0 0
Goods distribution margins 80.716 80.716 0 0 454.441 350.178 0 0 0 0
Other services 0 0 0 0 0 0 0 0 0 0
Total national production (basic prices) 13.797.225 13.566.772 15.750.032 1.732.504 4.488.978 3.174.354 8.550.631 1.710.126 273.952 246.557
Source: INE
Continuation

161
Table 160 - Share of tourism in all the products produced by the typical tourism activity sectors in thousand CVE (2011)
Year 2011
Air Transport Travel agencies Supporting transport Rent a car Cultural,
recreational and sports activities
Total Tourism share
Total Tourism share
Total Tourism share
Total Tourism share
Total Tourism share
Typical products 8.594.194 8.594.194 898.678 898.678 8.469.518 1.016.342 435.079 435.079 400.581 200.291
Accommodation services 0 0 0 0 0 0 0 0 0 0
Hotels and related 0 0 0 0 0 0 0 0 0 0
Real estate rental services 0 0 0 0 0 0 0 0 0 0
Restaurants and related 0 0 0 0 0 0 0 0 0 0
Passengers transport 8.594.194 8.594.194 0 0 0 0 0 0 0 0
Overland transport of passengers 0 0 0 0 0 0 0 0 0 0
Maritime passenger transport 0 0 0 0 0 0 0 0 0 0
Air passenger transport 8.594.194 8.594.194 0 0 0 0 0 0 0 0
Travel agency services 0 0 898.678 898.678 0 0 0 0 0 0
Supporting transport services 0 0 8.469.518 1.016.342 0 0 0 0
Rent a Car 0 0 0 0 0 0 435.079 435.079 0 0
Cultural, recreational and sporting services 0 0 0 0 0 0 0 0 400.581 200.291
Public Administrations Tourist market services 0 0 0 0 0 0 0 0 0 0
Non typical products 0 0 0 0 465 0 0 0 32.626 0
Goods 0 0 0 0 0 0 0 0 0 0
Goods distribution margins 0 0 0 0 465 0 0 0 31.465 0
Other services 0 0 0 0 0 0 0 0 1.161 0
Total national production (basic prices) 8.594.194 8.594.194 898.678 898.678 8.469.983 1.016.342 435.079 435.079 433.207 200.291
Source: INE
Continuation

162
Table 160 - Part of tourism in all the products produced by the tourism industry in thousands CVE (2011)
Year 2011
Total tourism activity sectors
Non tourism activity sectors
Total National tourism
consumption National
origin
National tourism
consumption Rest of the world origin
National tourism consumption
National total Total
Tourism share
Total Tourism share
Total Tourism
share
Typical products 61.123.711 31.144.002 757.219 190.803 61.880.929 31.334.804 31.334.804 1.416.671 32.751.475
Accommodation services 24.857.492 10.839.964 250.053 15.583 25.107.545 10.855.546 10.855.546 55.349 10.910.896
Hotels and related 9.107.460 9.107.460 16.159 15.583 9.123.620 9.123.043 9.123.043 55.349 9.178.392
Real estate rental services 15.750.032 1.732.504 233.893 0 15.983.925 1.732.504 1.732.504 0 1.732.504
Restaurants and related 8.643.585 7.202.772 21.338 0 8.664.924 7.202.772 7.202.772 134.797 7.337.569
Passengers transport 17.418.777 10.550.877 13.896 0 17.432.673 10.550.877 10.550.877 990.263 11.541.140
Overland transport of passengers 8.550.631 1.710.126 13.896 0 8.564.527 1.710.126 1.710.126 0 1.710.126
Maritime passenger transport 273.952 246.557 0 0 273.952 246.557 246.557 246.557
Air passenger transport 8.594.194 8.594.194 0 0 8.594.194 8.594.194 8.594.194 990.263 9.584.457
Travel agency services 898.678 898.678 65.466 65.466 964.144 964.144 964.144 153.448 1.117.591
Supporting transport services 8.469.518 1.016.342 130.402 11.685 8.599.920 1.028.027 1.028.027 80.900 1.108.927
Rent a Car 435.079 435.079 131.958 0 567.037 435.079 435.079 0 435.079
Cultural, recreational and sporting services
400.581 200.291 46.036 0 446.617 200.291 200.291 1.914 202.205
Public Administrations Tourist market services
0 0 98.069 98.069 98.069 98.069 98.069 0 98.069
Non typical products 568.248 430.894 194.435.191 5.057.907 195.003.43
9 5.488.801 5.488.801 6.618.481 12.107.282
Goods 0 0 46.196.694 1.737.721 46.196.694 1.737.721 1.737.721 6.618.481 8.356.203
Goods distribution margins 567.087 430.894 31.731.536 1.756.948 32.865.710 2.187.842 2.187.842 0 2.187.842
Other services 1.161 0 116.506.962 1.563.237 116.509.28
4 1.563.237 1.563.237 0 1.563.237
Total national production (basic prices)
61.691.958 31.574.896 195.192.410 5.248.710 256.884.36
8 36.823.605 36.823.605 8.035.152 44.858.758
Source: INE
Conclusion

163

164
Transports
Land transport
In Cabo Verde the number of vehicles has increased, but the occurrence of accidents has decreased. From 2010 to 2012 it is observed a decrease of about 5.7% of occurrences of accidents, the number of deaths also decreased by about 20.6%, while the number of injured has increased by 27.7% in the same period.
Table 161 - Number of road accidents per municipality (2010 – 2012)
2010 2011 2012
Cabo Verde 3.940 3.911 3.715
Ribeira Grande 56 47 44
Paul 22 7 17
Porto Novo 52 46 40
S. Vicente 459 453 484
Ribeira Brava 31 23 33
Tarrafal de S. Nicolau 12 12 7
Sal 182 153 173
Boa Vista 32 54 49
Maio 18 18 16
Tarrafal 32 36 31
Santa Catarina 163 169 151
Santa Cruz 85 124 122
Praia 2.486 2.407 2.197
S. Domingos 94 83 88
S. Miguel 40 37 25
S. Salvador do Mundo 25 33 34
S. Lourenço dos Órgãos 22 38 32
Ribeira Grande Santiago 11 15 17
Mosteiros 25 16 27
S. Filipe 78 120 93
Santa Catarina do Fogo 8 13 24
Brava 7 7 11 Source: Ministry of Administration and National (MAI)

165
Table 162 - Number of deaths in road accidents (2010 -2012)
2010 2011 2012
Cabo Verde 63 48 50
Ribeira Grande 3 3 1
Paul 1 0 0
Porto Novo 2 1 0
S. Vicente 6 10 7
Ribeira Brava 0 2 2
Tarrafal de S. Nicolau 0 0 2
Sal 4 0 2
Boa Vista 5 0 3
Maio 0 1 0
Tarrafal 4 1 6
Santa Catarina 4 7 3
Santa Cruz 2 0 1
Praia 16 13 10
S. Domingos 3 0 2
S. Miguel 4 1 1
S. Salvador do Mundo 0 1 1
S. Lourenço dos Órgãos 1 2 2
Ribeira Grande Santiago 2 1 1
Mosteiros 0 0 0
S. Filipe 5 4 3
Santa Catarina do Fogo 1 1 3
Brava 0 0 0 Source: Ministry of Administration and National (MAI)

166
Table 163 - Number of injured in road accidents per municipality (2010 – 2012)
2010 2011 2012
Cabo Verde 811 890 1036
Ribeira Grande 36 40 28
Paul 17 9 21
Porto Novo 34 44 23
S. Vicente 106 139 191
Ribeira Brava 19 9 24
Tarrafal de S. Nicolau 6 6 8
Sal 55 29 27
Boa Vista 8 41 13
Maio 7 14 11
Tarrafal 9 6 57
Santa Catarina 57 70 47
Santa Cruz 55 57 66
Praia 225 193 251
S. Domingos 70 21 73
S. Miguel 16 37 32
S. Salvador do Mundo 0 21 15
S. Lourenço dos Órgãos 10 37 32
Ribeira Grande Santiago 18 12 31
S. Filipe 43 63 55
Santa Catarina do Fogo 5 22 13
Mosteiros 14 18 17
Brava 1 2 1 Source: Ministry of Administration and National (MAI)

167
Maritime transport
From 2010 to 2014 the movement of passengers in national ports increased by 23% both in landing and boarding. Table 164 - Passenger movement in national ports (2010 – 2014)
Passengers 2010 2011 2012 2013 2014
Disembarking 324.847 411.277 386.882 380.650 399.864
Embarking 322.532 406.331 386.987 379.617 397.823
Total 647.379 817.608 773.869 760.267 797.687 Source: ENAPOR
Regarding the movement of goods, it is noted that in 2014, most of the goods moved in ports is associated with landing (79.9%), consistent with the value structure of the national economy, heavily dependent on imported goods. Overall, the goods movement had a slight increase of 4.2% from 2010 to 2014, however, most notably the embarkation movement which increased 30.7% while disembarking decreased by 0.8% in the same period. Table 165 - Cargo / goods movement in national ports (2010-2014)
Movement 2010 2011 2012 2013 2014
Loading 250.284 330.263 328.592 321.539 327.239
Unloading 1.311.041 1.417.507 1.251.177 1.210.732 1.300.334
Total 1.561.325 1.747.770 1.579.769 1.532.271 1.627.573
Source: ENAPOR

168
Air transport
The movement of passengers in airports has increased by 5.7% from 2010 to 2014, however, in this same period, the movement of passengers on domestic flights increased by about 30.1% and international flights showed a decrease of 17.8%. Similar situation can be seen in relation to aircraft movement in the same period. It may be noted an overall increase of about 15.7%, with a decrease of 34.4% in domestic flights and 87% on international flights. Considering cargo and mail movement, it is noticed a decrease of 9.2% and 3.4%, respectively, from 2011 to 2014. Table 166 - Passenger movement by type of traffic according to airports (2010-2014)
Airports Type 2010 2011 2012 2013 2014
AIAC-Sal
Domestic 216.690 212.824 198.228 164.091 163.633
International 388.924 457.037 401.413 448.026 461.117
Total 605.614 669.861 599.641 612.117 624.750
AIDP-Praia
Domestic 285.324 299.060 276.927 244.153 254.074
International 221.481 231.655 220.122 225.320 227.319
Total 506.805 530.715 497.149 469.473 481.393
AIAP-Boa Vista
Domestic 71.369 83.546 69.015 52.339 53.231
International 214.363 297.194 356.686 357.568 345.479
Total 285.732 380.740 425.701 409.907 398.710
AICE-S. Vicente
Domestic 179.137 173.572 168.394 151.721 155.069
International 11.385 23.294 41.701 52.316 53.771
Total 190.522 196.866 210.095 204.037 208.840
AD S. Filipe Domestic 69.159 71.051 74.408 58.094 51.724
AD S. Nicolau Domestic 25.934 26.659 26.436 23.088 21.814
AD Maio Domestic 16.936 19.209 16.125 9.986 10.769
Total
Domestic 864.549 885.921 829.533 703.472 710.314
International 836.153 1.009.921 1.019.922 1.083.230 1.087.686
Total 1.700.702 1.895.101 1.849.455 1.786.702 1.798.000
Note: Does not include transit passengers Source: ASA

169
Table 167 - Aircraft movements by type of traffic according to airports (2010-2014)
Airports Type 2010 2011 2012 2013 2014
AIAC-Sal
Domestic 5.931 6.216 5.944 3.892 3.808
International 5.153 5.595 6.015 6.219 6.247
Total 11.084 11.811 11.959 10.111 10.055
AIDP-Praia
Domestic 7.636 8.112 7.195 5.196 5.049
International 2.792 2.906 308 3.139 298
Total 10.428 11.018 10.275 8.335 8.029
AIAP-Boa Vista
Domestic 2.264 2.995 2.568 1.508 1.507
International 1674 2177 2724 2874 2839
Total 3.938 5.172 5.292 4.382 4.346
AICE-S. Vicente
Domestic 4.465 4.295 3.802 2.859 2.966
International 129 271 449 552 564
Total 4.594 4.566 4.251 3.411 353
AD S. Filipe Domestic 2.235 2.354 2.247 1.643 1367
AD S. Nicolau Domestic 630 789 819 578 538
AD Maio Domestic 506 768 464 269 298
Total
Domestic 23.667 25.529 23.039 15.945 15.533
International 9.748 10.949 12.268 12.784 1.263
Total 33.415 36.478 35.307 28.729 28.163
Source: ASA Table 168 - Cargo movement (in kg) per airports (2010 -2014)
Airports Type 2010 2011 2012 2013 2014
AIAC-Sal
Domestic 716.931 71.519 634.791 592.006 599.353
International 4.799 477.133 287.932 270.011 456.782
Total 1.196.831 1.188.652 922.723 862.017 1.056.135
AIDP-Praia
Domestic 755.915 801.969 679.894 68.892 709.573
International 792.072 828.389 741.412 620.768 655.965
Total 1.547.987 1.630.358 1.421.306 1.309.688 1.365.538
AIAP-Boa Vista
Domestic 234.943 264.001 183.102 149.668 200.212
International 48716 190097 62105 101215 56334
Total 283.659 454.098 245.207 250.883 256.546
AICE-S. Vicente
Domestic 41.613 363.269 299.784 285.272 313.292
International 8318 198348 206.658 274.078 242.925
Total 49.931 561.617 506.442 55.935 556.217
AD S. Filipe Domestic 75.736 107.649 67.143 51.974 45622
AD S. Nicolau Domestic 39.165 41.588 3.519 27.594 27.987
AD Maio Domestic 17.862 17.682 19.077 11.396 15.313
Total
Domestic 2.256.682 2.307.677 1.918.981 1.806.830 1.911.352
International 1.403.868 1.693.967 1.298.107 1.266.072 1.412.006
Total 3.660.550 4.001.644 3.217.088 3.072.902 3.323.358
Source: ASA

170
Table 169 - Postal Movement (in kg) per airports (2010 – 2014)
Airports Type 2010 2011 2012 2013 2014
AIAC-Sal
Domestic 61.082 58.601 41.736 3.737 60.321
International 47.797 46.589 28.657 29.242 57.522
Total 108.879 10.519 70.393 66.612 117.843
AIDP-Praia
Domestic 64.373 55.553 50.728 65.384 81.276
International 85.551 84.491 75.401 80.264 58.896
Total 149.924 140.044 126.129 145.648 140.172
AIAP-Boa Vista
Domestic 7.526 5.875 6.603 6.432 7.572
International 15 232 0 81 51
Total 7.541 6.107 6.603 6.513 7.623
AICE-S. Vicente
Domestic 62.827 55.884 36.855 33.719 36.718
International 942 496 14.147 19.936 19.936
Total 63.769 60.844 51.002 53.655 56.654
AD S. Filipe Domestic 8.026 5.452 5.247 5.277 475
AD S. Nicolau Domestic 5.831 5.855 5.095 5.346 5.302
AD Maio Domestic 3.008 3.159 3.027 3.174 2.996
Total
Domestic 212.673 190.379 149.291 156.702 198.935
International 134.305 136.272 118.205 129.523 136.405
Total 346.978 326.651 267.496 286.225 335.340
Source: ASA
Table 170 - Air accidents and victims
Date Place of accident Crew Passengers Occupants
Victims
Month Ano Injured Casualties
August 1999 Santo Antão 2 16 18 0 18
September 1998 Praia (Santiago) 3 19 22 4 1
November 1959 S. Filipe (Fogo) - - - - 0
http://aviation-safety.net

171
Access indicators and use of Information and Communication Technologies
(ICT)
Families and access to ICTs
The table on the proportion of households with access to fixed telephone service and mobile telephone service indicate that in 2014, 31% of households had access to lanlines and 65% said that there was at least one mobile phone in the household. These numbers also indicate that there was a decrease, compared with the 2012 values in which 40.6% of households had landline and 88.6% had at least one mobile phone at home. The data also indicate the existence of disparities in relation to urban and rural areas, that is, while in urban areas in 2014, 32.7% of households had landline and 71.9% had mobile phone in rural areas only 27.5% of households had access to lanlines and 52% had mobile phone.
Table 171 - Proportion of households with access to fixed telephone service and mobile telephone service, by residence and municipality (2012-2014)
2012 2013 2014
Landline At least
one mobile phone
Landline
At least one
mobile phone
Landline
At least one
mobile phone
Cabo Verde 40,6 88,6 35,6 86,5 31,0 65,1
Area
Urban 40,8 93,2 36,9 90,9 32,7 71,9
Rural 40,2 79,6 32,9 77,0 27,5 52,0
Municipalities
Ribeira Grande 65,3 75,6 45,5 67,1 50,1 46,1
Paul 46,9 81,9 38,7 83,8 38,1 56,7
Porto Novo 37,7 77,4 33,9 80,0 31,3 57,3
S. Vicente 46,1 92,4 45,6 87,4 40,8 68,9
Ribeira Brava 71,3 83,4 61,8 80,5 61,4 61,7
Tarrafal de S. Nicolau 62,8 79,9 52,7 82,2 49 62,5
Sal 34,7 97,2 30,7 93,9 28,9 80,7
Boavista 24,2 93,2 26,7 90,6 22 84,1
Maio 43,7 85,5 39,4 84,1 33,6 61,5
Tarrafal 30,9 78,9 22,7 76,3 16,9 57
Santa Catarina 40,4 83,7 33,1 83,0 27,1 60,2
Santa Cruz 20,4 85,2 17,9 78,2 16,3 53,3
Praia 40,3 94,5 34,2 93,5 29,4 73,8
S. Domingos 33,7 88,2 23,6 89,6 13,5 54,7
S. Miguel 28,1 85,5 24,1 83,2 16,4 55,0
S. Salvador do Mundo 35,6 87,5 28,0 86,8 19,3 57,7
S. Lourenço dos Órgãos 42,1 84,2 33,5 85,6 15,5 61,3
Ribeira Grande de Santiago 40,1 76,0 30,1 75,8 30,1 48,1
Mosteiros 50,5 79,1 51,2 81,6 45,6 49,1
S. Filipe 35,8 87,1 36,8 87,2 28,0 53,4
Santa Catarina do Fogo 40,7 71,0 44,4 71,4 35,8 45,2
Brava 63,7 83,8 50,5 67,1 46,9 59,5
Source: INE

172
Access to the media, is one of the requirements to improve the quality of life of the population. Considering the tables on the proportion of households according to access / ownership of TV, cable TV, Computer, Tablet / Ipad and Internet access it can be seen that in 2014, 77.4% of households had TV, 9.4 % had cable TV, 31.9% had a computer, 11.2% had a tablet / Ipad and about 32.2 had internet access. The tables show that there are disparities between rural and urban areas, however, in terms of municipalities, the disparities are most evident, with large differences in terms of access to the media. Table 172 - Proportion of households according to access / ownership of TV, cable TV, Computer, Tablet/ Ipad and Internet access per Residence and Municipality (2012-2014)
Television Cable TV Computor
Tablet / Ipad
Acess to internet
2012 81,8 7,3 29,3 - 20,3
2013 80,3 7,4 30,2 - 22,8
2014
Cabo Verde 77,4 9,4 31,9 11,2 32,2
Area
Urban 83,3 12,2 40,7 14,6 40,2
Rural 64,9 3,4 13,1 3,8 15,1
Municipality
Ribeira Grande 70,6 2,5 10,6 1,4 6,8
Paul 74,6 3,4 17,8 2,8 11,6
Porto Novo 74,2 2,0 21,3 4,3 20,0
S. Vicente 80,7 11,7 37,8 9,3 33,8
Ribeira Brava 75,9 10,5 22,4 6,0 18,8
Tarrafal de S. Nicolau 78,8 7,2 32,7 8,5 37,6
Sal 84,5 7,2 38,9 16,8 45,1
Boa Vista 81,2 9,6 37,1 13,9 46,1
Maio 78,8 0,9 13,1 3,4 11,8
Tarrafal 51,5 7,8 17,7 6,6 15,8
Santa Catarina 64,1 5,8 22,6 5,8 34,2
Santa Cruz 73,1 1,9 12,5 1,7 8,9
Praia 86,5 15,9 46,4 20,3 45,1
S. Domingos 69,1 1,6 18,2 6,9 17,4
S. Miguel 62,7 3,6 20,8 5,2 25,2
S. Salvador do Mundo 75,6 2,9 17,5 6,3 30,5
S. Lourenço dos Órgãos 74,4 5,2 20,7 5,5 16,4
Ribeira Grande de Santiago 74,1 4,5 20,2 6,8 15,8
Mosteiros 76,5 8,8 27,1 9,1 30,3
S. Filipe 67,5 4,8 23,7 8,8 25,3
Santa Catarina do Fogo 60,6 7,4 19,5 5,7 13,1
Brava 88,4 22,5 26,2 9,5 24,0
Source: INE

173
In 2014, the proportion of the population aged 10 years or more who has used a computer (laptop, desktop, Ipad or tablet) in the last three months was 36.8% overall; however, in urban areas, the percentage rises to 46% and in rural areas drops to only 19%. In the municipality of Ribeira Grande the percentage is the lowest, where only 16.5% of the population aged 10 years or more has used computer in the last three months, contrasting with the Sal Island, where the percentage amounted to 54.4%. The results was always practically equal in terms of the proportion of the population aged 10 years and over who has used the Internet in the last 3 months. Noteworthy that in 2014, about 37.1% has used internet and the discrepancy occurs both in rural and urban areas as well as for the different municipalities. Only 13.2% of the population of Ribeira Grande had access to the internet while in Sal 58.4% of the population had access to internet in the last three months.
Population and use of ICTs
Table 173 - Proportion of the population aged 10 years or more who has used a computer (laptop, desktop, Ipad or tablet) or who has used Internet in the last three months (2014)
Computer use Internet use
Total Male Female Total Male Female
Cabo Verde 36,8 37,5 36,2 37,1 37,6 36,7
Area
Urban 46,0 46,0 45,9 46,2 46,0 46,4
Rural 19,0 20,8 17,3 19,4 21,2 17,7
Municipality
Ribeira Grande 16,5 15,7 17,4 13,2 12,5 14,0
Paul 29,9 30,2 29,5 24,7 24,2 25,4
Porto Novo 26,8 27,5 26,1 26,2 26,5 25,9
S. Vicente 41,2 38,7 43,8 41,2 39,0 43,6
Ribeira Brava 26,8 27,0 26,6 31,2 31,7 30,6
Tarrafal de S. Nicolau 30,2 27,8 32,8 30,6 28,8 32,6
Sal 54,4 54,2 54,6 58,4 57,1 59,8
Boa Vista 36,8 36,8 36,8 42,8 43,0 42,5
Maio 23,9 24,7 23,2 26,0 27,7 24,3
Tarrafal 27,8 29,7 26,2 25,4 27,1 24,0
Santa Catarina 32,2 35,8 29,0 33,6 37,1 30,4
Santa Cruz 18,7 20,5 17,1 18,3 20,2 16,6
Praia 50,2 51,1 49,4 50,0 49,9 50,0
S. Domingos 20,5 21,3 19,8 18,5 18,8 18,2
S. Miguel 28,1 32,2 25,1 27,6 32,7 23,7
S. Salvador do Mundo 22,5 23,5 21,6 24,4 26,3 22,7
S. Lourenço dos Órgãos 27,3 29,3 25,4 27,1 28,2 26,0
Ribeira Grande de Santiago 19,0 21,6 16,6 19,0 22,1 16,1
Mosteiros 26,9 30,4 23,5 26,5 29,5 23,7
S. Filipe 20,6 22,2 19,0 22,6 25,0 20,4
Santa Catarina do Fogo 19,7 21,7 17,8 19,5 21,0 17,9
Brava 29,7 34,1 25,6 30,4 34,3 26,8
Source: INE

174

175
Concepts Turnover proceeds from the sale of goods and services, without deduction of discounts
Microbusiness business unit employing up to 5 workers and or having a monthly gross turnover not exceeding five million escudos.
Small business Business unit that employs from six to ten employees and or having a volume of gross annual turnover exceeding five million escudos and less than ten million escudos. Hotel establishments are intended to provide accommodation for remuneration, with or without meals and other services. Hotel establishments of interest to tourism are classified, in regulatory terms, in the following groups and categories:
Group 1: five, four, three and two-star hotels;
Group 2: four, three, two and one star guesthouses;
Group 3: four and three-star B & B;
Group 4: four, three and two-star Hotels – apartaments;
Group 5: Luxury Holiday Village, 1st and 2nd.
Hotels
For an establishment to be classified as a hotel it should occupy an entire building or a part of it, completely independent, making its facilities a homogeneous whole and have access to the floors for the exclusive use of customers. To be classified as a hotel, the establishment must have at least twenty rooms.
Guesthouses Guesthouses are establishments, that due to facilities, equipment, general appearance, location and capacity, do not meet the standards set for classification as a hotel and comply with the requirements of the provisions laid down by the regulations on the industry and the like. For an establishment to be classified as a guesthouse, it should occupy the whole of a building or building unit and have at least ten rooms. Residential establishments
Hotels and guesthouses that only offer hotel service and breakfast will be classified as residential. Hostels
Hostels are located hotel establishments outside urban centers, the building itself, offering good comfort and convenience conditions, designed to provide tourists hotel service and, if necessary, food.

176
Apartments - Hotels
Apartments – Hotels are establishments consisting of a set of furnished and serviced apartments, installed in the building itself and exploited as a hotel.
Holiday Villages
Are classified as tourist villages establishments consisting of a set of interdependent and adjacent facilities, the subject of an integrated tourist operation intended, for remuneration, to provide its hotel users, together with ancillary services and additional equipment and support. Hotel capacity Maximum number of individuals that establishments can accommodate at a given time or period. The hotel is determined by the number of beds, double beds count as two beds. This capability is present or available, as they do not consider the closed establishments. Overnight Stay in an establishment that provides lodging considered for each individual, and for a period from 12 hours from one day and 12 hours of the next day. Guest
Individual with at least one overnight in a hotel establishment. Even if it is the same establishment, the same individual is counted in the reference period as many times as periods remaining there (new registrations). Occupancy rate – bed Indicator to assess the average hotel capacity used during the reference period. Corresponds to the ratio between the number of overnight stays and the number of beds used, double beds are considered two beds.
O. R. (bed) =__ Number of overnights in the reference period ___ x 100
No. of beds x Number of days in the reference period
Average stay per hosting Ratio between the number of overnight stays and the number of guests that originated these overnights. Visitor Any person traveling to a place other than his/her habitual residence, for a duration less than 6 months, since the main purpose of the trip is not to engage in gainful activity in the place visited. Tourism
Activities carried out by individuals during their travel and stay in places outside their usual environment for a period of less than one consecutive year for leisure purposes, business or other reasons.

177
Tourist Visitor who stays at least one night in a collective or private hotel situated in the place visited. Personnel employed
People who in the reference period effectively participate in the activity of the company / establishment, regardless of the bond they have. It includes persons temporarily absent during the reference period for vacation, maternity, labor dispute, training, as well as disease or duration of a work accident equal or inferior to a month. It also includes employees of other companies who are working in the company / establishment, and then directly paid. It excludes employees complying with the military service on unpaid leave scheme, holders of political office (councilors and deputies), absent for illness or duration of a work accident exceeding one month, as well as workers with ties to the company shifted to other companies, and being directly paid on those. Paid employees
Person who actively participates in the company's activity / establishment receiving on this account a fixed sum of money and or pre-determined basic commodities. Non paid employees
Those who work without salary compensation. In small family farms, this form of employment includes the entrepreneur and family members who work without pay. For more information see: www.mai.gov.cv www.ine.cv www.asa.cv www.aac.cv www.enapor.cv http://aviation-safety.net


179

180
Foreign Trade
Cabo Verde has a high degree of economic openness (ratio of imports plus exports to GDP) and this shows the importance of analyzing foreign trade in this yearbook. This chapter on Foreign Trade is to present a framework on the main indicators of foreign trade, including imports and exports as well as companies associated with foreign trade activities. This chapter also presents the values of imports coverage rate.
Imports
Imports of goods
Imports increased 3.7% from 2010 to 2014 in terms of value and reported a decrease of 10.4% in terms of weight in the same period. Consumer goods account for 39.7% of total imports of goods in 2014.
Table 174 - Imports of goods by Rating by Broad Economic Categories - BEC (2010-2014)
Value (Millions of CVE) Weight (Ton)
2010 61.861 860
2011 75.160 920
2012 65.711 953
2013 60.201 779
2014
Cabo Verde 64.131 771
Consumer goods 25.474 197
Intermediate goods 19.878 413
Capital goods 8.971 17
Fuel 9.808 143 Source: INE
In 2013, although there were 690 importers, there is a clear downward trend given that in 2010 there were 761 companies, therefore, a reduction of about 71 importing companies. This reduction occurred with higher incidence in Santo Antão that showed a decrease by 63%; in absolute terms, however, the islands of Sal and Santiago had a reduction of 42 companies each.

181
Table 175 - Importers of goods per island (2009-2013)
2009 2010 2011 2012 2013
Cabo Verde 717 761 754 730 690
Santo Antão 16 38 16 21 14
S. Vicente 180 176 216 209 189
S. Nicolau 7 6 6 8 8
Sal 99 137 106 89 95
Boavista 11 19 8 27 37
Maio 0 0 1 1 1
Santiago 400 380 398 368 338
Fogo 3 5 3 7 8
Brava 0 0 0 0 0
Source: INE
There is a merger of suppliers, that is, the largest trading partner (Europe) represents 80.7% of the total import value and 83% in terms of total weight imported. It should also be highlighted the weight of Portugal, from where Cabo Verde imports 39% of total imports in value terms and 52% in terms of weight. The African continent is the economic zone where the weight of activities in the imports' structure is less expressive, although Cabo Verde is an ECOWAS member country. Table 176 - Imports of goods according to economic zones (2010-2014)
Value (Millions CVE) Weight (Ton)
2010 61.861 860
2011 75.160 920
2012 65.711 953
2013 60.201 779
2014
Cabo Verde 64.131 771
Africa 1.146 25
America 4.385 62
Asia/ Oceania 5.890 39
Europe 51.758 640
Others 953 5
Source: INE
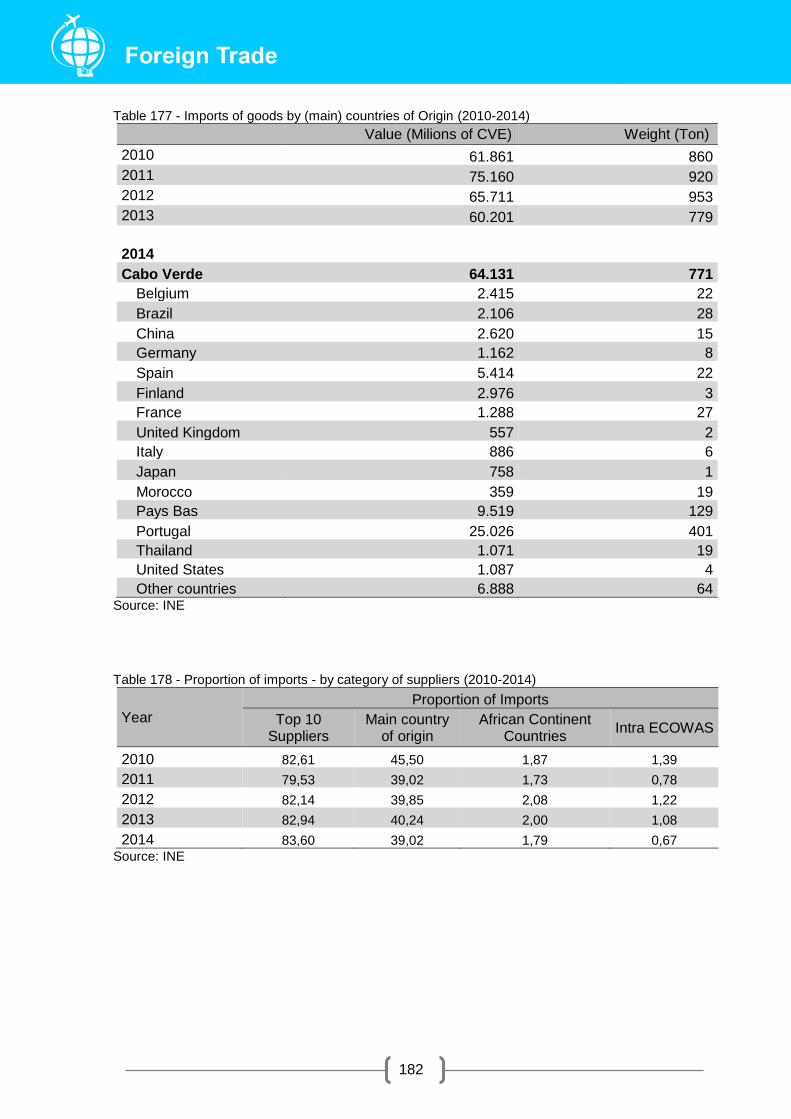
182
Table 177 - Imports of goods by (main) countries of Origin (2010-2014)
Value (Milions of CVE) Weight (Ton)
2010 61.861 860
2011 75.160 920
2012 65.711 953
2013 60.201 779
2014
Cabo Verde 64.131 771
Belgium 2.415 22
Brazil 2.106 28
China 2.620 15
Germany 1.162 8
Spain 5.414 22
Finland 2.976 3
France 1.288 27
United Kingdom 557 2
Italy 886 6
Japan 758 1
Morocco 359 19
Pays Bas 9.519 129
Portugal 25.026 401
Thailand 1.071 19
United States 1.087 4
Other countries 6.888 64 Source: INE
Table 178 - Proportion of imports - by category of suppliers (2010-2014)
Year
Proportion of Imports
Top 10 Suppliers
Main country of origin
African Continent Countries
Intra ECOWAS
2010 82,61 45,50 1,87 1,39
2011 79,53 39,02 1,73 0,78
2012 82,14 39,85 2,08 1,22
2013 82,94 40,24 2,00 1,08
2014 83,60 39,02 1,79 0,67
Source: INE

183
The weight of the top ten imported products in 2014, representing 54.8% of total imports that year. The weights of each of these products in total imports of 2013 and 2014 are highlighted in the following chart. Chart 4 - Weight (in%) of the main products imported in Cabo Verde (2013-2014)
About 85% of all goods imported in 2014, were dispatched at the offices of Santiago (50.9%)
and São Vicente (34.2%).
Table 179 - Imports (Million CVE) by customs office (2010-2014)
2010 2011 2012 2013 2014
Cabo Verde 61.861 75.160 65.711 60.201 64.131
D.A. da Furna 111 52 105 58 48
D.A. de Sal-Rei 2.233 3.380 2.233 2.237 2.346
D.A. de S. Filipe 471 541 765 695 414
ND FOGO 0 16 32 35 26
D.A. Porto Novo 568 797 498 406 415
Customs of Espargos 501 552 439 397 579
D.A. da Palmeira 6.268 6.006 5.312 4.053 5.763
D.A. do Tarrafal 320 277 258 221 274
Customs of Praia 31.401 34.184 29.894 28.574 29.553
D.A. Aeroporto Praia 2.989 4.190 7.625 2.705 2.797
D.A. da Assomada 396 425 188 80 2
Customs of Mindelo 16.604 24.738 18.009 20.334 21.458
Airport of S. Pedro 0 0 354 407 456
Source: INE
21,0
6,0 5,94,4
3,5 3,2 3,4 3,7
2,1 1,7
15,3
11,7
6,6
5,03,5 3,1 3,0 2,7 2,1 1,9
2013 2014

184
Import of services
Table 180 - Imports (Millions of CVE) by type of services (2010-2014)
2010 2011 2012 2013 2014
Services 25.041,6 23.813,2 30.378,5 27.401,7 28.500,2
Transports 8.471,7 7.493,7 8.589,0 7.019,5 7.428,2
Travel 10.768,6 10.500,2 10.993,4 9.937,3 8.959,8
Communication services 334,1 803,9 382,2 422,3 997,3
Construction services and public works 171,1 205,3 1.147,0 1.908,1 1.194,7
Insurance services 1.334,0 1.630,4 1.561,3 1.152,0 1.036,1
Financial services (excluding insurance) 189,2 196,3 209,0 198,5 1.060,5
Computer and information services 403,7 728,2 843,6 697,4 857,4
Royalties and license fees 28,4 0,0 6,4 9,2 397,7
Other business services 2.329,9 1.600,1 5.829,3 5.234,1 5.963,8 Personal, cultural and recreational
services 144,9 21,5 24,8 32,1 23,7
Government services, n.i. o. p. 865,9 633,5 792,4 791,3 580,9 Source: Bank of Cabo Verde

185
Exports
Exports of goods
Exports of Cabo Verde are concentrated in consumer goods. From 2010 to 2014 there was an increase of 72.6% in total exports and an increase of 128% in terms of weight was noticed in the same period.
Table 181 - Exports of goods, by classification of Broad Economic Categories (2010-2014)
Value (Millions CVE) Weight (Ton)
2010 3.881,2 16,8
2011 5.340,5 18,6
2012 4.836,8 20,0
2013 5.723,3 17,4
2014
Cabo Verde 6.699,5 38,3
Consumer goods 6.685,1 37,9
Intermediate goods 14,4 0,4
Capital goods 0,0 0,0
Fuels 0,0 0,0
Source: INE
Exporting companies are unevenly distributed in the country, while having increased 47% from 2009 to 2013. According to the data in Table below, in 2013, most of these companies (82.4%) were in Santiago (54.2%) and São Vicente (28.2%). In 2013 there were 131 exporting companies in the country, 42 more companies than in 2009. This growth was constant throughout the 2009-2013 period. Table 182 - Companies which export goods per island (2009-2013)
2009 2010 2011 2012 2013
Cabo Verde 89 105 113 115 131
Santo Antão 1 0 1 1 3
S. Vicente 21 33 29 33 37
S. Nicolau 1 1 3 4 5
Sal 12 13 15 14 9
Boavista 6 8 11 11 4
Maio 0 0 0 0 0
Santiago 47 49 53 50 71
Fogo 1 1 2 2 2
Brava 0 0 0 0 0 Source: INE

186
Exports of goods are concentrated practically in two European countries, which together account for 78.8% of total exports in 2014. Spain is the destination of 63.8% of exports of goods while Portugal accounts for about 15% of total exports.
Table 183 - Exports of goods per economic zones (2010-2014)
Value (Millions CVE) Weight (Ton)
2010 3.922,1 22,3
2011 5.396,8 29,2
2012 4.843,0 20,3
2013 5.740,2 18,4
2014
Cabo Verde 6.699,5 38,3
Africa 451,2 3,5
America 509,5 3,7
Asia/ Oceania 1,1 0,0
Europe 5.732,9 22,3
Others 4,7 8,9 Source: INE Table 184 - Exports of goods per main destination countries (201-2014)
Value (Millions CVE) Weight (Ton)
2010 3.922,1 22,3
2011 5.396,8 29,2
2012 4.843,0 20,3
2013 5.740,2 18,4 2014
Cabo Verde 6.699,5 38,3
Belgium 0,0 0,0
Brazil 0,0 0,0
China 0,0 0,0
Germany 1,5 0,0
Spain 4.270,6 20,5
France 11,8 0,0
United Kingdom 0,0 0,0
Italy 340,1 0,4
Morocco 331,3 2,4
Pays Bas 20,0 0,1
Portugal 1.007,0 0,6
United States 64,4 0,2
Other countries 652,9 14,2 Source: INE

187
Table 185 - Proportion of exports to the main types / customer classification in total exports (2010-2014)
Year
Proportion of Exports
Top 5 customers Main country of
destination African Continent
Countries Intra ECOWAS
2010 94,70 68,31 0,40 0,36
2011 82,75 66,57 1,03 0,23
2012 88,22 71,92 1,21 0,17
2013 89,66 66,68 1,15 0,21
2014 89,76 63,74 6,74 0,03
Source: INE
The most exported products by Cabo Verde in 2014 are, fish and shellfish, representing 44.5% of total exports and prepared or preserved fish that are positioned in second place with 40.0%. All products in the chart 2, below, except for alcoholic beverages, showed positive developments in 2014, with emphasis on garments which increased 34.1% and preserved fish 19.8% compared to the previous year. Chart 5 - Structure of Exports (in%) by main property in Cabo Verde (2013-2014)
45,3
38,9
6,27,3
1,2 1,1
44,5
40,0
7,1 6,7
0,9 0,8
Peixescrustacios emuloscos
Conserva dePeixes
Vestuário Calçados e suaspartes
Bebidasalcoolicas
RestantesProdutos
2013 2014
Fish, Crustaceans & Molluscs
Canned fish Clothing Shoes and Parts
Alcoholic beverages
Other products

188
In 2014, about 87.9% of exports came from Mindelo, where the headquarters of the largest exporters and cold infrastructure and logistics directed to export are located.
Table 186 - Exports (Millions CVE) by customs office (2010-2014)
2010 2011 2012 2013 2014
Cabo Verde 3.922,1 5.396,8 4.843,0 5.740,2 6.699,5
D.A. de Sal-Rei 0,1 0,0 0,0 0,0 0,0
D.A. de S. Filipe 0,0 0,0 8,0 3,0 10,2
D.A. Porto Novo 1,3 1,0 7,4 0,0 0,0
Customs of Espargos 15,0 0,0 0,0 10,0 0,0
D.A. da Palmeira 0,2 1,2 0,0 0,0 14,2
Customs of Praia 48,7 62,1 29,1 33,8 23,2
D.A. Aeroporto Praia 1,9 25,7 17,1 10,4 6,2
Customs of Mindelo 3.854,9 5.306,9 4.372,3 5.060,2 5.892,3
Airport of S. Pedro 0,0 0,0 409,2 623,0 753,4 Source: INE
Services Export
Exports of services came an upward trend from 2010 to 2013 but in 2014 there was a decline due to the reduction of exports of transport services, travel and other business services. The three main services exported by Cabo Verde (transport, travel and communication services) represented on average 93.3% of the total in the period under review. Table 187 - Exports (Millions of CVE) by type of services (2010-2014)
2010 2011 2012 2013 2014
Services 42.173,9 47.559,7 51.924,6 56.002,9 52.705,0
Transports 14.877,0 11.349,1 10.805,4 11.219,1 9.510,5
Travel 23.112,5 30.909,8 35.554,8 38.376,1 34.769,1
Communication services 1.934,9 2.267,8 2.046,3 2.250,1 4.385,5
Construction services and public works 0,7 52,9 531,7 377,1 499,0
Insurance services 461,1 588,5 317,9 441,6 665,2
Financial services (excluding insurance) 74,0 339,4 179,2 192,3 48,5
Computer and information services 1,0 32,9 3,9 10,4 33,5
Royalties and license fees 0,0 0,0 0,1 0,0 0,0
Other business services 77,7 608,1 694,0 1.165,5 725,3
Personal, cultural and recreational services 0,7 7,7 11,7 31,1 17,2
Government services, n.i. o. p. 1.634,5 1.402,9 1.779,8 1.939,6 2.051,2
Source: Bank of Cabo Verde

189
It is also worth highlight the fact that with the recently checked export dynamics, the import by export coverage rate has increased systematically and from 2010 to 2014 increased by 4.1 percentage points from that from 6.3% in 2010 went to 10.4% in 2014. Exports are by far higher than imports in services, but still insufficient to cover the deficit found in goods. Table 188 - Coverage rate of imports by exports (2010-2014)
Coverage rate (%) 2010 2011 2012 2013 2014
Goods 6,3 7,2 7,4 9,5 10,4
Services 168,4 199,7 170,9 204,4 184,9
Total 53,0 53,5 59,1 70,5 64,1 Source: INE

190
Concepts Special trade
The Special Trade comprises:
1. On import:
a) Merchandise shipped for domestic consumption;
b) Goods entries in temporary admission to undergo modification, repair or hand labor
complement;
c) goods placed under warehousing procedure should then be submitted for processing and
hand labor complement and,
d) Goods intended for the national navigation, but not cleared for consumption.
2. On export:
a) Goods produced in Cabo Verde;
b) Nationalized goods, ie, imported goods, offered for the free disposal of importers after they
had been settled for any rights they may be considered or treated with the modification, repair
or hand-to-work complement by virtue of having been admitted with temporary exemption and,
c) National and nationalized Goods and intended for foreign shipping.
This clearing procedures do not include:
1. On import
a) Goods entries at normal temporary basis (temporary admission);
b) goods returning to another country where they had been sent on a temporary basis (re-
import).
2. On export
a) Goods which have temporarily left the custos;
b) Goods returned as a result of a temporary import, ie the re-exported;
c) National and nationalized Goods destined to domestic navigation.

191
Country of origin and consumption
Imports are calculated by country of origin, that is, if it is a natural product, the country where
it was produced, in the case of product for work, the country where it has received the form in
which it was introduced in the importing country.
Exports are recorded according to the country of consumption, ie where the goods must have
the application for which it was produced or manufactured or where it should be processed or
subject to hand-to-work supplement.
Quantities
The net weight of goods is expressed in tonnes.
Values
The CIF value is considered for import and the FOB value for export , expressed in thousand
escudos and millions of escudos
Rounded figures
The quantities and values of goods are recorded in sub-multiples of the publication of the units,
so that, due to rounding, totals may not correspond to the sum of the partial.
Classification
The goods were classified according to the nomenclature of the Harmonized System (HS).
The United Nations Classification standards ISO II is used in this yearbook, to classify
countries.
For more information: Reports of the External Trade Statistics (INE) www.ine.cv www.bcv.cv


193

194
Agriculture and Fisheries
Agriculture
Cabo Verde, archipelagic and Sahelian country, is extremely vulnerable to natural phenomena, particularly droughts; the average annual rainfall ranges from 60mm on the flat islands to 240-550 mm in the mountainous islands. However, the agricultural sector, despite its structural weaknesses, has played a major role for the country, allowing the livelihood of a large number of families whose support and organization of family life are closely linked to the land. Despite the shortcomings, the agricultural sector was an important factor in economic and social development of Cabo Verde and should continue to be one of the most important aspects of the country's development, which has registered several investments in the modernization of agriculture (drop-by drop irrigation , new production technologies, protected crops and hydroponic professional training in agricultural research and knowledge transfer to farmers, diversification and production scheduling) and especially the mobilization and collection of water (dams, dikes, boreholes, reservoirs; improved management of water resources; renewable energy in water pumping etc.), in conjunction with other economic sectors particularly tourism, so that the sector can respond in a satisfactory and sustainable manner to the challenges and new opportunities and paradigms, particularly in the agribusiness. In this Yearbook, the Agriculture and Fisheries chapter intends to provide a portrait of the production, import, export and production factors related to the agricultural sector (for which data is based mainly on the Census of Agriculture 2004 - RGA 2004) and the sector of fisheries. Noteworthy that these sectors are the pillars of food and nutrition security of the country and source of income and employment opportunities in all the islands. They include activities that employ large numbers of hand labor and participate to a considerable extent in the export of goods.
Agricultural population
With regard to the agricultural population, comparing the results of the Agricultural Census (AC) 1988 with the Census of Agriculture (RGA) 2004, it appears that there was a significant increase in people engaged in agricultural households and on average there was a increase of 29%, and the island of São Vicente registered the largest increase, of more than 1,000% followed by the island of Maio and Santiago, with 46% and 34%, respectively. The island of Boavista was the only one that has undergone a reduction of the order of 11%. Also worth mentioning that Santiago Island was home to about 57% of the country's agricultural population, and the Municipality of Santa Catarina held about 16% of the national total. Both in 1988 and 2004, it appears that the agricultural population was mostly female. It should also be noted that from 1988 to 2004, the number of farming families, but their average size of the same, in all the islands, has decreased, corresponding to a variation of -7.4%, that variation being more pronounced in the islands of S. Vicente, Sal and Brava. Regarding the level of basic education in AC 1988, only 41% of heads of households of both genders, were literate, and this rate has increased to 63.5% in 2004. In this census, it was found that most of the heads of (48%), has the level of basic education, but the proportion of those with no education still remained high (36.5%). The secondary and post-secondary covered 5.7% of total breadwinners and those who had a professional agricultural training were almost nonexistent (0.4%). The highest rates of unschooled heads of households were on the islands of unschooled Santo Antão and São Vicente, 42% and 41%, respectively, but in Santiago (39%) the rate was also higher than the national average, with the higher rate occuring in the Santa Catarina municipality (46%).

195
With regard to indicators of living conditions and comfort of agricultural households (AH) in the 2004 AC, these indicators were registered in detail, having found that almost all the AH had an individual home (95.5 %) and only 0.5% were living in tents. In terms of sanitation, less than half (44%) of the dwellings of the AH, had toilet or latrine, and the Islands of Fogo, Brava, São Vicente and S. Nicolau, these conditions were above the national average and in Santiago the lowest. As for the water supply, the fountain was the main source of water supply of the AH (45%), followed by tap water with 27.6%, and water from the springs and water tanks (in Fogo, Brava and Tarrafal municipality), with 10.8% and 7.6%, respectively. Yet supplying by autotanque, water wells, and other sources of supply, fulfilled the AH needs with 3.7%, 3% and 1.9%, respectively. With regard to energy sources, the main source of energy used in the kitchen was still firewood, used by 80% of the Heads of Household, with higher rates in Santiago (89%) and Fogo (87%) and there are municipalities where this indicator reached values of 94% and 96% respectively in Tarrafal and São Miguel. The lowest value was recorded in Sal, with 5.4%. The second source of energy for cooking was gas. The remaining sources found were oil at 14%, but at high utilization rates in Boa Vista (64%) Maio (56%) and Fogo: (44%), respectively, and also coal and electricity, both with 6 %. Table 189 - Agricultural population by gender per island (1988 e 2004)
1988 2004
Male Female Total Male Female Total
Cabo Verde 81.762 90.601 172.363 106.031 116.223 222.254
Santo Antão 15.684 14.172 29.856 16.539 15.237 31.776
Ribeira Grande 4.872 4.398 14.832 7.570 6.988 14.558
Paul 3.078 2.676 5.754 3.049 2.584 5.633
Porto Novo 7.734 7.098 9.270 5.920 5.665 11.585
S. Vicente 515 449 964 5.369 5.271 10.640
S. Nicolau 4.118 4.080 8.198 4.569 4.653 9.222
Sal 953 891 1.844 1.017 1.074 2.091
Boa Vista 1.245 1.122 2.367 1.109 1.001 2.110
Maio 1.521 1.597 3.118 2.095 2.447 4.542
Santiago 43.118 52.274 95.392 58.803 68.928 127.731
Tarrafal 10.064 13.256 23.320 6.042 7.731 13.773
Santa Catarina 14.984 19.260 34.244 16.290 19.914 36.204
Santa Cruz 8.962 10.084 19.046 12.686 14.266 26.952
Praia 9.108 9.674 18.782 12.125 13.287 25.412
S. Domingos - - - 5.715 6.238 11.953
S. Miguel - - - 5.945 7.492 13.437
Fogo 12.156 13.376 25.532 13.834 14.857 28.691
Mosteiros - - - 3.676 4.126 7.802
S. Filipe - - - 10.158 10.731 20.889
Brava 2.452 2.640 5.092 2.696 2.755 5.451
Source: Ministry of Rural Development (MRD)

196
Amongst the comfort level indicators, radio is the most important for most AH: 75% of them owned a radio unit (ranging from 71% to 91% depending on the islands), followed by television set, which reached higher proportions than the fridge - 42% (ranging from 34% and 73%) compared to 30% (varying from 23% and 69%).The video was already an element of comfort to 17% (ranging from 14% to 46%) of the AH and the computer, although in a low incidence, owned by just 1.2% of the AH, already in the islands and the municipalities, and the internet access a reality for 0.6% of those who had a computer. Owning a car was limited to only 5% of the AH.
Table 190 - Proportion of the agricultural population by gender and average size of farm families by island (1988 e 2004)
1988 Average
family size
2004 Average family size Male (%) Female (%) Male (%) Female (%)
Cabo Verde 47,0 53,0 5,4 47,7 52,3 5,0
Santo Antão 53,0 47,0 5,8 52,0 48,0 4,7
S. Vicente 53,0 47,0 7,1 50,5 49,5 5,2
S. Nicolau 50,0 50,0 4,9 49,5 50,5 4,6
Sal 52,0 48,0 6,7 48,6 51,4 5,1
Boa Vista 53,0 47,0 4,9 52,6 47,4 4,3
Maio 49,0 51,0 4,5 46,1 53,9 4,1
Santiago 45,0 55,0 5,3 46,0 54,0 5,2
Fogo 48,0 52,0 5,2 48,2 51,8 5,0
Brava 48,0 52,0 5,4 49,5 50,5 4,4
Source: Ministry of Rural Development (MRD)
Farm Structure
In terms of the farm structure it is to be noted that in 2004, more than 99% of them are Family Farms (AH). Of the few farms that are not family type, most of them are operated by public entities (government or Municipalities). It is further noted a small number of entities such as cooperatives or associations of farmers. Noteworthy that 76.3% of farms were focused on rainfed agriculture and the three main agricultural islands concurrently - Santiago (59.1%), Santo Antão (14.7%) and Fogo (14.5%) - represent 88.3% of the AH. The islands of Fogo and Brava feature a percentage of 89% of farms engaged in rainfed crop. Santo Antão Island, S. Nicolau and Santiago showed a percentage of 38.6%, 17.4% and 16.5% of farms dedicated to the culture of irrigated land, respectively. It is further noted, that livestock is an activity present in 92% of farms in the country. Regarding the form of exploitation, the majority, ie 57% of the units are run by own account but it is also common to find partnership exploration systems (20.9%) or lease (12.5%).

197
Table 191 - Farm structure per island (1988 e 2004)
Farm structure Variation rate (%) -
1988/2004 AC 1988 RGA 2004
No % No %
Cabo Verde 32.193 100 35.145 100 9,2
Santo Antão 5.176 16,1 5.175 14,7 0,0
S. Vicente 136 0,4 265 0,8 94,9
S. Nicolau 1.664 5,2 1.490 4,2 -10,5
Sal 277 0,9 10 0,0 -96,4
Boa Vista 482 1,5 318 0,9 -34,0
Maio 696 2,2 868 2,5 24,7
Santiago 17.922 55,7 20.772 59,1 15,9
Fogo 4.898 15,2 5.109 14,5 4,30
Brava 942 2,9 1.138 3,2 20,8
Source: Ministry of Rural Development (MRD)
Table 192 - Farm structure according to type per island (2004)
Total
Type of Farm Structure
Family type
Non Family type
Total Co-operative
Producers Association
Public Entity (State/Municipality)
Company Other
Cabo Verde 44.506 44.450 56 1 6 23 8 18
Santo Antão 6.795 6.789 6 0 1 5 0 0
S. Vicente 2.077 2.060 17 0 1 3 4 9
S. Nicolau 2.011 2.009 2 0 0 1 0 1
Sal 412 410 2 0 1 1 0 0
Boa Vista 492 489 3 0 0 0 2 1
Maio 1.099 1.098 1 0 0 0 0 1
Santiago 24.639 24.625 14 1 1 7 2 3
Fogo 5.735 5.726 9 0 2 4 0 3
Brava 1.246 1.244 2 0 0 2 0 0 Source: Ministry of Rural Development (MRD)
Table 193 - Family farm holdings according to agricultural activities per island (2004)
Total
Farming activities
Dry farming Irrigated land Livestock Agro-forestry
No % No % No % No %
Cabo Verde 44.450 33.895 76,3 7 593 17,1 40 887 92,0 1 112 2,5
Santo Antão 6.789 4.563 67,2 2.622 38,6 6.044 89,0 5 0,1
S. Vicente 2.060 130 6,3 171 8,3 1.989 96,6 0 0,0
S. Nicolau 2.009 1.457 72,5 349 17,4 1.895 94,3 26 1,3
Sal 410 4 1,0 6 1,5 406 99,0 0 0,0
Boa Vista 489 306 62,6 40 8,2 467 95,5 1 0,2
Maio 1.098 840 76,5 124 11,3 990 90,2 1 0,1
Santiago 24.625 20.393 82,8 4.069 16,5 22.682 92,1 990 4,0
Fogo 5.726 5.090 88,9 87 1,5 5.391 94,1 7 0,1
Brava 1.244 1.112 89,4 125 10,0 1.023 82,2 82 6,6 Source: Ministry of Rural Development (MRD)

198
Table 194 - Family farm parcels according to farming operation per island (2004)
Total Farm operation
by Own Account
Partnership Lease
Right to use Loan
Fact of leasing Other
Cabo Verde 85.671 49.176 17.969 10.719 3.785 3.718 295 9
Santo Antão 14.857 9.527 4.447 426 369 26 62 0
S. Vicente 376 194 45 9 116 9 3 0
S. Nicolau 4.737 2.978 1.568 32 58 94 1 6
Sal 14 4 0 2 8 0 0 0
Boa Vista 842 726 65 1 49 1 0 0
Maio 1.267 190 12 0 1.006 59 0 0
Santiago 46.204 27.190 7.983 9.085 1.355 363 226 2
Fogo 12.611 7.317 3.538 693 824 235 3 1
Brava 4 763 1.050 311 471 0 2.931 0 0 Source: Ministry of Rural Development (MRD)
Table 195 - Proportion of family farm household representatives by gender (1978-2004)
1978 1988 2004
Male (%) Fem. (%) Male (%) Fem. (%)
Male (%) Fem. (%)
Cabo Verde - - 64 36 49,5 50,5
Santo Antão 68 32 82 18 68,9 31,1
S. Vicente - - - - 34,4 65,6
S. Nicolau 67 33 67 33 56,1 43,9
Sal - - - - 54,4 45,6
Boa Vista 64 36 68 32 66,5 33,5
Maio 56 44 57 43 42,3 57,7
Santiago 64 36 58 42 43,0 57,0
Fogo 67 33 65 35 54,4 45,6
Brava 60 40 59 41 60,5 39,5
Source: Ministry of Rural Development (MRD)
Another important indicator is the feminization rate of the headship of the EAF. As early as 1978, women ran more than a third of the EAF, up to 40% in Brava and 44% in Maio. From 1978 to 2004, there was generally significant increase in almost all islands except the island of Boavista, where possibly the phenomenon of female emigration has continued and Santo Antão and Brava, where there was a slight decrease.
The total arable land is 445,306 liters of which 99.6% belongs to the EAF. The state and the municipalities, as well as producer associations hold, each 0.2% of this area. The vast majority of EAF, concentrated in 1-5 liters area class, then the class 6 to 10 liters, with 36 and 34%, respectively. In the 1-5 class, the islands that contribute most are the Brava Island (79.7%), S. Nicolau (66.2%), Boa Vista (55.1%), Santiago (37.1%) and Santo Antão (28.3%). In the 5-10 liter class, the islands with higher percentages are the island of Santiago (41.8%), Maio (31.6%), Fogo (28.8%), Santo Antão (26.5% and Boa Vista (23.7%). the 35,145 EAF practicing agriculture hold 443,588 liters of the total arable land of the country. Of this area, 402,948 liters (90.8%) are dryland, 34,755 liters (7.8%) are irrigated land and 5,884 liters (1.3%) are irrigated land and dry land. the islands with larger arable agricultural areas are Santiago (52.7%), Santo Antão (20.8%) and Fogo (15.8 %). The remaining islands hold only 10.7% of the total arable agricultural area.

199
Table 196 - Arable land in liters, according to class per Island /Municipality (2004)
Total
Area Class (in Litres)
< 1 1 - 5 6 - 10 11 - 20 > 20
No % No % No % No % No %
Cabo Verde 443.588 3.114 0,7 159.601 36,0 152.542 34,4 79.364 17,9 48.967 11,0
Santo Antão 92.228 533 0,6 26.079 28,3 24.447 26,5 20.180 21,9 20.988 22,8
Ribeira Grande 40.246 398 1,0 16.270 40,4 10.831 26,9 6.862 17,0 5.886 14,6
Paul 16.141 21 0,1 3.814 23,6 4.875 30,2 4.299 26,6 3.133 19,4
Porto Novo 35.840 114 0,3 5.996 16,7 8.741 24,4 9.020 25,2 11.969 33,4
S. Vicente 4.941 2 0,0 452 9,1 933 18,9 1.404 28,4 2.149 43,5
S. Nicolau 15.081 208 1,4 9.990 66,2 3.059 20,3 1.085 7,2 740 4,9
Sal 64 0 0,7 19 28,9 10 15,6 35 54,8 0 0,0
Boa Vista 3.297 12 0,4 1.818 55,1 782 23,7 450 13,6 235 7,1
Maio 11.978 4 0,0 1.916 16,0 3.784 31,6 3.271 27,3 3.004 25,1
Santiago 233.783 1.634 0,7 86.662 37,1 97.715 41,8 37.171 15,9 10.601 4,5
Tarrafal 28.763 348 1,2 15.577 54,2 10.229 35,6 2.020 7,0 590 2,0
Santa Catarina 67.600 381 0,6 24.279 35,9 30.847 45,6 9.880 14,6 2.214 3,3
Santa Cruz 62.631 287 0,5 18.191 29,0 27.523 43,9 13.218 21,1 3.412 5,4
Praia 25.689 59 0,2 5.661 22,0 10.155 39,5 6.371 24,8 3.443 13,4
S. Domingos 21.283 53 0,2 6.761 31,8 10.066 47,3 3.817 17,9 588 2,8
S. Miguel 27.818 507 1,8 16.193 58,2 8.896 32,0 1.866 6,7 356 1,3
Fogo 70.145 435 0,6 23.043 32,8 20.182 28,8 15.455 22,0 11.031 15,7 Mosteiros 12.147 340 2,8 7.059 58,1 2.679 22,1 1.167 9,6 902 7,4 S. Filipe 57.998 95 0,2 15.984 27,6 17.503 30,2 14.288 24,6 10.129 17,5
Brava 12.072 286 2,4 9.623 79,7 1.629 13,5 314 2,6 220 1,8
Source: Ministry of Rural Development (MRD)
Chart 6 – Arable area by class (2004)
Source: Ministry of Rural Development (MRD)
0,7
36,034,4
17,9
11,0
0.0
1.0
2.0
3.0
4.0
< 1 1 - 5 6 - 10 11 - 20 > 20Class
(in Liters)
%

200
More than half of dryland available total area (54.9%) is found in the Island of Santiago and Santo Antão and Fogo have almost the same area, 17.6 and 17.3%, respectively. In turn, the Santo Antão Island holds a little more than half of the irrigable area of the country, 51.3%, followed by Santiago, with 31.8%. S. Vicente is the third island with more available area for irrigation. As can be seen, in Cabo Verde, the average size of parcels, both in rainfed conditions or irrigated is very small. On average, each family farm has 12.63 liters of arable land (equivalent to about 1.3 ha). In dryland this average is 11.92 liters, 4.95 liters in irrigated and rainfed and irrigated 6.31 liters. In terms of parcels form of exploitation, the Own Account is the dominant form of exploitation in 54% of non-irrigated land and 62% of irrigated land. The Partnership ranks second, with 23% of rainfed operating areas and 21% of irrigated areas. Lease represents 14.6% of rainfed operating areas and 10% of irrigated areas. Land operated in usufruct represented 5.3% in non-irrrigated and 6% on irrigated land. The Lending and tenure are not representative, with greater emphasis in certain islands. Table 197 - Parcels of family farms according to operation form per island (2004)
Total Farm operation
By own account Partnership Lease
Right to use Loan
Fact of leasing Other
Cabo Verde 85.671 49.176 17.969 10.719 3.785 3.718 295 9
Santo Antão 14.857 9.527 4.447 426 369 26 62 0
S. Vicente 376 194 45 9 116 9 3 0
S. Nicolau 4.737 2.978 1.568 32 58 94 1 6
Sal 14 4 0 2 8 0 0 0
Boa Vista 842 726 65 1 49 1 0 0
Maio 1.267 190 12 0 1.006 59 0 0
Santiago 46.204 27.190 7.983 9.085 1.355 363 226 2
Fogo 12.611 7.317 3.538 693 824 235 3 1
Brava 4.763 1.050 311 471 0 2.931 0 0 Source: Ministry of Rural Development (MRD)
Agricultural production (in the strict sense)
The horticultural sector has seen great progress with noticeable gains in increasing production and productivity encouraging a gradual change in the structure of the primary sector and playing an increasingly important economic role. The data produced in recent years (Vegetables and Tubers and roots crops production estimates from 2010 to 2014) indicate that there is a clear crop diversification and increased production of all cultures. Overall, from 2010 to 2014 there was an increase of 25.7% in the production of vegetables and the production of roots and tubersmore than doubled, increasing by 107%. The tomato is the most representative product in vegetable crops and has shown a participation of 29.7% of the total in 2014 (and in 2010 had a total share of 36.3%).

201
Table 198 - Estimated production (tons) Vegetables and Roots and Tubers crops (2010 – 2014)
2010 2011 2012 2013 2014
Vegetable crops 41.799 46.570 48.785 51.266 52.544
Tomatoes 15.193 17.399 14.045 16.684 15.611
Peppers 2.018 2.109 3.849 3.683 3.842
Cabbage 5.668 6.323 8.508 9.028 9.962
Carrots 4.208 5.592 5.573 5.266 6.078
Watermelon 30 2.185 1.252 1.278 1.537
Lettuce 692 709 1.215 1.302 1.856
Kale 2.335 2.689 2.270 2.293 3.551
Onion 4 471 4.548 6.822 6.548 4.842
Various 4.852 5.016 5.251 5.184 5.265
Roots and Tubers (R&T) 12.592 19.937 21.671 27.163 26.093
Source: Ministry of Rural Development (MRD)
Chart 7 - Estimated production (thousand tons) Vegetables and Roots and Tubers crops (2010 – 2014)
Source: Ministry of Rural Development (MRD)
41,846,6 48,8
51,3 52,5
12,6
19,9 21,7
27,2 26,1
54,4
66,570,5
78,4 78,6
0
20
40
60
80
100
2010 2011 2012 2013 2014
Thousands tons
Total(Vegetable crops +R&T)
Vegetable crops
Roots & Tubers

202
Regarding the production of fruit, estimates of annual production in 2014 amounting to 17,470 tons, consisting mainly of bananas, (approximately 60% of total production) that although it has been reduced from 67.5% in 2010 to 60.3 % of fruits produced in the country, showed a growth trend and from 2010 to 2014, increased to around 68.6%. Also to be noted an increase in the production of other fruits like mango and papaya during the period 2010-2014. Table 199 - Estimated production (tonnes) by type of fruit crops (2010-2014)
Fruit Crops 2010 2011 2012 2013 2014
Total 10.363 15.190 15.950 16.639 17.470
Banana 7.000 9.100 9.555 10.033 10.534
Mango 1.700 2.040 2.142 2.140 2.247
Papaya 1.130 3.000 3.150 3.308 3.473
Other 533 1.050 1.103 1.158 1.216
Source: Ministry of Rural Development (MRD)
Chart 8 - Production estimates (in thousand tons) according to the main fruit crops (2010 – 2014)
Source: Ministry of Rural Development (MRD)
7,09,1 9,6 10,0 10,5
1,7
2,02,1
2,12,2
1,1
3,03,2
3,33,5
0,5
1,11,1
1,21,2
0
5
10
15
20
2010 2011 2012 2013 2014
Mill
ions o
f to
ns
Outras
Papaia
Manga
Banana
Other
Papaya
Mango
Banana

203
Regarding cash crops, i.e., coffee, grape and sugarcane (the first two with higher spatial specificity), according to estimates, an increase since 2010 is to be noted; from 2012 to 2014 It may be noted an increase of 18.5% in the total production of these crops, however, the vineyard stands out with 83% of cash crops total production The annual production estimates of coffee suggest a variation from 33 to 52 tons of this product, highlighting coffee from Fogo. Table 200 - Estimated production (Ton.) of cash crops (2010 – 2014)
Cash Crops 2010 2011 2012 2013 2014
Total 218 338 393 436 465
Coffee 33 62 88 62 52
Vineyard 160 248 277 346 385
Sugarcane 25 28 28 28 28
Source: Ministry of Rural Development (MRD)
Data indicate that the production of non-irrigated crops registers fluctuations in the yearly rainfall. After a few years of good production, the rainfed crops registered a considerable decrease in production (about 83%), both in corn (-80.9%) as in the bean (-88.1%) that are grown in intercropping. However, it should be clarified that these figures are due to poor rainfall recorded in 2014. Table 201 - Estimated production (tons) of rainfed crops (2010 – 2014)
Non-irrigated Crops 2010 2011 2012 2013 2014
Total 11.232 12.174 12.008 1.941
Corn 7.047 5.569 6.001 5.785 1.065
Beans 4.688 5.463 5.950 5.943 650
Peanuts - 200 223 280 226
Source: Ministry of Rural Development (MRD)
Chart 9 - Production (thousand tons) of rainfed crops per year (2011 - 2014)
Source: Ministry of Rural Development (MRD)
5,66,0
5,8
1,1
5,56,0 5,9
0,70,2 0,2 0,3 0,2
0.0
0.2
0.4
0.6
0.8
2011 2012 2013 2014
Mill
ion
s o
f to
ns
Milho
Feijões
Mancarra
Corn
Beans
Peanuts

204
Table 202 - Total production, average maize production (tons) in the last 5 years, per island (2010-2014)
2010 2011 2012 2013 2014 Change
2013/2014
Average production in the last five
years
Average Change in the Last 5 years
Cabo Verde 7.047 5.569 6.342 5.785 1.065 -82 6.425 -83
S. Antão 271 245 311 205 7 -97 269 -97
S. Nicolau 177 156 190 171 12 -93 177 -93
Maio 6 6 6 5 1 -80 6 -83
Santiago 4.098 2.949 3.175 2.854 481 -83 3.486 -86
Fogo 1.681 1.457 1.846 1.702 360 -79 1.699 -79
Brava 814 756 814 848 204 -76 788 -74
Source: Ministry of Rural Development (MRD)
Chart 10 - Production (tons) of maize per island (2014)
Source: Ministry of Rural Development (MRD)
481
360
204
12
7
1
0 100 200 300 400 500 600
Santiago
Fogo
Brava
S. Nicolau
S. Antão
Maio
Tons

205
Animal Production
The family livestock farm is an important component of income and livelihoods of farm families, and the most raised species by agricultural families are chickens and goats.
The livestock activity has shown a structural change, if previously the creation of small ruminants was predominant, particularly goats and poultry (chicken), the latest estimates indicate that the pig farming has shown a significant growth and almost doubled from 2007 to 2008. All the islands show diversification in terms of livestock, though the focus is on the islands of
Santiago, Fogo and Santo Antão which only on the island of Santiago in 2004 represented about 68.2% of the cattle,
78.7% of sheep, 40.4% of goats, 63.5% of pigs and 50% of birds in the country.
Table 203 - Livestock by species and year (1994/95-2008)
Species 1994/95 2004 2006* 2007* 2008*
Cattle 21.728 22.306 27.370 23.979 25.928
Sheep 9.010 10.400 8.136 8.296 10.101
Goats 111.997 148.094 105.170 113.589 92.365
Pigs 69.718 77.316 38.690 74.821 136.992
Birds 270.896 327.562 173.723 244.394 202.163
Ducks and turkeys 3.436 15.558 - - 10.831
Equines 13.957 11.302 - - -
Rabbit 3.256 4.458 - - -
Source: Ministry of Rural Development (MRD) * - Results of agricultural campaigns
Chart 11 - Proportion of livestock by species (2008)
Source: Ministry of Rural Development (MRD)

206
Table 204 - Livestock species per island (2004)
Species
Cattle Sheep Goats Pigs Birds Ducks and
Turkeys Equines Rabbits
Cabo Verde 22.306 10.400 148.094 77.316 327.562 15.558 11.302 4.458
Santo Antão 832 165 23.791 7.786 38.721 629 1.997 1.288
S. Vicente 236 240 5.885 4.179 30.479 1.645 49 457
S. Nicolau 1.255 1.269 7.004 2.301 14.399 108 594 47
Sal 60 182 413 993 2.291 38 19 19
Boa Vista 260 37 11.214 940 2.757 64 488 7
Maio 740 40 8.953 1 944 4.093 230 159 42
Santiago 15.206 8.184 59.883 49 129 163.798 11 710 5 892 1 961
Fogo 3.064 269 26.268 9 147 59.671 1 009 1 780 410
Brava 653 14 4.683 897 11.353 125 324 227 Source: Ministry of Rural Development (MRD)
There have been positive developments for the production of meat in recent years, although it is very constrained by the fluctuations in forage availabilities in the case of ruminants and also the occurrence of episodes of African swine fever in pigs. From 2010 to 2014 the estimate was that the production of beef, pork, sheep and goats increased by 3.8% and pork accounted for about 66.9% of the total. It is worth highlighting the chicken meat production has increased about 39.3% in the same period. Table 205 - Meat production estimate (tons) (2010 – 2014)
Meat 2010 2011 2012 2013 2014
Beef, goats, sheep, swine meat 4.254 4.304 4.358 4.412 4.468
Chicken meat - 677 753 929 943
Source: Ministry of Rural Development (MRD)
Table 206 - Estimated total, slaughter rate, total slaughtered and meat production (tons) of major species (2014)
Species Total Slaughter rate total slaughtered Meat production (tons)
Cattle 22.802 0,15 3.420 547
Goat 195.195 0,30 58.559 878
Sheep 11.740 0,30 3.522 53
Pigs 85.405 0,70 59.783 2.989
Total 4.468
Source: Ministry of Rural Development (MRD)

207
The estimates on milk production also point towards a positive development, having grown about 8.1% in the period from 2010 to 2014. In that year it was estimated that about 31% of the milk produced was from bovine animals and 69% the caprine species.
For eggs production, this also registered a considerable growth of about 27.8% in the 2010-2013 period. Table 207 - Milk estimated production (in liters) (2010 – 2014)
2010 2011 2012 2013 2014
Milk 10.320.708 10.521.985 10.728.778 10.941.109 11.159.131
Source: Ministry of Rural Development (MRD)
Table 208 - Eggs estimate production (Unit) (2010 – 2014)
2010 2011 2012 2013 2014
Eggs 35.999.742 41.151.757 47.501.580 45.992.694 42.233.489
Source: Ministry of Rural Development (MRD)
Forestry
Afforestation in Cabo Verde, carried out intensively since the beginning of national independence, by successive governments, with the strong support of international cooperation, has played a crucial role in the fight against desertification and, in the background, allowing the satisfaction of the needs for most of the population. Currently, the country has a patrimony in woody vegetation, estimated at 89,903 ha, of which 54,919.4 ha (61%) is classified as forest, according to FAO standards3. Table 209 - Area covered by woody vegetation and forest and their proportions by island
Area with woody
vegetation (ha)
% Woody vegetation
area / island
Área florestal (ha)
% forest/island
area
% National forest area
Cabo Verde 89.903,10 54.919,4 13,60
Santo Antão 5.389,3 6,0 2.071,9 3 0,51
S. Vicente 2.745,4 3,1 2.163,1 10 0,53
S. Nicolau 5.530,5 6,2 2.464,1 7 0,61
Sal 1.714,3 1,9 356,0 2 0,08
Boavista 5.485,6 6,1 1.822,6 3 0,45
Maio 7.176,9 8,0 5.446,9 20 1,35
Santiago 50.532,3 56,1 37.328,3 38 9,25
Fogo 9.929,4 11,0 2.347,4 5 0,58
Brava 1.399,6 1,6 813,6 13 0,20
Source: Ministry of Rural Development (MRD)
3 Food and Agriculture Organization (Organização das Nações Unidas para Alimentação e Agricultura)

208
Table 210 - Biomass Forager Production Estimate (2013)
Forage production area
Area (ha) MS income (Tons)
Production (Tons)
Forestry and pastoral area 142.261 1,8 256.718
Cultivated corn area 31.727 1,1 35.217
Biomass Forager Production 291.935 Source: Ministry of Rural Development (MRD)
In recent years, one of the major threats to the destruction of this valuable heritage has been the occurrence of forest fires, with some frequency, particularly on Fogo Island. The major forest fires in the country, have occurred precisely on Fogo Island being the 2013 and 2015 fires, the most significant, with 437 and 801 ha burnt, respectively.
Table 211 - Wooded area (in hectares) burned in forest fires per island (2011 – 2015)
2011 2012 2013 2014 2015
Cabo Verde 73 44 437 278,4 801,2
Santo Antão 0 0 0 0 0
S. Vicente 0 0 0 0 0
S. Nicolau 0 0 0 0 0
Sal 0 0 0 0 0
Boavista 0 0 0 40 0
Maio 0 0 0 0 0
Santiago 0 44 0 80 -
Fogo 73 0 437 158,4 801,2
Brava 0 0 0 0 0
Source: Ministry of Rural Development (MRD)

209
Fisheries
Fishing has always been an important economic activity for Cabo Verde. This sector along with agriculture has allowed greater resilience of the rural population and reduced the dynamics of rural exodus, as well as provide an opportunity for employment and income for the population. Fishing in the country is divided into small-scale fishing, which is carried out with boats called "mouth open vessels" and directed to coastal fisheries and also has a semi-industrial fishing and industrial fishing, which is done using larger vessels, usually with inboard engines and greater autonomy. Artisanal fishing in 2011 had 1,239 vessels and 3,717 fishermen. The island of Santiago has a higher number of small fishing vessels, representing approximately 39.7% of the national total. In terms of industrial fishing, in 2011, it accounted for90 vessels, employing about 1,092 fishermen. About 47.8% of the vessels were in Santiago Island and approximately 26.7% were on the island of São Vicente. Table 212 - Number of vessels (boats) and artisanal fishing fishermen per island (2011)
Number of boats
Number of Fishermen
Cabo Verde 1.239 3.717
Santo Antão 124 372
São Vicente 93 279
São Nicolau 80 240
Sal 120 360
Boavista 61 183
Maio 69 207
Santiago 492 1.476
Fogo 109 327
Brava 91 273 Source: National Institute for Fisheries Development (NIFD)
Table 213 - Number of vessels and fisherman of industrial / semi-industrial fishing per island (2011)
Vessel no. Number of
Fishermen
Cabo Verde 90 1.092 Santo Antão 5 60 São Vicente 24 288 São Nicolau 4 48 Sal 9 108 Maio 4 60 Santiago 43 516 Brava 1 12
Source: National Institute for Fisheries Development (NIFD)

210
Catches increased by 28% from 2010 to 2013 and the artisanal fisheries catch has had a slight decrease (about 5.3%) while industrial fishing has increased about 59.7% in the same period. Artisanal fishing is more diverse and catches are concentrated around the tuna (35%) and demersal stocks (28%) while the industrial fisheries it is to be noted a certain predominance of tunas (66%) and small pelagic species (22%). Table 214 - Nominal catches of fish (in tons) according to the type of fishing for main species
Artisanal Industrial Total
2010 4.617,7 4.831,7 9.449,4
2011 4.622,5 4.622,5 9.245,1
2012 4.310,0 5.954,7 10.264,6
2013 4.374,2 7.714,7 12 089,0
2014
Total 4.417,5 9.839,4 14.256,9
Tunas 1.547,5 6.524,4 8.071,9
Small Pelagic 935,2 2.169,2 3.104,4
Demersal 1.245,7 972,6 2.218,2
Various 652,3 37,8 690,0
Crustaceans and molluscs 11,9 33,3 45,2
Sharks 25,0 102,3 127,2
Source: National Institute for Fisheries Development (NIFD)
Table 215 - Fish import - weight and value (2010-2014)
Weight (Tons)
Value (Millions of CVE)
2010 403,60 162,03
2011 612,06 251,36
2012 660,62 289,14
2013 727,17 339,23
2014
Total 662,43 322,50
Live fish 0,25 0,77
Fresh or chilled fish, excluding fish fillets and other fish meat
3,38 2,60
Frozen fish, excluding fish fillets and other fish meat
97,78 60,51
Fish fillets and other fish meat (minced), fresh, chilled or frozen
205,85 96,06
Fish, dried, salted or in brine; smoked fish, even cooked ...
60,54 37,13
Crustaceans, whether in shell or not, fresh live, chilled, frozen, dried
110,93 66,74
Mollusks, in shell or not, live, fresh, chilled, frozen, dried, salted ...
183,71 58,69
Source: INE

211
Indicators for the import of fish indicate that the country is still not self-sufficient in relation to consumption of fish. The import has increased and in 2010 had a value of 162.3 million CVE. From 2010 to 2013 imports increased by about 109.4% and correspond mainly to imports of fish fillets and other fish meat (minced), fresh, chilled or frozen, representing about 30% of total imports in value and 31% of total imports by weight. Sea products take a significantly part in the export basket of the country. From 2010 to 2013 the export value of fish increased (63.6%), however, the amount (weight) decreased by 0.85%. More than 99% of export of marine products are frozen fish. Despite the growth of fish imports, the trade balance in relation to these products is surplus, that is, the country exports more than it imports, fishing is therefore a great generator of foreign exchange for the country. Table 216 - Fish exports - weight and value (2010-2014)
Weight (Tons)
Value (Millions of CVE)
2010 13.328,6 1.590,38
2011 13.763,9 2.038,54
2012 10.582,9 1.858,87
2013 13.215,9 2.602,80
2014
Total 24.001,8 2.977,89
Fresh or chilled fish, excluding fish fillets and other fish meat
1,5 1,23
Frozen fish, excluding fish fillets and other fish meat
23.992,5 2.954,68
Fish fillets and other fish meat (minced), fresh, chilled or frozen
0,7 0,15
Crustaceans, whether in shell, live, fresh, chilled or frozen, dry
7,2 21,82
Source: INE


213

214
Environment
The inclusion of the topic in this environment directory, aims to provide the Cabo Verdean society a picture frame of protected areas and the conditions of housing in terms of access to water, sanitary facilities and habitability of houses. These indicators somewhat portray the diversity of the living conditions of the population and the data indicate that although an improvement in indicators is evident, there is great inter-regional heterogeneity in the country in terms of environmental conditions. Cabo Verde is a very fragile and vulnerable archipelago to climate change. Aware of this, the Government has implemented an ambitious program of environmental protection, and currently about 18% of the land area and 6% of the marine area are protected areas. Table 217 - Area and proportion of protected areas (Land and marine) by municipality (2015)
Area (Km2) Proportion
Land Marine Land Marine
Cabo Verde 733,57 55.924,74 18,19 5,66
Santo Antão 197,67 44,33 25,38
S. Vicente 3,12 0,00 1,37
Santa Luzia 34,27 27.318,00 100,00
Ilhéu Branco e Raso 8,54 27.837,00 100,00
S. Nicolau 22,77 0,00 6,64
Sal 38,27 162,16 17,72
Boa Vista 231,17 278,37 37,29
Maio 75,98 284,87 28,24
Santiago 37,10 0,00 3,74
Fogo 84,69 0,00 17,79
Brava 0,00 0,00 0,00
Source: National Environment Directorate (NED)

215
The data indicate that in terms of the proportion of the population with access to drinking water from improved sources, ie, access to water through "Fountain", "Autotanque", "Public Network" or even if got by neighbors, a considerable improvement was registered, from 78% in 2000 to 91% in 2014. This increase of 13 percentage points in national terms has a very important qualitative dimension, taking into account that the increase was more pronounced in rural areas, where access to water has always been a major constraint. First there were 65% of the population with access to water through improved sources in 2000, in 2014 it increased to 77%, an increase of 17%. Table 218 - Proportion of population using an improved drinking water source4
2000 2010 2012 2013 2014
Cabo Verde 78,1 90,2 90,5 90,1 91,0
Gender
Male 78,2 90,4 90,2 91,1
Female 78,0 90,1 90,0 90,8
Area
Urban 89,0 98,6 99,1 99,3 98,4
Rural 65,4 76,7 75,5 72,9 76,6
Municipality
Ribeira Grande 88,2 94,4 95,1 94,4 91,4
Paul 78,3 89,4 91,5 88,7 89,0
Porto Novo 83,4 91,5 94,5 95,4 95,8
S. Vicente 75,1 97,8 99,3 99,3 98,1
Ribeira Brava 91,3 94,5 99,3 96,7 98,4
Tarrafal de S. Nicolau 81,4 95,2 93,2 94,1 94,3
Sal 96,3 99,2 98,5 100,0 99,3
Boavista 77,9 98,5 99,2 92,8 99,3
Maio 92,6 98,9 99,3 98,8 99,8
Tarrafal 84,5 95,9 93,4 95,6 96,0
Santa Catarina 63,2 77,3 73,5 73,9 79,1
Santa Cruz 74,9 80,2 83,7 82,5 81,6
Praia 93,0 98,2 99,0 99,5 99,1
S. Domingos 75,4 88,1 90,0 82,3 66,1
S. Miguel 57,0 71,9 78,0 67,2 60,9
S. Salvador do Mundo 43,9 52,9 42,7 42,7 46,1
S. Lourenço dos Órgãos 61,0 79,0 79,8 86,0 86,4
Ribeira Grande de Santiago 49,8 74,6 81,7 85,7 82,5
Mosteiros 54,6 64,2 54,7 51,7 60,8
S. Filipe 72,7 80,3 72,7 70,9 91,0
Santa Catarina do Fogo 57,5 67,6 56,4 44,4 61,8
Brava 82,4 94,3 97,8 99,7 98,2
Source: INE
4 In Cabo Verde, it is considered improved sources of drinking water, "Fountain," "Autotanque" and "Public Network /
Channeling ... / ... Piped water (including from the homes of neighbors)"

Table 219 - Proportion of the population using improved sanitation facilities (1990, 2000, 2010, 2012-2014)
Improved sanitation facilities (%) 1990 2000 2010 2012 2013 2014
Cabo Verde 24,5 39,2 63,6 72,9 71,8 73,9
Gender
Male 39,2 63,5 71,5 73,3
Female 39,2 63,7 72,1 74,5
Area
Urban 43,1 56 76 83,9 81,1 83,3
Rural 9,8 19,7 43,8 53,9 54,6 55,9
Municipality
Ribeira Grande 17,0 37,3 72,3 77,9 74,8 78,2
Paul 8,4 21,1 60,4 70,7 69,3 71,2
Porto Novo 13,2 28,1 52,5 59,8 63,3 65,4
S. Vicente 43,3 57,1 80,5 87,4 83,8 85,1
Ribeira Brava ( 5 ) 30,9
46,6 68,6 71,0 70,4 66,3
Tarrafal de S. Nicolau ( 7 ) 51,6 71,3 85,2 82,5 86,1
Sal 67,0 71,1 87,6 89,0 89,4 91,4
Boavista 35,0 51,3 61,1 61,5 68,1 68,0
Maio 27,8 43,4 74,3 89,2 88,6 91,9
Tarrafal ( 6 ) 13,2 27,1 49,2 65,0 58,6 57,3
Santa Catarina ( 8 ) 13,8 28,2 52,0 57,7 58,3 60,0
Santa Cruz ( 8 ) 4,8 15,9 34,6 39,8 45,1 48,9
Praia ( 8 ) 39,7 52,0 69,8 81,9 77,4 80,0
S. Domingos ( 8 ) 5,8 15,8 36,6 54,0 52,6 52,1
S. Miguel ( 8 ) 6,2 12,6 34,5 46,7 42,8 50,0
S. Salvador do Mundo ( 8 ) 3,1 13,1 33,4 45,4 45,2 51,8
S. Lourenço dos Órgãos ( 8 ) 4,7 15,9 41,4 53,3 62,1 65,2
Ribeira Grande de Santiago ( 8 ) 2,1 10,3 31,0 41,4 48,1 45,4
Mosteiros (7) 19,9 37,4 76,5 83,1 89,1 87,8
S. Filipe (9) 16,2 35,6 67,5 77,1 79,1 82,1
Santa Catarina do Fogo (9) 9,9 28,7 71,2 74,3 81,9 83,6 Brava 41,9 50,9 73,4 86,1 86,6 87,4
Source: INE
5 For S. Nicolau it was not possible to know the disaggregated data by the two municipalities in 1990. The entire island was one
municipality at that time and had two parishes (Parish of Nossa Senhorada Lapa and Nossa Senhora do Rosário). When the parish was divided in two municipalities the areas of the two existing parishes were altered, as well as having been created another parish, so it is not possible to consider the data made available per parish of the Census 1990 since it does not correspond to the current areas of the two municipalities.
6 In 1990 the area of the Tarrafal municipality corresponded to 2 parishes. These Parishes, Santo Amaro Abade and S. Miguel
Arcanjo, correspond to existing municipalities of Tarrafal and São Miguel respectively. In 1990 the area of the Santa Catarina municipality corresponded to the two parishes. These Parishes, Santa Catarina and São Salvador do Mundo, correspond to existing municipalities of Santa Catarina and São Salvador do Mundo respectively. In 1990 the area of the municipality of Santa Cruz corresponded to the two parishes. These Parishes, Santiago Maior and S. Lourenço dos Orgãos correspond to the current municipalities of Santa Cruz and S. Lourenço dos orgãos respectively. In 1990 the area of Praia da county corresponded to the 5 parishes. These Parishes, Nossa Senhora da Luz, S. Nicolau Tolentino, Nossa Senhora da Graça, Santíssimo Nome de Jesus and S. João Baptista, correspond to existing municipalities of São Domingos (2 civil parishes), Praia and Ribeira Grande de Santiago (2 districts) respectively.
7 In 1990 the municipality of Mosteiros did not exist, but the current area corresponded to the Parish of Nossa Senhora da Ajuda.
The current area of S. Filipe county corresponds to the Parishes of S. Lourenço and Nossa Sra. Da Conceição. The current area of the municipality of Santa Catarina do Fogo corresponds to the Parish of Santa Catarina

217
Another indicator that is worth highlight is the proportion of urban population living in degraded houses or shacks. In 2000 about 61.6% of the urban population was living in housing units that offered precarious conditions for a decent life. The data indicate that there has been an improvement in this indicator and that in 2013, only 35.2% of the population was living in degraded houses or shacks (a reduction of 43% in that period). Only Boavista Island showed a step backwards from this indicator, where there was an increase of 8 percentage points from 2000 to 2013, causing about 60% of the population to live in precarious housing. Table 220 - Proportion of urban population living in rundown or precarious houses8 (2000, 2010, 2013-2014)
2000 2010 2013 2014
Cabo Verde 61,6 43,2 35,2 33,0
Gender
Male 61,8 43,7 35,4 34,3
Female 61,5 42,8 34,9 31,7
Municipality
Ribeira Grande 56,3 31,2 13,0 14,2
Paul 81,6 33,3 42,3 41,4
Porto Novo 72,9 50,0 41,3 38,4
S. Vicente 57,6 35,6 27,8 28,1
Ribeira Brava 56,9 21,4 20,1 25,1
Tarrafal de S. Nicolau 61,1 39,7 30,9 24,1
Sal 51,6 41,5 32,6 29,3
Boavista 52,0 61,8 59,9 52,7
Maio 68,7 34,2 29,1 47,9
Tarrafal 76,0 38,5 45,0 32,9
Santa Catarina 47,5 44,7 29,5 26,0
Santa Cruz 76,7 55,5 48,1 56,0
Praia 63,0 47,3 38,4 34,0
S. Domingos 69,6 40,1 25,1 54,2
S. Miguel 83,2 47,4 41,1 30,7
S. Salvador do Mundo - 63,4 55,0 46,0
S. Lourenço dos Órgãos - 55,0 23,8 28,5
Ribeira Grande de Santiago - 47,7 42,1 45,0
Mosteiros 35,5 39,4 25,1 26,4
S. Filipe 57,6 30,6 20,1 21,7
Santa Catarina do Fogo - 45,1 50,0 48,0
Brava 54,0 28,7 17,9 31,2
Source: INE
8 It represents the population living in households with one or more of the following conditions: Living in a tent, container, Makeshift in building not intended for housing: factories, schools, fountains, garages, etc; Has no access to improved drinking water source; Lacks access to improved sanitation facilities; The living units have ceiling, walls and floor made of non-durable materials; Overcrowded - more than 3 people sharing the same room.


Participação Política
219

Participação Política
220
Political Participation
The issue of political participation, whose focus is mainly on the participation of women in the national parliament and within the Executive Power, the main indicators of the elections’ results in 2011 (legislative and presidential) and 2012 (municipal) are also presented to highlight the effective participation of the population in the last elections. The tables were prepared based on data published in the Official Bulletin and demonstrate the electoral framework of Cabo Verde.
Women in politics
The data indicate that the participation of women has increased considerably from the 1991 and 2011elections. In terms of participation of women in the National Parliament, there is an increase of 17 percentage points, corresponding to a change of 447% (400 %) from 1991 to 2011. a similar behavior can be seen in relation to the participation of women within the Executive Power, where data indicate an increase of 49 percentage points and currently (until October 2015), women account for 55% of governmental positions.
Table 221 - Number and Proportion of seats held by women in national parliament
Year Total seats Women
No %
1985 83 10 12,0
1991 79 3 3,8
2001 72 8 11,1
2006 72 11 15,3
2011 72 15 20,8 Source: National Electoral Commission (NEC)
Table 222 - Number and Proportion of women within the Executive Power
Year Total
(Governmental position)
Women
No %
1991 16 1 6,3
1998 23 5 21,7
2002 17 4 23,5
2004 21 4 19,0
2006 22 7 31,8
2008 20 8 40,0
2011 20 8 40,0
2015 20 11 55,0 Source: National Electoral Commission (NEC and Government of Cabo Verde (www.governo.cv)

Participação Política
221
Political Participation Indicators
On the political participation in the various categories of elections (presidential, legislative and municipal) here are the main indicators (Abstention, proportion of votes of the most voted candidate etc.) as well as the results of the most recent elections (for each category); abstention is a fact that is to be highlighted. In virtually all of the elections held in 2011 and 2012 it is noted that the abstention rate is more than 20% whereas in the electoral constituency of Europe and Rest of World this rate is higher than in the last legislative and presidential elections which registered abstentions rate of 48% and 72%, respectively. The blank and void votes showed a very low percentage in all elections.
Table 223 - Indicators of participation in legislative elections (2011)
Electoral constituency Total votes Abstention
(%) Most voted party (%) Valid Blank Void
Total National 77,5 0,6 0,4 21,9 40,3
Santo Antão 81,4 0,9 0,7 17,7 40,6
S. Vicente 73,1 0,6 0,5 26,4 32,4
S. Nicolau 77,1 0,9 0,9 22,0 34,6
Sal 66,4 0,3 0,4 33,3 30,5
Boa Vista 71,5 0,4 0,7 28,1 37,4
Maio 83,5 0,4 0,3 16,1 33,9
Santiago Norte 79,5 0,7 0,3 19,8 43,3
Santiago Sul 79,1 0,5 0,4 20,4 42,9
Fogo 78,6 0,4 0,1 21,0 49,7
Brava 76,0 0,9 0,5 23,0 39,2
Total Foreign 59,5 0,6 0,4 39,9 33,8
Africa 69,9 1,2 0,5 28,9 45,4
Americas 76,6 0,7 0,4 22,8 49,6 Europe and rest of the
world 51,4 0,4 0,4 48,1 25,9
Total 75,4 0,6 0,4 24,0 52,0 Source: O.B. 7 - Series I of February 19, 2011

Participação Política
222
Table 224 - Indicators of participation in the 2nd round of the presidential elections by electoral constituency (2011)
Electoral constituency Total votes Abstention
(%) Most voted party (%) Valid Blank Void
Total National 62,2 0,5 0,3 37,1 54,3
Santo Antão 64,3 0,7 0,4 34,6 53,6
S. Vicente 53,5 0,7 0,3 45,5 54,3
S. Nicolau 63,4 1,3 0,4 34,8 59,8
Sal 50,2 0,6 0,1 49,0 60,0
Boa Vista 36,9 0,7 0,1 62,3 63,5
Maio 68,2 0,1 0,2 31,5 62,5
Santiago Norte 67,1 0,3 0,3 32,3 53,4
Santiago Sul 65,1 0,5 0,2 34,2 57,0
Fogo 64,9 0,2 0,1 34,8 39,6
Brava 65,0 0,1 0,4 34,5 53,0
Total Foreign 37,1 0,3 0,2 62,4 45,5
America 53,7 0,4 0,2 45,7 40,8
Africa 57,8 0,3 0,5 41,5 32,7 Europe and rest of the
world 27,3 0,3 0,2 72,2 52,7
TOTAL 59,1 0,5 0,3 40,1 53,6
Source: O.B. No. 29 - I Series 2nd Supplement, of September 4, 2011 / Notice No 3 / PR / CNE / 2011 Table 225 - Indicators of participation in local elections by electoral constituency (2012)
Electoral constituency Total votes Abstention
(%) Most voted party (%) Valid (%) Void (%) Blank (%)
Paul 99 2 1 18 55
Ribeira Grande 98 1 2 26 62
Porto Novo 99 2 1 23 41
S. Vicente 99 2 1 38 44
Ribeira Brava 98 2 2 22 42
Tarrafal S. Nicolau 98 2 2 24 51
Sal 99 1 1 38
Boa Vista 99 2 1 32 59
Maio 99 2 1 23 54
Praia 99 1 1 38 63
Ribeira Grande de Santiago 99 1 1 19 53
S. Domingos 99 2 1 20 53
Santa Cruz 99 1 1 24 44
S. Lourenço dos Órgãos 99 2 1 19 37
Santa Catarina 97 1 2 26
S. Salvador do Mundo 98 1 2 22 40
S. Miguel 99 1 1 26 53
Tarrafal 99 2 1 28 53
Mosteiros 99 1 1 27 28
S. Filipe 99 1 30
Santa Catarina do Fogo 99 1 1 18 46
Brava 99 1 1 24 54
Total 99 1 31 46
Source: O. B. No. 45 - Series I of August 1, 2012

Participação Política
223
Election Results
Table 226 - Results of the 2nd round of elections for President of the Republic (2011)
Electoral constituency No of
Registered No of Voters
Total votes Abstention
Vote
Valid Blank Void JCF MIS
Total National 267.676 168.478 166.418 1.377 683 99.198 91.498 74.920
Santo Antão 27.216 17.800 17.508 196 96 9.416 9.533 7.975
S. Vicente 46.198 25.170 24.707 333 130 21.028 13.667 11.040
S. Nicolau 8.268 5.388 5.246 105 37 2.880 3.223 2.023
Sal 14.146 7.212 7.104 91 17 6.934 4.325 2.779
Boa Vista 4.457 1.681 1.644 33 4 2.776 1.067 577
Maio 4.259 2.918 2.905 5 8 1.341 1.823 1.082
Santiago Norte 58.850 39.824 39.475 187 162 19.026 21.260 18.215
Santiago Sul 79.781 52.494 51.921 387 186 27.287 29.927 21.994
Fogo 20.675 13.485 13.420 36 29 7.190 5.346 8.074
Brava 3.826 2.506 2.488 4 14 1.320 1.327 1.161
Total foreign 36.945 13.885 13.696 105 84 23.060 6.237 7.459
America 8306 4514 4463 31 20 3792 1840 2623
Africa 4610 2698 2665 12 21 1912 883 1782 Europe and rest of the
world 24029 6673 6568 62 43 17356 3514 3054
TOTAL 304.621 182.363 180.114 1.482 767 122.258 97.735 82.379
59.9% 59.1% 0.5% 0.3% 40.1% 54.3% 45.7%
Source: O. B. No. 29 - I Series 2nd Supplement, of September 4, 2011 / Notice No 3 / PR / CNE / 2011 JCF - Jorge Carlos de Almeida Fonseca MIS - Manuel Inocêncio Sousa

Participação Política
224
Table 227 - Results of legislative elections (2011)
Electoral constituency No of
Registered No of Voters
Total votes Abstention MPD PAICV UCID PSD PTS
Valid Blank Void
Total National 264.220 206.292 204.752 1.540 1.103 57.928 86.342 106.354 9.484 429 1.040
Santo Antão 26.559 21.852 21.626 226 191 4.707 9.814 10.788 667 0 166
S. Vicente 45.802 33.728 33.465 263 215 12.074 11.541 14.835 6.297 73 504
S. Nicolau 8.113 6.326 6.255 71 71 1.787 3.172 2.809 163 0 40
Sal 14.229 9.496 9.454 42 55 4.733 4.424 4.343 632 0 0
Boa Vista 4.428 3.182 3.165 17 31 1.246 1.434 1.658 0 0 42
Maio 4.128 3.463 3.448 15 11 665 2.037 1.400 0 0 0
Santiago Norte 58.158 46.668 46.234 434 199 11.490 19.793 25.196 565 193 288
Santiago Sul 78.751 62.657 62.296 361 287 16.094 27.116 33.754 976 163 0
Fogo 20.311 16.041 15.964 77 26 4.270 5.706 10.104 128 0 0
Brava 3.741 2.879 2.845 34 17 862 1.305 1.467 56 0 0
Total Foreign 34.347 20.650 20.448 202 145 13.697 8.332 11.613 358 0 0
Africa 4.196 2.983 2.932 51 21 1.213 1.006 1.905 0 0 0
Americas 7.994 6.175 6.120 55 33 1.819 2.054 3.965 68 0 0
Europe and rest of the world 22.157 11.492 11.396 96 91 10.665 5.272 5.743 290 0 0
TOTAL 298.567 226.942 225.200 1.742 1.248 71.625 94.674 117.967 9.842 429 1.040
76,0% 75,4% 0,6% 0,4% 24,0% 41,7% 52,0% 4,3% 0,2% 0,5%
Source: O B. No 7 - Series I of February 19, 2011

Participação Política
225
Table 228 - Election results for the Municipal Councils according to political parties / groups by electoral constituency (2012)
Electoral constituency No of
registered No of Voters
Total votes Abstention FV. BV GIASF GIMCS GIUDS GUS/SM MPD PAICV PTS PRSC UCID UNISC
Valid votes
Void
Blank
Paul 4.916 4.046 4.000 46 60 915 0 0 0 0 0 2.235 1.705 0 0 0 0
Ribeira Grande 12.168 8.866 8.698 168 102 3.115 0 0 0 0 0 5.507 2.632 0 457 0
Porto Novo 11.447 8.863 8.783 80 174 2.582 0 0 0 0 0 3.674 7.935 0 0 0 0
S. Vicente 47.570 29.723 29.495 228 530 17.847 0 0 0 0 0 12.997 8.905 504 0 6.559 0
Ribeira Brava 5.069 3.951 3.887 64 112 1.145 0 0 0 0 0 1.651 2.000 0 0 124 0
Tarrafal S. Nicolau 3.620 2.736 2.693 43 56 884 0 0 0 0 0 1.392 1.245 0 0 0 0
Sal 14.883 9.171 9.062 109 122 5.712 0 0 4.891 0 0 0 3.678 0 0 371 0
Boa Vista 5.658 3.874 3.823 51 75 1.784 343 0 0 0 0 2.298 1.107 0 0 0 0
Maio 4.430 3.413 3.371 42 52 1.017 0 0 0 0 0 1.938 1.480 0 0 0 0
Praia 70.709 43.906 43.573 333 466 26.803 0 0 0 0 0 27.483 15.213 122 0 289 0
Ribeira Grande de Santiago 4.997 4.031 3.988 43 35 967 0 0 0 0 0 2.128 1.825 0 0 0 0
S. Domingos 7.922 6.360 6.284 76 108 1.562 0 0 0 0 0 3.386 2.790 0 0 0 0
Santa Cruz 13.738 10.481 10.349 132 151 3.257 0 0 0 0 0 4.579 5.312 0 0 0 307
S. Lourenço dos Órgãos 4.701 3.794 3.746 48 62 906 0 0 0 0 0 1.389 2.295 0 0 0 0
Santa Catarina 21.546 15.864 15.423 241 200 5.682 0 0 0 0 0 7.504 7.473 0 446 0 0
S. Salvador do Mundo 4.843 3.784 3.723 61 48 1.059 0 0 0 0 0 1.500 2.175 0 0 0 0
S. Miguel 8.469 6.246 6.175 71 85 2.222 0 0 0 0 231 3.322 2.469 68 0 0 0
Tarrafal 9.698 6.992 6.891 101 116 2.706 0 0 0 0 0 3.692 3.083 0 0 0 0
Mosteiros 5.594 4.075 4.054 21 35 1.519 0 0 0 0 0 1.134 2.885 0 0 0 0
S. Filipe 13.172 9.167 9.118 49 61 4.006 0 3.179 0 2.544 0 0 3.334 0 0 0 0
Santa Catarina do Fogo 3.063 2.504 2.483 21 13 559 0 0 0 0 0 1.155 1.315 0 0 0 0
Brava 4.121 3.128 3.087 41 30 993 0 0 0 0 0 1.674 1.383 0 0 0 0
Total 282.406 194.975 192.906 2.069 2.693 87.241 343 3.179 4.891 2.544 231 90.539 79.239 694 446 7.800 307
98,9% 0,7% 1,0% 30,9% 0,2% 1,6% 2,5% 1,3% 0,1% 46,4% 40,6% 0,4% 0,2% 4,0% 0,2%
Source: O. B. Series I no 45 of August 1st 2012
