statistical notes and tables · 2014-10-02 · statistical notes and tables the statistical...
TRANSCRIPT

Statistical notes and tables
The statistical appendix presents selected economic indicators for 43 developing member countries (DMCs) of the Asian Development Bank (ADB) in a total of 23 tables. These tables can generally be classified into the following accounts, namely: national accounts, both production and demand sides; labor (unemployment); prices; money supply; components of the balance of payments; external debt and debt service; exchange rates; international liquidity (gross international reserves); and government finance. The DMCs are grouped into five subregions: Central Asia, East Asia, South Asia, Southeast Asia, and the Pacific.
These tables contain historical data from 2001 to 2005. Forecasts for 2006 to 2007 are also provided in the following tables: growth rate of GDP (A1), growth rate of per capita GDP (A2), inflation (A8), growth rate of merchandise exports (A10), growth rate of merchandise imports (A12), trade balance (A13), current account balance (A14), and current account balance as percent of GDP (A15).
As much as possible, efforts were undertaken to standardize the data to allow comparability over time and across DMCs. However, limitations exist because of differences in statistical methodology, definitions, coverage, and practices. A discussion of the sources, definitions, scope, and nature of data in the 23 tables, as well as the methodology for the computation of regional and subregional averages/totals, follows.
Historical data are obtained from official sources, statistical publications, secondary publications, other working papers, and documents of the Asian Development Bank (ADB), International Monetary Fund (IMF), and World Bank. Projections for 2006 and 2007 are generally staff estimates, although for a few countries some projections are in accord with government economic programs agreed with IMF. Data in the tables are reported either on a calendar year or fiscal year basis. The DMCs that record most of their accounts on a calendar year basis (except for government finance data, which are reported on a fiscal year basis) are: Armenia; Azerbaijan; Hong Kong, China; Kazakhstan; Kyrgyz Republic; Lao People’s Democratic Republic (Lao PDR); Samoa; Taipei,China; Tajikistan; Thailand; Democratic Republic of Timor-Leste; and Uzbekistan. Palau reports government finance and balance-of-payments data on a fiscal year basis. Some countries record the majority of their accounts on a fiscal year basis, with some of their accounts recorded on a calendar year basis, e.g., GDP data for Bhutan.
Regional and subregional averages/totals for DMCs are provided for nine economic indicator tables. Data for Afghanistan, Myanmar, and Nauru are excluded from the computation of subregional averages/totals due to measurement problems. Out of the nine economic indicator tables, six have regional and subregional averages (A1, A2, A8, A10, A12, and A15). Where there are missing data for a given year, regional and

Asian Development Outlook 2006 30�
subregional averages are computed on the basis of available information only. Meanwhile, regional and subregional totals are incorporated in three tables (A11, A13, and A14) except that in Table A11, subregional totals are represented in terms of percentage shares of the subregions’ exports to DMCs (excluding PRC), PRC, Japan, United States (US), and the rest of the world. For four tables, (A1, A2, A8, and A15), levels of gross national income (GNI) in current US$ using the World Bank Atlas method are used as weights to calculate the subregional and regional averages. Tables on growth rates of merchandise exports and imports (A10 and A12) do not incorporate weights in the computation of averages; regional and subregional averages in these two tables are computed on the basis of a consistent sum, which means that if there are missing country data for a given year, the sum of the prior year used for computing the growth rate excludes the corresponding country data.
The GNI data, in current US$, for DMCs from 2001 to 2004 were obtained from the World Bank Group WDI Data Query (http://devdata.worldbank.org/data-query/). The most recent data, 2004, are also used to derive the weights for the computation of regional and subregional averages for 2005 to 2007. The GNI data, in current US$, for three of the DMCs are unavailable, namely Cook Islands; Taipei,China; and Tuvalu. For these economies, GNI data are estimated.
Six tables (A1, A2, A3, A4, A5, and A7) refer to the national income accounts. They show output and sector growth rates, as well as gross domestic investment (GDI) as a percentage of GDP. Definitions relating to output growth, production, and demand, are generally based on the United Nations System of National Accounts. The national income accounts data series for the People’s Republic of China (PRC) was revised starting in 1993 as a result of the new economic census conducted in 2004. Similarly, the national income accounts series for Bhutan and India have been revised to reflect their adoption of new base years.
Sector shares of agriculture, industry, and services for 2004 are, respectively, presented in Tables A3 to A5. Sector shares are computed based on constant prices. For Hong Kong, China, import duties and taxes net of imputed bank service charges are added to the services sector only for the computation of the sector shares to obtain a 100% sum for all sectors. For Samoa, imputed bank service charges are added to the services sector.
For Azerbaijan, Bhutan, Cambodia, Cook Islands, Fiji Islands, Republic of Korea, Kyrgyz Republic, Lao PDR, Maldives, Nepal, Solomon Islands, Tonga, and Vanuatu, the calculation of sector shares is based on the share of each sector to the sum of gross value added.
For Armenia, Bangladesh, and Papua New Guinea, import duties and taxes are excluded in the sector data but are also netted out in the total GDP level so that the sector shares still add up to 100%.
Gross domestic investment (GDI) from the expenditure side of the national income accounts is also presented in Table A7. This represents final expenditures on investment at purchasers’ prices. It is presented as a percentage of GDP, valued at current prices.
The following paragraphs examine the tables in more detail.Table A1: Growth rate of GDP (% per year). This shows annual growth
rates of GDP valued at constant market prices, factor costs, or basic

306 Asian Development Outlook 2006
prices. GDP at market prices is the aggregation of the value added of all resident producers at producers’ prices including taxes less subsidies on imports plus all nondeductible value-added or similar taxes. Factor cost measures differ from market price measures in that they exclude taxes on production and include subsidies. Basic price valuation is the factor cost plus some taxes on production, such as property and payroll taxes, and less some subsidies, such as labor-related subsidies but not product-related subsidies. Most DMCs use constant market price valuation. South Asian countries predominantly use constant factor costs, including Bhutan, India, Nepal, Pakistan, and Sri Lanka, while the Maldives’ GDP valuation is at basic prices. Among the Pacific countries, Fiji Islands, and Solomon Islands employ constant factor cost valuation. For Hong Kong, China, the computations of real GDP and sector growth rates are based on volume indexes, while GDP sector growth rates for Solomon Islands are based on GDP production indexes. Growth forecasts for Cook Islands, Fiji Islands, and Vanuatu adopt official government projections.
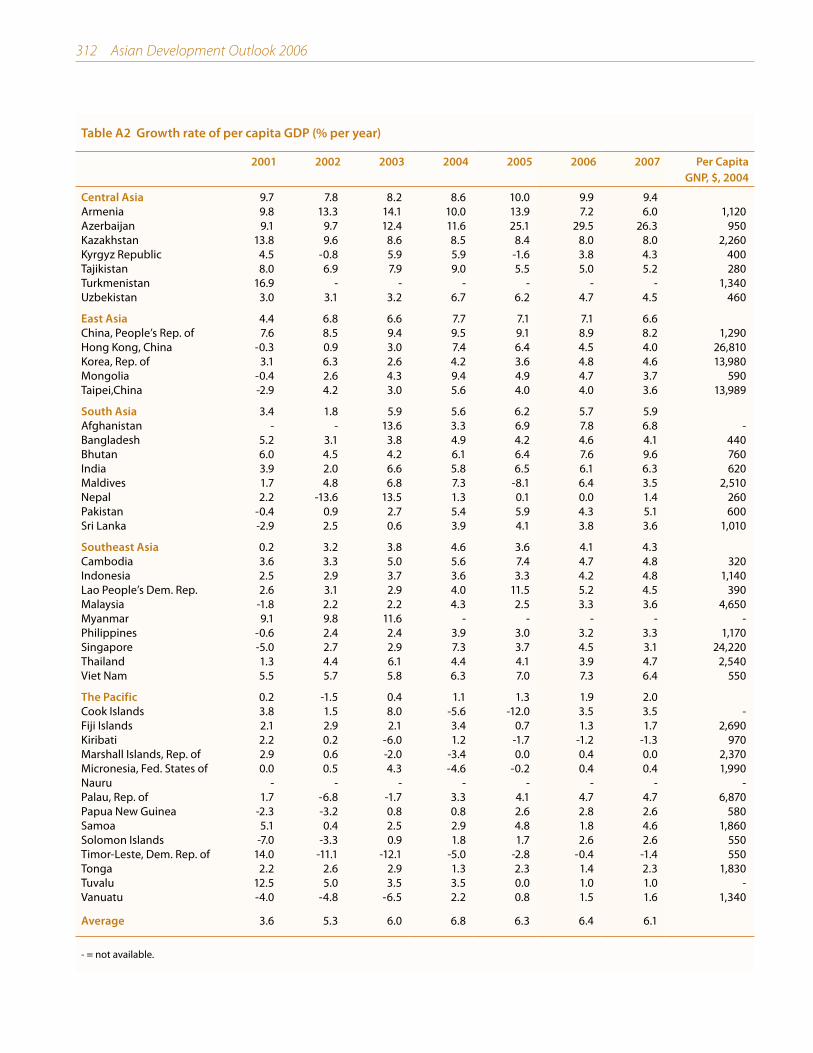
Table A2: Growth rate of per capita GDP (% per year). The table provides the growth rates of real per capita GDP, which is defined as GDP at constant prices divided by the population. Data on per capita gross national product in US$ terms for 2004, sourced from the World Bank, are also shown.
Table A3: Growth rate of value added in agriculture (% per year). The table shows the growth rates of value added in agriculture and its corresponding share in 2004. The agriculture sector includes agricultural crops, livestock, poultry, fisheries, and forestry.
Table A4: Growth rate of value added in industry (% per year). The table provides the growth rates of value added in industry and its corresponding share in 2004. This sector includes the manufacturing and nonmanufacturing subsectors. Mining and quarrying, construction, and utilities fall under the latter subsector.
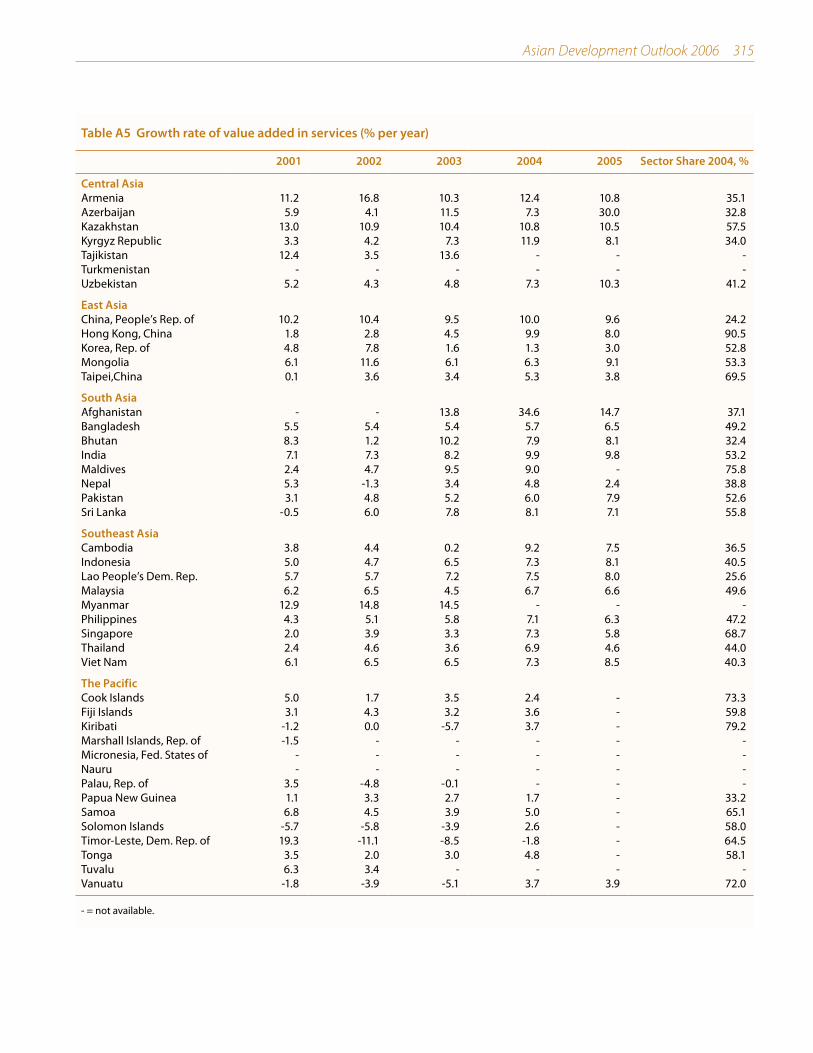
Table A5: Growth rate of value added in services (% per year). The table gives the growth rates of value added in services, as well as its corresponding share in 2004. Subsectors include trade, banking, finance, real estate, public administration, and other services. For Uzbekistan, construction is included in services while for Tajikistan, trade and other items are included in services.
Table A6: Unemployment rate (%). The unemployment rate is the percentage of the labor force that actively seeks work but is unable to find work at a given time. The age of the working population ranges from 18 to 65, except for Bangladesh where the labor force includes those aged 10 and above. In the case of the Philippines, a previous definition of unemployment is used to maintain historical consistency. Under that definition, unemployment was based on only two criteria: (i) without a job or business and (ii) looking for work (including those not seeking work for valid reasons). The new definition (which took effect only in April 2005) introduced “availability for work” as a third criterion. The unemployment rates of the PRC and Viet Nam refer to unemployment in urban areas only.
Table A7: Gross domestic investment (% of GDP). This table provides the ratio of GDI to GDP. GDI is the sum of gross fixed capital formation plus changes in inventories. Gross fixed capital formation is measured by
Asian Development Outlook 2006 30�
the total value of a producer’s acquisitions, less disposals, of fixed assets in a given accounting period. Additions to the value of nonproduced assets, e.g., land, form part of gross fixed capital formation. Inventories are stocks of goods held by institutional units to meet temporary or unexpected fluctuations in production and sales. For India, GDI includes valuables and errors and omissions.
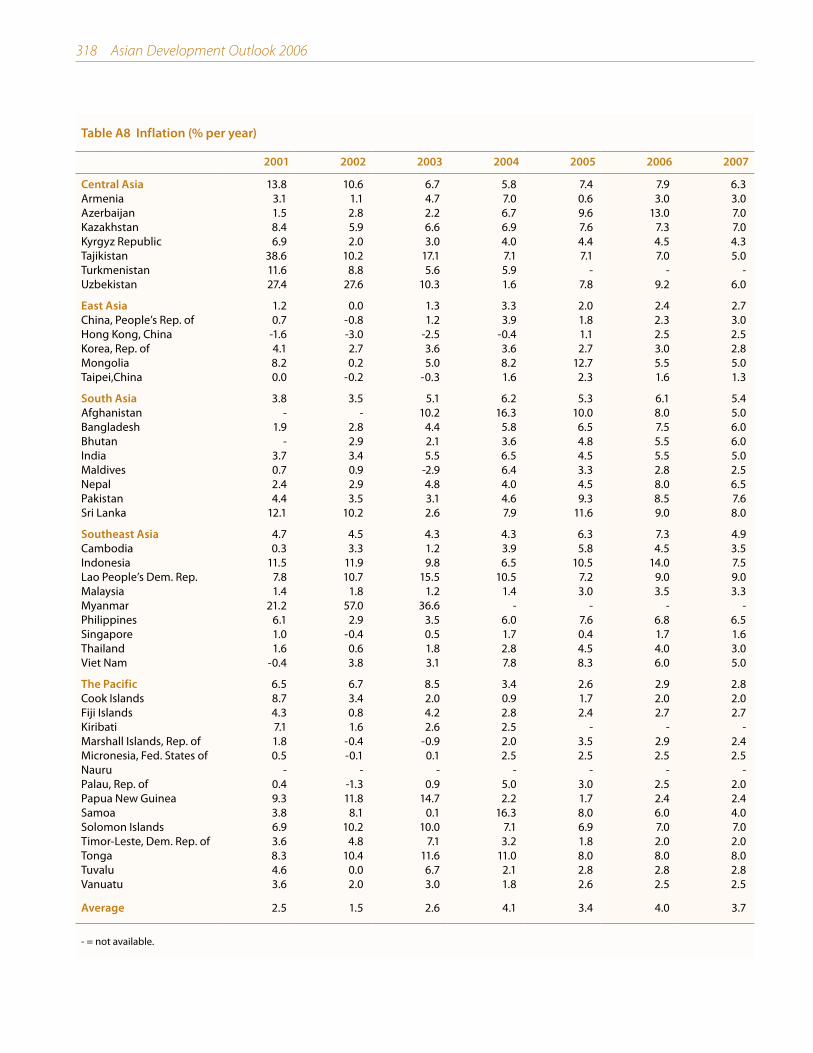
Table A8: Inflation (% per year). Data on inflation rates represent period averages. Except for India, which reports the wholesale price index, and Kiribati, which use the retail price index, annual inflation rates presented are based on consumer price indexes. Data for 2005 for India is as of February 2006. The consumer price indexes of the following countries are for a given city or group of consumers only: Cambodia is for Phnom Penh, Kiribati is for Tarawa, Republic of Marshall Islands is for Majuro, and Nepal is for urban consumers.
Table A9: Growth in money supply (% per year). This table tracks the annual percentage change in the end-of-period supply of broad money as represented by M2 (for most DMCs). M2 is defined as the sum of M1 and quasi-money where M1 denotes currency in circulation plus demand deposits and quasi-money consists of time and savings deposits including foreign currency deposits. For Korea, M2 includes transferable savings deposits. For Sri Lanka, money supply (M2b) includes time and savings deposits held by commercial banks’ foreign currency banking units. In the case of Turkmenistan, M2 excludes deposits in foreign currency. For India and Philippines, broad money is represented by M3, defined as M2 plus other assets that are less liquid than what would be classified under M2 and M1. For India, M3 includes deposits with the Reserve Bank of India and growth rate for 2005 is as of 3 March 2006. For Timor-Leste, M2 excludes currency holdings by the public, for which data are not available. The 2005 data for Kazakhstan is as of end-November only.
Tables A10, A12, A13, A14, A15, A16: Balance of payments. This set of tables primarily contains items from the balance of payments (BOP). These items cover the annual flows recorded in the BOP account. Data for the Philippines have been revised to conform to international standards. Major revisions involve valuation adjustments of imports under consignment arrangement; adoption of residency criterion for overseas Filipino workers and adjustments to account for remittances channeled outside the banking system; and use of survey-based data to estimate trade credits under the “other investment” account.
Tables A10 and A12: Growth rates of merchandise exports and imports (% per year). The annual growth rates of exports and imports, in terms of merchandise goods only, are shown in these tables. Data are in million US$, primarily obtained from the balance-of-payments accounts of each DMC, except for Fiji Islands where data are sourced from Overseas Merchandise Trade statistics. Exports in general are reported on a free-on-board (f.o.b.) basis. In this case, exports are valued at the customs frontier of the exporting country plus export duties and the costs of loading the goods onto the carrier unless the latter is borne by the carrier. It excludes the cost of freight and insurance beyond the customs frontier. Import data are reported either on an f.o.b. or c.i.f. (cost, insurance, freight) basis. On a c.i.f. basis, the value of imports includes the cost of international freight and insurance up to the customs frontier of the
30� Asian Development Outlook 2006
importing country. It excludes the cost of unloading the goods from the carrier unless it is borne by the carrier.
For East Asia, all economies report imports on an f.o.b. basis except Mongolia, which records them on a c.i.f. basis. Imports are valued on an f.o.b. basis for Indonesia, Malaysia, and Viet Nam while the rest of the Southeast Asian countries’ imports are valued on a c.i.f. basis. Afghanistan, Bhutan, and India record imports on a c.i.f. basis while Bangladesh, Maldives, Nepal, Pakistan, and Sri Lanka value imports on an f.o.b. basis. For most of the Central Asian republics, namely Armenia, Azerbaijan, Kyrgyz Republic, Kazakhstan, Tajikistan and Uzbekistan, all imports are reported on an f.o.b. basis. The 2005 data on merchandise exports and imports for Armenia are estimated based on the actual figure for the first three quarters of the year, while for Tajikistan, exports and imports data are based on projections. Most of the Pacific countries report imports on an f.o.b. basis. The only countries that record imports on a c.i.f. basis are Fiji Islands, Papua New Guinea, and Timor-Leste.
Table A11: Direction of exports (% of total). Data from this table are sourced from IMF, Direction of Trade and Statistics, CD-ROM (January 2006). This table shows the exports of ADB’s DMCs, except Taipei,China of which data on exports were sourced from CEIC Data Company Ltd. This table shows the percentage share of exports of each DMC to developing Asia excluding the PRC; PRC only; US; Japan; European Union (EU); and others (or rest of the world). The rest of the world is derived as total exports of DMCs to the world minus their exports among themselves and to US, Japan, and EU.
Table A13: Trade balance (US$ million). The trade balance is the difference between merchandise exports and merchandise imports. Figures on this table are based on the exports and imports levels used to generate Tables A10 and A12. For Samoa, data for 2004 are as of September only.
Table A14: Current account balance (US$ million). The current account balance is the sum of the balance of trade for merchandise, net trade in services and factor income, and net transfers. In the case of Mongolia, Cambodia, Lao PDR, Viet Nam, and Bangladesh, official transfers are excluded from the current account balance. The 2005 data for Armenia is estimated based on the actual figure for the first three quarters of the year; while data for Tajikistan is based on projection.
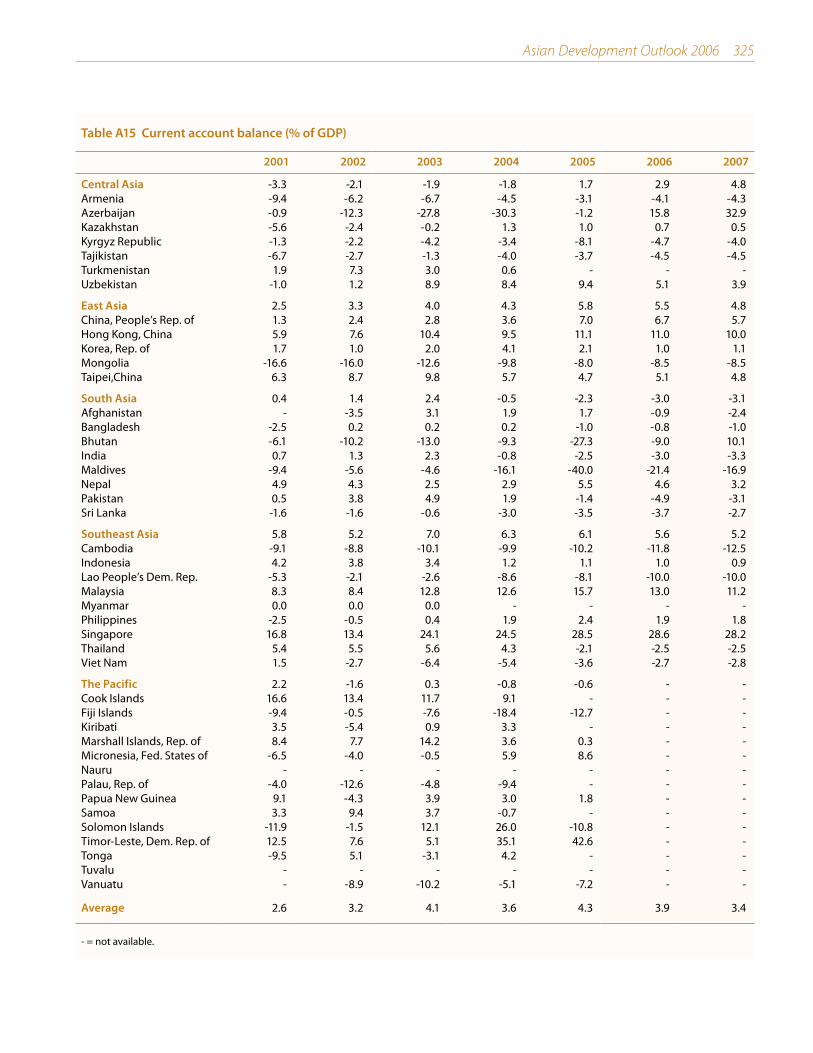
Table A15: Current account balance (% of GDP). The values reported in Table 14 are divided by GDP at current prices in US$. In the case of Bhutan, GDP for the previous calendar year is used as the denominator.
Table A16: Foreign direct investment (US$ million). Foreign direct investment refers to equity capital, reinvested earnings, investment in debt securities, and other capital associated with the transactions of the enterprises, net of repatriations and intercompany loan repayments. For the PRC, foreign direct investment refers to investments of foreign enterprises, economic organizations, and individuals through joint ventures and cooperation; reinvested earnings; and enterprises’ borrowings from abroad under approved investment projects. The series was revised to reflect actually utilized foreign direct investment. Data on foreign direct investment for Korea comprise equity purchases and long-term intercompany loans. In the case of the Lao PDR, gross capital

Asian Development Outlook 2006 30�
flows, instead of net capital flows, are presented. For Bangladesh, only those capital investments passing through banking channels are reported. Data for the Maldives are derived from the United Nations Conference on Trade and Development (UNCTAD) database and refer to gross inflows. The 2005 data for Armenia and Kyrgyz Republic cover only the first three quarters of the year, while the figure for Tajikistan is based on projection.
Table A17: External debt outstanding (US$ million). For most DMCs, external debt outstanding—public and private—includes medium- and long-term debt, short-term debt, and IMF credit. The external debt reported by Cambodia also excludes that owed to the Russian Federation and the US. For Samoa, the figure for 2005 is as of June 2005, while for India, the figure for 2005 is as of September 2005. The 2005 data for Armenia is estimated based on the actual figure for the first three quarters of the year. In the case of Kazakhstan, total external debt includes intracompany debt and its figure for 2005 is as of end-September.
Table A18: Debt service ratio (% of exports of goods and services). This table presents the total debt service payments of each DMC as a percentage of exports of goods and services. Total debt service payments comprise principal repayments (excluding on short-term debt) and interest payments on outstanding external debt. For Taipei,China, the debt service refers to external public debt only. Exports of goods are used as the denominator in the calculation of the ratio for PRC, Mongolia, Pakistan, Papua New Guinea, and Viet Nam. For the Philippines, exports of goods, services, and income are used as the denominator in the calculation of the ratio. For Bangladesh, the ratio represents debt service payments on medium- and long-term loans as a percentage of exports of goods, nonfactor services, and workers’ remittances. For Azerbaijan, the ratio represents public and publicly guaranteed external debt service payments as a percentage of exports of goods and nonfactor services.
Table A19: Exchange rates to the US dollar (annual average). The annual average exchange rates of the DMCs are quoted in local currencies per US dollar. Data for Cook Islands are end-period rates, except in 2005 where the exchange rate is as of November only.
Table A20: Gross international reserves (US$ million). Gross international reserves (GIR) are defined as the US$ value of holdings of special drawing rights (SDR), reserve position in the IMF, foreign exchange, and gold at the end of a given period. Most DMCs report GIR without gold. However, for Southeast Asian countries, gold is included in the computation of gross international reserves. For a few countries, GIR data are reported as of the end of the fiscal year. For the PRC, and for Taipei,China, GIR refers to foreign exchange reserves only. For India, GIR refers to foreign currency assets, and data for 2005 is as of 10 March 2006 only. For Maldives, GIR comprises foreign assets of the Maldives Monetary Authority. For Pakistan, GIR consists of net foreign reserves with the State Bank of Pakistan. For Azerbaijan, GIR includes Oil Fund assets. GIR data for Marshall Islands, Samoa, Solomon Islands, Tonga, and Vanuatu refer to gross official foreign exchange reserves. For Kiribati, GIR refers to total official external assets. In the case of Papua New Guinea, GIR includes the Bank of Papua New Guinea’s holdings of gold. The 2005 data for Tajikistan and Turkmenistan are staff estimates.
Tables A21, A22, and A23: Government finance. This set of tables refers

310 Asian Development Outlook 2006
to the revenue and expenditure transactions as well as the fiscal balance of the central government. For PRC, India, Mongolia, Kazakhstan, and Tajikistan, transactions are those reported by the general government. The shares of these major fiscal items as against GDP are calculated for this group of tables. For Bhutan, ratios are calculated relative to the previous calendar year’s GDP. The 2005 data for Tajikistan covers the period January–October only.
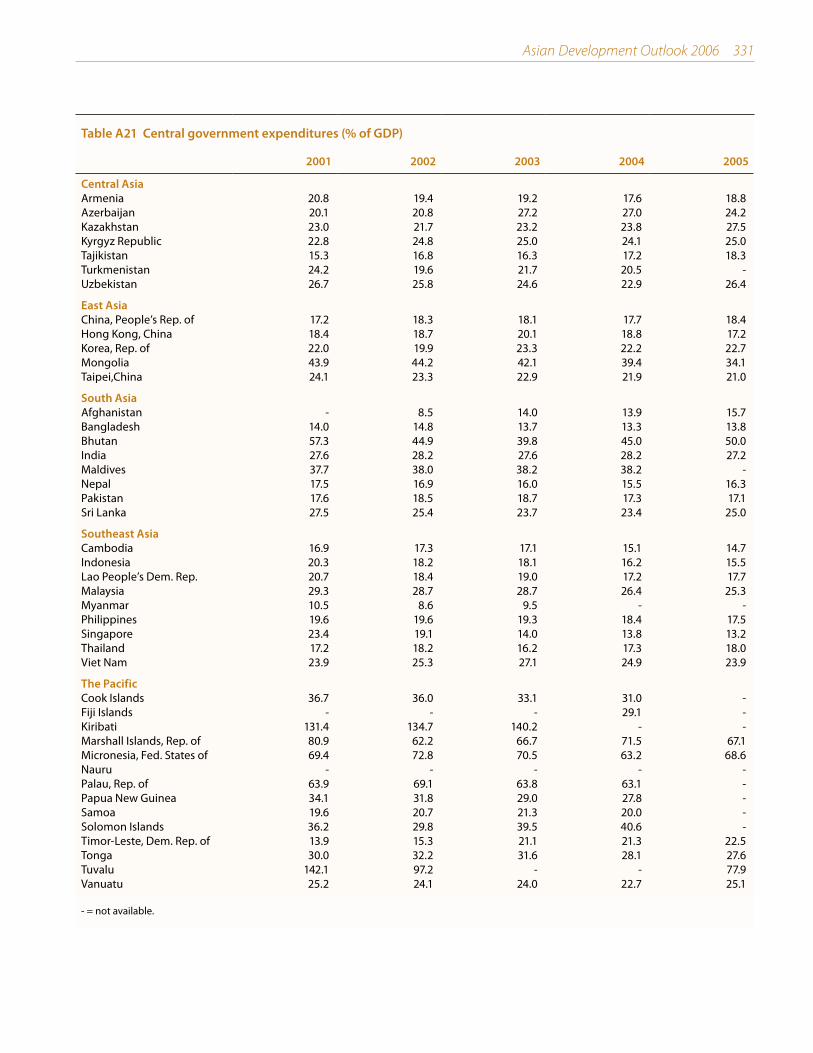
Table A21: Central government expenditures (% of GDP). Central government expenditures comprise all nonrepayable payments to both current and capital expenses, plus net lending. These amounts are computed as a share of GDP at current prices. For Singapore, expenditures refer to outlays made from the Consolidated Revenue Account, Development Fund Account, and Sinking Fund Account plus lending minus repayments. For Thailand, expenditures refer to budgetary expenditures excluding externally financed expenditures and corresponding borrowing. For Bangladesh, expenditures include a residual. One-time expenditures are excluded but a statistical discrepancy is included for Pakistan. For Tuvalu, Tuvalu Trust Fund transfers are excluded.
Table A22: Central government revenues (% of GDP). Central government revenues comprise all nonrepayable receipts, both current and capital, plus grants. These amounts are computed as a percentage of GDP at current prices. For Korea, revenues incorporate the repayment on government-guaranteed debts but exclude social security contributions. For Singapore, revenues refer to receipts credited to Consolidated Revenue Account, Development Fund Account, and Sinking Fund Account, including investment income, capital receipts, and investment adjustments. In some countries, other revenue items are included or excluded in the reported revenue figures: grants are excluded for Cambodia, Lao PDR, Malaysia, Singapore, Thailand, and Viet Nam; capital receipts are excluded but revenues from disinvestment are included for India; current revenues only are included for Bangladesh and Pakistan; grants and privatization proceeds are excluded for Sri Lanka; and Consolidated Investment Fund drawdowns are excluded for Tuvalu. For Kazakhstan, privatization proceeds are treated as financing items rather than revenues in 2002.
Table A23: Fiscal balance of central government (% of GDP). Fiscal balance is the difference between central government revenues and expenditures presented in nominal local currency. The difference is also computed as a share of GDP. Data variations may arise due to statistical discrepancies, e.g., balancing items for both central and local governments, and differences in the concept used in the individual computations of revenues and expenditures as compared with the calculation of the fiscal balance. For Thailand, the fiscal balance is a cash balance composed of the budgetary balance and nonbudgetary balance. Some off-budget accounts are included in the computation of the fiscal balance for Turkmenistan.
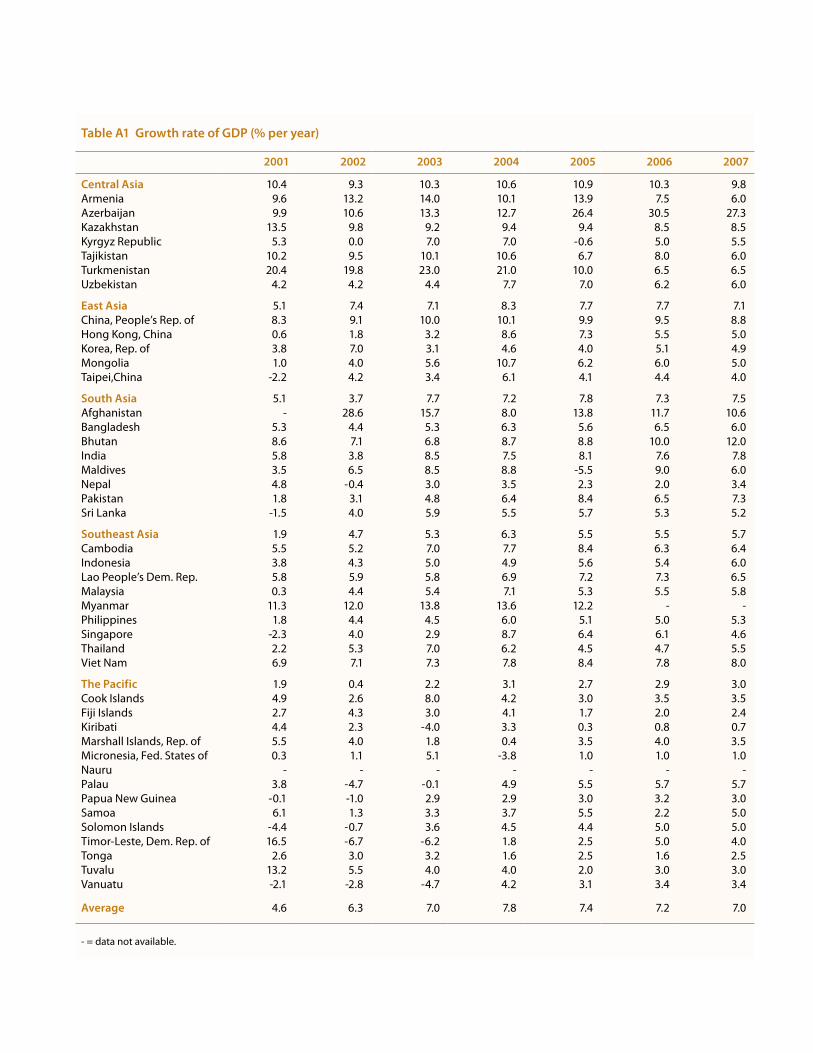
Table A1 Growth rate of GDP (% per year)
2001 2002 2003 2004 2005 2006 2007
Central Asia 10.4 9.3 10.3 10.6 10.9 10.3 9.8 Armenia 9.6 13.2 14.0 10.1 13.9 7.5 6.0 Azerbaijan 9.9 10.6 13.3 12.7 26.4 30.5 27.3 Kazakhstan 13.5 9.8 9.2 9.4 9.4 8.5 8.5 Kyrgyz Republic 5.3 0.0 7.0 7.0 -0.6 5.0 5.5 Tajikistan 10.2 9.5 10.1 10.6 6.7 8.0 6.0 Turkmenistan 20.4 19.8 23.0 21.0 10.0 6.5 6.5 Uzbekistan 4.2 4.2 4.4 7.7 7.0 6.2 6.0
East Asia 5.1 7.4 7.1 8.3 7.7 7.7 7.1 China, People’s Rep. of 8.3 9.1 10.0 10.1 9.9 9.5 8.8 Hong Kong, China 0.6 1.8 3.2 8.6 7.3 5.5 5.0 Korea, Rep. of 3.8 7.0 3.1 4.6 4.0 5.1 4.9 Mongolia 1.0 4.0 5.6 10.7 6.2 6.0 5.0 Taipei,China -2.2 4.2 3.4 6.1 4.1 4.4 4.0
South Asia 5.1 3.7 7.7 7.2 7.8 7.3 7.5 Afghanistan - 28.6 15.7 8.0 13.8 11.7 10.6 Bangladesh 5.3 4.4 5.3 6.3 5.6 6.5 6.0 Bhutan 8.6 7.1 6.8 8.7 8.8 10.0 12.0 India 5.8 3.8 8.5 7.5 8.1 7.6 7.8 Maldives 3.5 6.5 8.5 8.8 -5.5 9.0 6.0 Nepal 4.8 -0.4 3.0 3.5 2.3 2.0 3.4 Pakistan 1.8 3.1 4.8 6.4 8.4 6.5 7.3 Sri Lanka -1.5 4.0 5.9 5.5 5.7 5.3 5.2
Southeast Asia 1.9 4.7 5.3 6.3 5.5 5.5 5.7 Cambodia 5.5 5.2 7.0 7.7 8.4 6.3 6.4 Indonesia 3.8 4.3 5.0 4.9 5.6 5.4 6.0 Lao People’s Dem. Rep. 5.8 5.9 5.8 6.9 7.2 7.3 6.5 Malaysia 0.3 4.4 5.4 7.1 5.3 5.5 5.8 Myanmar 11.3 12.0 13.8 13.6 12.2 - - Philippines 1.8 4.4 4.5 6.0 5.1 5.0 5.3 Singapore -2.3 4.0 2.9 8.7 6.4 6.1 4.6 Thailand 2.2 5.3 7.0 6.2 4.5 4.7 5.5 Viet Nam 6.9 7.1 7.3 7.8 8.4 7.8 8.0
The Pacific 1.9 0.4 2.2 3.1 2.7 2.9 3.0 Cook Islands 4.9 2.6 8.0 4.2 3.0 3.5 3.5 Fiji Islands 2.7 4.3 3.0 4.1 1.7 2.0 2.4 Kiribati 4.4 2.3 -4.0 3.3 0.3 0.8 0.7 Marshall Islands, Rep. of 5.5 4.0 1.8 0.4 3.5 4.0 3.5 Micronesia, Fed. States of 0.3 1.1 5.1 -3.8 1.0 1.0 1.0 Nauru - - - - - - - Palau 3.8 -4.7 -0.1 4.9 5.5 5.7 5.7 Papua New Guinea -0.1 -1.0 2.9 2.9 3.0 3.2 3.0 Samoa 6.1 1.3 3.3 3.7 5.5 2.2 5.0 Solomon Islands -4.4 -0.7 3.6 4.5 4.4 5.0 5.0 Timor-Leste, Dem. Rep. of 16.5 -6.7 -6.2 1.8 2.5 5.0 4.0 Tonga 2.6 3.0 3.2 1.6 2.5 1.6 2.5 Tuvalu 13.2 5.5 4.0 4.0 2.0 3.0 3.0 Vanuatu -2.1 -2.8 -4.7 4.2 3.1 3.4 3.4
Average 4.6 6.3 7.0 7.8 7.4 7.2 7.0
- = data not available.
312 Asian Development Outlook 2006
Table A2 Growth rate of per capita GDP (% per year)
2001 2002 2003 2004 2005 2006 2007 Per Capita GNP, $, 2004
Central Asia 9.7 7.8 8.2 8.6 10.0 9.9 9.4 Armenia 9.8 13.3 14.1 10.0 13.9 7.2 6.0 1,120 Azerbaijan 9.1 9.7 12.4 11.6 25.1 29.5 26.3 950 Kazakhstan 13.8 9.6 8.6 8.5 8.4 8.0 8.0 2,260 Kyrgyz Republic 4.5 -0.8 5.9 5.9 -1.6 3.8 4.3 400 Tajikistan 8.0 6.9 7.9 9.0 5.5 5.0 5.2 280 Turkmenistan 16.9 - - - - - - 1,340 Uzbekistan 3.0 3.1 3.2 6.7 6.2 4.7 4.5 460
East Asia 4.4 6.8 6.6 7.7 7.1 7.1 6.6 China, People’s Rep. of 7.6 8.5 9.4 9.5 9.1 8.9 8.2 1,290 Hong Kong, China -0.3 0.9 3.0 7.4 6.4 4.5 4.0 26,810 Korea, Rep. of 3.1 6.3 2.6 4.2 3.6 4.8 4.6 13,980 Mongolia -0.4 2.6 4.3 9.4 4.9 4.7 3.7 590 Taipei,China -2.9 4.2 3.0 5.6 4.0 4.0 3.6 13,989
South Asia 3.4 1.8 5.9 5.6 6.2 5.7 5.9 Afghanistan - - 13.6 3.3 6.9 7.8 6.8 - Bangladesh 5.2 3.1 3.8 4.9 4.2 4.6 4.1 440 Bhutan 6.0 4.5 4.2 6.1 6.4 7.6 9.6 760 India 3.9 2.0 6.6 5.8 6.5 6.1 6.3 620 Maldives 1.7 4.8 6.8 7.3 -8.1 6.4 3.5 2,510 Nepal 2.2 -13.6 13.5 1.3 0.1 0.0 1.4 260 Pakistan -0.4 0.9 2.7 5.4 5.9 4.3 5.1 600 Sri Lanka -2.9 2.5 0.6 3.9 4.1 3.8 3.6 1,010
Southeast Asia 0.2 3.2 3.8 4.6 3.6 4.1 4.3 Cambodia 3.6 3.3 5.0 5.6 7.4 4.7 4.8 320 Indonesia 2.5 2.9 3.7 3.6 3.3 4.2 4.8 1,140 Lao People’s Dem. Rep. 2.6 3.1 2.9 4.0 11.5 5.2 4.5 390 Malaysia -1.8 2.2 2.2 4.3 2.5 3.3 3.6 4,650 Myanmar 9.1 9.8 11.6 - - - - - Philippines -0.6 2.4 2.4 3.9 3.0 3.2 3.3 1,170 Singapore -5.0 2.7 2.9 7.3 3.7 4.5 3.1 24,220 Thailand 1.3 4.4 6.1 4.4 4.1 3.9 4.7 2,540 Viet Nam 5.5 5.7 5.8 6.3 7.0 7.3 6.4 550
The Pacific 0.2 -1.5 0.4 1.1 1.3 1.9 2.0 Cook Islands 3.8 1.5 8.0 -5.6 -12.0 3.5 3.5 - Fiji Islands 2.1 2.9 2.1 3.4 0.7 1.3 1.7 2,690 Kiribati 2.2 0.2 -6.0 1.2 -1.7 -1.2 -1.3 970 Marshall Islands, Rep. of 2.9 0.6 -2.0 -3.4 0.0 0.4 0.0 2,370 Micronesia, Fed. States of 0.0 0.5 4.3 -4.6 -0.2 0.4 0.4 1,990 Nauru - - - - - - - - Palau, Rep. of 1.7 -6.8 -1.7 3.3 4.1 4.7 4.7 6,870 Papua New Guinea -2.3 -3.2 0.8 0.8 2.6 2.8 2.6 580 Samoa 5.1 0.4 2.5 2.9 4.8 1.8 4.6 1,860 Solomon Islands -7.0 -3.3 0.9 1.8 1.7 2.6 2.6 550 Timor-Leste, Dem. Rep. of 14.0 -11.1 -12.1 -5.0 -2.8 -0.4 -1.4 550 Tonga 2.2 2.6 2.9 1.3 2.3 1.4 2.3 1,830 Tuvalu 12.5 5.0 3.5 3.5 0.0 1.0 1.0 - Vanuatu -4.0 -4.8 -6.5 2.2 0.8 1.5 1.6 1,340
Average 3.6 5.3 6.0 6.8 6.3 6.4 6.1
- = not available.

Asian Development Outlook 2006 313
Table A3 Growth rate of value added in agriculture (% per year)
2001 2002 2003 2004 2005 Sector Share 2004, %
Central AsiaArmenia 11.7 3.8 4.0 14.5 11.2 22.4 Azerbaijan 1.4 4.0 0.9 3.7 4.6 12.3 Kazakhstan 17.1 3.4 1.4 0.1 6.7 7.9 Kyrgyz Republic 7.3 3.1 3.2 4.1 -4.2 48.5 Tajikistan 9.0 15.7 9.4 - - - Turkmenistan - - - - - - Uzbekistan 4.1 6.0 5.9 10.1 6.6 26.8
East AsiaChina, People’s Rep. of 2.8 2.9 2.5 6.3 5.2 9.5 Hong Kong, China 4.1 -0.7 -5.6 2.8 2.1 0.1 Korea, Rep. of 1.1 -3.5 -5.3 7.4 0.5 4.0 Mongolia -18.3 -12.4 4.9 17.7 7.7 20.9 Taipei,China -1.9 4.7 -0.1 -4.1 -4.1 1.6
South AsiaAfghanistan - - 16.9 -17.1 10.0 38.9 Bangladesh 3.1 0.0 3.1 4.1 2.7 23.1 Bhutan 5.0 3.1 1.7 3.1 3.2 23.5 India 6.2 -6.9 10.0 0.7 2.3 20.8 Maldives 5.1 15.9 1.8 2.7 - 8.8 Nepal 5.5 2.2 2.5 3.9 3.0 38.8 Pakistan -2.2 0.1 4.1 2.2 7.5 23.3 Sri Lanka -3.4 2.5 1.5 -1.8 0.5 17.7
Southeast AsiaCambodia 2.7 -2.8 12.2 -2.0 9.5 32.8 Indonesia 4.1 2.8 4.8 2.1 2.5 15.0 Lao People’s Dem. Rep. 3.8 4.0 2.2 3.5 3.0 47.1 Malaysia -0.6 2.8 5.6 5.0 2.1 7.9 Myanmar 8.7 6.0 11.7 - - - Philippines 3.7 4.0 3.2 4.9 2.0 19.6 Singapore -2.0 -6.3 1.3 12.3 -2.5 0.1 Thailand 3.2 0.7 11.4 -4.8 -2.4 9.3 Viet Nam 3.0 4.2 3.6 4.4 4.0 20.4
The PacificCook Islands -2.9 9.5 28.3 15.1 - 16.7 Fiji Islands -5.8 4.3 -3.9 3.4 - 14.6 Kiribati 13.8 3.8 33.4 11.9 - 9.4 Marshall Islands, Rep. of 5.0 - - - - - Micronesia, Fed. States of - - - - - - Nauru - - - - - - Palau, Rep. of 3.4 -2.5 -1.1 - - - Papua New Guinea -8.5 10.5 2.7 2.8 4.1 27.3 Samoa -3.9 -6.5 -3.5 -6.5 - 12.3 Solomon Islands -9.8 5.6 33.1 14.0 - 32.7 Timor-Leste, Dem. Rep. of 8.7 6.0 -0.4 10.1 - 31.3 Tonga 1.2 3.3 3.8 -3.3 - 25.9 Tuvalu -2.6 -9.4 - - - - Vanuatu 0.5 1.7 -2.6 5.5 -0.8 19.2
- = not available.

31� Asian Development Outlook 2006
Table A4 Growth rate of value added in industry (% per year)
2001 2002 2003 2004 2005 Sector Share 2004, %
Central AsiaArmenia 4.2 22.9 27.6 7.2 7.4 34.1 Azerbaijan 12.3 17.4 19.2 19.2 19.7 55.4 Kazakhstan 13.5 10.4 9.1 10.1 4.6 31.1 Kyrgyz Republic 5.1 -8.3 11.7 3.2 -9.7 17.5 Tajikistan 7.8 12.0 4.9 - - - Turkmenistan - - - - - - Uzbekistan 2.7 3.4 2.8 5.4 4.2 17.1
East AsiaChina, People’s Rep. of 8.4 9.8 12.7 11.1 11.4 66.3 Hong Kong, China -4.2 -3.6 -5.1 -2.7 -0.8 9.4 Korea, Rep. of 3.1 6.4 6.1 9.0 5.6 43.2 Mongolia 15.5 3.8 4.8 15.0 -0.9 25.8 Taipei,China -7.5 5.9 3.8 8.7 5.2 28.8
South AsiaAfghanistan - - 11.9 32.4 16.5 24.0 Bangladesh 7.4 6.5 7.3 7.6 8.4 27.7 Bhutan 13.1 14.4 8.8 12.7 12.0 44.1 India 2.7 7.0 7.6 8.6 9.0 26.0 Maldives 8.1 10.4 8.3 5.0 - 14.5 Nepal 3.2 -2.9 3.3 1.1 1.4 22.4 Pakistan 3.6 2.6 4.7 12.0 10.2 24.1 Sri Lanka -2.1 1.0 5.5 5.4 6.1 26.5
Southeast AsiaCambodia 11.2 17.3 11.9 16.1 8.5 30.7 Indonesia 2.7 4.4 3.8 3.7 4.3 44.5 Lao People’s Dem. Rep. 10.1 10.1 11.5 12.5 13.0 27.3 Malaysia -3.8 4.3 7.1 7.9 3.9 42.5 Myanmar 21.8 35.0 20.7 - - - Philippines -2.5 3.9 3.6 5.2 5.3 33.2 Singapore -9.0 4.0 1.1 10.5 7.8 31.2 Thailand 1.7 7.1 9.5 8.0 5.7 46.7 Viet Nam 10.4 9.5 10.5 10.2 10.6 39.4
The PacificCook Islands 13.3 -0.3 16.2 14.1 - 9.9 Fiji Islands 9.1 2.9 5.1 4.5 - 25.6 Kiribati 25.8 -4.9 -1.1 1.8 - 11.5 Marshall Islands, Rep. of 3.7 - - - - - Micronesia, Fed. States of - - - - - - Nauru - - - - - - Palau, Rep. of 6.3 -5.0 0.5 - - - Papua New Guinea 5.0 -10.2 2.7 2.8 - 39.5 Samoa 12.1 -1.9 6.5 6.0 - 22.6 Solomon Islands -17.4 4.0 4.5 6.0 - 9.3 Timor-Leste, Dem. Rep. of 18.5 -3.4 -4.9 2.2 - 4.2 Tonga 1.2 5.0 2.4 -1.0 - 16.0 Tuvalu 10.3 6.5 - - - - Vanuatu -4.6 -5.9 -3.2 3.5 3.4 8.8
- = not available.
Asian Development Outlook 2006 31�
Table A5 Growth rate of value added in services (% per year)
2001 2002 2003 2004 2005 Sector Share 2004, %
Central AsiaArmenia 11.2 16.8 10.3 12.4 10.8 35.1 Azerbaijan 5.9 4.1 11.5 7.3 30.0 32.8 Kazakhstan 13.0 10.9 10.4 10.8 10.5 57.5 Kyrgyz Republic 3.3 4.2 7.3 11.9 8.1 34.0 Tajikistan 12.4 3.5 13.6 - - - Turkmenistan - - - - - - Uzbekistan 5.2 4.3 4.8 7.3 10.3 41.2
East AsiaChina, People’s Rep. of 10.2 10.4 9.5 10.0 9.6 24.2 Hong Kong, China 1.8 2.8 4.5 9.9 8.0 90.5 Korea, Rep. of 4.8 7.8 1.6 1.3 3.0 52.8 Mongolia 6.1 11.6 6.1 6.3 9.1 53.3 Taipei,China 0.1 3.6 3.4 5.3 3.8 69.5
South AsiaAfghanistan - - 13.8 34.6 14.7 37.1 Bangladesh 5.5 5.4 5.4 5.7 6.5 49.2 Bhutan 8.3 1.2 10.2 7.9 8.1 32.4 India 7.1 7.3 8.2 9.9 9.8 53.2 Maldives 2.4 4.7 9.5 9.0 - 75.8 Nepal 5.3 -1.3 3.4 4.8 2.4 38.8 Pakistan 3.1 4.8 5.2 6.0 7.9 52.6 Sri Lanka -0.5 6.0 7.8 8.1 7.1 55.8
Southeast AsiaCambodia 3.8 4.4 0.2 9.2 7.5 36.5 Indonesia 5.0 4.7 6.5 7.3 8.1 40.5 Lao People’s Dem. Rep. 5.7 5.7 7.2 7.5 8.0 25.6 Malaysia 6.2 6.5 4.5 6.7 6.6 49.6 Myanmar 12.9 14.8 14.5 - - - Philippines 4.3 5.1 5.8 7.1 6.3 47.2 Singapore 2.0 3.9 3.3 7.3 5.8 68.7 Thailand 2.4 4.6 3.6 6.9 4.6 44.0 Viet Nam 6.1 6.5 6.5 7.3 8.5 40.3
The Pacific Cook Islands 5.0 1.7 3.5 2.4 - 73.3 Fiji Islands 3.1 4.3 3.2 3.6 - 59.8 Kiribati -1.2 0.0 -5.7 3.7 - 79.2 Marshall Islands, Rep. of -1.5 - - - - - Micronesia, Fed. States of - - - - - - Nauru - - - - - - Palau, Rep. of 3.5 -4.8 -0.1 - - - Papua New Guinea 1.1 3.3 2.7 1.7 - 33.2 Samoa 6.8 4.5 3.9 5.0 - 65.1 Solomon Islands -5.7 -5.8 -3.9 2.6 - 58.0 Timor-Leste, Dem. Rep. of 19.3 -11.1 -8.5 -1.8 - 64.5 Tonga 3.5 2.0 3.0 4.8 - 58.1 Tuvalu 6.3 3.4 - - - - Vanuatu -1.8 -3.9 -5.1 3.7 3.9 72.0
- = not available.

316 Asian Development Outlook 2006
Table A6 Unemployment rate (%)
2001 2002 2003 2004 2005
Central AsiaArmenia 10.4 10.8 10.1 9.6 8.1 Azerbaijan 1.3 1.3 1.4 1.4 1.5 Kazakhstan 10.4 9.4 8.8 8.4 7.8 Kyrgyz Republic 7.8 8.6 9.0 9.0 9.0 Tajikistan 2.3 2.2 2.2 1.8 - Turkmenistan 2.6 2.5 2.5 - - Uzbekistan 0.3 0.3 0.2 0.2 -
East AsiaChina, People’s Rep. of 0.9 1.0 1.2 1.1 1.1 Hong Kong, China 5.1 7.3 7.9 6.8 5.6 Korea, Rep. of 3.8 3.1 3.4 3.5 3.7 Mongolia 4.6 3.4 2.6 3.6 - Taipei,China 4.6 5.2 5.0 4.4 4.1
South AsiaAfghanistan 3.9 3.9 3.8 3.8 - Bangladesh - - - - - Bhutan - - - - - India - - - - - Maldives 2.0 - - - - Nepal - - - - - Pakistan 7.8 8.3 8.3 7.7 7.7 Sri Lanka 7.9 8.8 8.4 8.3 8.8
Southeast AsiaCambodia 0.5 - - - - Indonesia 8.1 9.1 9.6 9.9 10.3 Lao People’s Dem. Rep. - - - - - Malaysia 3.6 3.4 3.6 3.5 3.5 Myanmar - - - - - Philippines 11.1 11.4 11.3 11.8 11.4 Singapore 2.7 3.6 4.0 3.4 3.2 Thailand 3.3 2.4 2.2 2.1 1.4 Viet Nam 6.3 6.0 5.8 5.6 5.1
The PacificCook Islands - - - - - Fiji Islands - - - - - Kiribati - - - - - Marshall Islands, Rep. of - - - - - Micronesia, Fed. States of - - - - - Nauru - - - - - Palau, Rep. of - - - - - Papua New Guinea - - - - - Samoa - - - - - Solomon Islands - - - - - Timor-Leste, Dem. Rep. of - - - - - Tonga - - - - - Tuvalu - - - - - Vanuatu -
- = not available.

Asian Development Outlook 2006 31�
Table A7 Gross domestic investment (% of GDP)
2001 2002 2003 2004 2005
Central AsiaArmenia 19.8 21.7 24.3 23.9 33.3 Azerbaijan 20.7 34.6 53.2 54.5 44.3 Kazakhstan 26.9 27.3 25.9 24.0 7.9 Kyrgyz Republic 19.6 20.3 20.5 20.9 21.6 Tajikistan 16.6 13.9 13.1 18.0 - Turkmenistan 42.0 - - - - Uzbekistan 21.1 21.2 20.8 23.9 -
East AsiaChina, People’s Rep. of 34.2 35.2 38.0 39.3 43.5 Hong Kong, China 25.3 22.8 21.9 21.8 20.5 Korea, Rep. of 29.3 29.1 30.0 30.2 30.1 Mongolia 36.1 32.2 38.0 36.5 35.5 Taipei,China 18.4 17.4 17.4 21.5 20.2
South AsiaAfghanistan - 34.5 42.1 45.2 43.1 Bangladesh 23.1 23.1 23.4 24.0 24.4 Bhutan 65.1 63.1 63.1 - - India 23.0 25.3 27.2 30.1 - Maldives 28.1 25.5 26.9 38.1 - Nepal 24.1 24.2 25.8 26.4 25.7 Pakistan 17.2 16.8 16.9 17.3 16.8 Sri Lanka 22.0 21.3 22.3 25.8 27.0
Southeast AsiaCambodia 18.7 20.1 25.1 25.8 26.4 Indonesia 23.5 20.4 17.3 21.3 21.3 Lao People’s Dem. Rep. - - - - - Malaysia 23.9 24.0 21.6 22.6 19.8 Myanmar 11.6 10.1 11.0 - - Philippines 19.0 17.7 16.7 17.1 15.7 Singapore 26.5 23.7 15.6 19.4 18.6 Thailand 24.1 23.8 24.9 27.1 31.6 Viet Nam 31.2 33.2 35.4 35.5 35.4
The PacificCook Islands - - - - - Fiji Islands 13.7 14.8 15.8 16.6 - Kiribati - - - - - Marshall Islands, Rep. of 53.6 52.1 - - - Micronesia, Fed. States of - - - - - Nauru - - - - - Palau, Rep. of - - - - - Papua New Guinea 23.0 21.4 - - - Samoa - - - - - Solomon Islands - - - - - Timor-Leste, Dem. Rep. of 41.8 35.7 31.3 28.4 - Tonga 18.5 20.4 18.9 17.5 - Tuvalu - - - - - Vanuatu 20.0 20.9 - - -
- = not available.
31� Asian Development Outlook 2006
Table A8 Inflation (% per year)
2001 2002 2003 2004 2005 2006 2007
Central Asia 13.8 10.6 6.7 5.8 7.4 7.9 6.3 Armenia 3.1 1.1 4.7 7.0 0.6 3.0 3.0 Azerbaijan 1.5 2.8 2.2 6.7 9.6 13.0 7.0 Kazakhstan 8.4 5.9 6.6 6.9 7.6 7.3 7.0 Kyrgyz Republic 6.9 2.0 3.0 4.0 4.4 4.5 4.3 Tajikistan 38.6 10.2 17.1 7.1 7.1 7.0 5.0 Turkmenistan 11.6 8.8 5.6 5.9 - - - Uzbekistan 27.4 27.6 10.3 1.6 7.8 9.2 6.0
East Asia 1.2 0.0 1.3 3.3 2.0 2.4 2.7 China, People’s Rep. of 0.7 -0.8 1.2 3.9 1.8 2.3 3.0 Hong Kong, China -1.6 -3.0 -2.5 -0.4 1.1 2.5 2.5 Korea, Rep. of 4.1 2.7 3.6 3.6 2.7 3.0 2.8 Mongolia 8.2 0.2 5.0 8.2 12.7 5.5 5.0 Taipei,China 0.0 -0.2 -0.3 1.6 2.3 1.6 1.3
South Asia 3.8 3.5 5.1 6.2 5.3 6.1 5.4 Afghanistan - - 10.2 16.3 10.0 8.0 5.0 Bangladesh 1.9 2.8 4.4 5.8 6.5 7.5 6.0 Bhutan - 2.9 2.1 3.6 4.8 5.5 6.0 India 3.7 3.4 5.5 6.5 4.5 5.5 5.0 Maldives 0.7 0.9 -2.9 6.4 3.3 2.8 2.5 Nepal 2.4 2.9 4.8 4.0 4.5 8.0 6.5 Pakistan 4.4 3.5 3.1 4.6 9.3 8.5 7.6 Sri Lanka 12.1 10.2 2.6 7.9 11.6 9.0 8.0
Southeast Asia 4.7 4.5 4.3 4.3 6.3 7.3 4.9 Cambodia 0.3 3.3 1.2 3.9 5.8 4.5 3.5 Indonesia 11.5 11.9 9.8 6.5 10.5 14.0 7.5 Lao People’s Dem. Rep. 7.8 10.7 15.5 10.5 7.2 9.0 9.0 Malaysia 1.4 1.8 1.2 1.4 3.0 3.5 3.3 Myanmar 21.2 57.0 36.6 - - - - Philippines 6.1 2.9 3.5 6.0 7.6 6.8 6.5 Singapore 1.0 -0.4 0.5 1.7 0.4 1.7 1.6 Thailand 1.6 0.6 1.8 2.8 4.5 4.0 3.0 Viet Nam -0.4 3.8 3.1 7.8 8.3 6.0 5.0
The Pacific 6.5 6.7 8.5 3.4 2.6 2.9 2.8 Cook Islands 8.7 3.4 2.0 0.9 1.7 2.0 2.0 Fiji Islands 4.3 0.8 4.2 2.8 2.4 2.7 2.7 Kiribati 7.1 1.6 2.6 2.5 - - - Marshall Islands, Rep. of 1.8 -0.4 -0.9 2.0 3.5 2.9 2.4 Micronesia, Fed. States of 0.5 -0.1 0.1 2.5 2.5 2.5 2.5 Nauru - - - - - - - Palau, Rep. of 0.4 -1.3 0.9 5.0 3.0 2.5 2.0 Papua New Guinea 9.3 11.8 14.7 2.2 1.7 2.4 2.4 Samoa 3.8 8.1 0.1 16.3 8.0 6.0 4.0 Solomon Islands 6.9 10.2 10.0 7.1 6.9 7.0 7.0 Timor-Leste, Dem. Rep. of 3.6 4.8 7.1 3.2 1.8 2.0 2.0 Tonga 8.3 10.4 11.6 11.0 8.0 8.0 8.0 Tuvalu 4.6 0.0 6.7 2.1 2.8 2.8 2.8 Vanuatu 3.6 2.0 3.0 1.8 2.6 2.5 2.5
Average 2.5 1.5 2.6 4.1 3.4 4.0 3.7
- = not available.

Asian Development Outlook 2006 31�
Table A9 Change in money supply (% per year)
2001 2002 2003 2004 2005
Central AsiaArmenia 4.4 28.8 15.1 22.3 27.8 Azerbaijan -13.5 14.4 29.8 47.5 32.0 Kazakhstan 16.3 47.4 39.1 24.0 25.0 Kyrgyz Republic 11.3 34.1 33.5 32.0 9.9 Tajikistan 33.4 43.8 31.9 3.3 17.6 Turkmenistan 17.5 -2.5 57.7 14.7 - Uzbekistan 54.3 29.7 27.1 47.8 56.1
East AsiaChina, People’s Rep. of 17.6 16.9 19.6 14.5 18.0 Hong Kong, China -2.7 -0.9 8.4 9.3 5.1 Korea, Rep. of 8.1 14.0 3.0 5.2 6.6 Mongolia 27.9 42.0 49.6 20.4 38.1 Taipei,China 4.4 2.6 5.8 7.4 6.5
South AsiaAfghanistan - - 50.5 31.9 26.9 Bangladesh 16.6 13.1 15.6 13.8 16.8 Bhutan 5.5 17.6 28.7 4.0 10.7 India 14.1 14.7 16.7 12.4 16.3 Maldives 9.0 18.4 14.5 32.7 11.7 Nepal 15.2 4.4 9.8 12.8 8.3 Pakistan 9.0 15.4 18.0 19.6 19.3 Sri Lanka 13.6 13.4 15.3 19.5 16.6
Southeast AsiaCambodia 20.4 31.1 15.3 30.0 16.1 Indonesia 13.0 4.7 8.1 8.1 16.4 Lao People’s Dem. Rep. 20.1 27.0 19.2 22.9 8.1 Malaysia 2.2 5.8 11.1 25.4 15.4 Myanmar 43.2 18.4 11.0 33.3 9.5 Philippines 6.8 9.5 3.3 9.2 9.0 Singapore 5.9 -0.3 8.1 6.2 6.2 Thailand 4.2 2.6 4.9 5.4 9.4 Viet Nam 25.5 17.6 21.0 30.0 27.0
The PacificCook Islands 14.4 3.2 9.9 9.6 -5.2 Fiji Islands -3.1 7.9 25.2 10.3 - Kiribati -3.9 29.0 - - - Marshall Islands, Rep. of - - - - - Micronesia, Fed. States of 6.0 -12.0 -3.7 -0.1 - Nauru - - - - - Palau, Rep. of - - - - - Papua New Guinea 1.9 4.4 -3.6 30.2 21.7 Samoa 20.1 3.6 6.6 12.7 - Solomon Islands -13.3 3.9 25.4 19.5 - Timor-Leste, Dem. Rep. of 155.5 6.8 32.4 16.2 - Tonga 26.6 7.8 13.4 18.6 12.1 Tuvalu - - - - - Vanuatu - -3.5 -10.4 -4.8 -
- = not available.

320 Asian Development Outlook 2006
Table A10 Growth rate of merchandise exports (% per year)
2001 2002 2003 2004 2005 2006 2007
Central Asia -1.8 8.9 25.3 42.2 40.2 16.3 17.1 Armenia 13.9 45.5 35.5 6.1 28.2 9.1 11.8 Azerbaijan 13.7 12.7 13.9 42.6 87.1 76.1 42.1 Kazakhstan -3.9 12.3 31.6 55.5 40.0 8.0 10.0 Kyrgyz Republic -6.0 3.7 18.5 24.2 -6.4 15.5 8.1 Tajikistan -17.3 7.3 14.3 36.2 3.3 6.0 6.0 Turkmenistan 4.5 9.0 10.7 9.6 42.6 - - Uzbekistan -6.6 -8.4 29.1 31.6 17.9 8.0 2.9
East Asia -5.8 12.1 22.5 28.0 19.0 15.2 12.8 China, People’s Rep. of 6.8 22.4 34.6 35.4 28.4 20.0 17.0 Hong Kong, China -5.8 4.9 12.1 15.9 11.2 11.0 9.0 Korea, Rep. of -14.0 7.9 20.7 30.6 12.1 11.0 8.0 Mongolia 12.3 3.2 16.1 36.0 23.4 - - Taipei,China -17.3 6.4 10.5 20.7 8.8 9.0 7.4
South Asia 0.1 12.9 20.5 21.4 14.9 16.9 15.7 Afghanistan - - 46.7 -12.6 14.3 4.0 -10.8 Bangladesh 12.6 -7.6 9.5 15.9 14.0 13.0 12.0 Bhutan -12.9 4.1 8.9 39.7 18.0 - - India -1.6 20.3 23.3 23.9 15.8 17.0 17.0 Maldives 1.4 20.1 14.9 19.1 -10.5 - - Nepal 11.7 -20.3 -13.8 14.8 10.3 10.2 12.5 Pakistan 9.1 2.3 20.1 13.5 16.0 20.0 13.0 Sri Lanka -12.8 -2.4 9.2 12.7 8.9 8.0 8.0
Southeast Asia -10.1 5.8 12.8 20.6 14.7 12.8 10.5 Cambodia 12.1 11.7 15.5 22.1 9.3 9.0 8.9 Indonesia -12.3 3.1 8.4 12.6 20.1 12.1 11.9 Lao People’s Dem. Rep. -3.3 -5.9 7.2 12.7 48.6 8.0 8.0 Malaysia -10.6 7.2 11.0 20.9 12.0 17.8 15.1 Myanmar 43.0 -3.9 12.6 8.2 - - - Philippines -16.2 9.9 2.7 9.8 3.7 5.1 8.0 Singapore -10.5 5.2 15.0 24.3 15.7 9.5 6.0 Thailand -7.1 4.8 18.2 21.6 15.0 15.3 12.0 Viet Nam 6.5 7.4 20.4 30.3 20.5 18.0 15.0
The Pacific -11.2 -2.6 29.6 11.9 22.5 - - Cook Islands 6.7 14.3 38.7 0.8 0.0 - - Fiji Islands -9.2 5.3 21.6 1.1 -3.2 - - Kiribati -33.1 7.8 44.2 14.6 -10.5 - - Marshall Islands, Rep. of 13.6 14.0 24.6 10.6 5.1 - - Micronesia, Fed. States of 26.4 -14.7 -9.2 -9.3 -9.2 - - Nauru - - - - - - - Palau, Rep. of 62.3 8.9 -58.7 5.3 - - - Papua New Guinea -13.7 -9.5 34.4 15.6 31.2 - - Samoa 10.8 19.1 5.7 6.9 - - - Solomon Islands -32.0 22.6 28.9 31.2 - - - Timor-Leste, Dem. Rep. of -20.0 50.0 16.7 14.3 25.0 - - Tonga 9.5 49.0 -1.1 -21.2 15.9 - - Tuvalu - - - - - - - Vanuatu - - 32.4 43.3 -0.4 - -
Average -6.9 10.0 19.4 25.6 17.9 14.7 12.4
- = not available.

Asian Development Outlook 2006 321
Table A11 Direction of Exports (% of total)
To From
DMCs People’s Rep. of China
Japan United States European Union
Others
1995 2004 1995 2004 1995 2004 1995 2004 1995 2004 1995 2004
Central Asia 16.9 8.0 3.2 8.1 1.3 1.0 0.9 2.4 28.1 32.7 49.7 47.8 Armenia 19.8 1.7 0.0 0.3 0.0 0.1 0.2 8.1 22.3 44.1 57.7 45.7 Azerbaijan 6.7 13.8 0.3 1.5 0.0 0.0 0.2 1.8 19.0 56.8 73.8 26.1 Kazakhstan 9.4 5.6 5.7 9.9 0.9 1.1 0.8 2.5 26.6 35.2 56.7 45.7 Kyrgyz Republic 47.3 22.4 0.6 12.0 0.0 0.1 0.5 1.2 16.3 4.2 35.2 60.1 Tajikistan 20.7 11.1 0.8 0.0 1.1 0.0 2.0 0.1 53.5 54.4 22.0 34.5 Turkmenistan 23.2 5.0 0.4 0.3 0.0 0.0 1.7 2.1 26.7 12.0 48.0 80.6 Uzbekistan 22.2 22.9 2.4 14.7 3.7 3.1 0.5 3.2 29.8 18.5 41.6 37.6
East Asia 26.4 25.0 11.9 15.5 12.3 9.6 20.0 18.8 13.9 16.0 15.5 15.1 China, People’s Rep. of 37.6 31.4 0.0 0.0 19.1 12.4 16.6 21.1 13.6 18.1 13.0 17.0 Hong Kong, China 9.6 9.6 33.3 44.0 6.1 5.3 21.8 17.0 15.3 14.0 13.9 10.1 Korea, Rep. of 23.9 19.0 7.0 19.7 13.0 8.6 18.5 17.0 13.3 15.0 24.3 20.8 Mongolia 22.4 3.9 16.4 47.8 9.9 3.9 5.5 17.9 15.0 21.5 30.9 5.0 Taipei,China 40.4 35.4 0.3 19.9 11.8 7.7 23.7 16.5 12.7 13.0 11.0 7.5
South Asia 18.4 19.6 1.0 4.4 6.5 2.2 19.5 19.2 29.9 25.7 24.8 28.9 Afghanistan 55.9 50.1 9.2 0.4 0.6 0.5 3.2 12.4 20.6 20.3 10.5 16.3 Bangladesh 8.2 4.4 0.6 0.4 3.3 0.8 31.9 22.4 44.8 51.2 11.2 20.8 Bhutan - - - - - - - - - - - - India 20.2 22.0 0.9 5.5 7.0 2.5 17.4 17.0 27.5 21.9 27.0 31.1 Maldives 31.4 42.2 0.0 0.0 5.7 11.7 19.2 26.5 38.4 19.3 5.3 0.3 Nepal 9.8 49.3 0.1 1.2 0.5 1.1 30.5 22.7 53.3 18.2 5.8 7.5 Pakistan 19.6 15.8 1.5 2.3 6.8 1.2 15.1 23.5 31.0 30.3 26.1 27.0 Sri Lanka 8.9 12.7 0.1 0.4 5.3 2.7 35.6 32.4 32.4 32.4 17.7 19.5
Southeast Asia 35.7 35.5 2.7 7.5 13.9 12.0 18.7 15.6 14.7 14.6 14.2 14.8 Cambodia 74.0 8.0 1.5 1.1 1.9 3.5 1.4 55.9 14.5 25.9 6.7 5.7 Indonesia 25.9 31.3 3.8 6.4 27.1 22.3 13.9 12.3 15.2 12.6 14.0 15.0 Lao People’s Dem. Rep. 55.0 33.2 2.8 2.1 1.7 1.3 1.7 0.6 10.9 28.6 27.9 34.2 Malaysia 37.8 38.0 2.6 6.7 12.5 10.1 20.8 18.8 14.4 12.6 12.0 13.9 Myanmar 51.1 60.2 11.3 5.9 7.1 5.2 6.6 0.0 6.1 15.8 17.7 12.9 Philippines 21.1 28.3 1.2 6.7 15.8 20.1 35.8 18.2 17.7 17.2 8.4 9.5 Singapore 43.5 41.9 2.3 8.6 7.8 6.4 18.3 13.0 13.9 14.5 14.3 15.6 Thailand 29.2 31.1 2.9 7.4 16.6 14.0 17.6 16.1 16.1 14.9 17.7 16.5 Viet Nam 28.8 17.5 6.4 9.0 26.0 13.6 3.0 20.2 12.6 23.6 23.2 16.1
The Pacific 14.0 13.1 1.9 4.6 19.8 5.9 3.2 4.9 17.1 10.6 44.1 60.8 Cook Islands - - - - - - - - - - - - Fiji Islands 13.7 17.6 1.0 0.5 5.8 4.1 11.5 24.0 24.5 13.6 43.4 40.2 Kiribati 44.5 7.2 0.0 0.0 17.0 29.2 10.5 9.1 25.9 51.9 2.1 2.6 Marshall Islands, Rep of - - - - - - - - - - - - Micronesia, Fed. States of - - - - - - - - - - - - Nauru 15.3 17.5 0.0 0.0 1.5 7.2 0.0 0.0 2.2 28.8 81.0 46.5 Palau - - - - - - - - - - - - Papua New Guinea 12.9 8.4 2.3 4.6 21.2 5.8 1.6 1.2 16.3 10.0 45.7 70.0 Samoa 1.5 7.1 0.0 0.9 1.8 1.1 0.9 5.7 2.1 4.3 93.7 80.8 Solomon Islands 35.5 47.5 0.4 27.8 46.6 9.7 2.4 1.9 10.3 7.4 4.8 5.8 Timor-Leste, Dem. Rep. of - - - - - - - - - - - - Tonga 1.6 4.3 0.0 18.7 47.8 37.1 25.8 17.7 0.0 1.9 24.7 20.2 Tuvalu 17.4 14.4 0.0 0.0 0.3 0.0 0.0 0.0 22.6 82.0 59.6 3.6 Vanuatu 8.3 69.3 0.0 4.9 25.1 7.5 0.0 0.9 37.9 11.3 28.7 6.1
DMCs 29.0 27.4 8.1 12.6 12.4 9.7 19.3 17.6 15.1 16.3 16.1 16.4
- = not available.

322 Asian Development Outlook 2006
Table A12 Growth rate of merchandise imports (% per year)
2001 2002 2003 2004 2005 2006 2007
Central Asia 14.2 -6.8 8.0 48.6 34.2 22.5 17.2 Armenia 0.0 14.1 28.1 5.8 23.8 10.7 9.0 Azerbaijan -4.8 24.5 49.3 31.5 20.1 28.0 0.0 Kazakhstan 11.1 1.6 16.9 53.0 37.0 24.0 15.0 Kyrgyz Republic -13.1 25.4 31.1 25.0 24.0 1.2 6.3 Tajikistan -7.3 6.5 21.9 23.5 13.2 - - Turkmenistan 34.8 -9.8 5.8 30.1 24.7 - - Uzbekistan 4.6 -14.4 10.0 27.3 21.7 23.0 7.7
East Asia -6.6 10.4 23.8 28.7 14.4 15.4 12.4 China, People’s Rep. of 8.1 21.3 39.8 35.8 17.6 20.0 17.0 Hong Kong, China -5.5 3.1 12.2 17.0 10.2 10.6 8.6 Korea, Rep. of -13.4 7.7 18.0 25.6 16.1 14.6 8.3 Mongolia 12.8 8.6 9.8 22.4 13.4 - - Taipei,China -23.7 3.4 12.2 32.5 8.5 8.2 7.0
South Asia -1.7 7.9 21.4 40.5 28.2 21.7 19.5 Afghanistan - - 50.9 2.1 14.0 9.6 -5.2 Bangladesh 11.4 -8.7 13.1 13.0 20.6 15.0 16.0 Bhutan -8.3 9.9 1.7 29.2 67.6 - - India -2.8 14.5 24.1 48.5 30.0 21.2 21.0 Maldives 1.3 -0.5 20.2 36.9 15.5 - - Nepal 6.7 -15.3 7.1 15.9 0.1 15.3 20.0 Pakistan 6.2 -7.5 20.1 21.2 38.0 30.0 15.0 Sri Lanka -18.4 2.2 9.3 19.3 13.0 7.0 6.0
Southeast Asia -10.3 5.6 10.4 24.6 16.8 14.0 12.6 Cambodia 8.0 10.7 10.4 24.7 17.1 13.0 12.0 Indonesia -14.1 2.8 10.9 28.0 26.2 17.0 17.0 Lao People’s Dem. Rep. -4.7 -12.4 1.9 56.4 23.8 12.0 10.0 Malaysia -10.3 8.3 4.8 25.5 9.3 22.4 18.9 Myanmar 13.4 -16.1 1.3 -10.6 - - - Philippines -13.3 6.3 3.1 8.0 7.4 6.6 8.5 Singapore -13.7 3.3 8.4 27.2 15.7 9.5 6.2 Thailand -3.0 4.6 17.4 25.7 26.0 15.0 15.0 Viet Nam 6.0 19.5 37.4 26.0 16.0 15.0 15.0
The Pacific -0.3 6.9 20.2 17.5 13.4 - - Cook Islands -1.7 16.3 41.8 2.1 -13.5 - - Fiji Islands 3.5 1.7 33.8 19.8 6.5 - - Kiribati -8.9 12.7 21.7 11.4 1.0 - - Marshall Islands, Rep. of 56.6 -11.1 9.8 -5.7 17.4 - - Micronesia, Fed. States of -3.5 0.0 21.6 9.1 2.3 - - Nauru - - - - - - - Palau, Rep. of -24.7 1.0 -8.8 56.4 - - - Papua New Guinea -6.4 14.6 10.3 22.4 29.4 - - Samoa 8.8 0.9 14.8 10.5 - - - Solomon Islands -11.5 -41.8 47.7 3.2 42.0 - - Timor-Leste, Dem. Rep. of 17.4 -6.3 -16.9 -8.6 5.9 - - Tonga -1.6 -0.3 21.1 11.5 27.5 - - Tuvalu - - - - - - - Vanuatu - - 16.8 22.2 11.0 - -
Average -7.2 8.5 19.5 28.6 16.4 15.7 13.2
- = not available.

Asian Development Outlook 2006 323
Table A13 Trade balance (US$ million)
2001 2002 2003 2004 2005 2006 2007
Central Asia 1,856 3,296 5,055 7,914 13,871 14,297 18,843 Armenia -420 -369 -434 -458 -534 -607 -633 Azerbaijan 581 482 -98 162 2,701 6,825 12,018 Kazakhstan 1,321 2,301 4,171 6,786 9,817 7,576 7,159 Kyrgyz Republic 40 -54 -134 -171 -435 -342 -350 Tajikistan -121 -124 -204 -151 -279 - - Turkmenistan 271 736 919 545 1,301 - - Uzbekistan 185 324 835 1,202 1,300 845 650
East Asia 58,868 77,872 85,520 103,210 177,182 201,858 233,468 China, People’s Rep. of 34,017 44,167 44,652 58,983 133,450 160,141 187,364 Hong Kong, China -8,331 -5,053 -5,775 -9,311 -7,631 -7,250 -6,525 Korea, Rep. of 13,488 14,777 21,952 37,569 33,473 28,000 29,372 Mongolia -170 -213 -200 -159 -95 - - Taipei,China 19,864 24,193 24,891 16,128 17,985 20,967 23,256
South Asia -17,084 -15,149 -19,072 -43,923 -71,540 -91,254 -114,464 Afghanistan - -1,218 -1,892 -2,211 -2,515 -2,863 -2,824 Bangladesh -2,011 -1,768 -2,215 -2,319 -3,297 -3,963 -4,985 Bhutan -70 -83 -77 -87 -225 - - India -11,574 -10,690 -13,718 -36,629 -59,342 -75,992 -96,402 Maldives -236 -212 -262 -386 -494 - - Nepal -766 -695 -902 -1,052 -978 -1,169 -1,471 Pakistan -1,269 -294 -359 -1,279 -4,515 -7,315 -8,759 Sri Lanka -1,158 -1,407 -1,539 -2,170 -2,690 -2,815 -2,848
Southeast Asia 53,014 56,966 73,279 72,944 72,064 74,132 67,970 Cambodia -523 -563 -533 -718 -1,034 -1,276 -1,521 Indonesia 22,697 23,513 24,562 21,552 22,784 22,412 21,269 Lao People’s Dem. Rep. -191 -146 -133 -349 -342 -405 -457 Malaysia 18,383 18,978 25,727 27,493 33,391 34,324 34,335 Myanmar 223 503 790 1,232 - - - Philippines -6,265 -5,530 -5,851 -5,684 -7,546 -8,634 -9,579 Singapore 15,722 18,767 29,558 32,899 37,953 41,558 43,626 Thailand 2,494 2,739 3,759 1,460 -8,578 -9,537 -14,745 Viet Nam 473 -1,295 -4,600 -4,940 -4,564 -4,311 -4,958
The Pacific -31 -286 -31 -223 -33 - - Cook Islands 14 15 19 17 32 - - Fiji Islands -351 -337 -520 -751 -867 - - Kiribati -28 -32 -38 -42 -43 - - Marshall Islands, Rep. of -69 -59 -63 -57 -69 - - Micronesia, Fed. States of -87 -90 -113 -126 -130 - - Nauru - - - - - - - Palau, Rep. of -77 -76 -80 -129 - - - Papua New Guinea 875 563 1,017 1,095 1,464 - - Samoa 56 81 79 81 - - - Solomon Islands -34 10 4 25 -40 - - Timor-Leste, Dem. Rep. of -280 -260 -214 -194 -204 - - Tonga -50 -44 -57 -69 -90 - - Tuvalu - - - - - - - Vanuatu - -58 -65 -74 -86 - -
Total 96,623 122,698 144,750 139,922 191,545 199,033 205,817
- = not available.

32� Asian Development Outlook 2006
Table A14 Current account balance (US$ million)
2001 2002 2003 2004 2005 2006 2007
Central Asia -1,730 -1,308 -1,399 -1,130 1,420 3,655 8,629 Armenia -200 -148 -189 -162 -152 -213 -242 Azerbaijan -50 -769 -2,021 -2,585 -152 2,865 8,112 Kazakhstan -1,390 -1,024 -273 530 750 479 395 Kyrgyz Republic -19 -35 -81 -75 -197 -124 -117 Tajikistan -74 -32 -20 -83 -86 -118 -129 Turkmenistan 115 583 304 82 - - - Uzbekistan -113 117 881 1,164 1,258 766 610
East Asia 53,293 78,680 103,392 130,896 207,973 228,452 224,658 China, People’s Rep. of 17,405 35,422 45,875 68,659 155,500 180,000 177,000 Hong Kong, China 9,786 12,412 16,469 15,728 19,700 21,134 20,635 Korea, Rep. of 8,033 5,394 11,950 28,174 16,559 7,910 7,468 Mongolia -169 -178 -160 -157 -151 - - Taipei,China 18,239 25,630 29,258 18,493 16,366 19,408 19,555
South Asia 2,500 9,011 18,196 -4,062 -22,413 -31,506 -34,772 Afghanistan - -142 141 111 123 -76 -242 Bangladesh -1,170 88 94 115 -594 -502 -627 Bhutan -26 -48 -67 -55 -188 -80 - India 3,400 6,345 14,083 -5,400 -19,352 -24,173 -29,255 Maldives -59 -36 -32 -129 -298 - - Nepal 274 237 149 198 405 371 278 Pakistan 326 2,690 4,070 1,811 -1,559 -6,150 -4,400 Sri Lanka -244 -265 -101 -601 -828 -972 -768
Southeast Asia 32,993 32,926 48,911 50,068 52,758 53,520 52,906 Cambodia -344 -361 -441 -482 -556 -695 -787 Indonesia 6,901 7,822 8,106 3,108 2,996 3,500 3,400 Lao People’s Dem. Rep. -93 -38 -55 -221 -239 -335 -382 Malaysia 7,286 8,025 13,323 14,871 20,536 19,444 18,326 Myanmar -77 -115 -75 443 - - - Philippines -1,762 -351 282 1,626 2,354 2,200 2,300 Singapore 14,402 11,887 22,319 26,299 33,265 35,431 36,542 Thailand 6,205 7,008 7,965 6,865 -3,714 -4,626 -4,881 Viet Nam 475 -950 -2,513 -2,441 -1,885 -1,398 -1,612
The Pacific 136 -108 193 -113 -109 - - Cook Islands 14 15 19 17 - - - Fiji Islands -158 -9 - -437 -295 - - Kiribati 2 -3 1 2 2 - - Marshall Islands, Rep. of 9 9 16 4 0 - - Micronesia, Fed. States of -14 -9 -1 13 20 - - Nauru - - - - - - - Palau, Rep. of -5 -15 -6 -11 - - - Papua New Guinea 281 -129 140 122 78 - - Samoa 8 25 12 -3 - - - Solomon Islands -33 -3 28 67 -31 - - Timor-Leste, Dem. Rep. of 46 26 17 119 149 - - Tonga -13 7 -5 8 -10 - - Tuvalu - - - - - - - Vanuatu - -21 -27 -15 -22 - -
Total 87,192 119,201 169,293 175,659 239,630 254,122 251,421
- = not available.
Asian Development Outlook 2006 325
Table A15 Current account balance (% of GDP)
2001 2002 2003 2004 2005 2006 2007
Central Asia -3.3 -2.1 -1.9 -1.8 1.7 2.9 4.8 Armenia -9.4 -6.2 -6.7 -4.5 -3.1 -4.1 -4.3 Azerbaijan -0.9 -12.3 -27.8 -30.3 -1.2 15.8 32.9 Kazakhstan -5.6 -2.4 -0.2 1.3 1.0 0.7 0.5 Kyrgyz Republic -1.3 -2.2 -4.2 -3.4 -8.1 -4.7 -4.0 Tajikistan -6.7 -2.7 -1.3 -4.0 -3.7 -4.5 -4.5 Turkmenistan 1.9 7.3 3.0 0.6 - - - Uzbekistan -1.0 1.2 8.9 8.4 9.4 5.1 3.9
East Asia 2.5 3.3 4.0 4.3 5.8 5.5 4.8 China, People’s Rep. of 1.3 2.4 2.8 3.6 7.0 6.7 5.7 Hong Kong, China 5.9 7.6 10.4 9.5 11.1 11.0 10.0 Korea, Rep. of 1.7 1.0 2.0 4.1 2.1 1.0 1.1 Mongolia -16.6 -16.0 -12.6 -9.8 -8.0 -8.5 -8.5 Taipei,China 6.3 8.7 9.8 5.7 4.7 5.1 4.8
South Asia 0.4 1.4 2.4 -0.5 -2.3 -3.0 -3.1 Afghanistan - -3.5 3.1 1.9 1.7 -0.9 -2.4 Bangladesh -2.5 0.2 0.2 0.2 -1.0 -0.8 -1.0 Bhutan -6.1 -10.2 -13.0 -9.3 -27.3 -9.0 10.1 India 0.7 1.3 2.3 -0.8 -2.5 -3.0 -3.3 Maldives -9.4 -5.6 -4.6 -16.1 -40.0 -21.4 -16.9 Nepal 4.9 4.3 2.5 2.9 5.5 4.6 3.2 Pakistan 0.5 3.8 4.9 1.9 -1.4 -4.9 -3.1 Sri Lanka -1.6 -1.6 -0.6 -3.0 -3.5 -3.7 -2.7
Southeast Asia 5.8 5.2 7.0 6.3 6.1 5.6 5.2 Cambodia -9.1 -8.8 -10.1 -9.9 -10.2 -11.8 -12.5 Indonesia 4.2 3.8 3.4 1.2 1.1 1.0 0.9 Lao People’s Dem. Rep. -5.3 -2.1 -2.6 -8.6 -8.1 -10.0 -10.0 Malaysia 8.3 8.4 12.8 12.6 15.7 13.0 11.2 Myanmar 0.0 0.0 0.0 - - - - Philippines -2.5 -0.5 0.4 1.9 2.4 1.9 1.8 Singapore 16.8 13.4 24.1 24.5 28.5 28.6 28.2 Thailand 5.4 5.5 5.6 4.3 -2.1 -2.5 -2.5 Viet Nam 1.5 -2.7 -6.4 -5.4 -3.6 -2.7 -2.8
The Pacific 2.2 -1.6 0.3 -0.8 -0.6 - - Cook Islands 16.6 13.4 11.7 9.1 - - - Fiji Islands -9.4 -0.5 -7.6 -18.4 -12.7 - - Kiribati 3.5 -5.4 0.9 3.3 - - - Marshall Islands, Rep. of 8.4 7.7 14.2 3.6 0.3 - - Micronesia, Fed. States of -6.5 -4.0 -0.5 5.9 8.6 - - Nauru - - - - - - - Palau, Rep. of -4.0 -12.6 -4.8 -9.4 - - - Papua New Guinea 9.1 -4.3 3.9 3.0 1.8 - - Samoa 3.3 9.4 3.7 -0.7 - - - Solomon Islands -11.9 -1.5 12.1 26.0 -10.8 - - Timor-Leste, Dem. Rep. of 12.5 7.6 5.1 35.1 42.6 - - Tonga -9.5 5.1 -3.1 4.2 - - - Tuvalu - - - - - - - Vanuatu - -8.9 -10.2 -5.1 -7.2 - -
Average 2.6 3.2 4.1 3.6 4.3 3.9 3.4
- = not available.

326 Asian Development Outlook 2006
Table A16 Foreign direct investment (US$ million)
2001 2002 2003 2004 2005
Central AsiaArmenia 70 111 121 217 151 Azerbaijan 298 1,048 2,293 3,659 3,466 Kazakhstan 2,861 2,157 2,188 5,383 2,544 Kyrgyz Republic -1 5 46 131 60 Tajikistan 9 36 32 272 55 Turkmenistan 170 276 226 233 - Uzbekistan 83 65 70 140 200
East AsiaChina, People’s Rep. of 46,878 52,743 53,505 60,630 60,325 Hong Kong, China 12,431 -7,781 8,139 -11,689 3,323 Korea, Rep. of 1,108 -224 100 4,588 26 Mongolia 63 78 132 93 110 Taipei,China -1,371 -3,441 -5,229 -5,247 -4,403
South AsiaAfghanistan - 50 58 187 253 Bangladesh 550 391 376 385 776 Bhutan 0 2 2 3 9 India 4,734 3,217 2,388 3,240 - Maldives 12 12 14 13 - Nepal 0 -4 12 0 - Pakistan 286 483 771 906 1,459 Sri Lanka 172 181 171 217 261
Southeast AsiaCambodia 142 139 74 121 216 Indonesia -2,977 145 -597 1,023 2,258 Lao People’s Dem. Rep. 24 5 20 17 27 Malaysia 287 1,299 1,104 2,563 713 Myanmar 192 191 128 - - Philippines 335 1,477 188 109 970 Singapore -8,590 5,051 7,233 6,307 14,562 Thailand 3,540 841 1,466 1,289 3,289 Viet Nam 273 397 1,222 1,730 1,914
The PacificCook Islands - - - - - Fiji Islands 46 20 27 - - Kiribati - - - - - Marshall Islands, Rep. of 0 0 - - - Micronesia, Fed. States of - - - - - Nauru - - - - - Palau, Rep. of - - - - - Papua New Guinea - - - - - Samoa - - - - - Solomon Islands -12 -1 0 0 - Timor-Leste, Dem. Rep. of - - - - - Tonga - - - - - Tuvalu - - - - - Vanuatu - 9 15 22 -
- = not available.

Asian Development Outlook 2006 32�
Table A17 External debt outstanding (US$ million)
2001 2002 2003 2004 2005
Central AsiaArmenia 906 1,026 1,098 1,183 1,096 Azerbaijan 1,270 1,356 1,568 1,625 1,673 Kazakhstan 15,158 18,252 22,920 32,095 38,380 Kyrgyz Republic 1,677 1,784 1,966 2,104 1,974 Tajikistan 1,017 982 1,031 822 895 Turkmenistan 1,865 1,660 1,519 1,273 - Uzbekistan 3,960 3,925 4,092 3,997 -
East AsiaChina, People’s Rep. of 170,110 168,538 193,634 228,600 - Hong Kong, China 340,024 350,693 371,575 429,336 445,365 Korea, Rep. of 128,687 141,471 157,552 172,259 190,010 Mongolia 899 986 1,237 1,338 - Taipei,China 34,336 45,033 63,054 80,888 -
South AsiaAfghanistan 7,224 7,297 - 749 - Bangladesh 14,677 15,885 16,953 17,953 18,557 Bhutan 237 292 406 529 608 India 98,843 104,914 111,721 123,278 124,326 Maldives 182 223 273 332 482 Nepal 2,661 2,744 2,968 3,120 3,122 Pakistan 32,124 33,400 33,352 33,307 34,037 Sri Lanka 8,544 9,291 10,646 11,809 -
Southeast AsiaCambodia 2,489 2,626 2,874 3,110 3,208 Indonesia 133,074 131,343 135,401 137,024 132,718 Lao People’s Dem. Rep. 1,205 1,284 1,384 1,961 2,212 Malaysia 45,636 48,858 49,113 52,786 51,719 Myanmar 5,670 6,556 - - - Philippines 51,900 53,645 57,395 54,846 54,186 Singapore 160,127 163,409 189,071 225,818 245,983 Thailand 67,509 59,459 51,783 51,312 50,871 Viet Nam 13,242 13,100 14,100 14,410 17,400
The PacificCook Islands - - - - - Fiji Islands 228 229 246 267 - Kiribati 10 10 16 21 24 Marshall Islands, Rep. of 90 88 91 103 101 Micronesia, Fed. States of 58 57 59 59 - Nauru - - - - - Palau, Rep. of - - 18 37 - Papua New Guinea 1,575 1,486 1,380 1,367 1,264 Samoa 204 234 365 - - Solomon Islands 134 152 161 160 - Timor-Leste, Dem. Rep. of 0 0 0 0 0 Tonga 58 60 75 77 81 Tuvalu - - - - - Vanuatu 69 74 87 90 -
- = not available.

32� Asian Development Outlook 2006
Table A18 Debt service ratio (% of exports of goods and services)
2001 2002 2003 2004 2005
Central AsiaArmenia 9.7 9.8 15.6 9.7 - Azerbaijan 4.9 4.4 5.0 3.7 4.0 Kazakhstan 37.5 35.2 35.0 26.6 38.3 Kyrgyz Republic 30.8 20.7 21.8 13.7 9.4 Tajikistan 25.6 22.9 18.2 49.2 - Turkmenistan 17.4 14.3 11.6 9.6 - Uzbekistan 25.6 23.3 22.5 17.5 -
East AsiaChina, People’s Rep. of 8.0 7.3 7.5 7.5 - Hong Kong, China - - - - - Korea, Rep. of 14.4 7.8 6.5 5.6 5.8 Mongolia 5.3 4.9 - - - Taipei,China 0.0 0.0 0.0 0.0 -
South AsiaAfghanistan - - - - - Bangladesh 6.6 6.3 5.8 4.8 4.7 Bhutan 4.7 4.9 5.0 4.2 7.0 India 13.9 16.4 16.3 6.2 - Maldives 4.3 4.3 3.7 4.1 6.6 Nepal 6.8 8.5 9.7 9.5 9.4 Pakistan 38.0 44.8 28.7 39.9 18.8 Sri Lanka 13.2 13.2 11.6 11.5 10.8
Southeast AsiaCambodia 3.1 2.6 2.6 2.1 1.9 Indonesia 36.0 32.1 29.8 31.2 38.6 Lao People’s Dem. Rep. 7.8 8.9 6.8 9.4 12.0 Malaysia 6.8 6.6 6.2 4.4 4.0 Myanmar 3.1 - - - - Philippines 15.8 16.4 16.9 13.8 13.3 Singapore - - - - - Thailand 20.8 19.6 16.0 8.5 9.8 Viet Nam 10.6 8.3 8.0 6.7 5.2
The PacificCook Islands - - - - - Fiji Islands 3.4 3.4 3.1 3.0 - Kiribati 7.6 4.4 4.8 4.1 - Marshall Islands, Rep. of 135.8 15.1 16.9 14.6 24.4 Micronesia, Fed. States of 27.8 5.6 5.9 6.1 - Nauru - - - - - Palau, Rep. of - - 66.1 1.4 - Papua New Guinea 1.5 1.7 1.4 1.4 - Samoa 8.8 9.1 8.7 7.9 - Solomon Islands 5.1 7.8 6.4 6.4 - Timor-Leste, Dem. Rep. of - - - - - Tonga - - - - - Tuvalu - - - - - Vanuatu 1.0 1.5 1.5 1.7 1.5
- = not available.

Asian Development Outlook 2006 32�
Table A19 Exchange rates to the US dollar (annual average)
Currency Symbol 2001 2002 2003 2004 2005
Central AsiaArmenia Dram AMD 555.1 573.4 578.8 533.5 457.7 Azerbaijan Azerbaijan manat AZM 4,656.7 4,860.8 4,910.7 4,913.4 4,730.4 Kazakhstan Tenge T 146.9 153.5 149.5 136.7 132.9 Kyrgyz Republic Som Som 48.4 46.9 43.7 42.7 41.0 Tajikistan Somoni TJS 2.4 2.8 3.1 2.9 3.1 Turkmenistan Turkmen manat TMM 5,200.0 5,200.0 5,200.0 5,200.0 5,200.0 Uzbekistan Sum SUM 423.3 772.0 971.0 1,020.0 1,115.0
East AsiaChina, People’s Rep. of Yuan CNY 8.3 8.3 8.3 8.3 8.2 Hong Kong, China Hong Kong dollar HK$ 7.8 7.8 7.8 7.8 7.8 Korea, Rep. of Won W 1,291.0 1,250.7 1,191.9 1,143.7 1,024.1 Mongolia Togrog MNT 1,097.7 1,110.3 1,146.5 1,185.3 1,204.0 Taipei,China New Taiwan dollar NT$ 33.8 34.6 34.4 33.4 32.2
South AsiaAfghanistan Afghani AF 54.4 44.8 49.0 47.7 49.8 Bangladesh Taka Tk 54.0 57.4 57.9 58.9 61.4 Bhutan Ngultrum Nu 46.4 48.2 47.9 45.4 44.6 India Indian rupee/s Re/Rs 47.7 48.4 45.9 44.9 45.2 Maldives Rufiyaa Rf 12.2 12.8 12.8 12.8 12.8 Nepal Nepalese rupee/s NRe/NRs 73.7 76.7 77.9 73.8 72.2 Pakistan Pakistan rupee/s PRe/PRs 58.4 61.4 58.5 57.6 59.4 Sri Lanka Sri Lanka rupee/s SLRe/SLRs 89.4 95.7 96.5 101.2 100.5
Southeast AsiaCambodia Riel KR 3,924.0 3,917.0 3,979.0 4,019.0 4,097.0 Indonesia Rupiah Rp 10,260.9 9,311.2 8,577.1 8,938.9 9,750.0 Lao People’s Dem. Rep. Kip KN 8,954.6 10,056.3 10,652.0 10,380.0 10,500.0 Malaysia Ringgit RM 3.8 3.8 3.8 3.8 3.8 Myanmar Kyat MK 6.7 6.6 6.1 5.7 - Philippines Peso P 51.0 51.6 54.2 56.0 55.1 Singapore Singapore dollar S$ 1.8 1.8 1.7 1.7 1.7 Thailand Baht B 44.5 43.0 41.5 40.3 40.2 Viet Nam Dong D 14,725.2 15,279.5 15,656.0 15,781.0 15,939.0
The PacificCook Islands New Zealand dollar NZ$ - - - - - Fiji Islands Fiji dollar F$ 2.3 2.2 1.9 1.7 1.8 Kiribati Australian dollar A$ 1.9 1.8 1.5 1.4 1.4 Marshall Islands, Rep. of US dollar US$ 1.0 1.0 1.0 1.0 1.0 Micronesia, Fed. States of US dollar US$ 1.0 1.0 1.0 1.0 1.0 Nauru Australian dollar A$ - - - - - Palau, Rep. of US dollar US$ 1.0 1.0 1.0 1.0 1.0 Papua New Guinea Kina K 3.4 3.9 3.6 3.2 - Samoa Tala ST 3.5 3.4 3.0 2.8 - Solomon Islands Sol. Islands dollar SI$ 5.3 6.8 7.5 7.5 - Timor-Leste, Dem. Rep. of US dollar US$ 1.0 1.0 1.0 1.0 1.0 Tonga Pa’anga T$ 1.9 2.2 2.2 2.0 1.9 Tuvalu Australian dollar A$ 1.9 1.8 1.5 1.4 1.4 Vanuatu Vatu Vt 145.7 139.1 122.2 111.9 112.5
- = not available.

330 Asian Development Outlook 2006
Table A20 Gross international reserves (US$ million)
2001 2002 2003 2004 2005
Central AsiaArmenia 330 431 504 575 674 Azerbaijan 1,218 1,414 1,620 1,075 1,186 Kazakhstan 2,508 3,141 4,959 9,292 7,070 Kyrgyz Republic 285 317 389 565 612 Tajikistan 96 96 135 189 219 Turkmenistan 2,055 2,346 2,673 2,714 3,600 Uzbekistan 1,212 1,215 1,659 2,100 -
East AsiaChina, People’s Rep. of 212,165 286,400 403,251 609,932 818,872 Hong Kong, China 111,159 111,919 118,388 123,569 124,280 Korea, Rep. of 102,753 121,343 155,281 198,994 210,317 Mongolia 207 226 178 205 268 Taipei,China 122,211 161,656 206,632 241,738 253,290
South AsiaAfghanistan - 426 816 1,261 1,730 Bangladesh 1,307 1,583 2,470 2,705 2,930 Bhutan 293 315 373 383 420 India 51,049 71,890 107,448 135,571 137,419 Maldives 94 134 160 204 187 Nepal 1,002 1,031 1,159 1,447 1,476 Pakistan 1,677 4,333 9,525 10,554 9,791 Sri Lanka 1,338 1,700 2,329 1,824 2,458
Southeast AsiaCambodia 548 663 737 807 923 Indonesia 28,016 32,039 36,296 36,321 34,724 Lao People’s Dem. Rep. 131 192 209 228 238 Malaysia 30,848 34,583 44,862 66,720 70,497 Myanmar 223 312 456 - - Philippines 15,692 16,365 17,063 16,228 18,495 Singapore 75,800 82,276 96,324 112,808 116,646 Thailand 33,048 38,924 42,148 49,832 52,066 Viet Nam 3,540 3,815 5,577 6,027 7,730
The PacificCook Islands - - - - - Fiji Islands 372 339 385 454 464 Kiribati 358 391 485 571 - Marshall Islands, Rep. of 4 18 34 11 5 Micronesia, Fed. States of 98 117 90 84 - Nauru - - - - - Palau, Rep. of - - - - - Papua New Guinea 481 355 488 639 771 Samoa 60 63 63 75 - Solomon Islands 19 18 36 79 79 Timor-Leste, Dem. Rep. of - - - - - Tonga 13 18 17 44 42 Tuvalu - - - - - Vanuatu - 35 41 59 64
- = not available.
Asian Development Outlook 2006 331
Table A21 Central government expenditures (% of GDP)
2001 2002 2003 2004 2005
Central AsiaArmenia 20.8 19.4 19.2 17.6 18.8 Azerbaijan 20.1 20.8 27.2 27.0 24.2 Kazakhstan 23.0 21.7 23.2 23.8 27.5 Kyrgyz Republic 22.8 24.8 25.0 24.1 25.0 Tajikistan 15.3 16.8 16.3 17.2 18.3 Turkmenistan 24.2 19.6 21.7 20.5 - Uzbekistan 26.7 25.8 24.6 22.9 26.4
East AsiaChina, People’s Rep. of 17.2 18.3 18.1 17.7 18.4 Hong Kong, China 18.4 18.7 20.1 18.8 17.2 Korea, Rep. of 22.0 19.9 23.3 22.2 22.7 Mongolia 43.9 44.2 42.1 39.4 34.1 Taipei,China 24.1 23.3 22.9 21.9 21.0
South AsiaAfghanistan - 8.5 14.0 13.9 15.7 Bangladesh 14.0 14.8 13.7 13.3 13.8 Bhutan 57.3 44.9 39.8 45.0 50.0 India 27.6 28.2 27.6 28.2 27.2 Maldives 37.7 38.0 38.2 38.2 - Nepal 17.5 16.9 16.0 15.5 16.3 Pakistan 17.6 18.5 18.7 17.3 17.1 Sri Lanka 27.5 25.4 23.7 23.4 25.0
Southeast AsiaCambodia 16.9 17.3 17.1 15.1 14.7 Indonesia 20.3 18.2 18.1 16.2 15.5 Lao People’s Dem. Rep. 20.7 18.4 19.0 17.2 17.7 Malaysia 29.3 28.7 28.7 26.4 25.3 Myanmar 10.5 8.6 9.5 - - Philippines 19.6 19.6 19.3 18.4 17.5 Singapore 23.4 19.1 14.0 13.8 13.2 Thailand 17.2 18.2 16.2 17.3 18.0 Viet Nam 23.9 25.3 27.1 24.9 23.9
The PacificCook Islands 36.7 36.0 33.1 31.0 - Fiji Islands - - - 29.1 - Kiribati 131.4 134.7 140.2 - - Marshall Islands, Rep. of 80.9 62.2 66.7 71.5 67.1 Micronesia, Fed. States of 69.4 72.8 70.5 63.2 68.6 Nauru - - - - - Palau, Rep. of 63.9 69.1 63.8 63.1 - Papua New Guinea 34.1 31.8 29.0 27.8 - Samoa 19.6 20.7 21.3 20.0 - Solomon Islands 36.2 29.8 39.5 40.6 - Timor-Leste, Dem. Rep. of 13.9 15.3 21.1 21.3 22.5 Tonga 30.0 32.2 31.6 28.1 27.6 Tuvalu 142.1 97.2 - - 77.9 Vanuatu 25.2 24.1 24.0 22.7 25.1
- = not available.

332 Asian Development Outlook 2006
Table A22 Central government revenues (% of GDP)
2001 2002 2003 2004 2005
Central AsiaArmenia 16.5 16.8 18.0 15.9 16.8 Azerbaijan 18.0 18.7 24.2 25.0 22.5 Kazakhstan 22.6 21.4 22.2 23.5 28.2 Kyrgyz Republic 17.0 19.1 19.4 19.5 20.3 Tajikistan 15.2 16.7 17.2 17.9 18.1 Turkmenistan 24.9 19.7 20.2 20.5 - Uzbekistan 25.7 25.0 24.2 23.7 23.0
East AsiaChina, People’s Rep. of 14.9 15.7 16.0 16.5 16.8 Hong Kong, China 13.5 13.9 16.8 18.4 17.5 Korea, Rep. of 20.3 20.3 20.8 19.7 23.5 Mongolia 39.4 38.4 37.9 37.3 36.8 Taipei,China 17.7 19.0 20.1 19.0 19.9
South AsiaAfghanistan - 8.4 11.0 12.7 15.6 Bangladesh 9.0 10.1 10.3 10.1 10.3 Bhutan 44.5 39.5 28.2 38.3 38.7 India 17.7 18.6 19.1 19.9 19.6 Maldives 33.0 33.1 34.8 36.5 - Nepal 13.0 13.1 14.5 14.4 15.2 Pakistan 13.3 14.2 14.9 14.3 13.7 Sri Lanka 16.6 16.5 15.7 15.3 16.3
Southeast AsiaCambodia 10.3 10.9 10.2 10.8 11.6 Indonesia 17.9 16.1 16.4 15.1 15.0 Lao People’s Dem. Rep. 13.2 13.1 11.1 11.3 11.6 Malaysia 23.8 23.1 23.4 22.1 21.5 Myanmar 4.7 5.0 4.6 - - Philippines 15.5 14.3 14.6 14.5 14.8 Singapore 23.1 17.5 20.5 19.4 21.1 Thailand 15.0 15.8 16.6 17.6 18.1 Viet Nam 21.0 21.6 22.8 22.8 21.6
The PacificCook Islands 38.0 36.2 32.3 30.5 - Fiji Islands - - - - - Kiribati 114.9 134.1 112.0 109.1 - Marshall Islands, Rep. of 76.3 74.8 66.2 69.0 64.7 Micronesia, Fed. States of 62.8 72.5 70.6 53.7 62.5 Nauru - - - - - Palau, Rep. of 43.0 57.5 - - - Papua New Guinea 30.6 27.9 28.1 29.6 - Samoa 31.4 32.9 32.0 30.6 - Solomon Islands 23.5 18.8 39.4 48.9 - Timor-Leste, Dem. Rep. of 16.0 15.7 24.2 31.1 54.9 Tonga 28.5 30.6 28.4 29.5 - Tuvalu 129.5 155.6 - - 73.9 Vanuatu 21.6 22.2 22.1 24.0 24.8
- = not available.

Asian Development Outlook 2006 333
Table A23 Fiscal balance of central government (% of GDP)
2001 2002 2003 2004 2005
Central AsiaArmenia -4.3 -2.6 -1.3 -1.7 -2.0 Azerbaijan -2.1 -2.1 -3.0 -2.0 -1.8 Kazakhstan -0.4 -0.3 -1.0 -0.3 0.6 Kyrgyz Republic -5.0 -5.4 -5.1 -4.3 -4.2 Tajikistan 0.1 0.7 1.1 0.7 -0.3 Turkmenistan 0.7 0.2 -1.5 0.0 - Uzbekistan 0.2 -0.9 -1.3 0.0 0.1
East AsiaChina, People’s Rep. of -2.3 -2.6 -2.2 -1.3 -1.6 Hong Kong, China -4.9 -4.8 -3.3 -0.3 0.3 Korea, Rep. of -1.7 0.4 -2.5 -2.5 0.8 Mongolia -4.5 -5.8 -4.2 -2.1 2.7 Taipei,China -6.4 -4.3 -2.8 -2.9 -1.0
South AsiaAfghanistan - -0.1 -3.0 -1.2 -0.1 Bangladesh -5.0 -4.6 -3.4 -3.2 -3.5 Bhutan -12.8 -5.5 -11.6 -6.7 -11.3 India -9.9 -9.6 -8.4 -8.3 -7.6 Maldives -4.7 -4.9 -3.4 -1.7 - Nepal -4.5 -3.9 -1.5 -1.0 -1.1 Pakistan -4.3 -4.3 -3.7 -3.0 -3.3 Sri Lanka -10.8 -8.9 -8.0 -8.1 -8.7
Southeast AsiaCambodia -6.6 -6.4 -6.9 -4.3 -3.1 Indonesia -2.4 -2.1 -1.7 -1.1 -0.5 Lao People’s Dem. Rep. -7.5 -5.3 -7.9 -5.8 -6.0 Malaysia -5.5 -5.6 -5.3 -4.3 -3.8 Myanmar -5.8 -3.6 -4.9 -6.0 - Philippines -4.0 -5.3 -4.7 -3.9 -2.7 Singapore -0.3 -1.6 6.5 5.6 8.0 Thailand -2.1 -2.2 0.6 0.3 0.1 Viet Nam -2.9 -3.6 -4.3 -2.0 -2.3
The PacificCook Islands 1.3 0.2 -0.8 -0.6 3.1 Fiji Islands -6.6 -5.6 -6.0 -3.3 -4.3 Kiribati -16.5 -0.6 -28.2 - - Marshall Islands, Rep. of -4.7 12.7 -0.4 -2.6 -2.4 Micronesia, Fed. States of -6.6 -0.3 0.0 -9.5 -6.1 Nauru - - - - - Palau, Rep. of -20.8 -11.6 -11.7 -12.0 - Papua New Guinea -3.5 -3.9 -1.0 1.8 -0.6 Samoa 11.8 12.1 10.7 10.6 - Solomon Islands -12.7 -11.0 -0.2 8.3 - Timor-Leste, Dem. Rep. of 2.0 0.4 3.2 9.8 32.4 Tonga -1.6 -1.5 -3.2 1.4 - Tuvalu -12.6 58.4 -11.0 -9.0 -4.0 Vanuatu -3.7 -2.0 -1.9 1.3 -0.3
- = not available.