cb insights - corporate vc 2016
TRANSCRIPT

THE H1 2016 CORPORATEVENTURE CAPITAL REPORTA comprehensive data-driven look at the first half of 2016’s corporate venture capital activity globally.

2
ABOUT CB INSIGHTSA unique combination of data science and machine learning to help you see what’s next.
Backed by Pilot Growth Equity and the National Science Foundation, CB Insights uses data science and machine learning to help our customers predict what’s next—their next customer, their next investment, the next market they should attack, the next move of their competitor or the next company they should acquire.
The world’s leading global corporations including the likes of Cisco, Salesforce, Castrol and Gartner as well as top tier VCs including, NEA, Upfront Ventures, RRE, and FirstMark Capital rely on CB Insights to make decisions based on data, not decibels.
To make your life easier, visit http://www.cbinsights.com

3
A FEW OF OUR HAPPY CUSTOMERSThe most publicly reference-able customers of anyone in the industry
“Designed by a VC insider who truly knows the space and understands end-user needs.”
Greg BaeInvestments & Biz DevComcast Ventures
Jack LeeneyPortfolio ManagerTelefonica Ventures
“We're using CB Insights at Salesforce Ventures to analyze industry trends that are relevant to our strategy. It's helped improve our efficiency.”
Matt GarrattSr. Director, Corporate DevelopmentSalesforce Ventures
“CB Insights provides our team with a holistic and thematic approach that really captures market activity….we've found CBI to have the best access for the most accurate market view.”
“We have been looking for a tool that could give us the ability to track, research, and identify investment opportunities. CB Insights provides this simply and in a simple, easy to use interface. The depth of information that we get is exactly what we need. Great product.”
Jonathan TudorVentures DirectorCastrol innoVentures
“CB Insights perfectly illustrates what I expect today from such online services to stay tuned to our fast-changing Tech Landscape. Accurate and up-to-date data mash-ups, intuitive UIs, smart data visualization capabilities, and direct API access… all packaged together with straightforward pricing.”
Simon MencarelliSenior Manager, Strategic PlanningDassault Systems
“CB Insights' intuitive user interface, analytical capabilities, and detailed investment information create a very powerful tool for our team's research needs.”
Nate D’AnnaCorporate DevelopmentCisco
See what other customers have to say at http://www.cbinsights.com/customer-love

TABLE OF CONTENTS
# SECTION
5 Summary
6 Global Data
19 Country Recaps
24 USA
48 Sector Recaps
All monetary references contained in this report are in USD
4

SUMMARY OF FINDINGSH1’16: CORPORATE VCs PARTICIPATE IN $12.7B ACROSS 633 DEALS: Deals involving corporate VCs fell 6% when compared to the same period in 2015, while dollar funding from those deals increased 3%. In 2016, CVCs participated in a range of $100M+ deals including those to Lu.com, Magic Leap, Oscar Health Insurance, Slack Technologies, and many others.
CORPORATE VENTURE ACTIVITY RISING IN THE UK AND INDIA: Deals with CVC participation to UK and Indian startups reached all-time highs in Q2’16. California-based Qualcomm Ventures was the most active CVC investor in both countries.
2016 ON TRACK TO SEE RECORD NUMBER OF NEW CVCs: Globally, 53 new CVC units made their first investment in 2016, continuing a steadily upward trend in the number of new CVCs since 2011. Furthermore, 76 CVCs made investments in seed stage companies in H1’16. This puts 2016 on track for a record in new CVCs, as well as CVC investment at the seed stage.
CVC AVERAGE DEAL SIZES ARE LARGER THAN VCs’ AVERAGE DEAL SIZE: Globally, the average CVC deal size has consistently been larger than the average VC deal size over the last 14 quarters. The same is true for US-based deals, with CVC deal sizes above $20M+ the last 5 quarters.
GOOGLE VENTURES SURPASSES INTEL CAPITAL AS THE MOST ACTIVE GLOBAL CVC IN FIRST HALF OF 2016 GV (Google Ventures) leads all CVCs in the first half of 2016. In terms of geographic focus, 91% of GV’s investments took place in the United States while roughly 9% took place in Europe.
GLOBAL CVCs’ DEAL SHARE BY STAGE DOMINATED BY EARLIER STAGES: In Q2’16, seed stage companies accounted for 20% and Series A stage companies accounted for 26% of global deal share from CVCs. Additionally, Series B deals took a significant portion of the pie accounting for 24% of CVC participation.
CVCs INVOLVED IN $8.6B ACROSS 376 US DEALS IN H1’16: Corporate venture capital deal activity into US-based startups fell by 14% when compared to H1’15. Furthermore, on a quarterly basis, dollar funding from these deals fell 35% in Q2’16.
NOTE: REPORT ONLY INCLUDES INVESTMENT BY CVC ARMS. With the exception of pg. 18, this report only covers the funding activity of specific, separately demarcated corporate venture arms. Corporates making strategic investments directly are not included.
5

6
Global Corporate Venture Capital: FINANCING TRENDS

CVC DEAL ACTIVITY FALLS TO 9-QUARTER LOW
7
H1’16 corporate VC participation hit $12.7B across 633 deals. CVC-backed deal activity fell 11% in Q2’16 on a quarterly basis, while overall funding from deals with CVC participation fell 41% from Q1’16.
Quarterly Global CVC Financing Trend Q1’12 – Q2’16
$1.7 $2.1 $2.3 $2.2 $1.7 $2.7 $2.6 $2.7
$3.8 $5.1
$3.5 $4.5 $4.9
$7.4
$11.3
$5.5
$8.0
$4.7
160190 191
219 212227
253268
283303
340 334 325350
377
313335
298
Investment ($B) Deals

CORPORATE VENTURE IN EUROPE ON THE RISE
8
In Q2’16, European startups took 19% of all deals with CVC participation, a 5-quarter high. North America still accounted for more than 60% of deals involving CVCs.
Quarterly Global CVC Deal Share By ContinentQ2’15 – Q2’16
68% 63% 59% 63% 62%
17%20% 23% 21% 17%
14% 16% 17% 15% 19%
1% 1% 1% 1% 1%
Q2'15 Q3'15 Q4'15 Q1'16 Q2'16
North America Asia Europe Other

EARLY-STAGE CVC DEAL SHARE REMAINS STEADY IN H1’16
9
Early-stage (seed/angel and Series A) deals accounted for 46% of all deals with CVC participation in Q2’16. Across the 5 quarters, at least one-fifth of deals involving CVCs were at the Series B stage, with the exception of a drop in Q1’16.
Quarterly Global CVC Deal Share By SeriesQ2’15 – Q2’16
21% 24% 21%14%
20%
26%27% 28%
33%26%
22% 20% 25%18% 24%
14% 11%9%
17%14%
7% 5% 4% 5% 4%6% 7% 5% 4% 4%5% 7% 6% 9% 7%
Q2'15 Q3'15 Q4'15 Q1'16 Q2'16
Seed / Angel Series A Series B Series C Series D Series E+ Other

INTERNET AND MOBILE CONTINUE TO DOMINATE CVC DEAL SHARE
10
In Q2’16, the internet and mobile sectors accounted for 63% of all deals with CVC participation. Deal share to healthcare startups topped the share of software and computer hardware in each of the past 5 quarters.
Quarterly Global CVC Deal Share By SectorQ2’15 – Q2’16
50%41%
48% 45% 48%
19%
16%16%
15% 15%
11%
17%12% 16% 13%
7%7% 5% 6% 7%
2%3% 3% 4% 1%
11% 15% 16% 14% 17%
Q2'15 Q3'15 Q4'15 Q1'16 Q2'16
Internet Mobile & Telecommunications Healthcare Software (non-internet/mobile) Computer Hardware & Services Other

CVCs PARTICIPATE IN A FIFTH OF ALL VC DEALS IN H1’16
11
Corporate venture firms participated in 20% of the 3113 venture-backed financing rounds in the first half of 2016.
Quarterly Global Corporate VC vs. Overall VC Financing ActivityQ1’13 – Q2’16
$1.7 $2.7 $2.6 $2.7 $3.8 $5.1
$3.5 $4.5 $4.9
$7.4
$11.3
$5.5 $8.0
$4.7
$8.8 $10.0
$10.8 $12.0
$13.8
$19.7
$16.9
$20.6 $19.4
$28.1
$29.9
$23.0 $21.9
$17.2
212 227 253 268 283 303 340 334 325 350 377313 335 298
1364 14141543 1541 1566
1715 1731 1723 17541841 1848
16751577 1536
Q1'13 Q2'13 Q3'13 Q4'13 Q1'14 Q2'14 Q3'14 Q4'14 Q1'15 Q2'15 Q3'15 Q4'15 Q1'16 Q2'16
CVC Funding ($B) VC Funding ($B) CVC Deals VC Deals

CVC DEAL SHARE AT 19%+ FOR 8-STRAIGHT QUARTERS THROUGH Q2’16
12
On a quarterly basis, CVC deal share topped out at 19% in Q2’16, which is down from the all-time high in Q1’16 of 21% of deal share, but still consistent with previous quarters.
Quarterly Global Corporate VC Share Of All VC DealsQ1’13 – Q2’16
84% 84% 84% 83% 82% 82% 80% 81% 81% 81% 80% 81% 79% 81%
16% 16% 16% 17% 18% 18% 20% 19% 19% 19% 20% 19% 21% 19%
Q1'13 Q2'13 Q3'13 Q4'13 Q1'14 Q2'14 Q3'14 Q4'14 Q1'15 Q2'15 Q3'15 Q4'15 Q1'16 Q2'16
Other VCs CVC Deal Share

ACTIVE CVCs MORE THAN DOUBLE FROM Q1’12 TO Q2’16
13
Since Q4’14, there have been at least 160+ corporate VCs completing deals with Q3’15 hitting an all-time high of 191 corporate VCs making an investment.
Quarterly Global Active Corporate VC InvestorsQ1’12 – Q2’16
85 98 95112 104 111 124 125
147 140157 164 171 166
191 177 188 176
Q1'12 Q2'12 Q3'12 Q4'12 Q1'13 Q2'13 Q3'13 Q4'13 Q1'14 Q2'14 Q3'14 Q4'14 Q1'15 Q2'15 Q3'15 Q4'15 Q1'16 Q2'16
Unique CVC Investor

2016 ON TRACK FOR FRESH RECORD IN NEW CVC ARMS
14
53 new corporate VC units globally made their first investment in the first half of 2016, including firms like General Mills Ventures and NBC Sports Ventures. The number of new CVCs making first-time investments will surpass 100 at the current run rate.
Number Of New Corporate Venture Capital Groups2011 – H1’16
3747
6777
85
53
2011 2012 2013 2014 2015 H1'16

CVC ACTIVITY AT THE SEED STAGE ON TRACK TO SURPASS 2015 HIGHS
15
In H1’16, 76 unique CVC arms completed at least one seed VC round worldwide, already surpassing 2012 full-year totals and on track for a new annual high.
Global Active Corporate VC Investors at the Seed Stage2012 – H1’16
53
96
122131
76
2012 2013 2014 2015 H1'16

CVC DEAL SIZES CONSISTENTLY LARGER THAN VC
16
Average deal size with CVC participation has fallen to a 5-quarter low at $19M in Q2’16. Despite this, CVC deal size has consistently been larger than VC deal sizes over the last 14 quarters.
Global Corporate VC vs. Overall VC Average Deal SizeQ1’13 – Q2’16
$10 $16
$13 $13 $18 $19
$13 $18 $17
$25
$37
$22 $27
$19
$8 $9 $9 $9 $11 $14 $12
$15 $14 $18 $20
$17 $16 $13
Q1'13 Q2'13 Q3'13 Q4'13 Q1'14 Q2'14 Q3'14 Q4'14 Q1'15 Q2'15 Q3'15 Q4'15 Q1'16 Q2'16
Corporate VC ($M) Overall VC ($M)

THE MOST ACTIVE CORPORATE VENTURE CAPITAL GROUPS GLOBALLY
17
GV (Google Ventures) led all CVCs in global activity, investing in more than 30 companies, roughly 17% more than second-place Intel Capital through the first half of 2016.
RANK CVC INVESTOR RECENT* NEW INVESTMENTS IN FIRST HALF 2016
1
2
3
4
5

CORPORATIONS (APART FROM CVCs) ARE INCREASING THEIR DEAL AND FUNDING ACTIVITY
18
Beyond dedicated venture arms, corporations themselves are also deploying dollars into VC-backed startups. In H1’16, corporates participated in $11.5B in financings across 394 deals. Corporations’ activity has ticked up in the last two quarters, in which they have been involved in 195+ deals.
Global Corporate VC vs. Corporation Financing ActivityQ1’12 – Q2’16
$1.7 $2.1 $2.3 $2.2 $1.7 $2.7 $2.6 $2.7 $3.8 $5.1 $3.5 $4.5 $4.9
$7.4
$11.3
$5.5 $8.0
$4.7 $0.9 $1.4 $1.3 $0.7 $1.2 $1.6 $1.8 $1.6
$2.8 $2.8
$3.9 $5.5
$6.5
$5.9
$10.4
$5.5
$5.3
$6.2 160190 191
219 212 227253 268 283 303
340 334 325350 377
313335
298
241277 277
298 308338
366 364396 415
492 498 490540 556
488530
497
Q1'12 Q2'12 Q3'12 Q4'12 Q1'13 Q2'13 Q3'13 Q4'13 Q1'14 Q2'14 Q3'14 Q4'14 Q1'15 Q2'15 Q3'15 Q4'15 Q1'16 Q2'16
CVC Funding ($B) Corp Funding ($B) CVC Deals CVC+Corp Deals

Where is all this data from?The CB Insights platform has the details on all the 2016
corporate venture deals included in this report.
Some of our happy customers
Click here to sign up for free

20
Country Recaps:UK, INDIA, & CHINA

UK CVC DEAL ACTIVITY REACHES RECORD LEVELS IN Q2’16
21
In Q2’16, UK deal activity hit a record high of 21 deals, despite funding participation falling 33% on a quarterly basis.
UK Quarterly Corporate VC Financing HistoryQ1’12 – Q2’16
$58 $43 $127
$61 $78 $37
$76 $104 $65 $147
$225 $177
$107
$657
$432
$553
$313
$209
7
4
10
8
15
8
65 5
12 12
14
7
15
8
1413
21
Investments ($M) Deals

CVC DEAL ACTIVITY IN CHINA HITS 8-QUARTER LOW
22
Corporate VC firms participated in roughly $2B across 29 deals in China in the first half of 2016. In Q2’16, CVCs were involved in 12 deals to China-based startups, the lowest quarterly total since Q2’14.
China Quarterly Corporate VC Financing HistoryQ1’12 – Q2’16
$10 $98 $38 $30 $14 $95 $75 $106 $139 $161 $386 $245 $324
$1.4B
$4.2B
$628
$1.7B$282
8 8
2
10
2
87
911
7
24
19
13
17
27
14
17
12
Investment ($M) Deals

INDIA CVC DEAL ACTIVITY HITS ALL-TIME HIGH IN Q2’16
23
Corporate VC firms participated in $205M across 20 deals in the first half of 2016. Both deal and funding participation rose on a quarterly basis in Q2’16 with CVCs involved in $171M across 13 deals.
India Quarterly Corporate VC Financing HistoryQ1’12 – Q2’16
$56 $35 $9 $20 $65 $9 $13
$287
$89 $111 $96
$36 $66
$298
$34 $34
$171 3
5
3 3
5
2
67
89
5
3
7
11
5
7
13
Investment ($M) Deals

MOST ACTIVE CVCs IN UK, CHINA, & INDIA
24
Qualcomm Ventures was the most active investor in India and the UK. Legend Capital was the most active CVC investor in China while Intel Capital rounded out the second spot for both China and India.
RANK CVC INVESTOR
1
2
2
4
5
Most Active CVCs in the UK2012-H1’16
RANK CVC INVESTOR
1
2
3
4
5
Most Active CVCs in China2012-H1’16
Most Active CVCs in India2012-H1’16
RANK CVC INVESTOR
1
2
3
4
5

25
US CORPORATE VC TRENDS H1’16

US CORPORATE DEAL ACTIVITY FELL TO 10-QUARTER LOW
26
Corporate VCs participated in $8.6B across 376 deals to US-based companies in the first half of 2016, a 14% drop in deals when compared to the same period in 2015.
US Quarterly Corporate VC Financing HistoryQ1’12 – Q2’16
$1.4 $1.6 $2.0 $1.6 $1.5
$1.9 $2.1 $2.0
$3.0
$4.3
$2.2
$3.5 $3.7
$4.9 $5.6
$3.6
$5.2
$3.4
105
128 128 132140 145
172158
176
211202 203
212225
233
180
202
174
Investment ($B) Deals

CALIFORNIA DEAL SHARE HITS 5-QUARTER HIGH
27
Across the 5 quarters, California accounts for at least 48% of all US deals with CVC participation. New York is taking an increasing percentage of deals, with its proportion reaching as high as 20% in Q1’16.
US CVC Deal Share By StateQ2’15 – Q2’16
52% 55% 53% 48%58%
12%13% 12% 20%
16%11% 8% 12% 8%5%4% 3% 1% 5%4%3% 3% 2% 3% 2%
19% 19% 20% 17% 16%
Q2'15 Q3'15 Q4'15 Q1'16 Q2'16California New York Massachusetts Texas Washington Other

MID-STAGE DEALS TAKE PLURALITY OF SHARE IN THE US IN Q2’16
28
Investment flowed into the mid-stage with Series B and Series C stage deals attracting 46% of CVC investment in Q2’16. More than 1/5 of deals went to Series A stage companies in Q2’16.
US CVC Deal Share By SeriesQ2’15 – Q2’16
18% 21% 16% 10% 16%
23%26%
29%30% 21%
23%22% 27%
18% 32%
17% 14% 11%
21%14%
9% 5% 7% 7% 7%7% 9% 8%
5% 4%3% 3% 2% 7% 6%
Q2'15 Q3'15 Q4'15 Q1'16 Q2'16
Seed / Angel Series A Series B Series C Series D Series E+ Other

INTERNET CONTINUES TO DOMINATE IN US IN H1’16
29
Among US deals, the internet sector took the highest concentration of deals from corporate VCs. Healthcare and mobile took 15% and 14% of deals, respectively, in Q2’16.
US CVC Deal Share By SectorQ2’15 – Q2’16
47% 42%48%
42% 47%
13% 20%14%
18%15%
16% 17% 14% 14% 14%
8% 6% 4% 7% 7%2% 3%
3% 1%5%
13% 12% 16% 17% 12%
Q2'15 Q3'15 Q4'15 Q1'16 Q2'16
Internet Healthcare Mobile & Telecommunications Software (non-internet/mobile) Electronics Other

CVCs PARTICIPATE IN OVER A FIFTH OF US VC DEALS IN H1’16
30
In the first half of 2016, corporate VCs participated in 22% of the 1600+ US VC deals.
US Corporate VC vs. Overall VC Financing HistoryQ1’13 – Q2’16
$1.5 $1.9 $2.1 $2.0 $3.0 $4.3
$2.2 $3.5 $3.7
$4.9 $5.6 $3.6
$5.2 $3.4
$6.7 $7.5 $7.7
$8.8
$9.8
$14.2
$11.0
$13.7 $12.7
$17.9
$15.5
$12.4 $12.4 $11.5
140 145 172 158 176211 202 203 212 225 233
180 202 174
866 889
975941 958
1106 10881032
988
11041040
928866
816
Q1'13 Q2'13 Q3'13 Q4'13 Q1'14 Q2'14 Q3'14 Q4'14 Q1'15 Q2'15 Q3'15 Q4'15 Q1'16 Q2'16
CVC Funding ($B) VC Funding ($B) CVC Deals VC Deals

CVC US DEAL SHARE AT 19% OR HIGHER FOR 9- STRAIGHT QUARTERS
31
CVC quarterly deal share in the US topped out at 23% during the peak of Q1’16 and leveled out to 21% in Q2’16.
US CVC Deal Share Of All VC DealsQ1’13 – Q2’16
84% 84% 82% 83% 82% 81% 81% 80% 79% 80% 78% 81% 77% 79%
16% 16% 18% 17% 18% 19% 19% 20% 21% 20% 22% 19% 23% 21%
Q1'13 Q2'13 Q3'13 Q4'13 Q1'14 Q2'14 Q3'14 Q4'14 Q1'15 Q2'15 Q3'15 Q4'15 Q1'16 Q2'16
Other VC CVC Deal Share

NUMBER OF ACTIVE CVCs IN US FALL STEEPLY AFTER PEAK IN Q1’16
32
The number of active corporate VCs hit a 8-quarter low in Q2’16, with just 107 unique CVCs completing a US-based deal.
US Quarterly Active CVC InvestorsQ1’12 – Q2’16
61 67 67 75 7382 85 86
104 100111 108 115
126 132118
131
107
Q1'12 Q2'12 Q3'12 Q4'12 Q1'13 Q2'13 Q3'13 Q4'13 Q1'14 Q2'14 Q3'14 Q4'14 Q1'15 Q2'15 Q3'15 Q4'15 Q1'16 Q2'16
Unique CVC Investors

CVC DEAL SIZES LARGER THAN OVERALL VC DEALS IN US
33
The average size of deals with CVC participation was larger than overall US VC deals, mirroring the global pattern. The last 5 quarters saw US CVC deal sizes above $20M+ while each quarter in 2013 was below $20M in average deal size.
US CVC vs. Overall VC Average Deal SizeQ1’13 – Q2’16
$12 $16 $14 $14
$21 $22
$13
$21 $19
$24 $28
$22
$28
$22
$9 $9 $9 $10 $11
$14 $11
$15 $14 $18 $17
$15 $16 $15
Q1'13 Q2'13 Q3'13 Q4'13 Q1'14 Q2'14 Q3'14 Q4'14 Q1'15 Q2'15 Q3'15 Q4'15 Q1'16 Q2'16
Corporate VC ($M) Overall VC ($M)

THE MOST ACTIVE CVCs IN THE US
34
Google Ventures was the most CVC investor in the US through the first half of 2016. They are invested across a range of industries like healthcare and frontier tech; their portfolio includes Orbital Insight, Magic Leap, and ARMO Biosciences, among many others.
RANK CVC INVESTOR RANK CVC INVESTOR
1 5
2 5
3 8
4 9
5 9
Where is all this data from?The CB Insights platform has the details on all the 2016
corporate venture deals included in this report.
Some of our happy customers
Click here to sign up for free

36
US Corporate VC State Recaps: CALIFORNIA

CALIFORNIA: $4.5B ACROSS 197 DEALS DEALS IN H1’16
37
In Q2’16, total funding involving CVCs in California rose to $2.4B across 101 deals, a 17% increase in funding and 5% increase in deals on a quarterly basis.
California Quarterly CVC Financing HistoryQ1’12 – Q2’16
$0.7 $1.0 $1.0 $0.8 $0.9 $0.9
$1.3 $1.0
$2.0
$2.9
$1.6 $1.7 $1.8
$3.1 $3.6
$2.1 $2.1 $2.4
49
6960
6575
67
90
74
99
110 113106
95
116
127
95 96101
Investment ($B) Deals

CORPORATE VENTURE ARMS ACTIVE IN CALIFORNIA MID-STAGE MARKET
38
Series B deals only made up 17% of all California CVC participation in Q1’16, but grew to 34% in Q2’16. In contrast, Series A deals went from a 30% peak in Q1’16 to a 5-quarter low of 18% in Q2’16.
California CVC Deal Share By SeriesQ2’15 – Q2’16
19% 20% 15% 11% 12%
20%24%
26% 30%18%
24%20% 24%
17%34%
19% 17% 14% 22% 16%
6% 5% 7% 9% 10%
9% 11% 11% 4% 3%
3% 3% 3% 6% 8%
Q2'15 Q3'15 Q4'15 Q1'16 Q2'16
Seed / Angel Series A Series B Series C Series D Series E+ Other

CALIFORNIA CVC DEAL ACTIVITY CONCENTRATED ON INTERNET; MOBILE & SOFTWARE INCREASING
39
In the first half of 2016, the internet sector received 44% of all California deals with CVC participation. Healthcare peaked in Q1’16 at 21% but dropped to 10% in Q2’16, while both mobile and software increased over the same quarters.
California CVC Deal Share By SectorQ2’15 – Q2’16
47% 49% 49%42% 46%
17%19% 14%
14%17%
10%11%
12%21% 10%
7%6%
4% 6% 8%3%
5%4%
5%2%
16% 10%17% 13% 18%
Q2'15 Q3'15 Q4'15 Q1'16 Q2'16
Internet Mobile & Telecommunications Healthcare Software (non-internet/mobile) Computer Hardware & Services Other
40
US Corporate VC State Recaps: NEW YORK

NEW YORK: $1.7B ACROSS 68 DEALS IN H1’16
41
In Q2’16, funding to New York-based companies involving CVCs fell by 66% while deal count fell by 30% on a quarterly basis. In Q2’16, CVCs participated in deals like the Via Transportation $70M Series C and the US HealthVest $50M Series B, among others.
New York Quarterly CVC Financing HistoryQ1’12 – Q2’16
$52 $79 $141 $155 $185
$266 $114
$301 $206
$336 $202 $229 $294
$465
$768
$176
$1.3B
$438 7
11
7
1417
12
19
24
15
19
25
31
17
2730
22
40
28
Investment ($M) Deals

EARLY-STAGE DEALS INVOLVING CVCs SEE A REBOUND IN NEW YORK
42
In Q1’16, Series B deals accounted for 28% of NY-based deals with CVC participation, and this share increased to 32% in Q2’16. Early-stage (seed/angel and Series A) CVC deals fell to a 4-quarter low of 36% in Q1’16, but recovered to 47% in Q2’16.
New York CVC Deal Share By SeriesQ2’15 – Q2’16
19%
33% 36%
8%
29%
37%20%
27%
28%
18%
19% 27% 9%
28%
32%
7%
13%
9%23%
7%
15%3%
9%10% 4%
3%5%
5%7%
4% 5% 4%
Q2'15 Q3'15 Q4'15 Q1'16 Q2'16
Seed / Angel Series A Series B Series C Series D Series E+ Other

MOBILE & SOFTWARE EACH TAKE 1/5 OF NEW YORK CVC DEALS
43
The internet sector accounted for 57% of deals involving CVCs in Q2’16. Mobile as well as software deals have been in decline since Q4’15 but each still took 20%+ of deals in Q2’16.
New York CVC Deal Share By SectorQ2’15 – Q2’16
78%
47%59%
40%57%
11%
30%
32%
28%
21%
3%13%
11%
11%
30%32%
28%21%
5%7%10% 13%4%
Q2'15 Q3'15 Q4'15 Q1'16 Q2'16
Internet Mobile & Telecommunications Healthcare Software (non-internet/mobile) Business Products & Services Other

44
US Corporate VC State Recaps: MASSACHUSETTS

MASSACHUSETTS: $512M ACROSS 24 DEALS IN H1’16
45
In H1’16, deal activity from CVCs fell by 52% when compared to the same period in 2015. In Q2’16, deal count from CVCs investing in Massachusetts-based companies fell to a staggering 17-quarter low.
Massachusetts Quarterly CVC Financing HistoryQ1’12 – Q2’16
$177 $133
$231 $210 $132
$229 $274 $272
$153
$297
$87
$457 $533
$470
$596
$360 $390
$122
6
1716 16 16
1920
18 18
24
11
23
2624
19
22
16
8
Investment ($M) Deals

MASSACHUSETTS CVC ACTION LEANING TOWARDS SERIES A AND SERIES B DEALS
46
Over the last 5 quarters, Series A and Series B deals have accounted for at least 43% of CVC deals in Massachusetts. Seed/angel stage activity is taking an increasing share of CVC deals growing from 4% in Q3’15 to 11% in Q2’16.
Massachusetts CVC Deal Share By SeriesQ2’15 – Q2’16
8% 4% 7% 12% 11%
15%29%
31%35% 32%
28%
33%31%
27%21%
25%
8%10%
12%
11%
5%
21%3%
4%
11%
13%
4%
10% 5%
8% 7% 12% 11%
Q2'15 Q3'15 Q4'15 Q1'16 Q2'16
Seed / Angel Series A Series B Series C Series D Series E+ Other
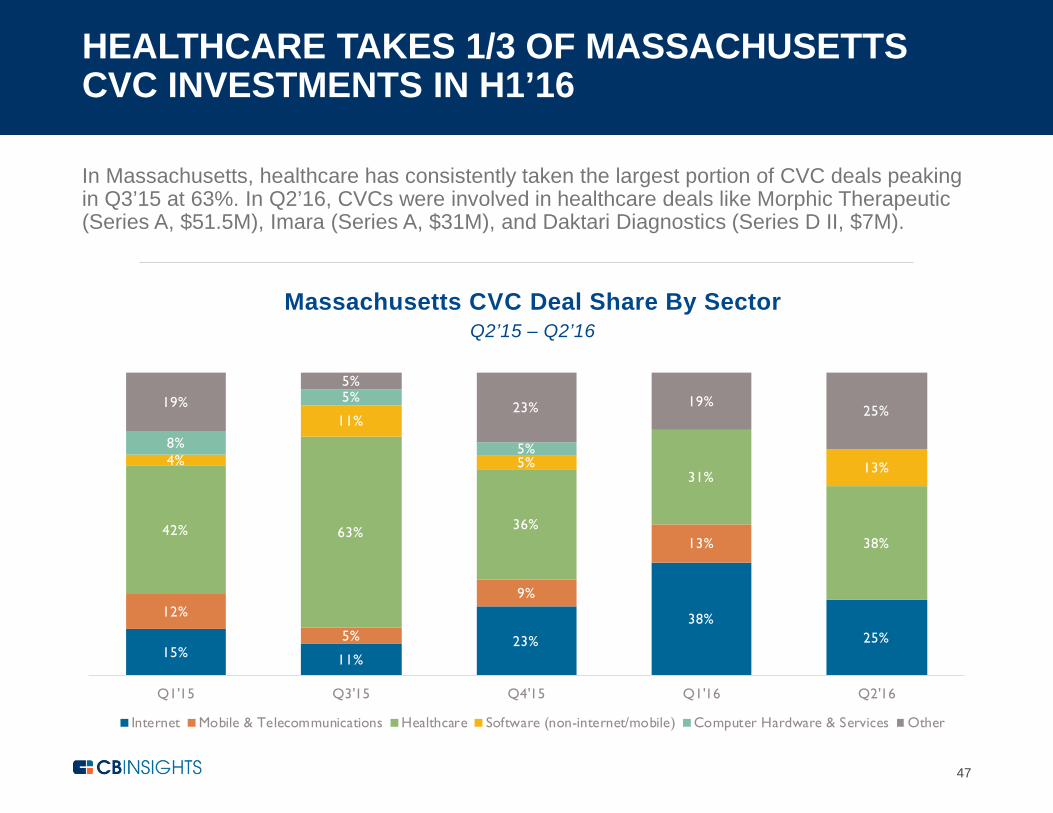
HEALTHCARE TAKES 1/3 OF MASSACHUSETTS CVC INVESTMENTS IN H1’16
47
In Massachusetts, healthcare has consistently taken the largest portion of CVC deals peaking in Q3’15 at 63%. In Q2’16, CVCs were involved in healthcare deals like Morphic Therapeutic (Series A, $51.5M), Imara (Series A, $31M), and Daktari Diagnostics (Series D II, $7M).
Massachusetts CVC Deal Share By SectorQ2’15 – Q2’16
15% 11%23%
38%25%
12%
5%
9%
13%42% 63% 36%
31%
38%
4%
11%
5% 13%
8%
5%
5%
19%5%
23% 19%25%
Q1'15 Q3'15 Q4'15 Q1'16 Q2'16
Internet Mobile & Telecommunications Healthcare Software (non-internet/mobile) Computer Hardware & Services Other

Like the H1’16 CVC Report?Let Us Know!
Just click this button (yes, it’s that easy)
Want more reports like this?Sign up!
It’s free!
Stay in Touch!Follow us on Twitter – we’d love to hear from you
If you’re a data junkie, you can also sign up for our newsletter here
@cbinsights
(212) 292-3148

49
Global Corporate VC Sector Recap: INTERNET
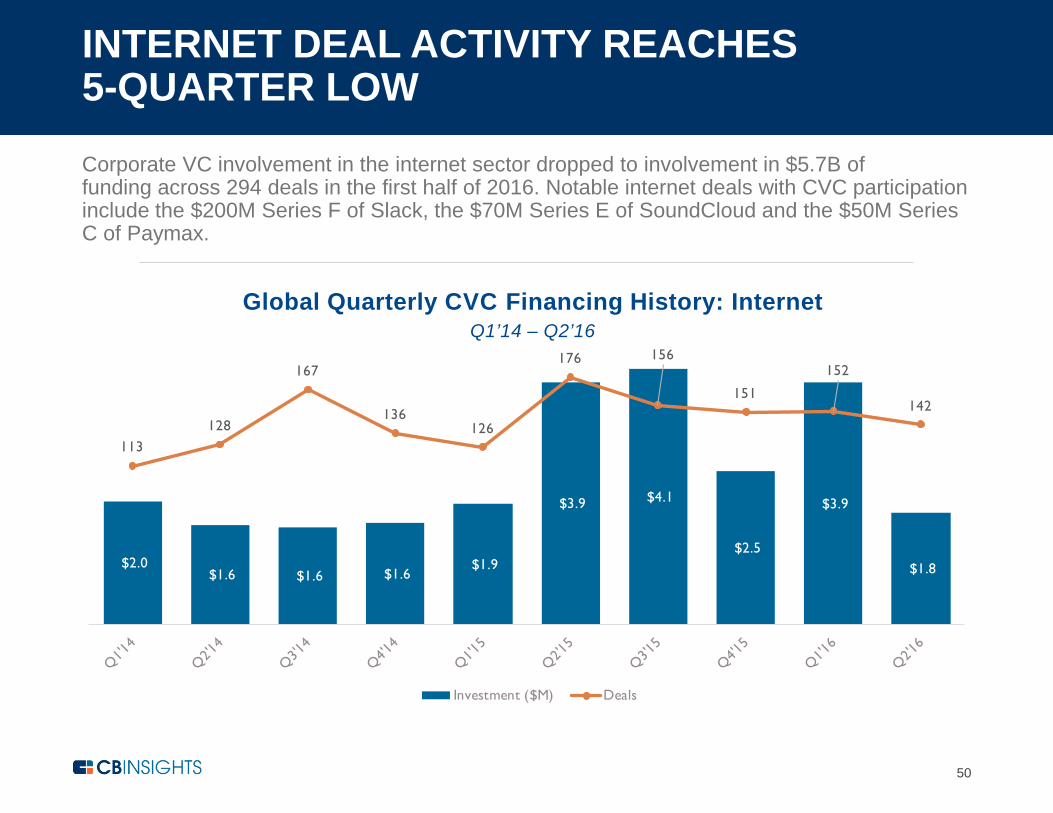
INTERNET DEAL ACTIVITY REACHES 5-QUARTER LOW
50
Corporate VC involvement in the internet sector dropped to involvement in $5.7B of funding across 294 deals in the first half of 2016. Notable internet deals with CVC participation include the $200M Series F of Slack, the $70M Series E of SoundCloud and the $50M Series C of Paymax.
Global Quarterly CVC Financing History: InternetQ1’14 – Q2’16
$2.0 $1.6 $1.6 $1.6
$1.9
$3.9 $4.1
$2.5
$3.9
$1.8
113128
167
136126
176 156
151
152
142
Investment ($M) Deals

EUROPE GAINS GREATER SHARE OF CVC INTERNET DEALS IN Q2’16
51
Corporate VC deals in the internet sector have remained relatively consistent across the top 3 continents with North America capturing the majority of all investments. Europe accounted for 20% of deals in Q2’16 after taking 16% or less in the previous four quarters.
Global CVC Deal Share By Continent: InternetQ2’15 – Q2’16
63% 64% 60% 59% 61%
23% 21% 25% 23% 18%
14% 14% 13% 16% 20%
1% 1% 1% 2% 1%
Q2'15 Q3'15 Q4'15 Q1'16 Q2'16
North America Asia Europe Other

CVC EARLY-STAGE INTERNET DEALS HIT 5-QUARTER LOW
52
For deals in the internet sector involving CVCs, early-stage deals (seed/angel and Series A) fell to 46% of the total in Q2’16, a 5-quarter low. Meanwhile, internet deals involving CVCs at the Series B stage hit a 5-quarter high at 27% in Q2’16.
Global CVC Deal Share By Series: InternetQ2’15 – Q2’16
22% 28% 26%17% 21%
30%28% 27%
31% 25%
20% 19% 25%18% 27%
13% 12% 9%17%
12%
7% 5% 5% 5% 3%4% 6% 5% 4% 5%4% 3% 4% 8% 7%
Q2'15 Q3'15 Q4'15 Q1'16 Q2'16
Seed / Angel Series A Series B Series C Series D Series E+ Other

Where is all this data from?The CB Insights platform has the details on all the 2016
corporate venture deals included in this report.
Some of our happy customers
Click here to sign up for free

54
Global Corporate VC Sector Recap: MOBILE

MOBILE SECTOR DEAL ACTIVITY TRENDING DOWNWARDS
55
Deal count in the mobile sector fell to a 14-quarter low with CVCs investing in 45 deals in Q2’16. Funding to mobile from deals with CVC participation dropped in the first half of 2016, after the Q3’15 spike which was driven by CVC involvement in $1B+ rounds to Didi Kuaidiand Ucar Group.
Global Quarterly CVC Financing History: Mobile & TelecomQ1’13 – Q2’16
$310 $334 $589 $387 $697
$1.7B
$386 $636 $685 $1.2B
$4B
$922 $680 $699
48 46
5763 61
57
72 7168 66
62
49 4945
Investment ($M) Deals

ASIA CATCHING ALMOST ¼ OF CORPORATE VC DEALS IN MOBILE
56
Mobile deals in North America involving corporate VCs took at least 53% of mobile CVC deals across the 5 quarters. Asia took at least 1/5 of deals in the 5 quarter-trend and ended Q2’16 on a high note taking roughly 1/4 of all mobile deals.
Global CVC Deal Share By Continent: Mobile & TelecomQ2’15 – Q2’16
59% 65%53%
61% 60%
21%21%
31%22% 24%
17%15% 16% 16% 16%
3%
Q2'15 Q3'15 Q4'15 Q1'16 Q2'16
North America Asia Europe Other

CVC EARLY-STAGE MOBILE DEAL SHARE DOMINATES OVER 5 QUARTERS
57
Early-stage deals consistently accounted for roughly 60% of CVC deals in the mobile sector. In Q2’16, mid-stage (Series B + Series C) deals took 30% of CVC participation with deals like Cabify (Series C, $120M) and Meta (Series B, $50M) drawing CVC involvement.
Global CVC Deal Share By Series: Mobile & TelecomQ2’15 – Q2’16
32%39% 35% 34% 37%
27%
33%35% 35% 29%
24%13% 21% 23%
15%
6% 5%6% 4%
15%1% 2%
2% 2% 2%
3%5%
1%6% 3% 2% 2% 2%
Q2'15 Q3'15 Q4'15 Q1'16 Q2'16
Seed / Angel Series A Series B Series C Series D Series E+ Other

58
Global Corporate VC Sector Recap: HEALTHCARE

HEALTHCARE DEAL ACTIVITY SLIGHTLY DOWN IN H1’16
59
Corporate VC involvement in the healthcare sector totaled 91 deals adding up to $2.6B in H1’16, a 2% decrease in deal activity over the same period in 2015.
Global Quarterly CVC Financing History: HealthcareQ1’13 – Q2’16
$423 $682
$565 $696
$437
$956
$565
$896 $1.1B
$1.3B
$1.9B
$1.1B
$1.4B
$1.2B
33
43
29
3843
51
31
45
56
37
65
37
53
38
Investment ($M) Deals

30% OF HEALTHCARE DEALS HAPPENING IN EUROPE AND ASIA
60
Healthcare deals primarily took place in North America with the continent notching at least 68% of all deals in the last 5 quarters. CVCs have increased their deal activity in Asia-based healthcare startups over the past 5 quarters going from 5% in Q2’15 to 18% in Q2’16.
Global CVC Deal Share By Continent: HealthcareQ2’15 – Q2’16
84%72% 68% 68% 68%
5%
5% 11% 15% 18%
11%23% 22% 15% 13%
2%
Q2'15 Q3'15 Q4'15 Q1'16 Q2'16
North America Asia Europe Other

CVCs ARE BETTING ON HEALTHCARE DEALS AT THE EARLY-STAGE
61
In Q2’16, early-stage deals accounted for 37% of CVC deals in the healthcare sector, up from 29% in Q2’15. Series C healthcare deals are trending downwards going from 17% in Q3’15 to 11% in Q2’16.
Global CVC Deal Share By Series: HealthcareQ2’15 – Q2’16
5% 6% 3% 5%
24%29%
27%43% 32%
32%31%
30%
30% 34%
16%17%
14%
13%11%11% 6%
5%
8%8% 8%
8%
5%3% 3%
14%6% 3%
Q2'15 Q3'15 Q4'15 Q1'16 Q2'16
Seed / Angel Series A Series B Series C Series D Series E+ Other

APPENDIX: 100 Most Active Corporate Venture Capital Firms Of The First Half Of 2016 (Global)
1-25 26-50 51-75 76-100Google Ventures In-Q-Tel Robert Bosch Venture Capital Kaiser Permanente VenturesIntel Capital Tengelmann Ventures Corigin Ventures UMC CapitalComcast Ventures Orange Digital Ventures Merck Global Health Innovation Fund Leta CapitalSalesforce Ventures Lilly Asia Ventures BlueCross BlueShield Venture Partners Aster CapitalCisco Investments American Express Ventures Nissay Capital Baxalta VenturesGE Ventures Nokia Growth Partners YJ Capital XL InnovateQualcomm Ventures Hewlett-Packard Ventures Bertelsmann India Investments Monsanto Growth VenturesPfizer Venture Investments Legend Capital Unilever Ventures Ascension VenturesBloomberg Beta WuXi Venture Fund SAIC Capital Astellas Venture ManagementCyberAgent Ventures AbbVie Biotech Ventures Chevron Technology Ventures Broadway Video VenturesF-Prime Capital Bertelsmann Digital Media Investments Morgan Stanley Expansion Capital Yamaha Motor VenturesSamsung Ventures SingTel Innov8 Autodesk Forge Fund Health Insight CapitalPing An Ventures Saison Ventures Recruit Strategic Partners LDV CapitalJohnson & Johnson Innovation 301 INC DG Incubation Simon Venture GroupRoche Venture Fund Caixa Capital Total Energy Ventures International DvH VenturesVerizon Ventures Wipro Ventures Gibraltar Ventures Twitter VenturesSR One Capital One Growth Ventures WPP Digital Liberty Global VenturesCiti Ventures Google Capital Globalive Capital Xiaomi VenturesBrand Capital Springboard Santander InnoVentures Motorola Solutions Venture Capital MassMutual VenturesRakuten Ventures Hearst Ventures Aviva Ventures Amgen VenturesNTT DoCoMo Ventures SMBC Venture Capital Reaktor Ventures Maxim VenturesMicrosoft Ventures American Family Ventures IBM Watson Group Shea VenturesNovartis Venture Funds WME Ventures Renren Lianhe Holdings McKesson VenturesTelstra Ventures Boehringer Ingelheim Venture Fund Innovacom SPH Media FundAXA Strategic Ventures Time Warner Investments CAA Ventures MediaTek Ventures
100 Most Active CVCs Of H1'16

Where is all this data from?The CB Insights platform has the details on all the 2016
corporate venture deals included in this report.
Some of our happy customers
Click here to sign up for free
