chapter 5 statistical quality control, 7th edition by ...haalshraideh/qc/c05.pdf · chapter 5...
TRANSCRIPT
Chapter 5 1Statistical Quality Control, 7th Edition by Douglas C. Montgomery.
Copyright (c) 2013 John Wiley & Sons, Inc.
Learning Objectives
Chapter 5 2Statistical Quality Control, 7th Edition by Douglas C. Montgomery.
Copyright (c) 2013 John Wiley & Sons, Inc.
Basic SPC Tools
Chapter 5 3Statistical Quality Control, 7th Edition by Douglas C. Montgomery.
Copyright (c) 2013 John Wiley & Sons, Inc.
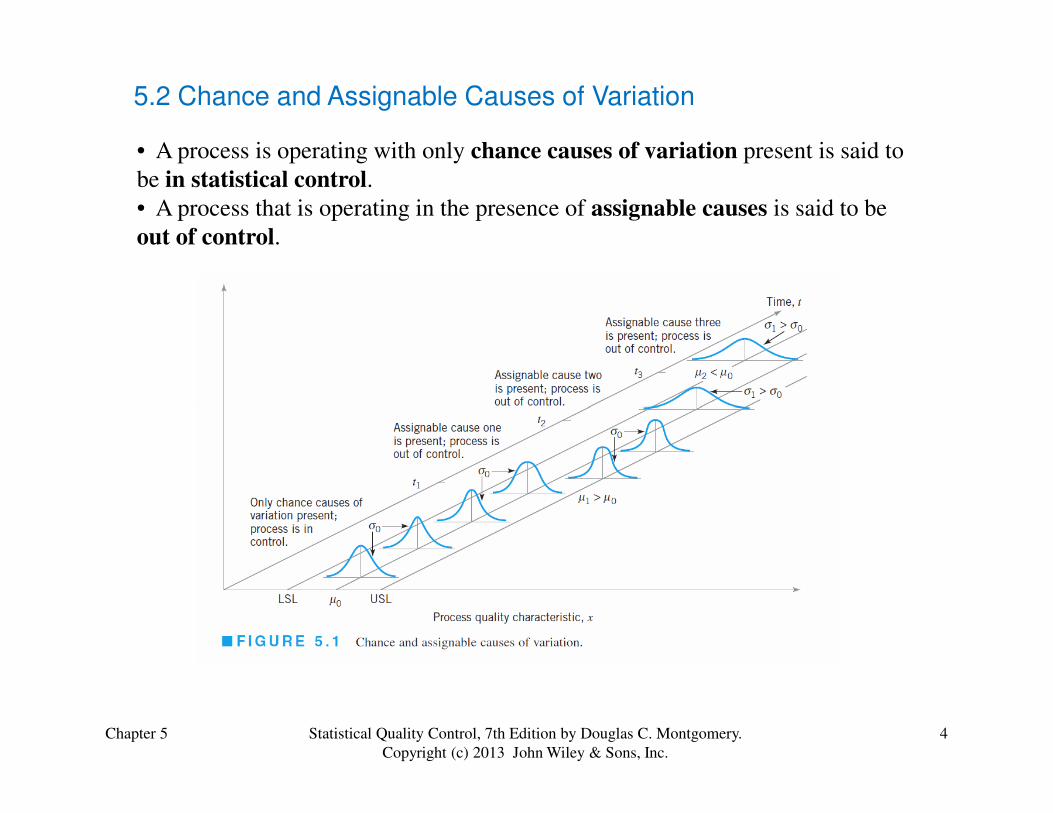
• A process is operating with only chance causes of variation present is said to
be in statistical control.
• A process that is operating in the presence of assignable causes is said to be
out of control.
5.2 Chance and Assignable Causes of Variation
Chapter 5 4Statistical Quality Control, 7th Edition by Douglas C. Montgomery.
Copyright (c) 2013 John Wiley & Sons, Inc.
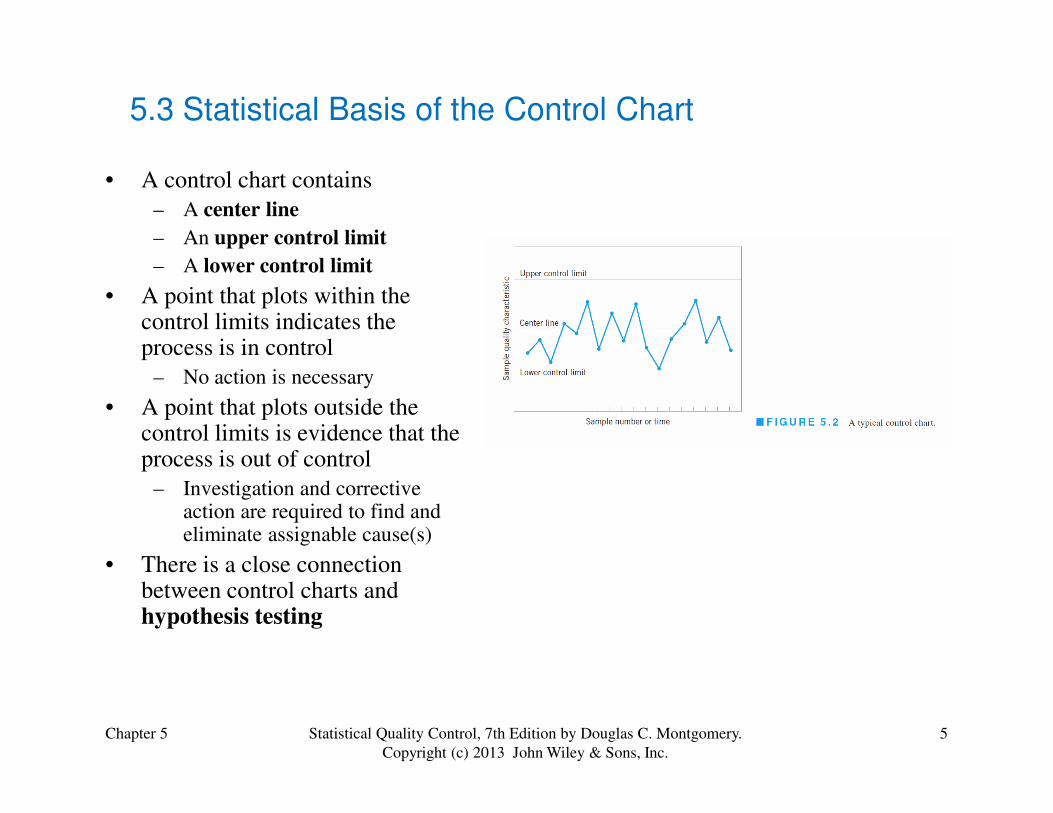
• A control chart contains
– A center line
– An upper control limit
– A lower control limit
• A point that plots within the control limits indicates the process is in control
– No action is necessary
• A point that plots outside the
5.3 Statistical Basis of the Control Chart
Chapter 5 5Statistical Quality Control, 7th Edition by Douglas C. Montgomery.
Copyright (c) 2013 John Wiley & Sons, Inc.
• A point that plots outside the control limits is evidence that the process is out of control
– Investigation and corrective action are required to find and eliminate assignable cause(s)
• There is a close connection between control charts and hypothesis testing
Photolithography Example
Chapter 5 6Statistical Quality Control, 7th Edition by Douglas C. Montgomery.
Copyright (c) 2013 John Wiley & Sons, Inc.
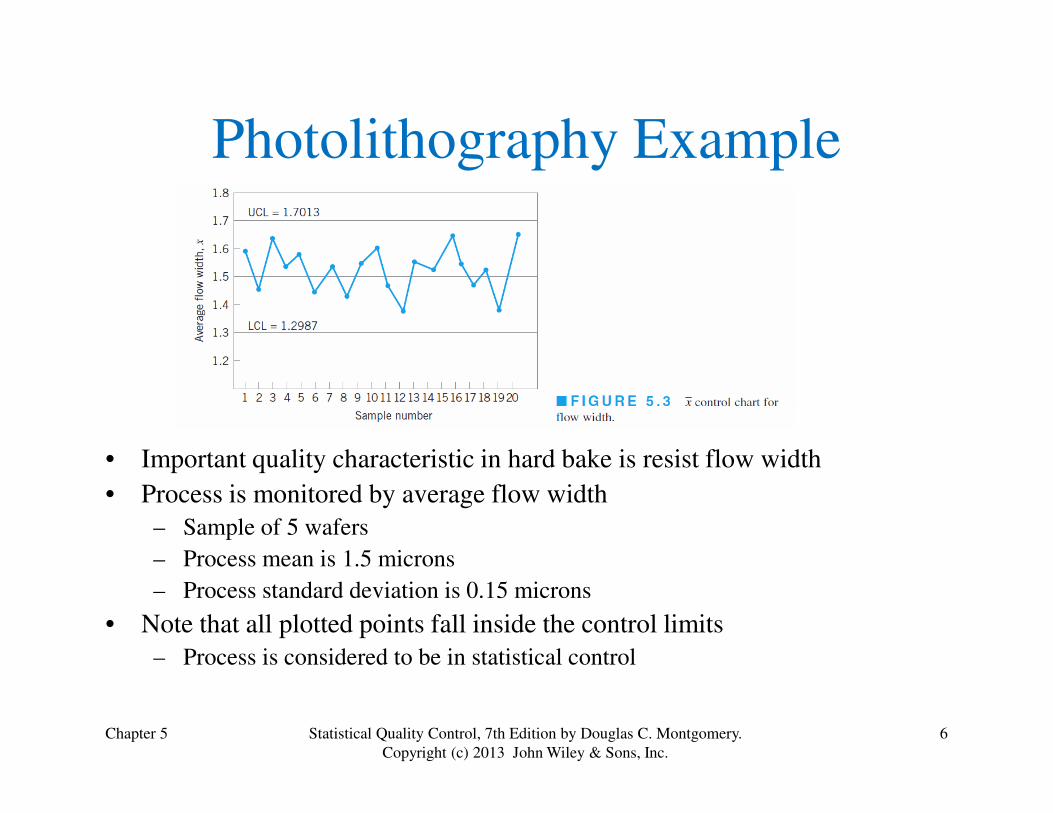
• Important quality characteristic in hard bake is resist flow width
• Process is monitored by average flow width
– Sample of 5 wafers
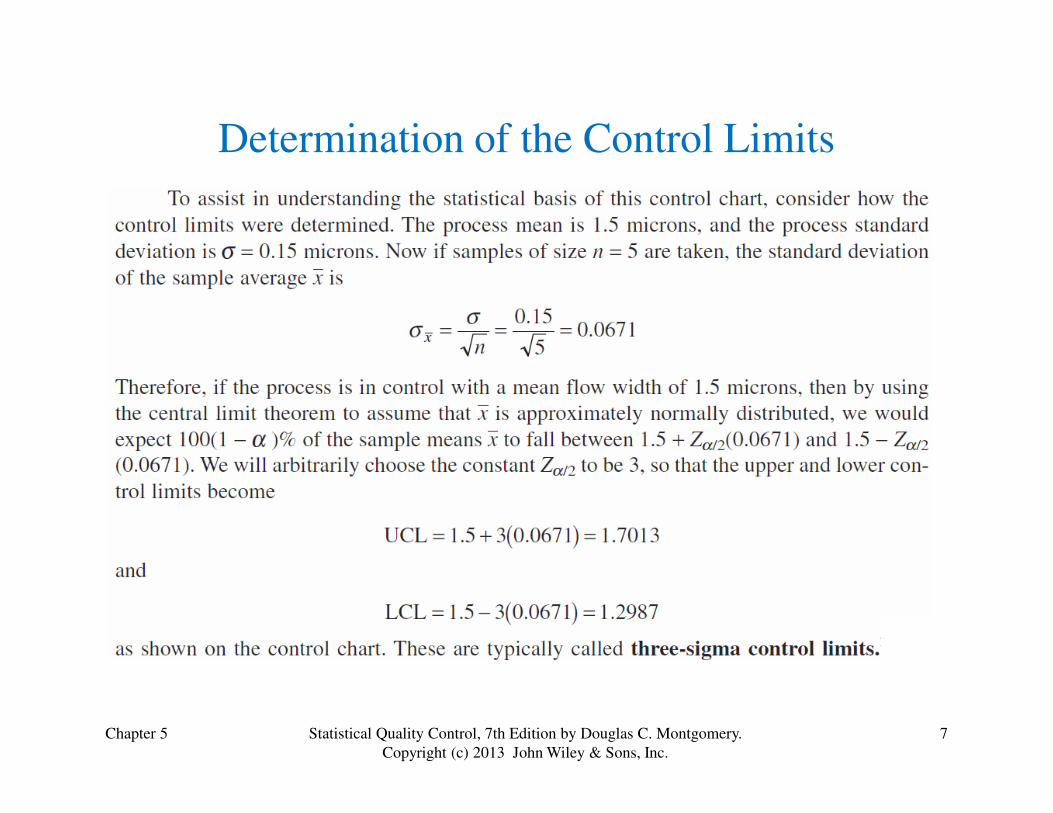
– Process mean is 1.5 microns
– Process standard deviation is 0.15 microns
• Note that all plotted points fall inside the control limits
– Process is considered to be in statistical control
Determination of the Control Limits
Chapter 5 7Statistical Quality Control, 7th Edition by Douglas C. Montgomery.
Copyright (c) 2013 John Wiley & Sons, Inc.
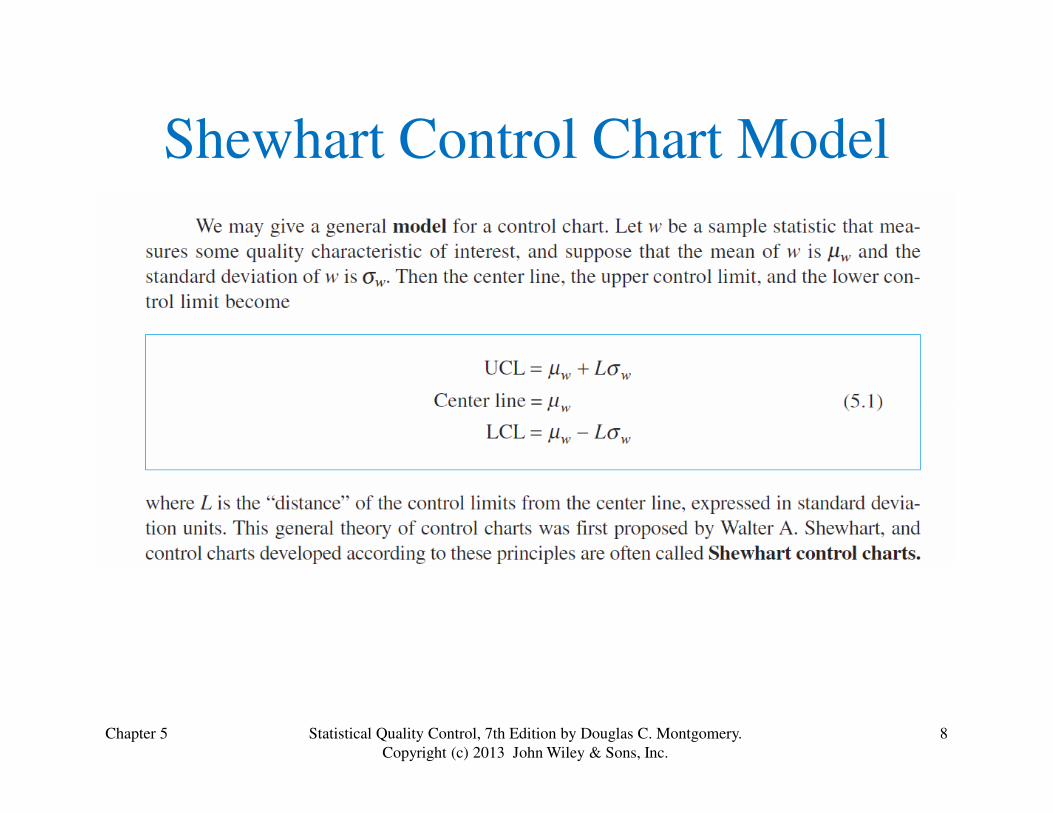
Shewhart Control Chart Model
Chapter 5 8Statistical Quality Control, 7th Edition by Douglas C. Montgomery.
Copyright (c) 2013 John Wiley & Sons, Inc.
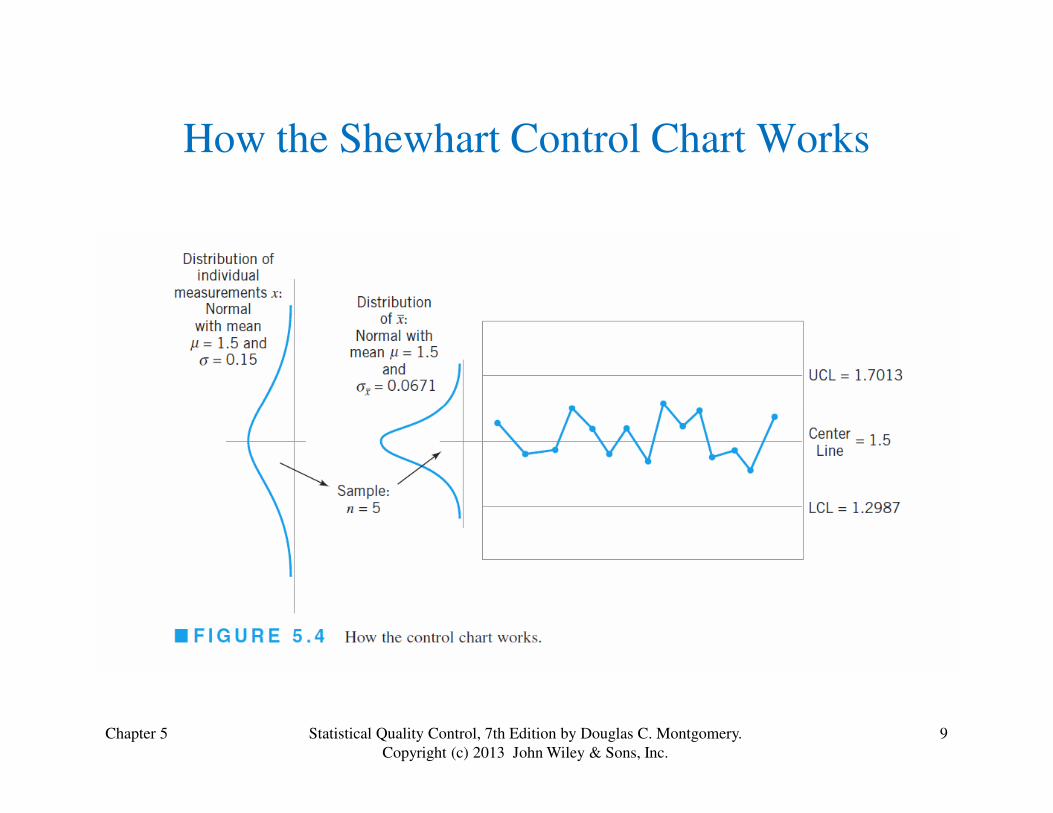
How the Shewhart Control Chart Works
Chapter 5 9Statistical Quality Control, 7th Edition by Douglas C. Montgomery.
Copyright (c) 2013 John Wiley & Sons, Inc.
Chapter 5 10Statistical Quality Control, 7th Edition by Douglas C. Montgomery.
Copyright (c) 2013 John Wiley & Sons, Inc.
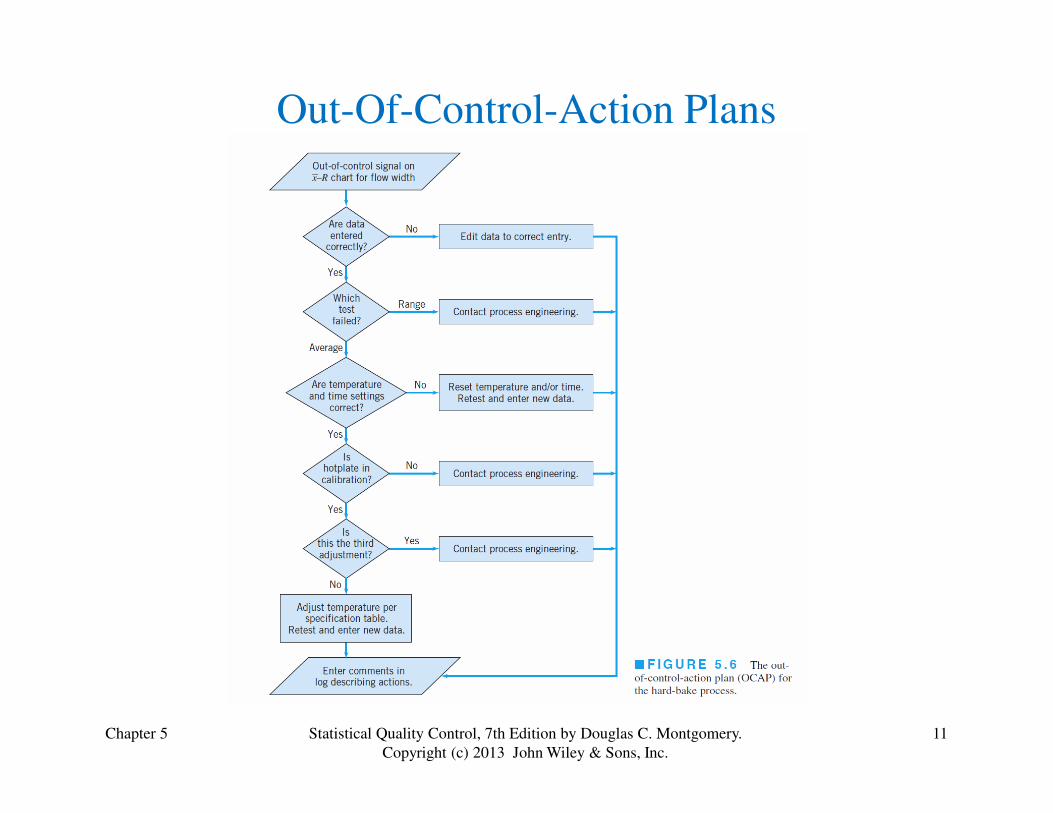
Out-Of-Control-Action Plans
Chapter 5 11Statistical Quality Control, 7th Edition by Douglas C. Montgomery.
Copyright (c) 2013 John Wiley & Sons, Inc.
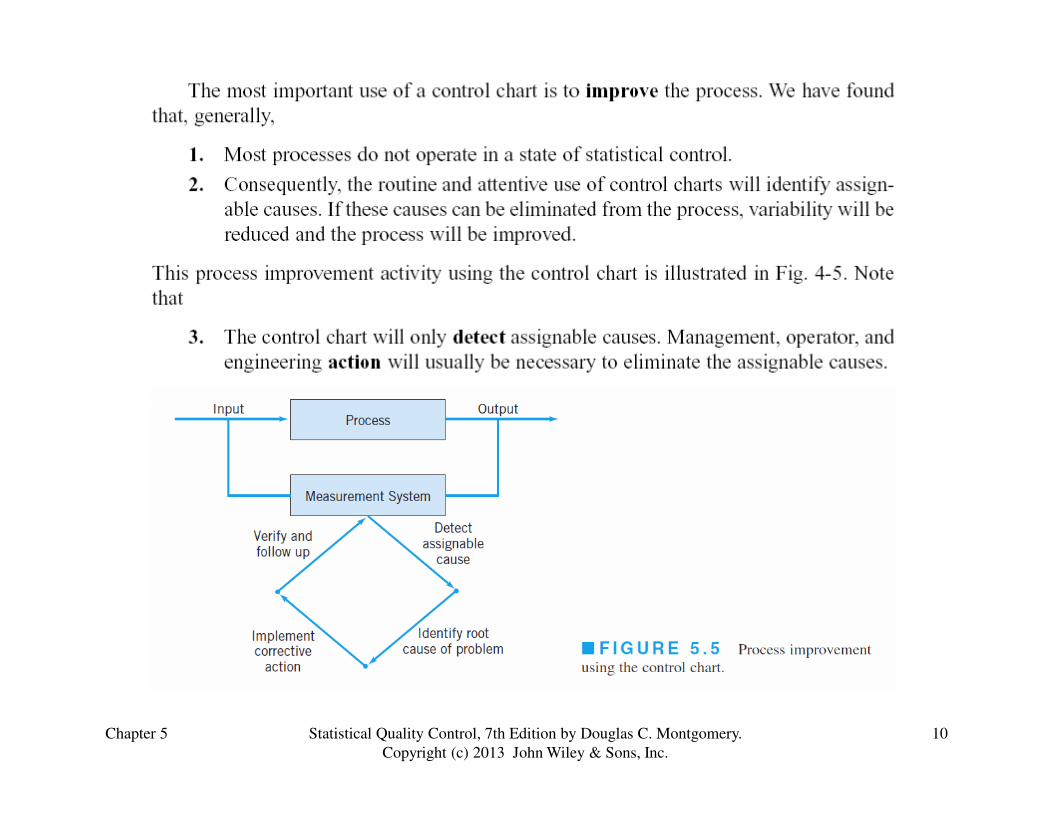
More Basic Principles
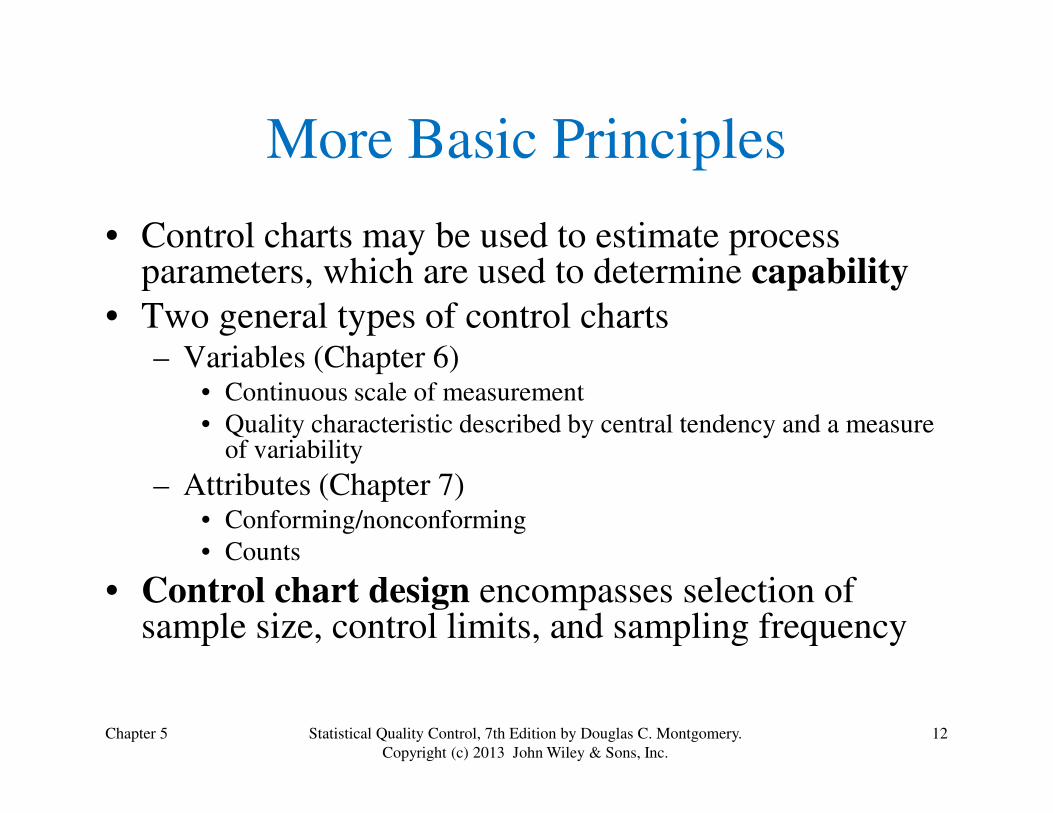
• Control charts may be used to estimate process parameters, which are used to determine capability
• Two general types of control charts– Variables (Chapter 6)
• Continuous scale of measurement
Chapter 5 12Statistical Quality Control, 7th Edition by Douglas C. Montgomery.
Copyright (c) 2013 John Wiley & Sons, Inc.
• Quality characteristic described by central tendency and a measure of variability
– Attributes (Chapter 7)• Conforming/nonconforming
• Counts
• Control chart design encompasses selection of sample size, control limits, and sampling frequency
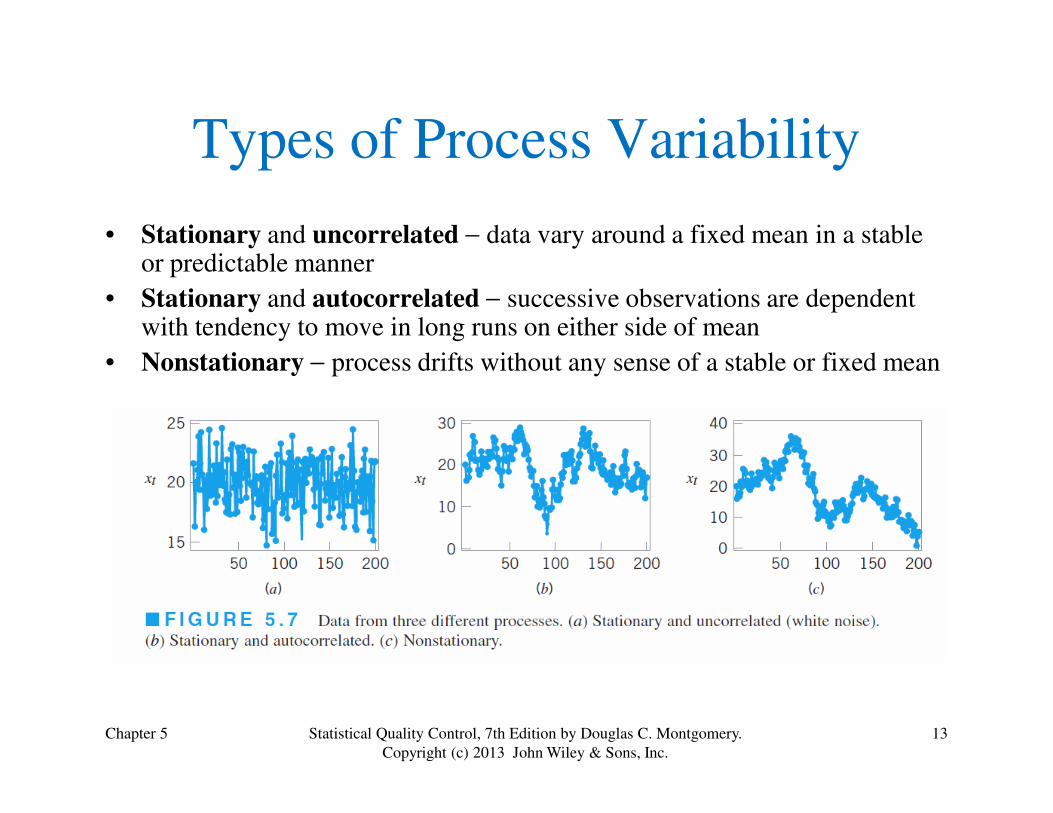
Types of Process Variability
• Stationary and uncorrelated − data vary around a fixed mean in a stable or predictable manner
• Stationary and autocorrelated − successive observations are dependent with tendency to move in long runs on either side of mean
• Nonstationary − process drifts without any sense of a stable or fixed mean
Chapter 5 13Statistical Quality Control, 7th Edition by Douglas C. Montgomery.
Copyright (c) 2013 John Wiley & Sons, Inc.
Reasons for Popularity
of Control Charts
1. Control charts are a proven technique for improving
productivity.
2. Control charts are effective in defect prevention.
3. Control charts prevent unnecessary process
Chapter 5 14Statistical Quality Control, 7th Edition by Douglas C. Montgomery.
Copyright (c) 2013 John Wiley & Sons, Inc.
3. Control charts prevent unnecessary process
adjustment.
4. Control charts provide diagnostic information.
5. Control charts provide information about process
capability.
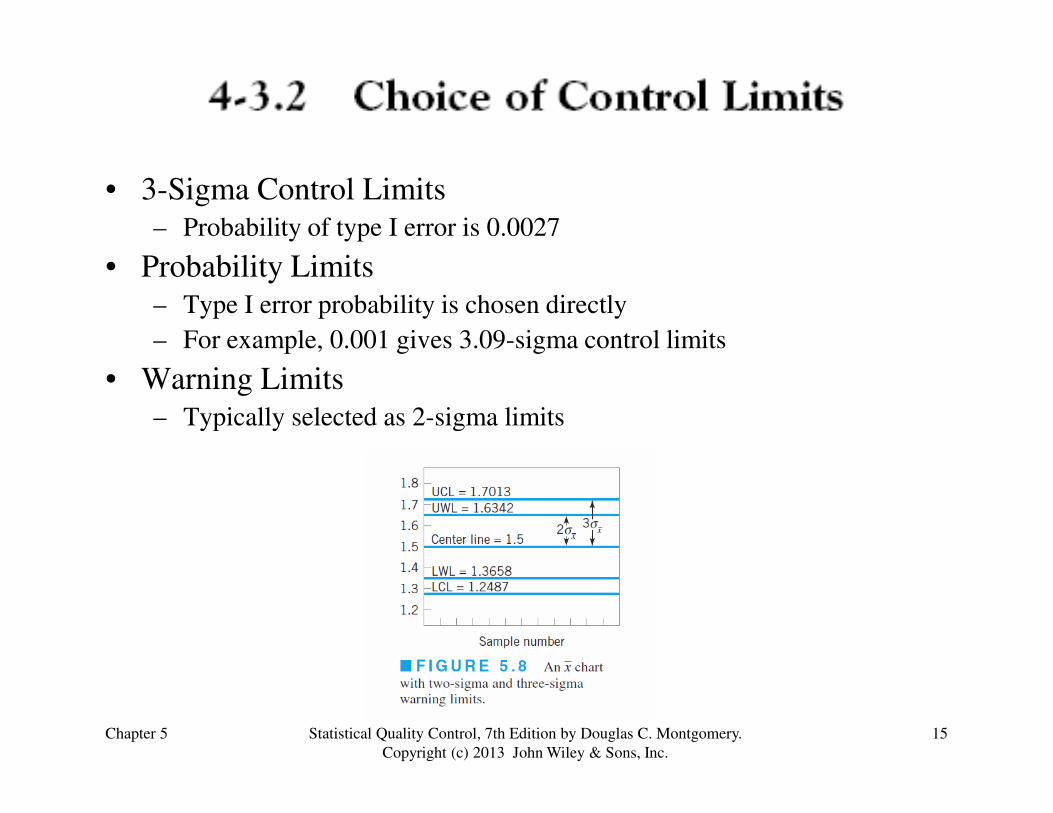
• 3-Sigma Control Limits
– Probability of type I error is 0.0027
• Probability Limits
– Type I error probability is chosen directly
– For example, 0.001 gives 3.09-sigma control limits
• Warning Limits
– Typically selected as 2-sigma limits
Chapter 5 15Statistical Quality Control, 7th Edition by Douglas C. Montgomery.
Copyright (c) 2013 John Wiley & Sons, Inc.
– Typically selected as 2-sigma limits
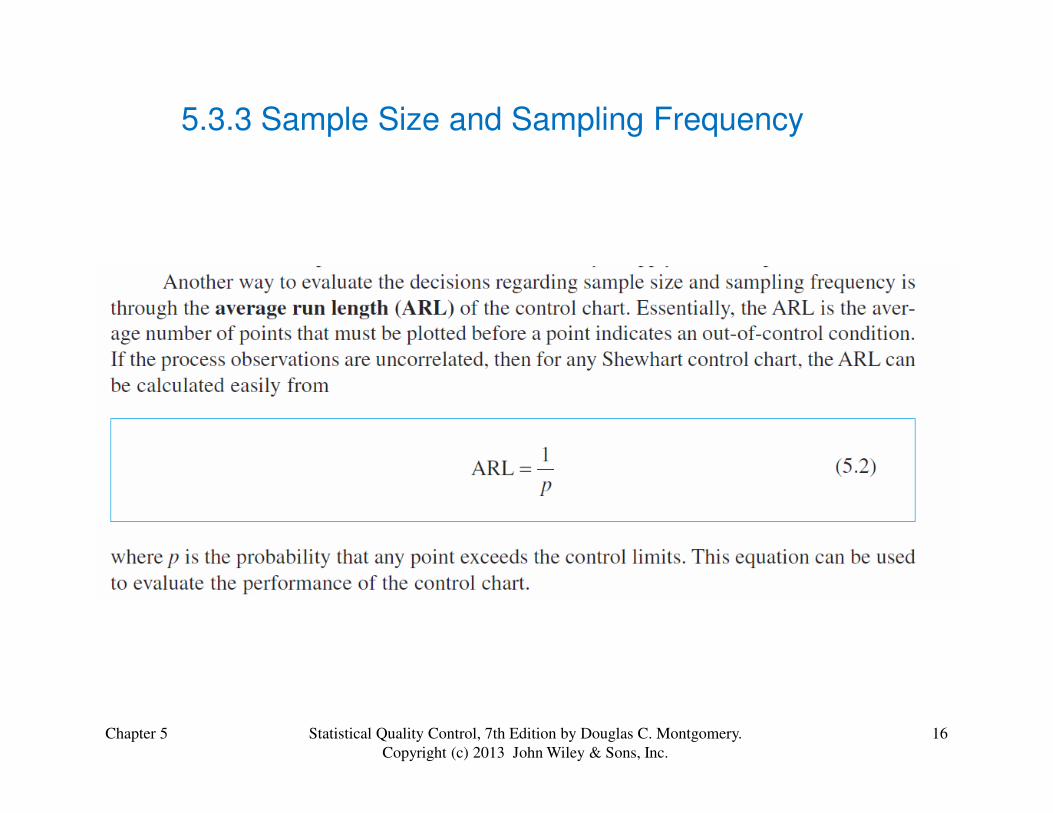
5.3.3 Sample Size and Sampling Frequency
Chapter 5 16Statistical Quality Control, 7th Edition by Douglas C. Montgomery.
Copyright (c) 2013 John Wiley & Sons, Inc.
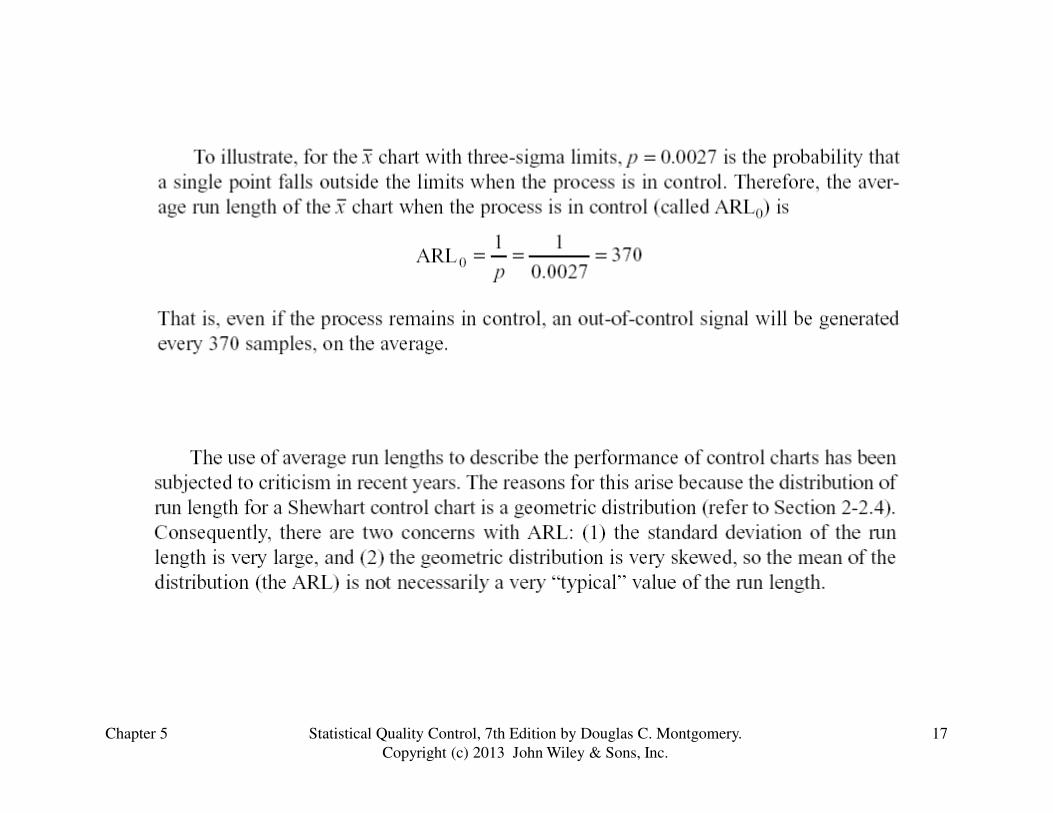
Chapter 5 17Statistical Quality Control, 7th Edition by Douglas C. Montgomery.
Copyright (c) 2013 John Wiley & Sons, Inc.
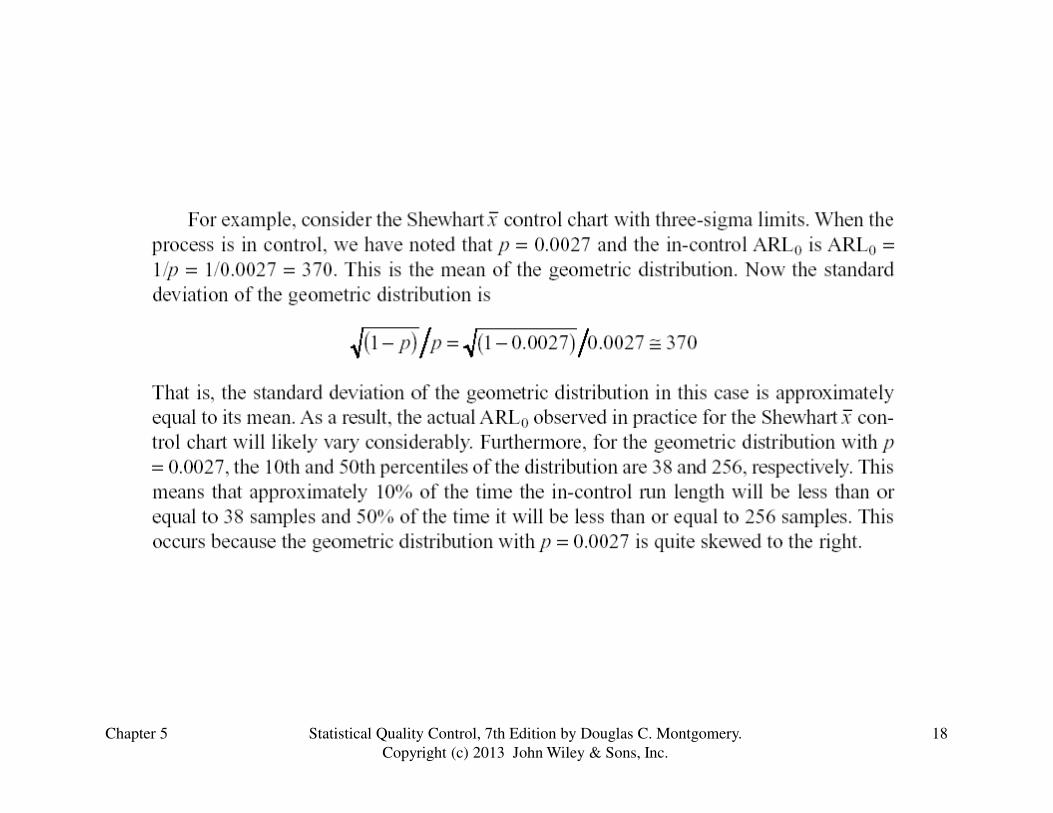
Chapter 5 18Statistical Quality Control, 7th Edition by Douglas C. Montgomery.
Copyright (c) 2013 John Wiley & Sons, Inc.
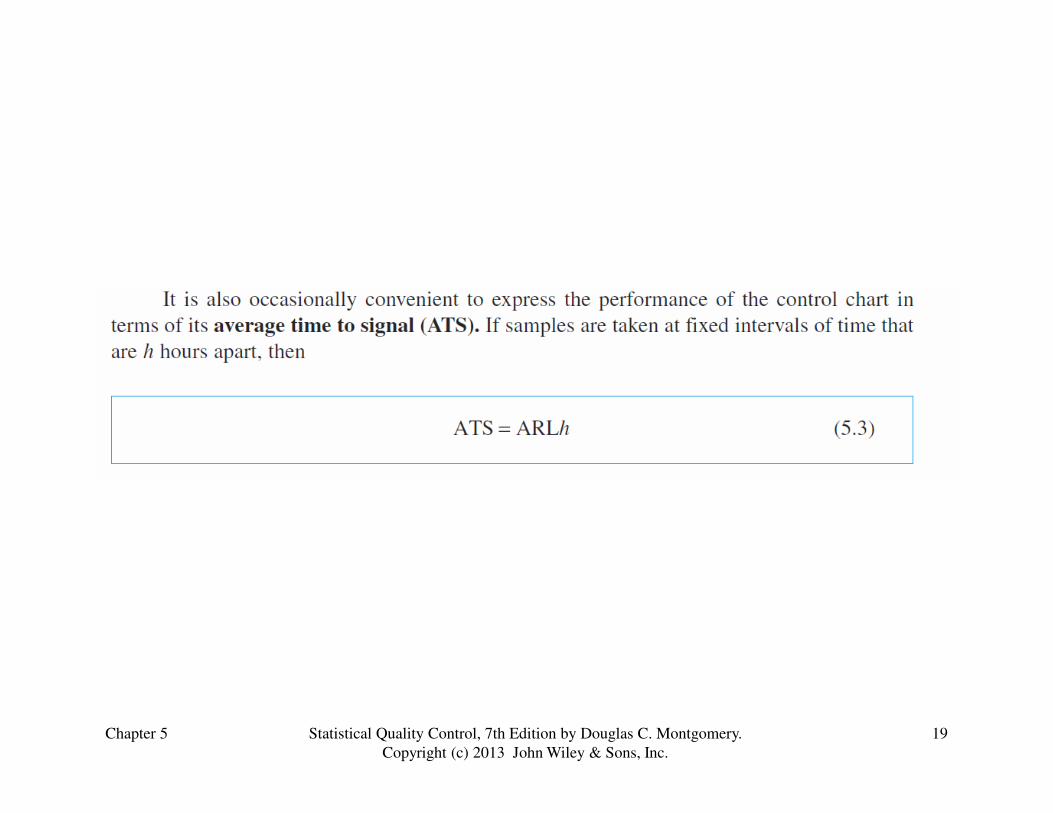
Chapter 5 19Statistical Quality Control, 7th Edition by Douglas C. Montgomery.
Copyright (c) 2013 John Wiley & Sons, Inc.
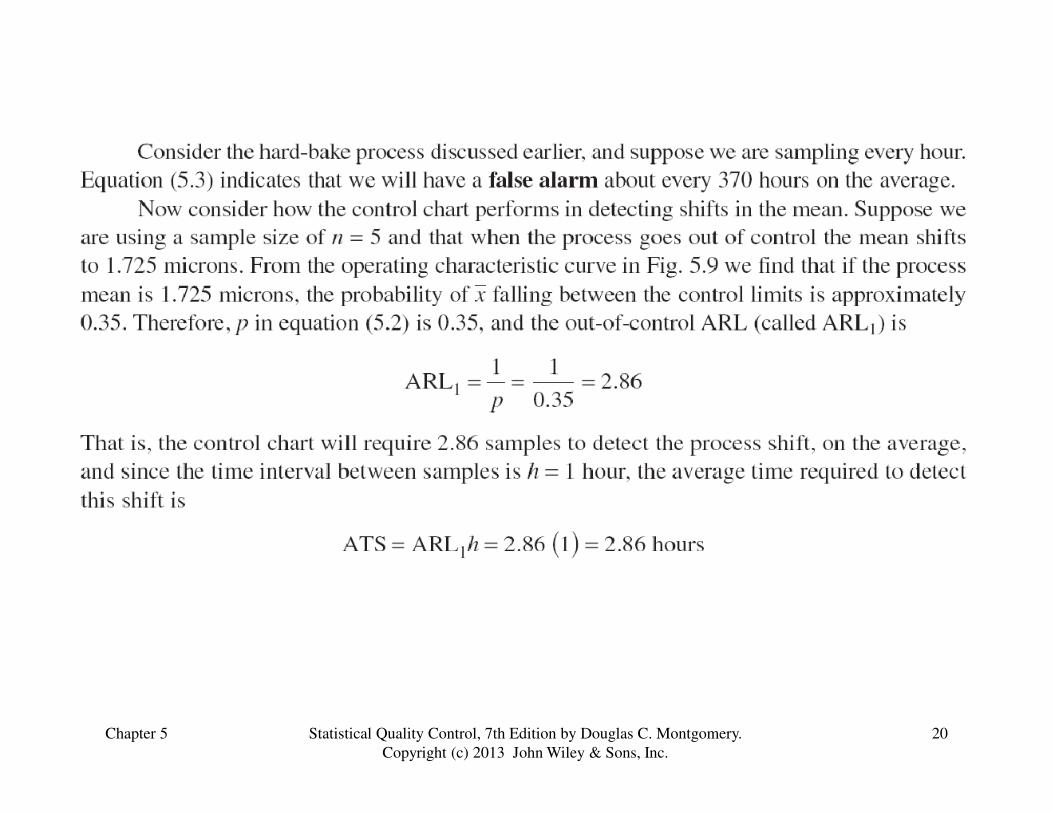
Chapter 5 20Statistical Quality Control, 7th Edition by Douglas C. Montgomery.
Copyright (c) 2013 John Wiley & Sons, Inc.
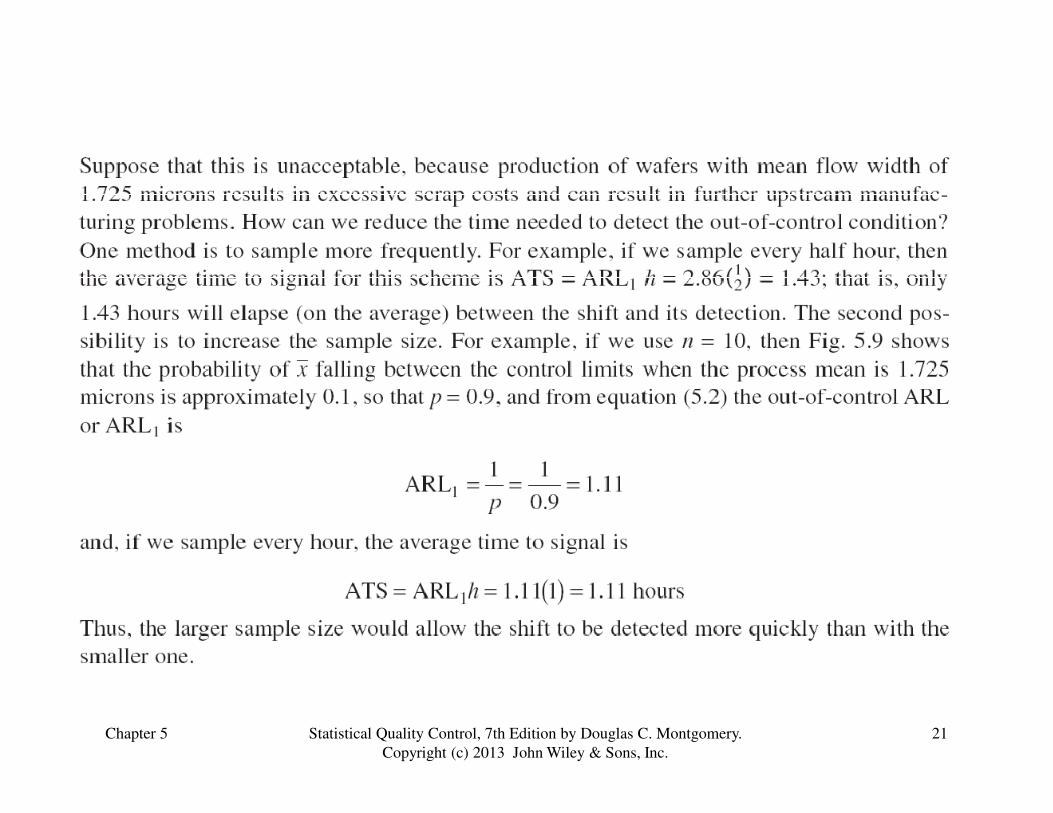
Chapter 5 21Statistical Quality Control, 7th Edition by Douglas C. Montgomery.
Copyright (c) 2013 John Wiley & Sons, Inc.
Chapter 5 22Statistical Quality Control, 7th Edition by Douglas C. Montgomery.
Copyright (c) 2013 John Wiley & Sons, Inc.
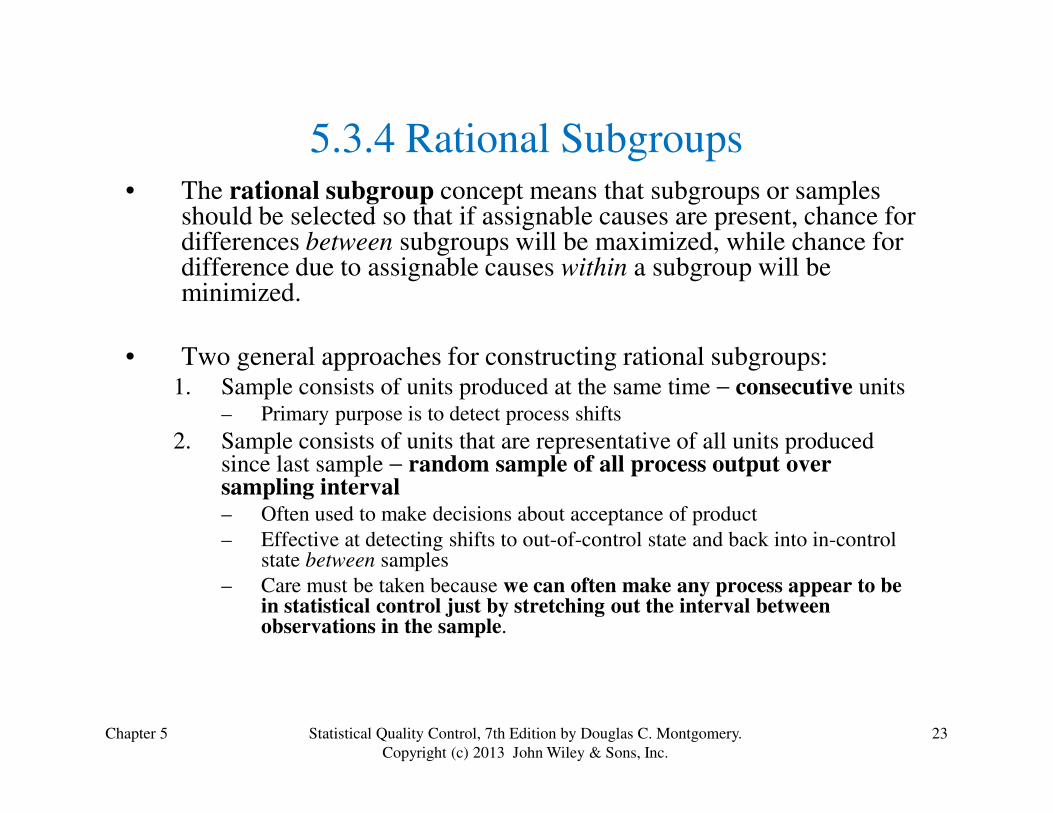
5.3.4 Rational Subgroups• The rational subgroup concept means that subgroups or samples
should be selected so that if assignable causes are present, chance for differences between subgroups will be maximized, while chance for difference due to assignable causes within a subgroup will be minimized.
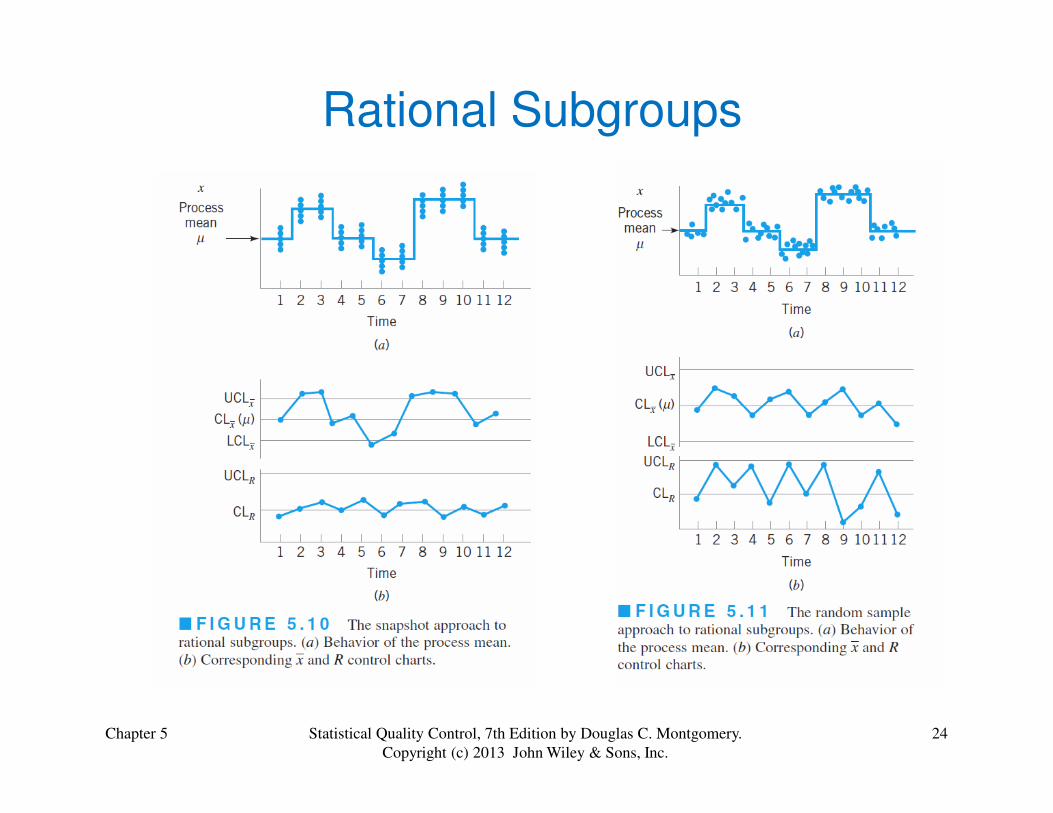
• Two general approaches for constructing rational subgroups:1. Sample consists of units produced at the same time − consecutive units
– Primary purpose is to detect process shifts
Chapter 5 23Statistical Quality Control, 7th Edition by Douglas C. Montgomery.
Copyright (c) 2013 John Wiley & Sons, Inc.
– Primary purpose is to detect process shifts
2. Sample consists of units that are representative of all units produced since last sample − random sample of all process output over sampling interval– Often used to make decisions about acceptance of product
– Effective at detecting shifts to out-of-control state and back into in-control state between samples
– Care must be taken because we can often make any process appear to be in statistical control just by stretching out the interval between observations in the sample.
Rational Subgroups
Chapter 5 24Statistical Quality Control, 7th Edition by Douglas C. Montgomery.
Copyright (c) 2013 John Wiley & Sons, Inc.
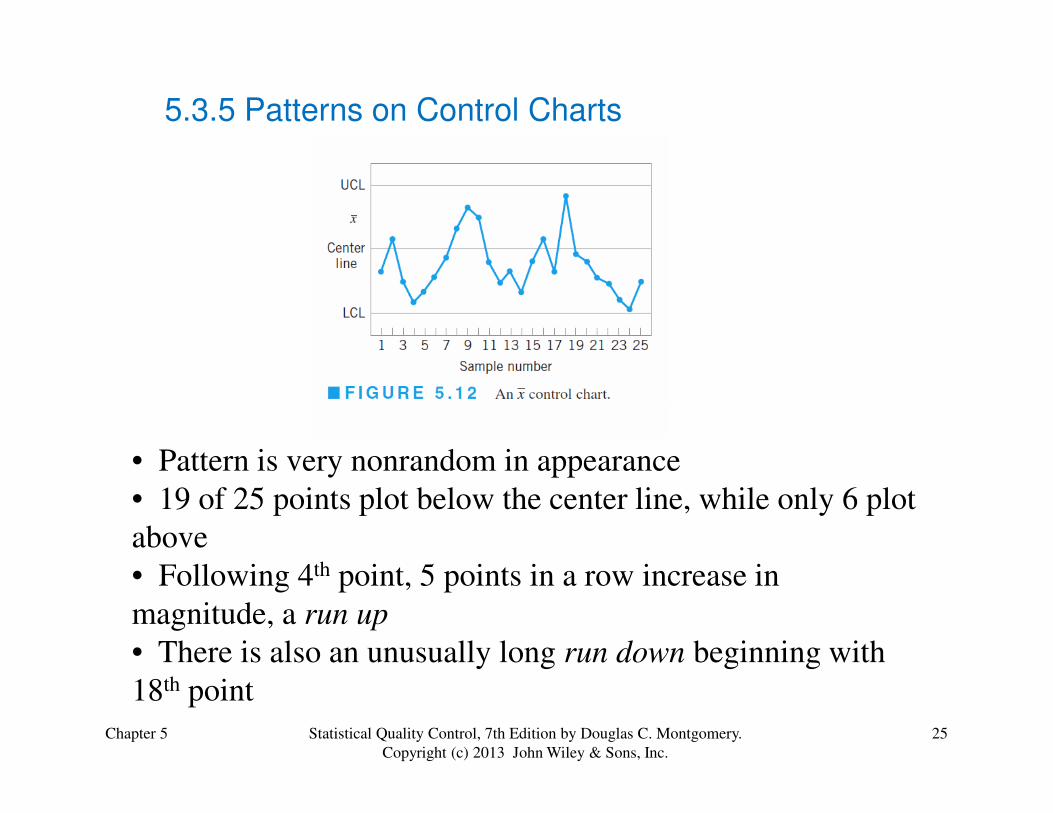
5.3.5 Patterns on Control Charts
Chapter 5 25Statistical Quality Control, 7th Edition by Douglas C. Montgomery.
Copyright (c) 2013 John Wiley & Sons, Inc.
• Pattern is very nonrandom in appearance
• 19 of 25 points plot below the center line, while only 6 plot
above
• Following 4th point, 5 points in a row increase in
magnitude, a run up
• There is also an unusually long run down beginning with
18th point
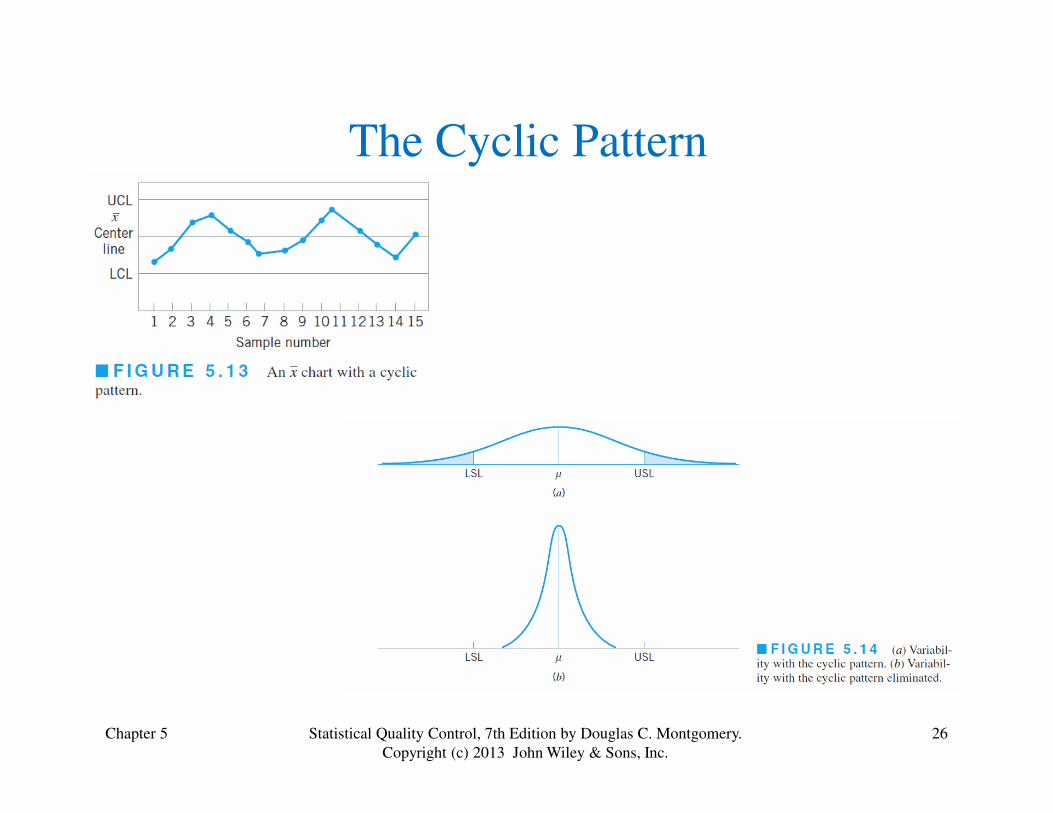
The Cyclic Pattern
Chapter 5 26Statistical Quality Control, 7th Edition by Douglas C. Montgomery.
Copyright (c) 2013 John Wiley & Sons, Inc.
Chapter 5 27Statistical Quality Control, 7th Edition by Douglas C. Montgomery.
Copyright (c) 2013 John Wiley & Sons, Inc.
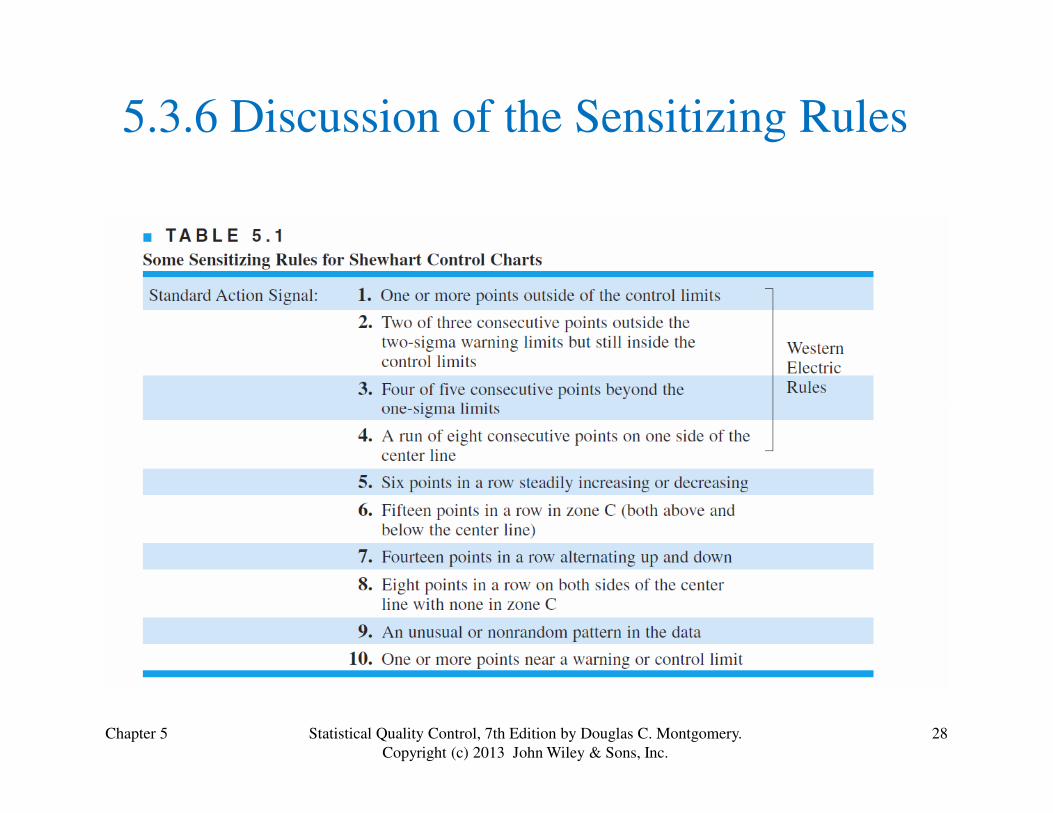
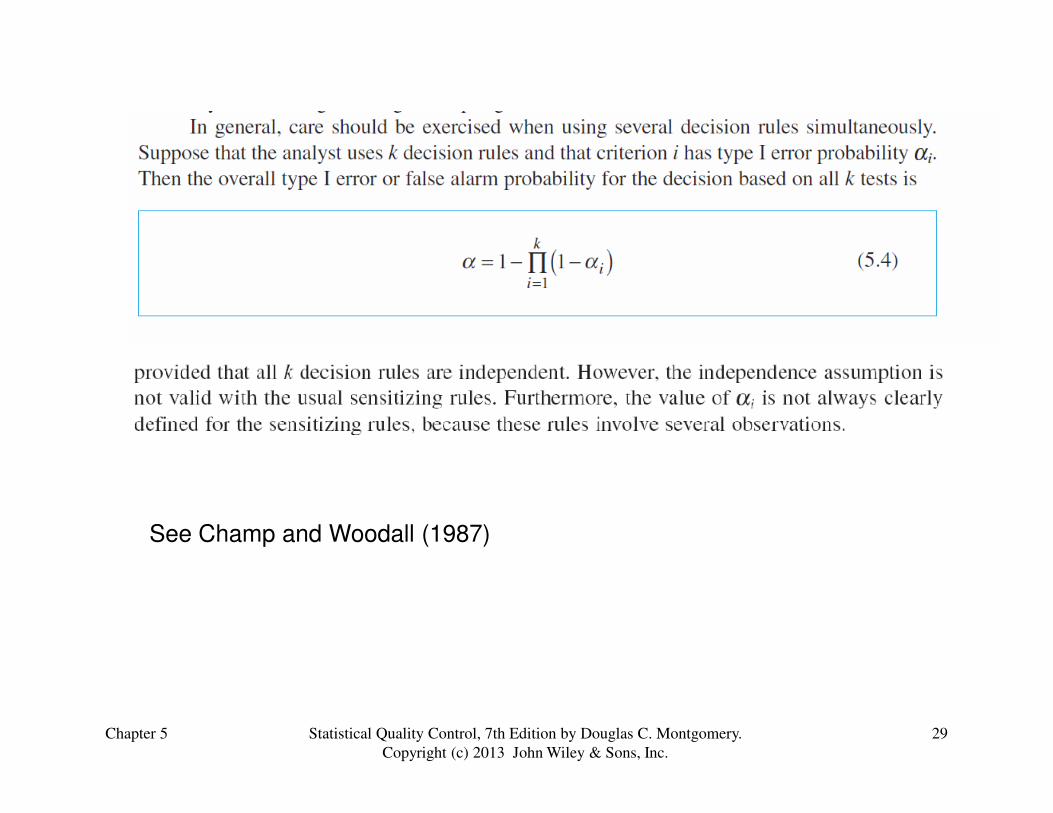
5.3.6 Discussion of the Sensitizing Rules
Chapter 5 28Statistical Quality Control, 7th Edition by Douglas C. Montgomery.
Copyright (c) 2013 John Wiley & Sons, Inc.
Chapter 5 29Statistical Quality Control, 7th Edition by Douglas C. Montgomery.
Copyright (c) 2013 John Wiley & Sons, Inc.
See Champ and Woodall (1987)
Chapter 5 30Statistical Quality Control, 7th Edition by Douglas C. Montgomery.
Copyright (c) 2013 John Wiley & Sons, Inc.
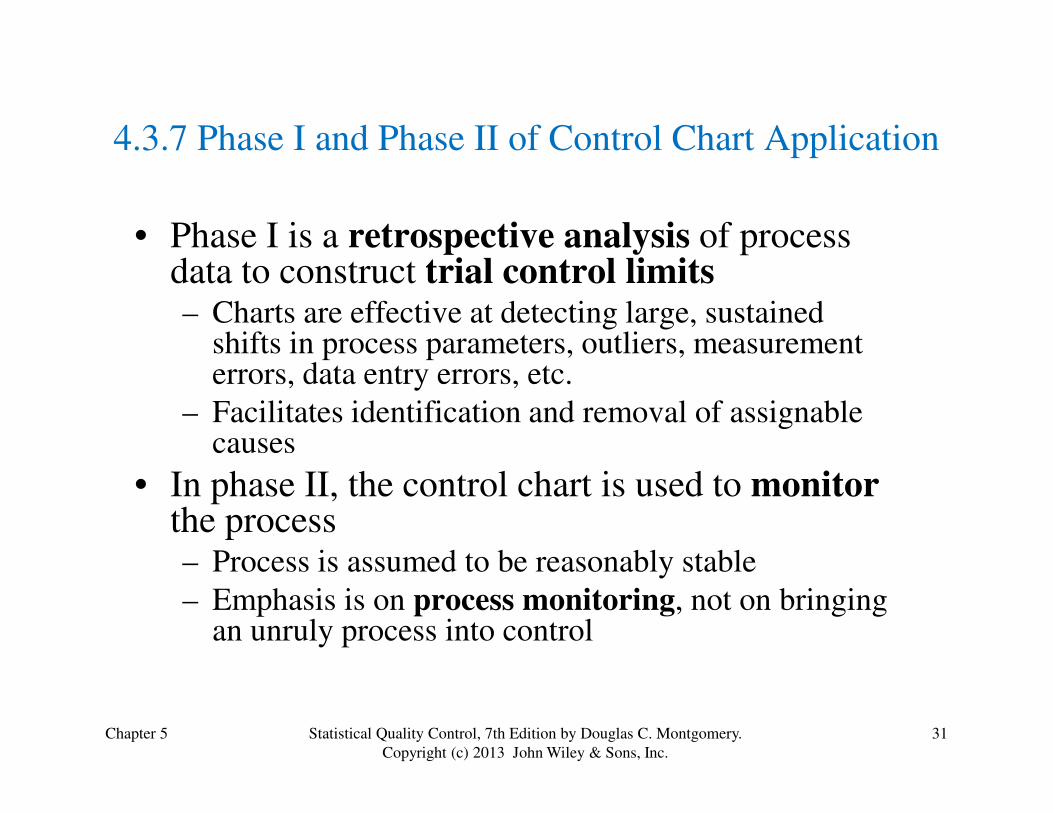
4.3.7 Phase I and Phase II of Control Chart Application
• Phase I is a retrospective analysis of process data to construct trial control limits– Charts are effective at detecting large, sustained
shifts in process parameters, outliers, measurement errors, data entry errors, etc.
– Facilitates identification and removal of assignable
Chapter 5 31Statistical Quality Control, 7th Edition by Douglas C. Montgomery.
Copyright (c) 2013 John Wiley & Sons, Inc.
– Facilitates identification and removal of assignable causes
• In phase II, the control chart is used to monitorthe process– Process is assumed to be reasonably stable
– Emphasis is on process monitoring, not on bringing an unruly process into control
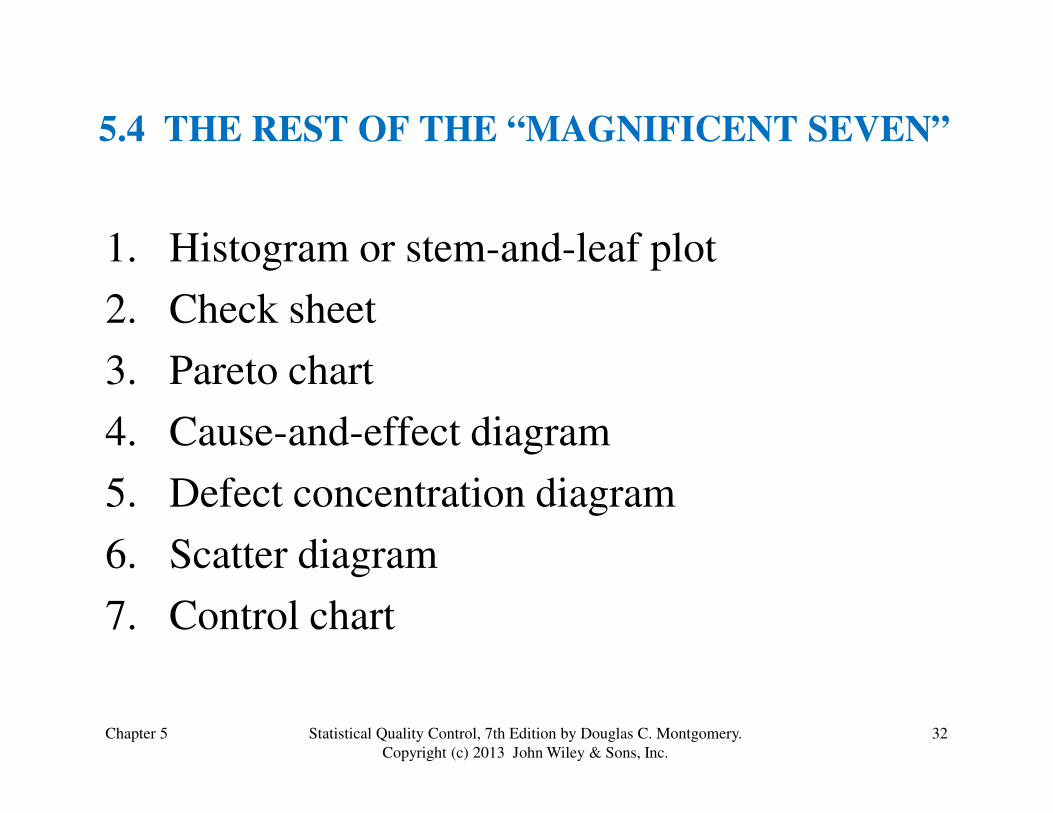
1. Histogram or stem-and-leaf plot
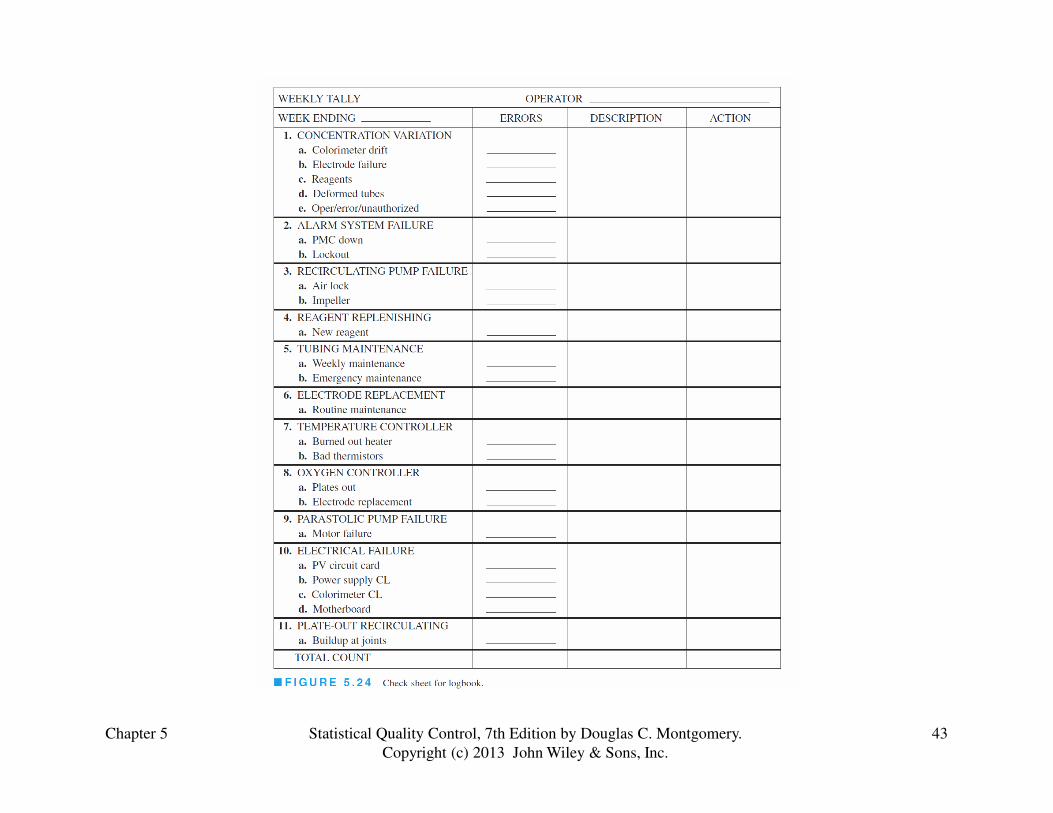
2. Check sheet
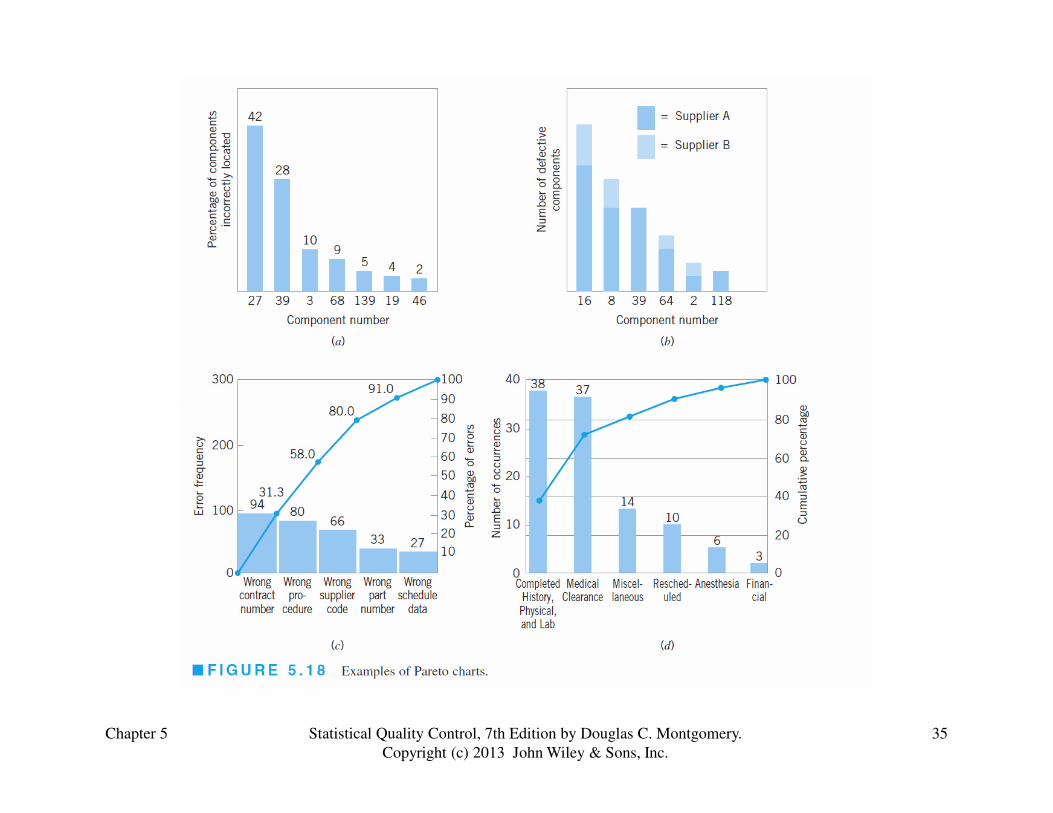
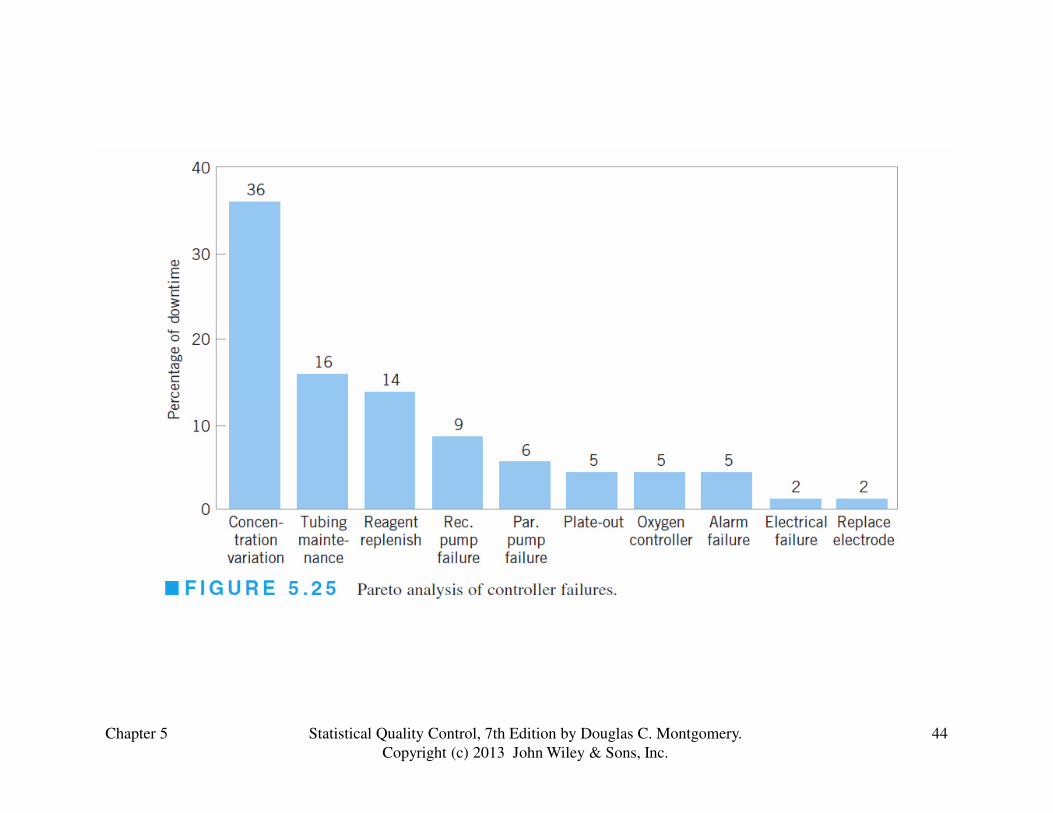
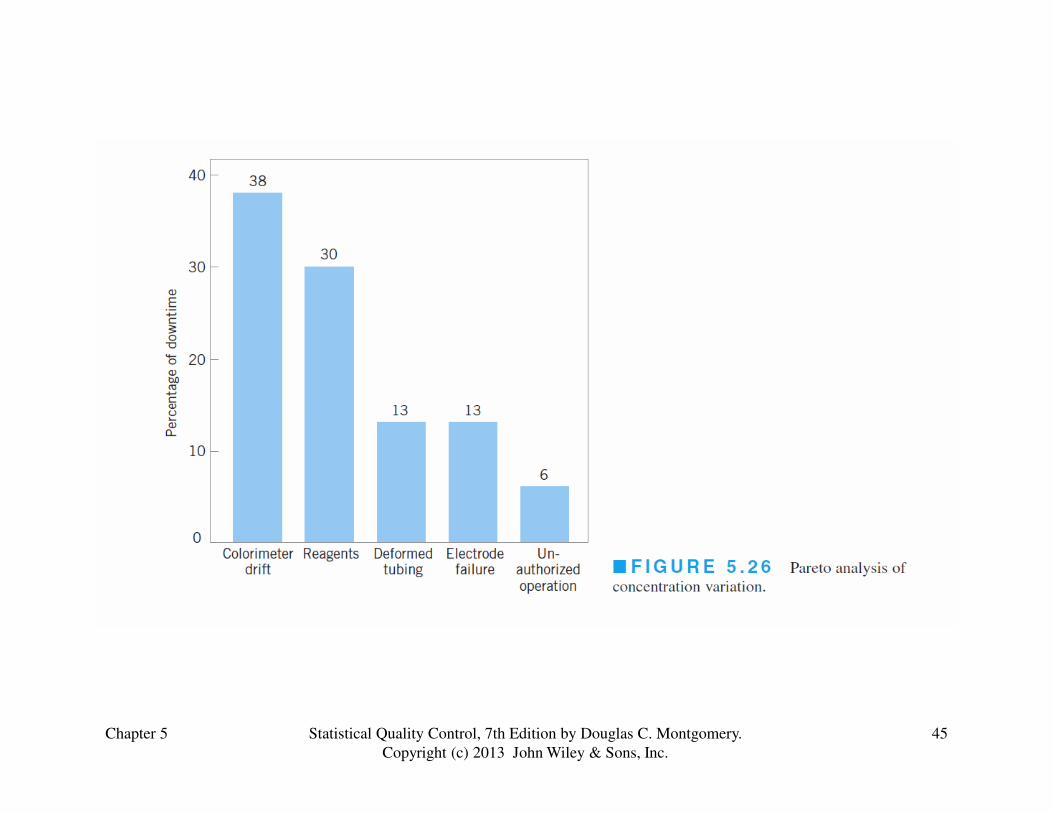
3. Pareto chart
5.4 THE REST OF THE “MAGNIFICENT SEVEN”
Chapter 5 32Statistical Quality Control, 7th Edition by Douglas C. Montgomery.
Copyright (c) 2013 John Wiley & Sons, Inc.
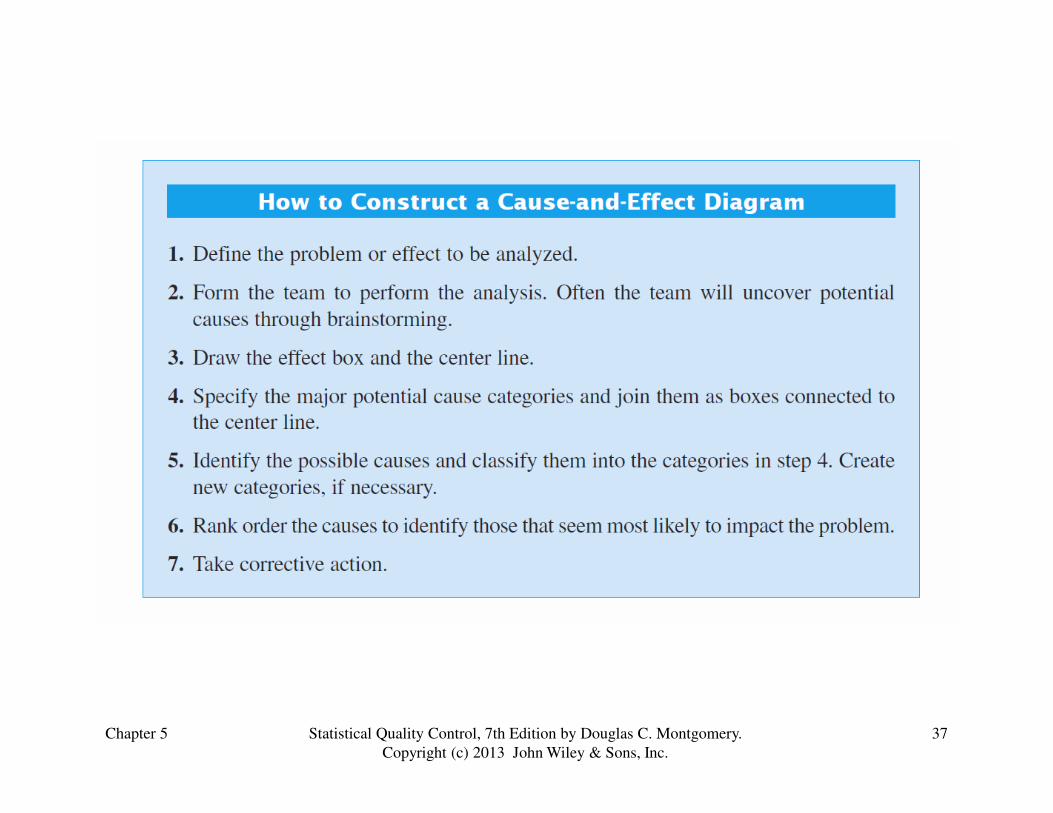
4. Cause-and-effect diagram
5. Defect concentration diagram
6. Scatter diagram
7. Control chart
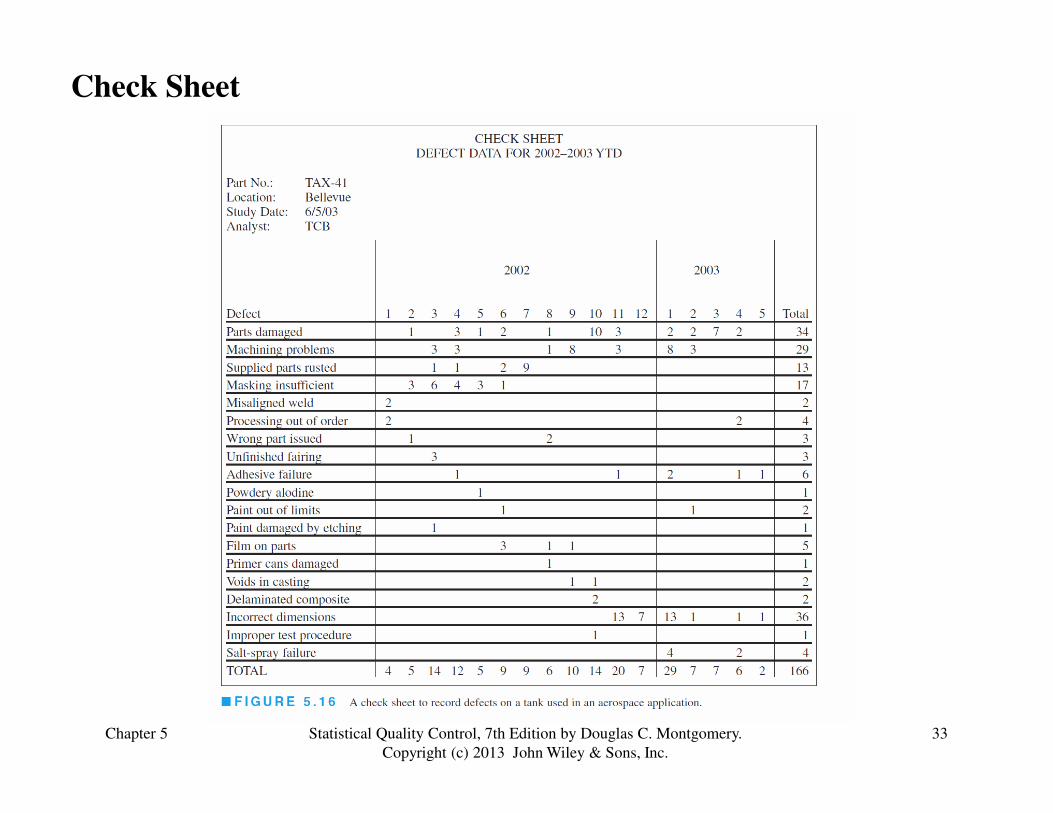
Check Sheet
Chapter 5 33Statistical Quality Control, 7th Edition by Douglas C. Montgomery.
Copyright (c) 2013 John Wiley & Sons, Inc.
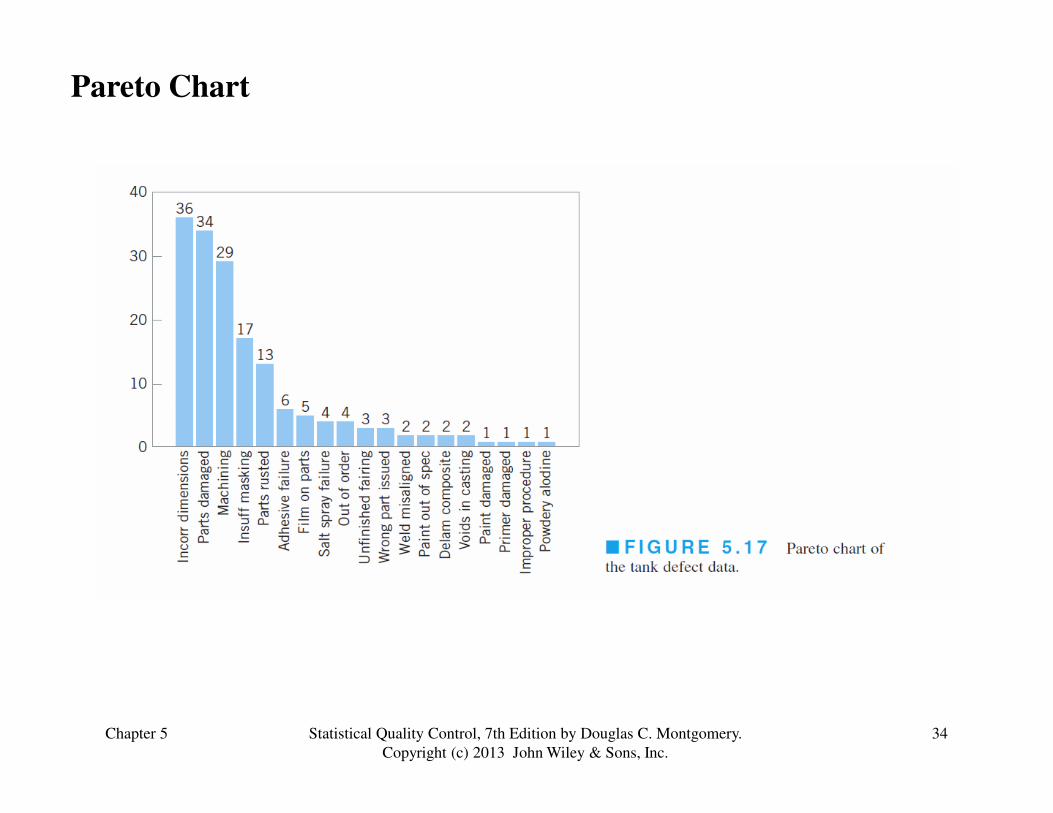
Pareto Chart
Chapter 5 34Statistical Quality Control, 7th Edition by Douglas C. Montgomery.
Copyright (c) 2013 John Wiley & Sons, Inc.
Chapter 5 35Statistical Quality Control, 7th Edition by Douglas C. Montgomery.
Copyright (c) 2013 John Wiley & Sons, Inc.
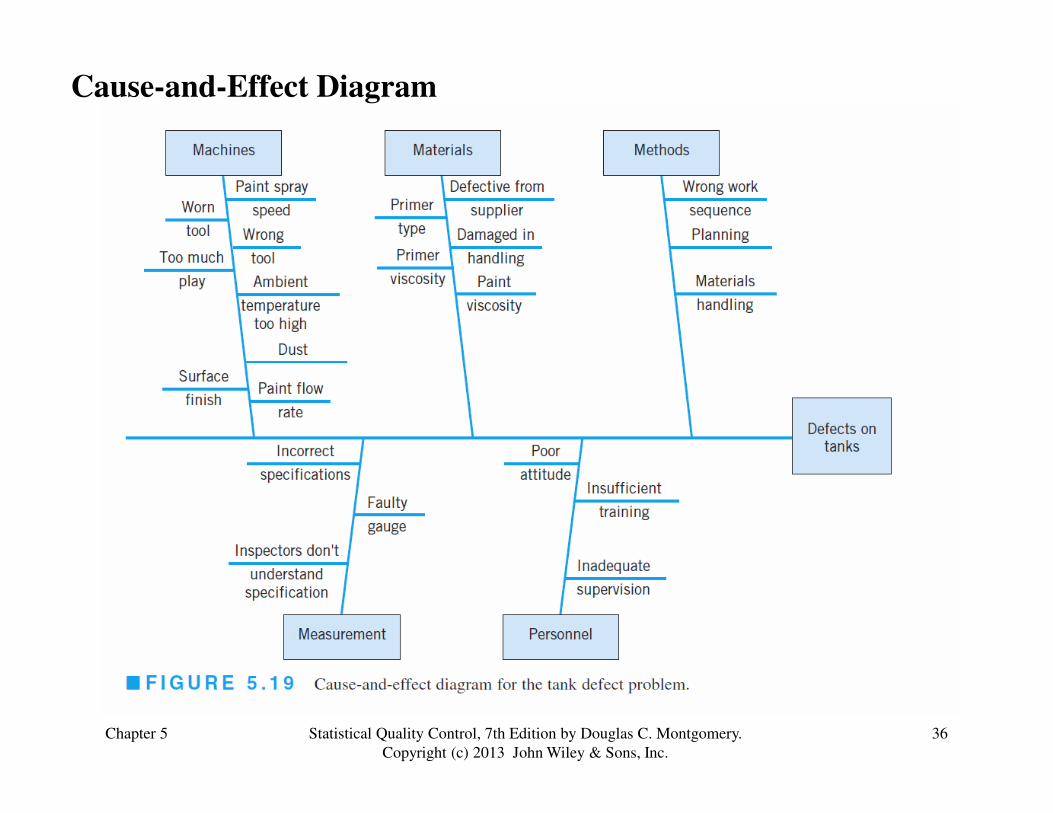
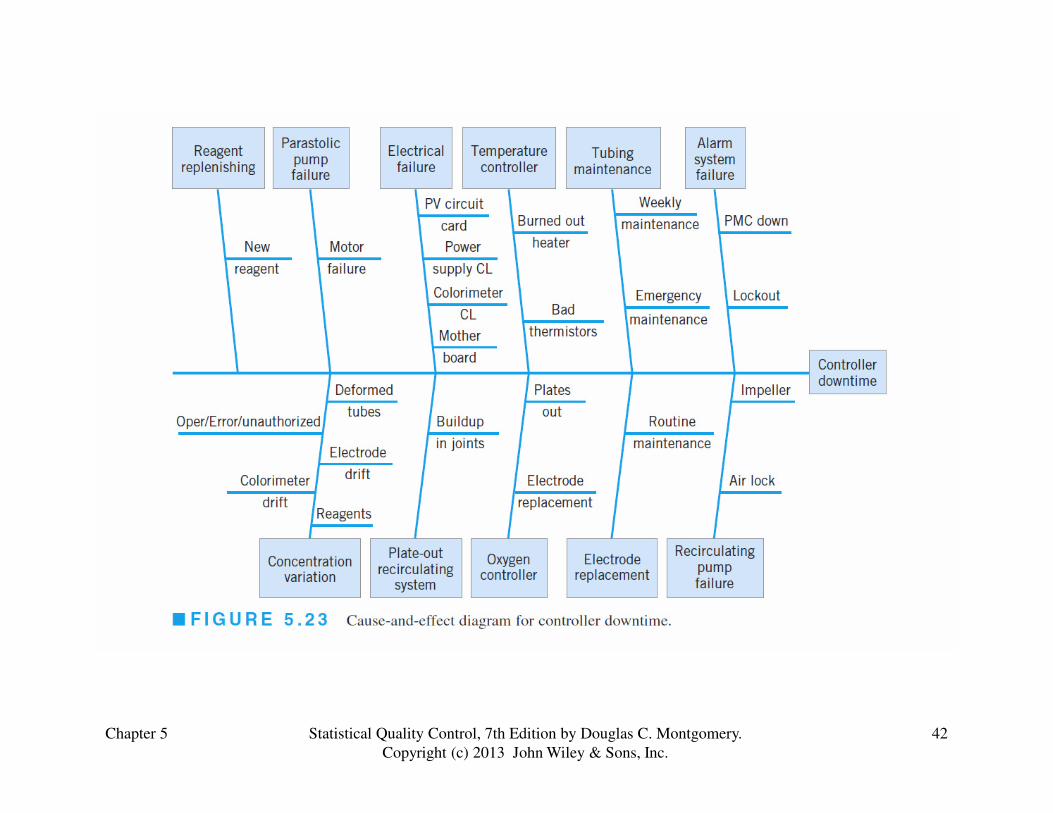
Cause-and-Effect Diagram
Chapter 5 36Statistical Quality Control, 7th Edition by Douglas C. Montgomery.
Copyright (c) 2013 John Wiley & Sons, Inc.
Chapter 5 37Statistical Quality Control, 7th Edition by Douglas C. Montgomery.
Copyright (c) 2013 John Wiley & Sons, Inc.
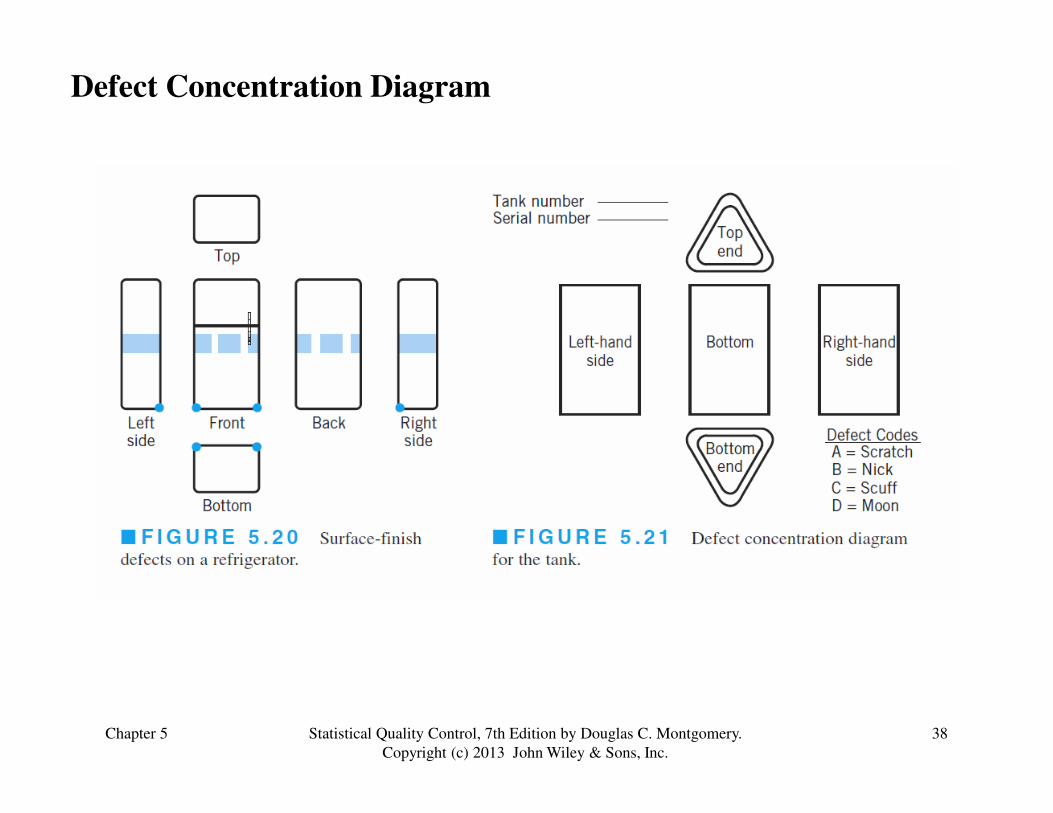
Defect Concentration Diagram
Chapter 5 38Statistical Quality Control, 7th Edition by Douglas C. Montgomery.
Copyright (c) 2013 John Wiley & Sons, Inc.

Scatter Diagram
Chapter 5 39Statistical Quality Control, 7th Edition by Douglas C. Montgomery.
Copyright (c) 2013 John Wiley & Sons, Inc.
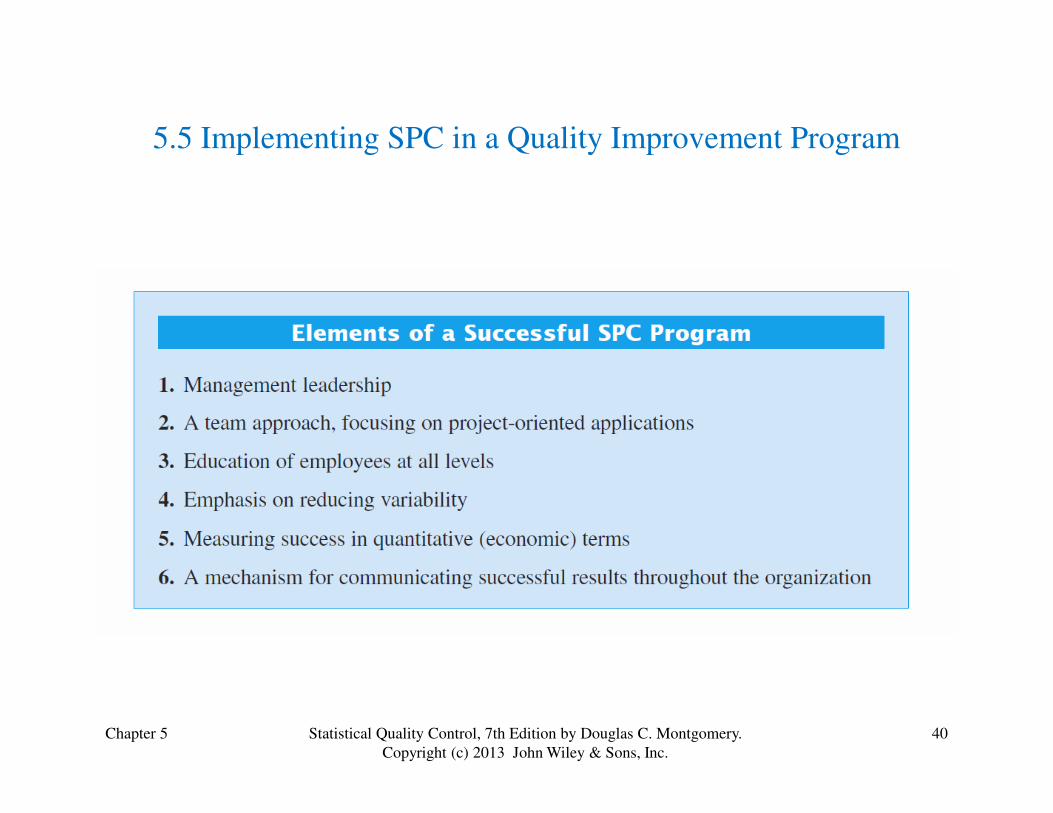
5.5 Implementing SPC in a Quality Improvement Program
Chapter 5 40Statistical Quality Control, 7th Edition by Douglas C. Montgomery.
Copyright (c) 2013 John Wiley & Sons, Inc.
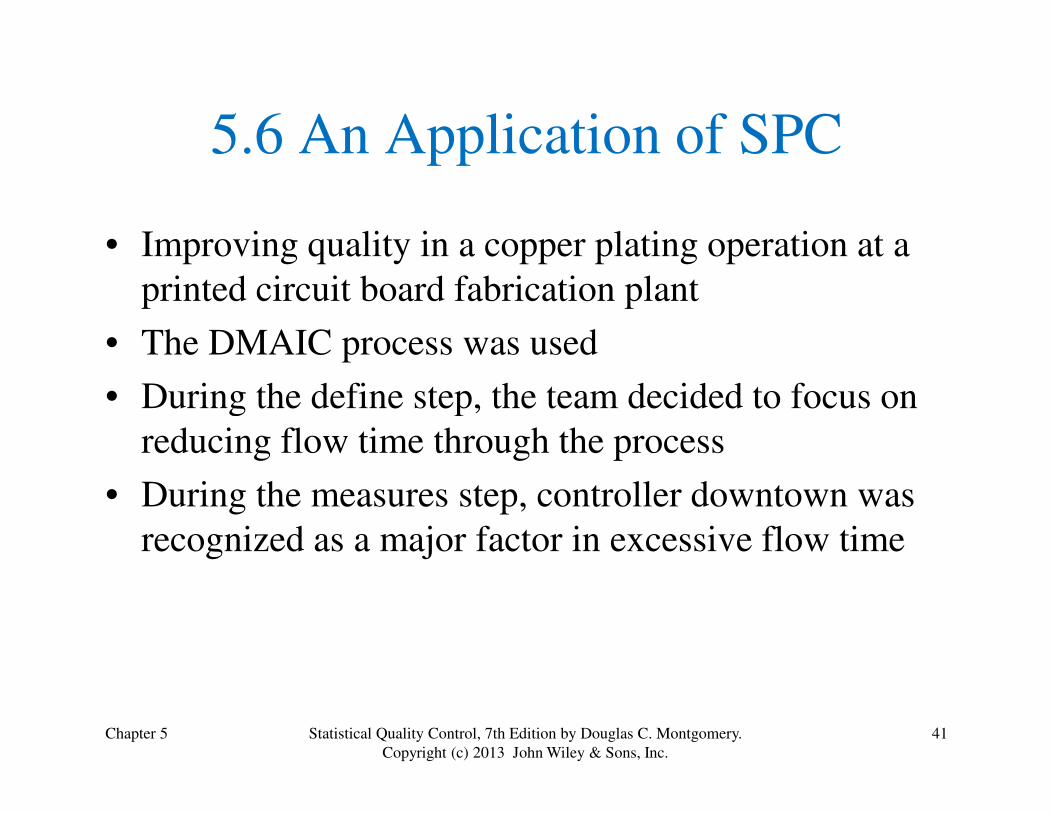
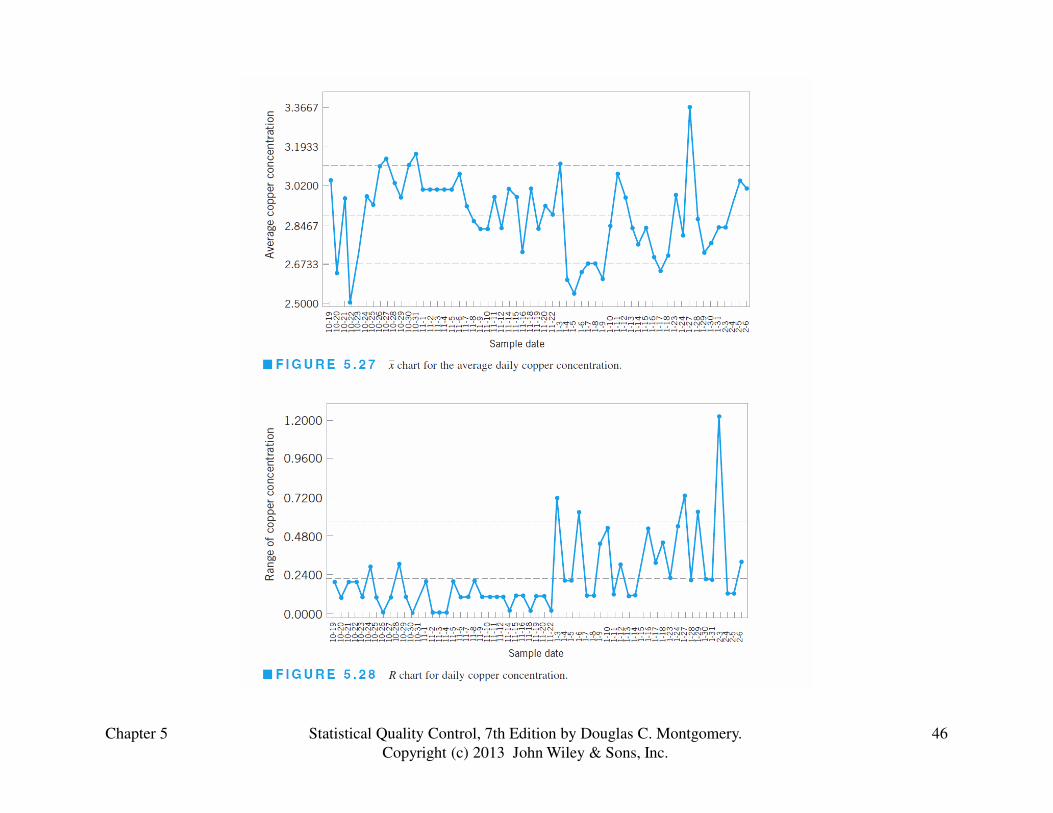
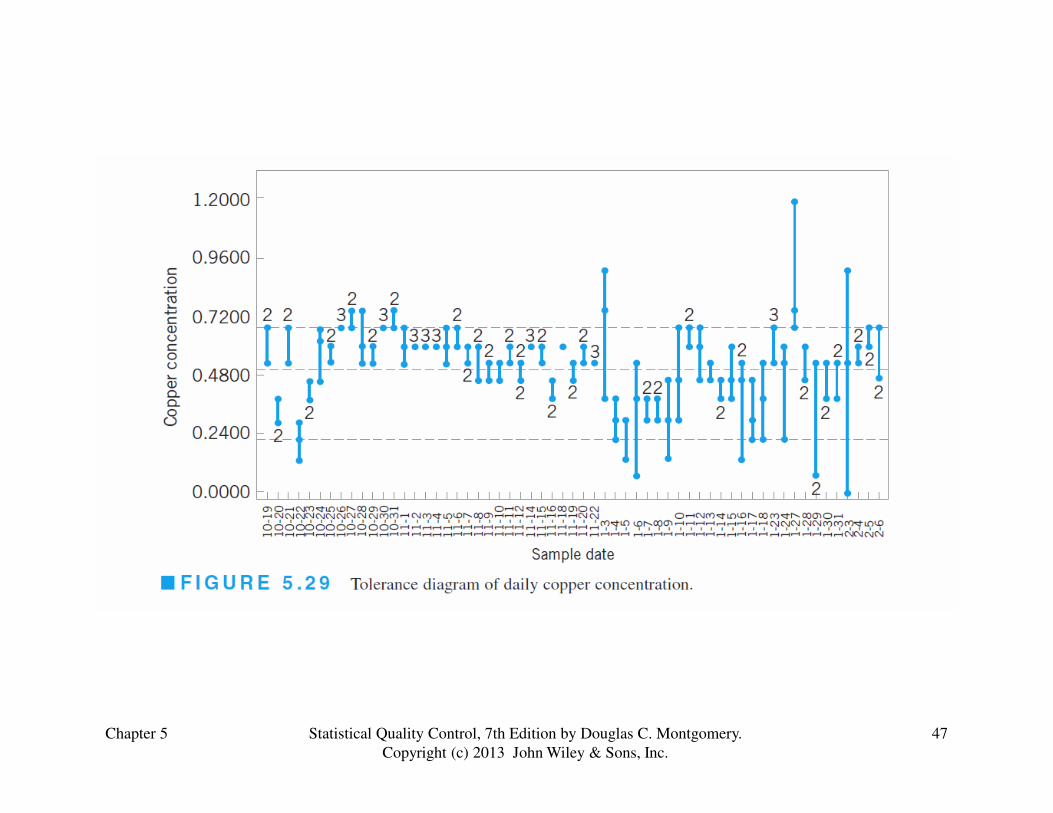
5.6 An Application of SPC
• Improving quality in a copper plating operation at a
printed circuit board fabrication plant
• The DMAIC process was used
• During the define step, the team decided to focus on
Chapter 5 41Statistical Quality Control, 7th Edition by Douglas C. Montgomery.
Copyright (c) 2013 John Wiley & Sons, Inc.
• During the define step, the team decided to focus on
reducing flow time through the process
• During the measures step, controller downtown was
recognized as a major factor in excessive flow time
Chapter 5 42Statistical Quality Control, 7th Edition by Douglas C. Montgomery.
Copyright (c) 2013 John Wiley & Sons, Inc.
Chapter 5 43Statistical Quality Control, 7th Edition by Douglas C. Montgomery.
Copyright (c) 2013 John Wiley & Sons, Inc.
Chapter 5 44Statistical Quality Control, 7th Edition by Douglas C. Montgomery.
Copyright (c) 2013 John Wiley & Sons, Inc.
Chapter 5 45Statistical Quality Control, 7th Edition by Douglas C. Montgomery.
Copyright (c) 2013 John Wiley & Sons, Inc.
Chapter 5 46Statistical Quality Control, 7th Edition by Douglas C. Montgomery.
Copyright (c) 2013 John Wiley & Sons, Inc.
Chapter 5 47Statistical Quality Control, 7th Edition by Douglas C. Montgomery.
Copyright (c) 2013 John Wiley & Sons, Inc.
Chapter 5 48Statistical Quality Control, 7th Edition by Douglas C. Montgomery.
Copyright (c) 2013 John Wiley & Sons, Inc.
5.7 Applications of SPC and Quality Improvement
Tools in Transactional and Service Businesses
• Nonmanufacturing applications often do not differ substantially from industrial applications, but sometimes require ingenuity
1. Most nonmanufacturing operations do not have a natural measurement system
2. The observability of the process may be fairly low
3. People are usually involved in transactional and services
Chapter 5 49Statistical Quality Control, 7th Edition by Douglas C. Montgomery.
Copyright (c) 2013 John Wiley & Sons, Inc.
3. People are usually involved in transactional and services processes, and variability between people may be an important part of the problem
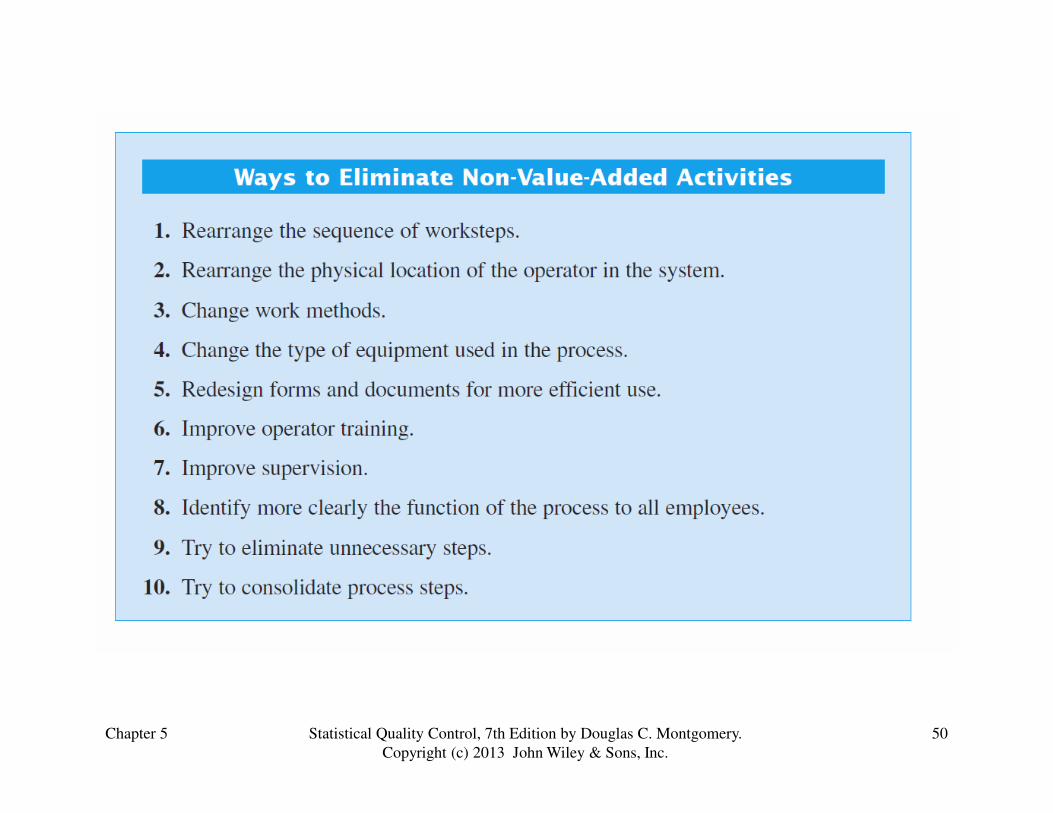
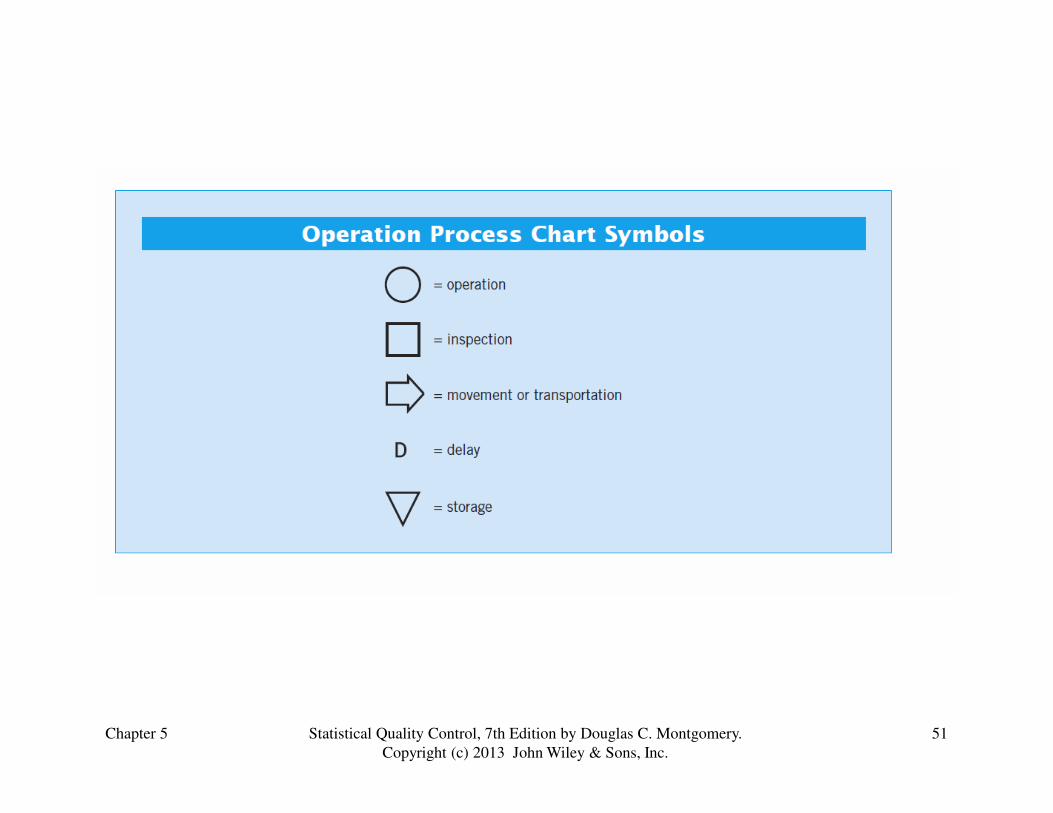
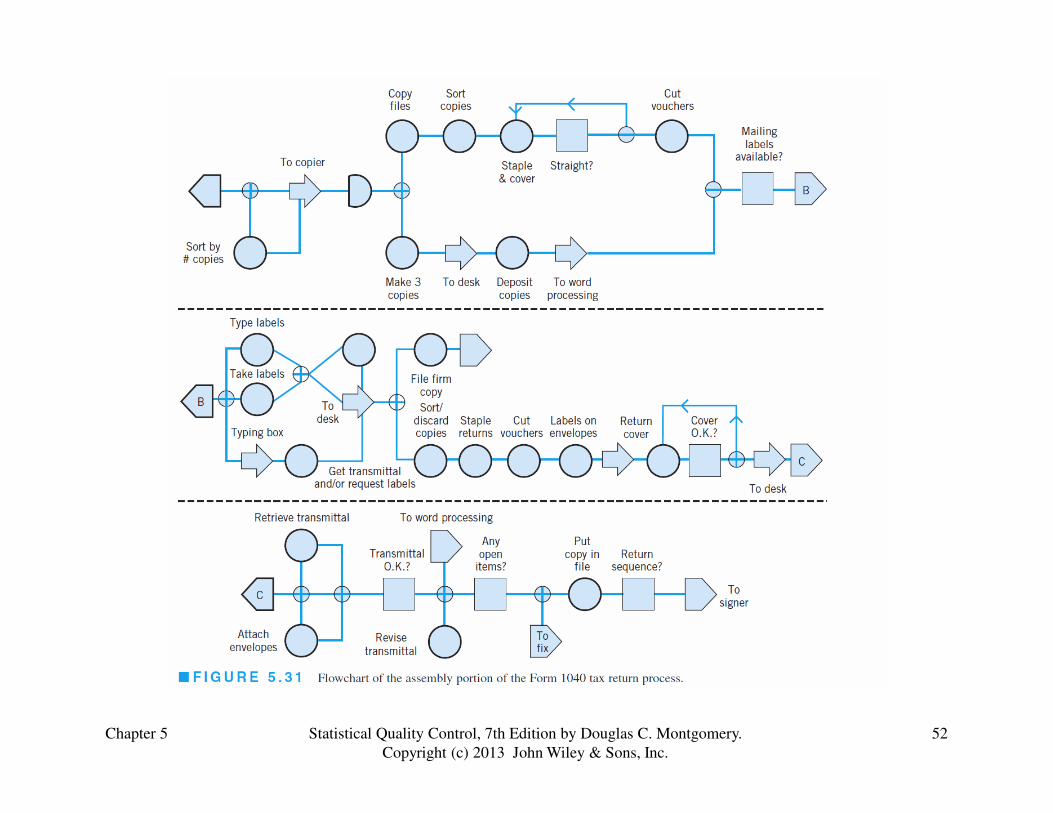
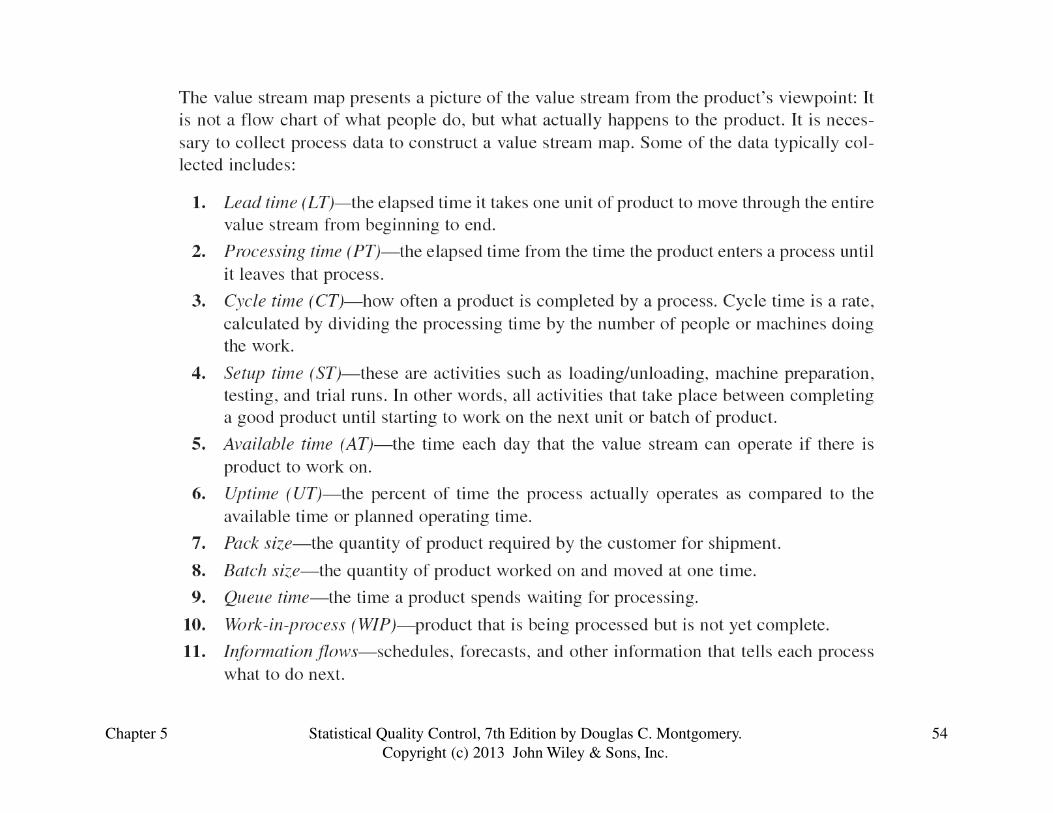
• Flow charts, operation process charts and value stream mapping are particularly useful in developing process definition and process understanding. This is sometimes called process mapping.
– Used to identify value-added versus nonvalue-addedactivity
Chapter 5 50Statistical Quality Control, 7th Edition by Douglas C. Montgomery.
Copyright (c) 2013 John Wiley & Sons, Inc.
Chapter 5 51Statistical Quality Control, 7th Edition by Douglas C. Montgomery.
Copyright (c) 2013 John Wiley & Sons, Inc.
Chapter 5 52Statistical Quality Control, 7th Edition by Douglas C. Montgomery.
Copyright (c) 2013 John Wiley & Sons, Inc.
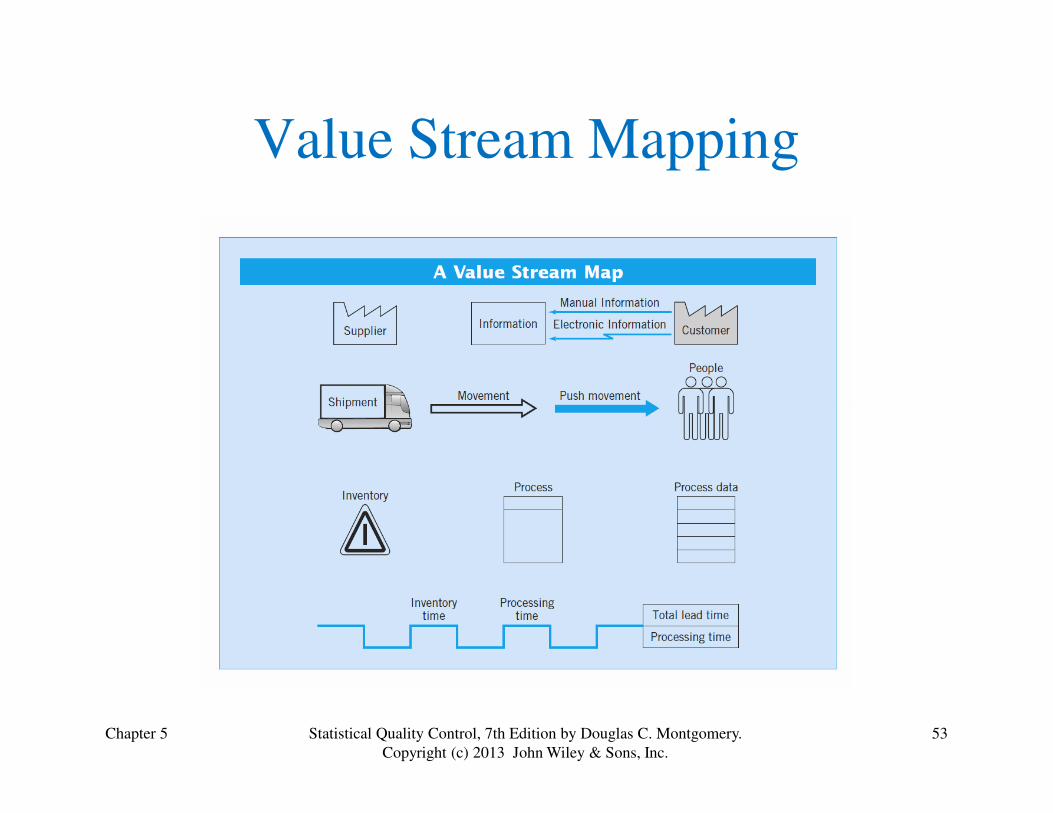
Value Stream Mapping
Chapter 5 53Statistical Quality Control, 7th Edition by Douglas C. Montgomery.
Copyright (c) 2013 John Wiley & Sons, Inc.
Chapter 5 54Statistical Quality Control, 7th Edition by Douglas C. Montgomery.
Copyright (c) 2013 John Wiley & Sons, Inc.
Chapter 5 55Statistical Quality Control, 7th Edition by Douglas C. Montgomery.
Copyright (c) 2013 John Wiley & Sons, Inc.
Chapter 5 56Statistical Quality Control, 7th Edition by Douglas C. Montgomery.
Copyright (c) 2013 John Wiley & Sons, Inc.
Transactional and Service Businesses
• All of the quality improvement tools can be used, including designed experiments
• Sometimes a simulation model if the process is useful
• More likely to encounter attribute data
• Lots of the continuous data may not be normally
Chapter 5 57Statistical Quality Control, 7th Edition by Douglas C. Montgomery.
Copyright (c) 2013 John Wiley & Sons, Inc.
• Lots of the continuous data may not be normally distributed (such as cycle time)
• Non-normality isn’t a big problem, because many techniques are relatively insensitive to the normality assumption
• Transformations and nonparametric methods could be used if the problem is severe enough
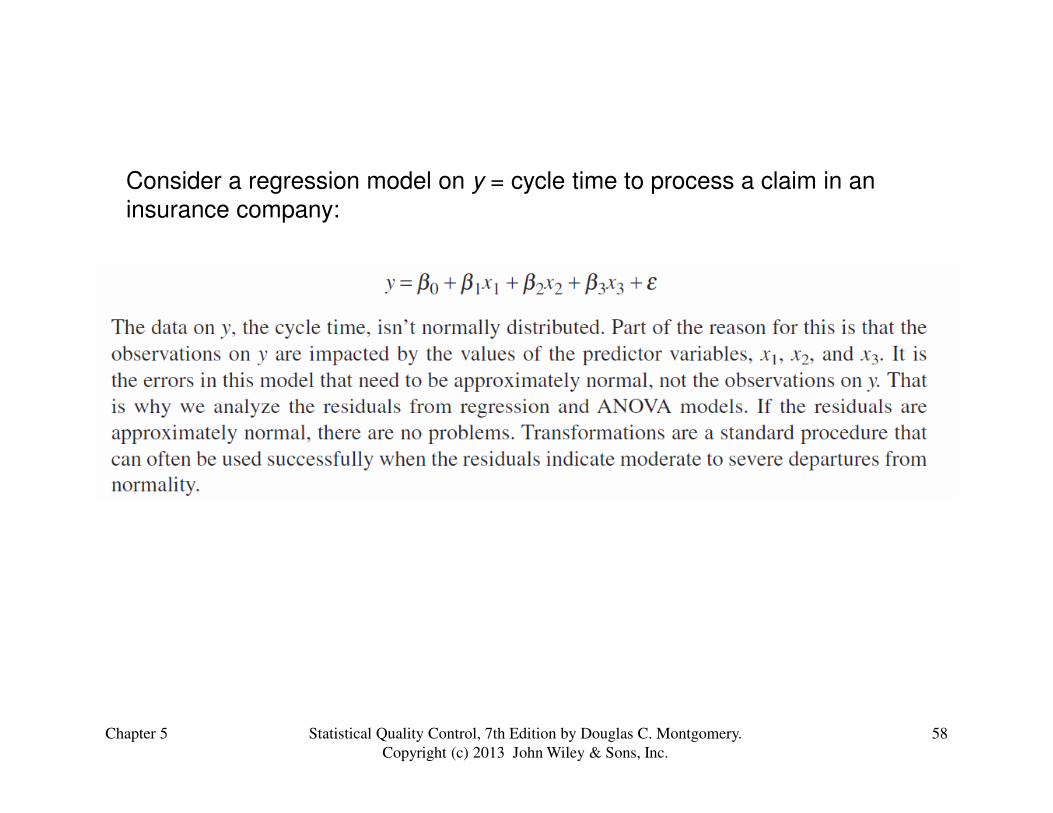
Consider a regression model on y = cycle time to process a claim in an
insurance company:
Chapter 5 58Statistical Quality Control, 7th Edition by Douglas C. Montgomery.
Copyright (c) 2013 John Wiley & Sons, Inc.
Chapter 5 59Statistical Quality Control, 7th Edition by Douglas C. Montgomery.
Copyright (c) 2013 John Wiley & Sons, Inc.