chartboost power-up report - amazon web...
TRANSCRIPT

Chartboost Power-Up ReportFebruary 2015
12 Advanced Tips for Promoting and Monetizing Your Mobile Game
Google Play Game Sessions Beats iOS in the Americas!
Middle East Territories Display Dramatic Growth
Special Deep Dive on Japan
Table of Contents
Which Countries Are Growing the Fastest? 1
Where Are People Playing Mobile Games the Most? 2
When Do People Play Mobile Games the Most? 5
Which Versions of iOS Are the Most Competitive? 7
Which Google Play OS Versions Generate the Most Money? 8
Which Google Play Devices Drive the Most Ad Revenue? 9
What Is the Top OS in Each Region? 6
Which Game Categories Are the Most Popular? 4
What Are the CPIs in Different Countries? 3
What Are the CPIs in Japan for Different Game Genres?
Which Platform Is Most Popular for Different Game Genres in Japan?
What Is the Top OS in Japan?
Chartboost Special Report: A Deep Dive into Japan
10
11
12
www.chartboost.com
Power-Up Report February 2015
Why This Matters to You
Get Into the Minds of Mobile Gamers
Mobile gamers aren’t your typical mobile users. Gamers tend to adopt new technologies faster than other segments. Use this data for guidance
on understanding where your audience is located, what technologies they use, and what types of games they play.
Optimize Your Campaigns With These Tips to Drive More Revenue
Country and Geography: Wield our country and geography usage data to identify key and emerging markets where you can acquire high-value
players and improve your monetization.
OS: Keep tabs on the tug of war between iOS and Google Play with our OS game session data.
OS Version: Is Google Play still fragmented? Do gamers update to the latest version of iOS faster than your normal mobile app user? Utilize this
data to give you a sense of what versions of Google Play and iOS are the most popular.
Device: Let our device data give you the upper hand on knowing which Google Play and iOS devices gamers use the most. For advertisers in
specific, this data will aid you with optimizing the size of your creatives.
Category: What types of games are gamers playing and where? Apply our category by game session data to help you with knowing the different
tastes of gamers globally.
Methodology
Identifying country, geography, OS, OS version, device and category trends by game sessions, impressions and ad revenue will help guide you in
optimizing your campaigns for success. The data in the Chartboost Power-Up Report for February 2015 (which includes data from January 2014 to
January 2015) comes from the largest 100% transparent, games-only ad network. Chartboost powers over 150,000 games globally, driving over
20 billion game sessions per month to more than 600 million monthly active gamers.
www.chartboost.com
Power-Up Report February 2015
Americas
Peru 417%
Colombia 405%
Argentina 196%
Chile 155%
Mexico 137%
Y-o-Y Growth EMEA
Iran 897%
Iraq 604%
Ukraine 232%
Egypt 221%
Saudi Arabia 109%
Y-o-Y Growth APAC
Malaysia 668%
India 394%
Philippines 156%
Vietnam 144%
China 78%
Y-o-Y Growth
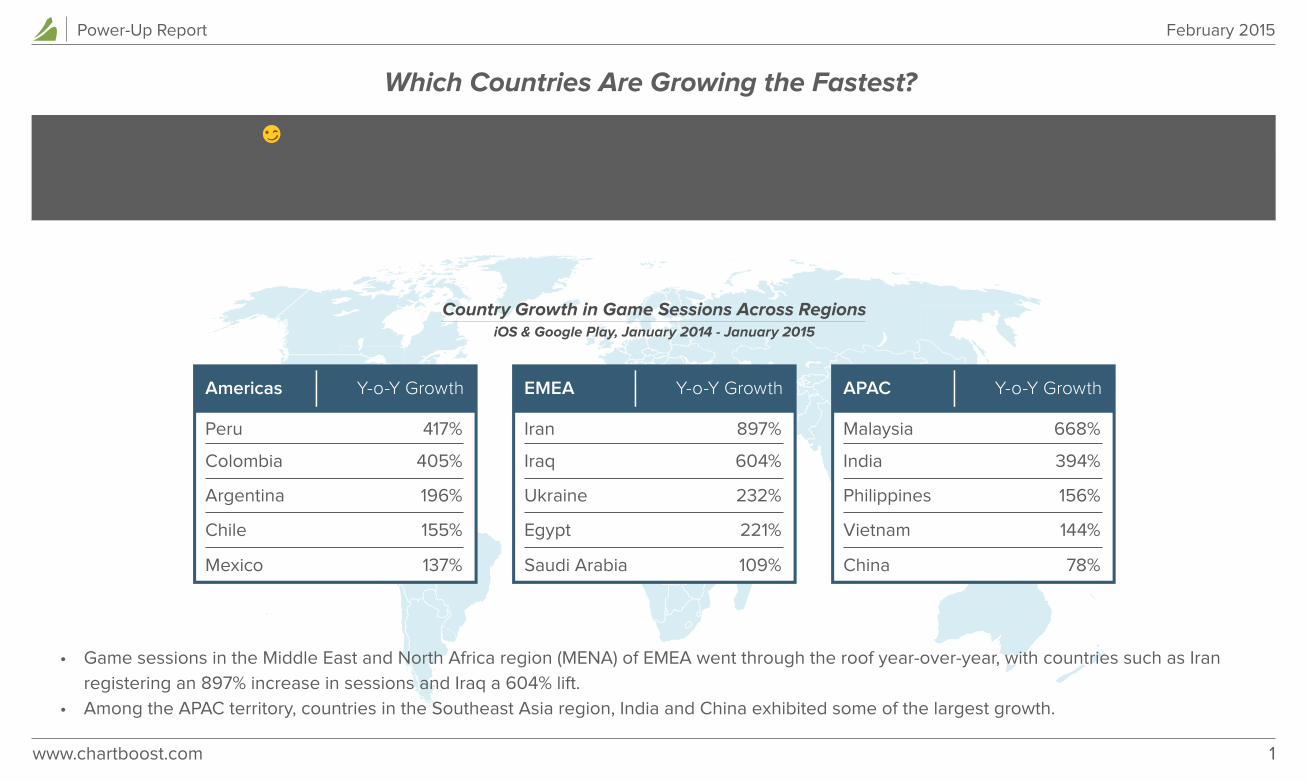
Which Countries Are Growing the Fastest?
Country Growth in Game Sessions Across RegionsiOS & Google Play, January 2014 - January 2015
1
• Game sessions in the Middle East and North Africa region (MENA) of EMEA went through the roof year-over-year, with countries such as Iran registering an 897% increase in sessions and Iraq a 604% lift.
• Among the APAC territory, countries in the Southeast Asia region, India and China exhibited some of the largest growth.
Use this data to determine where to launch your next game, where the hot market opportunities are to expand your games’ global reach, whether you are acquiring users in the top growing countries, and where to open up more targets in your campaigns!
Optimization Tip 1
www.chartboost.com
Power-Up Report February 2015
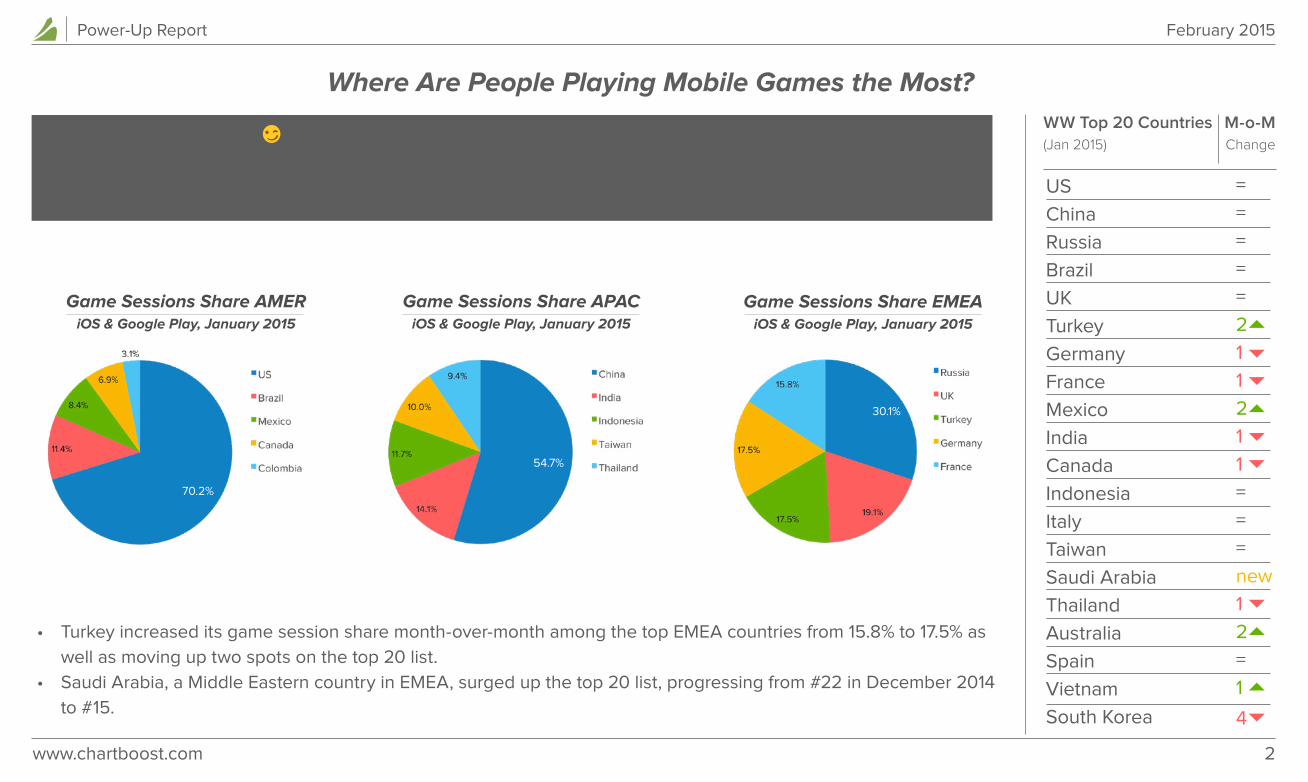
Where Are People Playing Mobile Games the Most?
• Turkey increased its game session share month-over-month among the top EMEA countries from 15.8% to 17.5% as well as moving up two spots on the top 20 list.
• Saudi Arabia, a Middle Eastern country in EMEA, surged up the top 20 list, progressing from #22 in December 2014 to #15.
WW Top 20 Countries(Jan 2015)
M-o-M Change
US China Russia Brazil UK Turkey Germany France Mexico India Canada Indonesia Italy Taiwan Saudi Arabia Thailand Australia Spain Vietnam South Korea
= = = = = 2 1 1 2 1 1 = = = new 1 2 = 1
4
2
Game Sessions Share AMERiOS & Google Play, January 2015
Game Sessions Share APACiOS & Google Play, January 2015
54.7%
Game Sessions Share EMEAiOS & Google Play, January 2015
30.1%
Use this data to determine where the best market opportunity is for your game, whether you are targeting the right countries and where mobile games are the most popular!
Optimization Tip 2
70.2%
www.chartboost.com
Power-Up Report February 2015
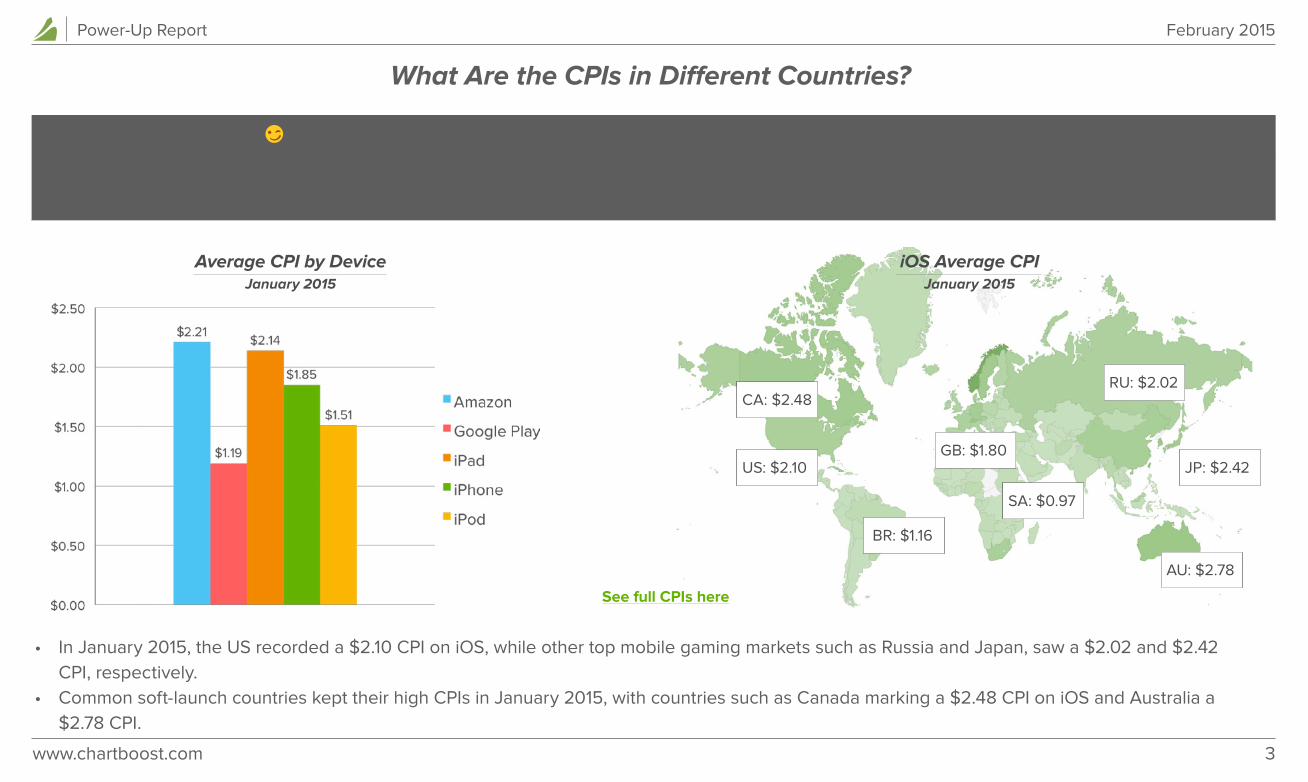
What Are the CPIs in Different Countries?
• In January 2015, the US recorded a $2.10 CPI on iOS, while other top mobile gaming markets such as Russia and Japan, saw a $2.02 and $2.42 CPI, respectively.
• Common soft-launch countries kept their high CPIs in January 2015, with countries such as Canada marking a $2.48 CPI on iOS and Australia a $2.78 CPI.
3
Average CPI by DeviceJanuary 2015
iOS Average CPIJanuary 2015
CA: $2.48
US: $2.10
BR: $1.16
SA: $0.97
GB: $1.80
RU: $2.02
JP: $2.42
AU: $2.78
See full CPIs here
Use this data to determine how much to bid for an install in order to acquire users in your target countries, how well your campaigns are performing and whether you should adapt your campaigns on a country-by-country basis to improve performance.
Optimization Tip 3
www.chartboost.com
Power-Up Report February 2015
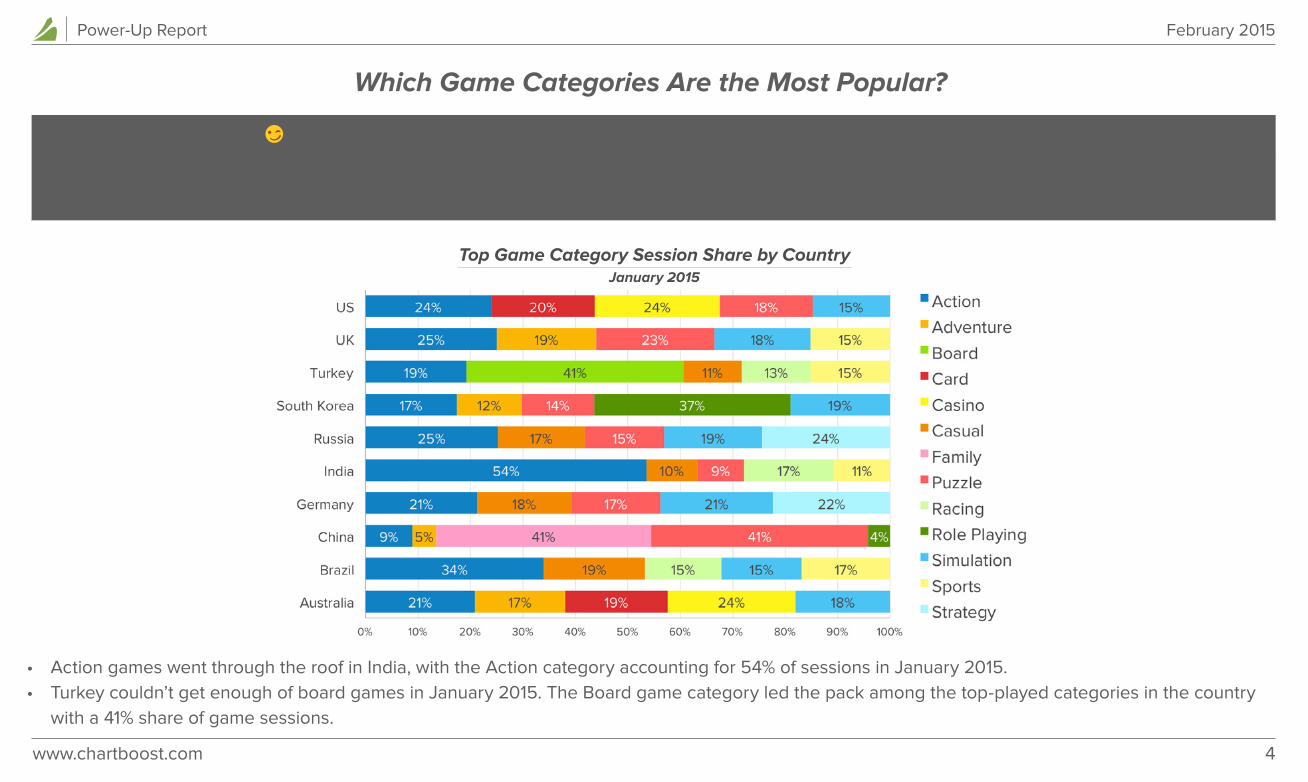
Which Game Categories Are the Most Popular?
• Action games went through the roof in India, with the Action category accounting for 54% of sessions in January 2015.• Turkey couldn’t get enough of board games in January 2015. The Board game category led the pack among the top-played categories in the country
with a 41% share of game sessions.
4
Top Game Category Session Share by CountryJanuary 2015
Utilize this data to figure out the genre for the game you want to develop, where the genre of game you are building is most popular, and where your game’s genre has the highest chances of “powering-up” revenues!
Optimization Tip 4
www.chartboost.com
Power-Up Report February 2015
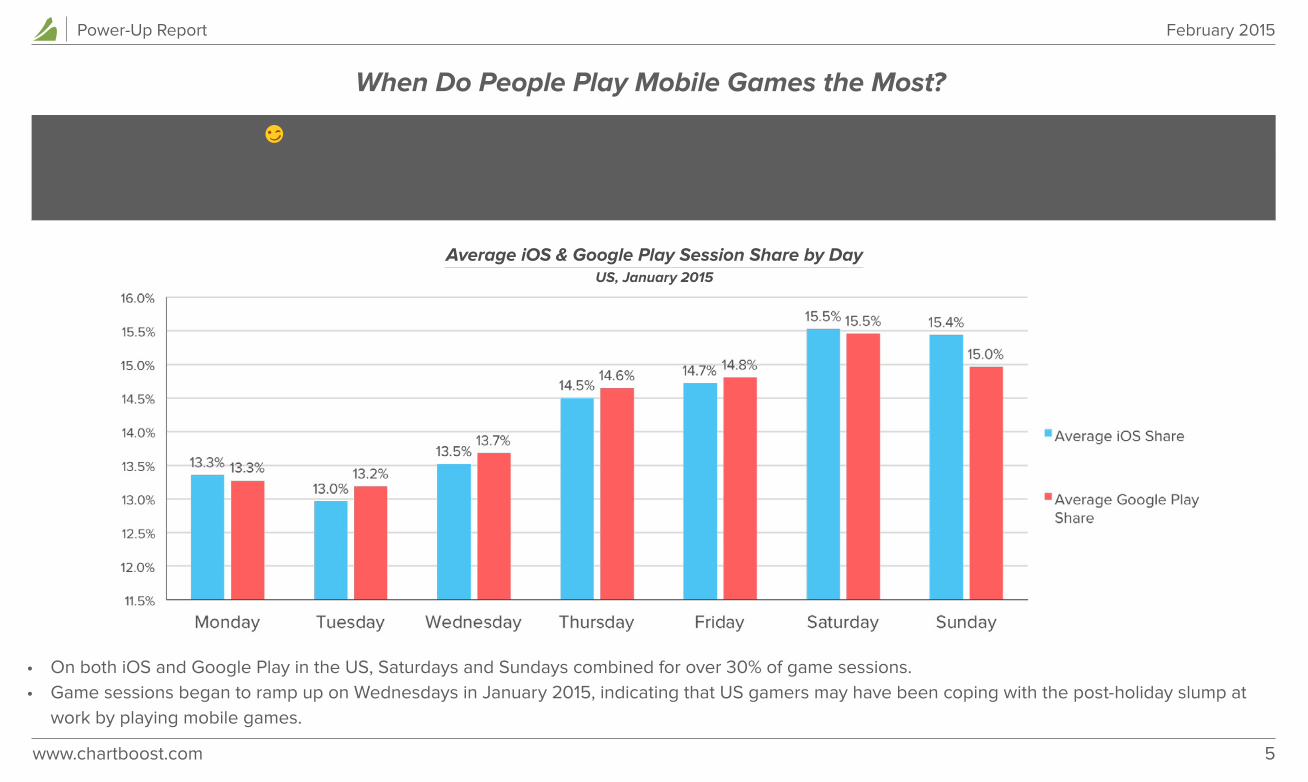
When Do People Play Mobile Games the Most?
• On both iOS and Google Play in the US, Saturdays and Sundays combined for over 30% of game sessions.• Game sessions began to ramp up on Wednesdays in January 2015, indicating that US gamers may have been coping with the post-holiday slump at
work by playing mobile games.
5
Average iOS & Google Play Session Share by DayUS, January 2015
Use this data to find out which days of the week you can expect the strongest opportunity to monetize your games, and which are the peak days to acquire players!
Optimization Tip 5
www.chartboost.com
Power-Up Report February 2015
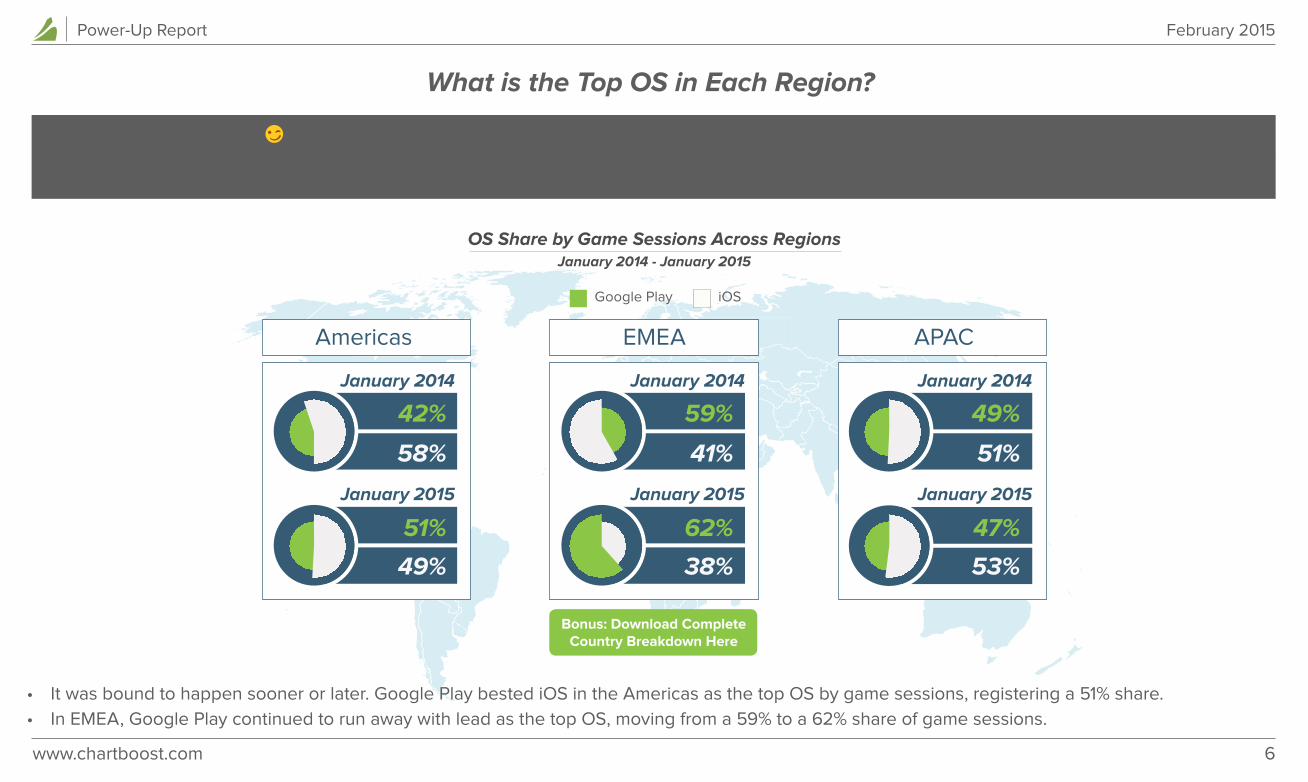
OS Share by Game Sessions Across RegionsJanuary 2014 - January 2015
January 2014 January 2014 January 2014
January 2015 January 2015 January 2015
Americas EMEA APAC
42% 59% 49%
51% 62% 47%
58% 41% 51%
49% 38% 53%
Google Play iOS
What is the Top OS in Each Region?
• It was bound to happen sooner or later. Google Play bested iOS in the Americas as the top OS by game sessions, registering a 51% share.• In EMEA, Google Play continued to run away with lead as the top OS, moving from a 59% to a 62% share of game sessions.
6
Bonus: Download Complete Country Breakdown Here
Wield this data to determine which platforms will accelerate your games’ revenues in different geographies.
Optimization Tip 6
www.chartboost.com
Power-Up Report February 2015
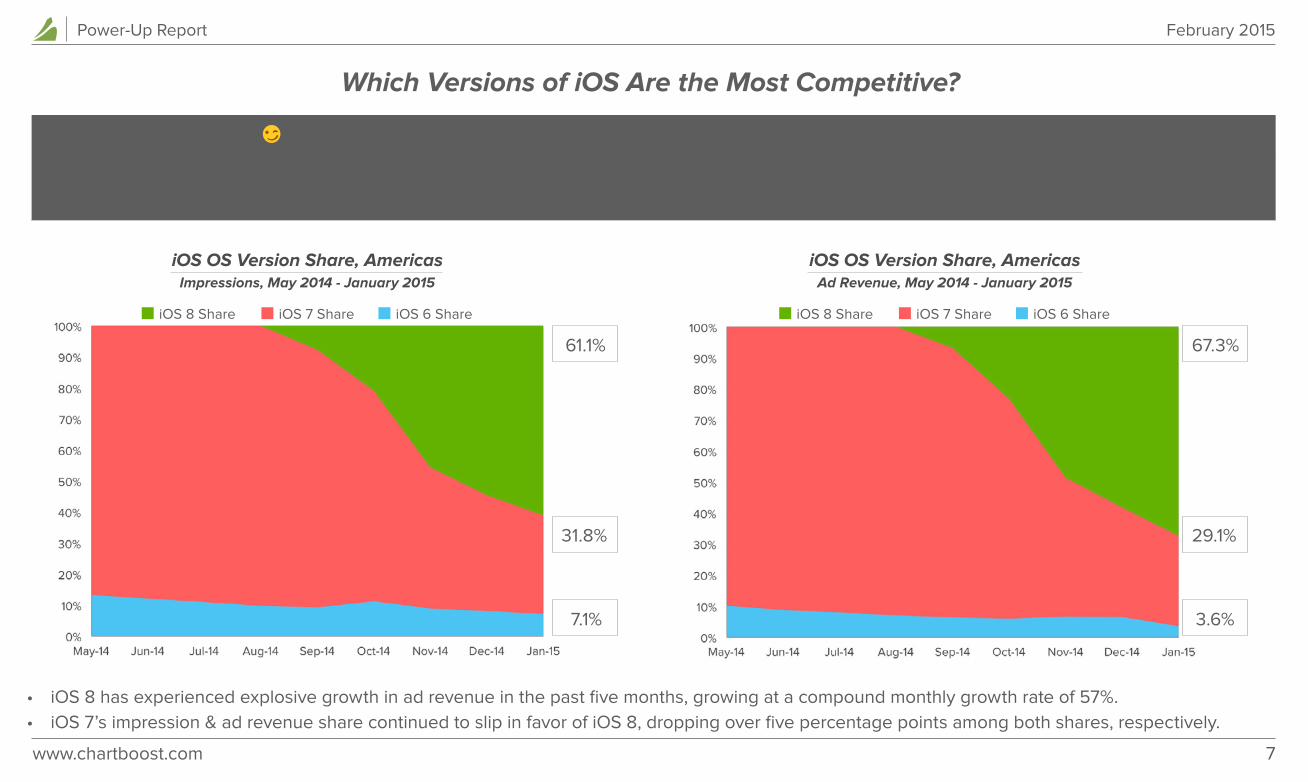
Which Versions of iOS Are the Most Competitive?
• iOS 8 has experienced explosive growth in ad revenue in the past five months, growing at a compound monthly growth rate of 57%.• iOS 7’s impression & ad revenue share continued to slip in favor of iOS 8, dropping over five percentage points among both shares, respectively.
7
iOS OS Version Share, AmericasImpressions, May 2014 - January 2015
iOS OS Version Share, AmericasAd Revenue, May 2014 - January 2015
iOS 8 Share iOS 7 Share iOS 6 Share iOS 8 Share iOS 7 Share iOS 6 Share
61.1% 67.3%
31.8% 29.1%
7.1% 3.6%
Be sure to target the early adopters and take advantage of new iOS versions that can generate increased revenue. Determine which OS versions that you should focus on and target the most.
Optimization Tip 7
www.chartboost.com
Power-Up Report February 2015
8
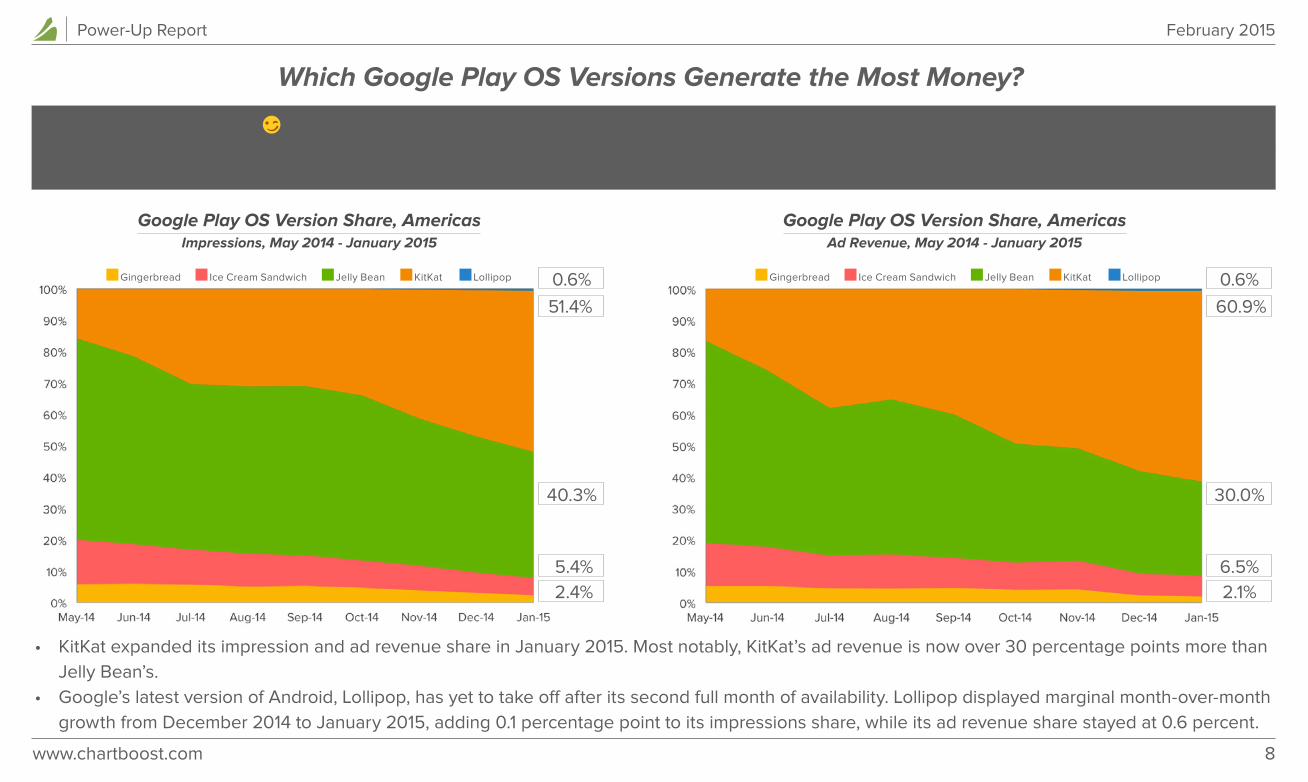
Which Google Play OS Versions Generate the Most Money?
• KitKat expanded its impression and ad revenue share in January 2015. Most notably, KitKat’s ad revenue is now over 30 percentage points more than Jelly Bean’s.
• Google’s latest version of Android, Lollipop, has yet to take off after its second full month of availability. Lollipop displayed marginal month-over-month growth from December 2014 to January 2015, adding 0.1 percentage point to its impressions share, while its ad revenue share stayed at 0.6 percent.
Google Play OS Version Share, AmericasImpressions, May 2014 - January 2015
Google Play OS Version Share, AmericasAd Revenue, May 2014 - January 2015
0.6%
51.4%
40.3%
2.4%5.4%
Gingerbread Ice Cream Sandwich Jelly Bean KitKat Lollipop 0.6%
60.9%
30.0%
2.1%6.5%
Gingerbread Ice Cream Sandwich Jelly Bean KitKat Lollipop
Use this data to determine which Google Play OS versions your games need to be compatible for!
Optimization Tip 8
www.chartboost.com
Power-Up Report February 2015
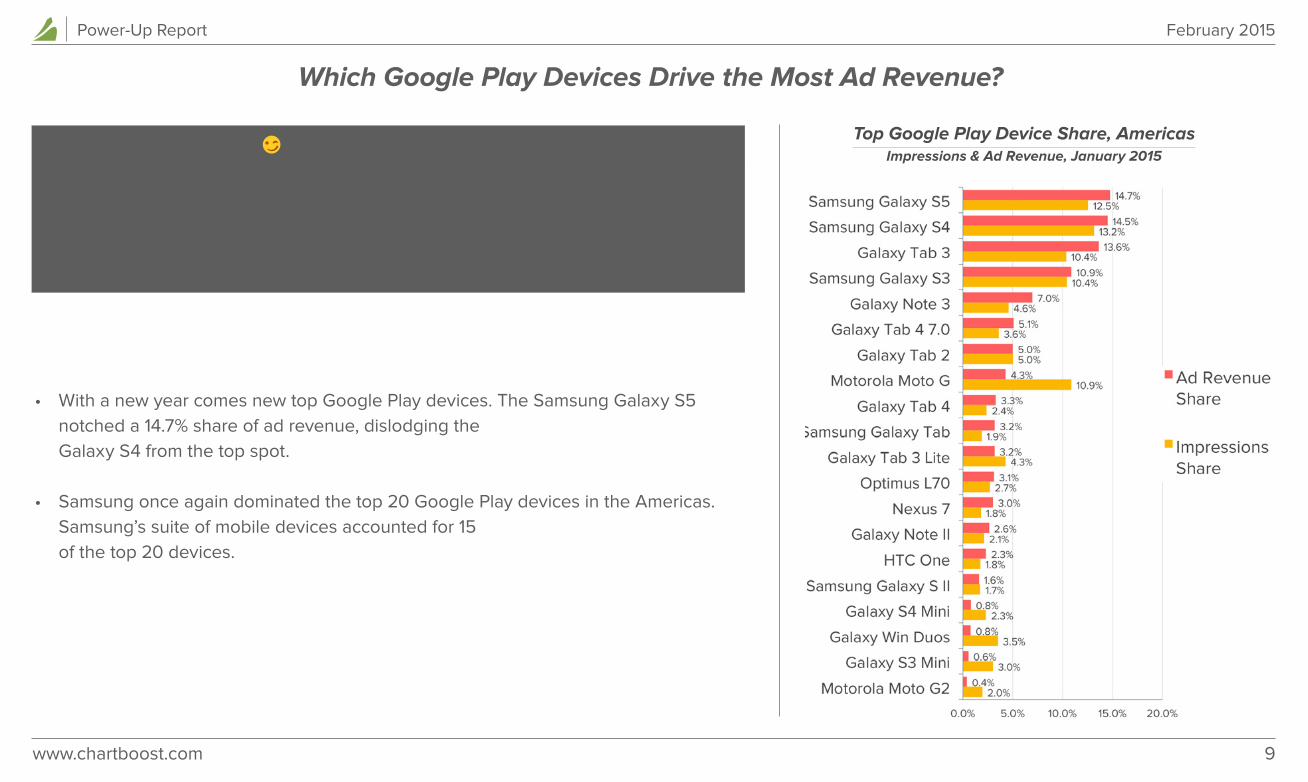
Which Google Play Devices Drive the Most Ad Revenue?
9
Top Google Play Device Share, AmericasImpressions & Ad Revenue, January 2015
• With a new year comes new top Google Play devices. The Samsung Galaxy S5 notched a 14.7% share of ad revenue, dislodging the Galaxy S4 from the top spot.
• Samsung once again dominated the top 20 Google Play devices in the Americas. Samsung’s suite of mobile devices accounted for 15 of the top 20 devices.
Use this data to determine which Google Play devices will impact your mobile game’s monetization the most, which devices you should allocate more budget towards in order to get the best players, and how to adapt your campaigns to target various devices differently by region!
Optimization Tip 9
www.chartboost.com
Power-Up Report February 2015
Chartboost Special Report: A Deep Dive into Japan
Every month, Chartboost takes a deep dive into the hottest areas of mobile gaming, honing in on specific countries, regions or categories that are driving the direction of the mobile game industry. For this month’s Special Report, we analyzed one of the largest mobile gaming markets in the world, Japan, to help you identify game session, impression & ad revenue trends.
www.chartboost.com
Power-Up Report February 2015
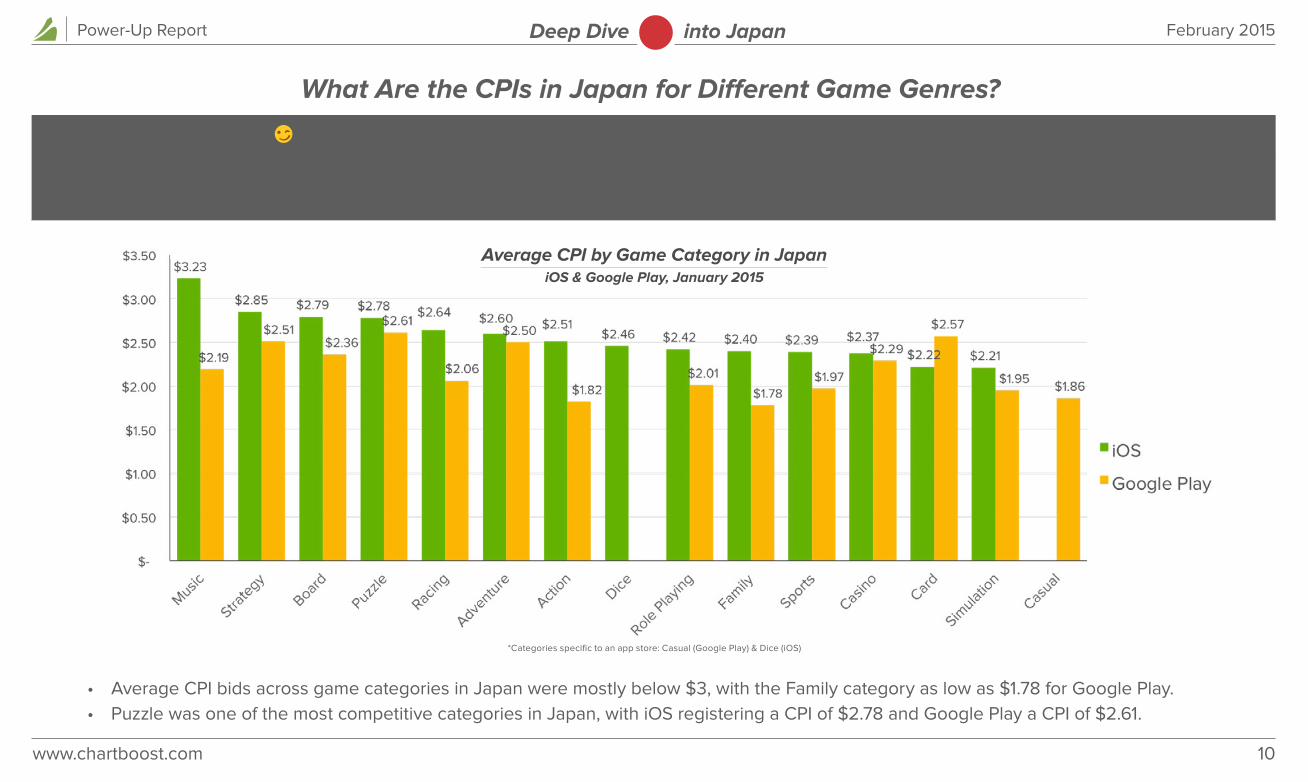
What Are the CPIs in Japan for Different Game Genres?
• Average CPI bids across game categories in Japan were mostly below $3, with the Family category as low as $1.78 for Google Play.• Puzzle was one of the most competitive categories in Japan, with iOS registering a CPI of $2.78 and Google Play a CPI of $2.61.
*Categories specific to an app store: Casual (Google Play) & Dice (iOS)
10
Deep Dive into Japan
Average CPI by Game Category in JapaniOS & Google Play, January 2015
Use this data to determine how much to bid for an install based on game category in order to optimally acquire users and whether you should adapt your campaigns in accordance with platform tastes.
Optimization Tip 10
www.chartboost.com
Power-Up Report February 2015
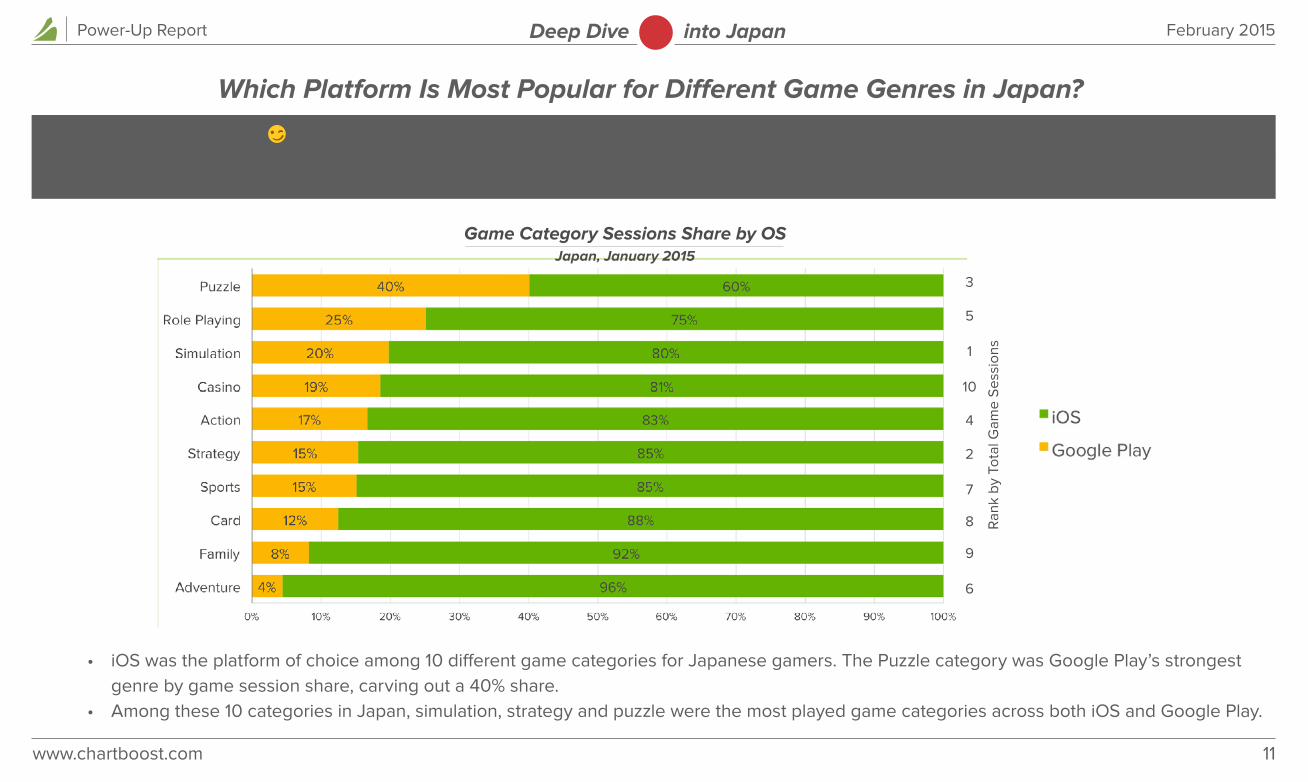
• iOS was the platform of choice among 10 different game categories for Japanese gamers. The Puzzle category was Google Play’s strongest genre by game session share, carving out a 40% share.
• Among these 10 categories in Japan, simulation, strategy and puzzle were the most played game categories across both iOS and Google Play.
11
Deep Dive into Japan
Ran
k by
Tot
al G
ame
Ses
sion
s
3
5
1
10
4
2
7
8
9
6
Game Category Sessions Share by OSJapan, January 2015
Which Platform Is Most Popular for Different Game Genres in Japan?
Harness this data to find out if iOS or Google Play is the best destination for your particular game genre in Japan to get the most use and revenue!
Optimization Tip 11
www.chartboost.com
Power-Up Report February 2015
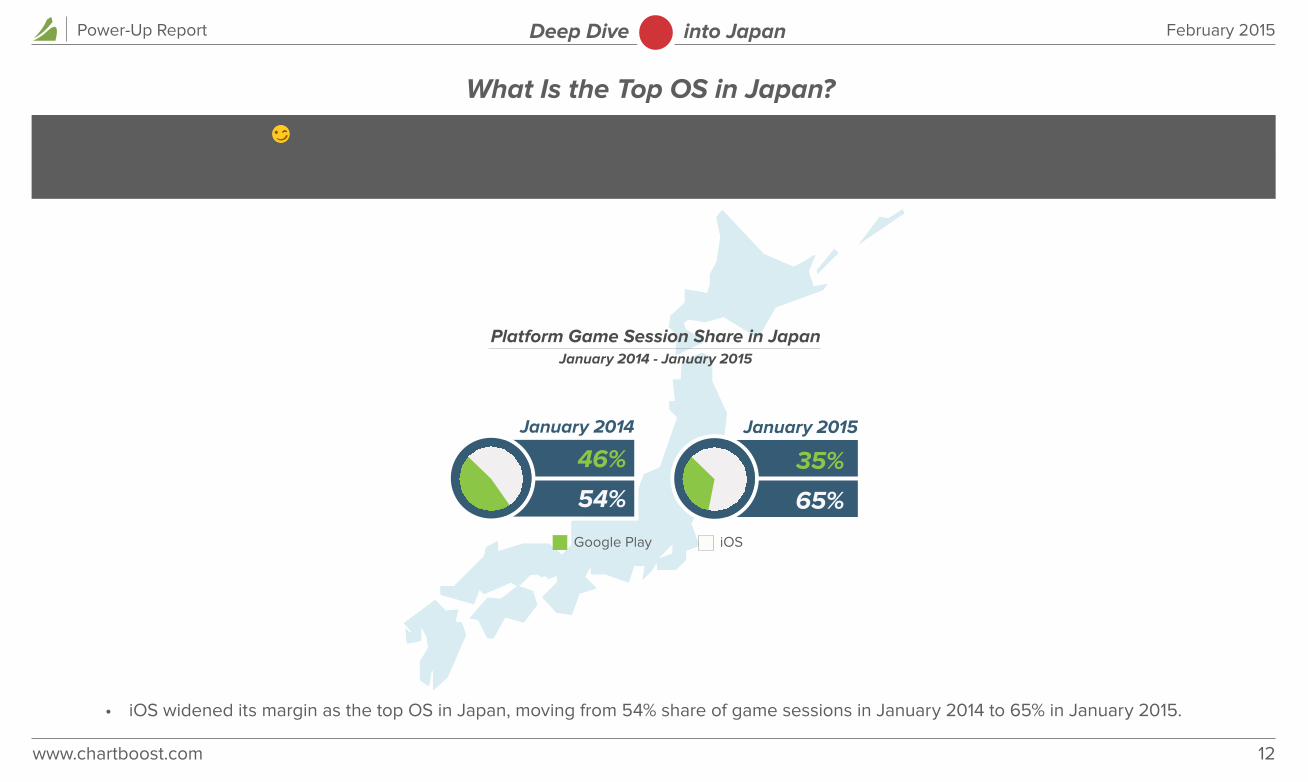
Platform Game Session Share in JapanJanuary 2014 - January 2015
January 2014
46%
54%
January 2015
35%
65%
Google Play iOS
12
• iOS widened its margin as the top OS in Japan, moving from 54% share of game sessions in January 2014 to 65% in January 2015.
Deep Dive into Japan
Use this data to figure out which platforms are the strongest in Japan to accelerate your games’ revenues.
Optimization Tip 12
What Is the Top OS in Japan?
Your success is our success.
Find new players and monetize your games with the largest 100% transparent, games-only ad network.
Start Increasing Revenues Today
Number of Games Using Chartboost: 150,000+
Powers Over 600M Monthly Active Uniques
Drives Over 20B Game Sessions Per Month
Chartboost is the largest mobile games developer platform to increase revenue & discover new players. Our technology provides mobile game developers with free cross promotion, a free developer-to-developer direct deals ad marketplace, the largest mobile games-only ad network with interstitial and mobile
video ads, plus robust app analytics. Chartboost powers over 150,000 games and drives over 20 billion monthly game sessions per month. Chartboost is a Sequoia-backed company with offices in San Francisco and Amsterdam.
For more information, please visit www.chartboost.com