chiquita brands 2010 annual report
TRANSCRIPT

CHIQUITA BRANDS 2010 ANNUAL REPORT

O P E R AT I N G I N C O M E a n dC A S H F LO W F R O M O P E R AT I O N S(in millions)
$108 $98
$147 $135
($281) $8
2010 2009 2008
(In millions, except per share amounts) 2010 2009 2008 1
I N C O M E S TAT E M E N T D ATA
Net sales $ 3,227 $ 3,470 $ 3,609
Operating income (loss) 108 147 (281)
Income (loss) from continuing operations 61 91 (330)
Net income (loss) 57 90 (329)
Net income (loss) per common share – diluted:
Continuing operations $ 1.32 $ 2.02 $ (7.54)
Discontinued operations (0.07) (0.02) 0.03
$ 1.25 $ 2.00 $ (7.51)
Shares used to calculate diluted EPS 45.9 45.2 43.7
C A S H F L O W D ATA
Cash flow from operations $ 98 $ 135 $ 8
Capital expenditures 66 68 63
Dec 31, 2010 Dec 31, 2009 Dec 31, 2008
B A L A N C E S H E E T D ATA
Cash and equivalents $ 156 $ 121 $ 77
Total assets 2,067 2,045 1,988
Total debt 634 656 697
Shareholders’ equity 740 660 524
1 2008 figures include a $375 million goodwill impairment charge (or $8.58 per diluted share).
Chiquita Brands International, Inc. (NYSE: CQB) is a leading international marketer and distributor of high-quality fresh and value-added food products —
from energy-rich bananas and other fruits to nutritious blends of convenient packaged green salads. Our products and services are designed to win the
hearts and smiles of the world’s consumers by helping them enjoy healthy fresh foods. We market our products under the Chiquita® and Fresh Express®
premium brands and other related trademarks. We employ approximately 21,000 people operating in nearly 70 countries worldwide. Additional information
is available at www.chiquita.com and www.freshexpress.com. Additional company and investor relations information is available at
www.chiquitabrands.com.
F I N A N C I A L H I G H L I G H T S
Ñ OPERATING INCOMEÑ CASH FLOWS FROM OPERATIONS
C A S H & E Q U I VA L E N T Sa n d T O TA L D E B T(in millions)
$156
$634
$121
$656
$77
$697
12·31·10 12·31·09 12·31·08
Ñ CASH & EQUIVALENTSÑ TOTAL DEBT
314419_InsideCOV_V07.qxp 4/7/11 9:28 AM Page IFC2

F E L LO W S H A R E H O L D E R S :
We recorded the third straight year of profitable results whilefacing numerous headwinds we could not have anticipated at theoutset. During a difficult economic environment, we delivered$36 million of comparable income1 in 2010, despite the challengesour industry experienced during the year. This included a difficultoperating environment in the banana industry in Europe andfurther gains by private label in salads in North America.
While we continue to make progress, we have much more to do toreach the earnings potential of our global and diversified business.We are optimistic about our business and anticipate a much better2011. In 2010 we worked hard to leverage the aspects of thebusiness that we directly control to effectively mitigate anyindustry trends that we may face. We believe our efforts willenable us to improve our results.
I M P R O V I N G W O R L D N U T R I T I O N
Chiquita’s mission is to improve the world’s nutrition and we have the products, brands, and people todo just that. Our opportunity and challenge is to make our healthy products readily available toconsumers to grab while on the move. Our brands are strong and hold the No. 1 or No. 2 marketposition in each category or market in which we compete. We work continuously to improve our brandsand create successful new products. We ask consumers regularly to taste test our products, goinghead-to-head with competitive offerings, and the results show that consumers prefer our brand.
Consumers today want food choices that offer great taste and convenience, along with health andwellness benefits. The nutritional attributes of our products allow us to focus on making them morereadily available and convenient to consumers rather than reformulating them to reduce fat, sodium orsugar, which has been a focus of other consumer product companies. We believe our global businessproduct portfolio is positioned to meet these needs and that our categories are great places to innovate.
P R O G R E S S O N O U R S T R AT E G I C P L A N
In order to maintain a sustainable earnings trajectory and reduce the variability of results in our business,we are focused on five strategic elements:
î Fixing our European business;
î Further diversifying our products and channels;
î Executing our strategic, operational and financial plans with discipline;
î Leveraging our joint venture with Danone; and
î Growing our salad volume through food safety, quality and innovation initiatives.
We have already begun to see progress in each of these areas, which makes us confident that we cancontinue to improve our profitability in 2011 and beyond.
L E T T E R F R O M T H E C H A I R M A N & C E O
1 Please refer to page iv for a reconciliation to U.S. GAAP.
Chiquita Brands International, Inc. – 2010 Annual Report i
F e r n a n d o A g u i r r eC h a i r m a n a n dC h i e f E x e c u t i v e O f f i c e r
314419_LTR_V06.qxp 4/7/11 3:58 PM Page 1

We are making progress in Europe under the leadership of Brian Kocher. He led our turnaround inNorth America during the last three years and he has the skills and experience to revitalize our Europeanbusiness. I am confident that we can regain our prior levels of profitability and maximize our premiumbrand position. We have plans to increase profitable distribution, drive banana category growth, expandinto new channels and drive more costs out of the business.
We continue to diversify our business and expand our brands beyond our basic business, providing uswith additional revenue streams and greater market penetration. In 2010, we launched several successfulnew products like Fresh Express Artisanal Salads, Chiquita Fresh & Ready® Avocados and ChiquitaDuo’s fruit cups. We also recently signed a license agreement to use our brand in the Middle East fora range of Chiquita Tropical Fruit Juices, providing an opportunity to extend our brand in the growing,longer shelf-life juice segment with a partner that already has manufacturing and distributioncapabilities in the region.
We continue to create shareholder value by focusing on executing our strategic, operational andfinancial plans with discipline to improve our business. For example, in salads, we delivered net costimprovements in 2010 of $26 million through network and cost efficiencies. Additionally, we improvedour 2010 salad operating margin, despite lower salad volumes and higher innovation and marketingspend. We delivered the highest profit margin in salads since our acquisition of Fresh Express in 2005,demonstrating that our salad profitability is sustainable.
The joint venture we formed with Danone in May 2010 is off to a good start, and it will enable us toexpand and drive profitability in European healthy beverages much faster and more efficiently thanever. Since we entered this category four years ago, we have established Chiquita as one of the leadingfruit smoothie brands in Europe. Our partnership with Danone began an alliance between twocompanies whose values and product portfolios represent a rich legacy of bringing nutritional branded,innovative foods to consumers around the world. It is also a significant validation of our strategy tohave attracted a partner like Danone, a world-class organization with particular strengths in researchand development in nutrition, which is at the core of our company’s mission.
In salads, private label remains a challenge. But supported by our significant investments in food safety,freshness and quality, we are confident consumers will revert to branded products as they realize theinherent value we can deliver versus competitive offerings. We have gained new distribution in ourNorth American salad business that will come on-stream by mid-year as a result of these kinds ofinvestments and we have an operating structure that delivers higher velocity, lower waste and better netmargins versus private label.
F R E S H R I N S E : B R E A K T H R O U G H C L E A N . Z E R O C H LO R I N E
Food safety and quality is in our DNA. We introduced Fresh Rinse™ technology in 2010 and it isperhaps the biggest innovation in the salad category since the creation of pre-packaged salads.Fresh Rinse is a revolutionary fresh produce wash that significantly improves food safety and is aquantum leap in reducing certain microorganisms on leafy greens by more than seven times versustraditional chlorine-based washes.
Fresh Rinse sets a new standard in food safety and we believe it will drive a sustainable advantage,particularly against private label offerings that do not match the technological and velocity advantagesof Fresh Express. While Fresh Rinse creates a sustainable advantage, as part of our commitment topublic health, we plan to make Fresh Rinse technology available for license to the industry to help makethe whole category safer for consumers. Fresh Rinse is the best recent example of our leadership in foodsafety in the produce industry.
ii Chiquita Brands International, Inc. – 2010 Annual Report
314419_LTR_V06.qxp 4/7/11 3:58 PM Page 2

A L E A D E R I N C O R P O R AT E S O C I A L R E S P O N S I B I L I T Y
We hold ourselves to high standards of corporate citizenship, corporate governance and corporatecompliance. We are actively engaged in the communities where we operate, and have establishedsustainability initiatives designed to minimize our environmental footprint. In 2010, we once againachieved important certifications by the Rainforest Alliance, Social Accountability 8000 andGlobalGAP for strong environmental, labor and food safety practices, respectively.
Our corporate governance practices have evolved over many years and are reviewed regularly toensure they support an empowered and independent board of directors working with management forthe benefit of all our stakeholders. In addition, our compliance practices help to ensure we operateethically and in accordance with governing laws and our Core Values: Integrity, Respect, Opportunityand Responsibility.
T H E C H I Q U I TA D I F F E R E N C E
Going into 2011, we are in a strong financial position, with diversified profits and a healthy balancesheet, and our plan is to significantly improve our profitability for the full year. We have the keyfundamentals in place that will provide more opportunities for profitable growth and allow us to thriveand be one of the clear leaders for healthy, fresh food in the global marketplace.
The progress that we made throughout the year would not have been possible without the relentlessdiscipline, hard work, and dedication of our 21,000 employees worldwide. Our people are one of ourmost powerful competitive advantages, and we thank them for their contributions to our company.
We are focused on growing shareholder value and are excited about the future growth prospects forChiquita in markets around the world. In closing, we want to extend a word of gratitude to ourcustomers, partners and shareholders for your continued investment in Chiquita, and we look forwardto reporting our progress.
Sincerely,
Fernando AguirreChairman and Chief Executive Officer
Chiquita Brands International, Inc. – 2010 Annual Report iii
314419_LTR_V06.qxp 4/7/11 3:58 PM Page 3

iv Chiquita Brands International, Inc. – 2010 Annual Report
(In millions) 2010 2009 2008
Comparable income (Non-GAAP) $ 36 $ 103 $ 49Gain on sale of smoothie business1 32 — —European headquarters relocation2 — (12) (7)Goodwill impairment3 — — (375)Gain (loss) on debt purchases4 (0) (0) 14Incremental non-cash interest expense on Convertible Notes5 (8) (7) (5)Gain on sale of Ivory Coast operations, including tax benefit6 — 8 —Other items7 — — (6)
Income from continuing operations (U.S. GAAP) $ 61 $ 91 $ (330)
Columns may not total due to rounding.
1 In the second quarter of 2010, we entered into a joint venture with Danone S.A. to market Chiquita-branded fruit beveragesbased on our Just Fruit in a Bottle® platform in Europe. Upon closing, we sold 51% of our smoothie business to Danone for€15 million ($18 million) and deconsolidated it, accounting for our remaining 49% investment using the equity method. Thegain on the sale and deconsolidation of the smoothie business was $32 million, which includes a $15 million gain related tothe fair value of the retained 49% investment on the closing date.
2 In 2008, we committed to relocate our European headquarters in order to optimize our long-term tax structure. The relocationresulted in total costs of $19 million.
3 Goodwill impairment was recorded in 2008 related to Fresh Express.
4 Gain (loss) on debt purchases relates to open-market repurchases of 71⁄2% and 87⁄8% Senior Notes.
5 Incremental non-cash interest expense on Convertible Notes relates to a discount recorded for the estimated value of thedebt-for-equity conversion feature at the issuance date. The discount is accreted back to the carrying value of the debt overthe life of the Convertible Notes, resulting in non-cash interest expense.
6 In 2008, we sold our operations in the Ivory Coast, recognizing a gain of $4 million on the sale and an additional $4 millionof income tax benefits related to these operations.
7 Other items in 2008 included $9 million of other income and $3 million of related income tax expense from the resolutionof claims and the receipt of refunds of certain non-income taxes paid between 1980 and 1990. Other items in 2008 alsoincluded a $3 million impairment charge related to the closure of a U.K. ripening center and $9 million of deferred financingfee write-offs as a result of our successful refinancing.
R E C O N C I L I AT I O N O F N O N - G A A P T O G A A P F I N A N C I A L M E A S U R E S :
The following information is provided to reconcile results reported under U.S. GAAP to certainnon-GAAP financial measures disclosed in the preceding Letter from the Chairman and CEO. In aneffort to provide investors with additional information regarding our financial results and to provide moremeaningful year-over-year comparisons of our financial performance against internal budgets and targets,we sometimes use non-GAAP measurements as defined by the Securities and Exchange Commission.Non-GAAP financial measures should be considered in addition to, and not instead of, U.S. GAAP.
314419_LTR_V06.qxp 4/7/11 3:58 PM Page 4

CHIQUITA BRANDS INTERNATIONAL, INC.2010 ANNUAL REPORT
Financial Information
Management’s Responsibility for Financial Reporting 2
Management’s Discussion and Analysis of Financial Condition and Results of Operations 4
Report of Independent Registered Public Accounting Firm 22
Consolidated Statements of Income 23
Consolidated Balance Sheets 24
Consolidated Statements of Shareholders’ Equity 25
Consolidated Statements of Cash Flow 27
Notes to Consolidated Financial Statements 29
Selected Financial Data 70
Directors, Officers and Senior Operating Management 1
Investor Information
[7

(This page intentionally left blank.)
314419_LTR_V06.qxp 4/7/11 3:58 PM Page 5

2Chiquita Brands International, Inc. — 2010 Annual Report
MANAGEMENT’S RESPONSIBILITY FOR FINANCIAL REPORTING
The financial statements and related financial information presented in this Annual Report are the responsibilityof Chiquita Brands International, Inc. management, who believe that they present fairly the company’s consolidatedfinancial position, results of operations, and cash flows in accordance with generally accepted accounting principlesin the United States.
Management is responsible for establishing and maintaining adequate internal controls, including a system ofinternal control over financial reporting as defined in Securities Exchange Act Rule 13a-15(f) that is supported byfinancial and administrative policies. This system is designed to provide reasonable assurance that the company’sfinancial records can be relied upon for preparation of its financial statements and that its assets are safeguardedagainst loss from unauthorized use or disposition.
Management has also designed a system of disclosure controls and procedures as defined in Exchange Act Rule13a-15(e) to ensure that material information relating to the company and its consolidated subsidiaries is madeknown to the company representatives who prepare and are responsible for the company’s financial statements andperiodic reports filed with the Securities and Exchange Commission (“SEC”). The effectiveness of these disclosurecontrols and procedures is reviewed quarterly by management, including the company’s Chief Executive Officer andChief Financial Officer. Management modifies these disclosure controls and procedures as a result of the quarterlyreviews, when appropriate, or as changes occur in business conditions, operations or reporting requirements. Thecompany’s global internal audit function, which reports to the Audit Committee, participates in the review of theadequacy and effectiveness of controls and compliance with the company’s policies.
Chiquita has published its Core Values and Code of Conduct, which establish high standards for ethicalbusiness conduct. The company maintains a helpline, administered by an independent service supplier, thatemployees and other third parties can use confidentially and anonymously to communicate suspected violations ofthe company’s Core Values or Code of Conduct, including concerns regarding accounting, internal accountingcontrol or auditing matters. All matters reported through the helpline are reported directly to the Chief ComplianceOfficer, who reports to the Audit Committee of the Board of Directors, and any significant concerns that relate toaccounting, internal accounting control or auditing matters are communicated to the chairman of the AuditCommittee of the Board of Directors.
The Audit Committee of the Board of Directors consists solely of directors who are considered independentunder applicable New York Stock Exchange rules. Two members of the Audit Committee, Howard W. Barker, Jr.and Kerrii B. Anderson, have each been determined by the Board of Directors to be an “audit committee financialexpert” as defined by SEC rules. The Audit Committee reviews the company’s financial statements and periodicreports filed with the SEC, as well as the company’s internal control over financial reporting and its accountingpolicies. In performing its reviews, the Audit Committee meets periodically with the independent auditors,management and the internal auditors, both together and separately, to discuss these matters.
The Audit Committee engaged PricewaterhouseCoopers LLP, an independent registered public accounting firm,to audit the company’s consolidated financial statements and its internal control over financial reporting and toexpress opinions thereon. The scope of the audits is set by PricewaterhouseCoopers following review anddiscussion with the Audit Committee. PricewaterhouseCoopers has full and free access to all company records andpersonnel in conducting its audits. Representatives of PricewaterhouseCoopers meet regularly with the AuditCommittee, with and without members of management present, to discuss their audit work and any other mattersthey believe should be brought to the attention of the Audit Committee. PricewaterhouseCoopers’ opinions on thecompany’s consolidated financial statements and the effectiveness of the company’s internal control over financialreporting are on page .

Chiquita Brands International, Inc. — 2010 Annual Report3
Management’s Assessment of the Company’s Internal Control over Financial Reporting
The company’s management assessed the effectiveness of the company’s internal control over financialreporting as of December 31, 2010. Based on this assessment, management believes that, as of December 31, 2010,the company’s internal control over financial reporting was effective based on the criteria in Internal Control –Integrated Framework, as set forth by the Committee of Sponsoring Organizations of the Treadway Commission(COSO).
FERNANDO AGUIRRE MICHAEL B. SIMS LORI A. RITCHEYChief Executive Officer Chief Financial Officer Chief Accounting Officer

4Chiquita Brands International, Inc. — 2010 Annual Report
MANAGEMENT’S DISCUSSION AND ANALYSIS OF FINANCIAL CONDITION AND RESULTS OFOPERATIONS
Overview
Chiquita Brands International, Inc. (“CBII”) and its subsidiaries (collectively, “Chiquita,” “the company,” “we”or “us”) operate as a leading international marketer and distributor of high-quality fresh and value-added producewhich is sold under the premium Chiquita® and Fresh Express® brands and other trademarks. We are one of thelargest banana distributors in the world and a major supplier of bananas in Europe and North America. In Europe,we are a market leader and obtain a price premium for our Chiquita® bananas, and we hold the No. 2 marketposition in North America for bananas. In North America, we are the market segment leader and obtain a pricepremium with our Fresh Express® brand of value-added salads. Our brands are known for the quality, freshness andnutrition associated with a healthy lifestyle and our goal is to take advantage of today’s health and wellness trendsby offering even more convenient products and making them available in a wider variety of retail outlets, such asconvenience stores and quick-serve restaurants.
In 2010, we continued to be profitable generating net income of $57 million versus $90 million in 2009. Our2010 net income included a $32 million gain on deconsolidation and sale of our European smoothie business. In ourNorth American banana business volume was stable and pricing increased slightly. In North American value-addedsalads, we were able to reduce costs to slightly improve profit margins as a percent of sales even as volume declinedas a result of certain customer conversions to private label products; new accounts already signed are expected topartially offset these volume losses in the second half of 2011. We also experienced improving results from theEuropean smoothie business. Europe was a challenging operating environment for our banana business in 2010 withlower average European exchange rates, decreased pricing and volume due primarily to reduced consumer demandand increased volume of competing tariff-advantaged fruit from European Union sources, even as the cost of fruitsourcing and fuel increased across the industry.
In January and February 2011, we have seen improvements in banana pricing in both North America and inEurope. However, these have been accompanied by higher sourcing costs affecting the entire industry as coolerweather across Latin America and flooding in several source countries have reduced the available supply. Inresponse to these higher costs, we added a surcharge to our banana pricing in North America that will remain ineffect until industry costs return to more normal levels.
We generated $98 million and $135 million of operating cash flow in 2010 and 2009, respectively, and used$30 million of cash to reduce our debt in 2010. We have no debt maturities greater than $20 million in any yearprior to 2014 and currently have significant financial covenant flexibility. At December 31, 2010, we had total cashof $156 million and $127 million of available borrowing capacity under our revolving credit facility.
We operate in a highly competitive industry and are subject to significant risks beyond our immediate control.The major risks facing our business include: the effect of market dynamics on the prices of the products we sell,product supply cost increases, the effect that adverse economic conditions may have on consumer and retailerbehavior, weather disruptions and agricultural conditions and their potential impact on produce quality and supply,consumer concerns about food safety, foreign currency exchange rates and risks of governmental regulation,investigations, litigation and other contingencies. We are a defendant in several pending legal proceedings that aredescribed in Note 19 to the Consolidated Financial Statements, where unfavorable outcomes could be material to ourresults of operations or financial position. We believe that most of our products are well-positioned to continue towithstand the risks of the current global economic environment because they are healthy and convenient staple fooditems that provide value to consumers. See “Item 1A – Risk Factors” in the Annual Report on Form 10-K for afurther description other risks.

Chiquita Brands International, Inc. — 2010 Annual Report5
Operations
Chiquita reports the following three business segments:
Bananas: Includes the sourcing (purchase and production), transportation, marketing and distribution ofbananas.
Salads and Healthy Snacks: Includes ready-to-eat, packaged salads, referred to in the industry as “value-added salads”; and other value-added products, such as healthy snacking products, fresh vegetable and fruitingredients used in food service, processed fruit ingredient products and our equity-method investment inthe Danone JV (described below), which sells Chiquita-branded fruit smoothies in Europe (see Note 3 tothe Consolidated Financial Statements).
Other Produce: Includes the sourcing, marketing and distribution of whole fresh fruits and vegetablesother than bananas.
Certain corporate expenses are not allocated to the reportable segments and are included in “Corporate” or“European headquarters relocation.” Inter-segment transactions are eliminated. Segment information representsonly continuing operations. (See Note 3 to the Consolidated Financial Statements for information related todiscontinued operations).
Financial information for each segment follows:
(In thousands) 2010 2009 2008
Net sales:Bananas $ 1,937,748 $ 2,081,510 $ 2,060,319Salads and Healthy Snacks 1,028,475 1,135,504 1,304,904Other Produce 261,209 253,421 244,148
Total net sales $ 3,227,432 $ 3,470,435 $ 3,609,371
Segment results:Bananas $ 80,591 $ 174,416 $ 181,113Salads and Healthy Snacks1 95,268 60,377 (399,822)Other Produce 5,363 5,640 10,128Corporate (70,426) (81,048) (65,605)European headquarters relocation - (12,076) (6,931)
Total segment results2 $ 110,796 $ 147,309 $ (281,117)
1 2010 includes a gain on the deconsolidation and sale of the European smoothie business of $32 million ($32 million after-tax). 2008 included a $375 million ($374 million after-tax) goodwill impairment charge.
2 A reconciliation of segment results to “Operating income (loss)” is as follows:
2010 2009 2008Segment results $ 110,796 $ 147,309 $ (281,117)
Other income attributed to Other Produce (2,525) - -Other income attributed to Corporate (611) - -
Operating income (loss) $ 107,660 $ 147,309 $ (281,117)

6Chiquita Brands International, Inc. — 2010 Annual Report
BANANA SEGMENTNet sales for the segment were $1.9 billion, $2.1 billion and $2.1 billion in 2010, 2009 and 2008, respectively.
The 7% decline in net sales for 2010 was primarily due to lower average European exchange rates and decreasedEuropean volumes and pricing, partially offset by slightly higher pricing in North America. Volume was also lowerin the Mediterranean markets, particularly in the fourth quarter of 2010, as we sold less low-priced excess fruit. Netsales for 2009 increased 1% versus 2008, on higher pricing in both Europe and North America, where priceincreases from prior periods were sustained, which was partially offset by lower average European exchange ratesand lower volumes in the U.K. and France.
Significant increases (decreases) in our Banana segment results, presented in millions, are as follows:
$ 181 2008 Banana segment results
60 Pricing(10) Volume(45) Average European exchange rates1
(29) Sourcing and logistics costs2
6 Marketing investment, primarily in Europe7 Equity earnings of the Asia JV prior to the sale3
4 Gain on sale of Ivory Coast operations
$ 174 2009 Banana segment results
5 Pricing(5) Volume4
(27) Average European exchange rates1
(79) Sourcing and logistics costs2
26 European tariff costs(5) Marketing investment, primarily in North America4 Selling, general and administrative costs
(7) Absence of equity earnings of the Asia JV3
(4) Absence of gain on sale of Ivory Coast operations(1) Other
$ 81 2010 Banana segment results______________
1 Average European exchange rates include the effect of hedging, which was a benefit (expense) of $2 million, $(1) millionand $(9) million in 2010, 2009 and 2008, respectively. See Note 11 to the Consolidated Financial Statements for furtherdescription of our hedging program.
2 Sourcing costs include increased costs of purchased fruit, as well as higher exchange rates in Latin America that increasedthe cost of fruit produced in owned operations. Logistics costs are significantly affected by fuel prices, and include theeffect of fuel hedges, which was an (expense) benefit of $(8) million, $3 million and $21 million in 2010, 2009 and 2008,respectively. See Note 11 to the Consolidated Financial Statements for further description of our hedging program.These costs also include $7 million and $25 million of temporary incremental costs in 2010 and 2009, respectively,related to cooler temperatures across Latin America in the fourth quarter of 2010 and flooding in Guatemala (2010),Panama (2008/2009) and Costa Rica (2008/2009), including costs of sourcing fruit from alternate sources.
3 See Note 3 to the Consolidated Financial Statements for more information about the Asia JV.4 In 2010, we sold lower volumes of low-priced excess fruit in the Mediterranean, which represented a $16 million
improvement over 2009.

Chiquita Brands International, Inc. — 2010 Annual Report7
Our banana sales volumes1 in 40-pound box equivalents were as follows:
(In millions, except percentages) 2010 2009 % Change
North America 62.9 63.3 (0.6)%Core Europe2 40.4 44.5 (9.2)%Mediterranean3 and Middle East 18.6 24.1 (22.8)%
121.9 131.9 (7.6)%
The following table shows year-over-year favorable (unfavorable) percentage changes in our banana prices andbanana volume for 2010 compared to 2009:
Q1 Q2 Q3 Q4 Year
Banana Prices
North America4 3.9% 6.3% 3.6% (0.2)% 3.4%Core Europe2
U.S. dollar basis5 (5.7)% (11.4)% (5.4)% (0.6)% (6.1)%Local currency basis (11.1)% (6.6)% 5.5 % 8.1% (1.9)%
Mediterranean3 and Middle East (12.4)% (4.3)% (3.6)% 16.3% 2.5%
Banana Volume
North America (0.7)% 3.1% (3.8)% 0.6% (0.6)%Core Europe2 (13.4)% (5.1)% (8.2)% (10.0)% (9.2)%Mediterranean3 and Middle East 51.5% 2.1% (27.6)% (56.3)% (22.8)%
1 Volume sold includes all banana varieties, such as Chiquita to Go, Chiquita minis, organic bananas and plantains.2 Core Europe includes the 27 member states of the European Union, Switzerland, Norway and Iceland. Banana sales in
Core Europe are primarily in euros.3 Mediterranean markets are mainly European and Mediterranean countries that do not belong to the European Union.4 North America pricing includes fuel-related and other surcharges.5 Prices on a U.S. dollar basis exclude the effect of hedging.
The average spot and hedged euro exchange rates were as follows:
Year Ended Dec. 31,(Dollars per euro) 2010 2009 % Change
Euro average exchange rate, spot $ 1.32 $ 1.39 (5.0)%Euro average exchange rate, hedged 1.33 1.38 (3.6)%
We have entered into euro put option contracts to reduce the negative cash flow and earnings effect that anysignificant decline in the value of the euro would have on the conversion of euro-based revenue into U.S. dollars.Put options, which require an upfront premium payment, can reduce this risk without limiting the benefit of astronger euro. To minimize the volatility that changes in fuel prices could have on the operating results of our coreshipping operations, we also enter into hedge contracts to lock in prices of future bunker fuel purchases.
Under our fuel and foreign currency hedging programs, we consider our exposure, current market conditionsand hedging costs when determining when and whether we should enter into new hedging instruments. For ourcurrency hedging program, a key consideration is the premium required to be paid for euro put options. During2010 and much of 2009, we purchased fewer euro put option contracts than in prior years as a result of this cost-benefit analysis, and as of December 31, 2010 only have foreign currency coverage for the first quarter of 2011.Further discussion of hedging risks can be found under the caption "Market Risk Management - FinancialInstruments" below, and Note 11 to the Consolidated Financial Statements.

8Chiquita Brands International, Inc. — 2010 Annual Report
EU Banana Import Regulation. From 2006 through the second quarter of 2010, bananas imported into theEuropean Union (“EU”) from Latin America, our primary source of fruit, were subject to a tariff of €176 per metricton, while bananas imported from African, Caribbean, and Pacific sources have been and continue to be allowed toenter the EU tariff-free (since January 2008, in unlimited quantities). Following several successful legal challengesto this EU import arrangement in the World Trade Organization (“WTO”), the EU and 11 Latin American countriesinitialed the WTO “Geneva Agreement on Trade in Bananas” (“GATB”) in December 2009, under which the EUagreed to reduce tariffs on Latin American bananas in stages, starting with a new rate of €148 per metric ton in2010, reducing to €143 per metric ton in 2011 and ending with a rate of €114 per metric ton by 2019. At that time,the EU also initialed a WTO agreement with the United States, under which it agreed not to reinstate WTO-illegaltariff quotas, quotas, or licenses on banana imports. On June 9, 2010, the EU reduced its tariff to €148 per metricton retroactively to December 15, 2009. On January 1, 2011, the EU further reduced its tariff to €143 per metric tonas required by the GATB. The WTO agreements were ratified by the European Parliament in February 2011 andmay need to be ratified by certain Latin American countries before being further formalized in the WTO. The initial€28 per metric ton reduction in the tariff lowered our tariff costs by $26 million for the year ended December 31,2010.
In another regulatory development, the EU concluded a free trade area ("FTA") agreement with Colombia andPeru in March 2010, and an FTA with the Central American countries and Panama in May 2010. Under both FTAagreements, the EU committed to reduce its banana tariff to €75 per metric ton over ten years for specified volumesof banana exports from each of the FTA countries. The agreements will need to be approved by the EuropeanCouncil, and ratified by the European Parliament and Latin American legislatures, before they take effect. There isno way of knowing when, or whether, one or both of these FTAs will be implemented, and what, if any, effect theywill have on our operations.
SALADS AND HEALTHY SNACKS SEGMENTNet sales for the segment were $1.0 billion, $1.1 billion and $1.3 billion in 2010, 2009 and 2008, respectively.
The decline in sales in 2010 from 2009 was primarily due to lower volume in retail value-added salads as a result ofcustomer conversions from branded to private label in the fourth quarter of 2009 and early 2010. We expect toremain market leaders in the value-added salad category, despite lower volume comparisons in first part of 2011because of these conversions. However, new accounts already signed are expected to partially offset volume lossesin the second half of 2011. Also in the first quarter of 2011, the value-added salad industry was affected by coldweather and a raw product blight in Yuma that lowered productivity and raised field and manufacturing costs, butthese factors are expected to abate as primary sourcing operations return to Salinas in March 2011. The decline insales in 2009 from 2008 primarily resulted from the discontinuation of products and contracts in North Americanfoodservice that were not sufficiently profitable, which created production flexibility that allowed us to improve ournetwork efficiencies.
We continue to invest in the area of food safety and unveiled FreshRinse™ in the fourth quarter of 2010.FreshRinse is a new produce wash that significantly reduces microorganisms on particular leafy greens compared toa conventional chlorine sanitizer. We are converting all of our facilities to use this technology during the first half of2011. As part of our commitment to advancing food safety standards, once we have fully implemented ourconversion, we plan to make the technology available for license to others in the industry and for other producewash applications.

Chiquita Brands International, Inc. — 2010 Annual Report9
Significant increases (decreases) in our Salads and Healthy Snacks segment results, presented in millions, are asfollows:
$ (400) 2008 Salads and Healthy Snacks segment results
4 Pricing(14) Volume375 Absence of goodwill impairment charge11 Selling, general, administrative and innovation costs45 Improved network efficiencies(7) Marketing investment for retail value-added salads32 Commodity inputs, such as fuel and packaging material costs
5 Results of European smoothie business5 Results in processed fruit ingredients4 Other
$ 60 2009 Salads and Healthy Snacks segment results
5 Pricing(32) Volume primarily in retail value-added salads12 Selling, general, administrative costs26 Improved network efficiencies(9) Marketing investment for retail value-added salads
(13) Commodity inputs, such as fuel and packaging material costs47 Deconsolidation, sale and results of European smoothie business(1) Other
$ 95 2010 Salads and Healthy Snacks segment results
Volume and pricing for Fresh Express-branded retail value-added salads was as follows:
(In millions, except percentages) 2010 2009 % Change
Volume (12-count cases) 54.5 63.4 (14.0)%Pricing 0.6%
On May 25, 2010, we sold 51% of our European smoothie business to Danone S.A. for €15 million ($18million) and deconsolidated it, accounting for our remaining 49% investment using the equity method. Thedeconsolidation and sale resulted in the creation of Danone Chiquita Fruits SAS (“Danone JV”), which is a jointventure intended to develop, manufacture, and sell packaged fruit juices and fruit smoothies in Europe. The gain onthe deconsolidation and sale of the European smoothie business was $32 million, which includes a gain of $15million from the remeasurement of our retained investment in the Danone JV to its fair value of $16 million on theclosing date as described in Note 3 to the Consolidated Financial Statements. The carrying value of the Danone JVis $18 million, included in “Investments and other assets, net” on our Consolidated Balance Sheet at December 31,2010, and the net results of the Danone JV are recognized in a single line, “Equity in losses (earnings) of investees”on the Consolidated Statements of Income. Sales of smoothies in Europe in 2010 before entering into the DanoneJV in May 2010 were $13 million. European smoothie sales were $26 million and $25 million in 2009 and 2008,respectively. We recognized European smoothie operating losses of $8 million, $22 million, and $26 million in2010, 2009, and 2008, respectively. See further information on the Danone JV in Note 3 to the ConsolidatedFinancial Statements.
In 2010, segment results improved as we continued to build on the network efficiencies and other sustainableimprovements that we achieved in 2009. These achievements reversed trends prior to 2009 that led to the goodwillimpairment charge in the fourth quarter of 2008, which is further described in Note 1 to the Consolidated FinancialStatements.

10Chiquita Brands International, Inc. — 2010 Annual Report
OTHER PRODUCE SEGMENTNet sales for the segment were $261 million, $253 million and $244 million in 2010, 2009, and 2008,
respectively. Segment results were $5 million, $6 million and $10 million in 2010, 2009 and 2008, respectively.The sales increase in the segment was primarily due to higher volume of other fresh produce, including our value-added Fresh & Ready® avocados, which are ripened using a proprietary process and specially packaged to provideconsistently ripe avocados and a longer shelf life to consumers and retailers. In 2010, we recognized income of $3million from the collection of a grower advance that had been fully reserved since 2000, which was included in“Other income (expense), net” in the Consolidated Statements of Income. During the fourth quarter of 2010, wediscontinued certain types of low-margin produce to better focus on produce generating sufficient margins oroffering growth opportunity by adding value to consumers and retailers. These discontinued products accounted forapproximately $80 million of the 2010 sales and had an insignificant effect on segment results.
CORPORATE AND RELOCATION OF EUROPEAN HEADQUARTERSCorporate expenses were $70 million, $81 million, and $66 million in 2010, 2009 and 2008, respectively.
Corporate expenses were higher in 2009 than 2010 and 2008 primarily due to higher incentive compensation andcosts associated with workforce reductions. As described in Note 20 to the Consolidated Financial Statements,relocation of the European headquarters was substantially complete at December 31, 2009.
INTEREST EXPENSEInterest expense was $57 million, $62 million and $81 million in 2010, 2009 and 2008, respectively. Interest
expense declined primarily due to debt reductions. As described more fully in Note 10 to the Consolidated FinancialStatements, we repurchased $13 million, $38 million and $91 million of our Senior Notes in the open market in2010, 2009, and 2008, respectively, which resulted in $1 million, $3 million, and $8 million of annual interestsavings, respectively. Interest expense includes $9 million of deferred financing fee write-offs in 2008 as a result ofthese repurchases; repurchases in 2010 and 2009 did not result in significant deferred financing fee write-offs.
OTHER INCOME AND EXPENSEOther income in 2010 included $3 million ($2 million net of income tax) from the refund of consumption taxes
paid between 1980 and 1990, $3 million from the collection of a grower advance that had been fully reserved since2000 (attributed to the Other Produce segment), $3 million of expense related to contingencies in Europe (see Note19 to the Consolidated Financial Statements for further discussion of contingencies) and a small loss of less than $1million related to fees to repurchase Senior Notes in the open market at or near par. Other expense in 2009 includeda small loss related to fees from Senior Note repurchases in the open market near par. Other income in 2008included a $14 million gain, after related deferred financing fee write-offs, from repurchasing Senior Notes at adiscount in the open market with proceeds from the sale of Atlanta AG and $9 million ($6 million net of income tax)from the resolution of claims and the receipt of refunds of certain non-income taxes paid between 1980 and 1990 inItaly.
INCOME TAXESOur foreign operations are generally taxed at rates lower than the U.S. statutory rate, and our overall effective
tax rate varies significantly from period to period due to the level and mix of income among various domestic andforeign jurisdictions. No U.S. taxes have been accrued on foreign earnings because such earnings have been or areexpected to be permanently invested in foreign operations. We have not historically generated U.S. federal taxableincome on an annual basis; however, we generated U.S. federal taxable income in 2009 and 2010, which was fullyoffset by the utilization of net operating loss carryforwards (“NOLs”). Even though NOLs have been utilized, ourremaining NOLs continue to have full valuation allowances. If in the future we demonstrate a trend of taxableincome and an expectation that we will utilize our deferred tax assets, some or all of the valuation allowance may bereleased through the income tax line in the Consolidated Statements of Income. As of December 31, 2010, we hadapproximately $101 million of U.S. federal and state valuation allowances. See Note 15 to the ConsolidatedFinancial Statements for further information about our income taxes and valuation allowances.

Chiquita Brands International, Inc. — 2010 Annual Report11
Income taxes were a net benefit of $2 million, less than $1 million and $2 million in 2010, 2009 and 2008,respectively. No income tax expense resulted from the gain on the sale of 51% of the European smoothie businessbecause sufficient foreign NOLs were in place and, when those foreign NOLs were used, the related valuationallowance was also released. Income taxes included benefits of $13 million, $16 million and $17 million for 2010,2009 and 2008, respectively. The benefits relate to the resolution of tax contingencies and governmental rulings invarious jurisdictions in 2010; the resolution of tax contingencies and $4 million of benefits from the sale of ouroperations in the Ivory Coast in 2009; and the resolution of tax contingencies in 2008.
OTHER SIGNIFICANT TRANSACTIONS AND EVENTSSale of Investment in Coast Citrus Distributors. In April 2010, we sold our 49% investment in Coast Citrus
Distributors, Inc. for $18 million in cash, which approximated its carrying value. Prior to the sale, we accounted forthis investment using the equity method.
Sale of Asia JV. In August 2009, we sold our 50% interest in the Asia JV to our former joint venture partner.Previously, we had operated in Asia primarily through the Chiquita-Unifrutti joint venture (“Asia JV”), which wasprimarily engaged in the distribution of fresh bananas and pineapples from the Philippines to markets in the Far andMiddle East. In connection with the sale, we entered into new long-term agreements with our former joint venturepartner for (a) shipping and supply of bananas sold in the Middle East and (b) licensing of the Chiquita brand forsales of whole fresh bananas and pineapples in Japan and Korea. As a result, sales and costs of selling Chiquitabananas in the Middle East are now fully reflected in our Consolidated Statements of Income and we receive a morepredictable income stream from Japan and Korea. See Note 3 to the Consolidated Financial Statements for furtherinformation.
Sale of Ivory Coast Operations. In January 2009, we sold our operations in the Ivory Coast. The sale resultedin a pre-tax gain of $4 million included in “Cost of sales,” including realization of $11 million of cumulativetranslation gains. Income tax benefits of approximately $4 million were recognized related to these operations.
Sale of Atlanta AG – Discontinued Operations. In August 2008, we sold our subsidiary, Atlanta AG(“Atlanta”), for aggregate consideration of (i) €65 million in cash ($97 million), including working capital and netdebt adjustments, and (ii) contingent consideration to be determined based on future performance criteria. Of thetotal consideration, approximately €6 million ($7 million), which had been held in escrow to secure any potentialobligations under the sale agreement, was collected in February 2010. In connection with the sale, we contractedwith Atlanta to continue to serve as our preferred supplier of banana ripening and distribution services in Germany,Austria and Denmark for at least five years. In 2008, we recognized a net gain of less than $1 million indiscontinued operations and a $2 million income tax benefit to continuing operations from the reversal of certainvaluation allowances from the sale and related services agreement. In 2010 and 2009, we recorded $3 million and$1 million of expense, respectively, based on new information about our potential indemnity obligations under thesale agreement; which is included in “Income (loss) from discontinued operations, net of tax” in the ConsolidatedStatements of Income. Further information on the transaction, including summary financial information for thesediscontinued operations, can be found in Note 3 to the Consolidated Financial Statements.
Liquidity and Capital Resources
We believe that our cash position, cash flow generated by operating subsidiaries and borrowing capacity willprovide sufficient cash reserves and liquidity to fund our working capital needs, capital expenditures and debtservice requirements. We are in compliance with the financial covenants of our credit facility and expect to remainin compliance for more than twelve months from the date of this filing. We have debt maturities of no more than$20 million in any year until 2014. At December 31, 2010, we had a cash balance of $156 million, no borrowingswere outstanding under our revolving credit facility and $23 million of credit availability was used to support issuedletters of credit, leaving $127 million of credit available. We did not borrow under our revolving credit facility in2010, but in 2009 and 2008 we borrowed and repaid $38 million and $57 million, respectively, to finance seasonalworking capital demands, which are highest in the first and second quarters. Based on our current cash position, wedo not expect to borrow under our revolving credit facility for seasonal working capital purposes in 2011.
12Chiquita Brands International, Inc. — 2010 Annual Report
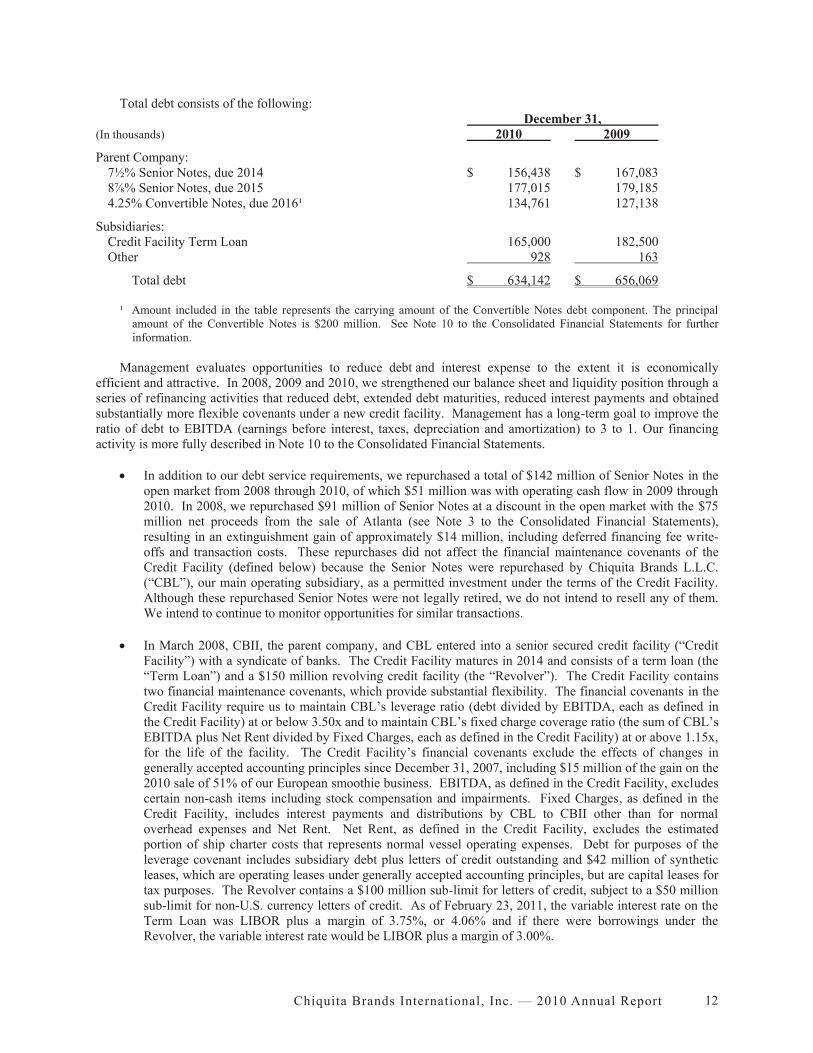
Total debt consists of the following:December 31,
(In thousands) 2010 2009
Parent Company:7½% Senior Notes, due 2014 $ 156,438 $ 167,0838⅞% Senior Notes, due 2015 177,015 179,1854.25% Convertible Notes, due 2016¹ 134,761 127,138
Subsidiaries:Credit Facility Term Loan 165,000 182,500Other 928 163
Total debt $ 634,142 $ 656,069
¹ Amount included in the table represents the carrying amount of the Convertible Notes debt component. The principalamount of the Convertible Notes is $200 million. See Note 10 to the Consolidated Financial Statements for furtherinformation.
Management evaluates opportunities to reduce debt and interest expense to the extent it is economicallyefficient and attractive. In 2008, 2009 and 2010, we strengthened our balance sheet and liquidity position through aseries of refinancing activities that reduced debt, extended debt maturities, reduced interest payments and obtainedsubstantially more flexible covenants under a new credit facility. Management has a long-term goal to improve theratio of debt to EBITDA (earnings before interest, taxes, depreciation and amortization) to 3 to 1. Our financingactivity is more fully described in Note 10 to the Consolidated Financial Statements.
In addition to our debt service requirements, we repurchased a total of $142 million of Senior Notes in theopen market from 2008 through 2010, of which $51 million was with operating cash flow in 2009 through2010. In 2008, we repurchased $91 million of Senior Notes at a discount in the open market with the $75million net proceeds from the sale of Atlanta (see Note 3 to the Consolidated Financial Statements),resulting in an extinguishment gain of approximately $14 million, including deferred financing fee write-offs and transaction costs. These repurchases did not affect the financial maintenance covenants of theCredit Facility (defined below) because the Senior Notes were repurchased by Chiquita Brands L.L.C.(“CBL”), our main operating subsidiary, as a permitted investment under the terms of the Credit Facility.Although these repurchased Senior Notes were not legally retired, we do not intend to resell any of them.We intend to continue to monitor opportunities for similar transactions.
In March 2008, CBII, the parent company, and CBL entered into a senior secured credit facility (“CreditFacility”) with a syndicate of banks. The Credit Facility matures in 2014 and consists of a term loan (the“Term Loan”) and a $150 million revolving credit facility (the “Revolver”). The Credit Facility containstwo financial maintenance covenants, which provide substantial flexibility. The financial covenants in theCredit Facility require us to maintain CBL’s leverage ratio (debt divided by EBITDA, each as defined inthe Credit Facility) at or below 3.50x and to maintain CBL’s fixed charge coverage ratio (the sum of CBL’sEBITDA plus Net Rent divided by Fixed Charges, each as defined in the Credit Facility) at or above 1.15x,for the life of the facility. The Credit Facility’s financial covenants exclude the effects of changes ingenerally accepted accounting principles since December 31, 2007, including $15 million of the gain on the2010 sale of 51% of our European smoothie business. EBITDA, as defined in the Credit Facility, excludescertain non-cash items including stock compensation and impairments. Fixed Charges, as defined in theCredit Facility, includes interest payments and distributions by CBL to CBII other than for normaloverhead expenses and Net Rent. Net Rent, as defined in the Credit Facility, excludes the estimatedportion of ship charter costs that represents normal vessel operating expenses. Debt for purposes of theleverage covenant includes subsidiary debt plus letters of credit outstanding and $42 million of syntheticleases, which are operating leases under generally accepted accounting principles, but are capital leases fortax purposes. The Revolver contains a $100 million sub-limit for letters of credit, subject to a $50 millionsub-limit for non-U.S. currency letters of credit. As of February 23, 2011, the variable interest rate on theTerm Loan was LIBOR plus a margin of 3.75%, or 4.06% and if there were borrowings under theRevolver, the variable interest rate would be LIBOR plus a margin of 3.00%.

Chiquita Brands International, Inc. — 2010 Annual Report13
In February 2008, we issued $200 million of 4.25% Convertible Notes, which provided approximately$194 million in net proceeds that were used to repay debt under our previous credit facility. TheConvertible Notes mature August 15, 2016 and are unsecured, unsubordinated obligations of CBII and rankequally with the 7½% Senior Notes and the 8⅞% Senior Notes. The Convertible Notes pay interest semi-annually at a rate of 4.25% per annum. Under the circumstances described in Note 10 to the ConsolidatedFinancial Statements, the Convertible Notes are convertible at an initial conversion rate of 44.5524 sharesof common stock per $1,000 in principal amount of the Convertible Notes, equivalent to an initialconversion price of approximately $22.45 per share of Chiquita common stock. Upon conversion, theConvertible Notes may be settled in shares, in cash or any combination thereof, at our option. Although weinitially reserved 11.8 million shares for issuance upon conversions of the Convertible Notes, our currentintent and policy is to settle any conversion in a cash amount equal to the principal portion together withshares of common stock to the extent that our obligation exceeds such principal portion.
The following table summarizes our contractual obligations for future cash payments at December 31, 2010:
Later(In thousands) Total 2011 2012 - 2013 2014 - 2015 years
Long-term debt:Parent company $ 533,453 $ - $ - $ 333,453 $ 200,000Subsidiaries 165,928 20,169 40,357 105,402 -
Interest on debt1 188,000 42,000 82,000 58,000 6,000Operating leases² 479,838 156,826 204,528 70,132 48,352Pension and severance
obligations3 98,869 12,485 22,949 20,480 42,955Purchase commitments4 1,261,305 504,956 439,373 228,210 88,766Other 28,448 12,846 6,452 5,935 3,215
$ 2,755,841 $ 749,282 $ 795,659 $ 821,612 $ 389,288
1 Estimating future cash payments for interest on debt requires significant assumptions. Amounts in the table reflectLIBOR of 0.25% plus a margin of 3.75% on the term loan under the Credit Facility for all future periods. Principalrepayments include scheduled principal maturities, and the full $200 million principal of our Convertible Senior Notesdue 2016. The table does not include any borrowings under the Revolver to fund working capital needs or interestthereon.
² Certain operating leases contain residual value guarantees under which we guarantee a certain minimum value at the endof the lease in the event we do not exercise our purchase option or the lessor cannot recover the guaranteed amount. Thetable does not include these amounts because we are unable to reasonably predict the ultimate timing or settlement owedto the lessor. The company estimates that the residual guarantees are approximately $26 million at December 31, 2010.
3 Obligations in foreign currencies are calculated using the December 31, 2010 exchange rates.4 Purchase commitments consist primarily of long-term contracts to purchase bananas, lettuce and other produce from
third-party producers. The terms of these contracts set the price for the purchased fruit for one to ten years; however,many of these contracts are subject to price renegotiations every one to two years. Therefore, we are only committed topurchase the produce at the contract price until the renegotiation date. Purchase commitments included in the table arebased on the current contract price and the estimated volume we are committed to purchase until the next renegotiationdate. These purchase commitments represent normal and customary operating commitments in the industry.

14Chiquita Brands International, Inc. — 2010 Annual Report
Cash and equivalents were $156 million and $121 million at December 31, 2010 and 2009, respectively, and arecomprised of either bank deposits or amounts invested in money market funds. Cash provided by operations was$98 million, $135 million and $8 million in 2010, 2009 and 2008, respectively. A subsidiary has an approximately€11 million ($15 million) uncommitted credit line for bank guarantees used primarily for payments due underimport licenses and duties in European Union countries. At December 31, 2010, we had an equal amount of cashequivalents in a compensating balance arrangement related to this uncommitted credit line.
Operating cash flow is primarily driven by operating results. Reported operating cash flow in 2010 was reducedby $19 million of bank overdrafts (outstanding checks) that were previously reported as “Accounts payable” and arenow treated as reductions of “Cash and equivalents” due to a change in the bank counterparties in the second quarterof 2010; this change had no effect on the amount of cash in banks. Cash flow from working capital in 2010 alsoincluded the payment of 2009 incentive compensation in 2010, increases in southern European accounts receivable,lower tariff accruals from lower tariff rates in 2010 and reductions in grower advances and value added taxreceivables. The increase in operating cash flow from 2008 to 2009 was primarily due to stronger operating resultsand from sustainable process improvements to better control timing of payments and pursue collections ofreceivables.
Cash flow from investing activities includes capital expenditures of $66 million, $68 million and $63 millionfor 2010, 2009 and 2008, respectively. In 2011, we expect higher capital expenditures as a result of planned facilityupgrades, including integration of the FreshRinse technology into remaining salad production lines. Net of cashsold with the business, we received €14 million ($17 million) from the sale of 51% of our European smoothiebusiness to Danone and $18 million from the sale of an equity method investment in Coast Citrus Distributors.Other investing cash flows in 2009 and 2008 primarily related to sales of the Asia JV, our former subsidiary Atlanta,and other asset sales. See Note 3 to the Consolidated Financial Statements for further details.
Depending on fuel prices, we can have significant obligations or amounts receivable under our bunker fuelhedging arrangements, although we would expect any liability or asset from these arrangements to be offset bylower or higher cash fuel costs, respectively. At December 31, 2010, and 2009, our bunker fuel forward contractswere an asset of $27 million and $6 million, respectively. The amount ultimately due or receivable will dependupon fuel prices at the dates of settlement. See “Market Risk Management – Financial Instruments” below and Note11 to the Consolidated Financial Statements for further information about our hedging activities. We expectoperating cash flows will be sufficient to cover our hedging obligations, if any.
We face certain contingent liabilities which are described in Note 19 to the Consolidated Financial Statements;in accordance with generally accepted accounting practices, reserves have not been established for most of the itemswhich are ongoing matters. It is possible that in future periods we could have to pay fines, penalties or damageswith respect to one or more of these matters, the exact amount of which would be at the discretion of the applicablecourt or regulatory body. We presently expect that we would use existing cash resources to satisfy any suchliabilities; however, depending on the size and timing of any such liability, it could have a material adverse effect onour financial position or results of operations and we could need to explore additional sources of financing, theavailability and terms of which would be dependent on prevailing market and other conditions. In addition, we aremaking payments and may be required to make additional payments to preserve our right to appeal assessments ofItalian customs cases, as more fully described in Note 19 to the Consolidated Financial Statements. Such paymentsare typically made over a period of time under a payment plan. If we ultimately prevail in these cases, the amountswill be repaid with interest.
We have not made dividend payments since 2006, and any future dividends would require approval by theboard of directors. Under the Credit Facility, CBL may distribute cash to CBII for routine CBII operating expenses,interest payments on CBII’s 7½% and 8⅞% Senior Notes and its Convertible Notes and payment of certain otherspecified CBII liabilities (“permitted payments”). CBL may distribute cash to CBII for other purposes, includingdividends, if we are in compliance with the covenants and not in default under the Credit Facility. The CBII 7½%and 8⅞% Senior Notes also have dividend payment limitations with respect to the ability and extent of declarationof dividends. At December 31, 2010, distributions to CBII, other than for permitted payments, were limited toapproximately $90 million annually.

Chiquita Brands International, Inc. — 2010 Annual Report15
Market Risk Management – Financial Instruments
HEDGING INSTRUMENTSOur products are distributed in nearly 70 countries. International sales are made primarily in U.S. dollars and
major European currencies. We reduce currency exchange risk from sales originating in currencies other than theU.S. dollar by exchanging local currencies for dollars promptly upon receipt. We consider our exposure, currentmarket conditions and hedging costs in determining when and whether to enter into new hedging instruments(principally euro put option contracts) to hedge the dollar value of our estimated net euro cash flow exposure up to18 months into the future. Put option contracts allow us to exchange a certain amount of euros for U.S. dollars ateither the exchange rate in the option contract or the spot rate. At February 23, 2011, we had hedging coverage forapproximately one-quarter of our expected net exposure for the first quarter of 2011 at a rate of $1.27 per euro.
Our shipping operations are exposed to the risk of rising fuel prices. To reduce the risk of rising fuel prices, weenter into bunker fuel forward contracts (swaps) that allow us to lock in fuel prices up to three years in the future.Bunker fuel forward contracts can offset increases in market fuel prices or can result in higher costs from declines inmarket fuel prices, but in either case reduce the volatility of changing fuel prices in our results. At February 23,2011, we had hedging coverage for approximately three-fourths of our expected fuel purchases through 2011 ataverage bunker fuel swap rates of $439 per metric ton, hedging coverage for approximately one-half of our expectedfuel purchases in 2012 at average bunker fuel swap rates of $459 per metric ton, hedging coverage forapproximately 40% of our expected fuel purchases in 2013 at average bunker fuel swap rates of $488 per metric tonand hedging coverage for approximately one-fourth of our expected fuel purchases in the first quarter of 2014 ataverage bunker fuel swap rates of $558 per metric ton.
We carry hedging instruments at fair value on our Consolidated Balance Sheets, and defer potential gains andlosses to the extent that the hedges are effective in “Accumulated other comprehensive loss” until the hedgedtransaction occurs (the euro sale or fuel purchase to which the hedging instrument was intended to apply). The fairvalue of the foreign currency options and bunker fuel forward contracts was a net asset of $28 million and $13million at December 31, 2010 and 2009, respectively. A hypothetical 10% increase in the euro currency rates wouldhave resulted in a decline in fair value of the euro put options of less than $1 million at December 31, 2010.However, we expect that any loss on these put options would be more than offset by an increase in the dollarrealization of the underlying sales denominated in foreign currencies. A hypothetical 10% decrease in bunker fuelrates would result in a decline in fair value of the bunker fuel forward contracts of approximately $24 million atDecember 31, 2010. However, we expect that any decline in the fair value of these contracts would be offset by adecrease in the cost of underlying fuel purchases.
See Notes 1 and 11 to the Consolidated Financial Statements for additional discussion of our hedging activities.See “Critical Accounting Policies and Estimates” below and Note 12 to the Consolidated Financial Statements foradditional discussion of fair value measurements, as it relates to our hedging instruments.
DEBT INSTRUMENTSWe are exposed to interest rate risk on our variable rate debt, which is comprised primarily of outstanding
balances under our Credit Facility. We had approximately $165 million of variable rate debt at December 31, 2010(see Note 10 to the Consolidated Financial Statements). A 1% change in interest rates would result in a change tointerest expense of approximately $2 million annually.
We have $534 million principal balance of fixed-rate debt, which includes the 7½% Senior Notes due 2014, the8⅞% Senior Notes due 2015 and the 4.25% Convertible Senior Notes due 2016. The $200 million principal balanceof the Convertible Notes is greater than their $135 million carrying value due to the adoption of new accountingstandards as described in Note 10 to the Consolidated Financial Statements. Although the Consolidated BalanceSheets do not present debt at fair value, a hypothetical 0.50% increase in interest rates would have resulted in adecline in the fair value of our fixed-rate debt of approximately $11 million at December 31, 2010.

16Chiquita Brands International, Inc. — 2010 Annual Report
Off-Balance Sheet Arrangements
Other than operating leases and non-cancelable purchase commitments in the normal course of business, we donot have any off-balance sheet arrangements.
Critical Accounting Policies and Estimates
Our significant accounting policies are summarized in Note 1 to the Consolidated Financial Statements. Theadditional discussion below addresses only our most significant judgments:
REVIEWING THE CARRYING VALUES OF GOODWILL AND INTANGIBLE ASSETSImpairment reviews are highly judgmental and involve the use of significant estimates and assumptions that
determine whether there is potential impairment and the amount of any impairment charge recorded. Estimates offair value involve estimates of discounted cash flows and are dependent upon discount rates and long-termassumptions regarding future sales, margin trends, market conditions and cash flow, from which actual results maydiffer.
Goodwill. Our $177 million of goodwill at December 31, 2010 primarily relates to our salad operations, FreshExpress. We review goodwill for impairment annually each fourth quarter or more frequently if circumstancesindicate the possibility of impairment. The 2010 and 2009 reviews did not indicate impairment and we hadsubstantial margin in both periods; however, as a result of the 2008 review, we recorded a $375 million ($374million after-tax) impairment charge. During the second half of 2008 and particularly in the fourth quarter, FreshExpress’ performance was below prior periods and management expectations, and when combined with slowergrowth expectations, negative category volume trends and a decline in market values resulting from weakness in thegeneral economy and the financial markets, led to the 2008 goodwill impairment charge.
The first step of the impairment review compares the fair value of the reporting unit, Fresh Express, to thecarrying value. Consistent with prior impairment reviews, we estimated the fair value of the reporting unit using acombination of (1) a market approach based on revenue and EBITDA multiples from recent comparable transactionsand (2) an income approach based on expected future cash flows discounted at 9.6%, 9.4% and 9.5% in 2010, 2009and 2008, respectively. The market approach and the income approach were weighted equally based on judgment ofthe comparability of the recent transactions and the risks inherent in estimating future cash flows. We consideredrecent economic and industry trends in estimating Fresh Express’ expected future cash flows in the incomeapproach. In 2010 and 2009, the first step did not indicate impairment because the estimated fair value of FreshExpress was substantially greater than its carrying value, and therefore, the second step was not required;reasonably possible fluctuations in the discount rate, cash flows or market multiples did not indicate impairment. In2008, however, the first step indicated potential impairment, so we performed the second step of the impairmentreview, which calculated the implied value of goodwill by subtracting the fair value of Fresh Express’ assets andliabilities, including intangible assets, from the previously estimated fair value of Fresh Express as a whole.Impairment was measured as the difference between the implied value and the carrying value of goodwill. In the2008 impairment review, an increase in the discount rate of 0.5% would have increased the impairment charge byapproximately $20 million and a 5.0% per year decrease in the expected future cash flows would have increased theimpairment charge by $15 million.
Trademarks. At December 31, 2010, Chiquita trademarks had a carrying value of $388 million and FreshExpress trademarks had a carrying value of $61 million. As indefinite-lived intangible assets that are not amortized,trademarks are also reviewed each fourth quarter or more frequently if circumstances indicate the possibility ofimpairment. The review compares the estimated fair values of the trademarks to the carrying values. The 2010,2009 and 2008 reviews of the Chiquita and Fresh Express trademarks did not indicate impairment because theestimated fair values were greater than the carrying values. Consistent with prior reviews, we estimated the fairvalues of the trademarks using the relief-from-royalty method. The relief-from-royalty method estimates the royaltyexpense that could be avoided in the operating business as a result of owning the respective trademarks. The royaltysavings are measured by applying a royalty rate to projected sales, tax-effected and then converted to present valuewith a discount rate that considers the risk associated with owning the trademarks. In the 2010 review, we assumeda 3.0% royalty rate and an 11.1% discount rate for both Chiquita and Fresh Express trademarks. In the 2009 review,

Chiquita Brands International, Inc. — 2010 Annual Report17
we assumed a 3.0% royalty rate and a 13.0% discount rate for both the Chiquita and Fresh Express trademarks. Inthe 2008 review, we assumed a 3.0% royalty rate for Chiquita trademarks, a 1.0% royalty rate for Fresh Expresstrademarks, and a 12.0% discount rate for both Chiquita and Fresh Express trademarks. In 2009, we changed theroyalty rate assumed for the Fresh Express trademarks to more closely align it with market data for similar royaltyagreements and recent Fresh Express agreements. The fair value estimate is most sensitive to the royalty rate, butreasonably possible fluctuations in the royalty rates for both the Chiquita and Fresh Express trademarks also did notindicate impairment. The fair value estimate is less sensitive to the discount rate, and reasonably possible changesto the discount rate would not indicate impairment for either trademark.
Other Intangible Assets. At December 31, 2010, other intangible assets had a $115 million carrying value netof amortization, consisting of $78 million in customer relationships and $37 million in patented technology relatedto Fresh Express. For amortizable intangible assets, we review the carrying value only when impairment indicatorsare present, by comparing (i) estimates of undiscounted future cash flows, before interest charges, included in ouroperating plans versus (ii) the carrying values of the related assets. Tests are performed over asset groups at thelowest level of identifiable cash flows. No impairment indicators existed in 2010 or 2009. The goodwillimpairment charge recorded in the fourth quarter of 2008 was an impairment indicator; however, no impairmentresulted from testing these assets.
REVIEWING THE CARRYING VALUES OF PROPERTY, PLANT AND EQUIPMENTWe also review the carrying value of our property, plant and equipment when impairment indicators are present.
Tests are performed over asset groups at the lowest level of identifiable cash flows. No material impairment chargeswere recorded during 2010 or 2009. The goodwill impairment charge recorded in 2008 was an impairment indicatorfor the property, plant and equipment at Fresh Express; however, no impairment resulted from testing these assets.Also in 2008, we recorded a $3 million impairment charge related to the closure of a ripening facility in the UnitedKingdom.
MEASURING THE FAIR VALUE OF FINANCIAL ASSETS AND LIABILITIESWe adopted accounting standards for fair value measurements for financial assets and financial liabilities
effective January 1, 2008. The effective date of the fair value standards for nonfinancial assets and nonfinancialliabilities was postponed, and we adopted these standards effective January 1, 2009. Fair value measurements ofnonfinancial assets and nonfinancial liabilities are primarily used in goodwill, trademark and other intangible assetimpairment reviews, as described above, and in the valuation of assets held for sale. The standards provide aframework for measuring fair value, which prioritizes the use of observable inputs in measuring fair value. Fairvalue is the price to hypothetically sell an asset or transfer a liability in an orderly manner in the principal market forthat asset or liability. The standards address valuation techniques used to measure fair value, including the marketapproach, the income approach and the cost approach. The market approach uses prices or relevant informationgenerated by market transactions involving identical or comparable assets or liabilities. The income approachinvolves converting future cash flows to a single present value, with the fair value measurement based on currentmarket expectations about those future cash flows. The cost approach is based on the amount that currently wouldbe required to replace the service capacity of the asset. Fair value measurements are presented in more detail inNotes 12 and 14 to the Consolidated Financial Statements.
The level of a fair value measurement is determined by the lowest level input that is significant to themeasurement. Level 3 measurements involve the most judgment, and our most significant Level 3 fair valuemeasurements are those used in impairment reviews of goodwill, trademarks and other intangible assets, asdescribed above. The three levels are (from highest to lowest):
Level 1 – observable prices in active markets for identical assets and liabilities;Level 2 – observable inputs other than quoted market prices in active markets for identical assets and liabilities,
which include quoted prices for similar assets or liabilities in an active market and market-corroborated inputs; and
Level 3 – unobservable inputs.

18Chiquita Brands International, Inc. — 2010 Annual Report
ACCOUNTING FOR PENSION AND TROPICAL SEVERANCE PLANSSignificant assumptions used in the actuarial calculation of projected benefit obligations related to our defined
benefit pension and foreign pension and severance plans include the discount rate and the long-term rate ofcompensation increase. The weighted average discount rate assumptions used to determine the projected benefitobligations for domestic pension plans were 5.0% and 5.5% at December 31, 2010 and 2009, respectively, whichwere based on a yield curve which uses the plans’ expected payouts combined with a large population of highquality, fixed income investments in the U.S. that are appropriate for the expected timing of the plans’ payments.The weighted average discount rate assumptions used to determine the projected benefit obligations for the foreignpension and severance plans were 8.0% at both December 31, 2010 and 2009, which represented the 10-year U.S.Treasury rate adjusted to reflect local inflation rates in these countries. The weighted average long-term rate ofcompensation increase used to determine the projected benefit obligations for both domestic and foreign plans was5.0% in 2010 and 2009.
Determination of the net periodic benefit cost also includes an assumption for the weighted average long-termrate of return on plan assets, which was assumed to be 8.0% and 7.75% for domestic plans in 2010 and 2009,respectively, and 1.0% for foreign plans in both 2010 and 2009. Actual rates of return can differ significantly fromthose assumed as a result of both the short-term volatility and longer-term changes in average market returns.
A 1% change to the discount rate, long-term rate of compensation increase, or long-term rate of return on planassets each affects pension expense by less than $1 million annually.
ACCOUNTING FOR INCOME TAXESWe are subject to income taxes in both the United States and numerous foreign jurisdictions. Income tax
expense or benefit is provided for using the asset and liability method. Deferred income taxes are recognized atcurrently enacted tax rates for the expected future tax consequences attributable to temporary differences betweenamounts reported for income tax purposes and financial reporting purposes. Deferred taxes are not provided for theundistributed earnings of subsidiaries operating outside the U.S. that have been permanently reinvested in foreignoperations. For deferred tax assets, we record an appropriate valuation allowance to reduce them to the amount thatis “more likely than not” to be realized. The determination as to whether a deferred tax asset will be realized ismade on a tax filer and jurisdictional basis and is based on the evaluation of positive and negative evidence. Thisevidence includes historical taxable income, projected future taxable income, the expected timing of the reversal ofexisting temporary differences and the implementation of tax planning strategies. Projected future taxable income isbased on expected results and assumptions as to the jurisdiction in which the income will be earned. The expectedtiming of the reversals of existing temporary differences is based on current tax law and our tax methods ofaccounting.
Deferred tax assets primarily relate to net operating loss carryforwards (“NOLs”). U.S. NOLs were $320million and $373 million as of December 31, 2010 and 2009, respectively. We have a full valuation allowanceagainst these NOLs due to our history of tax losses in the specific tax jurisdictions. Despite our history of tax losses,we generated taxable income in the U.S. in 2010 and 2009, which utilized a portion of the NOL carryforwards.Even though U.S. NOLs were utilized in 2010 and 2009, our remaining NOLs continue to have full valuationallowances. If in the future, we demonstrate a trend of taxable income and an expectation that we will utilize ourdeferred tax assets, some or all of the valuation allowance may be released through the income tax line of theConsolidated Statements of Income.
In the ordinary course of business, there are many transactions and calculations where the ultimate income taxdetermination is uncertain. The evaluation of a tax position is a two-step process. The first step is to evaluate theuncertain tax position for recognition by determining if the weight of available evidence indicates that it is “more-likely-than-not” that a tax position, including resolution of any related appeals or litigation, will be sustained uponexamination based on its technical merits. If the recognition criterion is met, the second step is to measure theincome tax benefit to be realized. Tax positions or portions of tax positions that do not meet these criteria are de-recognized by recording reserves. We establish reserves for income tax-related uncertainties based on estimates ofwhether, and the extent to which, additional taxes, penalties and interest could be due. Provisions for and changes tothese reserves, as well as the related net interest and penalties, are included in “Income tax benefit” in theConsolidated Statements of Income. Significant judgment is required in evaluating tax positions and determiningthe company’s provision for income taxes. We regularly review our tax positions, and the reserves are adjusted in

Chiquita Brands International, Inc. — 2010 Annual Report19
light of changing facts and circumstances, such as the resolution of outstanding tax audits or contingencies invarious jurisdictions and the expiration of statutes of limitations.
ACCOUNTING FOR CONTINGENT LIABILITIESOn a quarterly basis, we review the status of each claim and legal proceeding and assess the related potential
financial exposure. This is coordinated from information obtained through external and internal counsel. If thepotential loss from any claim or legal proceeding is considered probable and the amount can be reasonablyestimated, we accrue a liability for the estimated loss. To the extent the amount of a probable loss is estimable onlyby reference to a range of equally likely outcomes, and no amount within the range appears to be a better estimatethan any other amount, we accrue the low end of the range. We draw judgments related to accruals based on thebest information available at the time, which may be based on estimates and assumptions, including those thatdepend on external factors beyond our control. As additional information becomes available, we reassess thepotential liabilities related to pending claims and litigation and may revise estimates. Such revisions could have asignificant effect on our results of operations and financial position.
ASSESSING COLLECTIBILITY OF GROWER ADVANCESSeasonal advances may be made to certain qualified growers of other produce, which are usually collected as
the other produce is harvested and sold. We generally require property liens and pledges of the season’s produce ascollateral to support these advances. If sales of the season’s produce do not result in full repayment of the advance,we may exercise the collateral provisions or renegotiate terms, including interest, to collect the remaining balance.Allowances are established when we determine it is probable that the grower will be unable to repay the advancebased on our knowledge of the grower’s financial condition and our historical loss experience. These estimatesrequire significant judgment because of the inherent risks and uncertainties of projecting growers’ cash flows, cropyields, and market prices. Growers are also subject to many of the same risks that face us, such as weatherdisruptions and agricultural conditions, foreign currency exchange rates, and government regulation. Net groweradvances were $76 million and $81 million, of which, $50 million (including $20 million classified as long-term)and $49 million (including $12 million classified as long-term) were made to a large grower in Chile at December31, 2010 and 2009, respectively. We also carry payables to growers related to revenue collected from the sale of theother produce that is subsequently remitted to the grower, less outstanding grower advances and a margin retainedby us based upon the terms of the contract. Grower payables of $21 million and $15 million at December 31, 2010and 2009, respectively, are included in “Other Liabilities” in the Consolidated Balance Sheets.
ACCOUNTING FOR SALES INCENTIVESWe offer sales incentives and promotions to our customers and to consumers primarily in our Salads and
Healthy Snacks segment. These incentives are mainly volume-related rebates, exclusivity and placement fees (feespaid to retailers for product display), consumer coupons and promotional discounts. Consideration given tocustomers and consumers related to sales incentives is recorded as a reduction of sales. Changes in the estimatedamount of incentives to be paid are treated as changes in estimates and are recognized in the period of change.
New Accounting Standards
See Note 1 to the Consolidated Financial Statements for information regarding new accounting standards thatcould affect us.

20Chiquita Brands International, Inc. — 2010 Annual Report
Risks of International Operations
We operate in many foreign countries, including those in Central America, Europe, the Middle East, China andAfrica. Information about our operations by geographic area can be found in Note 18 to the Consolidated FinancialStatements. Our activities are subject to risks inherent in operating in these countries, including governmentregulation, currency restrictions and other restraints, import and export restrictions, burdensome taxes, risks ofexpropriation, threats to employees, political instability, terrorist activities, including extortion, and risks of U.S. andforeign governmental action in relation to us. Should such circumstances occur, we might need to curtail, cease oralter our activities in a particular region or country. Trade restrictions apply to certain countries, such as Iran, thatrequire us to obtain licenses from the U.S. government for sales in these countries; these sales are able to belicensed because the products we sell are food staples and the specific parties involved in the sales are cleared by theU.S. government.
See “Item 1A – Risk Factors” and “Item 3 – Legal Proceedings” in the Annual Report on Form 10-K and Note19 to the Consolidated Financial Statements for a further description of legal proceedings and other risks including,in particular, (1) a competition law investigation relating to prior information sharing in Europe and Statement ofObjections issued to us by the European Commission, (2) the plea agreement with the U.S. Department of Justicerelating to payments made by our former Colombian subsidiary to a Colombian paramilitary group and subsequentcivil litigation and investigations relating to the Colombian payments and (3) customs and tax proceedings in Italy.
*******
This Annual Report contains certain statements that are “forward-looking statements” within the meaning of thePrivate Securities Litigation Reform Act of 1995. These statements are subject to a number of assumptions, risksand uncertainties, many of which are beyond our control, including: the customary risks experienced by global foodcompanies, such as prices for commodity and other inputs, currency exchange rate fluctuations, industry andcompetitive conditions (all of which may be more unpredictable in light of continuing uncertainty in the globaleconomic environment), government regulations, food safety issues and product recalls affecting us or the industry,labor relations, taxes, political instability and terrorism; unusual weather events, conditions or crop risks; access toand cost of financing; and the outcome of pending litigation and governmental investigations involving us, as wellas the legal fees and other costs incurred in connection with such items.
The forward-looking statements speak as of the date made and are not guarantees of future performance.Actual results or developments may differ materially from the expectations expressed or implied in the forward-looking statements, and we undertake no obligation to update any such statements.

Chiquita Brands International, Inc. — 2010 Annual Report21
(This page intentionally left blank.)
22Chiquita Brands International, Inc. — 2010 Annual Report
REPORT OF INDEPENDENT REGISTERED PUBLIC ACCOUNTING FIRM
To the Board of Directors and Shareholders of Chiquita Brands International, Inc.
In our opinion, the accompanying consolidated balance sheets and the related consolidated statements ofincome, shareholders' equity and cash flow present fairly, in all material respects, the financial position of ChiquitaBrands International, Inc. and its subsidiaries at December 31, 2010 and 2009, and the results of their operations andtheir cash flows for each of the three years in the period ended December 31, 2010 in conformity with accountingprinciples generally accepted in the United States of America. Also in our opinion, the Company maintained, in allmaterial respects, effective internal control over financial reporting as of December 31, 2010, based on criteriaestablished in Internal Control - Integrated Framework issued by the Committee of Sponsoring Organizations of theTreadway Commission (COSO). The Company's management is responsible for these financial statements, formaintaining effective internal control over financial reporting and for its assessment of the effectiveness of internalcontrol over financial reporting, included in Management's Responsibility for Financial Reporting. Ourresponsibility is to express opinions on these financial statements and on the Company's internal control overfinancial reporting based on our integrated audits. We conducted our audits in accordance with the standards of thePublic Company Accounting Oversight Board (United States). Those standards require that we plan and performthe audits to obtain reasonable assurance about whether the financial statements are free of material misstatementand whether effective internal control over financial reporting was maintained in all material respects. Our audits ofthe financial statements included examining, on a test basis, evidence supporting the amounts and disclosures in thefinancial statements, assessing the accounting principles used and significant estimates made by management, andevaluating the overall financial statement presentation. Our audit of internal control over financial reportingincluded obtaining an understanding of internal control over financial reporting, assessing the risk that a materialweakness exists, and testing and evaluating the design and operating effectiveness of internal control based on theassessed risk. Our audits also included performing such other procedures as we considered necessary in thecircumstances. We believe that our audits provide a reasonable basis for our opinions.
A company’s internal control over financial reporting is a process designed to provide reasonable assuranceregarding the reliability of financial reporting and the preparation of financial statements for external purposes inaccordance with generally accepted accounting principles. A company’s internal control over financial reportingincludes those policies and procedures that (i) pertain to the maintenance of records that, in reasonable detail,accurately and fairly reflect the transactions and dispositions of the assets of the company; (ii) provide reasonableassurance that transactions are recorded as necessary to permit preparation of financial statements in accordancewith generally accepted accounting principles, and that receipts and expenditures of the company are being madeonly in accordance with authorizations of management and directors of the company; and (iii) provide reasonableassurance regarding prevention or timely detection of unauthorized acquisition, use, or disposition of the company’sassets that could have a material effect on the financial statements.
Because of its inherent limitations, internal control over financial reporting may not prevent or detectmisstatements. Also, projections of any evaluation of effectiveness to future periods are subject to the risk thatcontrols may become inadequate because of changes in conditions, or that the degree of compliance with thepolicies or procedures may deteriorate.
Cincinnati, OhioMarch 4, 2011

Chiquita Brands International, Inc. — 2010 Annual Report23
Chiquita Brands International, Inc.CONSOLIDATED STATEMENTS OF INCOME
(In thousands, except per share amounts) 2010 2009 2008
Net sales $ 3,227,432 $ 3,470,435 $ 3,609,371
Operating expenses:Cost of sales 2,765,104 2,890,835 3,067,612Selling, general and administrative 323,224 374,111 378,248Depreciation 51,172 52,695 62,899Amortization 9,844 10,294 9,824Gain on deconsolidation and sale of 51%
of European smoothie business (32,497) - -Equity in losses (earnings) of investees 2,925 (16,885) (10,321)Relocation of European headquarters - 12,076 6,931Goodwill impairment - - 375,295
3,119,772 3,323,126 3,890,488
Operating income (loss) 107,660 147,309 (281,117)
Interest income 5,532 6,045 7,152Interest expense (57,058) (62,058) (80,802)Other income (expense), net 2,889 (488) 22,708
Income (loss) from continuing operationsbefore income taxes 59,023 90,808 (332,059)
Income tax benefit 1,600 400 1,900
Income (loss) from continuing operations 60,623 91,208 (330,159)
(Loss) income from discontinuedoperations, net of income taxes (3,268) (717) 1,464
Net income (loss) $ 57,355 $ 90,491 $ (328,695)
Earnings (loss) per common share – basic:Continuing operations $ 1.34 $ 2.05 $ (7.54)Discontinued operations (0.07) (0.02) 0.03
$ 1.27 $ 2.03 $ (7.51)
Earnings (loss) per common share – diluted:Continuing operations $ 1.32 $ 2.02 $ (7.54)Discontinued operations (0.07) (0.02) 0.03
$ 1.25 $ 2.00 $ (7.51)
See Notes to Consolidated Financial Statements.

24Chiquita Brands International, Inc. — 2010 Annual Report
Chiquita Brands International, Inc.CONSOLIDATED BALANCE SHEETS
December 31,(In thousands, except share amounts) 2010 2009
ASSETSCurrent assets:
Cash and equivalents $ 156,481 $ 121,369Trade receivables, less allowances of
$9,497 and $9,619, respectively 265,283 290,083Other receivables, net 116,638 157,640Inventories 212,249 212,893Prepaid expenses 38,044 36,728Other current assets 19,939 8,212
Total current assets 808,634 826,925
Property, plant and equipment, net 349,650 335,528Investments and other assets, net 168,210 131,877Trademarks 449,085 449,085Goodwill 176,584 176,584Other intangible assets, net 114,983 124,827
Total assets $ 2,067,146 $ 2,044,826
LIABILITIES AND SHAREHOLDERS’ EQUITY
Current liabilities:Current portion of long-term debt of subsidiaries $ 20,169 $ 17,607Accounts payable 264,292 295,572Accrued liabilities 127,466 158,746
Total current liabilities 411,927 471,925
Long-term debt of parent company 468,214 473,406Long-term debt of subsidiaries 145,759 165,056Accrued pension and other employee benefits 73,797 65,812Deferred gain – sale of shipping fleet 48,684 63,246Deferred tax liabilities 115,825 105,094Other liabilities 62,952 39,984
Total liabilities 1,327,158 1,384,523
Commitments and contingencies
Shareholders’ equity:Common stock, $.01 par value
(45,298,038 and 44,817,833shares outstanding, respectively) 453 448
Capital surplus 815,010 809,984Accumulated deficit (75,915) (133,270)Accumulated other comprehensive income (loss) 440 (16,859)
Total shareholders’ equity 739,988 660,303
Total liabilities and shareholders’ equity $ 2,067,146 $ 2,044,826
See Notes to Consolidated Financial Statements.

Chiquita Brands International, Inc. — 2010 Annual Report25
Chiquita Brands International, Inc.CONSOLIDATED STATEMENTS OF SHAREHOLDERS’ EQUITY
(Accum. Totaldeficit) AOCI of AOCI of share-
Common Common Capital retained continuing discontinued holders’(In thousands) shares stock surplus earnings operations operations equity
DECEMBER 31, 2007 42,740 $ 427 $ 695,647 $ 104,934 $ 45,285 $ 49,180 $ 895,473
Net loss - - - (328,695) - - (328,695)Unrealized translation (loss) gain - - - - (966) 8,524 7,558Change in fair value of
available-for-sale investment - - - - (3,316) - (3,316)Change in fair value of derivatives - - - - (69,974) - (69,974)Gains reclassified from OCI into
net income - - - - (20,001) - (20,001)Pension liability adjustment - - - - (1,089) 498 (591)Realization of gains into net income
from OCI resulting from the saleof Atlanta AG - - - - - (58,202) (58,202)
Comprehensive loss (473,221)
Issuance of Convertible Notes, net - - 81,694 - - - 81,694Exercises of stock options and
warrants 1,220 12 12,400 - - - 12,412Stock-based compensation 447 5 11,327 - - - 11,332Shares withheld for taxes - - (3,289) - - - (3,289)
DECEMBER 31, 2008 44,407 $ 444 $ 797,779 $ (223,761) $ (50,061) $ - $ 524,401
Net income - - - 90,491 - - 90,491Unrealized translation loss - - - - (632) - (632)Change in fair value of
available-for-sale investment - - - - (165) - (165)Change in fair value of derivatives - - - - 59,831 - 59,831Gains reclassified from OCI into
net income - - - - (8,421) - (8,421)Pension liability adjustment - - - - (6,371) - (6,371)Realization of cumulative translation
adjustments into net income fromOCI resulting from the sale ofoperations in the Ivory Coast - - - - (11,040) - (11,040)
Comprehensive income 123,693
Exercises of warrants - - 4 - - - 4Stock-based compensation 411 4 14,264 - - - 14,268Shares withheld for taxes - - (2,063) - - - (2,063)
DECEMBER 31, 2009 44,818 $ 448 $ 809,984 $ (133,270) $ (16,859) $ - $ 660,303
See Notes to Consolidated Financial Statements.

26Chiquita Brands International, Inc. — 2010 Annual Report
Chiquita Brands International, Inc.CONSOLIDATED STATEMENTS OF SHAREHOLDERS’ EQUITY (continued)
(Accum. Totaldeficit) AOCI of AOCI of share-
Common Common Capital retained continuing discontinued holders’(In thousands) shares stock surplus earnings operations operations equity
DECEMBER 31, 2009 44,818 $ 448 $ 809,984 $ (133,270) $ (16,859) $ - $ 660,303
Net income - - - 57,355 - - 57,355Unrealized translation gain - - - - 87 - 87Change in fair value of
available-for-sale investment - - - - (126) - (126)Change in fair value of derivatives - - - - 28,709 - 28,709Gains reclassified from OCI into
net income - - - - (5,805) - (5,805)Pension liability adjustment - - - - (5,566) - (5,566)
Comprehensive income 74,654
Modification of LTIP awards - - (6,363) - - - (6,363)Stock-based compensation 480 5 14,028 - - - 14,033Shares withheld for taxes - - (2,639) - - - (2,639)
DECEMBER 31, 2010 45,298 $ 453 $ 815,010 $ (75,915) $ 440 $ - $ 739,988
See Notes to Consolidated Financial Statements.
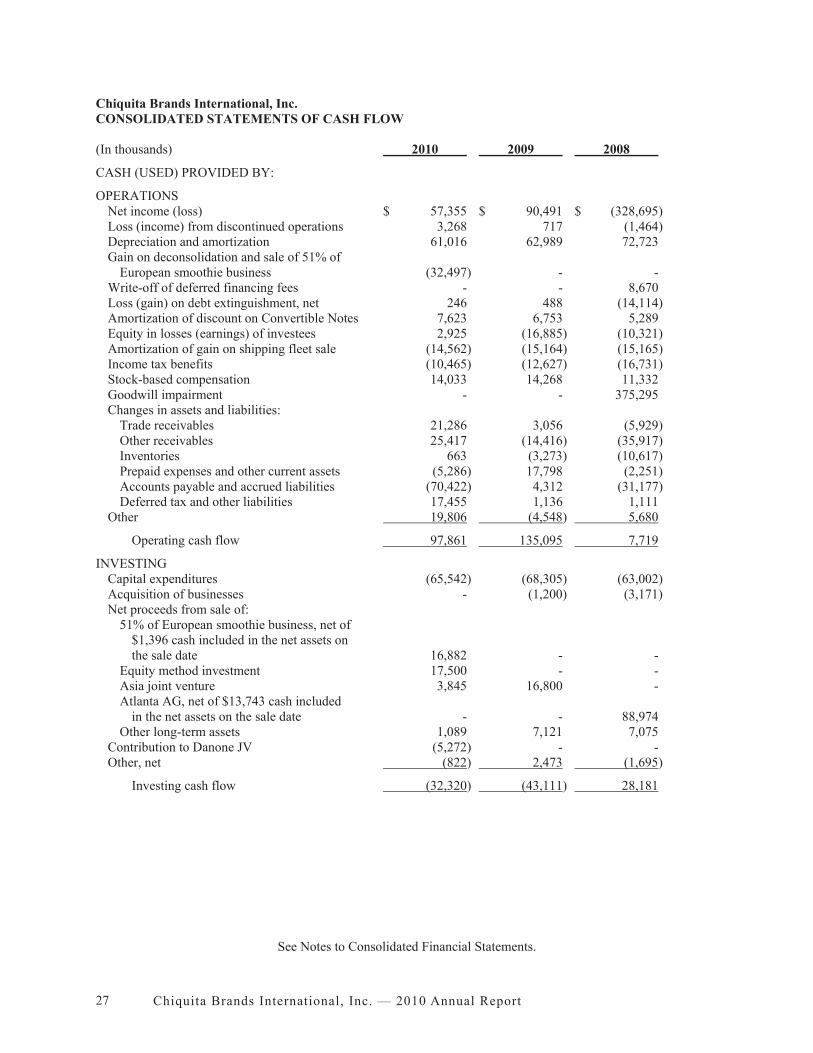
Chiquita Brands International, Inc. — 2010 Annual Report27
Chiquita Brands International, Inc.CONSOLIDATED STATEMENTS OF CASH FLOW
(In thousands) 2010 2009 2008
CASH (USED) PROVIDED BY:
OPERATIONSNet income (loss) $ 57,355 $ 90,491 $ (328,695)Loss (income) from discontinued operations 3,268 717 (1,464)Depreciation and amortization 61,016 62,989 72,723Gain on deconsolidation and sale of 51% of
European smoothie business (32,497) - -Write-off of deferred financing fees - - 8,670Loss (gain) on debt extinguishment, net 246 488 (14,114)Amortization of discount on Convertible Notes 7,623 6,753 5,289Equity in losses (earnings) of investees 2,925 (16,885) (10,321)Amortization of gain on shipping fleet sale (14,562) (15,164) (15,165)Income tax benefits (10,465) (12,627) (16,731)Stock-based compensation 14,033 14,268 11,332Goodwill impairment - - 375,295Changes in assets and liabilities:
Trade receivables 21,286 3,056 (5,929)Other receivables 25,417 (14,416) (35,917)Inventories 663 (3,273) (10,617)Prepaid expenses and other current assets (5,286) 17,798 (2,251)Accounts payable and accrued liabilities (70,422) 4,312 (31,177)Deferred tax and other liabilities 17,455 1,136 1,111
Other 19,806 (4,548) 5,680
Operating cash flow 97,861 135,095 7,719
INVESTINGCapital expenditures (65,542) (68,305) (63,002)Acquisition of businesses - (1,200) (3,171)Net proceeds from sale of:
51% of European smoothie business, net of$1,396 cash included in the net assets onthe sale date 16,882 - -
Equity method investment 17,500 - -Asia joint venture 3,845 16,800 -Atlanta AG, net of $13,743 cash included
in the net assets on the sale date - - 88,974Other long-term assets 1,089 7,121 7,075
Contribution to Danone JV (5,272) - -Other, net (822) 2,473 (1,695)
Investing cash flow (32,320) (43,111) 28,181
See Notes to Consolidated Financial Statements.

28Chiquita Brands International, Inc. — 2010 Annual Report
Chiquita Brands International, Inc.CONSOLIDATED STATEMENTS OF CASH FLOW (continued)
(In thousands) 2010 2009 2008
FINANCINGIssuances of long-term debt - - 400,000Repurchases and repayments of long-term debt (30,429) (47,764) (409,282)Fees and other issuance costs for long-term debt - (122) (19,508)Borrowings under the revolving credit facility - 38,000 57,000Repayments of revolving credit facility
and other debt - (38,000) (57,719)Proceeds from exercise of stock options/warrants - 4 12,412
Financing cash flow (30,429) (47,882) (17,097)
Cash flow from continuing operations 35,112 44,102 18,803
DISCONTINUED OPERATIONSOperating cash flow, net - - 13,645Investing cash flow, net - - (513)Financing cash flow, net - - (2,772)
Cash flow from discontinued operations - - 10,360
Increase in cash and equivalents 35,112 44,102 29,163Less: Intercompany change in cash and
equivalents of discontinued operations - - (13,160)
Increase in cash and equivalentsof continuing operations 35,112 44,102 16,003
Cash and equivalents, beginning of period 121,369 77,267 61,264
Cash and equivalents, end of period $ 156,481 $ 121,369 $ 77,267
See Notes to Consolidated Financial Statements.

Chiquita Brands International, Inc. — 2010 Annual Report29
Chiquita Brands International, Inc.NOTES TO CONSOLIDATED FINANCIAL STATEMENTS
Note 1 - Summary of Significant Accounting Policies
CONSOLIDATIONThe Consolidated Financial Statements include the accounts of Chiquita Brands International, Inc. (“CBII”),
controlled majority-owned subsidiaries and any entities that are not majority-owned but require consolidation as avariable interest entity (collectively, “Chiquita” or the company). Intercompany balances and transactions havebeen eliminated.
USE OF ESTIMATESThe consolidated financial statements have been prepared in conformity with accounting principles generally
accepted in the United States (“U.S. GAAP”), which require management to make estimates and assumptions thataffect the amounts and disclosures reported in the consolidated financial statements and accompanying notes.Significant estimates are inherent in the preparation of the accompanying consolidated financial statements.Significant estimates are made in determining allowance for doubtful accounts for grower and trade receivables,sales incentives, reviews of carrying values of long-lived assets, fair values assigned to assets and liabilities inconnection with business combinations, goodwill and intangible asset valuations, pension and severance plans,income taxes, contingencies, and fair value assessments. Actual results could differ from these estimates.
CASH AND EQUIVALENTSCash and equivalents include cash and highly liquid investments with a maturity of three months or less at the
time of purchase. At December 31, 2010, the company had €11 million ($15 million) of cash equivalents in acompensating balance arrangement relating to an uncommitted credit line for bank guarantees used primarily forimport licenses and duties in European Union countries.
TRADE RECEIVABLESTrade receivables less allowances reflect the net realizable value of the receivables, and approximate fair value.
The company generally does not require collateral or other security to support trade receivables subject to creditrisk. To reduce credit risk, the company performs credit investigations prior to establishing customer credit limitsand reviews customer credit profiles on an ongoing basis. Allowances against the trade receivables are establishedbased on the company’s knowledge of customers’ financial condition, historical loss experience and accountpayment status compared to invoice payment terms. Allowances are recorded and charged to expense when anaccount is deemed to be uncollectible. Recoveries of trade receivables previously reserved in the allowance arecredited to income.
FINANCE RECEIVABLESThe company includes finance receivables in the Consolidated Balance Sheets net of allowances, with current
portions included in “Other receivables, net” and long-term portions included in “Investments and other assets, net.”The largest components of finance receivables are seasonal grower advances and seller financing from prior sales ofcertain subsidiaries. Seasonal grower advances made to qualified growers of other produce are non-interest bearing,usually short-term in nature and are generally collected as the other produce is harvested and sold. The companygenerally requires property liens and pledges of the season’s produce as collateral to support the advances. If salesof the season’s produce do not result in full repayment of the advance, the company may exercise the collateralprovisions or renegotiate terms, including interest, to collect the remaining balance. Terms of seller financing aretypically based on the earnings power of the business that was sold.
Allowances are established when the company determines it is probable that the grower will be unable to repaythe advance based on the company’s knowledge of the grower’s financial condition and the company’s historicalloss experience. Allowances are measured for each individual finance receivable using quantitative and qualitativefactors, considering the value of any collateral securing the seller financing or grower advance. Interest receivableon overdue or renegotiated seller financing or grower advances is placed into nonaccrual status when collectibilitybecomes uncertain. Collectibility is assessed at the end of each reporting period and write-offs are recorded onlywhen collection efforts have been abandoned. Recoveries of other receivables previously reserved in the allowanceare credited to income.

30Chiquita Brands International, Inc. — 2010 Annual Report
INVENTORIESInventories are valued at the lower of cost or market. Cost for banana growing crops and certain banana
inventories is determined on the “last-in, first-out” (LIFO) basis. Cost for other inventory categories, includingother fresh produce and value-added salads, is determined on the “first-in, first-out” (FIFO) or average cost basis.Banana and other fresh produce inventories represent costs associated with boxed bananas and other fresh producenot yet sold. Growing crop inventories primarily represent the costs associated with growing banana plants oncompany-owned farms or growing lettuce on third-party farms where the company bears substantially all of thegrowing risk. Materials and supplies primarily represent growing and packaging supplies maintained on company-owned farms. Inventory costs are comprised of the purchase cost of materials and, in addition, for bananas andother fresh produce grown on company-owned farms, production labor and overhead.
INVESTMENTSInvestments representing non-controlling interests are accounted for by the equity method when Chiquita has
the ability to exercise significant influence over the investees’ operations. Investments that the company does nothave the ability to significantly influence are valued at cost. Publicly traded investments that the company does nothave the ability to significantly influence are accounted for as available-for-sale securities at fair value. Unrealizedholding gains or losses on available-for-sale securities are excluded from operating results and are recognized inshareholders’ equity (accumulated other comprehensive income) until realized. The company assesses any declinesin the fair value of individual investments to determine whether such declines are other-than-temporary and whetherthe investments are impaired.
PROPERTY, PLANT AND EQUIPMENTProperty, plant and equipment are stated at cost, and except for land, are depreciated on a straight-line basis
over their estimated remaining useful lives. The company generally uses 30 years for cultivations, 10 to 40 years forbuildings and improvements, and 3 to 15 years for machinery and equipment. Cultivations represent the costs toplant and care for banana plants until such time that the root system can support commercial quantities of fruit, aswell as the costs to build levees, drainage canals and other farm infrastructure to support the banana plants. Whenassets are retired or otherwise disposed of, the costs and related accumulated depreciation are removed from theaccounts. The difference between the net book value of the asset and the proceeds from disposition is recognized asa gain or loss. Routine maintenance and repairs are charged to expense as incurred, while costs of betterments andrenewals are capitalized. The company reviews the carrying value of its property, plant and equipment whenimpairment indicators are noted. No material impairment charges were recorded during 2010 or 2009. Thegoodwill impairment charge recorded in 2008 (see below) was an impairment indicator for the property, plant andequipment at Fresh Express; however, no impairment resulted from testing these assets. Also in 2008, the companyrecorded a $3 million impairment charge related to the closure of a ripening facility in the United Kingdom.
GOODWILL, TRADEMARKS AND INTANGIBLE ASSETSImpairment reviews are highly judgmental and involve the use of significant estimates and assumptions, which
determine whether there is potential impairment and the amount of any impairment charge recorded. Fair valueassessments involve estimates of discounted cash flows that are dependent upon discount rates and long-termassumptions regarding future sales and margin trends, market conditions and cash flow. Actual results may differfrom these estimates. Fair value measurements used in the impairment reviews of goodwill and intangible assets areLevel 3 measurements, as described in Note 12. See further information about the company’s policy for fair valuemeasurements below under “Fair Value Measurements” and in Note 12.
Goodwill. Goodwill is reviewed for impairment each fourth quarter, or more frequently if circumstancesindicate the possibility of impairment. Goodwill primarily relates to the company’s salad operations, Fresh Express.The 2010 and 2009 reviews did not indicate impairment and the company had substantial margin in both periods;however, as a result of the 2008 review, the company recorded a $375 million ($374 million after-tax) goodwillimpairment charge in the fourth quarter of 2008. During the second half of 2008 and particularly in the fourthquarter, Fresh Express’ performance was below prior periods and management expectations, and when combinedwith slower growth expectations, negative category volume trends and a decline in market values resulting fromweakness in the general economy and the financial markets, led to the 2008 goodwill impairment charge. Theseimpairment indicators coincided with the company’s annual impairment testing in the fourth quarter of 2008.

Chiquita Brands International, Inc. — 2010 Annual Report31
The first step of the impairment review compares the fair value of the reporting unit, Fresh Express, to thecarrying value. Consistent with prior impairment reviews, the company estimated the fair value of the reporting unitusing a combination of a market approach based on multiples of revenue and earnings before interest, taxes,depreciation and amortization (“EBITDA”) from recent comparable transactions and an income approach based onexpected future cash flows discounted at 9.6%, 9.4% and 9.5% in 2010, 2009 and 2008, respectively. The marketapproach and the income approach were weighted equally based on judgment of the comparability of the recenttransactions and the risks inherent in estimating future cash flows in a difficult economic environment. Managementconsidered recent economic and industry trends in estimating Fresh Express’ expected future cash flows in theincome approach. In 2010 and 2009, the first step did not indicate impairment because the estimated fair value ofFresh Express was substantially greater than its carrying value; therefore, the second step was not required;reasonably possible fluctuations in the discount rate, cash flows or market multiples did not indicate impairment. In2008, however, the first step indicated potential impairment, so the company performed the second step of theimpairment review, which calculated the implied value of goodwill by subtracting the fair value of Fresh Express’assets and liabilities, including intangible assets, from the previously estimated fair value of Fresh Express as awhole. Impairment was measured as the difference between the implied value and the carrying value of goodwill.In the 2008 impairment review, an increase in the discount rate of 0.5% would have increased the impairmentcharge by approximately $20 million and a 5.0% per year decrease in the expected future cash flows would haveincreased the impairment charge by $15 million.
Trademarks. Trademarks are indefinite-lived intangible assets that are not amortized and are also reviewedeach fourth quarter or more frequently if circumstances indicate the possibility of impairment. The review comparesthe estimated fair values of the trademarks to the carrying values. The 2010, 2009 and 2008 reviews did not indicateimpairment because the estimated fair values were greater than the carrying values. Consistent with prior reviews,the company estimated the fair values of the trademarks using the relief-from-royalty method. The relief-from-royalty method estimates the royalty expense that could be avoided in the operating business as a result of owningthe respective trademarks. The royalty savings are measured by applying a royalty rate to projected sales, tax-effected and then converted to present value with a discount rate that considers the risk associated with owning thetrademarks. In the 2010 review, the company assumed a 3.0% royalty rate and an 11.1% discount rate for bothChiquita and Fresh Express trademarks. In the 2009 review, the company assumed a 3.0% royalty rate and a 13.0%discount rate for both Chiquita and Fresh Express trademarks. In the 2008 review, the company assumed a 3.0%royalty rate for Chiquita trademarks, a 1.0% royalty rate for Fresh Express trademarks and a 12.0% discount rate forboth Chiquita and Fresh Express trademarks. In 2009, the company changed the royalty rate assumed for the FreshExpress trademarks to more closely align it with market data for similar royalty agreements. The fair value estimateis most sensitive to the royalty rate but reasonably possible fluctuations in the royalty rates for both the Chiquita andFresh Express trademarks also did not indicate impairment. The fair value estimate is less sensitive to the discountrate and reasonably possible changes to the discount rate would not indicate impairment for either trademark.
Other Intangible Assets. The company’s intangible assets with definite lives consist of customer relationshipsand patented technology related to Fresh Express. These assets are amortized on a straight-line basis (whichapproximates the attrition method) over their estimated remaining lives. The weighted average remaining lives ofthe Fresh Express customer relationships and patented technology are 13 years and 11 years, respectively. Asamortizable intangible assets, the company reviews the carrying value only when impairment indicators are present,by comparing (i) estimates of undiscounted future cash flows, before interest charges, included in the company’soperating plans versus (ii) the carrying values of the related assets. Tests are performed over asset groups at thelowest level of identifiable cash flows. No impairment indicators existed in 2010 or 2009. The goodwillimpairment charge recorded in the fourth quarter of 2008 was an impairment indicator; however, no impairmentresulted from testing these assets.
REVENUE RECOGNITIONThe company records revenue when persuasive evidence of an arrangement exists, delivery has occurred or
services have been rendered, the price to the customer is fixed or determinable, and collectibility is reasonablyassured. This generally occurs when the product is delivered to, and title to the product passes to, the customer.

32Chiquita Brands International, Inc. — 2010 Annual Report
SALES INCENTIVESThe company, primarily in its Salads and Healthy Snacks segment, offers sales incentives to its customers and
to consumers. These incentives primarily consist of volume-related rebates, exclusivity and placement fees (feespaid to retailers for product display), consumer coupons and promotional discounts. Consideration given tocustomers and consumers related to sales incentives is recorded as a reduction of sales. Changes in the estimatedamount of incentives to be paid are treated as changes in estimates and are recognized in the period of change.
ADVERTISING AND PROMOTION EXPENSEAdvertising and promotion expense are included in “Selling, general and administrative” and was $58 million,
$62 million and $63 million, which includes $3 million, $17 million and $23 million related to the Europeansmoothie business for the years ended December 31, 2010, 2009 and 2008, respectively. Television advertisingcosts related to production are expensed the first time an ad airs in each market and the cost of advertising time isexpensed over the advertising period. Other types of advertising and promotion are expensed over the advertising orpromotion period.
SHIPPING AND HANDLING FEES AND COSTSShipping and handling fees billed to customers are included in net sales. Shipping and handling costs are
recorded in cost of sales.
VALUE ADDED TAXESValue added taxes (“VAT”) that are collected from customers and remitted to taxing authorities in applicable
jurisdictions are excluded from sales and cost of sales. Receivables result from filing for refunds of VAT paid tovarious governments. As of December 31, 2010 and 2009, the company had $39 million and $60 million,respectively, of VAT receivables classified in “Other receivables,” and $6 million and $1 million, respectively,classified in “Investments and other assets, net.”
LEASESThe company’s leases of land and other operating assets are evaluated at inception or at any subsequent material
modification and, depending on the lease terms, are classified as either capital leases or operating leases, asappropriate. For operating leases that contain built-in pre-determined rent escalations, rent holidays or rentconcessions, rent expense is recognized on a straight-line basis over the life of the lease.
STOCK-BASED COMPENSATIONThe company’s share-based awards primarily consist of restricted stock units and generally vest over four years.
Prior to vesting, shares are not issued and grantees are not eligible to vote or receive dividends on the restrictedstock units. The fair value of the awards is determined at the grant date and expensed over the period from the grantdate to the date the employee is no longer required to provide service to earn the award, which could be immediatelyin the case of retirement-eligible employees.
The company has established a Long-Term Incentive Program (“LTIP”) for certain executive level employees.Awards are intended to be performance-based compensation as defined in Section 162(m) of the Internal RevenueCode. The program allows for awards to be issued at the end of each three-year performance period. One-half ofeach LTIP award is based on the company’s achievement of cumulative earnings per share targets (“EPS awards”),and the other half is based on the company’s achievement of total shareholder return relative to peer companies(“TSR awards”). The value of TSR awards is based on a Monte Carlo simulation at the measurement date.
In 2010, the LTIP award programs were modified to allow a portion of the awards to be paid in cash based onthe value of the shares at issuance, which caused the equity-classified awards to become liability-classified awards.Both equity-classified awards and liability-classified awards recognize compensation expense over the vestingperiod, but the value of equity-classified awards is measured only as of the grant date, whereas the value of theliability-classified awards is measured at each reporting date with cumulative adjustments for changes in valuerecognized currently. For modified awards, the expense is measured as the greater of that which would berecognized under the equity classification or the liability classification. At December 31, 2010, the expense for allof the LTIP awards was measured under the equity classification, as the original equity value of the awards is higherthan the current value. The value of EPS awards is based on the share price at the measurement date and an estimateof the expected number of shares to be issued.

Chiquita Brands International, Inc. — 2010 Annual Report33
CONTINGENT LIABILITIESOn a quarterly basis, the company reviews the status of each claim and legal proceeding and assesses the
potential financial exposure. This is coordinated with information obtained from external and internal counsel. Ifthe potential loss from any claim or legal proceeding is probable and the amount can be reasonably estimated, thecompany accrues a liability for the estimated loss. To the extent the amount of a probable loss is estimable only byreference to a range of equally likely outcomes, and no amount within the range appears to be a better estimate thanany other amount, the company accrues the low end of the range. Management makes judgments related to accrualsbased on the best information available to it at the time, which may be based on estimates and assumptions,including those that depend on external factors beyond the company’s control. As additional information becomesavailable, the company reassesses the potential liabilities related to pending claims and litigation, and may reviseestimates. Legal costs are expensed as incurred.
INCOME TAXESThe company is subject to income taxes in both the United States and numerous foreign jurisdictions. Income
taxes are provided for using the asset and liability method. Deferred income taxes are recognized at currentlyenacted tax rates for the expected future tax consequences attributable to temporary differences between amountsreported for income tax purposes and financial reporting purposes. Deferred taxes are not provided for theundistributed earnings of subsidiaries operating outside the U.S. that have been permanently reinvested in foreignoperations. The company records a valuation allowance to reduce deferred tax assets to the amount “more likelythan not” to be realized. The determination as to whether a deferred tax asset will be realized is made on a tax filerand jurisdictional basis and is based on the evaluation of positive and negative evidence. This evidence includeshistorical taxable income, projected future taxable income, the expected timing of the reversal of existing temporarydifferences and the implementation of tax planning strategies. The expected timing of the reversals of existingtemporary differences is based on current tax law and the company’s tax methods of accounting.
In the ordinary course of business, there are many transactions and calculations where the ultimate income taxdetermination is uncertain. The evaluation of a tax position is a two-step process. The first step is to evaluate theuncertain tax position for recognition by determining if the weight of available evidence indicates that it is “more-likely-than-not” that a tax position, including resolution of any related appeals or litigation, will be sustained uponexamination based on its technical merits. If the recognition criterion is met, the second step is to measure theincome tax benefit to be realized. Tax positions or portions of tax positions that do not meet these criteria are de-recognized by recording reserves. The company establishes reserves for income tax-related uncertainties based onestimates of whether, and the extent to which, additional taxes, penalties and interest could be due. Provisions forand changes to these reserves, as well as the related net interest and penalties, are included in “Income tax benefit”in the Consolidated Statements of Income. Significant judgment is required in evaluating tax positions anddetermining the company’s provision for income taxes. The company regularly reviews its tax positions, and thereserves are adjusted in light of changing facts and circumstances, such as the resolution of outstanding tax audits orcontingencies in various jurisdictions and the expiration of statutes of limitations.
EARNINGS PER SHAREBasic earnings per share is calculated on the basis of the weighted average number of common shares
outstanding during the year. Diluted earnings per share is calculated on the basis of the sum of the weighted averagenumber of common shares outstanding during the year and the dilutive effect of the assumed conversion to commonstock of the 4.25% convertible senior notes and the exercise or vesting of options and other stock awards using thetreasury stock method. The assumed conversion to common stock of securities that would, on an individual basis,have an anti-dilutive effect on diluted earnings per share is not included in the diluted earnings per sharecomputation.
CURRENCY TRANSLATION ADJUSTMENTChiquita primarily uses the U.S. dollar as its functional currency; however, prior to the sales of Atlanta AG in
2008 and the company’s operations in the Ivory Coast in 2009 (see Note 3), the euro was the functional currency forthese operations. Certain smaller subsidiaries also have functional currencies other than the U.S. dollar.

34Chiquita Brands International, Inc. — 2010 Annual Report
HEDGINGThe company is exposed to currency exchange risk, most significantly from the value of the euro and its effect
on the amount of net euro cash flow from the conversion of euro-denominated sales into U.S. dollars. The companyis also exposed to price risk on purchases of bunker fuel used in its ocean shipping operations. The company mayreduce these risks by purchasing derivatives, such as options and forward contracts. When purchasing derivatives,the company identifies a “forecasted hedged transaction,” which is a specific future transaction (e.g., the purchase offuel or exchange of currency in a specific future period), and designates the risk associated with the forecastedhedged transaction that the derivative will mitigate. The fair value of all derivatives is recognized in theConsolidated Balance Sheets. Gains and losses from changes in fair value of derivatives are recognized in netincome in the current period if a derivative does not qualify for, or is not designated for, hedge accounting.
Most of the company’s derivatives qualify for hedge accounting as cash flow hedges. The company formallydocuments all relationships between derivatives and the forecasted hedged transactions, including the company’srisk management objective and strategy for undertaking various hedge transactions. To the extent that a derivative iseffective in offsetting the designated risk exposure of the forecasted hedged transaction, gains and losses aredeferred in accumulated other comprehensive income (“AOCI”) in the Consolidated Balance Sheets until therespective forecasted hedged transaction occurs, at which point any gain or loss is recognized in net income. Gainsor losses on effective hedges that have been terminated prior to maturity are also deferred in AOCI until theforecasted hedged transactions occur. For the ineffective portion of the hedge, gains or losses are reflected in netincome in the current period. Ineffectiveness is caused by an imperfect correlation of the change in fair value of thederivative and the risk that is hedged.
The earnings effect of the derivatives is recorded in “Net sales” for currency hedges, and in “Cost of sales” forfuel hedges. The company does not hold or issue derivative financial instruments for speculative purposes. SeeNote 11 for additional description of the company’s hedging activities.
FAIR VALUE MEASUREMENTSEffective January 1, 2008, the company adopted new accounting standards for fair value measurements of
financial assets and financial liabilities. Effective January 1, 2009, the company adopted these standards fornonfinancial assets and nonfinancial liabilities. Fair value measurements of nonfinancial assets and nonfinancialliabilities are primarily used in goodwill and other intangible asset impairment reviews and in the valuation of assetsheld for sale. Fair value standards provide a framework for measuring fair value, which prioritizes the use ofobservable inputs in measuring fair value. Fair value is the price to hypothetically sell an asset or transfer a liabilityin an orderly manner in the principal market for that asset or liability. The standards address valuation techniquesused to measure fair value including the market approach, the income approach and the cost approach. The marketapproach uses prices or relevant information generated by market transactions involving identical or comparableassets or liabilities. The income approach involves converting future cash flows to a single present value, with thefair value measurement based on current market expectations about those future cash flows. The cost approach isbased on the amount that currently would be required to replace the service capacity of the asset.
See further information related to fair value measurements above under “Goodwill, Trademarks and IntangibleAssets” and in Notes 12 and 14.
PENSION AND TROPICAL SEVERANCE PLANSThe company records the underfunded status of the defined benefit postretirement plan and tropical severance
plans as a liability on the Consolidated Balance Sheets, recognizes changes in the funded status in AOCI in the yearin which the changes occur, and measures the plan assets and obligations that determine the funded status as of theend of the fiscal year. Significant assumptions used in the actuarial calculation of the liabilities and expense relatedto the company’s defined benefit and foreign pension and severance plans include the discount rate, long-term rateof compensation increase, and the long-term rate of return on plan assets. For domestic plans, the company uses adiscount rate based on a yield curve which uses the plans’ expected payouts combined with a large population ofhigh quality, fixed income investments in the U.S. that are appropriate for the expected timing of the plans’payments. For foreign plans, the company uses a discount rate based on the 10-year U.S. Treasury rate adjusted toreflect local inflation rates in those countries.

Chiquita Brands International, Inc. — 2010 Annual Report35
NEW ACCOUNTING STANDARDSNew accounting standards that could significantly affect the company’s Consolidated Financial Statements are
summarized as follows:
IssueDate Description
Effective Datefor Chiquita
Effect on Chiquita’sConsolidated Financial
StatementsDecember2010
Clarifies and expands disclosure requirements forsupplemental pro forma information of businesscombinations.
Prospectively,for acquisitionsoccurring afterDecember 31,2010.
Will expand disclosure if anacquisition occurs.
July 2010 Expanded disclosures about financing receivables. Prospectively,beginningDecember 31,2010.
See Notes 1 and 4.
January2010
Clarified accounting requirements for thedeconsolidation of a subsidiary or a group ofassets and expanded the related disclosure.Deconsolidation occurs when the parent ceases tohave a controlling interest and any resulting gainor loss is calculated as the fair value of theconsideration received plus the fair value of anyretained interest less the carrying value.
Retrospectively,beginningJanuary 1,2010.
See Note 3 concerning sale of51% and deconsolidation ofthe European smoothiebusiness, and associated gain.
January2010
Expanded disclosures for fair valuemeasurements.
Prospectively,beginningJanuary 1,2010.
See Notes 11 and 12.
January2010
Expands disclosures for Level 3 fair valuemeasurements to include purchases, sales,issuances and settlements.
Prospectively,beginningJanuary 1,2011.
Will expand disclosure.
June 2009 Amended the evaluation criteria to identify theprimary beneficiary of a variable interest entityand required ongoing reassessments of whetherthe company is the primary beneficiary.
Prospectively,beginningJanuary 1,2010.
See Note 3.

36Chiquita Brands International, Inc. — 2010 Annual Report
Note 2 - Earnings Per Share
Basic and diluted earnings per common share (“EPS”) are calculated as follows:
(In thousands, except per share amounts) 2010 2009 2008
Income (loss) from continuing operations $ 60,623 $ 91,208 $ (330,159)(Loss) income from discontinued operations (3,268) (717) 1,464
Net income (loss) $ 57,355 $ 90,491 $ (328,695)
Weighted average common shares outstanding(used to calculate basic EPS) 45,003 44,607 43,745
Stock options and other stock awards 847 641 -
Weighted average common shares outstanding(used to calculate diluted EPS) 45,850 45,248 43,745
Earnings (loss) per common share – basic:Continuing operations $ 1.34 $ 2.05 $ (7.54)Discontinued operations (0.07) (0.02) 0.03
$ 1.27 $ 2.03 $ (7.51)
Earnings (loss) per common share – diluted:Continuing operations $ 1.32 $ 2.02 $ (7.54)Discontinued operations (0.07) (0.02) 0.03
$ 1.25 $ 2.00 $ (7.51)
The assumed conversions to common stock of the company’s warrants, stock options, other stock awards and4.25% Convertible Senior Notes due 2016 (“Convertible Notes”) are excluded from the diluted EPS computationsfor periods in which these items, on an individual basis, have an anti-dilutive effect on diluted EPS. In 2010, 2009and 2008, the effect of the conversion of the Convertible Notes would have been anti-dilutive because the averagetrading price of the common stock was below the initial conversion price of $22.45 per share. For 2008, the sharesused to calculate diluted EPS would have been 44.8 million if the company had generated net income during theyear.
Note 3 – Deconsolidation, Divestitures and Discontinued Operations
DANONE CHIQUITA FRUITS JOINT VENTUREIn May 2010, the company sold 51% of its European smoothie business to Danone S.A., for €15 million ($18
million) and deconsolidated it. The deconsolidation and sale resulted in the creation of Danone Chiquita Fruits SAS(“Danone JV”), which is a joint venture intended to develop, manufacture, and sell packaged fruit juices and fruitsmoothies in Europe and is financed by Chiquita and Danone in amounts proportional to their ownership interests.The gain on the deconsolidation and sale of the European smoothie business was $32 million, which includes a gainof $15 million related to the remeasurement of the retained investment to its fair value of $16 million on the closingdate. No income tax expense resulted from the gain on the sale of 51% of the European smoothie business becausesufficient foreign NOLs were in place and, when those foreign NOLs were used, the related valuation allowance wasalso released. The fair value of the investment was a Level 3 measurement (see Note 12) based upon theconsideration paid by Danone for 51% of the Danone JV, including a control discount. The company’s 49%investment in the joint venture is accounted for as an equity method investment and is included in the Salads andHealthy Snacks segment. Future company contributions to the Danone JV are limited to an aggregate €22 million($27 million) through 2013 without unanimous consent of the owners. The company contributed a total of €4million ($5 million) during 2010, and the company’s carrying value of the Danone JV was $18 million as ofDecember 31, 2010.

Chiquita Brands International, Inc. — 2010 Annual Report37
The Danone JV is a variable interest entity; however, the company is not the primary beneficiary, and does notconsolidate it. The Danone JV will obtain sales, local marketing, and product supply chain management servicesfrom the company’s subsidiaries; however, the power to direct the JV’s most significant activities is controlled byDanone S.A.
SALE OF INVESTMENT IN COAST CITRUS DISTRIBUTORSIn April 2010, the company sold its 49% investment in Coast Citrus Distributors, Inc. for $18 million in cash,
which approximated its carrying value. Prior to the sale, the company accounted for this investment using the equitymethod.
SALE OF INTEREST IN ASIA JOINT VENTUREThe company previously operated in Asia primarily through the Chiquita-Unifrutti joint venture (“Asia JV”),
which was engaged in the distribution of fresh bananas and pineapples from the Philippines to Japan, Korea and theMiddle East and was accounted for using the equity method. In August 2009, the company sold its 50% interest inthe Asia JV to its former joint venture partner. In connection with the sale, the company entered into new long-termagreements with the former joint venture partner for (a) shipping and supply of bananas sold in the Middle East and(b) licensing the Chiquita brand for sales of whole fresh bananas and pineapples in Japan and Korea.
The sale proceeds included $4 million of cash, a $58 million note that is receivable in installments over 10years, and certain contingent consideration, of which $1 million was received in 2010. Additional contingentconsideration that would result in further gain will be recorded if and when realized. At December 31, 2010 and2009, the current portion of the note receivable included in “Other receivables, net” was $3 million and $3 million,respectively, and the long-term portion included in “Investments and other assets, net” was $34 million and $37million, respectively, on the Consolidated Balance Sheets.
SALE OF IVORY COAST OPERATIONSIn January 2009, the company sold its operations in the Ivory Coast. The sale resulted in a pre-tax gain of
approximately $4 million included in “Cost of sales,” including realization of $11 million of cumulative translationgains. Income tax benefits of approximately $4 million were recognized in the first quarter of 2009 related to theseoperations.
SALE OF ATLANTA AG – DISCONTINUED OPERATIONSIn August 2008, the company sold 100% of the outstanding stock of its subsidiary, Atlanta AG (“Atlanta”), and
certain related real property assets to UNIVEG Fruit & Vegetable for aggregate consideration of (i) €65 million incash ($97 million), including working capital and net debt adjustments, and (ii) contingent consideration to bedetermined based on future performance criteria. Of the total consideration, approximately €6 million ($7 million)was collected in February 2010 related to consideration from the sale which had been held in escrow to secure anypotential obligations of the company under the sale agreement. In 2008, the company recognized a net gain on thesale of Atlanta of less than $1 million, which is included in “(Loss) income from discontinued operations, net of tax”in the Consolidated Statements of Income and a $2 million income tax benefit to continuing operations from thereversal of certain valuation allowances. The net cash proceeds from the transaction were used primarily to reducedebt as described in Note 10. In 2010 and 2009, the company recorded $3 million and $1 million of expense,respectively, based on new information about potential indemnity obligations of the company under the saleagreement; these amounts are included in “(Loss) income from discontinued operations, net of tax” in theConsolidated Income Statements.
Concurrent with the sale, the parties entered into a long-term agreement under which Atlanta continues to serveas the company’s preferred supplier of banana ripening and distribution services in Germany, Austria and Denmark.In connection with this agreement and as part of the calculation of the net loss on the sale, the company recognized a$9 million deferred credit, which is being amortized to “Cost of sales” in the Consolidated Statements of Incomeover the initial 5-year term of the ripening and distribution services agreement, of which $2 million, $2 million andless than $1 million of this credit were recognized in the years ended December 31, 2010, 2009 and 2008,respectively. Through the date of the sale, sales of Chiquita bananas and other produce into these markets throughthe Atlanta distribution system totaled $93 million in 2008. The continuing cash flows are not considered to besignificant in relation to the overall activities of Atlanta and, therefore, Atlanta is presented as discontinuedoperations in the Consolidated Financial Statements.

38Chiquita Brands International, Inc. — 2010 Annual Report
Cash flows from discontinued operations include an increase in intercompany balances due to continuingoperations of $2 million in 2008. Prior to the sale, approximately three-fourths of the assets of discontinuedoperations were included in the Other Produce segment, with the remainder included in the Banana segment.
Summarized operating results of discontinued operations are as follows (operating results are reported throughthe date of the sale of Atlanta):
(In thousands) 2008
Net sales $ 914,747
Operating income 1,416
Income from discontinued operations before income taxes 2,664Income tax expense (1,200)
Income from discontinued operations $ 1,464
Net sales from discontinued operations by segment:Bananas $ 162,099Other Produce 752,648
Operating income (loss) from discontinued operations by segment:Bananas $ 550Other Produce 1,995Corporate (1,129)
Note 4 – Finance Receivables
Finance receivables were as follows:December 31,
2010 2009Gross Net Gross Net
(In thousands) Receivable Allowance Receivable Receivable Allowance Receivable
Grower advances $ 80,432 $ (4,552) $ 75,880 $ 83,825 $ (2,402) $ 81,423Seller financing 39,821 - 39,821 44,751 - 44,751
Seasonal advances may be made to certain qualified growers of other produce, which are generally collected asthe other produce is harvested and sold. The company generally requires property liens and pledges of the season’sproduce as collateral to support these advances. If sales of the season’s produce do not result in full repayment ofthe advance, the company may exercise the collateral provisions or renegotiate the terms, including interest, tocollect the remaining balance. The company carries payables to growers related to revenue collected from the saleof the other produce that is subsequently remitted to the grower, less outstanding grower advances and a marginretained by the company based upon the terms of the contract. Grower payables of $21 million and $15 million atDecember 31, 2010 and 2009, respectively, are included in “Other liabilities” in the Consolidated Balance Sheets.
Of the total seasonal advances, $50 million (including $20 million classified as long-term) and $49 million(including $12 million classified as long-term) relates to a Chilean grower as of December 31, 2010 and 2009,respectively. This Chilean grower grows grapes and other produce. Advances to this grower in past growingseasons were not fully repaid and the arrangement was restructured in 2009 to provide for full collection over thenext several growing seasons, while continuing to provide seasonal advances during these periods. In 2010, thegrower did not fully comply with the established repayment schedule despite formal personal guarantees by thegrower’s owners. Negotiations for various repayment options are ongoing and additional collateralization wasobtained, but the outstanding balance remains payable on demand. Based on the status of the negotiations, thecompany has not recorded an allowance for advances provided to the Chilean grower because the companydetermined that a loss was not probable. The company will use all available means to collect the full outstandingbalance owed by the grower. The remaining grower advances represent advances to smaller growers. Allowances

Chiquita Brands International, Inc. — 2010 Annual Report39
were recorded only for advances where loss was considered probable based on the facts and circumstancessurrounding each advance.
As described in Note 3, the company provided seller financing in the 2009 sale of the former Asia JV in theform of a note receivable in equal installments through 2019. The company also provided seller financing in the2004 sale of its former Colombian subsidiary in the form of a note receivable in equal installments through 2012.Payments are current on both seller financing notes receivable.
Note 5 - Inventories
Inventories consist of the following:
December 31,(In thousands) 2010 2009
Bananas $ 44,873 $ 53,846Salads 7,667 6,760Other fresh produce 4,381 1,733Processed food products 10,629 13,148Growing crops 74,392 77,032Materials, supplies and other 70,307 60,374
$ 212,249 $ 212,893
The carrying value of inventories valued by the LIFO method was approximately $85 million and $93 million atDecember 31, 2010 and 2009, respectively. At current costs, these inventories would have been approximately $55million and $42 million higher than the LIFO values at December 31, 2010 and 2009, respectively. The companyhad $9 million of LIFO liquidations in 2010.
Note 6 - Property, Plant and Equipment
Property, plant and equipment consist of the following:
December 31,(In thousands) 2010 20091
Land $ 40,117 $ 39,813Buildings and improvements 153,503 138,140Machinery, equipment and other 348,987 319,864Containers 12,398 14,886Cultivations 51,329 44,577
606,334 557,280Accumulated depreciation (312,341) (269,031)
293,993 288,249Construction in progress 55,657 47,279
$ 349,650 $ 335,528
1 Reclassifications were made for comparative purposes.

40Chiquita Brands International, Inc. — 2010 Annual Report
Note 7 - Equity Method Investments
The company’s share of the (loss) income from equity method investments was $(3) million, $17 million and$10 million in 2010, 2009 and 2008, respectively, and its investment in these affiliates totaled $19 million and $18million at December 31, 2010 and 2009, respectively. The company did not have undistributed earnings from itsequity method investments at December 31, 2010. The company’s share of undistributed earnings from its equitymethod investments totaled $14 million at December 31, 2009. The company’s carrying value of equity methodinvestments was approximately $1 million less than the company’s proportionate share of the investees’ underlyingnet assets at both December 31, 2010 and 2009. The amount associated with the property, plant and equipment ofthe underlying investees was not significant.
Summarized financial information for the company’s equity method investments is as follows:
Years ended December 31,(In thousands) 2010 2009 2008
Revenue $ 128,166 $ 567,739 $ 719,040Gross profit 23,617 88,562 71,228Net (loss) income (8,114) 33,823 20,939
December 31,(In thousands) 2010 2009
Current assets $ 7,888 $ 47,456Total assets 55,828 72,047Current liabilities 9,316 23,642Total liabilities 11,207 33,205
The company’s primary equity method investments were: the Asia JV, which was sold in August 2009; CoastCitrus Distributors, which was sold in April 2010; and the Danone JV, which was formed in May 2010. See furtherdiscussion in Note 3.
Sales by Chiquita to equity method investees were approximately $13 million, $35 million and $30 million inthe years ended December 31, 2010, 2009 and 2008, respectively. Purchases by the company from equity methodinvestees were $10 million and $14 million in the years ended December 31, 2009 and 2008, respectively. Nopurchases were made by the company from equity method investees in the year ended December 31, 2010.
Note 8 – Goodwill, Trademarks and Intangible Assets
GOODWILLThe company’s goodwill is primarily related to the company’s salad operations, Fresh Express, and is included
in the company’s Salads and Healthy Snacks reportable segment (see Note 18). Goodwill is as follows:Net
Accumulated CarryingGross Impairment Value of
(In thousands) Goodwill Losses1 Goodwill
December 31, 2008 $ 550,679 $ (375,295) $ 175,384Resolution of contingent purchase price 1,200 - 1,200
December 31, 2009 $ 551,879 $ (375,295) $ 176,584
December 31, 2010 $ 551,879 $ (375,295) $ 176,584
1 The 2008 impairment charge is described in Note 1.

Chiquita Brands International, Inc. — 2010 Annual Report41
TRADEMARKS AND OTHER INTANGIBLE ASSETSThe company’s trademarks for Chiquita and Fresh Express are not amortizable (indefinite-lived). Other
intangible assets, such as customer relationships and patented technology related to Fresh Express, are amortizable(finite-lived). Trademarks and other intangible assets, net, consist of the following:
December 31,(In thousands) 2010 2009
Unamortized intangible assets:Chiquita trademarks $ 387,585 $ 387,585Fresh Express trademarks 61,500 61,500
$ 449,085 $ 449,085
Amortized intangible assets:Customer relationships $ 110,000 $ 110,000Patented technology 59,500 59,500
169,500 169,500Accumulated amortization:
Customer relationships (32,222) (26,064)Patented technology (22,295) (18,609)
(54,517) (44,673)
Other intangible assets, net $ 114,983 $ 124,827
Amortization expense of other intangible assets totaled $10 million in each of 2010, 2009 and 2008. Theestimated amortization expense associated with other intangible assets is approximately $9 million in each of thenext five years. See Note 1 for discussion of impairment reviews.
Note 9 – Accounts Payable and Accrued Liabilities
Accounts payable and accrued liabilities consist of the following:
December 31,(In thousands) 2010 2009
Accounts payable:Trade $ 231,616 $ 241,844Book overdrafts1 1,026 22,048Other 31,650 31,680
$ 264,292 $ 295,572
Accrued liabilities:Payroll and employee benefit costs $ 48,438 $ 72,781Accrued sales incentives 15,557 16,666Income taxes 11,650 15,816Other 51,821 53,483
$ 127,466 $ 158,746
1 Represents outstanding checks in excess of deposits when the right of offset with other accounts does not exist.

42Chiquita Brands International, Inc. — 2010 Annual Report
Note 10 - Debt
Debt consists of the following:
December 31,(In thousands) 2010 2009
Parent company:7½% Senior Notes due 2014 $ 156,438 $ 167,0838⅞% Senior Notes due 2015 177,015 179,1854.25% Convertible Senior Notes due 2016 134,761 127,138
Long-term debt of parent company 468,214 473,406
Subsidiaries:Loans secured by substantially all U.S. assets,
due in installments from 2009 to 2014:Credit Facility Term Loan 165,000 182,500
Other loans 928 163Less current maturities (20,169) (17,607)
Long-term debt of subsidiaries 145,759 165,056
Total long-term debt $ 613,973 $ 638,462
Debt maturities are as follows:
(In thousands)
2011 $ 20,1692012 20,1732013 20,1842014 261,6322015 177,217Later years 200,000
In 2010, the company repurchased $13 million principal amount of its Senior Notes in the open market at asmall discount, consisting of $11 million of the 7½% Senior Notes and $2 million of the 8⅞% Senior Notes. In2009, the company repurchased $38 million principal amount of its Senior Notes in the open market at a smalldiscount, consisting of $28 million of the 7½% Senior Notes and $9 million of the 8⅞% Senior Notes. The 2010and 2009 repurchases resulted in an extinguishment loss of less than $1 million from deferred financing fee write-offs and transaction costs. In 2008, the company repurchased $55 million principal amount of 7½% Senior Notesand $36 million principal amount of 8⅞% Senior Notes at a discount in the open market with $75 million of the netproceeds from the sale of Atlanta (see Note 3). The 2008 Senior Note repurchases resulted in an extinguishmentgain of approximately $14 million, after deferred financing fee write-offs and transaction costs.
Total cash payments for interest were $46 million, $51 million and $78 million in 2010, 2009 and 2008,respectively.
SENIOR NOTESThe 7½% Senior Notes due 2014 are callable on or after November 1, 2010, in whole or from time to time in
part, at 102.5% of face value declining to face value in 2012. The 8⅞% Senior Notes due 2015 are callable on orafter June 1, 2010, in whole or from time to time in part, at 104.438% of face value declining to face value in 2013.
The indentures for the 7½% and 8⅞% Senior Notes contain covenants that limit the ability of the company andits subsidiaries to incur debt and issue preferred stock, dispose of assets, make investments, pay dividends or makedistributions in respect of the company’s capital stock, create liens, merge or consolidate, issue or sell stock ofsubsidiaries, enter into transactions with certain shareholders or affiliates, and guarantee company debt. Thesecovenants are generally less restrictive than the covenants under the Credit Facility or the prior CBL Facility.

Chiquita Brands International, Inc. — 2010 Annual Report43
In February 2008, the company issued $200 million of Convertible Notes. The Convertible Notes providedapproximately $194 million in net proceeds, which were used to repay a portion of the prior CBL Facility (discussedbelow). Interest on the Convertible Notes is payable semiannually in arrears at a rate of 4.25% per annum, beginningAugust 15, 2008. The Convertible Notes are unsecured, unsubordinated obligations of the parent company and rankequally with the 7½% Senior Notes and the 8⅞% Senior Notes.
The Convertible Notes are convertible at an initial conversion rate of 44.5524 shares of common stock per$1,000 in principal amount, equivalent to an initial conversion price of approximately $22.45 per share of commonstock. The conversion rate is subject to adjustment based on certain dilutive events, including stock splits, stockdividends and other distributions (including cash dividends) in respect of the common stock.
Holders of the Convertible Notes may tender their notes for conversion between May 15 and August 14, 2016,in multiples of $1,000 in principal amount, without limitation. Prior to May 15, 2016, holders may tender theirConvertible Notes for conversion under the following circumstances: (i) in any quarter, if the closing price ofChiquita common stock during 20 of the last 30 trading days of the prior quarter was above 130% of the conversionprice ($29.18 per share based on the initial conversion price); (ii) if a specified corporate event occurs, such as amerger, recapitalization or issuance of certain rights or warrants; (iii) within 30 days of a “fundamental change,”which includes a change in control, merger, sale of all or substantially all of the company’s assets, dissolution ordelisting; (iv) if during any 5-day trading period, the Convertible Notes are trading at less than 98% of the value ofthe shares into which the notes could otherwise be converted, as defined in the notes; or (v) if the company calls theConvertible Notes for redemption.
Upon conversion, the Convertible Notes may be settled in shares, in cash or any combination thereof, at thecompany’s option, unless the company makes an “irrevocable net share settlement election,” in which case anyConvertible Notes tendered for conversion will be settled in a cash amount equal to the principal portion togetherwith shares of the company’s common stock to the extent that the obligation exceeds such principal portion.Although the company initially reserved 11.8 million shares for issuance upon conversions of the Convertible Notes,the company’s current intent and policy is to settle any conversion of the Convertible Notes as if it had elected tomake the net share settlement.
Subject to certain exceptions, if the company undergoes a “fundamental change,” as defined in the notes, eachholder of Convertible Notes will have the option to require the company to repurchase all or a portion of suchholder’s Convertible Notes. In the event of a fundamental change, the repurchase price will be 100% of theprincipal amount of the Convertible Notes to be purchased, plus accrued and unpaid interest, plus certain make-whole adjustments, if applicable. Any Convertible Notes repurchased by the company will be paid in cash.
Beginning February 19, 2014, the company may call the Convertible Notes for redemption if the common stocktrades above 130% of the applicable conversion price ($29.18 based on the initial conversion price) for at least 20 ofthe 30 trading days preceding the redemption notice.
The company’s Convertible Notes are required to be accounted for in two components: (i) a debt componentincluded in “Long-term debt of parent company” recorded at the issuance date representing the estimated fair valueof a similar debt instrument without the debt-for-equity conversion feature; and (ii) an equity component included in“Capital surplus” representing the issuance date estimated fair value of the conversion feature. This separationresults in the debt being carried at a discount, which is accreted to the principal amount of the debt component usingthe effective interest rate method over the expected life of the Convertible Notes (through the maturity date).
To estimate the fair value of the debt component, the company discounted the principal balance to result in aneffective interest rate of 12.50% for each of the years ended December 31, 2010, 2009 and 2008. The fair value ofthe equity component was estimated as the difference between the full principal amount and the estimated fair valueof the debt component, net of an allocation of issuance costs and income tax effects. These were Level 3 fair valuemeasurements (described in Note 12) and will be reconsidered in the event that any of the Convertible Notes areconverted.
4.25% CONVERTIBLE SENIOR NOTES

44Chiquita Brands International, Inc. — 2010 Annual Report
The carrying amounts of the debt and equity components of the Convertible Notes, are as follows:
December 31,(In thousands) 2010 2009
Principal amount of debt component1 $ 200,000 $ 200,000Unamortized discount (65,239) (72,862)
Net carrying amount of debt component $ 134,761 $ 127,138
Equity component $ 84,904 $ 84,904Issuance costs and income taxes (3,210) (3,210)
Equity component, net of issuancecosts and income taxes $ 81,694 $ 81,694
1 As of December 31, 2010, the value of the shares that could result from conversion of the Convertible Notes is lessthan their principal amount.
The interest expense related to the Convertible Notes was as follows:
December 31,(In thousands) 2010 2009 2008
4.25% coupon interest $ 8,500 $ 8,500 $ 7,508Amortization of deferred financing fees 469 505 431Amortization of discount on the debt component 7,623 6,753 5,289
$ 16,592 $ 15,758 $ 13,228
CREDIT FACILITYIn March 2008, Chiquita Brands L.L.C. (“CBL”), the main operating subsidiary of the company, entered into a
$350 million senior secured credit facility (“Credit Facility”) that replaced the remaining portions of the prior CBLFacility (discussed below). The Credit Facility matures on March 31, 2014 and consists of a $200 million seniorsecured term loan (the “Term Loan”) and a $150 million senior secured revolving credit facility (the “Revolver”).The Revolver may be increased to $200 million under certain conditions.
The Term Loan bears interest at an annual rate at the company’s option of either: (i) the “Base Rate” plus2.75% to 3.50%; or (ii) LIBOR plus 3.75% to 4.50%. The interest rate spread in each case is based on the CBII’sadjusted leverage ratio. The “Base Rate” is the higher of the lender’s prime rate and the Federal Funds EffectiveRate plus 0.50%. Through September 2008, the terms of the Credit Facility set the annual interest rate for the TermLoan at LIBOR plus 4.25%. Based upon the CBII adjusted leverage ratio, it reset to LIBOR plus 3.75% on October1, 2008. At December 31, 2010, 2009 and 2008, the annual interest rate was LIBOR plus 3.75%, or 4.06%, 4.00%and 5.95%, respectively. The Term Loan requires quarterly principal repayments of $2.5 million through March 31,2010 and $5 million thereafter for the life of the loan, with any remaining balance to be paid upon maturity at March31, 2014. Borrowings under the Term Loan were used to extinguish the prior credit facility, including the $47million balance of the prior revolving credit facility.
The Revolver bears interest at an annual rate at the company’s option of either: (i) the “Base Rate” plus 2.00%to 2.75%; or (ii) LIBOR plus 3.00% to 3.75%. The interest rate spread in each case is based on the CBII adjustedleverage ratio. Based on the CBII adjusted leverage ratio, the borrowing rate under the Revolver would be either theBase Rate plus 2.00% or LIBOR plus 3.00%. The company is required to pay a fee of 0.50% per annum on thedaily unused portion of the Revolver. The Revolver contains a $100 million sub-limit for letters of credit, subject toa $50 million sub-limit for non-U.S. currency letters of credit. There were no borrowings under the Revolver atDecember 31, 2010, 2009 or 2008. At December 31, 2010, there was $127 million of available Revolver credit after$23 million was used to support issued letters of credit.

Chiquita Brands International, Inc. — 2010 Annual Report45
The obligations under the Credit Facility are guaranteed by CBII, substantially all of CBL’s domesticsubsidiaries and certain of its foreign subsidiaries. The obligations under the Credit Facility are secured bysubstantially all of the assets of CBL and its domestic subsidiaries, including trademarks, 100% of the stock ofsubstantially all of CBL’s domestic subsidiaries and at least 65% of the stock of certain of CBL’s foreignsubsidiaries. CBII’s obligations under its guarantee are secured by a pledge of the stock of CBL.
The Credit Facility contains two financial maintenance covenants, an operating company leverage covenant of3.50x and a fixed charge covenant of 1.15x, for the life of the facility, and no holding company or consolidatedleverage covenant. At December 31, 2010, the company was in compliance with the financial covenants of theCredit Facility. Repurchases of the Senior Notes in 2010, 2009 and 2008 did not affect the financial maintenancecovenants of the Credit Facility because they were repurchased by CBL as permitted investments under the terms ofthe Credit Facility and therefore, do not affect the financial maintenance covenants. Although these repurchasedSenior Notes were not retired, the company does not intend to resell or re-issue any of them.
The Credit Facility also places customary limitations on the ability of CBL and its subsidiaries to incuradditional debt, create liens, dispose of assets, carry out mergers and acquisitions and make investments and capitalexpenditures, as well as limitations on CBL’s ability to make loans, distributions or other transfers to CBII.However, payments to CBII are permitted: (i) whether or not any event of default exists or is continuing under theCredit Facility, for all routine operating expenses in connection with the company’s normal operations and to fundcertain liabilities of CBII (including interest payments on the Senior Notes and Convertible Notes) and (ii) subject tono continuing event of default and compliance with the financial covenants, for other financial needs, including (A)payment of dividends and distributions to the company’s shareholders and (B) repurchases of the company’scommon stock. At December 31, 2010, distributions to CBII, other than for normal overhead expenses and intereston the company’s Senior Notes and Convertible Notes, were limited to approximately $90 million. The CreditFacility also requires that the net proceeds of significant asset sales (other than those related to Atlanta) be usedwithin 180 days to prepay outstanding amounts, unless those proceeds are reinvested in the company’s business.
PRIOR CBL FACILITYThe Credit Facility replaced the remaining portions of a previous senior secured credit facility (the “CBL
Facility”). The CBL Facility included a $200 million revolving credit facility (the “Revolving Credit Facility”) thatwould have expired in 2010 and two term loans, one for $125 million (“Term Loan B”) and one for $375 million(“Term Loan C”) maturing in 2011 and 2012, respectively. In February 2008, the company repaid $194 million ofTerm Loan C with the net proceeds of the Convertible Notes issuance, and in March 2008, the company repaid theremaining $132 million of Term Loan C with the proceeds from the Term Loan under the new Credit Facility. Thecompany had borrowed an additional $57 million under the Revolving Credit Facility in January and February 2008,which was also repaid in March 2008, primarily with the proceeds from the new Term Loan. Upon theextinguishment of the CBL Facility, the remaining $9 million of related deferred financing fees were recognizedthrough “Interest expense” in the Consolidated Statements of Income.
Note 11 - Hedging
Derivative instruments are recognized at fair value on the Consolidated Balance Sheets. For derivativeinstruments that are designated and qualify as cash flow hedges, the effective portion of gains or losses on thederivatives are reported as a component of “Accumulated other comprehensive income (loss)” and are reclassifiedinto net income in the same period during which the hedged transaction affects net income. Gains and losses onderivatives representing hedge ineffectiveness are recognized in net income currently. See further informationregarding fair value measurements of derivatives in Note 12.

46Chiquita Brands International, Inc. — 2010 Annual Report
The company purchases euro put option contracts to hedge the cash flow and earnings risks that any significantdecline in the value of the euro would have on the conversion of euro-based revenue into U.S. dollars. Purchasedeuro put options require an upfront premium payment and can reduce these risks in the event of significant futuredeclines in the value of the euro, without limiting the benefit received from a stronger euro. Foreign currencyhedging costs charged to the Consolidated Statements of Income reduce any favorable impact of the exchange rateon U.S. dollar realizations of euro-denominated sales. These purchased euro put options are designated as cash flowhedging instruments. Foreign currency hedging benefits included in the Consolidated Statements of Income were $2million in 2010. Foreign currency hedging costs charged to the Consolidated Statements of Income were $1 millionand $9 million in 2009 and 2008, respectively. At December 31, 2010, unrealized net losses of $1 million on thecompany’s purchased euro put options were deferred in “Accumulated other comprehensive income (loss),” whichwould be reclassified to net income, if realized, in the next twelve months.
Most of the company’s foreign operations use the U.S. dollar as their functional currency. As a result, balancesheet translation adjustments due to currency fluctuations are recognized currently in “Cost of sales” in theConsolidated Statements of Income. To minimize the resulting volatility, the company also enters into 30-day euroforward contracts each month to economically hedge the net monetary assets exposed to euro exchange rates. These30-day euro forward contracts are not designated as hedging instruments, and gains and losses on these forwardcontracts are recognized currently in “Cost of sales” in the Consolidated Statements of Income. For the year endedDecember 31, 2010, the company recognized $8 million of gains on 30-day euro forward contracts, and $11 millionof expense from fluctuations in the value of the net monetary assets exposed to euro exchange rates.
The company also enters into bunker fuel forward contracts for its shipping operations, which permit it to lockin fuel purchase prices for up to three years and thereby minimize the volatility that changes in fuel prices couldhave on its operating results. These bunker fuel forward contracts are designated as cash flow hedging instruments.Bunker fuel hedging costs charged to the Consolidated Statements of Income were $8 million in 2010. Bunker fuelhedging benefits included in the Consolidated Statements of Income were $3 million and $21 million in 2009 and2008, respectively. At December 31, 2010, unrealized net gains of $25 million on the company’s bunker fuelforward contracts were deferred in “Accumulated other comprehensive income (loss),” including net gains of $14million which would be reclassified to net income, if realized, in the next twelve months.
At December 31, 2010, the company’s hedge portfolio was comprised of the following:
Notional Average SettlementAmount Rate/Price Period
Derivatives designated as hedging instruments:
Purchased euro put options €53 million $1.27/€ 2011
Fuel derivatives:
3.5% Rotterdam Barge:Bunker fuel forward contracts 185,233 mt $434/mt 2011Bunker fuel forward contracts 110,224 mt $455/mt 2012Bunker fuel forward contracts 89,226 mt $483/mt 2013
Singapore/New York Harbor:Bunker fuel forward contracts 48,719 mt $460/mt 2011Bunker fuel forward contracts 19,456 mt $485/mt 2012Bunker fuel forward contracts 15,753 mt $518/mt 2013
Derivatives not designated as hedging instruments:
30-day euro forward contracts €98 million $1.32/€ Jan. 2011
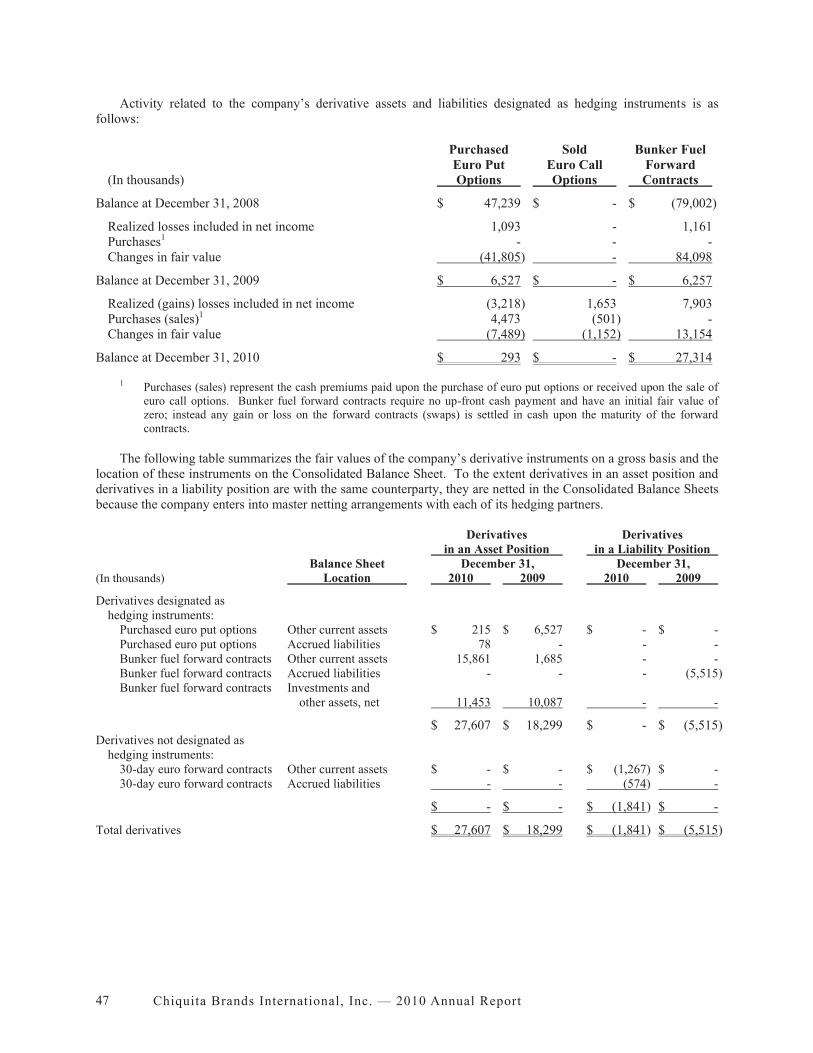
Chiquita Brands International, Inc. — 2010 Annual Report47
Activity related to the company’s derivative assets and liabilities designated as hedging instruments is asfollows:
Purchased Sold Bunker FuelEuro Put Euro Call Forward
(In thousands) Options Options Contracts
Balance at December 31, 2008 $ 47,239 $ - $ (79,002)
Realized losses included in net income 1,093 - 1,161Purchases1 - - -Changes in fair value (41,805) - 84,098
Balance at December 31, 2009 $ 6,527 $ - $ 6,257
Realized (gains) losses included in net income (3,218) 1,653 7,903Purchases (sales)1 4,473 (501) -Changes in fair value (7,489) (1,152) 13,154
Balance at December 31, 2010 $ 293 $ - $ 27,314
1 Purchases (sales) represent the cash premiums paid upon the purchase of euro put options or received upon the sale ofeuro call options. Bunker fuel forward contracts require no up-front cash payment and have an initial fair value ofzero; instead any gain or loss on the forward contracts (swaps) is settled in cash upon the maturity of the forwardcontracts.
The following table summarizes the fair values of the company’s derivative instruments on a gross basis and thelocation of these instruments on the Consolidated Balance Sheet. To the extent derivatives in an asset position andderivatives in a liability position are with the same counterparty, they are netted in the Consolidated Balance Sheetsbecause the company enters into master netting arrangements with each of its hedging partners.
Derivatives Derivativesin an Asset Position in a Liability Position
Balance Sheet December 31, December 31,(In thousands) Location 2010 2009 2010 2009
Derivatives designated ashedging instruments:
Purchased euro put options Other current assets $ 215 $ 6,527 $ - $ -Purchased euro put options Accrued liabilities 78 - - -Bunker fuel forward contracts Other current assets 15,861 1,685 - -Bunker fuel forward contracts Accrued liabilities - - - (5,515)Bunker fuel forward contracts Investments and
other assets, net 11,453 10,087 - -
$ 27,607 $ 18,299 $ - $ (5,515)Derivatives not designated as
hedging instruments:30-day euro forward contracts Other current assets $ - $ - $ (1,267) $ -30-day euro forward contracts Accrued liabilities - - (574) -
$ - $ - $ (1,841) $ -
Total derivatives $ 27,607 $ 18,299 $ (1,841) $ (5,515)

48Chiquita Brands International, Inc. — 2010 Annual Report
The following table summarizes the effect of the company’s derivatives designated as cash flow hedginginstruments on OCI and earnings:
Year Ended December 31, 2010 Year Ended December 31, 2009Bunker Bunker
Purchased Sold Fuel Purchased FuelEuro Put Euro Call Forward Euro Put Forward
(In thousands) Options Options Contracts Total Options Contracts Total
Gain (loss) recognized in OCI onderivative (effective portion) $ 17,897 $ (2,154) $ 12,966 $ 28,709 $ (19,887) $ 79,718 $ 59,831
Gain (loss) reclassified from accumulatedOCI into income (effective portion)1 15,861 (2,154) (7,903) 5,804 9,582 (1,161) 8,421
Gain (loss) recognized in income onderivative (ineffective portion)2 - - 188 188 - 4,380 4,380
1 Gain (loss) reclassified from accumulated OCI into income (effective portion) is included in “Net sales” for purchasedeuro put options and sold euro call options and “Cost of sales” for bunker fuel forward contracts.
2 Gain (loss) recognized in income on derivative (ineffective portion), if any, is included in “Net sales” for purchasedeuro put options and sold euro call options and “Cost of sales” for bunker fuel forward contracts.
The amount included in net income (loss) for the change in fair value of the bunker fuel forward contractsrelating to hedge ineffectiveness was a gain of less than $1 million, $4 million and $1 million in 2010, 2009 and2008, respectively.
Note 12 – Fair Value Measurements
Fair value is the price to hypothetically sell an asset or transfer a liability in an orderly manner in the principalmarket for that asset or liability. Accounting standards prioritize the use of observable inputs in measuring fairvalue. The level of a fair value measurement is determined entirely by the lowest level input that is significant to themeasurement. The three levels are (from highest to lowest):
Level 1 – observable prices in active markets for identical assets and liabilities;Level 2 – observable inputs other than quoted market prices in active markets for identical assets and liabilities,
which include quoted prices for similar assets or liabilities in an active market and market-corroborated inputs; and
Level 3 – unobservable inputs.

Chiquita Brands International, Inc. — 2010 Annual Report49
The company carried the following financial assets (liabilities) at fair value:
Fair Value Measurements UsingQuoted Prices Significant
in Active OtherMarkets for Observable Unobservable
Identical Assets Inputs Inputs(In thousands) Total (Level 1) (Level 2) (Level 3)
December 31, 2010
Purchased euro put options $ 293 $ - $ 293 $ -Bunker fuel forward contracts 27,314 - 27,314 -30-day euro forward contracts (1,841) - (1,841) -Available-for-sale investment 2,908 2,908 - -
$ 28,674 $ 2,908 $ 25,766 $ -
December 31, 2009
Purchased euro put options $ 6,527 $ - $ 6,527 $ -Bunker fuel forward contracts 6,257 - 6,257 -Available-for-sale investment 3,034 3,034 - -
$ 15,818 $ 3,034 $ 12,784 $ -
The company values fuel hedging positions by applying an observable discount rate to the current forwardprices of identical hedge positions. The company values currency hedging positions by utilizing observable ormarket-corroborated inputs such as exchange rates, volatility and forward yield curves. The company trades onlywith counterparties that meet certain liquidity and creditworthiness standards, and does not anticipate non-performance by any of these counterparties. The company does not require collateral from its counterparties, nor isit obligated to provide collateral when contracts are in a liability position. However, consideration of non-performance risk is required when valuing derivative instruments, and the company includes an adjustment for non-performance risk in the fair value measure of derivative instruments to reflect the full credit default spread (“CDS”)applied to the net exposure by counterparty. When there is a net asset position, the company uses the counterparty’sCDS, which is generally an observable input; when there is a net liability position, the company uses its ownestimated CDS, which is an unobservable input. CDS is generally not a significant input in measuring fair value. AtDecember 31, 2010 and 2009, the company’s adjustment for non-performance risk was not significant for thepurchased euro put options, 30-day euro forward contracts or the bunker fuel forward contracts. See furtherdiscussion and tabular disclosure of hedging activity in Note 11.
The company has not elected to carry its debt at fair value. The carrying values of the company’s debt representamortized cost and are summarized below with estimated fair values:
December 31, 2010 December 31, 2009Carrying Estimated Carrying Estimated
(In thousands) Value Fair Value Value Fair Value
Financial instruments not carried at fair value:
Parent company debt:7½% Senior Notes $ 156,438 $ 161,000 $ 167,083 $ 168,0008⅞% Senior Notes 177,015 179,000 179,185 182,0004.25% Convertible Senior Notes1 134,761 193,000 127,138 215,000
Subsidiary debt:Term Loan (Credit Facility) 165,000 165,000 182,500 175,000Other 928 900 163 100
1 The principal amount of the Convertible Notes is $200 million. The carrying amount of the Convertible Notes is lessthan the principal amount due to the application of accounting standards for Convertible Notes as described in Note 10.

50Chiquita Brands International, Inc. — 2010 Annual Report
The fair value of the parent company debt is based on quoted market prices (Level 1). The term loan may betraded on the secondary loan market, and the fair value of the term loan is based on either the last available tradingprice, if recent, or trading prices of comparable debt (Level 3). Level 3 fair value measurements described in Note 1are used in the impairment reviews of goodwill and intangible assets. The company also made a non-recurringLevel 3 fair value measurement in 2010 to estimate the fair value of its equity method investment in the Danone JVat the date of deconsolidation as described in Note 3. Fair value measurements of benefit plan assets included in netbenefit plan liabilities are discussed in Note 14. The carrying amounts of cash and equivalents, accounts receivableand accounts payable approximate fair value.
Note 13 – Leases
Total rental expense consists of the following:
(In thousands) 2010 2009 2008
Gross rentalsShips and containers $ 165,562 $ 178,637 $ 165,315Other 39,063 43,790 47,776
204,625 222,427 213,091Sublease rentals (4,679) (5,689) (9,362)
$ 199,946 $ 216,738 $ 203,729
The company has leased eleven refrigerated cargo ships through 2014 under a sale-leaseback, with options forup to an additional five years, four ships through 2011 and nine ships through 2012. No purchase options exist onships under operating leases. A deferred gain on the sale-leaseback is being recognized as a reduction of “Cost ofsales” in the Consolidated Statements of Income over the base term of the leases, through 2014.
A portion of the company’s operating leases of containers contain residual value guarantees under which thecompany guarantees a certain minimum value of the containers at the end of the lease. If the company does notexercise its purchase option at the end of the lease, and the lessor cannot sell the containers for at least theguaranteed amount, the company will have to pay the difference to the lessor. The company estimates that theresidual guarantees are approximately $26 million and $6 million at December 31, 2010 and 2009, respectively.
Portions of the minimum rental payments for ships constitute reimbursement for ship operating costs paid bythe lessor. In addition, the company incurs a significant amount of rental expense related to short-term ship leases,which are not included in the future minimum rental payments table below.
Future minimum rental payments required under operating leases having initial or remaining non-cancelablelease terms in excess of one year at December 31, 2010 are as follows:
Ships and(In thousands) Containers Other Total
2011 $ 132,414 $ 24,412 $ 156,8262012 114,432 17,821 132,2532013 60,181 12,094 72,2752014 37,451 9,288 46,7392015 18,951 4,442 23,393Later years 41,707 6,645 48,352

Chiquita Brands International, Inc. — 2010 Annual Report51
Note 14 - Pension and Severance Benefits
The company and its subsidiaries have several defined benefit and defined contribution pension plans coveringdomestic and foreign employees and have severance plans covering Central American employees. Pension planscovering eligible salaried and hourly employees and Central American severance plans for all employees call forbenefits to be based upon years of service and compensation rates. The company uses a December 31 measurementdate for all of its plans.
Pension and severance expense consists of the following:
Domestic Plans(In thousands) 2010 2009 2008
Defined benefit and severance plans:Service cost $ 466 $ 434 $ 347Interest on projected benefit obligation 1,327 1,479 1,444Expected return on plan assets (1,668) (1,704) (1,898)Recognized actuarial loss 144 55 22
269 264 (85)Defined contribution plans 9,225 8,576 9,133
Total pension and severance expense $ 9,494 $ 8,840 $ 9,048
Foreign Plans(In thousands) 2010 2009 2008
Defined benefit and severance plans:Service cost $ 6,105 $ 4,721 $ 5,488Interest on projected benefit obligation 4,195 4,294 3,354Expected return on plan assets (37) (45) (117)Recognized actuarial loss (gain) 821 (146) 627Amortization of prior service cost 128 128 65
11,212 8,952 9,417Net settlement gain (118) - -
11,094 8,952 9,417Defined contribution plans 410 584 467
Total pension and severance expense $ 11,504 $ 9,536 $ 9,884
The company’s pension and severance benefit obligations relate primarily to Central American benefits which,in accordance with local government regulations, are generally not funded until benefits are paid. Domestic pensionplans are funded in accordance with the requirements of the Employee Retirement Income Security Act.
In 2010, a net settlement gain of less than $1 million was recorded due to severance payments made toemployees terminated in Panama.

52Chiquita Brands International, Inc. — 2010 Annual Report
Financial information with respect to the company’s domestic and foreign defined benefit pension andseverance plans is as follows:
Domestic Plans Foreign PlansYear Ended December 31, Year Ended December 31,
(In thousands) 2010 2009 2010 2009
Fair value of plan assets at beginningof year $ 18,373 $ 16,162 $ 4,989 $ 5,054
Actual return on plan assets 2,376 3,560 360 177Employer contributions 888 1,150 8,942 7,224Benefits paid (2,388) (2,499) (9,080) (7,378)Foreign exchange - - (197) (88)
Fair value of plan assets at end of year $ 19,249 $ 18,373 $ 5,014 $ 4,989
Projected benefit obligation atbeginning of year $ 25,716 $ 24,801 $ 50,024 $ 41,751
Service and interest cost 1,793 1,913 10,300 9,015Actuarial loss 544 1,501 6,789 6,792Benefits paid (2,388) (2,499) (9,080) (7,378)Amendments - - - (84)Foreign exchange - - (579) (72)
Projected benefit obligation at endof year $ 25,665 $ 25,716 $ 57,454 $ 50,024
Plan assets less than projected benefitobligation $ (6,416) $ (7,343) $ (52,440) $ (45,035)
The short-term portion of the unfunded status was approximately $9 million and $8 million for foreign plans atDecember 31, 2010 and 2009, respectively. The full unfunded status of the domestic plans was classified as long-term at both December 31, 2010 and 2009. The foreign plans’ accumulated benefit obligation was $45 million and$40 million as of December 31, 2010 and 2009, respectively. The domestic plans’ accumulated benefit obligationwas $26 million as of both December 31, 2010 and 2009.
The following weighted-average assumptions were used to determine the projected benefit obligations for thecompany’s domestic pension plans and foreign pension and severance plans:
Domestic Plans Foreign PlansDecember 31, December 31,
2010 2009 2010 2009
Discount rate 5.00% 5.50% 8.00% 8.00%Rate of compensation increase 5.00% 5.00% 5.00% 5.00%
The company’s long-term rate of return on plan assets is based on the strategic asset allocation and futureexpected returns on plan assets. The following weighted-average assumptions were used to determine the netperiodic benefit cost for the company’s domestic pension plans and foreign pension and severance plans:
Domestic Plans Foreign PlansDecember 31, December 31,
2010 2009 2010 2009
Discount rate 5.50% 6.25% 8.00% 10.75%Rate of compensation increase 5.00% 5.00% 5.00% 5.00%Long-term rate of return on plan assets 8.00% 7.75% 1.00% 1.00%

Chiquita Brands International, Inc. — 2010 Annual Report53
Included in “Accumulated other comprehensive income (loss)” in the Consolidated Balance Sheets are thefollowing amounts that have not yet been recognized in net periodic pension cost:
December 31,(In thousands) 2010 2009
Unrecognized actuarial losses $ 21,303 $ 15,609Unrecognized prior service costs 1,076 1,204
The prior service costs and actuarial gains included in accumulated other comprehensive income and expectedto be included in net periodic pension cost during the next twelve months are $1 million.
The weighted-average asset allocations of the company’s domestic pension plans and foreign pension andseverance plans by asset category are as follows:
Domestic Plans Foreign PlansDecember 31, December 31,
2010 2009 2010 2009Asset category:
Equity securities 74% 74% - -Fixed income securities 24% 25% 24% 30%Cash and equivalents 2% 1% 76% 70%
The primary investment objective for the domestic plans is preservation of capital with a reasonable amount oflong-term growth and income without undue exposure to risk. This is provided by a balanced strategy using fixedincome securities, equities and cash equivalents. The target allocation of the overall fund is 75% equities and 25%fixed income securities. The cash position is maintained at a level sufficient to provide for the liquidity needs of thefund. For the funds covering the foreign plans, the asset allocations are primarily mandated by the applicablegovernments, with an investment objective of minimal risk exposure.
Mutual funds, domestic common stock, corporate debt securities and mortgage-backed pass-through securitiesheld in the plans are publicly traded in active markets and are valued using the net asset value, or closing price of theinvestment at the measurement date. There have been no changes in the methodologies used at December 31, 2010and 2009. The methods described above may produce a fair value calculation that may not be indicative of netrealizable value or reflective of future fair values. Furthermore, while the company believes its valuation methodsare appropriate and consistent with other market participants, the use of different methodologies or assumptions todetermine the fair value of certain financial instruments could result in a different fair value measurement at thereporting date.
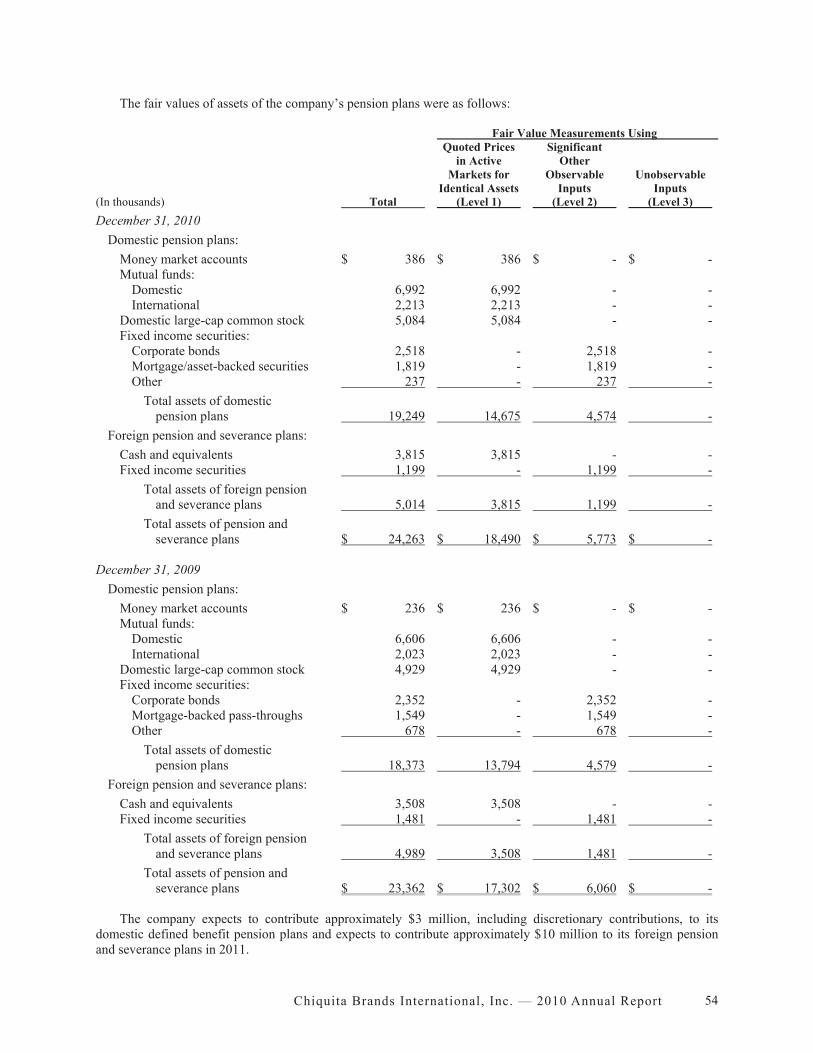
54Chiquita Brands International, Inc. — 2010 Annual Report
The fair values of assets of the company’s pension plans were as follows:
Fair Value Measurements UsingQuoted Prices Significant
in Active OtherMarkets for Observable Unobservable
Identical Assets Inputs Inputs(In thousands) Total (Level 1) (Level 2) (Level 3)December 31, 2010
Domestic pension plans:Money market accounts $ 386 $ 386 $ - $ -Mutual funds:
Domestic 6,992 6,992 - -International 2,213 2,213 - -
Domestic large-cap common stock 5,084 5,084 - -Fixed income securities:
Corporate bonds 2,518 - 2,518 -Mortgage/asset-backed securities 1,819 - 1,819 -Other 237 - 237 -
Total assets of domesticpension plans 19,249 14,675 4,574 -
Foreign pension and severance plans:Cash and equivalents 3,815 3,815 - -Fixed income securities 1,199 - 1,199 -
Total assets of foreign pensionand severance plans 5,014 3,815 1,199 -
Total assets of pension andseverance plans $ 24,263 $ 18,490 $ 5,773 $ -
December 31, 2009Domestic pension plans:
Money market accounts $ 236 $ 236 $ - $ -Mutual funds:
Domestic 6,606 6,606 - -International 2,023 2,023 - -
Domestic large-cap common stock 4,929 4,929 - -Fixed income securities:
Corporate bonds 2,352 - 2,352 -Mortgage-backed pass-throughs 1,549 - 1,549 -Other 678 - 678 -
Total assets of domesticpension plans 18,373 13,794 4,579 -
Foreign pension and severance plans:Cash and equivalents 3,508 3,508 - -Fixed income securities 1,481 - 1,481 -
Total assets of foreign pensionand severance plans 4,989 3,508 1,481 -
Total assets of pension andseverance plans $ 23,362 $ 17,302 $ 6,060 $ -
The company expects to contribute approximately $3 million, including discretionary contributions, to itsdomestic defined benefit pension plans and expects to contribute approximately $10 million to its foreign pensionand severance plans in 2011.

Chiquita Brands International, Inc. — 2010 Annual Report55
Expected benefit payments for the company’s domestic defined benefit pension plans and foreign pension andseverance plans are as follows:
Domestic Foreign(In thousands) Plans Plans
2011 $ 2,023 $ 10,4622012 2,027 9,8672013 2,008 9,0472014 2,020 8,5422015 2,010 7,9082016-2020 9,337 33,618
The company is also a participant in a multiemployer defined benefit plan based in the United Kingdomcovering officers aboard the company’s current and former ships. Expense is recognized as the company is notifiedof funding requirements. Expense recognized related to this multiemployer plan in 2010, 2009 and 2008 was notsignificant. The company does not expect future contribution requirements to be material.
Note 15 - Income Taxes
“Income tax benefit” consists of the following:
(In thousands) U.S. Federal U.S. State Foreign Total
2010:Current tax benefit $ 1,300 $ 1,354 $ 437 $ 3,091Deferred tax (expense) benefit - 33 (1,524) (1,491)
$ 1,300 $ 1,387 $ (1,087) $ 1,600
2009:Current tax benefit (expense) $ (1,236) $ (1,499) $ 3,870 $ 1,135Deferred tax (expense) benefit - 141 (876) (735)
$ (1,236) $ (1,358) $ 2,994 $ 400
2008:Current tax benefit (expense) $ 5 $ (846) $ 3,065 $ 2,224Deferred tax (expense) benefit - (1,399) 1,075 (324)
$ 5 $ (2,245) $ 4,140 $ 1,900
“Income tax benefit” differs from income taxes computed at the U.S. federal statutory rate for the followingreasons:
(In thousands) 2010 2009 2008
Income tax (expense) benefit computedat U.S. federal statutory rate $ (20,658) $ (31,532) $ 114,145
State income taxes, net of federal benefit (1,149) (799) (1,538)Impact of foreign operations (25,508) 38,266 67,855Change in valuation allowance 38,794 (15,786) (81,085)Goodwill impairment - - (110,573)Tax contingencies 9,764 11,447 13,183Other 357 (1,196) (87)
Income tax benefit $ 1,600 $ 400 $ 1,900

56Chiquita Brands International, Inc. — 2010 Annual Report
“Income tax benefit” includes benefits of $13 million, $16 million and $17 million for 2010, 2009 and 2008,respectively. The benefits relate to the resolution of tax contingencies and governmental rulings in variousjurisdictions in 2010; the resolution of tax contingencies and $4 million of benefits from the sale of the company’soperations in the Ivory Coast in 2009; and the resolution of tax contingencies in 2008.
The components of deferred income taxes included on the Consolidated Balance Sheets are as follows:
December 31,(In thousands) 2010 2009
Deferred tax benefits:Net operating loss carryforwards $ 214,955 $ 258,176Other tax carryforwards 308 6,516Employee benefits 29,588 28,431Accrued expenses 11,165 10,658Depreciation and amortization 18,424 16,970Other 6,670 7,464
Total deferred tax benefits 281,110 328,215
Deferred tax liabilities:Growing crops (17,421) (17,437)Trademarks (138,354) (139,680)Discount on Convertible Notes (25,510) (30,014)Other (3,467) (1,263)
Total deferred tax liabilities (184,752) (188,394)
Net deferred tax benefitbefore valuation allowance 96,358 139,821
Valuation allowance (202,943) (244,915)
Net deferred tax liability $ (106,585) $ (105,094)
U.S. net operating loss carryforwards (“NOLs”) were $320 million and $373 million as of December 31, 2010and 2009, respectively. The U.S. NOLs existing at December 31, 2010 will expire between 2024 and 2029. ForeignNOLs were $402 million and $464 million at December 31, 2010 and 2009, respectively. Foreign NOLs existing atDecember 31, 2010 of $217 million will expire between 2011 and 2025. The remaining $185 million of NOLsexisting at December 31, 2010 have an indefinite carryforward period.
A valuation allowance has been established against the deferred tax assets described above due to thecompany’s history of tax losses in specific tax jurisdictions, including the U.S. Despite the company’s history of taxlosses, the company generated taxable income in the U.S. in 2009 and 2010, which utilized a portion of the NOLcarryforwards. Even though NOLs have been utilized, the company’s remaining NOLs continue to have fullvaluation allowances. If in the future, the company demonstrates a trend of taxable income and an expectation thatit will utilize its deferred tax assets, some or all of the valuation allowance may be released through “Income taxbenefit” in the Consolidated Statements of Income. As of December 31, 2010, the company had approximately$101 million of U.S. federal and state valuation allowances.
Valuation allowance relates to both U.S. and foreign deferred tax assets. The valuation change resulted in thecreation of deferred tax assets of $19 million, primarily net operating losses, a reduction of tax assets of $10 milliondue to the expiration of foreign NOLs and the use of $51 million of deferred tax assets.

Chiquita Brands International, Inc. — 2010 Annual Report57
Income before taxes attributable to foreign operations was $11 million, $73 million and $98 million in 2010,2009 and 2008, respectively. Undistributed earnings of foreign subsidiaries, which were approximately $1.7 billionat December 31, 2010, have been permanently reinvested in foreign operations. Accordingly, no provision for U.S.federal and state income taxes has been recorded on these earnings.
Cash payments for income taxes were $9 million, $11 million and $14 million in 2010, 2009 and 2008,respectively. No income tax expense is associated with any of the items included in other comprehensive income.
A summary of the activity for the company’s unrecognized tax benefits follows:
(In thousands) 2010 2009 2008
Balance as of beginning of the year $ 15,825 $ 22,730 $ 37,320Additions of tax positions of prior years - 2,597 379Settlements - (3,837) (3,745)Reductions due to lapse of the
statute of limitations (4,715) (5,309) (4,833)Reduction from sale of subsidiary - (215) (7,385)Foreign currency exchange change (815) (141) 994
Balance as of end of the year $ 10,295 $ 15,825 $ 22,730
At December 31, 2010, 2009 and 2008, the company had unrecognized tax benefits of approximately $7million, $13 million and $20 million, respectively, which could affect the company’s effective tax rate, ifrecognized. Interest and penalties included in “Income tax benefit” were $4 million, $2 million and $2 million in2010, 2009 and 2008, respectively, and the cumulative interest and penalties included in the Consolidated BalanceSheets at December 31, 2010 and 2009 were $4 million and $8 million, respectively.
During the next twelve months, it is reasonably possible that unrecognized tax benefits impacting the effectivetax rate could be recognized as a result of the expiration of statutes of limitation in the amount of $3 million plusaccrued interest and penalties. In addition, the company has ongoing tax audits in multiple jurisdictions that are invarious stages of audit or appeal. If these audits are resolved favorably, unrecognized tax benefits of up to $1million plus accrued interest and penalties will be recognized. The timing of the resolution of these audits is highlyuncertain but reasonably possible to occur in the next twelve months.
The following tax years remain subject to examinations by major tax jurisdictions:
Tax YearsTax Jurisdiction:
United States 2007 – currentGermany 2001 – currentItaly 2004 – currentNetherlands 2006 – currentSwitzerland 2008 – current
Note 16 - Stock-Based Compensation
The company may issue up to an aggregate of 10.5 million shares of common stock as stock awards (includingrestricted stock units), stock options, performance awards and stock appreciation rights (“SARs”) under its stockincentive plan; at December 31, 2010, 2.1 million shares were available for future grants. Stock options provide forthe purchase of shares of common stock at fair market value at the date of grant. The company issues new shareswhen grants of restricted stock units vest or when options are exercised under the stock plan. Stock compensationexpense totaled $14 million, $14 million and $11 million for the years ended December 31, 2010, 2009 and 2008,respectively.

58Chiquita Brands International, Inc. — 2010 Annual Report
RESTRICTED STOCK UNITSThe company’s share-based awards primarily consist of restricted stock units and generally vest over four years,
and the fair value of the awards at the grant date is expensed over the period from the grant date to the date theemployee is no longer required to provide service to earn the award. Prior to vesting, grantees are not eligible tovote or receive dividends on the restricted stock units.
A summary of the activity and related information for the company’s restricted stock units follows:
2010 2009 2008Weighted Weighted Weighted
average average average(In thousands, except grant grant grantper share amounts) Units date price Units date price Units date price
Unvested units at beginning of year 1,502 $ 15.30 1,551 $ 15.77 1,742 $ 16.48Units granted 729 14.83 755 13.35 798 16.21Units vested (629) 15.15 (622) 14.13 (636) 17.39Units forfeited (100) 14.83 (182) 15.24 (353) 17.19
Unvested units at end of year 1,502 $ 15.16 1,502 $ 15.30 1,551 $ 15.77
Restricted stock unit compensation expense totaled $10 million, $8 million and $9 million for the years endedDecember 31, 2010, 2009 and 2008, respectively. At December 31, 2010, there was $15 million of totalunrecognized pre-tax compensation cost related to unvested restricted stock unit awards. This cost is expected to berecognized over a weighted-average period of approximately three years.
LONG-TERM INCENTIVE PROGRAMThe company has established a Long-Term Incentive Program (“LTIP”) for certain executive level employees.
Awards are intended to be performance-based compensation as defined in Section 162(m) of the Internal RevenueCode. The program allows for awards to be issued at the end of each three-year performance period. One-half ofeach LTIP award is based on the company’s achievement of cumulative earnings per share targets (“EPS awards”),and the other half is based on the company’s achievement of total shareholder return relative to peer companies(“TSR awards”). In 2010, the LTIP awards were modified to allow a portion to be paid in cash based on the valueof the shares at issuance. As a result of the LTIP award modification, $2 million was reclassified to “Accruedliabilities” and $4 million to “Other liabilities” from “Capital surplus,” representing the estimated fair value of theLTIP awards at December 31, 2010. Approximately $7 million remains in “Capital surplus” which represents thedecline in value of the LTIP awards since the respective grant dates.
The company recognized $4 million of LTIP expense in 2010 related to the 2010-2012, 2009-2011 and 2008-2010 periods. The company recognized $7 million of LTIP expense in 2009 related to the 2009-2011 and 2008-2010 periods. The company recognized $2 million of expense in 2008 for the 2008-2010 LTIP period. For the2010-2012 and 2009-2011 periods, up to 0.5 million and 0.7 million shares, respectively, could be awardeddepending on the company’s achievement of the metrics. The company will award approximately 0.1 million sharesand approximately $1 million in cash payments for the 2008-2010 plan in March 2011.
STOCK OPTIONSOptions for approximately 1 million shares were outstanding at December 31, 2010 under the stock incentive
plan. These options generally vested over four years and are exercisable for a period not in excess of ten years,through 2014. In addition to the options granted under the plan, the table below includes an inducement stockoption grant for 325,000 shares made to the company’s chief executive officer in January 2004 in accordance withNew York Stock Exchange rules. No options have been granted since January 2004. Additionally, but not includedin the table below, there were 4,000 SARs granted to certain non-U.S. employees outstanding at December 31, 2010,which are exercisable through 2012.

Chiquita Brands International, Inc. — 2010 Annual Report59
A summary of the activity and related information for the company’s stock options follows:
2010 2009 2008Weighted Weighted Weighted
average average average(In thousands, except exercise exercise exerciseper share amounts) Shares price Shares price Shares price
Under option at beginning of year 1,182 $ 18.18 1,289 $ 18.08 2,100 $ 17.57Options exercised - - - - (734) 16.90Options forfeited or expired (227) 16.95 (107) 16.97 (77) 15.50Under option at end of year 955 $ 18.47 1,182 $ 18.18 1,289 $ 18.08
Options exercisable at end of year 955 $ 18.47 1,182 $ 18.18 1,289 $ 18.08
Options outstanding as of December 31, 2010 had a weighted average remaining contractual life of two yearsand had exercise prices ranging from $11.73 to $23.16. The following table provides further information on therange of exercise prices:
Options Outstandingand Exercisable
Weighted Weightedaverage average
(In thousands, except exercise remainingper share amounts) Shares price life
Exercise price:$11.73 - 15.05 163 $ 13.49 2 years$16.92 - 16.97 467 16.95 1 year$23.16 325 23.16 3 years
Note 17 – Shareholders’ Equity
The company’s Certificate of Incorporation authorizes 20 million shares of preferred stock and 150 millionshares of common stock. Warrants representing the right to purchase 13.3 million shares of common stock at $19.23per share were issued in 2002 and expired in March 2009.
At December 31, 2010, shares of common stock were reserved for the following purposes:
Issuance upon conversion of the Convertible Notes (see Note 10) 11.8 millionIssuance upon exercise of stock options and other stock awards (see Note 16) 4.6 million
The company’s shareholders’ equity includes “Accumulated other comprehensive income (loss)” at December31, 2010 comprised of unrealized gains on derivatives of $24 million, unrealized translation losses of less than $1million, a decrease in the fair value of an available-for-sale investment of less than $1 million and unrecognizedprior service costs and actuarial losses of $22 million. The balance of “Accumulated other comprehensive income(loss)” at December 31, 2009 included unrealized gains on derivatives of less than $1 million, unrealized translationlosses of less than $1 million, a decrease in the fair value of an available-for-sale investment of less than $1 millionand unrecognized prior service costs and actuarial losses of $17 million.
In September 2006, the board of directors suspended the payment of dividends. Any future payments ofdividends would require approval of the board of directors. See Note 10 for a further description of limitationsunder the company’s Senior Notes and Credit Facility on its ability to pay dividends.

60Chiquita Brands International, Inc. — 2010 Annual Report
Note 18 - Segment Information
The company reports the following three business segments:
Bananas: Includes the sourcing (purchase and production), transportation, marketing and distribution ofbananas.
Salads and Healthy Snacks: Includes ready-to-eat, packaged salads, referred to in the industry as “value-added salads”; and other value-added products, such as healthy snacking products, fresh vegetable and fruitingredients used in food service, processed fruit ingredient products and the company’s equity-methodinvestment in the Danone JV, which sells Chiquita-branded fruit smoothies in Europe (see Note 3).
Other Produce: Includes the sourcing, marketing and distribution of whole fresh fruits and vegetablesother than bananas.
Certain corporate expenses are not allocated to the reportable segments and are included in “Corporate” or“European Headquarters Relocation.” Inter-segment transactions are eliminated. Segment information representsonly continuing operations. See Note 3 for information related to discontinued operations.
Financial information for each segment follows:
Salads and EuropeanHealthy Other Headquarters
(In thousands) Bananas Snacks Produce Corporate Relocation Consolidated
2010Net sales $ 1,937,748 $ 1,028,475 $ 261,209 $ - $ - $ 3,227,432Segment results1 80,591 95,268 5,363 (70,426) - 110,796Depreciation and amortization 18,568 39,803 175 2,470 - 61,016Equity in (losses) earnings
of investees2 1,472 (4,837) 440 - - (2,925)Total assets 1,100,391 702,639 105,303 158,813 - 2,067,146Expenditures for long-lived assets 29,828 28,429 36 7,249 - 65,542Net operating assets (liabilities) 639,212 570,917 72,689 (65,169) - 1,217,649
2009Net sales $ 2,081,510 $ 1,135,504 $ 253,421 $ - $ - $ 3,470,435Segment results 174,416 60,377 5,640 (81,048) (12,076) 147,309Depreciation and amortization 21,343 40,499 93 1,054 - 62,989Equity in earnings of investees2 15,009 - 1,876 - - 16,885Total assets4 1,139,561 686,652 124,714 93,899 - 2,044,826Expenditures for long-lived assets 31,824 29,115 642 7,924 - 69,505Net operating assets (liabilities)4 609,670 560,517 99,747 (74,931) - 1,195,003
2008Net sales $ 2,060,319 $ 1,304,904 $ 244,148 $ - $ - $ 3,609,371Segment results3 181,113 (399,822) 10,128 (65,605) (6,931) (281,117)Depreciation and amortization 27,762 44,938 23 - - 72,723Equity in earnings of investees2 7,583 - 2,738 - - 10,321Total assets4 1,073,627 716,056 118,399 80,103 - 1,988,185Investment in equity affiliates2 37,748 - 15,436 - - 53,184Expenditures for long-lived assets 16,583 41,304 74 8,212 - 66,173Net operating assets (liabilities)4 554,216 567,887 93,957 (71,615) - 1,144,445
1 Salads and Healthy Snacks segment includes a gain on the deconsolidation and sale of the European smoothie business of $32 millionin 2010 as described in Note 3.
2 See Notes 3 and 7 for further information related to investments in and income from equity method investments.3 Salads and Healthy Snacks segment includes a $375 million ($374 million after-tax) goodwill impairment charge in 2008.4 Reclassifications were made for comparative purposes.

Chiquita Brands International, Inc. — 2010 Annual Report61
The reconciliation of segment results to “Operating income (loss)” is as follows:
(In thousands) 2010 2009 2008Segment results $ 110,796 $ 147,309 $ (281,117)
Other income attributed to Other Produce (2,525) - -Other income attributed to Corporate (611) - -
Operating income (loss) $ 107,660 $ 147,309 $ (281,117)
The reconciliation of Consolidated Statements of Cash Flow captions to expenditures for long-lived assets is asfollows:
(In thousands) 2010 2009 2008
Per Consolidated Statements of Cash Flow:Capital expenditures $ 65,542 $ 68,305 $ 63,002Acquisition of businesses and resolution of
contingent purchase price - 1,200 3,171
Expenditures for long-lived assets $ 65,542 $ 69,505 $ 66,173
The reconciliation of the Consolidated Balance Sheets’ total assets to net operating assets follows:
December 31,(In thousands) 2010 2009
Total assets $ 2,067,146 $ 2,044,826Less:
Cash 156,481 121,369Accounts payable 264,292 295,572Accrued liabilities 127,466 158,746Accrued pension and other employee benefits 73,797 65,812Deferred tax liability 115,825 105,094Deferred gain – sale of shipping fleet 48,684 63,246Other liabilities 62,952 39,984
Net operating assets $ 1,217,649 $ 1,195,003
Financial information by geographic area is as follows:
(In thousands) 2010 2009 2008
Net sales:United States $ 1,895,207 $ 1,943,963 $ 2,121,349
Italy 206,767 235,665 231,311Germany 198,665 212,511 230,924Other Core Europe 606,522 689,157 752,052
Total Core Europe1 1,011,954 1,137,333 1,214,287
Other international 320,271 389,139 273,735
Foreign net sales 1,332,225 1,526,472 1,488,022
Total net sales $ 3,227,432 $ 3,470,435 $ 3,609,371
1 Core Europe includes the 27 member states of the European Union, Switzerland, Norway and Iceland.

62Chiquita Brands International, Inc. — 2010 Annual Report
Long-lived assets by geographic area are primarily hard assets that cannot be readily removed:
December 31,(In thousands) 2010 2009
Long-lived assets:United States $ 200,086 $ 197,010Central and South America 122,264 111,069Other international 27,300 27,449
$ 349,650 $ 335,528
The company’s products are sold throughout the world and its principal production and processing operationsare conducted in the United States, Central America and South America. Chiquita’s earnings are heavily dependentupon products grown and purchased in Central and South America. These activities are a significant factor in theeconomies of the countries where Chiquita produces bananas and related products, and are subject to the risks thatare inherent in operating in such foreign countries, including government regulation, currency restrictions,fluctuations and other restraints, import and export restrictions, burdensome taxes, risks of expropriation, threats toemployees, political instability, terrorist activities, including extortion, and risks of U.S. and foreign governmentalaction in relation to the company. Certain of these operations are substantially dependent upon leases and otheragreements with these governments.
The company is also subject to a variety of government regulations in most countries where it markets bananasand other fresh products, including health, food safety and customs requirements, import tariffs, currency exchangecontrols and taxes.
Note 19 - Contingencies
The company had accruals, including accrued interest, in the Consolidated Balance Sheets of $7 million and $12million at December 31, 2010 and 2009, respectively, related to the plea agreement with the U.S. Department ofJustice described below. The company also had an accrual of $4 million at December 31, 2009 related to thesettlement agreement for the Colombia related shareholder derivative lawsuits described below, a portion of whichis expected to be recovered through insurance; and the company had an accrual of $4 million at December 31, 2010related to contingencies and legal proceedings in Europe. While other contingent liabilities described below may bematerial, the company has determined that losses in these matters are not probable and has not accrued any otheramounts. Regardless of their outcomes, the company has paid, and will likely continue to incur, significant legaland other fees to defend itself in these proceedings, which may significantly affect the company’s financialstatements.
EUROPEAN COMPETITION LAW INVESTIGATIONIn June 2005, the company announced that its management had become aware that certain of its employees had
shared pricing and volume information with competitors in Europe over many years in violation of Europeancompetition laws and company policies, and may have engaged in other conduct that did not comply with Europeancompetition laws or applicable company policies. The company promptly stopped the conduct and notified theEuropean Commission (“EC”) and other regulatory authorities of these matters. In October 2008, the EC announcedits final decision that, between 2000 and 2002, Chiquita and other competitors violated the EC Treaty’s ban oncartels and restrictive practices in eight European Union (“EU”) member states in Northern Europe by sharingcertain information related to the setting of price quotes for bananas. Based on the company’s voluntary notificationand the company’s continued cooperation in the investigation, the EC granted the company final immunity fromfines related to this matter.

Chiquita Brands International, Inc. — 2010 Annual Report63
As previously disclosed, following the announcement of that decision, the EC has also continued to investigatecertain alleged conduct in southern Europe. The company believes that it has cooperated with that investigation,under the terms of the EC’s previous grant of conditional immunity. In connection with that investigation, inDecember 2009, the company received a Statement of Objections (“SO”) from the EC in relation to certain pastactivities alleged to have occurred during the approximately 18-month period from July 2004 to January 2006. AnSO is a confidential procedural document whereby the EC communicates its preliminary view in relation to apossible infringement of EU competition laws and other related matters, and allows the companies identified in thedocument to present arguments in response. The EC has also expressed a preliminary view questioning the grantingof immunity or leniency with respect to the matters set forth in the SO. The company filed its response to the SOwith the EC, and a hearing was held in June 2010. A final decision from the EC is expected during the first half of2011. The company continues to believe that it should be entitled to immunity.
If the EC were ultimately to determine to proceed with a decision in this case and to take the position in any suchdecision that the company is not entitled to immunity, then the EC can seek to impose fines on the company, which,if imposed, could be substantial. Under its existing fining guidelines, the EC has significant discretion indetermining the amount of any fine, subject to a maximum amount equal to 10% of a company’s worldwide revenueattributable to all of its products for the fiscal year prior to the year in which the fine is imposed. As such, if the ECwere to impose a fine, it is possible the fine could have a material adverse impact on the company’s consolidatedfinancial results in the particular reporting period in which imposed and, depending on the size of the fine and thecompany’s success in challenging it, a material adverse effect on the company’s consolidated financial position. Adecision regarding the matters referenced in the SO will not be taken by the EC until the close of the administrativeprocedure. Other than the potential imposition of fines, as described above, the company does not believe that thereporting of these matters or the cessation of the conduct has had or should in the future have any material adverseeffect on the regulatory or competitive environment in which it operates.
COLOMBIA-RELATED MATTERSDOJ Settlement. As previously disclosed, in March 2007, the company entered into a plea agreement with the
U.S. Department of Justice (“DOJ”) relating to payments made by the company’s former Colombian subsidiary to aColombian paramilitary group designated under U.S. law as a foreign terrorist organization. The company hadpreviously voluntarily disclosed these payments to the DOJ as having been made by its Colombian subsidiary toprotect its employees from risks to their safety if the payments were not made. Under the terms of the pleaagreement, the company pled guilty to one count of Engaging in Transactions with a Specially-Designated GlobalTerrorist Group without having first obtained a license from the U.S. Department of Treasury’s Office of ForeignAssets Control. The company agreed to pay a fine of $25 million, payable in five equal annual installments withinterest. In September 2007, the U.S. District Court for the District of Columbia approved the plea agreement. TheDOJ had earlier announced that it would not pursue charges against any current or former company executives.Pursuant to customary provisions in the plea agreement, the Court placed the company on corporate probation forfive years, during which time the company and its subsidiaries must not violate the law and must implement and/ormaintain certain business processes and compliance programs; violation of these requirements could result in settingaside the principal terms of the plea agreement, including the amount of the fine imposed. The company recorded acharge of $25 million in 2006 and paid the first four $5 million annual installments in September 2007, 2008, 2009and 2010, respectively. At December 31, 2010, the remaining $5 million installment payment, plus accrued interestof approximately $2 million, is included in “Accrued liabilities” on the Consolidated Balance Sheet. Accruedinterest is payable with the final installment payment.
Tort Lawsuits. Between June 2007 and April 2010, seven lawsuits were filed against the company by Colombiannationals in U.S. federal courts. These lawsuits assert civil tort claims under various laws, including the Alien TortStatute (“ATS”), 28 U.S.C. § 1350, the Torture Victim Protection Act, 28 U.S.C. § 1350 note, and state laws. Theplaintiffs in all seven lawsuits, either individually or as members of a putative class, claim to be persons injured, orfamily members or legal heirs of individuals allegedly killed or injured, by armed groups that received paymentsfrom the company’s former Colombian subsidiary. The plaintiffs claim that, as a result of such payments, thecompany should be held legally responsible for the alleged injuries. At present, claims are asserted on behalf of over3,000 alleged victims in the seven suits; plaintiffs’ counsel have indicated that they may add claims for additionalvictims to the litigation. The company also has received formal requests to participate in mediation in Colombiaconcerning similar claims, which could be followed by litigation in Colombia. Six of the ATS lawsuits seekunspecified compensatory and punitive damages, as well as attorneys’ fees and costs, and one of these also seekstreble damages and disgorgement of profits, although it does not explain the basis for those demands. The other ATS

64Chiquita Brands International, Inc. — 2010 Annual Report
lawsuit contains a specific demand of $10 million in compensatory damages and $10 million in punitive damagesfor each of the several hundred alleged victims in that suit. The seven ATS lawsuits have been centralized in theU.S. District Court for the Southern District of Florida for consolidated or coordinated pretrial proceedings (“MDLProceeding”). The company believes the plaintiffs’ claims are without merit and is defending itself vigorously.
Between March 2008 and April 2010, three additional tort lawsuits were filed against the company. Theplaintiffs in these lawsuits are American citizens who allege that they were kidnapped and held hostage by an armedgroup in Colombia, or that they are the survivors of American nationals kidnapped and/or killed by the same groupin Colombia. Similar to the ATS lawsuits described above, the plaintiffs contend that the company should be heldliable because its former Colombian subsidiary allegedly provided material support to the armed group. Theplaintiffs in these cases assert civil claims under the Antiterrorism Act (“ATA”), 18 U.S.C. § 2331, et seq., and statetort laws. These three ATA suits seek unspecified compensatory damages, treble damages, attorneys’ fees and costsand punitive damages. The lawsuits have been centralized in the U.S. District Court for the Southern District ofFlorida with the other similar cases pending in the MDL Proceeding. The company believes the plaintiffs’ claims arewithout merit and is defending itself vigorously.
Although the company previously filed motions to dismiss five of the ATS lawsuits, the court issued an orderpermitting plaintiffs to amend their complaints as a matter of course by late February 2010; plaintiffs in all five ATSactions filed amended complaints by the specified date. The company filed a consolidated motion to dismiss the fiveamended ATS complaints in April 2010. The company has also filed motions to dismiss the two most recently filedATS lawsuits and to dismiss the three ATA actions. In February 2010, the motion to dismiss one of the ATAactions, Julin v. Chiquita Brands International, Inc., was granted in part and denied in part. The company believes ithas strong defenses to the remaining claims in that case. There has been no decision on Chiquita’s motions todismiss the seven ATS actions or the two remaining ATA actions.
Insurance Recovery. The company maintains general liability insurance policies that should provide coverage forthe types of costs involved in defending the tort lawsuits described above. However, the company’s primary generalliability insurers whose policies are relevant to the underlying tort lawsuits have disputed their obligations to providecoverage.
In September 2008, the company filed suit in the Common Pleas Court of Hamilton County, Ohio against threeof its primary general liability insurers seeking (i) a declaratory judgment with respect to the insurers’ obligation toreimburse the company for defense costs that it has incurred (and will incur) in connection with the defense of thetort claims described above; and (ii) an award of damages for the insurers’ breach of their contractual obligation toreimburse the company for defense costs to defend itself in these matters. A fourth primary insurer, National UnionFire Insurance Company of Pittsburgh, PA (“National Union”), was later added to this case. In August 2009, thecompany reached a settlement agreement with one of the primary insurers under which this insurer has paid and willcontinue to pay a portion of defense costs.
In September 2009, the Court ruled that Chiquita’s primary insurers that did not settle have a duty to defend thetort lawsuits that include allegations that bodily injury or property damage occurred during the period of theirpolicies as a result of negligence on the part of Chiquita. The Court also ruled that the dispute about the number ofoccurrences that are involved in the underlying tort cases should be resolved by a trial.
In February 2010, Chiquita reached a settlement agreement with two of the remaining three primary insurersinvolved in the coverage suit, under which they have paid and will continue to pay a portion of defense costs.National Union, the one remaining primary insurer involved in the coverage suit which has not settled with Chiquita,has also paid a portion of defense costs, but has reserved the right to attempt to obtain reimbursement of thesepayments from Chiquita. A fifth primary insurer that is not a party to the coverage suits is insolvent.
Chiquita Brands International, Inc. — 2010 Annual Report65
After a trial, the Court ruled in October 2010 that the defense costs incurred by Chiquita in connection with theunderlying tort lawsuits and that were the subject of trial—with certain limited exceptions related to media-relatedactivity—were reasonable and that National Union was obligated to reimburse Chiquita for all defense costs notalready paid by other insurers. Pursuant to the Court’s order, National Union reimbursed Chiquita for the defensecosts not already paid by other insurers, but continues to reserve its rights to seek reimbursement from Chiquita inthe form of loss-sensitive premium, the amount of which is based in part on the number of occurrences. NationalUnion also has sought contribution from other primary insurers with whom Chiquita entered partial settlements. Thenumber of occurrences was the subject of the second phase of the trial involving National Union, which was held inNovember 2010. The Court has not yet issued its ruling on the number of occurrences or National Union'scontribution rights against the other primary insurers. Any resulting judgment could be appealed.
With the exception of the defense costs that, as described above, three of Chiquita’s primary insurers have agreedto pay pursuant to partial settlement agreements, there can be no assurance that any claims under the applicablepolicies will result in insurance recoveries.
Derivative Lawsuits. Between October and December 2007, five shareholder derivative lawsuits were filedagainst certain of the company’s current and former officers and directors in various state and federal courts. All fivecomplaints alleged that the named defendants breached their fiduciary duties to the company and/or wastedcorporate assets in connection with the payments that were the subject of the company’s March 2007 plea agreementwith the DOJ, described above. The complaints sought unspecified damages against the named defendants; two ofthem also sought the imposition of certain equitable remedies on the company.
In April 2008, the company’s Board of Directors established a Special Litigation Committee (“SLC”) toinvestigate and analyze the allegations and claims asserted in the derivative lawsuits and to determine what actionthe company should take with respect to them, including whether it was in the best interests of the company and itsshareholders to pursue these claims. The SLC retained independent legal counsel to assist with its investigation.After an investigation that included 70 interviews of 53 witnesses and the review of over 750,000 pages ofdocuments, the SLC determined, in the exercise of its business judgment, that it was not in the best interests of thecompany or its shareholders to continue legal action on any of the claims asserted against the current and formerofficers and directors.
The SLC subsequently entered into a settlement with plaintiffs’ counsel to resolve the pending derivativelitigation, and the settlement was approved by the United States District Court for the Southern District of Florida inOctober 2010. The settlement provides for the adoption of certain governance and compliance changes by thecompany, as well as the payment of attorneys’ fees to plaintiffs’ counsel, a portion of which was recovered throughinsurance.
Colombia Investigation. The Colombian Attorney General’s Office is conducting an investigation into paymentsmade by companies in the banana and other industries to paramilitary groups in Colombia. Included within thescope of the investigation are the payments that were the subject of the company’s March 2007 plea agreement withthe DOJ, described above. The company believes that it has at all times complied with Colombian law.
ITALIAN CUSTOMS CASES1998-2000 Cases. In October 2004, the company’s Italian subsidiary, Chiquita Italia, received the first of several
notices from various customs authorities in Italy stating that it is potentially liable for additional duties and taxes onthe import of bananas by Socoba S.r.l. (“Socoba”) from 1998 to 2000 for sale to Chiquita Italia. The customsauthorities claim that (i) the amounts are due because these bananas were imported with licenses (purportedly issuedby Spain) that were subsequently determined to have been forged and (ii) Chiquita Italia should be jointly liablewith Socoba because (a) Socoba was controlled by a former general manager of Chiquita Italia and (b) the importtransactions benefited Chiquita Italia, which arranged for Socoba to purchase the bananas from another Chiquitasubsidiary and, after customs clearance, sell them to Chiquita Italia. Chiquita Italia is contesting these claims,principally on the basis of its good faith belief at the time the import licenses were obtained and used that they werevalid.

66Chiquita Brands International, Inc. — 2010 Annual Report
Of the original notices, civil customs proceedings in an aggregate amount of €14 million ($19 million) plusinterest were ultimately brought and are now pending against Chiquita Italia in four Italian jurisdictions, Genoa,Trento, Aosta and Alessandria (for €7 million, €5 million, €2 million, and €0.4 million, respectively, plus interest).The Aosta case is still at the trial level; in the Genoa case, Chiquita Italia won at the trial level, lost on appeal, andappealed to the Court of Cassation, the highest level of appeal in Italy, where the case is pending; in the Trento andAlessandria cases, Chiquita Italia lost at the trial level, but the cases have been stayed pending a final resolution of acase in Rome. This Rome case was brought by Socoba (and Chiquita Italia intervened voluntarily) on the issue ofwhether the forged Spanish licenses used by Socoba should be regarded as genuine in view of the apparent inabilityto distinguish between genuine and forged licenses. In an October 2010 decision, the Rome trial court rejectedSocoba’s claim that the licenses should be considered genuine on the basis that Socoba had not sufficientlydemonstrated how similar the forged licenses were to genuine Spanish licenses. Socoba has one year to appeal thisdecision. In an unrelated case addressing similar forged Spanish licenses used in Belgium, the EU Commission hasruled that these types of licenses were such good forgeries that they needed to be treated as genuine, and ChiquitaItalia has brought this decision to the attention of the customs authorities in Genoa to seek relief in relation to thepending customs case. In Italy, each level of appeal involves a review of the facts and law applicable to the case andthe appellate court can render a decision that disregards or substantially modifies the lower court’s opinion.
Under Italian law, the amounts claimed in the Trento, Alessandria and Genoa cases have become due andpayable notwithstanding the pending appeals and stays of proceedings. In March 2009, Chiquita Italia began to paythe amounts due in the Trento and Alessandria cases, €7 million ($9 million), including interest, in 36 monthlyinstallments. In the Genoa case, Chiquita Italia began making monthly installment payments in March 2010 under asimilar arrangement for the amount due of €13 million ($17 million), including interest, but this payment obligationhas been temporarily suspended. If Chiquita Italia ultimately prevails in its appeals, all amounts paid will bereimbursed with interest.
2004-2006 Cases. In early March 2008, Chiquita Italia was required to provide documents and information tothe Italian fiscal police at its offices in Rome in connection with a criminal investigation into imports of bananas byChiquita Italia during 2004-2005, and the payment of customs duties on these imports. The focus of theinvestigation was on the importation process used by Chiquita to sell bananas to holders of some types of importlicenses, which holders in turn imported the bananas and resold them to Chiquita Italia. The company believes thatall of the transactions under investigation were legitimate under both Italian and EU law at all times, that the typesof transactions under investigation were widely accepted by competent authorities across the EU and by the EC, andthat all of the underlying import transactions were entirely genuine. The Italian prosecutors are pursuing this matter.If criminal liability is ultimately determined, Chiquita Italia could be civilly liable for damages, including applicableduties, taxes and penalties. The fiscal police investigation also challenged the involvement of a Bermuda corporationin the importation of bananas; this could result in liability for additional taxes and penalties. In December 2009 andNovember 2010, prior to expiration of the statute of limitations for the 2004 and 2005 tax years, respectively,Chiquita Italia received assessments from the tax authorities for those respective years in the amounts ofapproximately €20 million ($26 million) for 2004 and €25 million, ($33 million) for 2005, plus interest andpenalties, covering the above potential claims. Chiquita Italia filed an appeal to object to the assessment for 2004 inMay 2010 and has until late April 2011 to file an appeal of the 2005 assessment. Pending appeal, the 2004assessment has become due and payable, and in February 2011 Chiquita Italia began to make required installmentpayments for half of the amount assessed plus interest, which will involve making monthly payments over six-yearsof an aggregate of €13 million ($18 million); Chiquita Italia intends to seek a suspension of these payments. IfChiquita Italia ultimately prevails in these cases, all amounts paid will be reimbursed with interest.
Independent of the investigation by the Italian prosecutors, Italian customs authorities have issued assessmentnotices totaling €18 million ($23 million) plus interest related to the import license matter described above.Payment of these amounts has been suspended pending the outcome of the appeals.
Chiquita Italia continues to believe that it acted properly and that the transactions for which it received theassessments were legitimate and reported appropriately; it is vigorously defending all of the transactions at issue.

Chiquita Brands International, Inc. — 2010 Annual Report67
CONSUMPTION TAX REFUNDIn November 2007, the company received a favorable decision from a court in Turin, Italy, for the refund of
certain consumption taxes paid between 1980 and 1990. The company recognized other income of $9 million, or $6million net of tax, when this refund was received in 2008. In March 2008, the company received a favorabledecision from a court in Rome, Italy for the refund of certain consumption taxes paid between 1980 and 1990. TheItalian Finance Administration did not appeal the decision prior to May 2009, when their right to appeal expired. In2010, payment was received, and the company recognized other income of €3 million ($3 million or $2 million netof income tax). The company has a number of other similar claims pending in different Italian jurisdictions and anygains that may occur will be recognized as the related gain contingencies are resolved. The March 2008 Rome rulinghas no binding effect on pending claims in other jurisdictions, which may take years to resolve.
Note 20 – Relocation
In 2008, the company committed to relocate its European headquarters from Belgium to Switzerland tooptimize its long-term tax structure. The relocation, which was substantially complete at December 31, 2009,affected approximately 100 employees who were required to continue providing services until specified terminationdates in order to be eligible for a one-time termination benefit. Employees in sales offices, ports and other fieldoffices throughout Europe were not affected. In connection with the relocation, the company incurred aggregatecosts of $19 million through December 31, 2010, including approximately $11 million of one-time terminationbenefits and approximately $8 million of relocation, recruiting and other costs. Expense for one-time terminationbenefits was accrued over each individual’s required service period. Relocation and recruiting costs were expensedas incurred.
A reconciliation of the accrual for the relocation that is included in “Accrued liabilities” is as follows:
Relocation,One-Time Recruiting
Termination and(In thousands) Costs Other Costs Total
December 31, 2008 $ 3,884 $ 922 $ 4,806
Amounts expensed 6,951 5,125 12,076Amounts paid (9,947) (5,877) (15,824)Currency translation 58 - 58
December 31, 2009 946 170 1,116
Amounts paid (881) (170) (1,051)Currency translation (65) - (65)
December 31, 2010 $ - $ - $ -
Note 21 - Quarterly Financial Data (Unaudited)
The following quarterly financial data are unaudited, but in the opinion of management include all necessaryadjustments for a fair presentation of the interim results. The company’s results are subject to significant seasonalvariations and interim results are not indicative of the results of operations for the full fiscal year. The company’sresults during the third and fourth quarters are generally weaker than in the first half of the year due to increasedavailability of competing fruits and resulting lower banana prices, as well as seasonally lower consumption of saladsin the fourth quarter.

68Chiquita Brands International, Inc. — 2010 Annual Report
Per share results include the effect, if dilutive, of the assumed conversion of the Convertible Notes, options,warrants and other stock awards into common stock during the period presented. The effects of assumedconversions are determined independently for each respective quarter and year and may not be dilutive during everyperiod due to variations in net income (loss) and average stock price. Therefore, the sum of quarterly per shareresults will not necessarily equal the per share results for the full year. For the quarters ended December 31, 2010and 2009, the shares used to calculate diluted EPS would have been 45.9 million and 45.6 million, respectively, ifthe company had generated net income. For the quarter ended March 31, 2010 and September 30, 2010, the sharesused to calculate diluted EPS would have been 45.9 million and 45.6 million, respectively, if the company hadgenerated net income.
In the fourth quarter of 2010, the company recognized out of period adjustments primarily related to two items.One adjustment related to tariff costs of $5 million, of which $3 million should have been recognized in 2008 andearlier and the remainder in the first three quarters of 2010. The other related to insurance receipts of $2 millionrecognized in the first three quarters of 2010, which should have been recorded as a deferred gain. Theseadjustments decreased net income by $7 million in the fourth quarter of 2010. In the fourth quarter of 2009, thecompany identified advertising expenses related to the third quarter of 2009. The collective adjustments had aninsignificant effect on the annual and prior quarterly periods based on a quantitative and qualitative evaluation inrelation to all affected periods and line items.
2010(In thousands, except per share amounts) March 31 June 30 Sept. 30 Dec. 31
Net sales $ 808,329 $ 916,331 $ 729,706 $ 773,066Cost of sales 706,336 738,090 630,436 690,242Gross profit 101,993 178,241 99,270 82,824Operating income (loss) 7,583 106,711 6,335 (12,969)Income (loss) from continuing
operations (5,919) 94,642 (8,448) (19,652)Loss from discontinued
operations, net of income tax (3,268) - - -Net income (loss) (9,187) 94,642 (8,448) (19,652)
Net income (loss) per common share – basic:Continuing operations $ (0.13) $ 2.11 $ (0.19) $ (0.43)Discontinued operations (0.07) - - -
$ (0.20) $ 2.11 $ (0.19) $ (0.43)
Net income (loss) per common share – diluted:Continuing operations $ (0.13) $ 2.06 $ (0.19) $ (0.43)Discontinued operations (0.07) - - -
$ (0.20) $ 2.06 $ (0.19) $ (0.43)
Common stock market price:High $ 18.46 $ 16.85 $ 14.86 $ 14.59Low 14.01 11.59 11.52 11.18

Chiquita Brands International, Inc. — 2010 Annual Report69
2009(In thousands, except per share amounts) March 31 June 30 Sept. 30 Dec. 31
Net sales $ 841,566 $ 951,954 $ 797,471 $ 879,444Cost of sales 710,263 745,688 665,620 769,264Gross profit 131,303 206,266 131,851 110,180Operating income (loss) 33,557 108,671 23,286 (18,205)Income (loss) from continuing
operations 23,169 88,923 5,081 (25,965)Loss from discontinued
operations, net of income tax - - - (717)Net income (loss) 23,169 88,923 5,081 (26,682)
Net income (loss) per common share – basic:Continuing operations $ 0.52 $ 2.00 $ 0.11 $ (0.58)Discontinued operations - - - (0.02)
$ 0.52 $ 2.00 $ 0.11 $ (0.60)
Net income (loss) per common share – diluted:Continuing operations $ 0.51 $ 1.95 $ 0.11 $ (0.58)Discontinued operations - - - (0.02)
$ 0.51 $ 1.95 $ 0.11 $ (0.60)
Common stock market price:High $ 14.97 $ 10.96 $ 16.70 $ 18.98Low 4.41 6.63 10.02 14.75

70Chiquita Brands International, Inc. — 2010 Annual Report
Chiquita Brands International, Inc.SELECTED FINANCIAL DATA
(In thousands, except Year Ended December 31,per share amounts) 2010 2009 2008 2007 2006
FINANCIAL CONDITIONWorking capital $ 396,707 $ 355,000 $ 320,759 $ 259,592 $ 223,058Capital expenditures 65,542 68,305 63,002 62,529 57,652Total assets 2,067,146 2,044,826 1,988,185 2,384,239 2,461,909Capitalization:
Short-term debt 20,169 17,607 10,495 5,177 67,013Long-term debt 613,973 638,462 686,816 798,013 950,268Shareholders’ equity 739,988 660,303 524,401 846,293 841,439
OPERATIONSNet sales $ 3,227,432 $ 3,470,435 $ 3,609,371 $ 3,464,703 $ 3,265,794Operating income (loss)1 107,660 147,309 (281,117) 31,621 15,988Income (loss) from
continuing operations1 60,623 91,208 (330,159) (45,690) (56,128)(Loss) income from
discontinued operations,net of income tax (3,268) (717) 1,464 (3,351) (39,392)
Net income (loss)1 57,355 90,491 (328,695) (49,041) (95,520)
SHARE DATA2
Shares used to calculate netincome (loss) per commonshare – diluted 45,850 45,248 43,745 42,493 42,084
Net income (loss) percommon share - diluted:
Continuing operations $ 1.32 $ 2.02 $ (7.54) $ (1.14) $ (1.33)Discontinued operations (0.07) (0.02) 0.03 (0.08) (0.94)
$ 1.25 $ 2.00 $ (7.51) $ (1.22) $ (2.27)
Dividends declared per commonshare $ - $ - $ - $ - $ 0.20
Market price per common share:High $ 18.46 $ 18.98 $ 25.77 $ 20.99 $ 20.34Low 11.18 4.41 8.58 12.50 12.64End of period 14.02 18.04 14.78 18.39 15.97
1 Amounts presented for 2008 include a $375 million ($374 million after-tax) goodwill impairment charge in the Saladsand Healthy Snacks segment as discussed in Note 1.
2 Earnings available to common shareholders for the year ended December 31, 2007, used to calculate EPS are reducedby a deemed dividend to a minority shareholder in a subsidiary, resulting in an additional $0.06 net loss per commonshare.
See Note 3 to the Consolidated Financial Statements for information on acquisitions and divestitures. SeeManagement’s Discussion and Analysis of Financial Condition and Results of Operations for information related tosignificant items affecting operating income (loss) for 2010, 2009 and 2008.

Chiquita Brands International, Inc. — 2010 Annual Report71
Board of Directors Officers and Senior Operating Management
FERNANDO AGUIRRE FERNANDO AGUIRREChairman, President and Chief Executive Officer Chairman, President and Chief Executive Officer
KERRII B. ANDERSON1,2,3 MICHAEL J. BURNESSChair, Nominating & Governance Committee Vice President, Global Quality & Food SafetyFormer Chief Executive Officer,Wendy’s International, Inc. KEVIN R. HOLLAND
HOWARD W. BARKER, JR.Senior Vice President and Chief People Officer
Chair of the Audit CommitteeFormer Partner, KPMG LLP
JOSEPH M. HUSTONPresident, North America
WILLIAM H. CAMP1, 2
Chair of the Compensation & OrganizationBRIAN W. KOCHER
Development CommitteePresident, Europe and Middle East
Former Executive Vice PresidentArcher Daniels Midland Company (agricultural
MANUEL RODRIGUEZ
processing company and manufacturer of value-Senior Vice President, Government & International
added food and feed ingredients)Affairs and Corporate Responsibility Officer
ROBERT W. FISHER1, 4, 5 MICHAEL B. SIMS
Private InvestorSenior Vice President and Chief Financial Officer
Former President, Dole Food Company
TANIOS VIVIANI
CLARE M. HASLER-LEWIS3, 4
President, Global Innovation & Emerging Markets
Chair of the Food Innovation, Safety &
and Chief Marketing Officer
Technology CommitteeExecutive Director, Robert Mondavi Institute for
JAMES E. THOMPSON
Wine and Food Science
Senior Vice President, General Counsel andSecretary
WAHEED ZAMANSenior Vice President, Product Supply Organization
STEVEN P. STANBROOK2, 3
Chief Operating Officer - InternationalS.C. Johnson & Son, Inc.(manufacturer of consumer products)
1 Member of the Audit Committee2 Member of Compensation & Organization Development Committee3 Member of Nominating & Governance Committee4 Member of Food Innovation, Safety &Technology Committee5 Mr. Fisher has informed the company that he will not stand for re-election to the Chiquita Board of Directors at the 2011
Annual Meeting. Jeffrey N. Simmons has been selected as a nominee to succeed him.
JAIME SERRA2, 3
Senior Partner of Serra Associates International(consulting firm in law and economics) andPrincipal of The NAFTA Fund (private equity fund)Mexico�s former Undersecretary of Finance andsecretary of Trade and Industry

P U B L I C LY I S S U E D S E C U R I T I E SCommon Stock, par value $.01 per share71/2% Senior Notes due 201487/8% Senior Notes due 20154.25% Convertible Senior Notes due 2016
E XC H A N G E L I S T I N GNew York Stock ExchangeTrading Symbol: CQB
S H A R E H O L D E R S O F R E C O R DAs of April 1, 2011, there were 1,514 holdersof record of Common Stock.
A N N UA L M E E T I N GMay 26, 201110 a.m., Eastern Daylight TimeChiquita Center250 East Fifth Street, 28th FloorCincinnati, Ohio 45202
T R A N S F E R A G E N T A N D R E G I S T R A RF O R C O M M O N S T O C KWells Fargo Shareowner Services161 North Concord ExchangeSouth St. Paul, Minnesota 55075-1139(800) 468-9716(651) 450-4064
T R U S T E E – S E N I O R N O T E S( 7 1/2% A N D 8 7/8% S E N I O R N OT E SA N D 4 . 2 5 % CO N V E R T I B L E N OT E S )Wells Fargo Bank, National Association45 Broadway, 14th FloorNew York, New York 10006(212) 515-5244
I N V E S T O R I N Q U I R I E SFor other questions concerning your investment in Chiquita,contact Investor Relations at (513) 784-6366.
C O R P O R AT E G O V E R N A N C E A N DC O D E O F C O N D U C TChiquita has a Code of Conduct, which applies to allemployees, including our senior management and, to theextent applicable to their roles, our directors. We alsocomply with New York Stock Exchange (NYSE) governancerequirements. All of our directors other than the chairmanare independent.
The Investor Relations/Corporate Governance section ofwww.chiquitabrands.com provides access to:
î Code of Conduct
î Governance Standards and Policiesof the Board of Directors
î Charter of the Audit Committee
î Charter of the Compensation & OrganizationDevelopment Committee
î Charter of the Nominating & Governance Committee
î Charter of the Food Innovation, Safety& Technology Committee
î Standards for Director Independence
î Related Person Transactions Policy
î Chiquita’s filings with the SEC
H E L P L I N EChiquita’s Helpline provides its employees, its vendors, andother third parties with a means of reporting ethical or legalconcerns. The Helpline is available 24 hours a day, sevendays a week, and reports are accepted in any language.The Helpline can be accessed by phone at 1-888-749-1952or by web at www.MyComplianceReport.com usingAccess ID “CBI.” Persons who report concerns areprotected from retaliation.
C O M M O N S T O C K P E R F O R M A N C E G R A P HThe performance graph to the right compares Chiquita’scumulative shareholder returns over the periodDecember 31, 2006 through December 31, 2010, assuming$100 had been invested at December 31, 2006 in each ofChiquita Common Stock, the Standard & Poor’s 500 StockIndex and the Standard & Poor’s Midcap Food ProductsIndex. The calculation of total shareholder return is basedon the change in the price of the stock over the relevantperiod and assumes the reinvestment of all dividends.
S&P MidcapS&Pi i a
12.31.06 12.31.07 12.31.08 12.31.09 12.31.10
I N V E S T O R I N F O R M A T I O N
Chiquita Brands International, Inc., supportsresponsible use of forest resources.

PANTONE®
123 CPANTONE®
186 CPANTONE®
355 CPANTONE®
BLACK C
Word mark Fresh Express
CHIQUITA BRANDS
250 EAST FIFTH STREET, CINCINNATI , OH 45202T. 513.784.8000 F. 513.784.8030
www.chiquitabrands.com