cimat taller de modelos de capture y recaptura 2010 introduction
TRANSCRIPT

CIMAT Taller de Modelos de Capture y Recaptura
2010Introduction

• Gotelli defines a biological population as• A group of plants, animals, or other organisms, all of
the same species, that live together and reproduce• Turchin defines a population as
• A group of individuals of the same species • That live together in an area of sufficient size to
permit normal dispersal and migration behavior• In which population changes are largely determined
by birth and death processes
WHAT IS A POPULATION?

OTHER DEFINITIONS
• Geo-political Populations• e.g., people in Guanajuato, Mexico, etc.
• Study Population (or Statistical Population)• e.g., the fish in a study stream during 2009-2010
• Management Population• e.g., Desert Bighorn Sheep on Tiburon Island
Population Biology
Population Genetics
WHAT IS POPULATION BIOLOGY?

POPULATION GENETICS
• Genetic Diversity • Within• Across Populations
• Space and Time
• Change in allele frequencies within a population over time• Natural Selection• Genetic Drift: change in allele frequencies due to
random events in small populations• Founder Events• Bottlenecks

OTHER POPULATION DEFINITIONS
• Theoretical Evolutionary Studies • A group of individuals with a given allele• A group of individuals with a given phenotype

Population Biology
Population Ecology
WHAT IS POPULATION BIOLOGY?

POPULATION ECOLOGY
• How individuals within a population interact with their surrounding environment
• How this affects:• Distribution• Abundance• Growth and dynamics (i.e., rates of change) • Of populations over space and time

Population Biology
Population Ecology Population Genetics

Populations
Communities
Ecosystems
Global Systems
Individuals
Organs
Cells
Organelles
DNA
Evolution Ecology
Socio-Economics

• Each definition of a population refers to a collection of individuals
• We denote the total # of individuals in a population as N (population abundance)
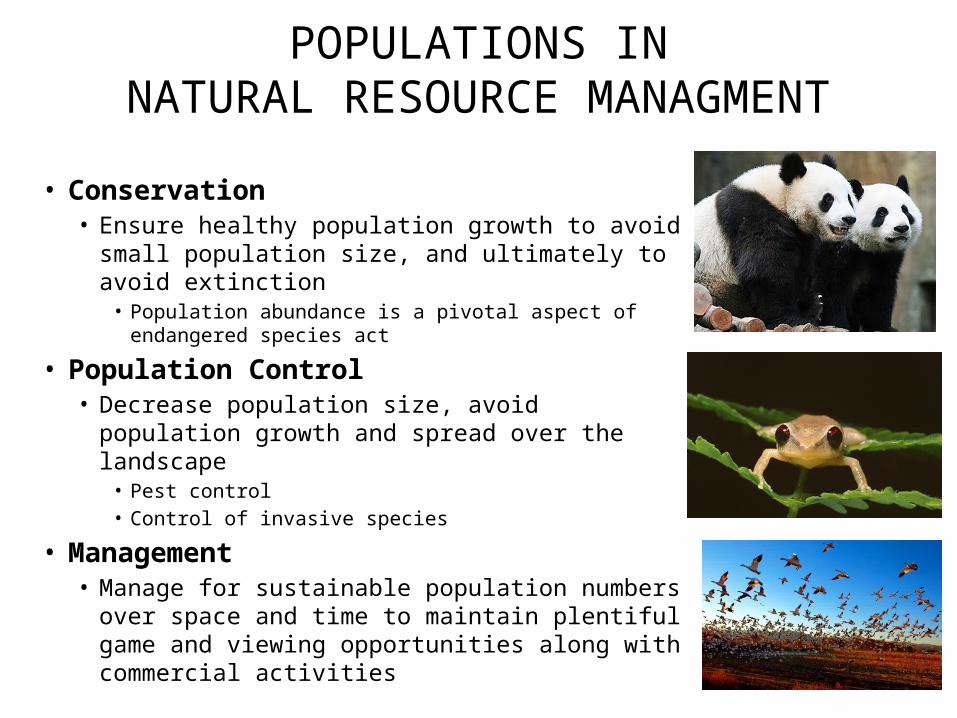
POPULATIONS INNATURAL RESOURCE MANAGMENT
• Conservation• Ensure healthy population growth to avoid small
population size, and ultimately to avoid extinction• Population abundance is a pivotal aspect of endangered
species act
• Population Control• Decrease population size, avoid population growth
and spread over the landscape• Pest control• Control of invasive species
• Management• Manage for sustainable population numbers over
space and time to maintain plentiful game and viewing opportunities along with commercial activities

POPULATIONS IN HUMAN SOCIETIES
• Innovation & Infrastructure• Within nations: more minds can lead to more innovators
• Societal infrastructure
• Demand for limited resources• More people, more demand for finite resources
• Cost of living • Quality of living
• Social Programs• Age structure (e.g., ratio of dependents to working age to retired)
• Stimulate or strain social gov. programs (e.g., social security)

irth
mmigration
eath
migration
There are only 4 processes that can affect N
Nfuture = Nnow + B + I – D – E

WHAT ARE MODELS FOR?
• “Essentially, all models are wrong, but some are useful” Box 1987
• How so?• By being a simplification of nature, a model
can never be exactly correct• Some can do a great job of explaining the
general patterns in nature• Simple enough to understand
WHAR ARE MODELS USEFUL FOR
• Force one to clearly state their assumptions• Force one to simplify nature so that it can be
understood• Useful learning tool, e.g., can be used to
project the consequences of different scenarios • For making predictions
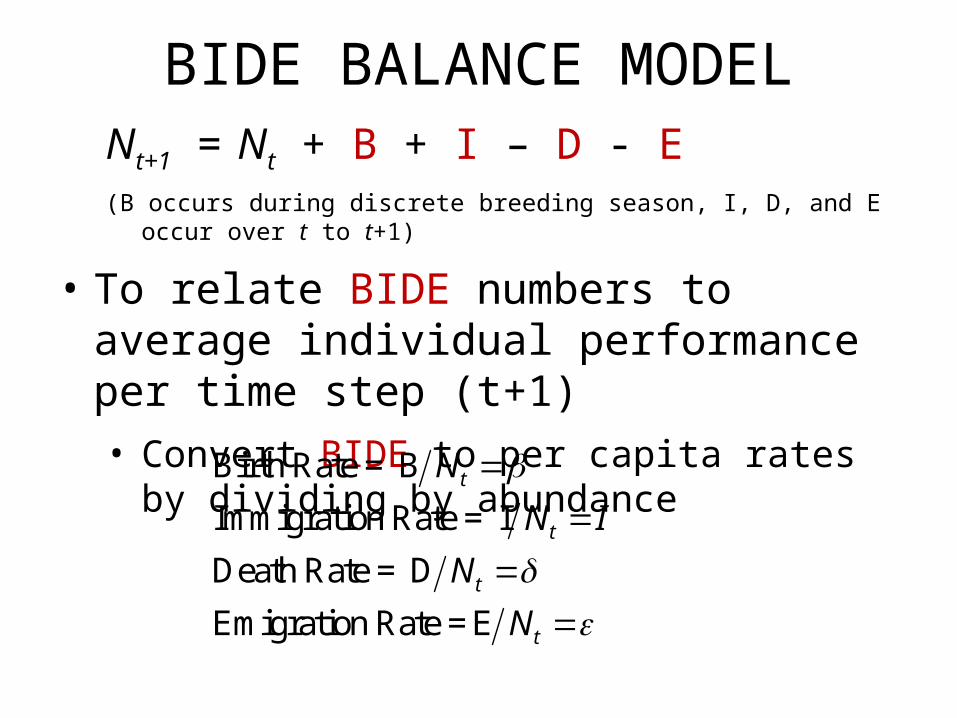
BIDE BALANCE MODELNt+1 = Nt + B + I – D - E (B occurs during discrete breeding season, I, D, and E occur over t to t+1)
• To relate BIDE numbers to average individual performance per time step (t+1)• Convert BIDE to per capita rates by dividing by
abundanceBirth Rate = B
Immigration Rate = I
Death Rate = D
Emigration Rate = E
t
t
t
t
N
N I
N
N

BIDE BALANCE MODEL• Substitute per capita rates into the model
• Divide by Nt
• Lambda (λ)• ‘geometric’ rate of growth (or decline) over a ‘finite’ time
interval (e.g., a year)
1 - -
1 - -t t t t t t
t
N N N IN N N
N I
1 1 - -t
t
NI
N

• There are 2 ways to estimate lambda:
• If one has an estimate of lambda, population abundance can be projected over time:
1
1
t
t
I
N
N
1
0
t t
tt
N N
N N
BIDE BALANCE MODEL

POPULATION HEALTH• Abundance is important
• More to population biology than just knowing how many there are
• Are there more than there used to be? • Are there fewer than there used to be?• How is the population doing? • Are they doing so well that they’re moving
into new areas, or is the range contracting?• Questions related to population
growth over time and space

BIDE ESTIMATION• Must follow the history of individuals
• Human Studies• Field Studies in the wild
• 2 Categories of Event Knowledge for an individual life history• Events are known with certainty
• Census, clinical trials, etc.
• Events are not known, but can be estimated conditional on other probabilities (detection probability)
• Captures of marked individuals

Survival curves for male subjects with Cystic Fibrosis (CF) but without diabetes (green, median survival 49.5 years), male subjects with CF and diabetes (blue, median 47.4 years), female subjects with CF but without diabetes (black, median 47.0 years), and female subjects with CF and diabetes (red, median survival 30.7 years).

Women's sample hazard functions of having the first child plotted against age by attractiveness groups.
24
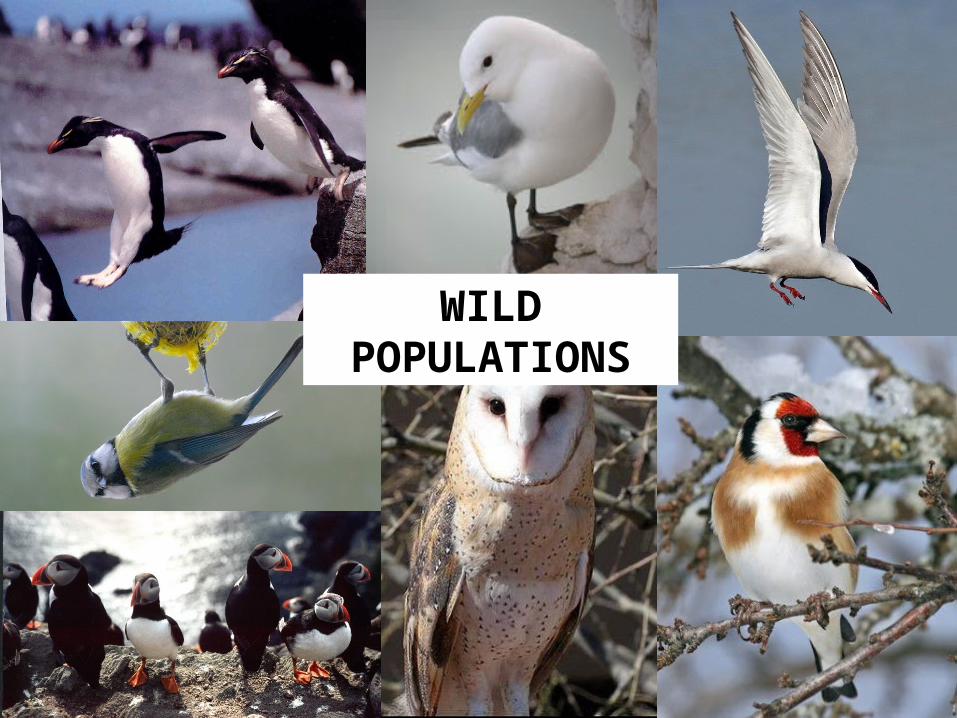
WILD POPULATIONS

25
How many children do you
have?
None of your business!
• Human demographers use surveys, census, etc
• What do population ecologists use?
IN THE WILD

BIDE ESTIMATION• Must follow the history of individuals
• Human Studies• Field Studies in the wild
• 2 Categories of Event Knowledge for an individual life history• Events are known with certainty
• Census, clinical trials, etc.
• Events are not known, but can be estimated conditional on other probabilities (detection probability)

27
CAPTURE-MARK-RECAPTURE
Band Recovery Satellite tracking
• And also radio-telemetry, number-tags, paint-tags, pit tags, etc.
• You can then estimate vital rates (survival, movement, growth…), population size, capture probabilities, and more

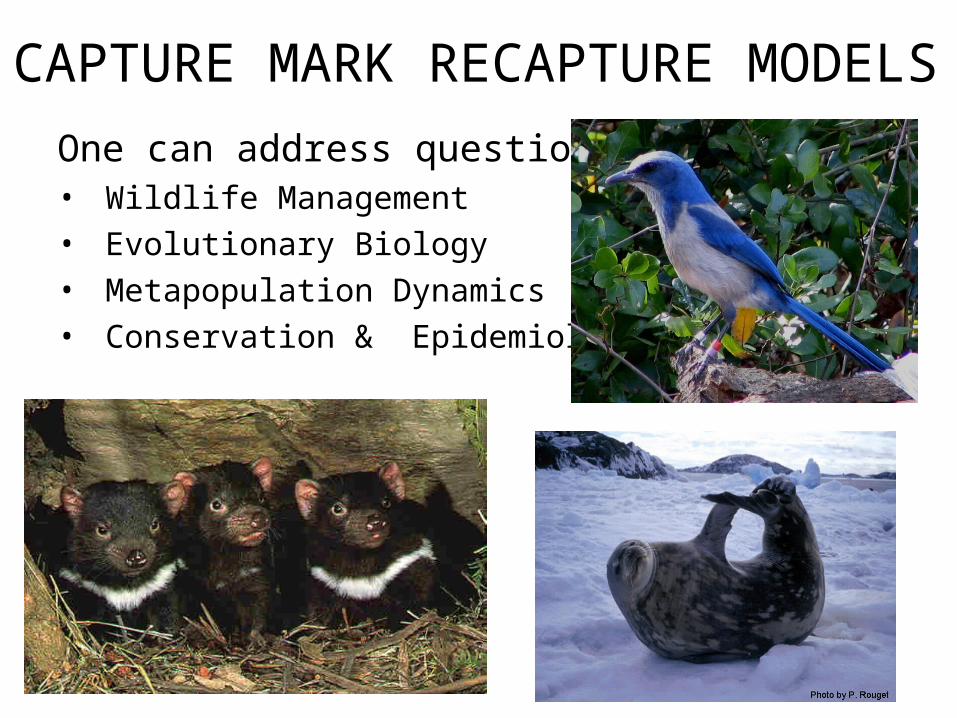
One can address questions in:• Wildlife Management• Evolutionary Biology• Metapopulation Dynamics • Conservation & Epidemiology
CAPTURE MARK RECAPTURE MODELS

APPLICATION IN MANAGEMENTSnow Goose Demography (Chen caerulescens caerulescens)
• Snow Geese at La Pérouse Bay Near Churchill, MB

APPLICATION IN MANAGEMENT
Snow Goose Demography
• Reproduction estimated by monitoring: • Egg production in nests• Probability of nests hatching young• Gosling survival up to fledging

• Survival estimated by: • Capturing thousands of geese each year (most years)• Banding them (USFWS leg band)
APPLICATION IN MANAGEMENT
Snow Goose Demography

• Survival estimated using:Recaptures of live banded geese and hunter recoveries of known-age banded
birds allows us to estimate age-specific survival
APPLICATION IN MANAGEMENT
Snow Goose Demography

SNOW GOOSE DEMOGRAPHY
• Age-specific Fertility and Survival for lesser snow geese (Chen caerulescens caerulescens)
• Studied by Fred Cooke, Rocky Rockwell, Evan Cooch , Dave Koons, Lise Aubry, and others
• LaPérouse Bay, Manitoba, Canada 1969-present
Age Class Fertility Survival
1 0 0.816
2 0.186 0.816
3 0.363 0.816
4 0.435 0.816
5 and older 0.504 0.816

SNOW GOOSE LIFE CYCLE MODEL
0.816
0.5040.4350.363
0.186
Age Class Fertility Survival
1 0 0.816
2 0.186 0.816
3 0.363 0.816
4 0.435 0.816
5 and older 0.504 0.816
1 2 3 4 5+0.816 0.816 0.816
0.816

1 ×
0 0.186 0.363 0.435 0.504 0
0.816 0 0 0 0 0
0 0.816 0 0 0 0
0 0 0.816 0 0 0
0 0 0 0.816 0.816 100
t t
N A N
0.816
0.5040.4350.363
0.186
1 2 3 4 5+0.816 0.816 0.816
0.816
1.10
SNOW GOOSE LIFE CYCLE MODEL
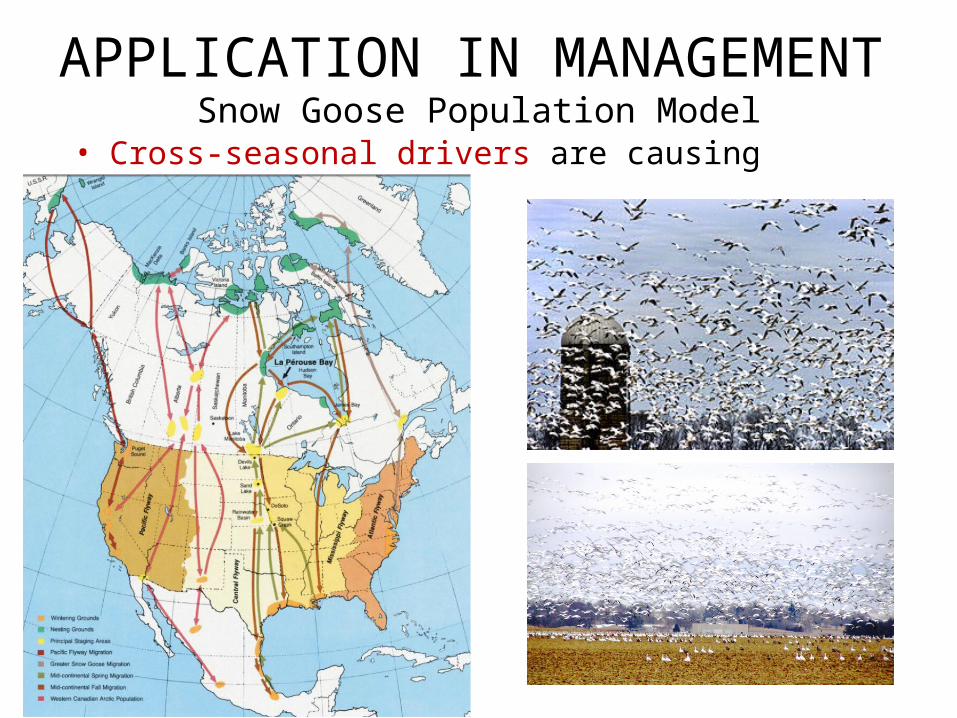
APPLICATION IN MANAGEMENT
Snow Goose Population Model• Cross-seasonal drivers are causing overpopulation

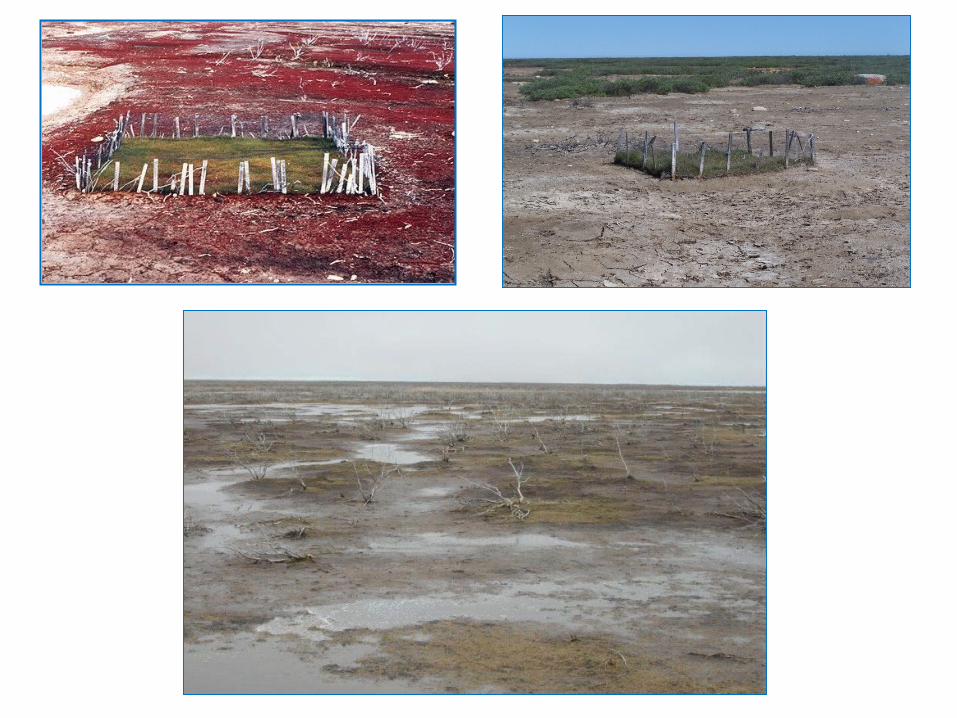
SNOW GOOSE EXAMPLE• Overpopulation of snow geese is
degrading arctic habitat
• Experienced adults now nesting and raising their goslings away from traditional nesting colony such that goslings can graze on higher quality saltmarsh grasses

APPLICATION IN MANAGEMENT
• Elasticity of population growth to survival probabilities = 0.83
• Elasticity of population growth to fertilities = 0.17• Population is almost 5 times more sensitive to
proportional changes in survival than it is to fertility

APPLICATION IN MANAGEMENT Snow Goose Population Model
• Rather than addling eggs• Reductions in adult survival (increased mortality) would be
more effective at controlling rapid and destructive population growth
• In an attempt to do just this, managers have liberalized harvest regulations• Try and increase harvest rates • Hopefully reduce survival by a large enough amount
• To stabilize or reverse the population trend• Has had some effect
• Now trying to compute the optimal kill rate required to decrease numbers and stabilize ecosystem dynamics

1. EVOLUTIONARY ECOLOGYWeddell seal study
G. Hadley, R. Garrott, J. Rotella, K. Proffitt (Montana State)
MORE EXAMPLES
2. METAPOPULATION DYNAMICSFlorida Scrub Jay
D.R. Breininger, J.D. Nichols, G.M. Carter, D.M. Oddy (Central Florida University)
3. EPIDEMIOLOGY & CONSERVATIONTasmanian Devil
S. Lachish, M. Jones, H. McCallum(Queensland/ Tasmania / Canberra University)
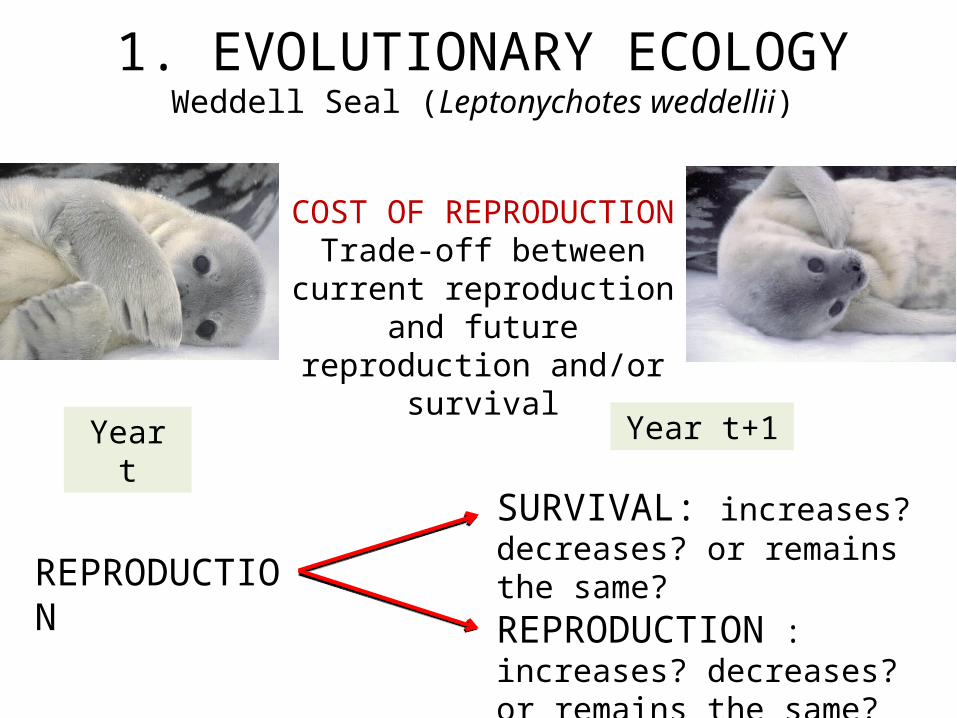
1. EVOLUTIONARY ECOLOGYWeddell Seal (Leptonychotes weddellii)
COST OF REPRODUCTIONTrade-off between current reproduction and future
reproduction and/or survival
SURVIVAL: increases? decreases? or remains the same?
REPRODUCTION : increases? decreases? or remains the same?
Year t Year t+1
REPRODUCTION

• DATA • Known-age reproductive females• 1979 to Present• 2 states:
• Breeding (B)• Non-breeding (N)
• COVARIATES OF INTEREST• AFR: age at first reproduction• Environmental Variability Breeding
Experience
THE STUDY
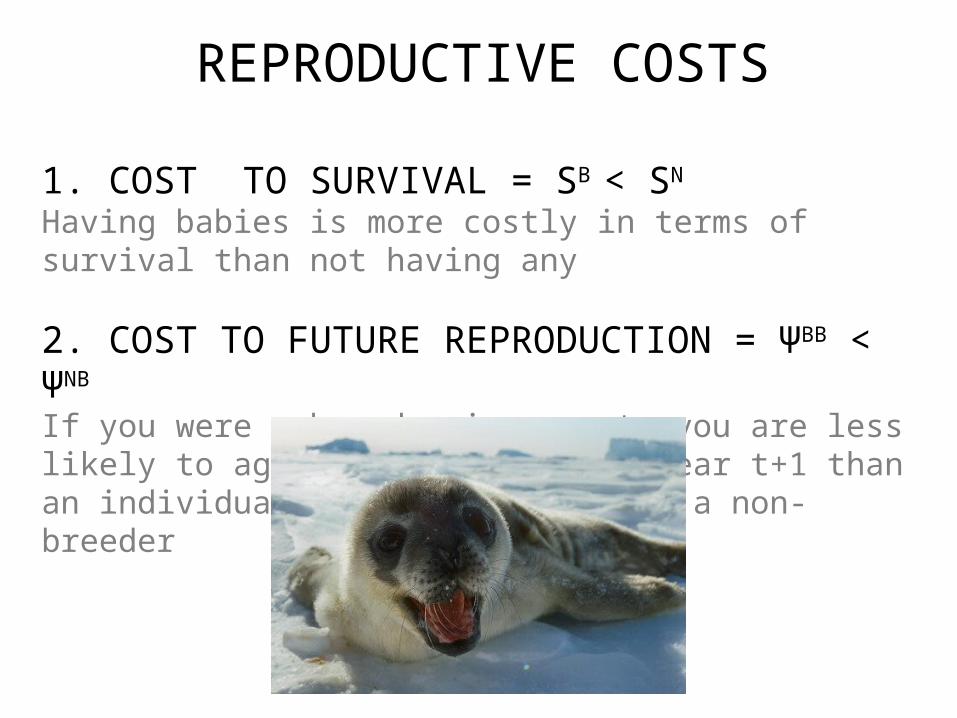
1. COST TO SURVIVAL = SB < SN Having babies is more costly in terms of survival than not having any
2. COST TO FUTURE REPRODUCTION = ΨBB < ΨNB
If you were a breeder in year t, you are less likely to again be a breeder in year t+1 than an individual that was previously a non-breeder
REPRODUCTIVE COSTS
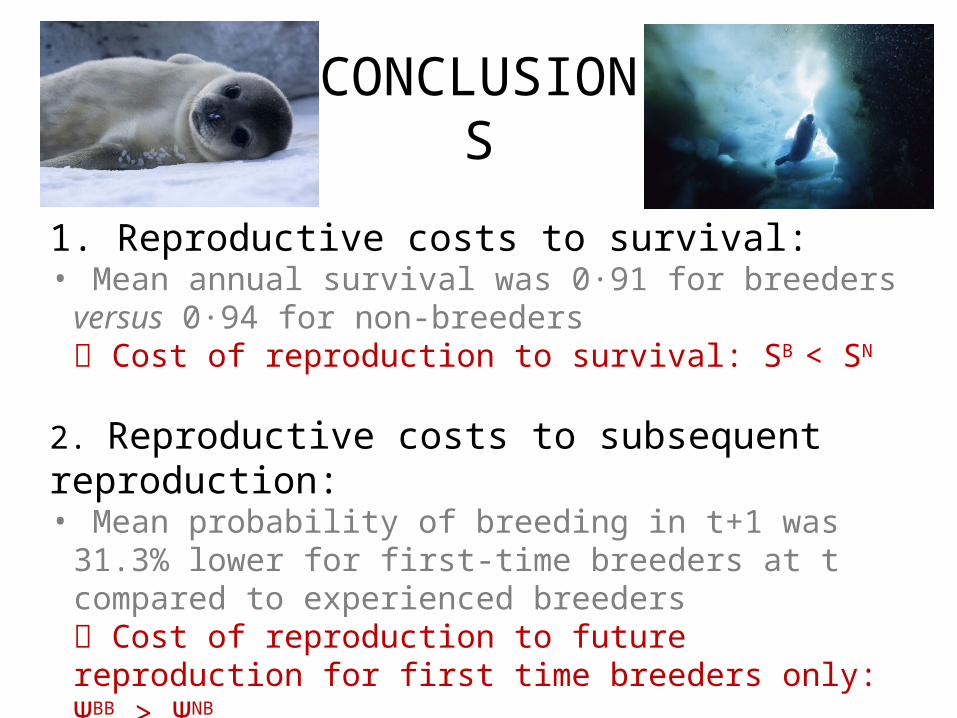
CONCLUSIONS
1. Reproductive costs to survival: • Mean annual survival was 0·91 for breeders versus 0·94 for non-
breeders Cost of reproduction to survival: SB < SN
2. Reproductive costs to subsequent reproduction: • Mean probability of breeding in t+1 was 31.3% lower for first-
time breeders at t compared to experienced breeders Cost of reproduction to future reproduction for first time breeders only: ΨBB > ΨNB
CONCLUSION: breeding experience helps!

• Habitat-specific demography in a territorial, philopatric and cooperative breeder
• Only bird endemic to Florida
• Exclusively lives in Florida scrub habitat• Nutrient poor habitat• Occasional droughts• Frequent fires
2. METAPOPULATION DYNAMICSFlorida Scrub Jay (Aphelocoma coerulescens)

• Birds marked from 1988 to present • Trapped with baited Potter traps, drop traps, and mist nests
• Monthly surveys:• Try to re-sight marked birds • Family composition • Breeding status (pair-bond behavior)• Habitat in territory locale
THE STUDY

• 4 Habitat types:‘Short’: burned within 3 years, sandy with sparse oak shrubs‘Optimal’: large sandy areas and patches of oak shrubs‘Tall mix’: short and medium high shrubs and patches of tall oak‘Tall’: connected shrub canopies
THE STUDY

OBJECTIVES
1. Estimating:• Habitat-specific survival probabilities • Habitat-specific recapture probabilities• Transition probabilities across habitat of different quality
In a frequently disturbed ecosystem (fire dynamics)

2. Disentangling bird movement across habitats of different quality from habitat quality changing as a result of disturbance
• Habitat dynamics: disturbances (e.g., fires, severe droughts)• Bird movement: processes of habitat selection (e.g., avoiding
a high predation environment, moving to a location where resources or more abundant)
OBJECTIVES

p Prediction does not exactly match results
RESULTS
Expected
Observed

RESULTSS Prediction matches results
Soptimal > Stallmix > Stall > Sshort
1.0 1.5 2.0 2.5 3.0 3.5 4.0
0.7
00
.75
0.8
00
.85
Habitat type
Su
rviv
al p
rob
ab
ilitie
s
1.0 1.5 2.0 2.5 3.0 3.5 4.0
0.7
00
.75
0.8
00
.85
Habitat type
Su
rviv
al p
rob
ab
ilitie
s
Short Optimal Short-mix Tall

RESULTS
Bird did not move much, but their habitat changed over time as a response to disturbances (mainly fires), which in turn influenced Scrub Jay demography
Ψ Predictions match results

RESULTS
• Survival was found to be highest in optimal habitats, however, in this study, only 27% of habitats were ‘optimal’
• Asymptotic distribution of habitats: 13% (short), 27% (optimal), 43% (tallmix), 17% (tall)
• For optimal habitats to become more available, occasional extensive fires might be needed

3. EPIDEMIOLOGY & CONSERVATIONTasmanian Devil (Sarcophilus harrisii)

3. EPIDEMIOLOGY & CONSERVATIONTasmanian Devil (Sarcophilus harrisii)
Cedric is the only devil that was infected with DFTD but showed positive immune response
Devil Facial Tumor Disease (DFTD) • Infectious cancer observed starting in 1996• Listed as vulnerable in may 2008• Fatal disease (die of starvation within 3-7 months)• Transmissible through social interactions• Spread over 60% of Tasmanian's habitats

• Estimate vital rates for infected and healthy devils• Force of infection (function of disease prevalence)• Population monitored since 1999, infected with
DFTD in 2001
THE STUDY

1. Impact of DFTD on sex- and age-specific survival
2. Variation in infection rates to a disease state (transition rate from healthy to diseased) in response to disease prevalence
3. Effect of DFTD on lambda
OBJECTIVES

• Ear marked / transponders
• Juveniles are excluded, • 1 and 2+ years old only
• 3 states: • healthy sub-adult (hsa) • healthy adult (ha)• diseased adult (da)
THE DATA

Survival for both sub-adults and adults declined as disease prevalence increased
Sub-adultsAdultsDFTD prevalence
RESULTS

Healthy sub-adults to diseased adultsHealthy adults to diseased adultsDFTD prevalence
As disease prevalence increased, the probability for healthy sub-adults to become diseased adults increased, but the probability of healthy adults to become infected was stable
RESULTS

CONCLUSIONS
• Initially all infections occurred in adults
• The majority of new infections appear to be occurring in recently matured adults
• In May 2009, the Australian government uplisted the Tasmanian devil from ‘vulnerable’ to ‘Endangered’ under national environmental law

• 2 Programs are ‘specialized’ in CMR models• MARK (US team)• M-surge/E-surge (French team)
• MARK is user friendly, not as flexible (constrained parameterization), and slow (big datasets)
• M-SURGE: slow start (GEMACO language), very flexible, fast (optimized algorithms)
IN PRACTICE

• Downloadable websites http://www.cefe.cnrs.fr/biom/En/softwares.htm
• Online books• MARK http://welcome.warnercnr.colostate.edu/class_info/fw663/Mark.html
• (Gary White & Evan Cooch)• M-SURGE http://www.cefe.cnrs.fr/biom/pdf/Choquet-M-SURGE-MANUAL-V1-8.pdf
(Remi Choquet)
• Online Help for both softwareshttp://www.phidot.org/forum/index.php
IN PRACTICE

• 2 R Packages• RMARK
• For Capture-Mark-Recapture (Jeff Laake & Erik Rexstad)• http://www.phidot.org/software/mark/rmark/
• UNMARKED • For habitat occupancy, distance estimation of abundance
(Ian Fiske and Richard Chandler)• http://crantastic.org/packages/unmarked
IN PRACTICE