city of north olmsted, ohio
TRANSCRIPT

CITY OF NORTH OLMSTED, OHIO
COMPREHENSIVE ANNUAL FINANCIAL REPORT
for the Year Ended December 31, 2010
Issued by the Department of Finance
Carrie B. Copfer, CPA Director of Finance
Jessica K. Howlett, CPA Assistant Director of Finance

Cover artwork courtesy of Alanna Shadrake, North Olmsted High School, Class of 2011
City of North Olmsted, Ohio
Comprehensive Annual Financial Report December 31, 2010
Issued by: Department of Finance Carrie B. Copfer, CPA, Director of Finance
Jessica K. Howlett, CPA, Assistant Director of Finance

INTRODUCTORYSECTION

City of North Olmsted, Ohio Comprehensive Annual Financial Report For the Year Ended December 31, 2010 Table of Contents Page
ii
I. Introductory Section Title Page ....................................................................................................................................................... i Table of Contents ..........................................................................................................................................ii Letter of Transmittal ....................................................................................................................................vi Organization Chart ......................................................................................................................................xii Principal City Officials ..............................................................................................................................xiii GFOA Certificate of Achievement ............................................................................................................xiv II. Financial Section Independent Auditors’ Report.......................................................................................................................1 Management’s Discussion and Analysis.......................................................................................................3 Basic Financial Statements: Government-wide Financial Statements: Statements of Net Assets................................................................................................................15 Statement of Activities...................................................................................................................16 Fund Financial Statements: Balance Sheet – Governmental Funds ...........................................................................................18 Reconciliation of Total Governmental Fund Balances to Net Assets of Governmental Activities ...............................................................................19 Statement of Revenues, Expenditures and Changes in Fund Balances – Governmental Funds .............................................................................................20 Reconciliation of the Statement of Revenues, Expenditures and Changes in Fund Balances of Governmental Funds to the Statement of Activities ...................................21 Statement of Revenues, Expenditures and Changes in Fund Balance Budget (Non-GAAP Basis) and Actual - General Fund..........................................................23 Statement of Revenues, Expenditures and Changes in Fund Balance Budget (Non-GAAP Basis) and Actual - Permanent Improvements Fund .............................24 Statement of Fund Net Assets – Proprietary Funds ...................................................................... .25 Statement of Revenues, Expenses and Changes in Fund Net Assets – Proprietary Funds ...............................................................................................26

City of North Olmsted, Ohio Comprehensive Annual Financial Report For the Year Ended December 31, 2010 Table of Contents Page
iii
Statement of Cash Flows – Proprietary Funds ...............................................................................27 Statement of Fiduciary Assets and Liabilities – Agency Fund ......................................................29 Notes to the Basic Financial Statements ..............................................................................................30 Combining Statements and Individual Fund Schedules: Combining Statements – Non-Major Funds: Fund Descriptions ..........................................................................................................................65 Combining Balance Sheet – Non-Major Governmental Funds......................................................68 Combining Statement of Revenues, Expenditures and Changes in Fund Balances – Non-Major Governmental Funds .................................................................69 Combining Balance Sheet – Non-Major Special Revenue Funds..................................................70 Combining Statement of Revenues, Expenditures and Changes in Fund Balances – Non-Major Special Revenue Funds .............................................................74 Combining Balance Sheet – Non-Major Debt Service Funds........................................................78 Combining Statement of Revenues, Expenditures and Changes in Fund Balances – Non-Major Debt Service Funds ...................................................................79 Combining Balance Sheet – Non-Major Capital Projects Funds ...................................................80 Combining Statement of Revenues, Expenditures and Changes in Fund Balances – Non-Major Capital Projects Funds...............................................................81 Combining Statement of Fund Net Assets – Non-Major Internal Service Funds ..........................82 Combining Statement of Revenues, Expenses and Changes in Fund Net Assets – Non-Major Internal Service Funds ...........................................................83 Combining Statement of Cash Flows – Non-Major Internal Service Funds..................................84 Individual Fund Schedules of Revenues, Expenditures/Expenses and Changes in Fund Balances/Fund Equities Budget (Non-GAAP Basis) and Actual: Major Funds: General Fund ...........................................................................................................................86 Permanent Improvements Fund...............................................................................................91 General Obligation Bond Retirement Fund.............................................................................92 Non-Major Funds: Casualty Loss Fund .................................................................................................................93

City of North Olmsted, Ohio Comprehensive Annual Financial Report For the Year Ended December 31, 2010 Table of Contents Page
iv
CDBG Fund.............................................................................................................................94 Alcohol Education Fund..........................................................................................................95 Economic Development Fund .................................................................................................96 FEMA Grant Fund...................................................................................................................97 Federal Grants Fund ................................................................................................................98 Motor Vehicle License Tax Fund ...........................................................................................99 Recreation Fund.....................................................................................................................100 Clague Park Fund ..................................................................................................................101 Hotel/Motel Tax Fund ...........................................................................................................102 Emergency Medical Services Fund .......................................................................................103 State Highway Fund ..............................................................................................................104 Street Maintenance Fund .......................................................................................................105 Solid Waste Management Fund.............................................................................................106 Community Diversion Fund ..................................................................................................107 Drug Enforcement Fund ........................................................................................................108 Endowment and Grant Fund..................................................................................................109 Fair Capacity Housing Fund .................................................................................................110 Fire Pension Fund..................................................................................................................111 Law Enforcement Fund .........................................................................................................112 Stop Program Fund................................................................................................................113 Police Pension Fund ..............................................................................................................114 Senior Center Fund................................................................................................................115 Title III Fund .........................................................................................................................116 Public Way Management Fund ............................................................................................117 Library Bond Retirement Fund..............................................................................................118 Special Assessment Bond Retirement Fund ..........................................................................119 Fire Station Bond Retirement Fund.......................................................................................120 Capital Improvements Fund ..................................................................................................121 Library Construction Fund ....................................................................................................122 Building and Land Acquisition and Improvement Fund .......................................................123 Issue I Fund ...........................................................................................................................124 Fire Construction Fund .........................................................................................................125 North Olmsted Municipal Bus Line (NOMBL) Fund ..........................................................126 Springvale Golf Course and Ballroom Fund .........................................................................127 Sewer Revenue Fund .............................................................................................................128 Hospitalization Fund..............................................................................................................129 Workers’ Compensation Fund ..............................................................................................130 Financial Statement – Fiduciary Fund: Fund Description..........................................................................................................................131 Statement of Changes in Assets and Liabilities Deposits Fund........................................................................................................................132

City of North Olmsted, Ohio Comprehensive Annual Financial Report For the Year Ended December 31, 2010 Table of Contents Page
v
III. Statistical Section Net Assets by Component – Last Eight Years .......................................................................................... 134 Changes in Net Assets – Last Eight Years ................................................................................................ 135 Fund Balances, Governmental Funds – Last Ten Years ...........................................................................139 Changes in Fund Balances, Governmental Funds – Last Ten Years ........................................................140 Assessed Valuations and Estimated Actual Values of Taxable Property – Last Ten Years .........................................................................................................................................................142 Income Tax Revenue Collections (Cash Basis) – Last Ten Years............................................................143 Property Tax Rates – Direct and Overlapping Governments – (Per $1,000 of Assessed Valuation) – Last Ten Years......................................................................................................144 Real Property Tax Levies and Collections – Last Ten Years....................................................................145 Principal Taxpayers – Real Estate Tax – 2010 and 2001..........................................................................146 Ratio of Outstanding Debt to Total Personal Income and Debt per Capita – Last Ten Years ........................................................................................................................................................147 Ratio of Net General Bonded Debt to Assessed Value and Net Bonded Debt Per Capita – Last Ten Years ............................................................................................................................148 Computation of Direct and Overlapping General Obligation Debt...........................................................150 Legal Debt Margin – Last Ten Years........................................................................................................151 Principal Employers – Last Ten Years......................................................................................................152 Demographic and Economic Statistics – Last Ten Years ........................................................................153 Full Time City Employees by Function or Program – Last Ten Years ....................................................154 Operating Indicators by Function/Program – Last Nine Years .................................................................155 Capital Assets Statistics by Function/Program – Last Nine Years ...........................................................157 Capital Assets by Function – Last Nine Years..........................................................................................158

vi
June 24, 2011 Honorable Kevin M. Kennedy Citizens of North Olmsted, Ohio And Members of City Council Ohio law (Ohio Administrative Code Section 117-2-03(B)) requires that all cities file annual audited financial reports prepared on a GAAP (Generally Accepted Accounting Principles) basis with the Auditor of State within six months of the close of each fiscal year. This report is published to fulfill that requirement for the fiscal year ended December 31, 2010. Management assumes full responsibility for the completeness and reliability of the information contained in this report, based upon a comprehensive framework of internal control that the City has established for this purpose. Because the cost of internal control should not exceed anticipated benefits, the objective is to provide reasonable, rather than absolute, assurance that the financial statements are free of any material misstatements. Ciuni & Panichi, Inc. (Certified Public Accountants and Business Advisors), have issued an unqualified (“clean”) opinion on the City of North Olmsted’s financial statements for the year ended December 31, 2010. The Independent Auditors’ Report is located at the front of the financial section of this report. Management’s discussion and analysis (MD&A) immediately follows the independent auditor’s report and provides a narrative introduction, overview and analysis of the basic financial statements. MD&A complements this letter of transmittal and should be read in conjunction with it.
PROFILE OF THE GOVERNMENT
Basic Information North Olmsted was once a part of the Connecticut Western Reserve, claimed by the state of Connecticut. Investors bought land from the state, sight unseen, and went west to divide it up and sell it to settlers. Aaron Olmstead was one of the early landowners, but he never lived here. His son, Charles Olmstead, owned much of the land along Butternut Ridge and sold plots to the pioneer settlers beginning in 1815. In 1820 Charles Olmstead offered his father’s library of 500 books to the community, then called Lenox, if they would change the name to Olmstead. They agreed, and the books, brought by oxcart from Connecticut, were used as a circulating library. The remaining 153 books are on display in the City’s library. Over the course of the years, the “a” was omitted and the city became known as “North Olmsted.” In 1908 the residents voted to incorporate, becoming a village. In 1951 North Olmsted became a city because it had a population of over 5,000 people. The rapid growth was attributed to returning World War II veterans looking to provide a suburban living for their families. At one time the City was considered the fastest growing city in Ohio because it more than doubled in size from 1950 to 1960 and doubled again in 1970. Since the 1970 census, the population of North Olmsted has stayed relatively constant. The 2010 census was 32,718 which represents a four percent decline from the 2000 census. The City is a suburban community located in Cuyahoga County in Northeastern Ohio, approximately 13 miles southwest of the downtown area of the City of Cleveland and approximately 18 miles southeast of the City of Lorain. The City is served by diversified transportation facilities. There is immediate access to three State and U.S. highways and interstate highways I-80 (the Ohio Turnpike) and I-480, with access to interstate highways I-90 and I-71 within five miles of the City. The City is served by Cleveland Hopkins

vii
International Airport, located within five miles of the City, and is adjacent to areas served by Conrail and Amtrak railroads.
The City of North Olmsted’s primary government consists of all funds and departments, which are not legally separate from the City and provide a full range of services including:
Police, Emergency Medical Services and Fire Protection Parks and Recreational Activities and Facilities 18 hole Golf Course and Historic Ballroom Senior Center and Related Programs Local Human Services - ministering to youth, disabled, seniors and needy families Planning and Zoning Committees Building Code Enforcement Waste Water Treatment Plant Processing of Sanitary Sewage Maintenance and Improvement of City Roads and Infrastructure Maintenance and Improvement of Storm and Sanitary Sewer Systems Administrative and Legislative functions including Council, Law, Finance, Human
Resources and Information Technology The City of North Olmsted operates under and is governed by its Charter, first adopted by the voters in 1959. The Charter has been and may be amended by the voters from time to time. The City is also subject to some general laws applicable to all cities. Under the Ohio Constitution, the City may exercise all powers of local self-government, and police powers to the extent not in conflict with applicable general laws. The Charter provides for a mayor-council form of government.
Legislative authority is vested in a seven-member Council, of whom three members are at-large and four members are from wards, all elected to four-year terms. The Council sets compensation of City officials and employees, and enacts ordinances and resolutions relating to City services, tax levies, appropriating and borrowing money, licensing and regulating businesses and trades, and other municipal purposes. The presiding officer is the President of Council, elected specifically to that office by the voters for a four-year term. The President of Council has no vote except in the event of a tie. The Charter establishes certain administrative departments and the Council may establish divisions of those departments or additional departments and has exercised that authority.
The City’s chief executive and administrative officer is the Mayor, elected by the voters specifically to that office for a four-year term. The other elected City officials are the Director of Finance and the Director of Law, each elected to a four-year term. All elected officials, except the Mayor and Director of Finance, serve part-time.
The Mayor has authority to appoint the directors of Public Safety, Public Service, Human Resources, Planning and Economic Development, certain City employees and members of a number of City boards and commissions. The Mayor generally may remove, without the concurrence of Council and in accordance with civil service and collective bargaining agreement requirements, all officers and employees he has appointed, except that directors of the aforementioned departments may only be removed with the concurrence of two-thirds of the members of Council. The Mayor may not remove officers and employees of Council, Finance or the Law departments.
The Mayor may veto any legislation passed by Council. A veto may be overridden by a two-thirds vote of all members of Council.
Component Unit The North Olmsted Commission on Paratransit, Inc. (N.O.C.O.P.) has been presented as a discretely presented component unit of the primary government, based on the significant services and resources provided by the City. A complete discussion of the City’s reporting entity is provided in Notes 1 and 21 of the basic financial statements.
viii
Budgetary Process A temporary appropriation resolution to control expenditures may be passed on or around January 1 of each year for the period January 1 to March 31. An annual appropriation measure must be passed by April 1 of each year for the period January 1 to December 31. Appropriations by fund must be within the estimated resources as certified by the County Budget Commission, and the total of expenditures and encumbrances may not exceed the appropriations at any level of control. Any revisions that alter the appropriations at the legal level of budgetary control must first by approved by City Council. Council may pass supplemental fund appropriations so long as the total appropriations by fund does not exceed the amounts set forth in the most recent Certificate of Estimated Resources. The City maintains budgetary control on a cash basis by department for salaries, other expenditures and debt service. Estimated expenditure amounts must be encumbered prior to the release of purchase orders to vendors or finalization of other contracts. Encumbrances that would exceed the available appropriation level are identified on an ongoing basis and are not approved or recorded until City Council authorizes additional appropriations or transfers. Unencumbered appropriations lapse at the end of each calendar year. Formal budgetary integration is employed as a management control device during the year for all funds consistent with statutory provisions. Appropriation amounts are as originally adopted, or as amended by City Council throughout the year by supplemental appropriations, which either reallocate or increase the original appropriated amounts. During the year, supplemental appropriation measures were legally enacted; however, none of these amendments were significant. The budgetary figures, which appear in the statement of budgetary comparisons, represent the original permanent appropriation and the final appropriations amounts, including all amendments and modifications.
FACTORS AFFECTING FINANCIAL CONDITION Summary of Local Economy The City is a suburban residential community and a commercial center for the western portion of the County and adjacent Lorain County. The City has actively promoted commercial, residential and light industrial development, and has established a City-wide community reinvestment area and participated in an enterprise zone within the County for that purpose, as hereinafter discussed in more detail. The largest commercial development in the City includes the Westfield Shopping Mall and the adjacent Great Northern Shopping Center, together constituting a 2.0 million square foot retail complex with approximately 225 stores, professional and medical offices and restaurants; the Great Northern Corporate Center I, II and III, a 267,000 square foot executive office complex; and the Great Northern Technology Center, a 144,000 square foot office complex. All of this development is located adjacent to an interchange on interstate highway I-480. The properties have been developed in phases over the past 35 years, and the businesses located in them now provide employment for approximately 6,500 persons. The local economy has developed and redeveloped around this area. In 2007 the Westfield Group made a significant improvement to the mall and its outlying restaurants and other properties to keep its status of top performing mall complexes. While the City has several larger taxpayers, it is not dependent on a single revenue source or a single taxpayer which is a strength during an economic downturn. The City Charter allows for 11.1 charter millage to be levied on property, which also is unique to cities. Additionally, the City, which currently offers residents 100 percent credit on up to two percent for taxes paid to their workplace city, can adjust that credit through an ordinance of Council. The local economy, which is a direct reflection of the region, state, national and global recession saw another year of dramatic declines in jobs and development, and an increase in many struggling businesses. Retail and automotive sales are major businesses in North Olmsted and they continued to suffer. This is evidenced in the two percent decline in total municipal income tax, though the net profit (corporate) income tax ended 23.5 percent below 2009. Unemployment was at nine and one-half percent in the county at the end of 2010.

ix
The County reduced real property tax values by seven percent, mirroring the market value decline. The number of home sales dropped again with the credit crisis and any improvements made to enhance value was limited as evidenced by the type of building permits being issued. The number of foreclosures stayed relatively unchanged from 2009 at approximately 200, which represents 1.64 percent of the 10,414 housing units and 1,664 condominiums. The State, in its effort to be more aggressive in its economic recovery while balancing a projected 8 billion dollar budget shortfall, has proposed significant cuts in its next biannual budget beginning July 1, 2011 that reduces local government funding. See Management’s Discussion and Analysis for a description of these reductions. Relevant Financial Policies Internal Control Management of the City is responsible for establishing and maintaining an internal control structure designed to ensure the assets of the government are protected from loss, theft or misuse and adequate accounting data is compiled to allow for the preparation of financial statements in conformity with generally accepted accounting principles. The internal control structure is designed to provide reasonable, but not absolute, assurance that these objectives are met. The concept of reasonable assurance recognizes that: 1) the cost of a control should not exceed the benefits likely to be derived; and 2) the valuation of costs and benefits requires estimates and judgments by management. All internal controls are designed within the above framework. Accordingly, we believe the City’s system of internal controls is adequate to safeguard assets and provide reasonable assurance of proper recording of transactions. Basis of Accounting This is the eighth year the City has prepared financial statements following GASB Statement 34, “Basic Financial Statements and Management’s Discussion and Analysis for State and Local Governments.” GASB 34 creates basic financial statements for reporting the City’s financial activities as follows:
Government-wide financial statements These statements are prepared on an accrual basis of accounting, which is similar to the basis of accounting followed by many businesses. The government-wide statements distinguish between those activities of the City that are governmental and those that are considered business-type activities. Fund financial statements These statements present information for individual major funds rather than by fund type. Nonmajor funds are presented in total in one column. Governmental funds use the modified accrual basis of accounting and include reconciliation to the governmental activities accrual information presented in the governmental-wide financial statements. Proprietary and fiduciary funds use the accrual basis of accounting. Statements of budgetary comparisons These statements present comparisons of actual information to the legally adopted budget. The budgetary basis as provided by law is based upon accounting for certain transactions on a basis of cash receipts, disbursements and encumbrances.
Debt Administration The Debt Service Fund accounts for the accumulation of resources for the payment of general long-term obligations. Revenue sources for these funds include receipts from property taxes and transfers from other funds consisting of income taxes, hotel/motel taxes, sewer user charges and golf user charges. The Mayor and his administration prioritize capital projects for which borrowings are required. City Council approves such borrowings for these purposes. Both the Administration and Council have been committed to borrowing for the prioritized list of current capital needs at an amount less than the City is retiring each year in general obligation debt so that each year the City’s total general obligation debt is declining. This is a general policy with the Mayor’s and City Council’s consideration of the impact of voted tax issues and self-supporting enterprise fund debt.

x
In April of 2006, the City of North Olmsted received a rating increase to an A1 rating from Moody’s Investor Service Inc. for limited tax and an Aa3 rating for unlimited tax. Fitch IBCA affirmed the City’s A+ rating in April 2006, and again in August 2009. In April of 2010, under pressure from the federal government, all three rating agencies adjusted the way municipal debts were rated to basing it on the likelihood of default, which is the standard for corporate debt. This will increase the market of potential municipal buyers, and theoretically, reduce the cost of borrowing due to the increased competition. The recalibration caused Moody’s Investor Services to raise the City’s rating to Aa2 on all outstanding debt, while Fitch raised the rating to AA-. Moody’s affirmed that rating in July 2010 for the general obligation bond issue and all the City’s outstanding debt. Major Initiatives The City, by partnering with the unions and other employee groups, obtained concessions between five to ten percent in wages and benefits, resulting in a more than $1.3 million savings in 2010. The City Charter was changed by a vote of the people taking the requirement of certain positions out of the Charter and allowing the Council to restructure the City departments and responsibilities to gain efficiencies. The Staffing for Adequate Fire and Emergency Response (SAFER) grant was awarded to the City through the Federal Emergency Management Agency that enabled the call back of four laid-off emergency responders with wages and benefits for two years and no city matching funds were required. The City issued bonds for $4,005,000 to retire 2007-2009 street improvement bond anticipation notes of $2,700,000. The remaining $1,015,000 was for 2010 street improvements and $290,000 for a sanitary sewer jet gap vac truck. A new National Pollutant Elimination Discharge System permit with requirements to improve both the collection system and plant by December 2014 was obtained by the City from the Environmental Protective Agency (EPA). Also an EPA loan for the necessary improvements to the collection system and plant renovation totaling $44 million was approved. The collection system will be bid out in fall 2011 with the plant to follow in 2012. Long-term Financial Planning The City does not have a formal long-term capital plan; however, the City is layering new borrowing for street improvements at $1,000,000 annually. The outstanding bonded street debt requirements are reduced substantially in 2013. The City currently does not have a formal long-range plan for fund balance accumulations, however, through prudent budget management, the General Fund balance at the end of the year was 11.36 percent of General Fund revenues. In the 2011 budget process, the city began a compensated absences fund and a twenty-seventh pay fund both with multiple year funding plans.
AWARDS AND ACKNOWLEDGEMENTS GFOA Certificate of Achievement The Government Finance Officers Association of the United States and Canada (GFOA) awarded a Certificate of Achievement for Excellence in Financial Reporting to the City of North Olmsted for its comprehensive annual financial report for the fiscal year ended December 31, 2009. This was the eleventh consecutive year that the city has achieved this prestigious award. In order to be awarded a Certificate of Achievement, a government unit must publish an easily readable and efficiently organized comprehensive annual financial report. This report must satisfy both generally accepted accounting principles and applicable legal requirements. A Certificate of Achievement is valid for a period of one year only. We believe that our current Comprehensive Annual Financial Report continues to meet the Certificate of Achievement Program’s requirements and we are submitting it to the GFOA to determine its eligibility for another certificate.


xii

City of North Olmsted, Ohio Principal City Officials December 31, 2010
xiii
Elected Officials Kevin M. Kennedy ............................................................................................................................................ Mayor Michael R. Gareau, Jr......................................................................................................................... Director of Law Carrie B. Copfer ............................................................................................................................Director of Finance Duane K. Limpert........................................................................................................................ President of Council Louis Brossard ....................................................................................................................................Council Ward 1 Paul R. Barker .....................................................................................................................................Council Ward 2 Nicole Dailey Jones.............................................................................................................................Council Ward 3 Lawrence R. Orlowski ........................................................................................................................Council Ward 4 Kevin G. Kearney............................................................................................................................ Council-At-Large Mark J. Mahoney ............................................................................................................................ Council-At-Large Angela Williamson.......................................................................................................................... Council-At-Large
Appointed Officials Cheryl Farver ............................................................................................................... Director of Human Resources Chase Ritenauer ............................................................................................... Director of Public Safety and Service Kimberly Wenger..................................................................................................Director of Planning Development
xiv

xv
This page intentionally left blank.

FINANCIALSECTION

Independent Auditors’ Report
Members of the City Council North Olmsted, Ohio We have audited the accompanying financial statements of the governmental activities, the business-type activities, the aggregate discretely presented component unit, each major fund, and the aggregate remaining fund information of the City of North Olmsted, Ohio (the “City”), as of and for the year ended December 31, 2010, which collectively comprise the City’s basic financial statements as listed in the table of contents. These financial statements are the responsibility of the City’s management. Our responsibility is to express opinions on these financial statements based on our audit. We conducted our audit in accordance with auditing standards generally accepted in the United States of America and the standards applicable to financial audits contained in Government Auditing Standards, issued by the Comptroller General of the United States. Those standards require that we plan and perform the audit to obtain reasonable assurance about whether the financial statements are free of material misstatement. An audit includes examining, on a test basis, evidence supporting the amounts and disclosures in the financial statements. An audit also includes assessing the accounting principles used and the significant estimates made by management, as well as evaluating the overall financial statement presentation. We believe that our audit provides a reasonable basis for our opinions. In our opinion, the financial statements referred to above present fairly, in all material respects, the respective financial position of the governmental activities, the business-type activities, the aggregate discretely presented component unit, each major fund, and the aggregate remaining fund information of the City as of December 31, 2010, and the respective changes in financial position and cash flows, where applicable, thereof and the respective budgetary comparison for the General Fund and Permanent Improvements Special Revenue Fund for the year then ended in conformity with accounting principles generally accepted in the United States of America. As described in Note 3, during the year ended December 31, 2010, the City implemented Governmental Accounting Standard Board (GASB) Statement No. 51, Accounting and Financial Reporting for Intangible Assets; GASB Statement No. 53, Accounting and Financial Reporting for Derivative Instruments; and GASB Statement No. 58, Accounting and Financial Reporting for Chapter 9 Bankruptcies.

Members of the City Council North Olmsted, Ohio
2
In accordance with Government Auditing Standards, we have also issued our report dated June 24, 2011 on our consideration of the City’s internal control over financial reporting and on our tests of its compliance with certain provisions of laws, regulations, contracts, and grant agreements and other matters. The purpose of that report is to describe the scope of our testing of internal control over financial reporting and compliance and the results of that testing, and not to provide an opinion on the internal control over financial reporting or on compliance. That report is an integral part of an audit performed in accordance with Government Auditing Standards and should be considered in assessing the results of our audit. The management’s discussion and analysis on pages 3 through 14 is not a required part of the basic financial statements but is supplementary information required by accounting principles generally accepted in the United States of America. We have applied certain limited procedures, which consisted principally of inquiries of management regarding the methods of measurement and presentation of the required supplementary information. However, we did not audit the information and express no opinion on it. Our audit was conducted for the purpose of forming opinions on the financial statements that collectively comprise the City’s basic financial statements. The introductory section, combining and individual nonmajor fund financial statements and schedules, and statistical section, are presented for purposes of additional analysis and are not a required part of the basic financial statements. The combining and individual nonmajor fund financial statements and schedules have been subjected to the auditing procedures applied in the audit of the basic financial statements and, in our opinion, are fairly stated in all material respects in relation to the basic financial statements taken as a whole. The introductory and statistical sections have not been subjected to the auditing procedures applied in the audit of the basic financial statements and, accordingly, we express no opinion on them.
Cleveland, Ohio June 24, 2011

City of North Olmsted Management's Discussion and Analysis (Unaudited)
For the Fiscal Year Ended December 31, 2010
3
The Management’s Discussion and Analysis of the City of North Olmsted’s financial performance provides an overall review of the City's financial activities for the year ended December 31, 2010. The intent of this discussion and analysis is to look at the City's financial performance as a whole; readers should also review the transmittal letter and the basic financial statements to enhance their understanding of the City's financial performance. Financial Highlights Key financial highlights for 2010 are as follows:
Total net assets are $68,364,490 at December 31, 2010, which represents a 16.1 percent increase from the prior year. This increase is primarily attributed to the completion of the Crocker/Stearns road project in 2010, in which $8,062,080 was contributed by Cuyahoga County and capitalized by the City.
Total expenses decreased by 6.3 percent in 2010 from 2009. A major factor in this decrease was the
impact of employee wage concessions made in 2010.
The City issued $4,005,000 in general obligation bonds for various purposes and received an Aa2 rating from Moody’s Investor Services on these bonds and on all of the City’s bonded debt.
Total liabilities decreased by $5,652,080 or 8.4 percent decrease from 2009 primarily from debt
service payments. Using This Comprehensive Annual Financial Report (CAFR) This annual report consists of a series of financial statements and notes to those statements. These statements are prepared and organized so the reader can understand the City of North Olmsted as a financial whole or as an entire operating entity. The statements proceed to provide an increasingly detailed look at our specific financial condition. The Statement of Net Assets and Statement of Activities provide information about the activities of the whole City, presenting both an aggregate view of the City's finances and a longer-term view of those assets. Major fund financial statements provide the next level of detail. For governmental funds, these statements tell how services were financed in the short term as well as what dollars remain for future spending. The fund financial statements also look at the City's most significant funds with all other non-major funds presented in total in one column.

City of North Olmsted Management's Discussion and Analysis (Unaudited)
For the Fiscal Year Ended December 31, 2010
4
Reporting the City of North Olmsted as a Whole Statement of Net Assets and Statement of Activities While this document contains information about the funds used by the City to provide services to our citizens, the view of the City as a whole considers all financial transactions and measures how the City did financially during fiscal year 2010. The Statement of Net Assets and the Statement of Activities include assets and liabilities using the accrual basis of accounting similar to the accounting method used by the private sector. The basis of this accounting takes into account all of the current year's revenues and expenses regardless of when the cash is received or paid. These two statements report the City's net assets and the changes in those assets. The changes in net assets are important because it tells whether, for the City as a whole, the financial position has improved or diminished. However, in evaluating the overall position of the City, non-financial information such as changes in the City's tax base and the condition of the City’s capital assets will also need to be evaluated. The Statement of Net Assets and the Statement of Activities are divided into the following categories:
Assets Liabilities Net Assets (Assets minus Liabilities) Program Revenue and Expenses General Revenues Net Assets Beginning and End of Year
Reporting the City of North Olmsted’s Most Significant Funds Fund Financial Statements The presentation of the City's major funds begins on page 18. Fund financial reports provide detailed information about the City's major funds based on the restrictions on the use of monies. The City has established many funds which account for the multitude of services, facilities and infrastructure provided to our residents. However, these fund financial statements focus on the City's most significant funds. In the case of the City of North Olmsted, the major governmental funds are the General Fund, Permanent Improvements Fund and General Obligation Bond Retirement Fund and the major enterprise funds are North Olmsted Municipal Bus Line (NOMBL) Fund, Springvale Golf Course and Ballroom Fund, and Sewer Revenue Fund.

City of North Olmsted Management's Discussion and Analysis (Unaudited)
For the Fiscal Year Ended December 31, 2010
5
Governmental Funds Most of the City's activities are reported in the governmental funds which focus on how money flows into and out of those funds and the balances left at year end available for spending in future periods. Governmental funds are reported using an accounting method called modified accrual accounting which measures cash and all other financial assets that are expected to be readily converted to cash. The governmental fund statements provide a detailed short-term view of the City's general operations and the basic services it provides. Government fund information helps one determine whether there are more or fewer financial resources that can be spent in the near future on services provided to our residents. The relationship (or differences) between governmental activities (reported in the Statement of Net Assets and the Statement of Activities) and governmental funds is reconciled in the financial statements. Proprietary Funds The City of North Olmsted maintains two different types of proprietary funds. Enterprise funds are used to report the same functions presented as business-type activities. The City uses enterprise funds to account for the operations of its municipal bus line, golf course and ballroom and sanitary sewer plant and system. Internal service funds are an accounting device used to accumulate and allocate costs internally among the City’s various functions. The City maintains this type of fund for its self-insurance of health related employee benefits and self-insurance of workers’ compensation. Because this predominately affects governmental rather than business functions, it has been included within the governmental activities in the government-wide financial statements. Proprietary fund financial statements provide the same type of information as the government-wide financial statements, only in more detail. The basic proprietary fund financial statements can be found beginning on page 25 of this report. Fiduciary Funds Fiduciary funds are used to account for resources held for the benefit of parties outside the government. Fiduciary funds are not reflected in the government-wide financial statements because the resources are not available to support the City’s own programs. The City of North Olmsted has only one agency fund to report within the fiduciary fund category. Agency funds are reported on a full accrual basis and only present a statement of assets and liabilities. Notes to the Financial Statements The notes provide additional information that is essential for a full understanding of the data provided in the government-wide and fund financial statements. The notes to the basic financial statements can be found starting on page 30 of this report. Other Information In addition to the basic financial statements and the accompanying notes, this report also presents certain other information that the City believes readers will find useful. After the notes to the basic financial statements, the combining statements referred to earlier in connection with nonmajor governmental funds are presented, as well as individual detailed budgetary comparisons for all funds. This information can be found starting on page 65 of this report.

City of North Olmsted Management's Discussion and Analysis (Unaudited)
For the Fiscal Year Ended December 31, 2010
6
The City of North Olmsted as a Whole The Statement of Net Assets looks at the City as a whole. Table 1 provides a summary of the City's net assets for 2010 compared to 2009.
Table 1 Net Assets
Governmental Activities Business-Type Activities Total 2010 2009 2010 2009 2010 2009 Assets: Current and Other Assets $ 31,842,736 $ 30,390,704 $ 1,404,583 $ 950,947 $ 33,247,319 $ 31,341,651 Capital Assets, Net 69,434,775 66,882,536 27,393,653 28,009,644 96,828,428 94,892,180 Total Assets 101,277,511 97,273,240 28,798,236 28,960,591 130,075,747 126,233,831 Liabilities: Current Liabilities 10,828,875 11,327,709 286,177 541,221 11,115,052 11,868,930 Long-term Liabilities 35,741,074 39,879,197 14,855,131 15,615,210 50,596,205 55,494,407 Total Liabilities 46,569,949 51,206,906 15,141,308 16,156,431 61,711,257 67,363,337 Net Assets: Invested in Capital Assets, Net of Related Debt 38,558,141 32,357,653 13,079,015 12,896,414 51,637,156 45,254,067 Restricted 11,995,201 12,112,003 - - 11,995,201 12,112,003 Unrestricted 4,154,220 1,596,678 577,913 (92,254) 4,732,133 1,504,424 Total Net Assets $ 54,707,562 $ 46,066,334 $ 13,656,928 $ 12,804,160 $ 68,364,490 $ 58,870,494 Net assets may serve over time as a useful indicator of a government’s financial position. For the City of North Olmsted, total assets exceed total liabilities by $68,364,490 as of December 31, 2010, which is a 16.1 percent increase from the prior year, or a $9,493,996 increase. At the end of the current year, the City of North Olmsted is able to report positive balances in all three categories of net assets. The largest portion of the City’s net assets (75.5 percent) reflects the investments in capital assets (land, construction in progress, buildings, improvements other than buildings, machinery and equipment, furniture and fixtures and infrastructure) less any related debt to acquire those assets that is still outstanding. These capital assets are used to provide services to the City’s citizens; consequently, these assets are not available for future spending. Although the City’s investment in its capital assets is reported net of related debt, it should be noted that resources needed to repay this debt must be provided from other sources since the capital assets themselves cannot be used to liquidate these liabilities.

City of North Olmsted Management's Discussion and Analysis (Unaudited)
For the Fiscal Year Ended December 31, 2010
7
Total assets for 2010 increased by $3,841,916 or 3.0 percent when compared to 2009. Current assets increased by $1,905,668 or 6.1 percent from 2009. The increase in total assets was mainly due to capital asset additions, including the Crocker/Stearns road project that was completed in 2010. The net affect of depreciation, additions and deletions on governmental activities was an increase of $2,552,239. Business-type activities capital assets decreased by $615,991, which is primarily attributed to the accumulated depreciation on capital assets of the sanitary sewer plant and system exceeding the additions and deletions. The City’s total liabilities decreased $5,652,080 from 2009 to 2010. The total current liabilities declined by $753,878, primarily from a decrease in accounts payable, which is a result of permanent improvement and water treatment plant design contracts being completed in 2010 and a decline in unearned revenue, which is a result of decreased property tax collections. Total long term liabilities decreased by $4,898,202 which can be attributed to the annual debt service payments offset by additional borrowing for capital projects for both governmental and business-type activities. In order to further understand what makes up the changes in net assets for the current year, Table 2 provides further details regarding the results of activities for the current year.

City of North Olmsted Management's Discussion and Analysis (Unaudited)
For the Fiscal Year Ended December 31, 2010
8
Table 2 Changes in Net Assets
Governmental Activities Business-Type Activities Total 2010 2009 2010 2009 2010 2009 Revenues: Program revenues: Charges for services $ 3,898,794 $ 3,821,114 $ 8,074,799 $ 7,657,348 $ 11,973,593 $ 11,478,462 Operating grants and contributions 1,857,890 1,696,873 - - 1,857,890 1,696,873 Capital grants and contributions 8,162,080 800,379 71,428 124,197 8,233,508 924,576 Total program revenues 13,918,764 6,318,366 8,146,227 7,781,545 22,064,991 14,099,911 General revenues: Property taxes and other taxes 9,895,600 11,020,701 - - 9,895,600 11,020,701 Municipal income taxes 12,142,212 12,239,390 - - 12,142,212 12,239,390 Grants and entitlements 3,954,223 3,462,553 - - 3,954,223 3,462,553 Other 85,191 107,974 - - 85,191 107,974 Total general revenues 26,077,226 26,830,618 - - 26,077,226 26,830,618 Total revenues 39,995,990 33,148,984 8,146,227 7,781,545 48,142,217 40,930,529 Program expenses: General government 3,276,027 3,900,267 - - 3,276,027 3,900,267 Security of persons and property 11,627,831 12,806,773 - - 11,627,831 12,806,773 Public health welfare 467,464 536,943 - - 467,464 536,943 Transportation 9,184,733 9,493,814 - - 9,184,733 9,493,814 Basic utility services 2,246,112 2,111,966 - - 2,246,112 2,111,966 Leisure time activities 2,519,617 2,493,927 - - 2,519,617 2,493,927 Economic development 377,094 548,066 - - 377,094 548,066 Interest and fiscal charges 1,580,084 1,754,255 - - 1,580,084 1,754,255 NOMBL - - - 13,158 - 13,158 Springvale - - 1,403,969 1,337,078 1,403,969 1,337,078 Sewer - - 5,965,290 6,251,896 5,965,290 6,251,896 Total program expenses 31,278,962 33,646,011 7,369,259 7,602,132 38,648,221 41,248,143 Change in net assets before transfers 8,717,028 (497,027) 776,968 179,413 9,493,996 (317,614) Transfers (75,800) (27,781) 75,800 27,781 - - Change in net assets 8,641,228 (524,808) 852,768 207,194 9,493,996 (317,614) Net assets, beginning of year 46,066,334 46,591,142 12,804,160 12,596,966 58,870,494 59,188,108 Net assets, end of year $ 54,707,562 $ 46,066,334 $ 13,656,928 $ 12,804,160 $ 68,364,490 $ 58,870,494

City of North Olmsted Management's Discussion and Analysis (Unaudited)
For the Fiscal Year Ended December 31, 2010
9
Governmental Activities
Overall, total governmental activities revenues increased by $6,847,006. Program revenues represent 34.8 percent of the total governmental activities revenues. This includes charges for services and both operating and capital grants. Program revenues increased in 2010 by $7,600,398. The increase in program revenues is primarily due to capital grants and contributions of $8,162,080, of which $8,062,080 was contributed by Cuyahoga County for the completion of the Crocker/Stearns road project in 2010 and capitalized by the City. General revenues represent the other 65.2 percent of total governmental activities with municipal income taxes at 30.4 percent, property and other local taxes at 24.7 percent and grants, entitlements and other miscellaneous revenues representing the remaining 10.1 percent. General revenues declined in 2010 by $753,392. Property taxes decreased by $1,125,101 or 10.2 percent, which represents the decline in real property values for tax year 2009 as well as recession conditions. Municipal income taxes declined by $97,178 or 1.0 percent from 2009 which is a direct result of the economic recession. Grants and entitlements increased by $491,670 or 14.2 percent in 2010. This is primarily due to an increase in estate tax revenues in 2010. Other general revenues decreased by $22,783 in 2010 primarily from reduced investment earnings from the low investments rates on all sources of allowable investments throughout 2010. Overall, total program expenses decreased by 7.0 percent from 2009 or $2,367,049. With the exception of leisure time activities and basic utility services, all functional expenses declined due to the effect of employee wage concessions, and the limit on all but critical capital equipment purchases, materials and supplies, and outside services. General government represents 10.5 percent of program expenses. This includes all the general governmental expenses used by the entire City such as council, mayor administration, finance, law, etc. These expenses decreased by 16.0 percent. In addition to the aforementioned, savings on wages and benefits were achieved from employee wage concessions in 2010. Security of persons and property represent 37.2 percent of program expenses. This includes the cost of the police, dispatch, fire and paramedic services. A 9.2 percent decline, $1,178,942, from 2009 represents a savings in wages and benefits from the wage concessions in effect during 2010. Transportation expenses, which represent 29.3 percent of program expenses, decreased by 3.3 percent from the prior year. This includes the cost of providing all public works services such as street and storm channel maintenance and improvements, public property maintenance, snow removal, brush removal and equipment maintenance. Program expenses decreased as a result of employee wage concessions, offset by an increase in road maintenance supplies including salt. Leisure time activities represent 8.1 percent of program expenses. This is the cost of operating the recreation center and parks, recreational programs and programs provided to senior citizens. Despite stringent management of spending in 2010, leisure time activities increased by 1.0 percent due to $40,000 in emergency repairs to equipment at the recreation center. Interest and fiscal charges on debt service are 5.1 percent of program expenses. They ended 9.9 percent less as debt service payments represent more principal and less interest each year.

City of North Olmsted Management's Discussion and Analysis (Unaudited)
For the Fiscal Year Ended December 31, 2010
10
Business Type Activities Charges for services are the primary source of program revenues for the business type activities. The municipal bus line (NOMBL) has not operated since 2005, but has not been liquidated due to special assessments still owed on the City land. The Springvale Golf Course and Ballroom (Springvale) has both golf and event revenues. The sewer plant and collection system operations (WWTP) represent the largest share of the charges for services. The City is in year three of a five year rate plan increase. Even with the 9.5 percent rate increase in 2010 over 2009, program revenues only went up 4.7 percent, illustrating the decline in WWTP volume in 2010. Despite a 5 percent increase in Springvale expenses, business type activity expenses decreased in 2010 by 3.1 percent or $232,873 from the prior year. Both Springvale and WWTP were not immune from the constraints required on materials and supplies and contractual services due to the economic recession. Wage concessions also applied to employees in these business type activities as well. The increase in Springvale expenditures was due to increased part time staffing levels and supplies required to meet increased golf outing activity in 2010. Additionally, course improvements of approximately $30,000 were made during 2010. Financial Analysis of the City’s Funds The City of North Olmsted uses fund accounting as mandated by governmental legal requirements. The importance of accounting and reporting using this method is to demonstrate compliance with these finance related requirements. Governmental Funds The focus of the City’s governmental funds is to provide information on near-term inflows, outflows, and balances of spendable resources. Such information is useful in assessing the City’s financing requirements. In particular, unreserved fund balance may serve as a useful measure of a government’s net resources available for spending at the end of the fiscal year. Information about the City’s governmental funds begins on page 18. These funds are accounted for by using the modified accrual basis of accounting. As of December 31, 2010, the City’s governmental funds reported combined ending fund balances of $14,850,300. Of that amount, $13,555,957 constitutes unreserved fund balances, which is available for spending at the government’s discretion. The $1,294,343 of fund balance is reserved to indicate that it is not available for new spending because it has already been committed to liquidate contracts and purchases of the prior period and for advances to other funds. All governmental funds had total revenues of $31,546,296 and expenditures of $34,877,818, leaving a deficiency of revenues under expenditures of $3,331,522. After consideration of $3,888,192 in other financing sources and uses, the current year income was $556,670. The General Fund is the most significant fund as it is the source for providing a significant portion of major governmental activities such as police, fire, service, legislative and administrative functions. In 2010, the General Fund had total revenues of $18,342,983 and expenditures of $17,360,411 resulting in an increase in fund balance of $902,901, after consideration of $79,671 in net other financing uses, for an ending General Fund balance at December 31, 2010 of $4,491,661. General Fund revenues decreased from the prior year

City of North Olmsted Management's Discussion and Analysis (Unaudited)
For the Fiscal Year Ended December 31, 2010
11
revenues by 1.1 percent or $202,307 and expenditures were $725,979 less than last year’s expenditures, a 4.0 percent decrease. Property tax revenues declined by 7.6 percent as the assessed valuation of properties in the City were reduced by 7%. Municipal income taxes decreased by 3.8 percent, which is attributable to the economic recession. Intergovernmental revenues increased by 18.3 percent, which was primarily due to a $345,186 increase in estate taxes received in 2010. Charges for services increased by 6.2 percent as charges were evaluated and adjusted where possible and EMS runs increased by 3.5 percent. Wage concessions were in effect for all employees in 2010 along with major spending reductions on fuel, materials and supplies and contractual services. Where possible the city broadened the use of special revenue funds to transfer operating costs from the general fund. The largest areas affected were general government, security of persons and property and transportation. The Permanent Improvements Fund accounts for 15 percent of the municipal income tax receipts and expenditures for the permanent improvement of streets and storm sewer system. In 2010, the Permanent Improvements Fund had total revenues of $1,776,215 and expenditures of $4,273,662 resulting in a decrease in fund balance of $164,645, after consideration of $2,332,802 in net other financing sources, for an ending fund balance at December 31, 2010 of $2,081,869. Revenues in 2010 decreased by $282,169 from the prior year as local share monies from the county for the completed Dover Road resurfacing project were mostly received in 2009, and 3.9 percent less was collected in income tax due to the economic recession. Expenditures increased from the prior year as another year’s worth of notes were borrowed to perform street improvements; bonds were then issued in 2010. The General Obligation Bond Retirement Fund accounts for resources that are used for payments of principal and interest and fiscal charges on general obligation debt. In 2010, the General Obligation Bond Retirement Fund had total revenues of $3,151,364 and expenditures of $4,780,416 resulting in an increase in fund balance of $144,764, after consideration of $1,773,816 in net other financing sources, for an ending fund balance at December 31, 2010 of $2,802,057. The General Obligation Bond Retirement fund revenues decreased in 2010 by $222,311 primarily from significantly lower property tax and homestead and rollback receipts due to the 7 percent decline in property valuations. The expenditures and transfers in are set by the bonds and are comparable to the prior year in total, though more principal and less interest was paid in 2010. General Fund Budgeting Highlights The City's budget is prepared according to Ohio law and is based on accounting for certain transactions on a basis of cash receipts, disbursements, and encumbrances. The most significant budgeted fund is the General Fund. The City amended its General Fund budget at various times throughout fiscal year 2010. All recommendations for budget amendments are initially presented to the Finance Committee of City Council for review before they are presented to the whole Council for Ordinance enactment on the change. Budgetary modifications between the legal level of control categories may only be made by resolution of the City Council. The City allows intra-department budget modifications if they are within the same legal level of control category. The General Fund supports many of the City’s major activities such as the police, fire and service departments, as well as most legislative and administrative activities. The General Fund is monitored closely, looking for possible revenue shortfalls or potential overspending by individual departments.

City of North Olmsted Management's Discussion and Analysis (Unaudited)
For the Fiscal Year Ended December 31, 2010
12
For the General Fund, the original budgeted revenues and other financing sources were $17,516,672. The final budgeted revenues and other financing sources were $17,515,672. The City actually received $18,596,433 in 2010. The excess came primarily from greater than anticipated municipal income tax revenues of $8,418,440, due to conservative projections, and greater than anticipated intergovernmental revenues from estate tax collections. The original appropriations, including other financing uses for the General Fund were $19,120,786. The final appropriations, including other financing uses, were $19,064,996. The City’s actual expenditures, excluding other financing uses ended $868,095 below the final budgeted amount primarily from employee wage concessions and limited spending by all divisions in fuel, materials and supplies and outside services. There was a $612,290 excess of revenues over expenditures before the $212,284 net other financing uses. This resulted in a net increase of the General Fund balance of $400,006. Capital Assets and Debt Administration Capital Assets
Governmental Activities Business-Type Activities Totals 2010 2009 2010 2009 2010 2009 Land $ 4,054,455 $ 4,054,455 $ 2,617,895 $ 2,617,895 $ 6,672,350 $ 6,672,350 Land improvements, not depreciated - - 19,453 19,453 19,453 19,453 Construction in progress 18,986 154,606 1,232,247 628,446 1,251,233 783,052 Other non-depreciable assets 23,000 23,000 - - 23,000 23,000 Land improvements 397,501 445,130 652,602 703,361 1,050,103 1,148,491 Buildings and improvements 15,438,311 16,026,357 6,605,358 7,051,256 22,043,669 23,077,613 Furniture and fixtures 170,046 238,301 - - 170,046 238,301 Vehicles and equipment 2,060,222 2,136,381 10,232,731 10,678,311 12,292,953 12,814,692 Infrastructure 47,272,254 43,804,306 6,033,367 6,310,922 53,305,621 50,115,228 Total $ 69,434,775 $ 66,882,536 $ 27,393,653 $ 28,009,644 $ 96,828,428 $ 94,892,180
Total capital assets net of depreciation of the City’s governmental activities as of December 31, 2010, were $69,434,775, which was $2,552,239 higher than December 31, 2009. The most significant additions were in roads of $9,341,103, of which $8,062,080 is the completion of the Crocker/Stearns road project. This addition was offset by disposals and annual depreciation expense of $7,127,222. Business type activities net capital assets decreased by $615,991 from 2009 which is primarily due to the annual depreciation of $1,582,999 exceeding the new capital additions, which is primarily the engineering for the significant upgrade of the antiquated wastewater treatment plant and collection system, design services which are substantially complete at $1,232,247. For additional information see Note 8.

City of North Olmsted Management's Discussion and Analysis (Unaudited)
For the Fiscal Year Ended December 31, 2010
13
Debt and Other Long-Term Obligations As of December 31, 2010, the City of North Olmsted had $50,596,205 in total debt and other long-term obligations outstanding with $7,706,452 due within one year. Governmental Activities Business-Type Activities Totals 2010 2009 2010 2009 2010 2009 General obligation bonds $ 30,783,808 $ 31,165,433 $ 12,222,846 $ 13,313,153 $ 43,006,654 $ 44,478,586 Special assessment bonds - 90,000 - - - 90,000 OWDA loan - - 1,436,697 1,018,076 1,436,697 1,018,076 OPWC loans 40,837 54,450 651,668 782,001 692,505 836,451 Police pension 93,801 96,629 - - 93,801 96,629 Long-term notes - 3,215,000 - - - 3,215,000 Compensated absences 4,527,146 4,696,106 540,493 501,980 5,067,639 5,198,086 Settlements and judgments - 205,985 - - - 205,985 Claims payable 243,493 355,594 - - 243,493 355,594 Capital leases 51,989 - 3,427 - 55,416 - Total $ 35,741,074 $ 39,879,197 $ 14,855,131 $ 15,615,210 $ 50,596,205 $ 55,494,407 The General Obligation Bonds are composed of many various purposes which include street and storm improvements, sanitary sewer improvements, equipment, computerization, golf course purchase and improvements, recreation center and parks improvements, city building improvements and new library and fire station construction. Many revenue sources assist in the payment of debt service. The Special Assessment Bonds are for the Industrial Parkway construction. The property owners pay for this bond which repayment was complete in 2010. The City has several OPWC and OWDA loans outstanding, however, the OPWC loans are no interest loans. The State of Ohio statute limits the amount of general obligation debt a governmental entity may issue to 10.5 percent of the total assessed valuation. The City’s overall legal debt margin was $61,864,300 at December 31, 2010. This represents the aggregate principal amount of additional voted and unvoted debt which the City may issue over and above what the City currently has outstanding without exceeding the limitation. This calculation does not take into account the City’s ability to repay such debt levels within current resources. Additional information concerning the City’s debt can be found in Notes 12, 13, 14, and 15 to the basic financial statements. Economic Factors and Next Year’s Budget In 2011, The City of North Olmsted will continue to feel the effects of the economic recession that gripped the global, national and regional economies since 2008. In 2011 the City’s income tax collections were projected to stay stagnant, as corporate income tax collections are still down. The State of Ohio, in its efforts to balance its budget beginning in July 2011, reduced intergovernmental revenues in 2011 by 25%, and by 50% in fiscal year 2012, as well as accelerating the CAT tax elimination by $337,000 and $400,000 in 2011 and 2012, respectively. There is reopener language for the employee wage concessions to remain in effect in 2011, with several unions already agreeing for 80% of the concessions to remain.

City of North Olmsted Management's Discussion and Analysis (Unaudited)
For the Fiscal Year Ended December 31, 2010
14
Requests for Information This financial report is designed to provide our citizens, taxpayers, creditors and investors with a general overview of the City’s finances and show the City’s accountability for all money it receives, spends, or invests. If you have any questions about this report or need financial information, contact the Director of Finance, City of North Olmsted, 5200 Dover Center Road, North Olmsted, Ohio, 44070; telephone 440-777-8000 or e-mail at [email protected].

City of North Olmsted, Ohio Statement of Net Assets December 31, 2010
The accompanying notes are an integral part of these financial statements. 15
Component Primary Government Unit North Olmsted Governmental Business-Type Commission on Activities Activities Total Paratransit, Inc. Assets: Equity in pooled cash and cash equivalents $ 13,471,703 $ 820,795 $ 14,292,498 $ 39,568 Interest receivable 2,391 - 2,391 - Accounts receivable 274,254 - 274,254 - Materials and supplies inventory 324,201 170,289 494,490 - Prepaid items 75,461 48,105 123,566 - Internal balances 2,244,441 (2,244,441) - - Intergovernmental receivable 2,290,265 2,515,692 4,805,957 10,729 Income taxes receivable 3,045,641 - 3,045,641 - Taxes receivable - property and other 9,919,196 - 9,919,196 - Unamortized bond issuance costs 195,183 94,143 289,326 - Non-depreciable capital assets 4,096,441 3,869,595 7,966,036 - Depreciable capital assets, net 65,338,334 23,524,058 88,862,392 - Total assets 101,277,511 28,798,236 130,075,747 50,297 Liabilities: Accounts and contracts payable 597,567 132,962 730,529 10,729 Accrued wages and benefits 264,525 60,069 324,594 - Matured compensated absences 123,261 - 123,261 - Intergovernmental payable 469,656 37,993 507,649 - Unearned revenue 9,259,692 - 9,259,692 - Accrued interest payable 114,174 55,153 169,327 - Long term liabilities: Due within one year 5,792,809 1,913,643 7,706,452 - Due in more than one year 29,948,265 12,941,488 42,889,753 - Total liabilities 46,569,949 15,141,308 61,711,257 10,729 Net assets: Invested in capital assets, net of related debt 38,558,141 13,079,015 51,637,156 - Restricted for: Debt service 4,680,441 - 4,680,441 - Capital projects 597,111 - 597,111 - Community development 50,857 - 50,857 - Highways and streets 4,654,165 - 4,654,165 - Public safety 642,429 - 642,429 - Recreation 87,335 - 87,335 - Solid waste management 672,589 - 672,589 - Federal and other grants 610,274 - 610,274 - Unrestricted 4,154,220 577,913 4,732,133 39,568 Total net assets $ 54,707,562 $ 13,656,928 $ 68,364,490 $ 39,568

City of North Olmsted, Ohio Statement of Activities For the Year Ended December 31, 2010
The accompanying notes are an integral part of these financial statements. 16
Program Revenues Charges for Operating Grants Capital Grants Services and and Expenses and Sales Contributions Contributions Primary government: Governmental activities: General government $ 3,276,027 $ 1,247,442 $ 48,547 $ - Security of persons and property 11,627,831 1,191,835 54,646 - Public health and welfare 467,464 40,077 63,017 - Transportation 9,184,733 173,141 1,603,510 8,162,080 Basic utility services 2,246,112 - 3,634 - Leisure time activities 2,519,617 1,226,424 69,136 - Economic development 377,094 19,875 15,400 - Interest and fiscal charges 1,580,084 - - - Total governmental activities 31,278,962 3,898,794 1,857,890 8,162,080 Business-type activities: NOMBL - - - - Springvale golf course and ballroom 1,403,969 1,304,849 - - Sewer revenue 5,965,290 6,769,950 - 71,428 Total business-type activities 7,369,259 8,074,799 - 71,428 Total primary government $ 38,648,221 $ 11,973,593 $ 1,857,890 $ 8,233,508 Component unit: North Olmsted Commission on Paratransit, Inc. $ 143,455 $ - $ 143,139 $ - General revenues: Property taxes levied for: General purposes Recreation Fire pension Police pension Debt service Municipal income taxes levied for: General purposes Solid waste management Capital outlay Grants and entitlements not restricted to specific programs Investment income Miscellaneous income Total general revenues Transfers Total general revenues and transfers Change in net assets Net assets, beginning of year Net assets, end of year
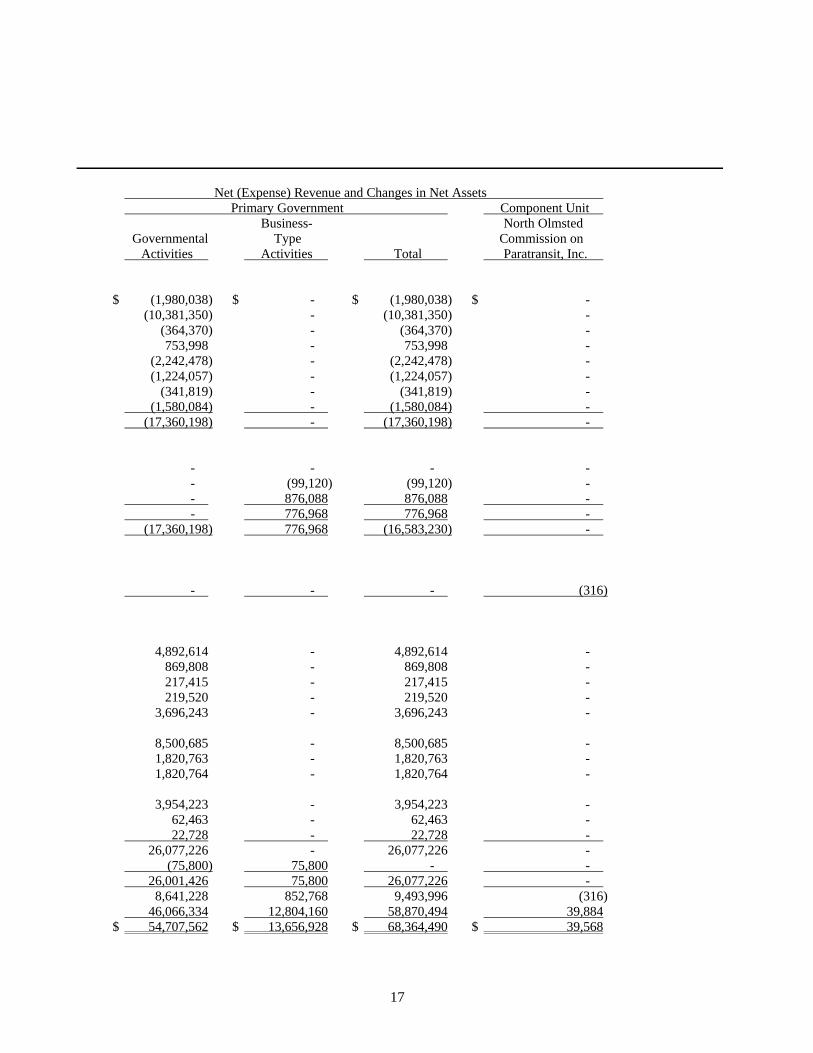
17
Net (Expense) Revenue and Changes in Net Assets Primary Government Component Unit Business- North Olmsted Governmental Type Commission on Activities Activities Total Paratransit, Inc. $ (1,980,038) $ - $ (1,980,038) $ - (10,381,350) - (10,381,350) - (364,370) - (364,370) - 753,998 - 753,998 - (2,242,478) - (2,242,478) - (1,224,057) - (1,224,057) - (341,819) - (341,819) - (1,580,084) - (1,580,084) - (17,360,198) - (17,360,198) - - - - - - (99,120) (99,120) - - 876,088 876,088 - - 776,968 776,968 - (17,360,198) 776,968 (16,583,230) - - - - (316) 4,892,614 - 4,892,614 - 869,808 - 869,808 - 217,415 - 217,415 - 219,520 - 219,520 - 3,696,243 - 3,696,243 - 8,500,685 - 8,500,685 - 1,820,763 - 1,820,763 - 1,820,764 - 1,820,764 - 3,954,223 - 3,954,223 - 62,463 - 62,463 - 22,728 - 22,728 - 26,077,226 - 26,077,226 - (75,800) 75,800 - - 26,001,426 75,800 26,077,226 - 8,641,228 852,768 9,493,996 (316) 46,066,334 12,804,160 58,870,494 39,884 $ 54,707,562 $ 13,656,928 $ 68,364,490 $ 39,568
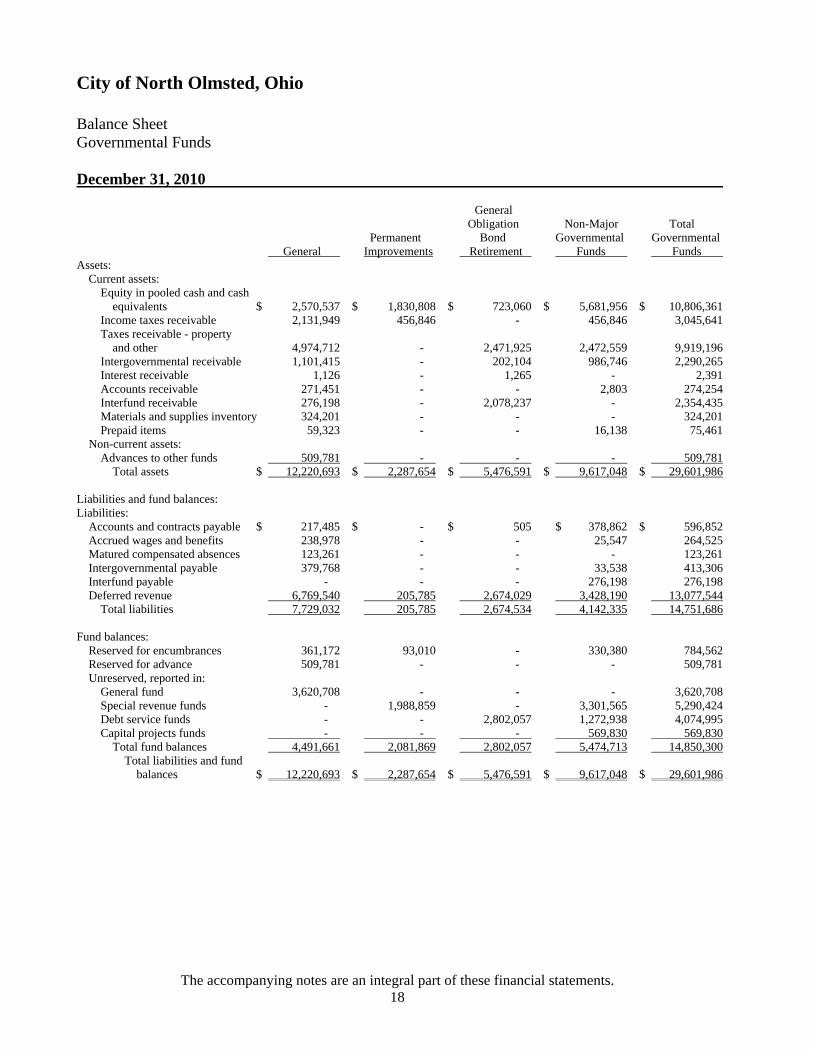
City of North Olmsted, Ohio Balance Sheet Governmental Funds December 31, 2010
The accompanying notes are an integral part of these financial statements. 18
General Obligation Non-Major Total Permanent Bond Governmental Governmental General Improvements Retirement Funds Funds Assets: Current assets: Equity in pooled cash and cash equivalents $ 2,570,537 $ 1,830,808 $ 723,060 $ 5,681,956 $ 10,806,361 Income taxes receivable 2,131,949 456,846 - 456,846 3,045,641 Taxes receivable - property and other 4,974,712 - 2,471,925 2,472,559 9,919,196 Intergovernmental receivable 1,101,415 - 202,104 986,746 2,290,265 Interest receivable 1,126 - 1,265 - 2,391 Accounts receivable 271,451 - - 2,803 274,254 Interfund receivable 276,198 - 2,078,237 - 2,354,435 Materials and supplies inventory 324,201 - - - 324,201 Prepaid items 59,323 - - 16,138 75,461 Non-current assets: Advances to other funds 509,781 - - - 509,781 Total assets $ 12,220,693 $ 2,287,654 $ 5,476,591 $ 9,617,048 $ 29,601,986 Liabilities and fund balances: Liabilities: Accounts and contracts payable $ 217,485 $ - $ 505 $ 378,862 $ 596,852 Accrued wages and benefits 238,978 - - 25,547 264,525 Matured compensated absences 123,261 - - - 123,261 Intergovernmental payable 379,768 - - 33,538 413,306 Interfund payable - - - 276,198 276,198 Deferred revenue 6,769,540 205,785 2,674,029 3,428,190 13,077,544 Total liabilities 7,729,032 205,785 2,674,534 4,142,335 14,751,686 Fund balances: Reserved for encumbrances 361,172 93,010 - 330,380 784,562 Reserved for advance 509,781 - - - 509,781 Unreserved, reported in: General fund 3,620,708 - - - 3,620,708 Special revenue funds - 1,988,859 - 3,301,565 5,290,424 Debt service funds - - 2,802,057 1,272,938 4,074,995 Capital projects funds - - - 569,830 569,830 Total fund balances 4,491,661 2,081,869 2,802,057 5,474,713 14,850,300 Total liabilities and fund balances $ 12,220,693 $ 2,287,654 $ 5,476,591 $ 9,617,048 $ 29,601,986

City of North Olmsted, Ohio Reconciliation of Total Governmental Fund Balances to Net Assets of Governmental Activities December 31, 2010
The accompanying notes are an integral part of these financial statements 19
Total governmental fund balances $ 14,850,300 Amounts reported for governmental activities in the Statement of Net Assets are different because: Capital assets used in governmental activities are not financial resources and therefore are not reported in the funds. 69,434,775 Other long-term assets are not available to pay for current period expenditures and therefore are deferred in the funds. Property and other taxes $ 644,340 Municipal income taxes 1,371,900 Intergovernmental 1,713,721 Miscellaneous 87,891 Total 3,817,852 In the Statement of Activities, interest is accrued on outstanding long-term obligations, whereas in governmental funds, an interest expenditure is reported when due. (114,174) In the Statement of Activities, bond issuance costs are amortized over the term of the bonds, whereas in governmental funds, bond issuance expenditures are reported when bonds are issued. 195,183 Long-term liabilities are not due and payable in the current period and are therefore not reported in the funds. OPWC street loan (40,837) Police pension liability (93,801) General obligation bonds (30,783,808) Capital leases payable (51,989) Compensated absences (4,527,146) Total (35,497,581) Internal service funds are used by management to charge the costs of insurance to individual funds. The assets and liabilities of the internal service funds are included in governmental activities in the Statement of Net Assets. Net assets 2,364,784 Internal balances (343,577) Net assets of governmental activities $ 54,707,562

City of North Olmsted, Ohio Statement of Revenues, Expenditures and Changes in Fund Balances Governmental Funds For the Year Ended December 31, 2010
The accompanying notes are an integral part of these financial statements 20
General Obligation Non-Major Total Permanent Bond Governmental Governmental General Improvements Retirement Funds Funds Revenues: Property and other local taxes $ 4,683,907 $ - $ 2,631,620 $ 2,669,786 $ 9,985,313 Municipal income taxes 8,240,353 1,764,979 - 1,764,978 11,770,310 Charges for services 1,212,043 - - 1,202,458 2,414,501 Fines, licenses and permits 991,660 - - 220,477 1,212,137 Intergovernmental 3,186,270 11,236 501,931 2,103,158 5,802,595 Special assessments - - - 90,000 90,000 Investment income 28,720 - 17,813 15,930 62,463 Miscellaneous income 30 - - 208,947 208,977 Total revenues 18,342,983 1,776,215 3,151,364 8,275,734 31,546,296 Expenditures: Current: General government 3,361,104 - 8,335 87,763 3,457,202 Security of persons and property 11,074,052 - - 873,730 11,947,782 Public health and welfare 409,997 - - 67,743 477,740 Transportation 1,932,654 1,044,823 - 1,444,577 4,422,054 Basic utility services 223,326 - - 2,022,786 2,246,112 Leisure time activities - - - 2,343,545 2,343,545 Economic development 344,812 - - 211,655 556,467 Capital outlay - - - 122,399 122,399 Debt service: Principal 8,799 3,055,000 3,763,113 761,803 7,588,715 Interest and fiscal charges 5,667 75,467 997,946 527,328 1,606,408 Issuance costs - 98,372 11,022 - 109,394 Total expenditures 17,360,411 4,273,662 4,780,416 8,463,329 34,877,818 Excess (deficiency) of revenues over expenditures 982,572 (2,497,447) (1,629,052) (187,595) (3,331,522) Other financing sources (uses): Sale of capital assets 18,840 - - 1,444 20,284 Inception of capital leases 48,815 - - 10,948 59,763 Transfers - in - - 1,743,243 117,526 1,860,769 Transfers - out (147,326) (1,520,570) - (268,673) (1,936,569) General obligation bonds issued - 3,715,000 - - 3,715,000 Premium on bonds issued - 138,372 30,573 - 168,945 Total other financing sources (uses) (79,671) 2,332,802 1,773,816 (138,755) 3,888,192 Net change in fund balances 902,901 (164,645) 144,764 (326,350) 556,670 Fund balances, beginning of year 3,588,760 2,246,514 2,657,293 5,801,063 14,293,630 Fund balances, end of year $ 4,491,661 $ 2,081,869 $ 2,802,057 $ 5,474,713 $ 14,850,300

City of North Olmsted, Ohio Reconciliation of the Statement of Revenues, Expenditures and Changes in Fund Balances of Governmental Funds to the Statement of Activities For the Year Ended December 31, 2010
The accompanying notes are an integral part of these financial statements 21
Net change in fund balances - total governmental funds $ 556,670 Amounts reported for governmental activities in the Statement of
Activities are different because: Governmental funds report capital outlay as expenditures. However in the Statement of Activities, the cost of those assets is allocated over their useful lives and reported as depreciation expense. This is the amount by which depreciation exceeded capital outlays in the current period. Capital outlay $ 9,797,913 Depreciation expense (7,127,222) Total 2,670,691 In the Statement of Activities, only the gain or loss on the disposal of capital assets is reported, whereas, in the governmental funds, the proceeds from the disposal increase financial resources. Thus, the change in net assets differs from the change in fund balance by the cost of the capital assets. (118,452) Revenues in the Statement of Activities that do not provide current financial resources are not reported as revenues in the funds. Municipal income taxes 371,902 Property and local taxes (89,713) Charges for services 8,231 Special assessments (90,000) Intergovernmental 182,454 Total 382,874 Other financing sources in the governmental funds increase long-term liabilities in the Statement of Net Assets. General obligation bonds issued (3,715,000) Premium on bonds issued (168,945) Total (3,883,945) Other financing sources in the Governmental Funds that increase long-term liabilities in the Statement of Net Assets. These sources were attributed to the inception of capital leases (59,763) Repayment of long-term obligations is an expenditure in the governmental funds, but the repayment reduces long-term liabilities in the Statement of Net Assets. General obligation bonds 4,259,500 Special assessment bonds 90,000 Long-term notes 3,215,000 OPWC street loan 13,613 Police pension liability 2,828 Capital leases 7,774 Total 7,588,715 (Continued)

City of North Olmsted, Ohio Reconciliation of the Statement of Revenues, Expenditures and Changes in Fund Balances of Governmental Funds to the Statement of Activities (Continued) For the Year Ended December 31, 2010
The accompanying notes are an integral part of these financial statements 22
In the Statement of Activities, bond issuance costs are amortized over the term of the bonds, whereas in governmental funds a bond issuance expenditure is reported when bonds are issued. 83,372 Some expenses reported in the Statement of Activities do not require the use of current financial resources and therefore are not reported as expenditures in governmental funds. Accrued interest on bonds 57,010 Compensated absences 168,960 Claims and judgments 205,985 Amortization of premium 43,103 Amortization of loss on refunding (37,033) Amortization of issuance costs (10,734) Total 427,291
Internal service funds used by management to charge the costs of insurance to individual funds are not reported in the entity-wide Statement of Activities. Governmental expenditures and related internal service fund revenues are eliminated. The net revenue (expense) of the internal service funds are allocated among governmental activities. Change in net assets 1,074,253 Internal balances (80,478) Total 993,775 Change in net assets of governmental activities $ 8,641,228

City of North Olmsted, Ohio Statement of Revenues, Expenditures and Changes in Fund Balance Budget (Non-GAAP Basis) and Actual - General Fund For the Year Ended December 31, 2010
The accompanying notes are an integral part of these financial statements 23
Variance with Final Budget Budget Positive Original Final Actual (Negative) Revenues: Property and other local taxes $ 4,559,795 $ 4,559,795 $ 4,683,907 $ 124,112 Municipal income taxes 8,010,539 8,010,539 8,418,440 407,901 Charges for services 1,107,340 1,106,340 1,225,355 119,015 Licenses and permits 785,100 785,100 836,604 51,504 Fines and forfeitures 211,500 211,500 253,493 41,993 Intergovernmental 2,469,998 2,469,998 3,014,188 544,190 Investment income 50,000 50,000 32,626 (17,374) Miscellaneous income 15,000 15,000 20,580 5,580 Total revenues 17,209,272 17,208,272 18,485,193 1,276,921 Expenditures: Current: General government 3,612,412 3,627,253 3,543,215 84,038 Security of persons and property 11,124,209 11,218,331 10,732,303 486,028 Public health and welfare 495,573 427,933 421,464 6,469 Transportation 3,183,996 2,863,367 2,572,302 291,065 Basic utility services 70,000 223,800 223,676 124 Economic development 468,596 380,314 379,943 371 Total expenditures 18,954,786 18,740,998 17,872,903 868,095 Excess (deficiency) of revenues over expenditures (1,745,514) (1,532,726) 612,290 2,145,016 Other financing sources (uses): Sales of capital assets 10,000 10,000 18,840 8,840 Advances - in 297,400 297,400 92,400 (205,000) Advances - out (105,000) (176,198) (176,198) - Transfers - out (61,000) (147,800) (147,326) 474 Total other financing sources (uses) 141,400 (16,598) (212,284) (195,686) Net change in fund balance (1,604,114) (1,549,324) 400,006 1,949,330 Prior year encumbrances 546,955 546,955 546,955 - Fund balance, beginning of year 1,152,905 1,152,905 1,152,905 - Fund balance, end of year $ 95,746 $ 150,536 $ 2,099,866 $ 1,949,330

City of North Olmsted, Ohio Statement of Revenues, Expenditures and Changes in Fund Balance Budget (Non-GAAP Basis) and Actual - Permanent Improvements Fund For the Year Ended December 31, 2010
The accompanying notes are an integral part of these financial statements 24
Variance with Final Budget Budget Positive Original Final Actual (Negative) Revenues: Municipal income taxes $ 1,716,544 $ 1,716,544 $ 1,803,952 $ 87,408 Intergovernmental 220,551 416,579 220,976 (195,603) Total revenues 1,937,095 2,133,123 2,024,928 (108,195) Expenditures: Current: Transportation 1,220,698 1,631,582 1,288,109 343,473 Debt service: Principal 3,055,000 7,125,000 7,125,000 - Interest and fiscal charges 76,100 185,780 185,780 - Total debt service 3,131,100 7,310,780 7,310,780 - Total expenditures 4,351,798 8,942,362 8,598,889 343,473 Excess (deficiency) of revenues over expenditures (2,414,703) (6,809,239) (6,573,961) 235,278 Other financing sources (uses): Long-term notes issued 4,070,000 4,070,000 4,081,941 11,941 Premium on general obligation bonds issued - 138,372 138,372 - General obligation bonds issued - 3,715,000 3,715,000 - Transfers - out (1,484,768) (1,520,571) (1,520,570) 1 Total other financing sources (uses) 2,585,232 6,402,801 6,414,743 11,942 Net change in fund balance 170,529 (406,438) (159,218) 247,220 Prior year encumbrances 82,999 82,999 82,999 - Fund balance, beginning of year 1,814,016 1,814,016 1,814,016 - Fund balance, end of year $ 2,067,544 $ 1,490,577 $ 1,737,797 $ 247,220

City of North Olmsted, Ohio Statement of Fund Net Assets Proprietary Funds December 31, 2010
The accompanying notes are an integral part of these financial statements 25
Governmental Business-Type Activities - Enterprise Funds Activities Springvale Golf Course and Sewer Internal NOMBL Ballroom Revenue Total Service Funds Assets: Current assets: Equity in pooled cash and equivalents $ 21,708 $ 139,525 $ 659,562 $ 820,795 $ 2,665,342 Materials and supplies inventory - 11,566 158,723 170,289 - Prepaid items - 6,580 41,525 48,105 - Intergovernmental receivable - - 2,515,692 2,515,692 - Total current assets 21,708 157,671 3,375,502 3,554,881 2,665,342 Non-current assets: Unamortized bond issuance costs - 36,383 57,760 94,143 - Non-depreciable capital assets 391,537 2,245,811 1,232,247 3,869,595 - Depreciable capital assets, net - 2,747,497 20,776,561 23,524,058 - Total non-current assets 391,537 5,029,691 22,066,568 27,487,796 - Total assets 413,245 5,187,362 25,442,070 31,042,677 2,665,342 Liabilities: Current: Accounts and contracts payable - 9,136 123,826 132,962 715 Accrued wages and benefits - 4,462 55,607 60,069 - Intergovernmental payable - 3,642 34,351 37,993 56,350 Interfund payable - 2,010,811 67,426 2,078,237 - Accrued interest payable - 16,072 39,081 55,153 - Claims payable - - - - 190,297 Accrued compensated absences - 22,098 224,860 246,958 - Capital lease payable - - 774 774 - General obligation bond payable - 327,000 1,138,000 1,465,000 - OWDA loan payable - - 70,578 70,578 - OPWC loan payable - - 130,333 130,333 - Total current liabilities - 2,393,221 1,884,836 4,278,057 247,362 Long-term liabilities (net of current portion): Advances from other funds - 411,771 98,010 509,781 - Claims payable - - - - 53,196 Accrued compensated absences - 40,551 252,984 293,535 - Capital lease payable - - 2,653 2,653 - General obligation bonds payable - 3,915,948 6,841,898 10,757,846 - OWDA loan payable - - 1,366,119 1,366,119 - OPWC loan payable - - 521,335 521,335 - Total long-term liabilities - 4,368,270 9,082,999 13,451,269 53,196 Total liabilities - 6,761,491 10,967,835 17,729,326 300,558 Net assets: Invested in capital assets, net of related debt 391,537 750,360 11,937,118 13,079,015 - Unrestricted (deficit) 21,708 (2,324,489) 2,537,117 234,336 2,364,784 Total net assets (deficit) $ 413,245 $ (1,574,129) $ 14,474,235 13,313,351 $ 2,364,784 Net assets reported for business-type activities in the Statement of Net Assets are different because they include accumulated overpayments to the internal service funds: 343,577 Net assets business-type activities $ 13,656,928

City of North Olmsted, Ohio Statement of Revenues, Expenses and Changes in Fund Net Assets Proprietary Funds For the Year Ended December 31, 2010
The accompanying notes are an integral part of these financial statements 26
Governmental Business-Type Activities - Enterprise Funds Activities Springvale Golf Course and Sewer Internal NOMBL Ballroom Revenue Total Service Funds Operating revenues: Charges for services $ - $ 1,304,849 $ 6,769,950 $ 8,074,799 $ 3,098,488 Operating expenses: Salaries - 405,483 1,543,042 1,948,525 - Benefits - 79,890 620,722 700,612 - Contractual services - 275,464 1,632,381 1,907,845 478,158 Materials and supplies - 255,216 386,394 641,610 - Claims - - - - 1,546,077 Depreciation - 171,241 1,411,758 1,582,999 - Total operating expenses - 1,187,294 5,594,297 6,781,591 2,024,235 Operating income - 117,555 1,175,653 1,293,208 1,074,253 Nonoperating revenues (expenses): Loss on disposal of capital assets - - (1,751) (1,751) - Interest and fiscal charges - (219,406) (446,989) (666,395) - Total nonoperating revenues (expenses) - (219,406) (448,740) (668,146) - Income (loss) before contributions and transfers - (101,851) 726,913 625,062 1,074,253 Capital contributions - - 71,428 71,428 - Transfers - in - 75,800 - 75,800 - Change in net assets - (26,051) 798,341 772,290 1,074,253 Net assets (deficit), beginning of year 413,245 (1,548,078) 13,675,894 1,290,531 Net assets (deficit), end of year $ 413,245 $ (1,574,129) $ 14,474,235 $ 2,364,784 Some amounts reported for business-type activities in the Statement of Activities are different because a portion of the net expense of the internal service funds are reported with business-type activities: 80,478 Change in net assets business-type activities $ 852,768

City of North Olmsted, Ohio Statement of Cash Flows Proprietary Funds For the Year Ended December 31, 2010
The accompanying notes are an integral part of these financial statements 27
Governmental Business-Type Activities - Enterprise Funds Activities Springvale Golf Course and Sewer Internal NOMBL Ballroom Revenue Total Service Funds Cash flows from operating activities: Receipts from customers and users $ - $ 1,304,385 $ 6,299,729 $ 7,604,114 $ 3,098,488 Cash payments for goods and services - (17,337) (2,187,639) (2,204,976) (478,511) Cash paid to suppliers for materials and supplies - (262,702) (412,693) (675,395) - Cash payments for employee services and benefits - (475,261) (2,133,240) (2,608,501) - Cash paid for claims - - - - (1,658,178) Net cash provided by operating activities - 549,085 1,566,157 2,115,242 961,799 Cash flows from capital and related financing activities: Acquisition of capital assets - (7,334) (958,864) (966,198) - Proceeds from sale of capital assets ` - - 1,542 1,542 - Tap-in fees - - 71,428 71,428 - Proceeds from capital debt - - 776,474 776,474 - Proceeds from capital debt - notes payable - - 320,000 320,000 - Premium on general obligation bonds - - 9,538 9,538 - Bond issuance costs - - (6,508) (6,508) - Capital lease principal paid - - (676) (676) - Interest paid on capital lease - - (179) (179) - Note principal paid - - (320,000) (320,000) - Note interest paid - - (2,068) (2,068) - Loan principal paid - OPWC - - (130,333) (130,333) - Loan principal paid - OWDA - - (67,853) (67,853) - General obligation bonds principal paid - (344,500) (1,053,500) (1,398,000) - Interest paid - (208,769) (447,587) (656,356) - Net cash used for capital and related financing activities - (560,603) (1,808,586) (2,369,189) - Cash flows from noncapital financing activities: Transfers - in - 75,800 - 75,800 - Net increase (decrease) in cash and cash equivalents - 64,282 (242,429) (178,147) 961,799 Cash and cash equivalents, beginning of year 21,708 75,243 901,991 998,942 1,703,543 Cash and cash equivalents, end of year $ 21,708 $ 139,525 $ 659,562 $ 820,795 $ 2,665,342
(Continued)

City of North Olmsted, Ohio Statement of Cash Flows (Continued) Proprietary Funds For the Year Ended December 31, 2010
The accompanying notes are an integral part of these financial statements 28
Governmental Business-Type Activities - Enterprise Funds Activities Springvale Golf Course and Sewer Internal NOMBL Ballroom Revenue Total Service Funds Reconciliation of operating income to net cash provided by operating activities: Operating income $ - $ 117,555 $ 1,175,653 $ 1,293,208 $ 1,074,253 Adjustments: Depreciation - 171,241 1,411,758 1,582,999 - (Increase) decrease in assets and increase (decrease) in liabilities: Materials and supplies inventory - (7,969) (26,719) (34,688) - Intergovernmental receivable - - (470,221) (470,221) - Prepaid items - 1,004 9,133 10,137 - Accounts and contracts payable - 125 (189,155) (189,030) (580) Accrued salaries and benefits - 36 2,528 2,564 - Intergovernmental payable - (690) (59,558) (60,248) 227 Interfund payable - 257,877 (315,869) (57,992) - Claims payable - - - - (112,101) Accrued compensated absences - 9,906 28,607 38,513 - Net cash provided by operating activities $ - $ 549,085 $ 1,566,157 $ 2,115,242 $ 961,799 Non-cash capital financing activities: Borrowing under capital lease $ - $ - $ 4,103 $ 4,103 $ -

City of North Olmsted, Ohio Statement of Fiduciary Assets and Liabilities Agency Fund December 31, 2010
The accompanying notes are an integral part of these financial statements 29
Assets: Equity in pooled cash and cash equivalents $ 375,304 Liabilities: Deposits held and due to others $ 375,304

City of North Olmsted, Ohio Notes to the Basic Financial Statements For the Year Ended December 31, 2010
30
Note 1: Description of the City and Reporting Entity The City of North Olmsted, Ohio, was chartered in 1959 under the laws of the State of Ohio. The City operates a Mayor-Council form of government. A reporting entity is comprised of the primary government, component units, and other organizations that are included to ensure that the financial statements are not misleading. The City’s primary government consists of all funds and departments which are not legally separate from the City. They include police and fire fighting forces, sewer services, a municipal bus line, a golf course, a street maintenance service, planning and zoning, and a staff to provide necessary support to these service providers. Component units are legally separate organizations for which the City is financially accountable. The City is financially accountable for an organization if the City appoints a voting majority of the organization’s governing board and (1) the City is able to significantly influence the programs or services performed or provided by the organization; or (2) the City is legally entitled to or can otherwise access the organization’s resources; the City is legally obligated or has otherwise assumed the responsibility to finance the deficits of, or provide financial support to, the organization; or the City is obligated for the debt of the organization. Component units may also include organizations which are fiscally dependent on the City in that the City approves the budget, the issuance of debt, or the levying of taxes. A discretely presented component unit is reported in a separate column in the government-wide financial statements to emphasize it is legally separated from the City. North Olmsted Commission on Paratransit, Inc. (N.O.C.O.P.) provides transportation to the residents of the City of North Olmsted, the City of Olmsted Falls and Olmsted Township who are sixty years of age or older or disabled. N.O.C.O.P. was formed in 1992 and is governed by a Board of Trustees which consists of nine members. The following four members are automatic members of the Board of Trustees: The Mayor of the City of North Olmsted or designee, The Finance Director of the City of North Olmsted or designee, a member of the Finance Committee of the North Olmsted City Council as designated by the Chairman of the Committee and the President of the North Olmsted City Council. The remaining members of the Board of Trustees are elected by the membership as provided in its by-laws. N.O.C.O.P utilizes the services of a third party provider, Senior Transportation Connection, to provide transportation services to the residents. Fares are collected by the provider based on the destination and frequency that the service is used. The three communities share costs or deficits on a prorated agreement based on each community’s population. The current formula is as follows: the City of North Olmsted contributes 68.9 percent, the City of Olmsted Falls contributes 10.0 percent and Olmsted Township contributes 21.1 percent. N.O.C.O.P. operates on a fiscal year ending December 31. Complete financial statements for N.O.C.O.P. may be obtained by writing the North Olmsted Commission on Paratransit, Inc., 5200 Dover Center Road, North Olmsted, Ohio 44070.
City of North Olmsted, Ohio Notes to the Basic Financial Statements (Continued) For the Year Ended December 31, 2010
31
Note 1: Description of the City and Reporting Entity (continued) Information in the following notes to the basic financial statements is applicable to the primary government. Information relative to the component unit is presented in Note 21. The City is associated with one jointly governed organization, the West Shore Council of Governments. This organization is presented in Note 18 to the basic financial statements. Note 2: Summary of Significant Accounting Policies The financial statements of the City of North Olmsted have been prepared in conformity with generally accepted accounting principles (GAAP) as applied to governmental units. The Governmental Accounting Standards Board (GASB) is the accepted standard-setting body for establishing governmental accounting and financial reporting principles. The City also applies Financial Accounting Standards Board (FASB) Statements and Interpretations issued on or before November 30, 1989, to its business-type activities and to its proprietary funds provided they do not conflict with or contradict GASB pronouncements. The City has elected not to apply FASB codification, pronouncements and interpretations issued after November 30, 1989, to its business-type activities and enterprise funds. The more significant of the City’s accounting policies are described below. A. Basis of Presentation The City’s basic financial statements consist of government-wide statements, including a Statement of Net Assets and a Statement of Activities, and fund financial statements, which provide a more detailed level of financial information. Government-wide Financial Statements The Statement of Net Assets and the Statement of Activities display information about the City as a whole. These statements include the financial activities of the primary government, except for fiduciary funds. The statements distinguish between those activities of the City that are governmental and those that are considered business-type. The activities of the internal service funds are eliminated to avoid “doubling up” revenues and expenses.

City of North Olmsted, Ohio Notes to the Basic Financial Statements (Continued) For the Year Ended December 31, 2010
32
Note 2: Summary of Significant Accounting Policies (continued) A. Basis of Presentation (continued) Government-wide Financial Statements (continued) The Statement of Net Assets presents the financial condition of the governmental and business-type activities of the City at year-end. The Statement of Activities presents a comparison between direct expenses and program revenues for each program or function of the City’s governmental activities and for the business-type activities of the City. Direct expenses are those that are specifically associated with a service, program or department and therefore clearly identifiable to a particular function. Program revenues include charges paid by the recipient of the goods or services offered by the program, grants and contributions that are restricted to meeting the operational or capital requirements of a particular program and interest earned on grants that is required to be used to support a particular program. Revenues which are not classified as program revenues are presented as general revenues of the City, with certain limited exceptions. The comparison of direct expenses with program revenues identifies the extent to which each governmental program or business activity is self-financing or draws from the general revenues of the City. Fund Financial Statements During the year, the City segregates transactions related to certain City functions or activities in separate funds in order to aid financial management and to demonstrate legal compliance. Fund financial statements are designed to present financial information of the City at this more detailed level. The focus of governmental and enterprise fund financial statements is on major funds. Each major fund is presented in a separate column. Nonmajor funds are aggregated and presented in a single column. Internal service funds are presented in a single column on the face of the proprietary fund statements. Fiduciary funds are reported by type. B. Fund Accounting The City uses funds to maintain its financial records during the year. A fund is defined as a fiscal and accounting entity with a self balancing set of accounts. There are three categories of funds: governmental, proprietary and fiduciary. Governmental Funds Governmental funds are those through which most governmental functions are financed. Governmental fund reporting focuses on the sources, uses and balances of current financial resources. Expendable assets are assigned to the various governmental funds according to the purposes for which they may or must be used. Current liabilities are assigned to the fund from which they will be paid. The difference between governmental fund assets and liabilities is reported as fund balance. The following are the City's major governmental funds:

City of North Olmsted, Ohio Notes to the Basic Financial Statements (Continued) For the Year Ended December 31, 2010
33
Note 2: Summary of Significant Accounting Policies (continued) B. Fund Accounting (continued) Governmental Funds (continued)
General Fund - The General Fund is the operating fund of the City and is used to account for all financial resources except those required to be accounted for in another fund. The General Fund balance is available to the City for any purpose provided it is expended or transferred according to the charter of the City of North Olmsted and/or the general laws of Ohio. Permanent Improvements Fund – The Permanent Improvements Special Revenue Fund accounts for 15 percent of the municipal income tax receipts and expenditures for the permanent improvement of streets and the storm sewer system.
General Obligation Bond Retirement Fund - The General Obligation Bond Retirement Fund accounts for resources that are used for payment of principal and interest and fiscal charges on general obligation debt.
The other governmental funds of the City account for grants and other resources whose use is restricted to a particular purpose. Proprietary Funds Proprietary fund reporting focuses on the determination of operating income, changes in net assets, financial position and cash flows. Proprietary funds are classified as either enterprise or internal service.
Enterprise Funds - Enterprise funds may be used to account for any activity for which a fee is charged to external users for goods or services. The City’s major enterprise funds are:
North Olmsted Municipal Bus Line Fund (NOMBL) - The NOMBL Fund accounts for the revenues and expenses of the City-owned municipal bus line. Springvale Golf Course and Ballroom Fund - The Springvale Golf Course and Ballroom Fund accounts for revenues and expenses of the City owned golf course and ballroom facility. Sewer Revenue Fund - The Sewer Revenue Fund accounts for the revenues and expenses of the sanitary sewer system and waste water treatment plant facilities.
Internal Service Funds - Internal service funds account for the financing of services provided by one department or agency to other departments or agencies of the City on a cost-reimbursement basis. One internal service fund accounts for a self-insurance program for employee medical, dental and vision benefits. The other internal service fund accounts for assets set aside for claim settlements and related liabilities associated with the workers’ compensation self-insurance program.

City of North Olmsted, Ohio Notes to the Basic Financial Statements (Continued) For the Year Ended December 31, 2010
34
Note 2: Summary of Significant Accounting Policies (continued) B. Fund Accounting (continued) Fiduciary Funds Fiduciary fund reporting focuses on net assets and changes in net assets. The fiduciary fund category is split into four classifications: pension trust funds, investment trust funds, private purpose trust funds and agency funds. Trust funds are used to account for assets held by the City under a trust agreement for individuals, private organizations, or other governments and are therefore not available to support the City’s own programs. The City has no trust funds. Agency funds are purely custodial in nature (assets equal liabilities) and thus do not involve measurement of results of operations. The City’s agency fund accounts for deposits from contractors, developers and individuals to ensure compliance with City ordinances. C. Measurement Focus Government-wide Financial Statements The government-wide financial statements are prepared using a flow of economic resources measurement focus. All non-fiduciary assets and all liabilities associated with the operation of the City are included on the Statement of Net Assets. The Statement of Activities presents increases (i.e. revenues) and decreases (i.e. expenses) in total net assets. Fund Financial Statements All governmental funds are accounted for using a flow of current financial resources measurement focus. With this measurement focus, only current assets and current liabilities generally are included on the balance sheet. The Statement of Revenues, Expenditures and Changes in Fund Balances reports on the sources (i.e., revenues and other financing sources) and uses (i.e., expenditures and other financing uses) of current financial resources. This approach differs from the manner in which the governmental activities of the government-wide financial statements are prepared. Governmental fund financial statements therefore include a reconciliation with brief explanations to better identify the relationship between the government-wide statements and the statements for governmental funds. Like the government-wide statements, all proprietary funds are accounted for on a flow of economic resources measurement focus. All assets and all liabilities associated with the operation of these funds are included on the Statement of Fund Net Assets. The Statement of Revenues, Expenses and Changes in Fund Net Assets presents increases (i.e., revenues) and decreases (i.e., expenses) in total net assets. The Statement of Cash Flows provides information about how the City finances and meets the cash flow needs of its proprietary activities.
City of North Olmsted, Ohio Notes to the Basic Financial Statements (Continued) For the Year Ended December 31, 2010
35
Note 2: Summary of Significant Accounting Policies (continued) D. Basis of Accounting Basis of accounting determines when transactions are recorded in the financial records and reported on the financial statements. Government-wide financial statements are prepared using the accrual basis of accounting; proprietary and fiduciary funds also use the accrual basis of accounting. Governmental funds use the modified accrual basis of accounting. Differences in the accrual and modified accrual basis of accounting arise in the recognition of revenue, the recording of deferred revenue and in the presentation of expenses versus expenditures. Revenues - Exchange and Nonexchange Transactions Revenue resulting from exchange transactions, in which each party gives and receives essentially equal value, is recorded on the accrual basis when the exchange takes place. On a modified accrual basis, revenue is recorded in the year in which the resources are measurable and become available. Available means that the resources will be collected within the current year or are expected to be collected soon enough thereafter to be used to pay liabilities of the current year. For the City, available means expected to be received within sixty days of year-end. Nonexchange transactions, in which the City receives value without directly giving equal value in return, include income taxes, property taxes, grants, entitlements and donations. On an accrual basis, revenue from income taxes is recognized in the period in which the income is earned. Revenue from property taxes is recognized in the year for which the taxes are levied (See Note 7). Revenue from grants, entitlements and donations is recognized in the year in which all eligibility requirements have been satisfied. Eligibility requirements include timing requirements, which specify the year when the resources are required to be used or the year when use is first permitted, matching requirements, in which the City must provide local resources to be used for a specified purpose, and expenditure requirements, in which the resources are provided to the City on a reimbursement basis. On the modified accrual basis, revenue from nonexchange transactions must also be available before it can be recognized. Under the modified accrual basis, the following revenue sources are considered to be both measurable and available at year-end: income tax, state-levied locally shared taxes (including gasoline tax and motor vehicle license fees), fines and forfeitures, interest, grants and entitlements and rentals. Unearned Revenue/Deferred Revenue
Unearned revenue arises when assets are recognized before revenue recognition criteria have been satisfied. Property taxes for which there is an enforceable legal claim as of December 31, 2010, but which were levied to finance year 2011 operations, have been recorded as unearned revenue. Grants and entitlements received before the eligibility requirements are met are also recorded as unearned revenue. On governmental fund financial statements, receivables that will not be collected within the available period have also been reported as deferred revenue.

City of North Olmsted, Ohio Notes to the Basic Financial Statements (Continued) For the Year Ended December 31, 2010
36
Note 2: Summary of Significant Accounting Policies (continued) D. Basis of Accounting (continued) Expenses/Expenditures On the accrual basis of accounting, expenses are recognized at the time they are incurred. The measurement focus of governmental fund accounting is on decreases in net financial resources (expenditures) rather than expenses. Expenditures are generally recognized in the accounting period in which the related fund liability is incurred, if measurable. Allocations of cost, such as depreciation and amortization, are not recognized in governmental funds. E. Budgetary Data All funds, except agency funds, are legally required to be budgeted and appropriated. The major documents prepared are the tax budget, the certificate of estimated resources, and the appropriations resolution, all of which are prepared on the budgetary basis of accounting. The tax budget demonstrates a need for existing or increased tax rates. The certificate of estimated resources establishes a limit on the amount Council may appropriate. The appropriations resolution is Council’s authorization to spend resources and sets annual limits on expenditures plus encumbrances at the level of control selected by Council. The legal level of control has been established by Council at the category level (salaries, benefits, materials and supplies, contractual services, capital outlay, etc). Budgetary modifications may only be made by resolution of the City Council at the legal level of control. The certificate of estimated resources may be amended during the year if projected increases or decreases in revenue are identified by the Director of Finance. The amounts reported as the original budgeted amounts on the budgetary statements reflect the amounts on the certificate of estimated resources when the original appropriations were adopted. The amounts reported as the final budgeted amounts on the budgetary statements reflect the amounts on the amended certificate of estimated resources in effect at the time the final appropriations were enacted by Council. The appropriation resolution is subject to amendment throughout the year with the restriction that appropriations cannot exceed estimated resources. The amounts reported as the original budgeted amounts reflect the first appropriation resolution for that fund that covered the entire year, including amounts automatically carried forward from prior years. The amounts reported as the final budgeted amounts represent the final appropriation amounts passed by Council during the year. F. Pooled Cash and Cash Equivalents To improve cash management, cash received by the City is pooled. Monies for all funds, including proprietary funds, are maintained in this pool. Individual fund integrity is maintained through the City’s records. Interest in the pool is presented as “equity in pooled cash and cash equivalents”. Investments are reported at fair value which is based on quoted market prices, with the exception of nonparticipating certificates of deposit and repurchase agreements, which are reported at cost.
City of North Olmsted, Ohio Notes to the Basic Financial Statements (Continued) For the Year Ended December 31, 2010
37
Note 2: Summary of Significant Accounting Policies (continued) F. Pooled Cash and Cash Equivalents (continued) During 2010, investments were limited to repurchase agreements, non-negotiable certificates of deposit, United States Government Obligations, money market savings accounts and federally backed agency securities. Investment procedures are restricted by the provisions of the Ohio Revised Code. Interest revenue for 2010 consisted of: Actual From (to) other Interest Credited City Funds General $ 28,720 $ 18,989 Special Revenue Funds: Motor Vehicle License Tax 179 (270) State Highway 693 (1,018) Street Maintenance 1,987 (3,146) Endowment and Grant 15 (1,035) Senior Center 321 157 Debt Service Funds: General Obligation Bond Retirement 17,813 15,109 Special Assessment Bond Retirement 12,735 12,332 All others - (41,118) $ 62,463 $ - Investments of the cash management pool and investments with an original maturity of three months or less at the time they are purchased by the City are presented on the financial statements as cash equivalents. G. Materials and Supplies Inventory Inventories are presented at cost on a first-in, first-out basis and are expended/expensed when used. Inventory consists of expendable supplies. H. Prepaid Items Payments made to vendors for services that will benefit periods beyond December 31, 2010 are recorded as prepaid items using the consumption method by recording a current asset for the prepaid amount and reflecting the expenditure/expense in the year in which services are consumed.

City of North Olmsted, Ohio Notes to the Basic Financial Statements (Continued) For the Year Ended December 31, 2010
38
Note 2: Summary of Significant Accounting Policies (continued) I. Capital Assets General capital assets are those assets not specifically related to activities reported in the proprietary funds. These assets generally result from expenditures in the governmental funds. General capital assets are reported in the governmental activities column of the government-wide Statement of Net Assets but are not reported in the fund financial statements. Capital assets utilized by the proprietary funds are reported both in the business-type activities column of the government-wide Statement of Net Assets and in the respective funds. Capital assets are capitalized at cost (or estimated historical cost) and updated for additions and retirements during the year. Donated capital assets are recorded at their fair market values as of the date received. The City maintains a capitalization threshold of $5,000. Improvements are capitalized; the costs of normal maintenance and repairs that do not add to the value of the asset or materially extend an asset’s life are not. Interest incurred during the construction of proprietary fund capital assets is also capitalized. All capital assets are depreciated except for land and construction in progress. Improvements are depreciated over the remaining useful lives of the related capital assets. Useful lives for infrastructure were estimated based on the City’s historical records of necessary improvements and replacement. Depreciation is computed using the straight-line method over the following useful lives:
Description Estimated Lives Land improvements 5 to 40 years Buildings and improvements 8 to 40 years Furniture and fixtures 10 to 20 years Vehicles and equipment 2 to 25 years Roads 10 to 30 years Bridges and culverts 35 to 50 years Sanitary sewer lines 50 years
The City’s infrastructure consists of roads, bridges, culverts and sanitary sewer lines. J. Interfund Balances On fund financial statements, outstanding interfund loans and unpaid amounts for interfund services are reported as “interfund receivables/payables”. Long-term interfund loans are classified as “advances to/from other funds” on the Balance Sheet and are equally offset by a fund balance reserve account which indicates that they do not constitute available expendable resources. Interfund balance amounts are eliminated in the Statement of Net Assets, except for any net residual amounts due between governmental and business-type activities, which are presented as internal balances.

City of North Olmsted, Ohio Notes to the Basic Financial Statements (Continued) For the Year Ended December 31, 2010
39
Note 2: Summary of Significant Accounting Policies (continued) K. Compensated Absences Vacation benefits are accrued as a liability as the benefits are earned if the employees' rights to receive compensation are attributable to services already rendered and it is probable that the employer will compensate the employees for the benefits through paid time off or some other means. The City records a liability for all accumulated unused vacation time when earned for all employees with more than one year of service. Sick leave benefits are accrued as a liability using the vesting method. The liability includes the employees who are currently eligible to receive termination benefits and those that the City has identified as probable of receiving payment in the future. The amount is based on accumulated sick leave and employee wage rates at year end taking into consideration any limits specified in the City's termination policy. L. Accrued Liabilities and Long-Term Obligations All payables, accrued liabilities and long-term obligations are reported in the government-wide financial statements, and all payables, accrued liabilities and long-term obligations payable from proprietary funds are reported on the proprietary fund financial statements. In general, governmental fund payables and accrued liabilities that, once incurred, are paid in a timely manner and in full from current financial resources, are reported as obligations of the funds. However, claims and judgments, compensated absences, and contractually required pension contributions that will be paid from governmental funds are reported as a liability in the fund financial statements only to the extent that they are due for payment during the current year. Bonds and long-term loans are recognized as a liability on the governmental fund financial statements when due. M. Fund Balance Reserves The City reserves those portions of fund balance which are legally segregated for a specific future use or which do not represent expendable resources and therefore are not available for appropriation or expenditure. Fund balance reserves have been established for encumbrances and advances to other funds. N. Net Assets Net assets represent the difference between assets and liabilities. Net assets invested in capital assets, net of related debt consists of capital assets, net of accumulated depreciation, reduced by the outstanding balances of any borrowing used for the acquisition, construction or improvement of those assets. Net assets are reported as restricted when there are limitations imposed on their use either through constitutional provisions or enabling legislation or through external restrictions imposed by creditors, grantors or laws or regulations of other governments. The government-wide Statement of Net Assets reports $11,995,201 of restricted net assets, none of which is restricted by enabling legislation. The City applies restricted resources when an expense is incurred for purposes for which both restricted and unrestricted net assets are available.

City of North Olmsted, Ohio Notes to the Basic Financial Statements (Continued) For the Year Ended December 31, 2010
40
Note 2: Summary of Significant Accounting Policies (continued) O. Operating Revenues and Expenses Operating revenues are those revenues that are generated directly from the primary activity of the proprietary funds. For the City, these revenues are charges for services for sewer, golf and self-insurance programs. Operating expenses are necessary costs that have been incurred in order to provide the good or service that is the primary activity of the fund. All revenues and expenses not meeting this definition are reported as non-operating. P. Bond Issuance Costs Bond issuance costs for underwriting fees and bond insurance for the various purpose general obligation bonds are being amortized using the straight-line method over the life of the bonds on the government-wide statements and in the City’s enterprise funds. The straight-line method of amortization is not materially different from the effective-interest method. Q. Deferred Loss on Refunding The difference between the reacquisition price (funds required to refund the old debt) of various refunding bonds and the net carrying amount of the old debt, the deferred amount (loss) on refunding, is being amortized as a component of interest expense. This accounting loss is amortized over the remaining life of the new debt and is presented net of general obligation bonds payable on the Statement of Net Assets. R. Bond Premiums On the government-wide financial statements, bond premiums are deferred and amortized over the term of the bonds using the straight-line method. Bond premiums are presented as an increase of the face amount of the general obligation bonds payable. On fund financial statements, bond premiums are receipted in the year the bonds are issued. S. Contributions of Capital Contributions of capital in proprietary fund financial statements arise from outside contributions of capital assets, tap-in fees to the extent they exceed the cost of the connection to the system, or from grants or outside contributions of resources restricted to capital acquisition and construction. T. Interfund Activity Transfers between governmental and business-type activities on the government-wide statements are reported in the same manner as general revenues. Exchange transactions between funds are reported as revenues in the seller funds and as expenditures/expenses in the purchaser funds. Flows of cash or goods from one fund to another without a requirement for repayment are reported as interfund transfers. Interfund transfers are reported as other financing sources/uses in governmental funds and after nonoperating revenues/expenses in proprietary funds. Repayments from funds responsible for particular expenditures/expenses to the funds that initially paid for them are not presented on the financial statements.

City of North Olmsted, Ohio Notes to the Basic Financial Statements (Continued) For the Year Ended December 31, 2010
41
Note 2: Summary of Significant Accounting Policies (continued) U. Extraordinary and Special Items Extraordinary items are transactions or events that are both unusual in nature and infrequent in occurrence. Special items are transactions or events that are within the control of the City Administration and that are either unusual in nature or infrequent in occurrence. Neither occurred in 2010. V. Estimates The preparation of the financial statements in conformity with generally accepted accounting principles requires management to make estimates and assumptions that affect the amounts reported in the financial statements and accompanying notes. Actual results may differ from those estimates. W. Subsequent Events In preparing these financial statements, the City has evaluated events and transactions for potential recognition or disclosure through June 24, 2011, the date the financial statements were available to be issued. Note 3: Change in Accounting Principles For 2010, the City has implemented Governmental Accounting Standards Board (GASB) Statement No. 51, Accounting and Financial Reporting for Intangible Assets, GASB Statement No. 53, Accounting and Financial Reporting for Derivative Instruments, and GASB Statement No. 58, Accounting and Financial Reporting for Chapter 9 Bankruptcies. GASB Statement No. 51 establishes accounting and financial reporting requirements for intangible assets to reduce inconsistencies thereby enhancing the comparability of accounting and financial reporting of such assets among state and local governments. The implementation of this statement did not result in any changes to the financial statements. GASB Statement No. 53 enhances the usefulness and comparability of derivative instrument information reported by the state and local governments. This statement provides a comprehensive framework for the measurement, recognition, and disclosure of derivative instrument transactions. The implementation of this statement did not result in any changes to the financial statements. GASB Statement No. 58 provides accounting and financial reporting guidance for governments that have petitioned for protection from creditors by filing for bankruptcy under Chapter 9 of the United States Bankruptcy Code. The requirements in this statement will provide more consistent recognition, measurement, display, and disclosure guidance for governments that file for Chapter 9 bankruptcy. The implementation of this statement did not result in any changes to the financial statements as the City has not applied for such protection.

City of North Olmsted, Ohio Notes to the Basic Financial Statements (Continued) For the Year Ended December 31, 2010
42
Note 4: Accountability There are deficits in the Springvale Golf Course and Ballroom Fund and the FEMA Grant Fund of $1,574,129 and $132, respectively. The deficit in the Springvale Golf Course and Ballroom Fund is the result of interfund loans which are used to finance the debt payments until resources are accumulated to repay the General Obligation Bond Retirement Fund. The deficit in the FEMA Grant Fund is caused by the application of accounting principles generally accepted in the United States of America to these funds. The General Fund is liable for any deficit in this fund and provides operating transfers when cash is required, not when accruals occur. Note 5: Budgetary Basis of Accounting While the City is reporting financial position, results of operations, and changes in fund balances on the accrual basis as required by generally accepted accounting principles (GAAP), the budgetary basis, as provided by law, is based upon accounting for certain transactions on the basis of cash receipts, disbursements, and encumbrances. The Statement of Revenues, Expenditures, and Changes in Fund Balance - Budget (Non-GAAP Basis) and Actual presented for the General Fund and Permanent Improvements Fund are presented on the budgetary basis to provide a meaningful comparison of actual results with the budget. The major differences between the budget basis and the GAAP basis are that:
(a) Revenues are recorded when received in cash (budget basis) as opposed to when susceptible
to accrual (GAAP basis). (b) Expenditures are recorded when paid in cash (budget basis) as opposed to when the liability
is incurred (GAAP basis). (c) Encumbrances are treated as expenditures (budget basis) rather than as a reservation of fund
balance (GAAP basis). The following table summarizes the adjustments necessary to reconcile the GAAP basis statements to the budget basis statements for the General Fund and Permanent Improvements Fund.
Net Change in Fund Balance
Permanent General Improvements GAAP basis $ 902,901 $ (164,645) Increase (decrease) due to: Revenue accruals 185,795 4,330,654 Expenditure accruals (218,019) (4,232,216) Outstanding encumbrances (470,671) (93,011) Budget basis $ 400,006 $ (159,218)

City of North Olmsted, Ohio Notes to the Basic Financial Statements (Continued) For the Year Ended December 31, 2010
43
Note 6: Deposits and Investments State statutes classify monies held by the City into three categories. Active deposits are public deposits necessary to meet current demands on the treasury. Such monies must be maintained either as cash in the City Treasury, in commercial accounts payable or withdrawable on demand, including negotiable order of withdrawal (NOW) accounts, or in money market deposit accounts. Inactive deposits are public deposits that Council has identified as not required for use within the current five year period of designation of depositories. Inactive deposits must either be evidenced by certificates of deposit maturing not later than the end of the current period of designation of depositories, or by savings or deposit accounts including, but not limited to, passbook accounts. Interim deposits are deposits of interim monies. Interim monies are those monies which are not needed for immediate use but which will be needed before the end of the current period of designation of depositories. Interim deposits must be evidenced by time certificates of deposit maturing not more than one year from the date of deposit or by savings or deposit accounts including passbook accounts. Protection of the City’s deposits is provided by the Federal Deposit Insurance Corporation, by eligible securities pledged by the financial institution as security for repayment, by surety company bonds deposited with the treasurer by the financial institution or by a single collateral pool established by the financial institution to secure the repayment of all public monies deposited with the institution. Interim monies can be invested in the following obligations:
1. United States treasury notes, bills, bonds, or any other obligation or security issued by the United States treasury or any other obligation guaranteed as to principal and interest by the United States;
2. Bonds, notes, debentures, or any other obligations or securities issued by any federal
government agency or instrumentality, including but not limited to, the Federal National Mortgage Association, Federal Home Loan Bank, Federal Farm Credit Bank, Federal Home Loan Mortgage Corporation, Government National Mortgage Association, and Student Loan Marketing Association. All federal agency securities shall be direct issuances of federal government agencies or instrumentalities;
3. Written repurchase agreements in the securities listed above provided that the market value
of the securities subject to the repurchase agreement must exceed the principal value of the agreement by at least two percent and be marked to market daily, and that the term of the agreement must not exceed thirty days;
4. Bonds and other obligations of the State of Ohio; 5. No-load money market mutual funds consisting exclusively of obligations described in (1) or
(2) of this and repurchase agreements secured by such obligations, provided that investments in securities described in this division are made only through eligible institutions; and
6. The State Treasurer’s investment pool (STAROhio).

City of North Olmsted, Ohio Notes to the Basic Financial Statements (Continued) For the Year Ended December 31, 2010
44
Note 6: Deposits and Investments (continued) Investments may only be made through specified dealers and institutions. Payment for investments may be made only upon delivery of the securities representing the investments to the finance director or, if the securities are not represented by certificate, upon receipt of confirmation of transfer from the custodian. Investments in stripped principal or interest obligations, reverse repurchase agreements and derivatives are prohibited. The issuance of taxable notes for the purpose of arbitrage, the use of leverage and short selling are also prohibited. An investment must mature within five years from the date of purchase unless matched to a specific obligation or debt of the City, and must be purchased with the expectation that it will be held to maturity. Deposits Custodial credit risk is the risk that in the event of bank failure, the City’s deposits may not be returned to it. The City has no deposit policy for custodial risk beyond the requirements of State statute. Ohio law requires that deposits either be insured or protected by eligible securities pledged to and deposited either within the City or a qualified trustee by the financial institution as security for repayment, or by a collateral pool of eligible securities deposited with a qualified trustee and pledged to secure the repayment of all public monies deposited in the financial institution whose market value at all times shall be at least one hundred and five percent of the deposits being secured. At year-end, the carrying amount of the City’s deposits was $12,862,873 and the bank balance was $13,055,886. Of the bank balance $3,742,067 was covered by Federal depository insurance and $9,313,819 was uninsured and collateralized with securities held by the pledging institution’s trust department, not in the City’s name. Investments Investments are reported at fair value. As of December 31, 2010, the City had the following investments: Maturity Less than One Fair Value Year Federal Home Loan Bank $ 1,555,250 $ 1,555,250 Federal Home Loan Mortgage Corporation 249,679 249,679 Total $ 1,804,929 $ 1,804,929 Interest Rate Risk arises because potential purchasers of debt securities will not agree to pay face value for those securities if interest rates subsequently increase. The City’s investment policy addresses interest rate risk requiring that the City’s investment portfolio be structured so that securities mature to meet cash requirements for ongoing operations and/or long-term debt payments, thereby avoiding that need to sell securities on the open market prior to maturity and by investing operating funds primarily in short-term investments. The City investment policy also limits security purchases to those that mature no later than five years from purchase unless specifically matched to a specific cash flow. To date, no investments have been purchased with a life greater than one year.
City of North Olmsted, Ohio Notes to the Basic Financial Statements (Continued) For the Year Ended December 31, 2010
45
Note 6: Deposits and Investments (continued) Custodial Risk for investments is the risk that, in the event of the failure of the counterparty to a transaction, the City will not be able to recover the value of investment or collateral securities that are in the possession of an outside party. The securities underlying the repurchase agreements are exposed to custodial credit risk in that they are uninsured, unregistered and held by the counterparty. The City has no investment policy dealing with investment custodial credit risk beyond the requirement in State statute that requires securities shall be delivered into the custody of the finance director or governing board or an agent designated by the finance director or governing board. All financial institutions and broker/dealers who desire to become qualified for investment transactions with the City must meet a set of prescribed standards and be periodically reviewed. Credit Risk is addressed by the City’s investment policy by the requirements that all investments are authorized by Ohio Revised Code and that portfolio be diversified both by types of investment and issuer. All investments of the city are registered and carry a rating AAA by Standard & Poor’s. Concentration of Credit Risk is defined by the Governmental Accounting Standards Board as five percent or more in the securities of a single issuer. The City’s investment policy requires diversification of the portfolio but does not indicate specific percentage allocations. The Federal Home Loan Bank bonds represent 86.17 percent of the City’s investments. Note 7: Receivables Receivables at December 31, 2010, consisted primarily of municipal income taxes, property and other taxes, special assessments, accounts (billings for user charged services and court fines), and intergovernmental receivables arising from grants, entitlements and shared revenues. No allowance for doubtful accounts has been recorded because uncollectible amounts are expected to be insignificant. A. Property Taxes Property taxes include amounts levied against all real and public utility property located in the City. Property tax revenue received during 2010 for real and public utility property taxes represents collections of the 2009 taxes. 2010 real property taxes are levied after October 1, 2010, on the assessed value as of January 1, 2010, the lien date. Assessed values are established by State law at 35 percent of appraised market value. 2010 real property taxes are collected in and intended to finance 2011. Public utility tangible personal property currently is assessed at varying percentages of true value; public utility real property is assessed at 35 percent of true value. 2010 public utility property taxes which became a lien December 31, 2009, are levied after October 1, 2010, and are collected in 2011 with real property taxes.

City of North Olmsted, Ohio Notes to the Basic Financial Statements (Continued) For the Year Ended December 31, 2010
46
Note 7: Receivables (continued) A. Property Taxes (continued) The full tax rate for all City operations for the year ended December 31, 2010, was $13.30 per $1,000 of assessed value. The assessed values of real and tangible personal property upon which 2010 property tax receipts were based as follows: Real estate Residential/Agriculture $ 565,739,130 Commercial/Industrial/Mineral 261,830,480 Public utility 11,432,430 Total valuation $ 839,002,040 Real property taxes are payable annually or semi-annually. If paid annually, payment is due December 31; if paid semi-annually, the first payment is due December 31, with the remainder payable by June 20. Under certain circumstances, State statue permits later payment dates to be established. The County Treasurer collects property taxes on behalf of all taxing districts in the County, including the City of North Olmsted. The County Auditor periodically remits to the City its portion of the taxes collected. Property taxes receivable represents real property taxes, public utility taxes and outstanding delinquencies which are measurable as of December 31, 2010 and for which there is an enforceable legal claim. In the General Fund; Recreation, Fire Pension and Police Pension Special Revenue Funds; and General Obligation Bond Retirement, Library Bond Retirement and Fire Station Bond Retirement Debt Service Funds; the entire receivable has been offset by deferred revenue since the current taxes were not levied to finance 2010 operations and the collection of delinquent taxes during the available period is not subject to reasonable estimation. On a full accrual basis, delinquent property taxes have been recorded as revenue while the remainder of the receivable is deferred. B. Income Taxes The City levies and collects an income tax of 2 percent on all income earned within the City as well as income of residents earned outside the City. The City allows a credit of 100 percent of the tax paid to another municipality, not to exceed the amount owed. Employers within the City are required to withhold income tax on employee earnings and remit the tax to the City at least quarterly. Corporations and other individual taxpayers are also required to pay their estimated tax at least quarterly and file an annual return. Income tax revenues are distributed by a 1991 vote of the people as follows: 70 percent to the General Fund; 15 percent for solid waste management, recycling and disposal (Solid Waste Management Fund); and 15 percent for maintaining and equipping streets, storm water drainage systems and other permanent improvements, including debt charges on obligations issued after 1990 for those purposes (Permanent Improvements Fund).

City of North Olmsted, Ohio Notes to the Basic Financial Statements (Continued) For the Year Ended December 31, 2010
47
Note 7: Receivables (continued) C. Intergovernmental Receivables A summary of the principal items of intergovernmental receivables follows: Amount Governmental activities: Local government $ 612,827 Homestead and rollback 661,404 Gasoline tax 641,500 Estate tax 109,850 CAT tax reimbursement 64,071 Public utility reimbursement 64,421 Permissive tax 34,774 Court fines 25,073 Auto registration 15,636 North Olmsted City School District 9,601 Prisoner care reimbursement 479 City of Cleveland reimbursement 6,271 Miscellaneous 5,370 Miscellaneous grants 1,644 SAFER grant 37,344 Total governmental activities 2,290,265 Business-type activities: Sewer charges 2,407,711 City of Fairview Park 107,981 Total business-type activities 2,515,692 Total $ 4,805,957 The City financed sanitary sewer system improvements through the issuance of general obligation bonds and an OWDA loan. The sanitary sewer system provides sewer services for part of the City of Fairview Park. The City of Fairview Park has agreed to pay the City 5.24 percent of the debt retirement related to the improvement and a capital surcharge. An intergovernmental receivable of $107,981 has been recorded on the Statement of Net Assets.

City of North Olmsted, Ohio Notes to the Basic Financial Statements (Continued) For the Year Ended December 31, 2010
48
Note 8: Capital Assets A summary of changes in capital assets during 2010 follows: Balance Balance 12/31/09 Additions Disposals 12/31/10 Governmental activities: Capital assets not being depreciated: Land $ 4,054,455 $ - $ - $ 4,054,455 Art 23,000 - - 23,000 Construction in progress 154,606 165,477 (301,097) 18,986 Total capital assets not being depreciated 4,232,061 165,477 (301,097) 4,096,441 Capital assets, being depreciated: Land improvements 953,428 - - 953,428 Buildings and improvements 28,998,496 174,109 - 29,172,605 Furniture and fixtures 772,818 19,144 - 791,962 Vehicles and equipment 9,070,014 399,177 (288,719) 9,180,472 Infrastructure: Roads 127,338,828 9,341,103 (358,542) 136,321,389 Bridges and culverts 3,101,565 - - 3,101,565 Total capital assets, being depreciated 170,235,149 9,933,533 (647,261) 179,521,421 Less accumulated depreciation: Land improvements (508,298) (47,629) - (555,927) Buildings and improvements (12,972,139) (762,155) - (13,734,294) Furniture and fixtures (534,517) (87,399) - (621,916) Vehicles and equipment (6,933,633) (431,008) 244,391 (7,120,250) Infrastructure: Roads (85,116,084) (5,724,776) 284,418 (90,556,442) Bridges and culverts (1,520,003) (74,255) - (1,594,258) Total accumulated depreciation (107,584,674) (7,127,222) 528,809 (114,183,087) Total capital assets, being depreciated, net 62,650,475 2,806,311 (118,452) 65,338,334 Total governmental capital assets, net $ 66,882,536 $ 2,971,788 $ (419,549) $ 69,434,775

City of North Olmsted, Ohio Notes to the Basic Financial Statements (Continued) For the Year Ended December 31, 2010
49
Note 8: Capital Assets (continued) Balance Balance 12/31/09 Additions Disposals 12/31/10 Business-type activities: Capital assets not being depreciated: Land $ 2,617,895 $ - $ - $ 2,617,895 Land improvements, not depreciated 19,453 - - 19,453 Construction in progress 628,446 603,801 - 1,232,247 Total capital assets not being depreciated 3,265,794 603,801 - 3,869,595 Capital assets, being depreciated: Land improvements 1,170,155 7,334 - 1,177,489 Buildings and improvements 23,216,653 - - 23,216,653 Furniture and fixtures 23,058 - - 23,058 Vehicles and equipment 34,727,807 359,166 (169,382) 34,917,591 Sanitary sewer lines 14,064,897 - - 14,064,897 Total capital assets, being depreciated 73,202,570 366,500 (169,382) 73,399,688 Less accumulated depreciation: Land improvements (466,794) (58,093) - (524,887) Buildings and improvements (16,165,397) (445,898) - (16,611,295) Furniture and fixtures (23,058) - - (23,058) Vehicles and equipment (24,049,496) (801,453) 166,089 (24,684,860) Sanitary sewer lines (7,753,975) (277,555) - (8,031,530) Total accumulated depreciation (48,458,720) (1,582,999) 166,089 (49,875,630) Total capital assets, being depreciated, net 24,743,850 (1,216,499) (3,293) 23,524,058 Total business-type capital assets, net $ 28,009,644 $ (612,698) $ (3,293) $ 27,393,653 Depreciation expense was charged to governmental functions as follows: General government $ 455,339 Security of persons and property 409,768 Transportation 5,949,417 Leisure time activities 312,698 Total $ 7,127,222

City of North Olmsted, Ohio Notes to the Basic Financial Statements (Continued) For the Year Ended December 31, 2010
50
Note 9: Defined Benefit Pension Plans A. Ohio Public Employees Retirement System The City participates in the Ohio Public Employees Retirement System (OPERS). OPERS administers three separate pension plans. The Traditional Plan is a cost-sharing, multiple-employer defined benefit pension plan. The Member-Directed Plan is a defined contribution plan in which the member invests both member and employer contributions (employer contributions vest over five years at 20% per year). Under the Member-Directed Plan, members accumulate retirement assets equal to the value of the member and vested employer contributions plus any investment earnings. The Combined Plan is a cost-sharing, multiple-employer defined benefit pension plan. Under the Combined Plan, OPERS invests employer contributions to provide a formula retirement benefit similar in nature to the Traditional Plan Benefit. Member contributions, the investment of which is self-directed by the members, accumulate retirement assets in a manner similar to the Member-Directed Plan. OPERS provides retirement, disability, survivor and death benefits and annual cost of living adjustments to members of the Traditional and Combined Plans. Members of the Member-Directed plan do not qualify for ancillary benefits. Authority to establish and amend benefits is provided by Chapter 145 of the Ohio Revised Code. OPERS issues a stand-alone financial report that may be obtained by writing to OPERS, 277 East Town Street, Columbus, OH 43215-4642 or by calling (614) 222-5601 or 800-222-7377. The Ohio Revised Code provides statutory authority for member and employer contributions. For 2010, member and employer contribution rates were consistent across all three plans. For the year ended December 31, 2010, the members of all three plans were required to contribute 10.0 percent of their annual covered salary to fund pension obligations. The City contributed 14.0 percent of covered payroll. The City’s required contributions for pension obligations to the Traditional and Combined Plans for the years ended December 31, 2010, 2009, and 2008 were $627,223, $628,178, and $593,691, respectively, 93 percent has been contributed for 2010, the remaining 7 percent has been recorded as a liability and 100 percent of contributions have been made for 2009 and 2008. Contributions to the member-directed plan for 2010 were $5,838 made by the City of North Olmsted and $4,170 made by the plan members. B. Ohio Police and Fire Pension Fund The City contributes to the Ohio Police and Fire Pension Fund (OP&F), a cost-sharing multiple-employer defined benefit pension plan. OP&F provides retirement and disability pension benefits, annual cost-of-living adjustments, and death benefits to plan members and beneficiaries. Benefit provisions are established by the Ohio State Legislature and are codified in Chapter 742 of the Ohio Revised Code. OP&F issues a publicly available financial report that includes financial information and required supplementary information for the plan. That report may be obtained by writing to OP&F, 140 East Town Street, Columbus, Ohio 43215-5164.

City of North Olmsted, Ohio Notes to the Basic Financial Statements (Continued) For the Year Ended December 31, 2010
51
Note 9: Defined Benefit Pension Plans (continued) B. Ohio Police and Fire Pension Fund (continued) Plan members are required to contribute 10.00 percent of their annual covered salary, while employers are required to contribute 19.50 percent for police officers and 24.00 percent for firefighters. Contributions are authorized by state statute. The City’s contributions to OP&F for police and firefighters (not including health care contributions) were $445,264 and $498,199 for the year ended December 31, 2010, $469,825 and $514,449 for the year ended December 31, 2009, and $534,077 and $592,075 for the year ended December 31, 2008. The full amount has been contributed for 2009 and 2008. For 2010, 76 percent for police and 75 percent for firefighters has been contributed with the remainder being reported as a liability. Note 10: Postemployment Benefits A. Ohio Public Employees Retirement System The Ohio Public Employees Retirement System (OPERS) administers three separate pension plans: the Traditional Plan – a cost-sharing multiple-employer defined benefit pension plan; the Member-Directed Plan – a defined contribution plan; and the Combined Plan – a cost-sharing multiple-employer defined benefit pension plan that has elements of both a defined benefit and defined contribution plan. OPERS maintains a cost-sharing multiple employer defined benefit postemployment healthcare plan, which includes a medical plan, prescription drug program and Medicare Part B premium reimbursement, to qualifying members of both the Traditional Pension and the Combined Plans. Members of the Member-Directed Plan do not qualify for ancillary benefits, including postemployment health care coverage. In order to qualify for post-retirement health care coverage, age-and-service retirees under the Traditional Pension and Combined Plans must have 10 or more years of qualifying Ohio service credit. Health care coverage for disability benefit recipients and qualified survivor benefit recipients is available. The health care coverage provided by OPERS meets the definition of an Other Post Employment Benefit (OPEB) as described in GASB Statement 45. The Ohio Revised Code permits, but does not mandate, OPERS to provide OPEB benefits to its eligible members and beneficiaries. Authority to establish and amend benefits is provided in Chapter 145 of the Ohio Revised Code. OPERS issues a stand-alone financial report that may be obtained by writing to OPERS, 277 East Town Street, Columbus, OH, 43215-4642, or by calling (614) 222-5601 or 800-222-7377. The Ohio Revised Code provides the statutory authority requiring public employers to fund postretirement health care through their contributions to OPERS. A portion of each employer’s contribution to OPERS is set aside for the funding of post retirement health care benefits. Employer contribution rates are expressed as a percentage of the covered payroll of active members. In 2010, the City contributed at a rate of 14.0 percent of covered payroll. The Ohio Revised Code currently limits the employer contribution to a rate not to exceed 14.0 percent of covered payroll for state and local employer units. Active members do not make contributions to the OPEB Plan.

City of North Olmsted, Ohio Notes to the Basic Financial Statements (Continued) For the Year Ended December 31, 2010
52
Note 10: Postemployment Benefits (continued) A. Ohio Public Employees Retirement System (continued) OPERS’ Post Employment Health Care plan was established under, and is administered in accordance with, Internal Revenue Code 401(h). Each year, the OPERS Retirement Board determines the portion of the employer contribution rate that will be set aside for funding of the postemployment health care benefits. The portion of employer contributions allocated to health care for members in the Traditional Plan was 5.5% from January 1 through February 28, 2010 and 5.0% from March 1 through December 31, 2010. The portion of employer contributions allocated to health care for members in the Combined Plan was 4.73% from January 1 through February 28, 2010, and 4.23% from March 1 through December 31, 2010. The OPERS Retirement Board is also authorized to establish rules for the payment of a portion of the health care coverage by the retiree or their surviving beneficiaries. Payment amounts vary depending on the number of covered dependents and the coverage selected. The City’s contributions for health care for the years ended December 31, 2010, 2009, and 2008 were $360,859, $454,882, and $593,691, respectively. The full amount has been contributed for 2009 and 2008. For 2010, 93 percent has been contributed for 2010 with the remainder being reported as a liability. The Health Care Preservation Plan (HCPP) adopted by the OPERS Retirement Board on September 9, 2004, was effective January 1, 2007. Member and employer contribution rates increased on January 1 of each year from 2006 to 2008, which allowed additional funds to be allocated to the health care plan. B. Ohio Police and Fire Pension Fund The City contributes to the Ohio Police and Fire Pension Fund (OP&F) sponsored health care program, a cost-sharing multiple-employer defined postemployment health care plan administered by OP&F. OP&F provides healthcare benefits including coverage for medical, prescription drugs, dental, vision, Medicare Part B Premium and long term care to retirees, qualifying benefit recipients and their eligible dependents. OP&F provides access to post retirement health care coverage for any person who receives or is eligible to receive a monthly service, disability, or survivor benefit check or is a spouse or eligible dependent child of such person. The health care coverage provided by OP&F meets the definition of an Other Post Employment Benefit (OPEB) as described in GASB Statement 45. The Ohio Revised Code allows, but does not mandate OP&F to provide OPEB benefits. Authority for the OP&F Board of Trustees to provide health care coverage to eligible participants and to establish and amend benefits is codified in Chapter 742 of the Ohio Revised Code. OP&F issues a publicly available financial report that includes financial information and required supplementary information for the Plan. That report may be obtained by writing to OP&F, 140 East Town Street, Columbus, Ohio 43215-5164.

City of North Olmsted, Ohio Notes to the Basic Financial Statements (Continued) For the Year Ended December 31, 2010
53
Note 10: Postemployment Benefits (continued) B. Ohio Police and Fire Pension Fund (continued) The Ohio Revised Code provides for contribution requirements of the participating employers and of the plan members to the OP&F (defined benefit pension plan). Participating employers are required to contribute to the pension plan at rates expressed as percentages of the payroll of active pension plan members, currently, 19.5 percent and 24.0 percent of covered payroll for police and fire employers, respectively. The Ohio Revised Code states that the employer contribution may not exceed 19.5 percent of the covered payroll for police employer units and 24.0 percent of covered payroll for fire employer units. Active members do not make contributions to the OPEB Plan. OP&F maintains funds for health care in two separate accounts. One for health care benefits under an IRS Code Section 115 trust and one for Medicare Part B reimbursements administered as an Internal Revenue Code 401(h) account, both of which are within the defined benefit pension plan, under the authority granted by the Ohio Revised Code to the OP&F Board of Trustees. The Board of Trustees is authorized to allocate a portion of the total employer contributions made into the pension plan to the Section 115 trust and the Section 401(h) account as the employer contribution for retiree health care benefits. For the year ended December 31, 2010, the employer contribution allocated to health care plan was 6.75 percent of covered payroll. The amount of employer contributions allocated to the health care plan each year is subject to the Trustees’ primary responsibility to ensure that pension benefits are adequately funded and is limited by the provisions of Sections 115 and 401(h). The OP&F Board of Trustees also is authorized to establish requirements for contributions to the health care plan by retirees and their eligible dependents, or their surviving beneficiaries. Payment amounts vary depending on the number of covered dependents and the coverage selected. The City’s contributions to OP&F for police and fire for the years ending December 31, 2010, 2009, and 2008 were $680,832 and $692,905, $718,387 and $715,506, and $816,631 and $823,470, respectively, of which $235,568 and $194,706, $248,562 and $201,057, and $282,554 and $231,395, respectively, was allocated to the health care plan. The full amount has been contributed for 2009 and 2008. For 2010, 76 percent for police and 75 percent for firefighters has been contributed, with the remainder being reported as a liability. Note 11: Risk Management A. Property and Liability The City is exposed to various risks of loss related to torts; theft of, damage to, and destruction of assets; errors and omissions; injuries to employees; and natural disasters. By maintaining comprehensive insurance coverage with private carriers, the City has addressed these various types of risk. There were no reductions in insurance coverage from the previous year. Settled claims have not exceeded this commercial coverage in any of the past three years.

City of North Olmsted, Ohio Notes to the Basic Financial Statements (Continued) For the Year Ended December 31, 2010
54
Note 11: Risk Management (continued) B. Health Insurance Benefits The City provides health, dental and vision insurance to its employees through a self-insurance plan. The City pays the monthly premium for the self-insurance plan. The City contracts with a third party administrator to direct this program. During 2010, self-insurance was in effect for claims up to $75,000 per covered individual and $2,482,417 in aggregate. This aggregate includes both medical and drug coverage. Claims in excess of this aggregated amount are insured by private carriers. The claims liability of $172,565 as estimated by the third party administrator and reported in the Hospitalization Internal Service Fund at December 31, 2010, is based on the requirements of GASB Statement No. 30 which requires a liability for unpaid claims costs, including estimates of costs relating to incurred but not reported claims, be reported if information prior to the issuance of the financial statements indicates that it is probable that a liability has been incurred at the date of the financial statements and the amount of the loss can be reasonably estimated. The estimate was not affected by incremental claims adjustment expenses and does not include other allocated or unallocated claim adjustment expenses. Changes in the Fund’s claims liability amount in 2010 and 2009 were as follows: 2010 2009 Unpaid claims, beginning of year $ 246,081 $ 234,919 Incurred claims 1,541,400 1,832,795 Claims payments (1,614,916) (1,821,633) Unpaid claims, end of year $ 172,565 $ 246,081 C. Workers’ Compensation Program On January 1, 2009, the City was approved for self-insurance status by the Bureau of Workers’ Compensation and began to administer its own workers’ compensation program (the program). The City established the Workers’ Compensation Self-Insurance Internal Service Fund to account for assets set aside for claim settlements and related liabilities associated with the program. Liabilities of the fund are reported when an employee injury has occurred, it is probable that a claim will be filed under the program, and the amount of the claim can be reasonably estimated. The City utilizes the services of Care Works Consultants, Inc., the third party administrator, to review, process, and pay employee claims. The City also maintains excess insurance coverage which would pay the portion of claims that exceed $500,000 per occurrence for police officers and fire fighters and $450,000 per occurrence for all other employees, up to a maximum of an additional $1,000,000 per occurrence. The claims liability of $70,928 reported in the Workers’ Compensation Self-Insurance Internal Service Fund is based on the requirements of Governmental Standards Board No. 30, which requires a liability for the unpaid claims costs, including estimates of costs relating to incurred but not report claims, be reported. Changes in the Fund’s claims liability amount in 2010 and 2009 were as follows:
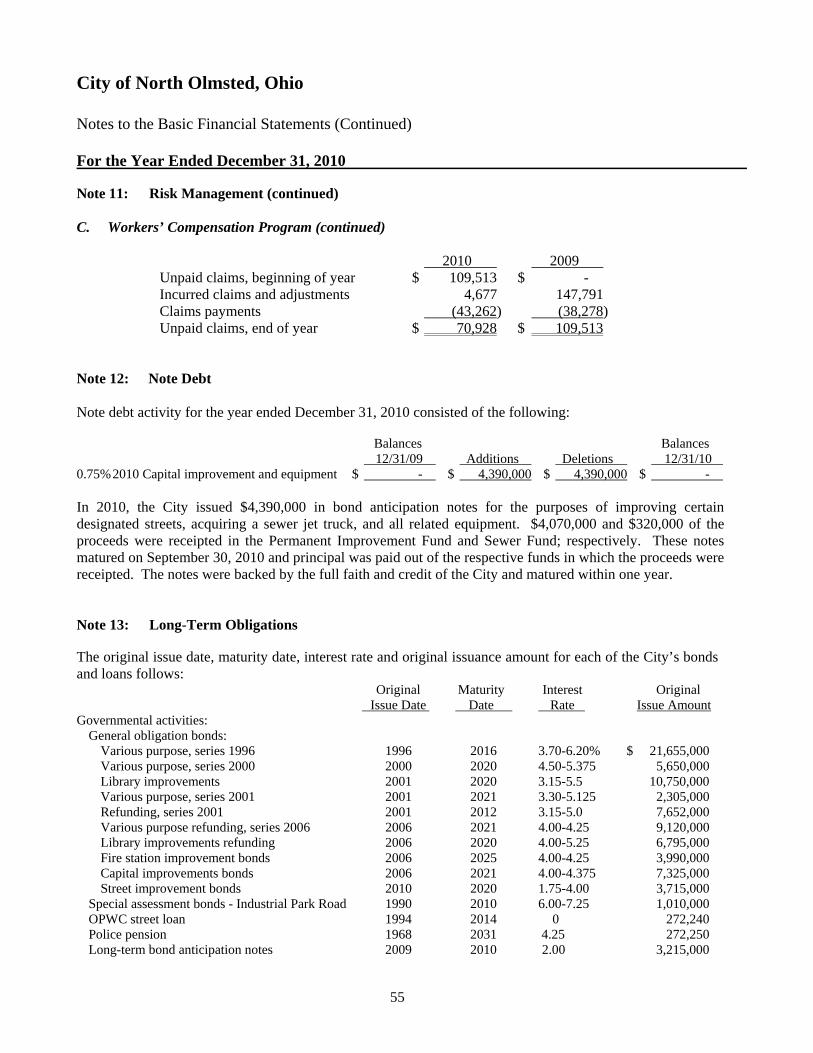
City of North Olmsted, Ohio Notes to the Basic Financial Statements (Continued) For the Year Ended December 31, 2010
55
Note 11: Risk Management (continued) C. Workers’ Compensation Program (continued) 2010 2009 Unpaid claims, beginning of year $ 109,513 $ - Incurred claims and adjustments 4,677 147,791 Claims payments (43,262) (38,278) Unpaid claims, end of year $ 70,928 $ 109,513 Note 12: Note Debt Note debt activity for the year ended December 31, 2010 consisted of the following: Balances Balances 12/31/09 Additions Deletions 12/31/10 0.75% 2010 Capital improvement and equipment $ - $ 4,390,000 $ 4,390,000 $ - In 2010, the City issued $4,390,000 in bond anticipation notes for the purposes of improving certain designated streets, acquiring a sewer jet truck, and all related equipment. $4,070,000 and $320,000 of the proceeds were receipted in the Permanent Improvement Fund and Sewer Fund; respectively. These notes matured on September 30, 2010 and principal was paid out of the respective funds in which the proceeds were receipted. The notes were backed by the full faith and credit of the City and matured within one year. Note 13: Long-Term Obligations The original issue date, maturity date, interest rate and original issuance amount for each of the City’s bonds and loans follows: Original Maturity Interest Original Issue Date Date Rate Issue Amount Governmental activities: General obligation bonds: Various purpose, series 1996 1996 2016 3.70-6.20% $ 21,655,000 Various purpose, series 2000 2000 2020 4.50-5.375 5,650,000 Library improvements 2001 2020 3.15-5.5 10,750,000 Various purpose, series 2001 2001 2021 3.30-5.125 2,305,000 Refunding, series 2001 2001 2012 3.15-5.0 7,652,000 Various purpose refunding, series 2006 2006 2021 4.00-4.25 9,120,000 Library improvements refunding 2006 2020 4.00-5.25 6,795,000 Fire station improvement bonds 2006 2025 4.00-4.25 3,990,000 Capital improvements bonds 2006 2021 4.00-4.375 7,325,000 Street improvement bonds 2010 2020 1.75-4.00 3,715,000 Special assessment bonds - Industrial Park Road 1990 2010 6.00-7.25 1,010,000 OPWC street loan 1994 2014 0 272,240 Police pension 1968 2031 4.25 272,250 Long-term bond anticipation notes 2009 2010 2.00 3,215,000

City of North Olmsted, Ohio Notes to the Basic Financial Statements (Continued) For the Year Ended December 31, 2010
56
Note 13: Long-Term Obligations (continued) Original Maturity Interest Original Issue Date Date Rate Issue Amount Business-type activities: General obligation bonds: Various purpose, series 1996 1996 2021 3.70-6.20% $ 20,550,000 Various purpose, series 2000 2000 2020 4.50-5.375 1,195,000 Golf course improvements 2001 2021 3.30-5.125 2,500,000 Various purpose and golf course improvements refunding, series 2006 2006 2021 4.00-4.25 10,525,000 Capital improvement bonds 2006 2021 4.00-4.375 450,000 Golf course and ballroom improvements 2007 2011 4.25 112,000 Sewer truck bonds 2010 2020 1.75-4.00 290,000 OWDA sanitary sewer loan 1997 2017 4.12 1,060,795 OWDA sanitary sewer loan 2008 2014 3.20 50,000 OWDA sanitary sewer loan 2009 2015 3.20 1,235,383 OPWC sanitary sewer loan 1994 2014 0 272,250
This space intentionally left blank

City of North Olmsted, Ohio Notes to the Basic Financial Statements (Continued) For the Year Ended December 31, 2010
57
Note 13: Long-Term Obligations (continued) Changes in long-term obligations during the year ended December 31, 2010, consisted of the following: Balance Balance Amounts Due 12/31/09 Increase Decrease 12/31/10 in One Year Governmental activities: General obligation bonds: Various purpose bonds 1996 $ 2,770,000 $ - $ 1,365,000 $ 1,405,000 $ 1,405,000 Various purpose bonds 2000 595,000 - 595,000 - - Various purpose bonds 2001 465,000 - 160,000 305,000 165,000 Various purpose bonds refunding 9,017,000 - 21,000 8,996,000 89,000 Premium on various purpose bonds 145,074 - 12,090 132,984 - Loss on refunding (166,901) - (13,908) (152,993) - Total various purpose bonds 12,825,173 - 2,139,182 10,685,991 1,659,000 Library improvements 510,000 - 510,000 - - Library improvements refunding 6,745,000 - 10,000 6,735,000 550,000 Premium on library improvements bonds 341,141 - 31,013 310,128 - Loss on refunding (254,381) - (23,125) (231,256) - Total library improvements bonds 7,341,760 - 527,888 6,813,872 550,000 Refunding 2001 2,450,000 - 780,000 1,670,000 815,000 Capital improvements bonds 5,073,500 - 668,500 4,405,000 645,000 Fire station improvement bonds 3,475,000 - 150,000 3,325,000 160,000 Street improvement bonds - 3,715,000 - 3,715,000 145,000 Premium on street improvement bonds - 168,945 - 168,945 - Total general obligation bonds 31,165,433 3,883,945 4,265,570 30,783,808 3,974,000 Special assessment bonds 90,000 - 90,000 - - OPWC street loan 54,450 - 13,613 40,837 13,612 Police pension liability 96,629 - 2,828 93,801 2,950 Long-term notes 3,215,000 - 3,215,000 - - Settlements and judgments 205,985 - 205,985 - - Claims payable 355,594 1,546,077 1,658,178 243,493 190,297 Capital lease payable - 59,763 7,774 51,989 11,937 Compensated absences payable 4,696,106 1,137,623 1,306,583 4,527,146 1,600,013 Total governmental activities $ 39,879,197 $ 6,627,408 $ 10,765,531 $ 35,741,074 $ 5,792,809 Business - type activities: General obligation bonds: Various purpose bonds 1996 $ 2,255,000 $ - $ 1,095,000 $ 1,160,000 $ 1,160,000 Various purpose bonds 2000 75,000 - 75,000 - - Golf course improvements 345,000 - 110,000 235,000 115,000 Various purpose and golf course improvements bonds refunding 10,398,000 - 29,000 10,369,000 76,000 Unamortized premium 167,426 - 13,952 153,474 - Unamortized loss (265,273) - (22,107) (243,166) - Total various purpose and golf course improvements bonds 12,975,153 - 1,300,845 11,674,308 1,351,000 Capital improvement bonds 291,500 - 66,500 225,000 35,000 Sewer truck bonds - 290,000 - 290,000 55,000 Unamortized premium - 9,538 - 9,538 - Golf course and ballroom improvement bonds 46,500 - 22,500 24,000 24,000 Total general obligation bonds 13,313,153 299,538 1,389,845 12,222,846 1,465,000 OWDA sanitary sewer loans 1,018,076 486,474 67,853 1,436,697 70,578 OPWC sanitary sewer loan 782,001 - 130,333 651,668 130,333 Capital lease payable - 4,103 676 3,427 774 Compensated absences payable 501,980 295,041 256,528 540,493 246,958 Total business - type activities $ 15,615,210 $ 1,085,156 $ 1,845,235 $ 14,855,131 $ 1,913,643
City of North Olmsted, Ohio Notes to the Basic Financial Statements (Continued) For the Year Ended December 31, 2010
58
Note 13: Long-Term Obligations (continued) General obligation bonds are direct obligations of the City for which its full faith and credit are pledged for repayment. General obligation bonds are to be repaid from both voted and unvoted general property taxes levied on all taxable property located within the City, sewer user charges and golf fees. Tax monies will be received in and the debt will be retired from the General Obligation Bond and Library Bond Retirement Funds. Special assessment bonds are payable from the proceeds of assessments against the specific property owners who primarily benefited from the project. Special assessment monies will be received in and the debt will be retired from the Special Assessment Fund. In the event that property owners fail to make their special assessment payments, the City is responsible for providing the resources to meet the annual principal and interest payments. Compensated absences are generally paid from the General Fund and Recreation Fund and the Springvale Golf Course and Ballroom and Sewer Revenue Funds. The police pension liability is paid from the General Fund. The OWDA and OPWC loan liabilities are payable semiannually from the General Obligation Bond Retirement, and Sewer Bond Funds. The OPWC loans are interest free. Claims and judgments will be paid from the General Fund. During the year, the City obtained partial proceeds from an Ohio Water Development Authority (“OWDA”) loan that relates to the waste water treatment plant improvements to be repaid in semi-annual principal and interest payments beginning in 2012. The City has not yet collected the total proceeds to be received on this loan and as a result, the debt maturity schedule below does not reflect any amounts for principal or interest. When the loan is finalized, the principal and interest will be included below. In 2006, the City defeased a portion of library improvement bonds, various general obligation bonds and golf course improvement bonds in order to take advantage of lower interest rates. The proceeds of the new bonds were placed in an irrevocable trust to provide for all future debt service payments on the old bonds. Accordingly, the trust account assets and liabilities for the defeased bonds are not included in the City’s basic financial statements. At December 31, 2010, $26,040,000 of the defeased bonds are still outstanding. In 2001, the City defeased certain general obligation bonds by placing the proceeds of new bonds in an irrevocable trust to provide for all future debt service payments on the old bonds. Accordingly, the trust account assets and the liability for the defeased bonds are not included in the City’s basic financial statements. At December 31, 2010, $1,715,000 of bonds outstanding are considered to be defeased. The City’s overall legal debt margin was $61,864,300 at December 31, 2010. Principal and interest requirements to retire the long-term obligations outstanding at December 31, 2010, are as follows:

City of North Olmsted, Ohio Notes to the Basic Financial Statements (Continued) For the Year Ended December 31, 2010
59
Note 13: Long-Term Obligations (continued) Governmental Activities General Obligation Bonds OPWC Loans Year Principal Interest Principal 2011 $ 3,974,000 $ 1,362,175 $ 13,612 2012 3,868,000 1,170,295 13,612 2013 3,372,000 1,008,898 13,613 2014 3,452,000 875,691 - 2015 3,572,000 713,516 - 2016-2020 9,758,000 2,012,329 - 2021-2025 2,560,000 352,075 - Totals $ 30,556,000 $ 7,494,979 $ 40,837 Governmental Activities Total Police Pension Governmental Activities Year Principal Interest Principal Interest 2011 $ 2,950 $ 3,956 $ 3,990,562 $ 1,366,131 2012 3,077 3,829 3,884,689 1,174,124 2013 3,209 3,697 3,388,822 1,012,595 2014 3,347 3,559 3,455,347 879,250 2015 3,490 3,415 3,575,490 716,931 2016-2020 19,833 14,694 9,777,833 2,027,023 2021-2025 24,475 10,052 2,584,475 362,127 2026-2030 30,202 4,325 30,202 4,325 2031 3,218 68 3,218 68 Totals $ 93,801 $ 47,595 $ 30,690,638 $ 7,542,574 Business-Type Activities General Obligation Bonds OWDA Loans Year Principal Interest Principal Interest 2011 $ 1,465,000 $ 550,447 $ 70,578 $ 18,700 2012 1,517,000 466,727 73,423 15,854 2013 1,598,000 406,085 76,384 12,893 2014 1,673,000 341,636 74,056 9,811 2015 1,763,000 259,086 71,508 4,168 2016-2020 3,797,000 481,167 112,881 4,682 2021 490,000 20,825 - - Totals $ 12,303,000 $ 2,525,973 $ 478,830 $ 66,108

City of North Olmsted, Ohio Notes to the Basic Financial Statements (Continued) For the Year Ended December 31, 2010
60
Note 13: Long-Term Obligations (continued) Business-Type Activities Total OPWC Loans Business-Type Activities Year Principal Principal Interest 2011 $ 130,333 $ 1,665,911 $ 569,147 2012 130,333 1,720,756 482,581 2013 130,334 1,804,718 418,978 2014 130,334 1,877,390 351,447 2015 130,334 1,964,842 263,254 2016-2020 - 3,909,881 485,849 2021 - 490,000 20,825 Totals $ 651,668 $ 13,433,498 $ 2,592,081 Note 14: Lease Obligations The City entered into lease agreements for several copiers. The City’s lease obligations meet the criteria of a capital lease and have been recorded on the government-wide statements. Capital lease payments have been reclassified and are reflected as debt service expenses in the fund financial statements for the General Fund, Recreation Fund and Senior Center Fund. These expenditures are reflected as capital outlay expenditures on a budgetary basis. The original amounts capitalized for the capital leases and the book value as of December 31, 2010 follows: Governmental Business-Type Activities Activities Assets: Vehicles and equipment $ 59,763 $ 4,103 Less: accumulated depreciation (4,269) (293) Current book value $ 55,494 $ 3,810 The following is a schedule of the future long-term minimum lease payments required under the capital leases and the present value of the minimum lease payments as of December 31, 2010. Governmental Business-Type Year Activities Activities 2011 $ 14,487 $ 932 2012 14,487 932 2013 14,487 932 2014 13,723 932 2015 823 78 Total minimum lease payments 58,007 3,806 Less: amount representing interest (6,018) (379) Present value of minimum lease payments $ 51,989 $ 3,427

City of North Olmsted, Ohio Notes to the Basic Financial Statements (Continued) For the Year Ended December 31, 2010
61
Note 14: Lease Obligations (continued) The following is a schedule of the future long-term minimum lease payments required under operating leases that have initial or remaining noncancellable lease terms in excess of one year as of December 31, 2010. Governmental Business-Type Year Activities Activities 2011 $ 1,447 $ 69,650 2012 1,447 - 2013 598 - Total minimum lease payments $ 3,492 $ 69,650 The total costs for operating leases in 2010 were $1,447 and $69,650 for governmental activities and business-type activities, respectively. Note 15: Compensated Absences Vacation leave is earned at rates which vary depending upon length of service and standard work week. City employees are paid for earned, unused vacation leave at the time of termination of employment if the employee has acquired at least one year of service to the City. Sick leave is earned at the rate of 10 hours for each month worked. Each employee upon retirement is paid for a portion of the employee’s earned unused sick leave balances, from 900 hours to 1,500 hours, depending upon the union contract and termination with the City. Note 16: Construction and Other Significant Commitments At December 31, 2010, the City’s significant contractual commitments consisted of: Contract Amount Remaining on Project Amount Paid Contract Emergency food cupboard renovation $ 148,400 $ 18,986 $ 129,414

City of North Olmsted, Ohio Notes to the Basic Financial Statements (Continued) For the Year Ended December 31, 2010
62
Note 17: Interfund Transfers and Balances A. Interfund Transfers Interfund transfers for the year ended December 31, 2010 consisted of the following: Transfer From Permanent Nonmajor General Improvements Governmental Transfer to: Fund Fund Funds Total General Obligation Bond Retirement Fund $ - $ 1,520,570 $ 222,673 $ 1,743,243 Nonmajor Governmental Funds 71,526 - 46,000 117,526 Springvale Golf and Ballroom Fund 75,800 - - 75,800 Total $ 147,326 $ 1,520,570 $ 268,673 $ 1,936,569 The transfer to the General Obligation Bond Retirement Fund was made for the payment of debt. The transfer to the CDBG Fund from the Land and Building Acquisition Fund was for the City’s share of the Emergency Food Pantry relocation. B. Interfund Balances As of December 31, 2010, interfund balances were as follows: Receivable Payable Advance to Advance from Interfund Other Funds Interfund Other Funds Major Funds: General Fund $ 276,198 $ 509,781 $ - $ - General Obligation Bond Retirement Fund 2,078,237 - - - Nonmajor Funds: CDBG Fund - - 205,000 - FEMA Fund - - 71,198 - Total Governmental Activities 2,354,435 509,781 276,198 - Business-type Activities: Springvale Golf Course and Ballroom Fund - - 2,010,811 411,771 Sewer Fund - - 67,426 98,010 Total Business Type Activities - - 2,078,237 509,781 Total $ 2,354,435 $ 509,781 $ 2,354,435 $ 509,781 The General Obligation Bond Retirement Fund loaned the Springvale Golf Course and Ballroom Fund and Sewer Revenue Fund additional resources to meet the debt service requirements for the year. The General Fund loaned the Springvale Golf Course and Ballroom Fund and Sewer Revenue Fund operating monies that will be paid back in future years. The loans from the General Fund to the Community Development Block Grant Fund and FEMA Fund were to help pay operating expenses for these reimbursement grants.
City of North Olmsted, Ohio Notes to the Basic Financial Statements (Continued) For the Year Ended December 31, 2010
63
Note 18: Jointly Governed Organizations West Shore Council of Governments The West Shore Council of Governments helps foster cooperation between municipalities in areas affecting health, safety, welfare, education, economic conditions and regional development. The Board is comprised of one member from each of the six participating entities. The Board exercises total control over the operation of the Council including budgeting, appropriating, contracting and designating management. Budgets are adopted by the Board. Each city's degree of control is limited to its representation on the Board. In 2010, the City contributed $57,820. Complete financial information can be obtained from the City of Bay Village 350 Dover Center Road, Bay Village, Ohio 44140. The Council has established two subsidiary organizations, the West Shore Hazardous Materials Committee ("HAZ MAT") which provides hazardous material protection and assistance, and the West Shore Enforcement Bureau which provides extra assistance to cities in the form of a Swat Team. Note 19: Contingent Liabilities The City of North Olmsted is a party to legal proceedings seeking damages. City management is of the opinion that ultimate disposition of these claims and legal proceedings will not have a material effect, if any, on the financial condition of the City. Note 20: Subsequent Events On June 8, 2011, the City issued $1,365,000 in bond anticipation notes for the purposes of improving certain designated City streets, acquiring a rescue squad, acquiring equipment for Springvale Golf Course, certain improvements to Springvale Golf Course, and certain improvements to the Recreation Center. The notes mature in June, 2012 and have an interest rate of 0.809%. Note 21: Component Unit A. Summary of Significant Accounting Policies Nature of Organization - North Olmsted Commission on Paratransit, Inc. (N.O.C.O.P.) is a non-profit corporation that provides transportation to residents of the City of North Olmsted, the City of Olmsted Falls and Olmsted Township who are 60 years of age or older or disabled. N.O.C.O.P utilizes the services of a third party provider, Senior Transportation Connection, to provide transportation services to the residents. Fares are collected by the provider based on the destination and frequency that the service is used. The three communities share costs or deficits on a prorated agreement based on each community’s population. The current formula is as follows: the City of North Olmsted contributes 68.9 percent, the City of Olmsted Falls contributes 10.0 percent and Olmsted Township contributes 21.1 percent.

City of North Olmsted, Ohio Notes to the Basic Financial Statements (Continued) For the Year Ended December 31, 2010
64
Note 21: Component Unit (continued) A. Summary of Significant Accounting Policies (continued) The N.O.C.O.P. is exempt under Internal Revenue Code Section 501(c) (3) from Federal income tax. It is also currently exempt from Federal unemployment tax and Ohio franchise, personal property, and sales taxes. Financial Statement Presentation - The N.O.C.O.P. has prepared financial statements in conformity with general accepted accounting principles (GAAP) as applied to governmental units. The Governmental Accounting Standards Board (GASB) is the accepted standard-setting body for establishing governmental accounting and financial reporting principles. The N.O.C.O.P. also applies Financial Accounting Standards Board (FASB) Codification, Statements and Interpretations issued on or before November 30, 1989, provided they do not conflict with or contradict GASB pronouncements. Classification of Net Assets - Unrestricted net assets are comprised of amounts upon which donors have placed no restriction on expenditure of these assets themselves or their investment income. Temporarily restricted net assets and investment income generated by these assets comprise those amounts the expenditure of which has been restricted by donors for use during a specific time period or for a particular purpose. When such a restriction expires; that is, when a stipulated time restriction ends or a program restriction is accomplished, temporarily restricted net assets are released to unrestricted net assets and are reported in the Statement of Activities and changes in net assets. Permanently restricted net assets comprise those assets contributed to the N.O.C.O.P. by donors who have indicated an intention that the assets are to remain in perpetuity as permanent endowments of the N.O.C.O.P. Investment income generated by these assets is reported as unrestricted or temporarily restricted, depending upon whether the donors have limited the expenditure of income to a particular purpose or purposes or have indicated that such income is to be available for the general purposes of the N.O.C.O.P. At December 31, 2010, all of the assets of the N.O.C.O.P. are unrestricted. Intergovernmental Receivables - Intergovernmental receivables are derived from the monthly shared cost of services among the three communities. At December 31, 2010, intergovernmental receivables were reported at $10,729. Use of Estimates - The preparation of financial statements in conformity with generally accepted accounting principles requires management to make estimates and assumptions that affect the reported amounts of assets and liabilities and disclosure of contingent assets and liabilities at the date of the financial statements and the reported amounts of revenues and expenses during the reporting period. Actual results could differ from those estimates. B. Cash Equivalents and Cash on Hand At year end the carrying amount of the N.O.C.O.P.’s deposits were $39,568 and the bank balance was $39,568, all of which was covered by the Federal Deposit Insurance Coverage (FDIC).
City of North Olmsted, Ohio Combining Statements Non-Major Funds For the Year Ended December 31, 2010
65
Non-Major Special Revenue Funds
To account for revenues from specific sources which legally, or otherwise, are restricted to expenditures for specific purposes. Casualty Loss Fund - Accounts for resources designated to pay for property damages that are not covered by insurance. Community Development Block Grant Fund (CDBG) - Accounts for block grants received and grant reimbursement expenditures. Alcohol Education Fund - Accounts for court fees obtained from DUI cases and approved alcohol education related expenditures. Economic Development Fund - Accounts for the revenues generated from annual fees paid by new development agreements through tax abatement and community reinvestment incentives and expenditures in promoting economic development and compliance. FEMA Grant Fund - Accounts for revenues received from the federal government and expenditures as prescribed under the Federal Emergency Management Agency’s Assistance to Firefighters and Staffing for Adequate Fire and Emergency Response Grant Programs. Federal Grants Fund - Accounts for revenues received for Federal Grants and the expenditures for those grants when the terms of the grant do not require that the grant be tracked in another fund. Motor Vehicle License Tax Fund - Accounts for the additional motor vehicle registration fees designated for maintenance and repair of streets within the City. Recreation Fund - Accounts for real and personal property taxes and program revenues and expenditures for the operation and maintenance of recreation programs, services, parks and the recreation center facility. Clague Park Fund - Accounts for the receipt of a sale of land proceeds and Clague Park wireless communication tower upfront proceeds and the expenditures related to revitalizing and improving Clague Park. Hotel/Motel Tax Fund - Accounts for the three percent Hotel/Motel Tax Levy and emergency medical service nonresident ambulance receipts. Expenditures are restricted to safety equipment and up to 15% for capital improvements or building maintenance for safety use. Surplus monies from this fund can also be used to pay for any other operational needs of the police, fire and dispatch divisions, with the exception of wages and benefits. Emergency Medical Services Fund - Accounts for 25% of the resident emergency medical service’s receipts. Expenditures are restricted to capital improvements for the Fire Division of the Department of Public Safety. State Highway Fund - Accounts for the portion of the State gasoline tax and motor vehicle registration fees designated for maintenance and repair of State highways within the City.

City of North Olmsted, Ohio Combining Statements Non-Major Funds For the Year Ended December 31, 2010
66
Non-Major Special Revenue Funds (continued) Street Maintenance Fund - Accounts for the portion of State gasoline tax and motor vehicle registration fees designated for maintenance and repair of streets within the City. Solid Waste Management Fund - Accounts for 15% of the municipal income tax receipts and expenditures associated with tax collection, solid waste removal, and costs of recycling services provided to residents. Community Diversion Fund - Accounts for the federal grant receipts, County and local program fees and expenditures related to the youth community diversion program contracted with the County juvenile court system. Drug Enforcement Fund - Accounts for fines and forfeitures from drug court cases and expenditures for use in drug enforcement. Endowment and Grant Fund - Accounts for donations restricted for a specific purpose and expenditures for those specific restricted uses. Fair Capacity Housing Fund - Accounts for revenue and expenditures related to the Housing and Urban Development (HUD) Fair Capacity Housing Grant. Fire Pension Fund - Accounts for property taxes levied for the payment of current employer contributions for fire disability and pension benefits. Law Enforcement Fund - Accounts for other monies seized from criminals by law enforcement officers or the sale of contraband in the course of their work restricted for expenditures that would enhance the police services. Stop Program Fund - Accounts for fines on traffic violations restricted to paying overtime wages and benefits to officers issuing tickets under this program, wages of the prosecuting attorney and police equipment used in the STOP program. Surplus monies from this fund can be used to pay any other operational expenditure that meets the need of the police and dispatch divisions, with the exception of wages and benefits unrelated to STOP. Police Pension Fund - Accounts for property taxes levied for the payment of current employer contributions for police disability and pension benefits. Senior Center Fund - Accounts for the daily operations of the senior center and its programs and the services provided on a cost reimbursement basis to senior citizens. Title III Fund - Accounts for the hot lunch program which provides lunch to senior citizens on a cost reimbursement basis.

City of North Olmsted, Ohio Combining Statements Non-Major Funds For the Year Ended December 31, 2010
67
Non-Major Special Revenue Funds (continued) Public Way Management Fund - Accounts for fees that are levied by the City on service providers that install above ground facilities in public right of way areas and the expenditures associated with maintaining the right of way areas. Non-Major Debt Service Funds Library Bond Retirement Fund - Accounts for resources restricted to pay the principal, interest and related fiscal charges on the library bonded debt. Special Assessment Bond Retirement Fund - Accounts for the collected taxes levied by special assessment where specified improvements were levied to specific taxpayers and expenditures to pay the related applicable debt payments and the costs associated with collection and payment. Fire Station Bond Retirement Fund - Accounts for resources restricted to pay the principal, interest and related fiscal charges on the fire station funded debt.
Non-Major Capital Projects Funds
Capital Improvements Fund - Accounts for resources allocated for specific major capital improvements and the related expenditures. Library Construction Fund - Accounts for financial resources designated to construct a free and public library and related expenditures. Building and Land Acquisition and Improvement Fund - Accounts for financial resources for acquiring real property, constructing improvements, including additions to buildings, upon lands owned by the City, or for substantially rehabilitating or renovating existing City-owned buildings. Fire Construction Fund - Accounts for the financial resources designated to construct, furnish, equipment and otherwise improve a fire station. Non-Major Internal Service Funds Hospitalization Fund - Accounts for a self-insurance program for employee medical, dental and vision benefits. Workers’ Compensation Fund - Accounts for assets set aside for claim settlements and related liabilities associated with the workers’ compensation self-insurance program.

City of North Olmsted, Ohio Combining Balance Sheet Non-Major Governmental Funds December 31, 2010
68
Non-Major Non-Major Non-Major Total Special Debt Capital Non-Major Revenue Service Projects Governmental Funds Funds Funds Funds Assets: Equity in pooled cash and cash equivalents $ 3,811,227 $ 1,272,938 $ 597,791 $ 5,681,956 Income taxes receivable 456,846 - - 456,846 Taxes receivable - property and other 1,355,562 1,116,997 - 2,472,559 Intergovernmental receivable 912,151 74,595 - 986,746 Accounts receivable 2,803 - - 2,803 Prepaid items 16,138 - - 16,138 Total assets $ 6,554,727 $ 2,464,530 $ 597,791 $ 9,617,048 Liabilities and fund balances: Liabilities: Accounts and contracts payable $ 378,182 $ - $ 680 $ 378,862 Accrued wages and benefits 25,547 - - 25,547 Intergovernmental payable 33,538 - - 33,538 Interfund payable 276,198 - - 276,198 Deferred revenue 2,236,598 1,191,592 - 3,428,190 Total liabilities 2,950,063 1,191,592 680 4,142,335 Fund balances: Reserved for encumbrances 303,099 - 27,281 330,380 Unreserved, reported in: Special revenue funds 3,301,565 - - 3,301,565 Debt service funds - 1,272,938 - 1,272,938 Capital projects funds - - 569,830 569,830 Total fund balances 3,604,664 1,272,938 597,111 5,474,713 Total liabilities and fund balances $ 6,554,727 $ 2,464,530 $ 597,791 $ 9,617,048

City of North Olmsted, Ohio Combining Statement of Revenues, Expenditures and Changes in Fund Balances Non-Major Governmental Funds For the Year Ended December 31, 2010
69
Non-Major Non-Major Non-Major Total Special Debt Capital Non-Major Revenue Service Projects Governmental Funds Funds Funds Funds Revenues: Property and other local taxes $ 1,570,734 $ 1,099,052 $ - $ 2,669,786 Municipal income taxes 1,764,978 - - 1,764,978 Charges for services 1,202,458 - - 1,202,458 Fines, licenses and permits 218,867 - 1,610 220,477 Intergovernmental 1,966,399 136,759 - 2,103,158 Special assessments - 90,000 - 90,000 Investment income 3,195 12,735 - 15,930 Miscellaneous income 208,947 - - 208,947 Total revenues 6,935,578 1,338,546 1,610 8,275,734 Expenditures: Current: General government 84,039 3,044 680 87,763 Security of persons and property 873,730 - - 873,730 Public health and welfare 67,743 - - 67,743 Transportation 1,444,577 - - 1,444,577 Basic utility services 2,022,786 - - 2,022,786 Leisure time activities 2,343,545 - - 2,343,545 Economic development 211,655 - - 211,655 Capital outlay - - 122,399 122,399 Debt service: Principal 1,803 760,000 - 761,803 Interest and fiscal charges 475 526,853 - 527,328 Total expenditures 7,050,353 1,289,897 123,079 8,463,329 Excess (deficiency) of revenues over expenditures (114,775) 48,649 (121,469) (187,595) Other financing sources (uses): Sale of capital assets 1,444 - - 1,444 Inception of capital leases 10,948 - - 10,948 Transfers - in 117,526 - - 117,526 Transfers - out (222,673) - (46,000) (268,673) Total other financing sources (uses) (92,755) - (46,000) (138,755) Net change in fund balances (207,530) 48,649 (167,469) (326,350) Fund balances, beginning of year 3,812,194 1,224,289 764,580 5,801,063 Fund balances, end of year $ 3,604,664 $ 1,272,938 $ 597,111 $ 5,474,713

City of North Olmsted, Ohio Combining Balance Sheet Non-Major Special Revenue Funds December 31, 2010
70
Casualty Alcohol Economic FEMA Federal Loss CDBG Education Development Grant Grants Assets: Equity in pooled cash and cash equivalents $ 79,770 $ 233,927 $ 17,651 $ 50,857 $ 41,702 $ 29,988 Income taxes receivable - - - - - - Taxes receivable - property and other - - - - - - Intergovernmental receivable - - 242 - 37,344 - Accounts receivable 1,009 - - - - - Prepaid items - - - - - - Total assets $ 80,779 $ 233,927 $ 17,893 $ 50,857 $ 79,046 $ 29,988 Liabilities and fund balances: Liabilities: Accounts and contracts payable $ 21,445 $ - $ 186 $ - $ - $ - Accrued wages and benefits - - - - - - Intergovernmental payable 980 - - - 7,980 - Interfund payable - 205,000 - - 71,198 - Deferred revenue - - - - - - Total liabilities 22,425 205,000 186 - 79,178 - Fund balances: Reserved for encumbrances 16,096 131,217 650 12,772 - - Unreserved (deficit) 42,258 (102,290) 17,057 38,085 (132) 29,988 Total fund balances 58,354 28,927 17,707 50,857 (132) 29,988 Total liabilities and fund balances $ 80,779 $ 233,927 $ 17,893 $ 50,857 $ 79,046 $ 29,988
(Continued)

71
Motor Emergency Vehicle Clague Hotel/ Medical State Street License Tax Recreation Park Motel Tax Services Highway Maintenance $ 101,641 $ 173,413 $ 3,065 $ 286,192 $ 2,773 $ 422,212 $ 1,106,584 - - - - - - - - 893,598 - 15,164 - - - 110,250 72,421 - - - 47,500 594,000 - 1,794 - - - - - - 16,138 - - - - - $ 211,891 $ 1,157,364 $ 3,065 $ 301,356 $ 2,773 $ 469,712 $ 1,700,584 $ - $ 139,077 $ - $ - $ - $ 900 $ 49,780 - 17,854 - - - - 6,989 - 13,125 - - - - 5,711 - - - - - - - 75,476 966,019 - - - 37,360 468,948 75,476 1,136,075 - - - 38,260 531,428 54,663 11,374 - 16,295 - 5,600 32,068 81,752 9,915 3,065 285,061 2,773 425,852 1,137,088 136,415 21,289 3,065 301,356 2,773 431,452 1,169,156 $ 211,891 $ 1,157,364 $ 3,065 $ 301,356 $ 2,773 $ 469,712 $ 1,700,584

City of North Olmsted, Ohio Combining Balance Sheet Non-Major Special Revenue Funds (Continued) December 31, 2010
72
Solid Fair Waste Community Drug Endowment Capacity Management Diversion Enforcement and Grant Housing Assets: Equity in pooled cash and cash equivalents $ 379,813 $ 9,342 $ 22,330 $ 251,111 $ 263,353 Income taxes receivable 456,846 - - - - Taxes receivable - property and other - - - - - Intergovernmental receivable - - - - - Accounts receivable - - - - - Prepaid items - - - - - Total assets $ 836,659 $ 9,342 $ 22,330 $ 251,111 $ 263,353 Liabilities and fund balances: Liabilities: Accounts and contracts payable $ 164,070 $ 200 $ - $ 750 $ - Accrued wages and benefits - - - - 577 Intergovernmental payable - 248 - - 215 Interfund payable - - - - - Deferred revenue 205,785 - - - - Total liabilities 369,855 448 - 750 792 Fund balances: Reserved for encumbrances 5,990 - - 60 - Unreserved (deficit) 460,814 8,894 22,330 250,301 262,561 Total fund balances 466,804 8,894 22,330 250,361 262,561 Total liabilities and fund balances $ 836,659 $ 9,342 $ 22,330 $ 251,111 $ 263,353
(Continued)

73
Fire Law Stop Police Senior Public Way Pension Enforcement Program Pension Center Title III Management Total $ 29,792 $ 36,445 $ 101,993 $ 48,584 $ 33,917 $ 37,068 $ 47,704 $ 3,811,227 - - - - - - - 456,846 223,400 - - 223,400 - - - 1,355,562 18,105 - 12,540 18,105 - 1,644 - 912,151 - - - - - - - 2,803 - - - - - - - 16,138 $ 271,297 $ 36,445 $ 114,533 $ 290,089 $ 33,917 $ 38,712 $ 47,704 $ 6,554,727 $ - $ - $ - $ - $ 1,774 $ - $ - $ 378,182 - - - - - 127 - 25,547 - - 5,131 - - 148 - 33,538 - - - - - - - 276,198 241,505 - - 241,505 - - - 2,236,598 241,505 - 5,131 241,505 1,774 275 - 2,950,063 - - - - 847 - 15,467 303,099 29,792 36,445 109,402 48,584 31,296 38,437 32,237 3,301,565 29,792 36,445 109,402 48,584 32,143 38,437 47,704 3,604,664 $ 271,297 $ 36,445 $ 114,533 $ 290,089 $ 33,917 $ 38,712 $ 47,704 $ 6,554,727
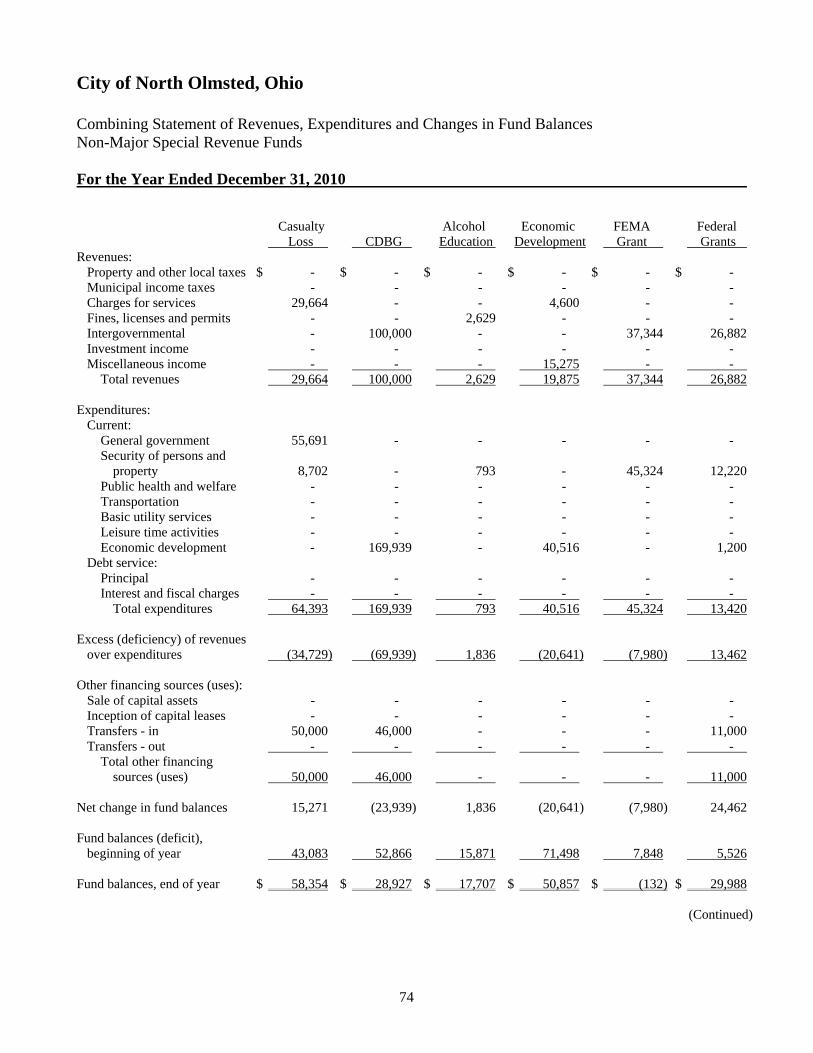
City of North Olmsted, Ohio Combining Statement of Revenues, Expenditures and Changes in Fund Balances Non-Major Special Revenue Funds For the Year Ended December 31, 2010
74
Casualty Alcohol Economic FEMA Federal Loss CDBG Education Development Grant Grants Revenues: Property and other local taxes $ - $ - $ - $ - $ - $ - Municipal income taxes - - - - - - Charges for services 29,664 - - 4,600 - - Fines, licenses and permits - - 2,629 - - - Intergovernmental - 100,000 - - 37,344 26,882 Investment income - - - - - - Miscellaneous income - - - 15,275 - - Total revenues 29,664 100,000 2,629 19,875 37,344 26,882 Expenditures: Current: General government 55,691 - - - - - Security of persons and property 8,702 - 793 - 45,324 12,220 Public health and welfare - - - - - - Transportation - - - - - - Basic utility services - - - - - - Leisure time activities - - - - - - Economic development - 169,939 - 40,516 - 1,200 Debt service: Principal - - - - - - Interest and fiscal charges - - - - - - Total expenditures 64,393 169,939 793 40,516 45,324 13,420 Excess (deficiency) of revenues over expenditures (34,729) (69,939) 1,836 (20,641) (7,980) 13,462 Other financing sources (uses): Sale of capital assets - - - - - - Inception of capital leases - - - - - - Transfers - in 50,000 46,000 - - - 11,000 Transfers - out - - - - - - Total other financing sources (uses) 50,000 46,000 - - - 11,000 Net change in fund balances 15,271 (23,939) 1,836 (20,641) (7,980) 24,462 Fund balances (deficit), beginning of year 43,083 52,866 15,871 71,498 7,848 5,526 Fund balances, end of year $ 58,354 $ 28,927 $ 17,707 $ 50,857 $ (132) $ 29,988
(Continued)

75
Motor Emergency Vehicle Clague Hotel/ Medical State Street License Tax Recreation Park Motel Tax Services Highway Maintenance $ - $ 877,884 $ - $ 253,908 $ - $ - $ - - - - - - - - - 1,122,954 - - - - - - - - - - - - 221,186 173,659 - - - 92,335 1,138,805 179 - - - - 693 1,987 - 76,631 - - - - - 221,365 2,251,128 - 253,908 - 93,028 1,140,792 - - - - - - - - - - 114,297 - - - - - - - - - - 214,711 - - - - 4,572 1,208,493 - - - - - - - - 2,251,015 - - - - - - - - - - - - - 1,010 - - - - - - 266 - - - - - 214,711 2,252,291 - 114,297 - 4,572 1,208,493 6,654 (1,163) - 139,611 - 88,456 (67,701) - 1,444 - - - - - - 6,131 - - - - - - 10,526 - - - - - - (77,333) - (145,340) - - - - (59,232) - (145,340) - - - 6,654 (60,395) - (5,729) - 88,456 (67,701) 129,761 81,684 3,065 307,085 2,773 342,996 1,236,857 $ 136,415 $ 21,289 $ 3,065 $ 301,356 $ 2,773 $ 431,452 $ 1,169,156

City of North Olmsted, Ohio Combining Statement of Revenues, Expenditures and Changes in Fund Balances Non-Major Special Revenue Funds (Continued) For the Year Ended December 31, 2010
76
Solid Fair Waste Community Drug Endowment Capacity Management Diversion Enforcement and Grant Housing Revenues: Property and other local taxes $ - $ - $ - $ - $ - Municipal income taxes 1,764,978 - - - - Charges for services - 14,640 - 259 - Fines, licenses and permits - - 33 - - Intergovernmental 14,870 16,800 - - 38,310 Investment income - - - 15 - Miscellaneous income - - - 110,859 - Total revenues 1,779,848 31,440 33 111,133 38,310 Expenditures: Current: General government - - - - 28,348 Security of persons and property - - - 1,278 - Public health and welfare - 26,075 - 14,154 - Transportation - - - - - Basic utility services 2,022,786 - - - - Leisure time activities - - - 56,130 - Economic development - - - - - Debt service: Principal - - - - - Interest and fiscal charges - - - - - Total expenditures 2,022,786 26,075 - 71,562 28,348 Excess (deficiency) of revenues over expenditures (242,938) 5,365 33 39,571 9,962 Other financing sources (uses): Sale of capital assets - - - - - Inception of capital leases - - - - - Transfers - in - - - - - Transfers - out - - - - - Total other financing sources (uses) - - - - - Net change in fund balances (242,938) 5,365 33 39,571 9,962 Fund balances (deficit), beginning of year 709,742 3,529 22,297 210,790 252,599 Fund balances, end of year $ 466,804 $ 8,894 $ 22,330 $ 250,361 $ 262,561
(Continued)

77
Fire Law Stop Police Senior Public Way Pension Enforcement Program Pension Center Title III Management Total $ 219,471 $ - $ - $ 219,471 $ - $ - $ - $ 1,570,734 - - - - - - - 1,764,978 - - - - 20,657 8,637 1,047 1,202,458 - - 212,505 - 1,700 - 2,000 218,867 42,790 - - 42,790 - 20,628 - 1,966,399 - - - - 321 - - 3,195 - - - - 6,182 - - 208,947 262,261 - 212,505 262,261 28,860 29,265 3,047 6,935,578 - - - - - - - 84,039 261,242 7,201 165,223 257,450 - - - 873,730 - - - - - 27,514 - 67,743 - - - - - - 16,801 1,444,577 - - - - - - - 2,022,786 - - - - 36,400 - - 2,343,545 - - - - - - - 211,655 - - - - 793 - - 1,803 - - - - 209 - - 475 261,242 7,201 165,223 257,450 37,402 27,514 16,801 7,050,353 1,019 (7,201) 47,282 4,811 (8,542) 1,751 (13,754) (114,775) - - - - - - - 1,444 - - - - 4,817 - - 10,948 - - - - - - - 117,526 - - - - - - - (222,673) - - - - 4,817 - - (92,755) 1,019 (7,201) 47,282 4,811 (3,725) 1,751 (13,754) (207,530) 28,773 43,646 62,120 43,773 35,868 36,686 61,458 3,812,194 $ 29,792 $ 36,445 $ 109,402 $ 48,584 $ 32,143 $ 38,437 $ 47,704 $ 3,604,664

City of North Olmsted, Ohio Combining Balance Sheet Non-Major Debt Service Funds December 31, 2010
78
Special Library Assessment Fire Bond Bond Station Bond Retirement Retirement Retirement Total Assets: Equity in pooled cash and cash equivalents $ 653,645 $ 90,952 $ 528,341 $ 1,272,938 Taxes receivable - property and other 819,131 - 297,866 1,116,997 Intergovernmental receivable 54,703 - 19,892 74,595 Total assets $ 1,527,479 $ 90,952 $ 846,099 $ 2,464,530 Liabilities and fund balances: Liabilities: Deferred revenue $ 873,834 $ - $ 317,758 $ 1,191,592 Fund balances: Unreserved 653,645 90,952 528,341 1,272,938 Total liabilities and fund balances $ 1,527,479 $ 90,952 $ 846,099 $ 2,464,530
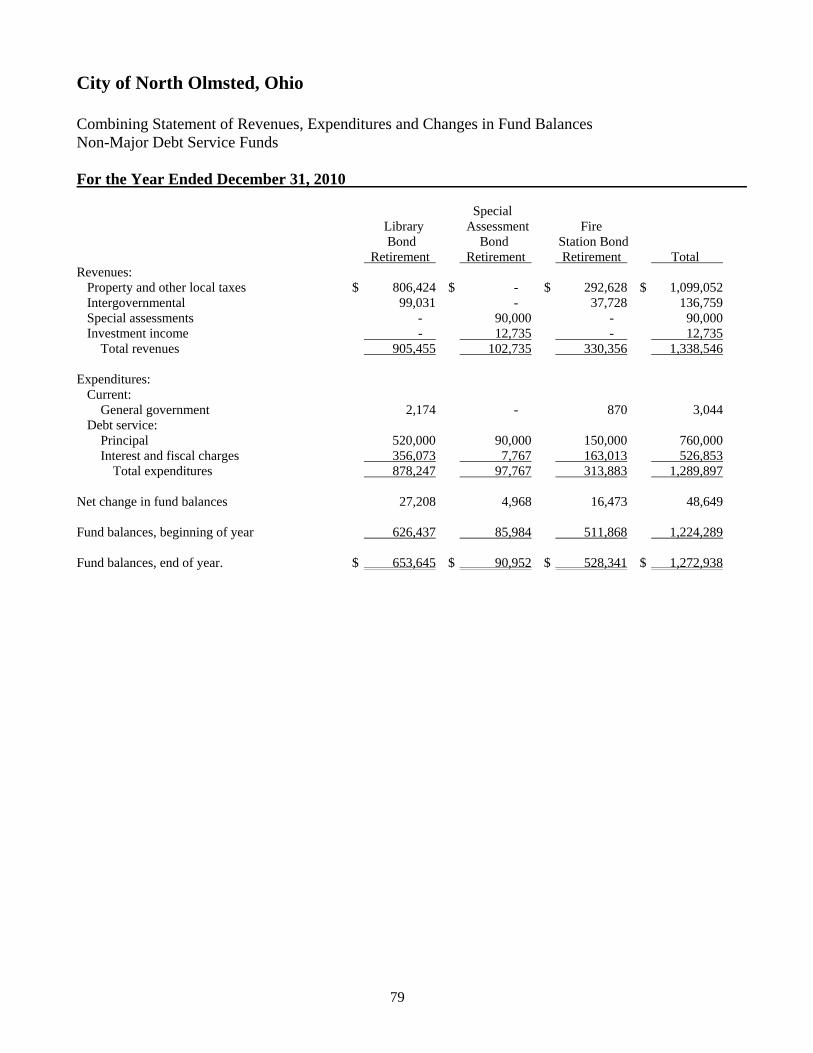
City of North Olmsted, Ohio Combining Statement of Revenues, Expenditures and Changes in Fund Balances Non-Major Debt Service Funds For the Year Ended December 31, 2010
79
Special Library Assessment Fire Bond Bond Station Bond Retirement Retirement Retirement Total Revenues: Property and other local taxes $ 806,424 $ - $ 292,628 $ 1,099,052 Intergovernmental 99,031 - 37,728 136,759 Special assessments - 90,000 - 90,000 Investment income - 12,735 - 12,735 Total revenues 905,455 102,735 330,356 1,338,546 Expenditures: Current: General government 2,174 - 870 3,044 Debt service: Principal 520,000 90,000 150,000 760,000 Interest and fiscal charges 356,073 7,767 163,013 526,853 Total expenditures 878,247 97,767 313,883 1,289,897 Net change in fund balances 27,208 4,968 16,473 48,649 Fund balances, beginning of year 626,437 85,984 511,868 1,224,289 Fund balances, end of year. $ 653,645 $ 90,952 $ 528,341 $ 1,272,938

City of North Olmsted, Ohio Combining Balance Sheet Non-Major Capital Projects Funds December 31, 2010
80
Building and Land Capital Library Acquisition and Fire Improvements Construction Improvement Construction Total Assets: Equity in pooled cash and cash equivalents $ 155,040 $ 113,169 $ 175,196 $ 154,386 $ 597,791 Liabilities and fund balances: Liabilities: Accounts and contracts payable $ 680 $ - $ - $ - $ 680 Fund balances: Reserved for encumbrances 27,056 - - 225 27,281 Unreserved 127,304 113,169 175,196 154,161 569,830 Total fund balances 154,360 113,169 175,196 154,386 597,111 Total liabilities and fund balances $ 155,040 $ 113,169 $ 175,196 $ 154,386 $ 597,791

City of North Olmsted, Ohio Combining Statement of Revenues, Expenditures and Changes in Fund Balances Non-Major Capital Projects Funds For the Year Ended December 31, 2010
81
Building and Land Capital Library Acquisition and Fire Improvements Construction Improvement Construction Total Revenues: Fines, licenses, and permits $ 1,610 $ - $ - $ - $ 1,610 Expenditures: Current: General government 680 - - - 680 Capital outlay 122,399 - - - 122,399 Total expenditures 123,079 - - - 123,079 Excess (deficiency) of revenues over expenditures (121,469) - - - (121,469) Other financing sources (uses): Transfers - out - - (46,000) - (46,000) Net change in fund balances (121,469) - (46,000) - (167,469) Fund balances, beginning of year 275,829 113,169 221,196 154,386 764,580 Fund balances, end of year $ 154,360 $ 113,169 $ 175,196 $ 154,386 $ 597,111

City of North Olmsted, Ohio Combining Statement of Fund Net Assets Non-Major Internal Service Funds December 31, 2010
82
Total Internal Workers’ Service Hospitalization Compensation Funds Assets: Current assets: Equity in pooled cash and cash equivalents $ 2,186,809 $ 478,533 $ 2,665,342 Liabilities: Current liabilities: Accounts and contracts payable - 715 715 Intergovernmental payable - 56,350 56,350 Claims payable 172,565 17,732 190,297 Total current liabilities 172,565 74,797 247,362 Long-term liabilities: Claims payable - 53,196 53,196 Total liabilities 172,565 127,993 300,558 Net assets: Unrestricted $ 2,014,244 $ 350,540 $ 2,364,784

City of North Olmsted, Ohio Combining Statement of Revenues, Expenses and Changes in Fund Net Assets Non-Major Internal Service Funds For the Year Ended December 31, 2010
83
Total Internal Workers’ Service Hospitalization Compensation Funds Operating revenues: Charges for services $ 2,511,040 $ 587,448 $ 3,098,488 Operating expenses: Contractual services 344,511 133,647 478,158 Claims 1,541,400 4,677 1,546,077 Total operating expenses 1,885,911 138,324 2,024,235 Change in net assets 625,129 449,124 1,074,253 Net assets, beginning of year 1,389,115 (98,584) 1,290,531 Net assets (deficit), end of year $ 2,014,244 $ 350,540 $ 2,364,784

City of North Olmsted, Ohio Combining Statement of Cash Flows Non-Major Internal Service Funds For the Year Ended December 31, 2010
84
Total Internal Workers’ Service Hospitalization Compensation Funds Cash flows from operating activities: Receipts from customers and users $ 2,511,040 $ 587,448 $ 3,098,488 Cash payments for goods and services (344,511) (134,000) (478,511) Cash paid for claims (1,614,916) (43,262) (1,658,178) Net cash provided by operating activities 551,613 410,186 961,799 Net increase in cash and cash equivalents 551,613 410,186 961,799 Cash and cash equivalents, beginning of year 1,635,196 68,347 1,703,543 Cash and cash equivalents, end of year $ 2,186,809 $ 478,533 $ 2,665,342 Reconciliation of operating income to net cash provided by (used for) operating activities: Operating income $ 625,129 $ 449,124 $ 1,074,253 Adjustments: Changes in assets/liabilities: Decrease in accounts and contracts payable - (580) (580) Increase in intergovernmental payable - 227 227 Decrease in claims payable (73,516) (38,585) (112,101) Net cash provided by operating activities $ 551,613 $ 410,186 $ 961,799
85
Individual Fund Schedules of Revenues, Expenditures/Expenses and
Changes in Fund Balances/Equities - Budget (Non – GAAP Basis) and Actual

City of North Olmsted, Ohio Schedule of Revenues, Expenditures and Changes in Fund Balance Budget (Non-GAAP Basis) and Actual - General Fund For the Year Ended December 31, 2010
86
Variance with Final Budget Budget Positive Original Final Actual (Negative) Revenues: Property and other local taxes $ 4,559,795 $ 4,559,795 $ 4,683,907 $ 124,112 Municipal income taxes 8,010,539 8,010,539 8,418,440 407,901 Charges for services 1,107,340 1,106,340 1,225,355 119,015 Licenses and permits 785,100 785,100 836,604 51,504 Fines and forfeitures 211,500 211,500 253,493 41,993 Intergovernmental 2,469,998 2,469,998 3,014,188 544,190 Investment income 50,000 50,000 32,626 (17,374) Miscellaneous income 15,000 15,000 20,580 5,580 Total revenues 17,209,272 17,208,272 18,485,193 1,276,921 Expenditures: Current: General government - legislative and executive Council Salaries 143,489 143,489 142,989 500 Benefits 32,902 32,902 32,856 46 Materials and supplies 700 700 492 208 Contractual services 17,848 20,848 19,403 1,445 Total council 194,939 197,939 195,740 2,199 Mayor Salaries 166,239 135,869 135,627 242 Benefits 56,345 44,872 44,799 73 Materials and supplies 29,100 2,900 2,051 849 Contractual services 15,450 11,250 8,095 3,155 Total mayor 267,134 194,891 190,572 4,319 Finance department Salaries 316,463 321,552 313,932 7,620 Benefits 128,983 129,770 129,704 66 Materials and supplies 12,225 12,225 9,795 2,430 Contractual services 707,090 746,632 744,415 2,217 Total finance department 1,164,761 1,210,179 1,197,846 12,333 (Continued)

City of North Olmsted, Ohio Schedule of Revenues, Expenditures and Changes in Fund Balance Budget (Non-GAAP Basis) and Actual - General Fund (Continued) For the Year Ended December 31, 2010
87
Variance with Final Budget Budget Positive Original Final Actual (Negative) Law department Salaries 203,855 195,855 185,415 10,440 Benefits 77,168 86,918 86,326 592 Materials and supplies 1,025 1,025 713 312 Contractual services 15,480 15,480 15,251 229 Total law department 297,528 299,278 287,705 11,573 Information systems Salaries 59,648 61,558 60,364 1,194 Benefits 25,010 26,373 26,328 45 Materials and supplies 7,600 7,600 7,553 47 Contractual services 80,218 84,508 70,989 13,519 Capital outlay 40,970 40,970 40,530 440 Total information systems 213,446 221,009 205,764 15,245 Department of human resources Salaries 158,637 189,808 189,210 598 Benefits 63,366 75,936 75,821 115 Materials and supplies 515 26,715 25,532 1,183 Contractual services 209,426 183,376 168,960 14,416 Total department of human resources 431,944 475,835 459,523 16,312 Civil service department Salaries 1,250 497 493 4 Benefits 194 77 76 1 Materials and supplies 400 400 355 45 Contractual services 15,800 15,800 11,996 3,804 Total civil service department 17,644 16,774 12,920 3,854 Boards and commissions Salaries 43,097 43,097 43,090 7 Benefits 22,214 22,196 22,192 4 Materials and supplies 1,804 1,804 1,605 199 Contractual services 1,700 2,250 1,753 497 Total boards and commissions 68,815 69,347 68,640 707 (Continued)

City of North Olmsted, Ohio Schedule of Revenues, Expenditures and Changes in Fund Balance Budget (Non-GAAP Basis) and Actual - General Fund (Continued) For the Year Ended December 31, 2010
88
Variance with Final Budget Budget Positive Original Final Actual (Negative) Building department Salaries 452,070 453,826 448,449 5,377 Benefits 213,565 208,572 208,138 434 Materials and supplies 12,510 12,510 12,074 436 Contractual services 57,533 50,033 44,631 5,402 Total building department 735,678 724,941 713,292 11,649 Engineering department Salaries 62,000 71,300 69,146 2,154 Benefits 13,587 15,024 14,987 37 Materials and supplies 1,500 4,885 4,049 836 Contractual services 143,436 125,851 123,031 2,820 Total engineering department 220,523 217,060 211,213 5,847 Total general government - legislative and executive 3,612,412 3,627,253 3,543,215 84,038 Security of persons and property Safety director Salaries 109,323 114,323 112,914 1,409 Benefits 26,473 27,295 27,205 90 Materials and supplies 735 655 491 164 Contractual services - 80 80 - Total safety director 136,531 142,353 140,690 1,663 Fire department Salaries 3,115,133 3,115,133 2,955,659 159,474 Benefits 1,114,836 1,114,836 1,114,692 144 Materials and supplies 56,400 56,400 51,811 4,589 Contractual services 323,019 321,069 300,526 20,543 Capital outlay 1,500 3,450 1,372 2,078 Total fire department 4,610,888 4,610,888 4,424,060 186,828 Central dispatch Salaries 436,327 436,327 399,910 36,417 Benefits 144,773 144,773 144,712 61 Materials and supplies 1,000 1,000 26 974 Contractual services 25,804 25,804 25,211 593 Total central dispatch 607,904 607,904 569,859 38,045 (Continued)

City of North Olmsted, Ohio Schedule of Revenues, Expenditures and Changes in Fund Balance Budget (Non-GAAP Basis) and Actual - General Fund (Continued) For the Year Ended December 31, 2010
89
Variance with Final Budget Budget Positive Original Final Actual (Negative) Police department Salaries 3,905,041 3,905,041 3,736,320 168,721 Benefits 1,358,750 1,358,750 1,358,690 60 Materials and supplies 63,200 151,500 130,261 21,239 Contractual services 310,760 310,760 267,206 43,554 Total police department 5,637,751 5,726,051 5,492,477 233,574 Corrections Salaries 51,650 51,650 43,384 8,266 Benefits 24,035 24,035 24,006 29 Materials and supplies 1,200 1,200 561 639 Contractual services 54,250 54,250 37,266 16,984 Total corrections 131,135 131,135 105,217 25,918 Total security of persons and property 11,124,209 11,218,331 10,732,303 486,028 Public health and welfare Division of aging Salaries 98,943 101,800 101,725 75 Benefits 38,113 43,302 43,210 92 Materials and supplies 600 600 215 385 Contractual services 32,430 27,684 23,007 4,677 Capital outlay 110 110 - 110 Total division of aging 170,196 173,496 168,157 5,339 Department of community and youth services Salaries 161,983 91,624 91,152 472 Benefits 59,726 54,895 54,780 115 Materials and supplies 1,005 1,005 837 168 Contractual services 102,663 106,913 106,538 375 Total department of community and youth services 325,377 254,437 253,307 1,130 Total public health and welfare 495,573 427,933 421,464 6,469 Transportation Service director Salaries 121,681 53,656 53,117 539 Benefits 34,824 12,686 12,606 80 Materials and supplies 1,600 1,600 1,073 527 Contractual services 691,051 593,385 562,700 30,685 Total service director 849,156 661,327 629,496 31,831 (Continued)

City of North Olmsted, Ohio Schedule of Revenues, Expenditures and Changes in Fund Balance Budget (Non-GAAP Basis) and Actual - General Fund (Continued) For the Year Ended December 31, 2010
90
Variance with Final Budget Budget Positive Original Final Actual (Negative) Service department Salaries 559,457 566,386 537,258 29,128 Benefits 255,145 256,216 255,890 326 Materials and supplies 75,087 72,087 50,134 21,953 Contractual services 354,116 342,316 295,129 47,187 Capital outlay 46,582 70,582 38,104 32,478 Total service department 1,290,387 1,307,587 1,176,515 131,072 Fleet maintenance department Salaries 361,828 362,423 360,973 1,450 Benefits 157,233 159,638 159,542 96 Materials and supplies 509,190 356,190 231,901 124,289 Contractual services 10,042 10,042 9,278 764 Capital outlay 6,160 6,160 4,597 1,563 Total fleet maintenance 1,044,453 894,453 766,291 128,162 Total transportation 3,183,996 2,863,367 2,572,302 291,065 Basic utility services Service Department Contractual services 70,000 223,800 223,676 124 Economic development Planning department Salaries 116,478 116,478 116,476 2 Benefits 40,678 40,696 40,685 11 Materials and supplies 400 400 218 182 Contractual services 311,040 222,740 222,564 176 Total economic development 468,596 380,314 379,943 371 Total expenditures 18,954,786 18,740,998 17,872,903 868,095 Excess (deficiency) of revenues over expenditures (1,745,514) (1,532,726) 612,290 2,145,016 Other financing sources (uses): Sale of capital assets 10,000 10,000 18,840 8,840 Advances - in 297,400 297,400 92,400 (205,000) Advances - out (105,000) (176,198) (176,198) - Transfers - out (61,000) (147,800) (147,326) 474 Total other financing sources (uses) 141,400 (16,598) (212,284) (195,686) Net change in fund balance (1,604,114) (1,549,324) 400,006 1,949,330 Prior year encumbrances 546,955 546,955 546,955 - Fund balance, beginning of year 1,152,905 1,152,905 1,152,905 - Fund balance, end of year $ 95,746 $ 150,536 $ 2,099,866 $ 1,949,330
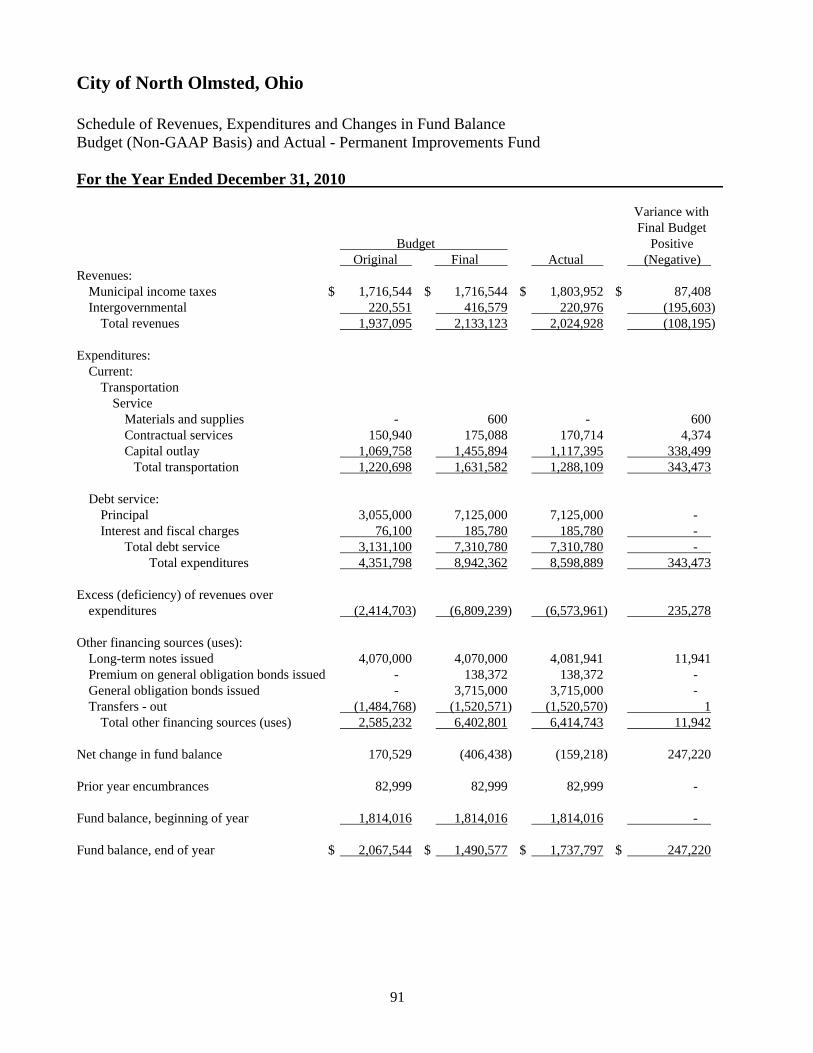
City of North Olmsted, Ohio Schedule of Revenues, Expenditures and Changes in Fund Balance Budget (Non-GAAP Basis) and Actual - Permanent Improvements Fund For the Year Ended December 31, 2010
91
Variance with Final Budget Budget Positive Original Final Actual (Negative) Revenues: Municipal income taxes $ 1,716,544 $ 1,716,544 $ 1,803,952 $ 87,408 Intergovernmental 220,551 416,579 220,976 (195,603) Total revenues 1,937,095 2,133,123 2,024,928 (108,195) Expenditures: Current: Transportation Service Materials and supplies - 600 - 600 Contractual services 150,940 175,088 170,714 4,374 Capital outlay 1,069,758 1,455,894 1,117,395 338,499 Total transportation 1,220,698 1,631,582 1,288,109 343,473 Debt service: Principal 3,055,000 7,125,000 7,125,000 - Interest and fiscal charges 76,100 185,780 185,780 - Total debt service 3,131,100 7,310,780 7,310,780 - Total expenditures 4,351,798 8,942,362 8,598,889 343,473 Excess (deficiency) of revenues over expenditures (2,414,703) (6,809,239) (6,573,961) 235,278 Other financing sources (uses): Long-term notes issued 4,070,000 4,070,000 4,081,941 11,941 Premium on general obligation bonds issued - 138,372 138,372 - General obligation bonds issued - 3,715,000 3,715,000 - Transfers - out (1,484,768) (1,520,571) (1,520,570) 1 Total other financing sources (uses) 2,585,232 6,402,801 6,414,743 11,942 Net change in fund balance 170,529 (406,438) (159,218) 247,220 Prior year encumbrances 82,999 82,999 82,999 - Fund balance, beginning of year 1,814,016 1,814,016 1,814,016 - Fund balance, end of year $ 2,067,544 $ 1,490,577 $ 1,737,797 $ 247,220

City of North Olmsted, Ohio Schedule of Revenues, Expenditures and Changes in Fund Balance Budget (Non-GAAP Basis) and Actual - General Obligation Bond Retirement Fund For the Year Ended December 31, 2010
92
Variance with Final Budget Budget Positive Original Final Actual (Negative) Revenues: Property and other local taxes $ 2,564,886 $ 2,564,886 $ 2,631,619 $ 66,733 Intergovernmental 485,481 485,481 501,930 16,449 Investment income 60,000 60,000 16,548 (43,452) Total revenues 3,110,367 3,110,367 3,150,097 39,730 Expenditures: Current: General government - legislative and executive Finance department Contractual services - 7,828 7,828 - Debt service: Principal 5,709,764 5,709,764 5,349,763 360,001 Interest and fiscal charges 1,675,571 1,675,571 1,640,050 35,521 Total debt service 7,385,335 7,385,335 6,989,813 395,522 Total expenditures 7,385,335 7,393,163 6,997,641 395,522 Excess (deficiency) of revenues over expenditures (4,274,968) (4,282,796) (3,847,544) 435,252 Other financing sources (uses): Premium on general obligation bonds issued - 30,573 30,573 - Transfers - in 4,065,878 4,076,844 4,076,844 - Total other financing sources (uses) 4,065,878 4,107,417 4,107,417 - Net change in fund balance (209,090) (175,379) 259,873 435,252 Fund balance, beginning of year 463,187 463,187 463,187 - Fund balance, end of year $ 254,097 $ 287,808 $ 723,060 $ 435,252

City of North Olmsted, Ohio Schedule of Revenues, Expenditures and Changes in Fund Balance Budget (Non-GAAP Basis) and Actual - Casualty Loss Fund For the Year Ended December 31, 2010
93
Variance with Final Budget Budget Positive Original Final Actual (Negative) Revenues: Charges for services $ 25,000 $ 25,000 $ 30,993 $ 5,993 Expenditures: Current: General government - legislative and executive Department of human resources Contractual services 82,664 82,664 82,348 316 Excess (deficiency) of revenues over expenditures (57,664) (57,664) (51,355) 6,309 Other financing sources (uses): Transfers - in 50,000 50,000 50,000 - Net change in fund balance (7,664) (7,664) (1,355) 6,309 Prior year encumbrances 22,664 22,664 22,664 - Fund balance, beginning of year 20,919 20,919 20,919 - Fund balance, end of year $ 35,919 $ 35,919 $ 42,228 $ 6,309
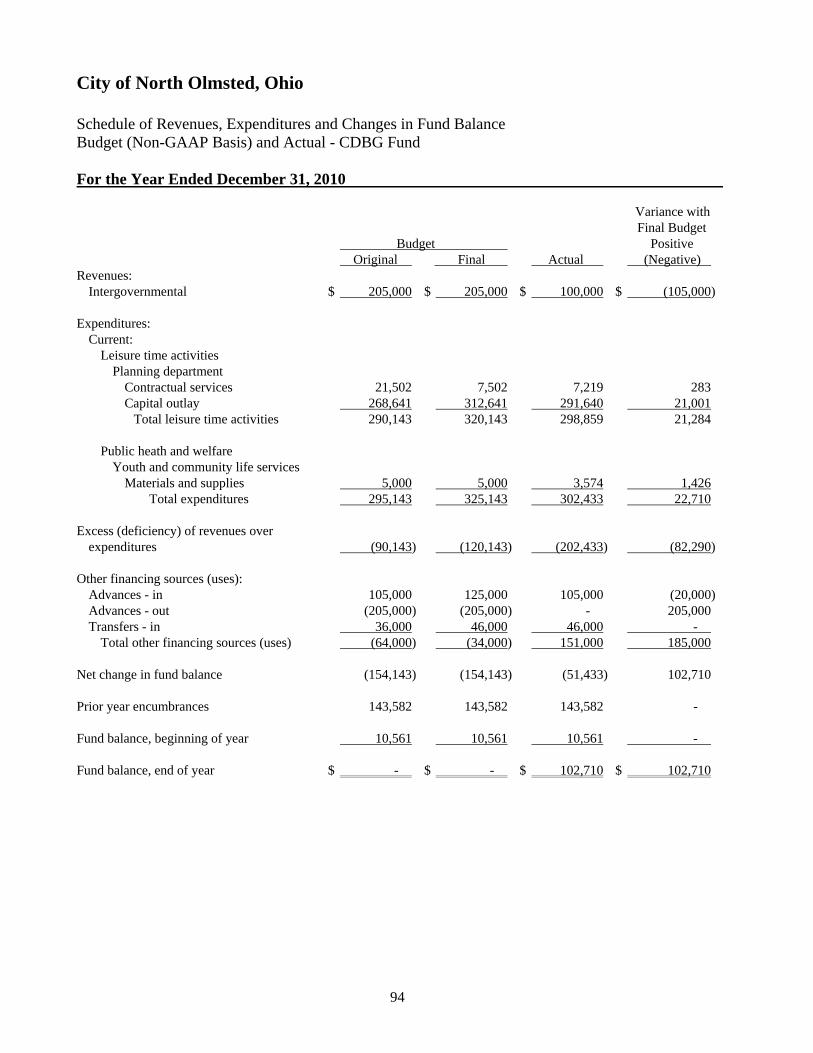
City of North Olmsted, Ohio Schedule of Revenues, Expenditures and Changes in Fund Balance Budget (Non-GAAP Basis) and Actual - CDBG Fund For the Year Ended December 31, 2010
94
Variance with Final Budget Budget Positive Original Final Actual (Negative) Revenues: Intergovernmental $ 205,000 $ 205,000 $ 100,000 $ (105,000) Expenditures: Current: Leisure time activities Planning department Contractual services 21,502 7,502 7,219 283 Capital outlay 268,641 312,641 291,640 21,001 Total leisure time activities 290,143 320,143 298,859 21,284 Public heath and welfare Youth and community life services Materials and supplies 5,000 5,000 3,574 1,426 Total expenditures 295,143 325,143 302,433 22,710 Excess (deficiency) of revenues over expenditures (90,143) (120,143) (202,433) (82,290) Other financing sources (uses): Advances - in 105,000 125,000 105,000 (20,000) Advances - out (205,000) (205,000) - 205,000 Transfers - in 36,000 46,000 46,000 - Total other financing sources (uses) (64,000) (34,000) 151,000 185,000 Net change in fund balance (154,143) (154,143) (51,433) 102,710 Prior year encumbrances 143,582 143,582 143,582 - Fund balance, beginning of year 10,561 10,561 10,561 - Fund balance, end of year $ - $ - $ 102,710 $ 102,710

City of North Olmsted, Ohio Schedule of Revenues, Expenditures and Changes in Fund Balance Budget (Non-GAAP Basis) and Actual - Alcohol Education Fund For the Year Ended December 31, 2010
95
Variance with Final Budget Budget Positive Original Final Actual (Negative) Revenues: Fines and forfeitures $ 2,000 $ 2,000 $ 2,490 $ 490 Expenditures: Current: Security of persons and property Police department Materials and supplies 12,063 12,063 1,493 10,570 Net change in fund balance (10,063) (10,063) 997 11,060 Fund balance, beginning of year 15,818 15,818 15,818 - Fund balance, end of year $ 5,755 $ 5,755 $ 16,815 $ 11,060
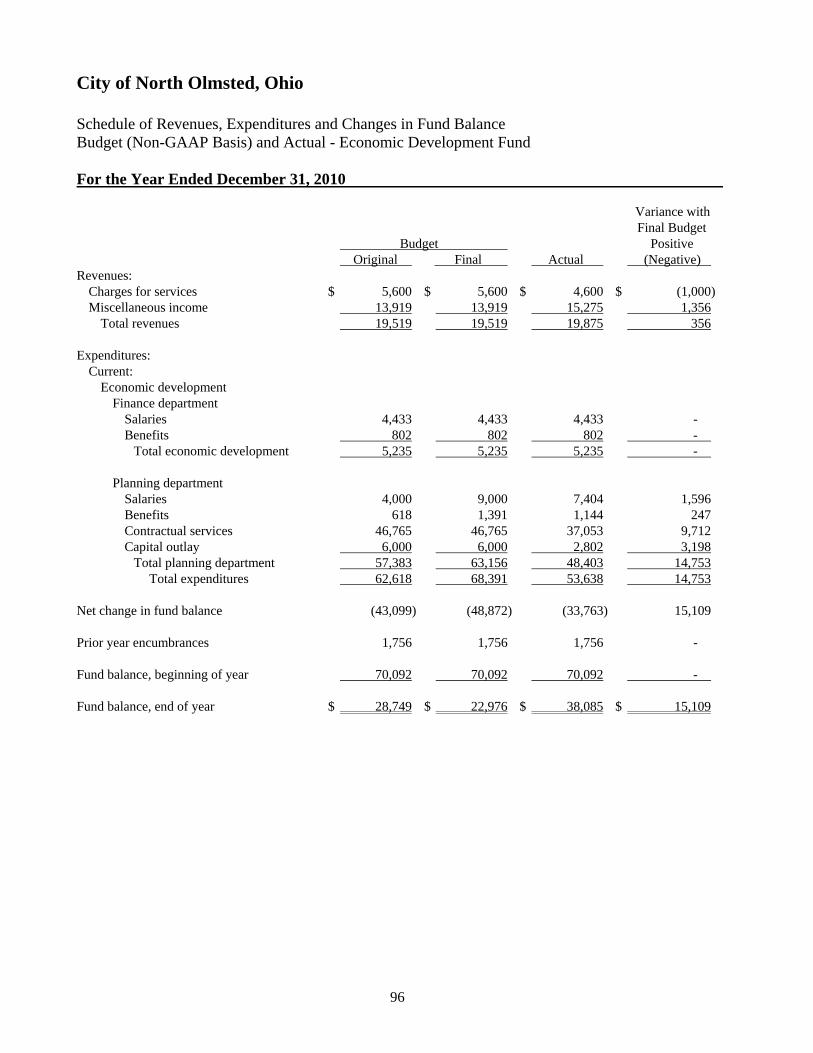
City of North Olmsted, Ohio Schedule of Revenues, Expenditures and Changes in Fund Balance Budget (Non-GAAP Basis) and Actual - Economic Development Fund For the Year Ended December 31, 2010
96
Variance with Final Budget Budget Positive Original Final Actual (Negative) Revenues: Charges for services $ 5,600 $ 5,600 $ 4,600 $ (1,000) Miscellaneous income 13,919 13,919 15,275 1,356 Total revenues 19,519 19,519 19,875 356 Expenditures: Current: Economic development Finance department Salaries 4,433 4,433 4,433 - Benefits 802 802 802 - Total economic development 5,235 5,235 5,235 - Planning department Salaries 4,000 9,000 7,404 1,596 Benefits 618 1,391 1,144 247 Contractual services 46,765 46,765 37,053 9,712 Capital outlay 6,000 6,000 2,802 3,198 Total planning department 57,383 63,156 48,403 14,753 Total expenditures 62,618 68,391 53,638 14,753 Net change in fund balance (43,099) (48,872) (33,763) 15,109 Prior year encumbrances 1,756 1,756 1,756 - Fund balance, beginning of year 70,092 70,092 70,092 - Fund balance, end of year $ 28,749 $ 22,976 $ 38,085 $ 15,109

City of North Olmsted, Ohio Schedule of Revenues, Expenditures and Changes in Fund Balance Budget (Non-GAAP Basis) and Actual - FEMA Grant Fund For the Year Ended December 31, 2010
97
Variance with Final Budget Budget Positive Original Final Actual (Negative) Expenditures: Current: Security of persons and property Fire department Salaries $ - $ 39,715 $ 33,249 $ 6,466 Benefits - 31,483 4,095 27,388 Total expenditures - 71,198 37,344 33,854 Excess (deficiency) of revenues over expenditures - (71,198) (37,344) (33,854) Other financing sources (uses): Advances - in - 71,198 71,198 - Net change in fund balance - - 33,854 (33,854) Fund balance, beginning of year 7,848 7,848 7,848 - Fund balance, end of year $ 7,848 $ 7,848 $ 41,702 $ (33,854)

City of North Olmsted, Ohio Schedule of Revenues, Expenditures and Changes in Fund Balance Budget (Non-GAAP Basis) and Actual - Federal Grants Fund For the Year Ended December 31, 2010
98
Variance with Final Budget Budget Positive Original Final Actual (Negative) Revenues: Intergovernmental $ 15,400 $ 46,882 $ 46,882 $ - Expenditures: Current: Security of persons and property Safety department Salaries - 2,482 2,482 - Capital outlay 82,063 92,686 91,801 885 Total security of persons and property 82,063 95,168 94,283 885 Economic development Planning Contractual services 11,000 11,000 1,200 9,800 Total expenditures 93,063 106,168 95,483 10,685 Excess (deficiency) of revenues over expenditures (77,663) (59,286) (48,601) 10,685 Other financing sources (uses): Advances - out (90,000) (90,000) (90,000) - Transfers - in 11,000 11,000 11,000 - Total other financing sources (uses) (79,000) (79,000) (79,000) - Net change in fund balance (156,663) (138,286) (127,601) 10,685 Prior year encumbrances 82,063 82,063 82,063 - Fund balance, beginning of year 75,526 75,526 75,526 - Fund balance, end of year $ 926 $ 19,303 $ 29,988 $ 10,685

City of North Olmsted, Ohio Schedule of Revenues, Expenditures and Changes in Fund Balance Budget (Non-GAAP Basis) and Actual - Motor Vehicle License Tax Fund For the Year Ended December 31, 2010
99
Variance with Final Budget Budget Positive Original Final Actual (Negative) Revenues: Intergovernmental $ 212,000 $ 212,000 $ 220,965 $ 8,965 Investment income - - 179 179 Total revenues 212,000 212,000 221,144 9,144 Expenditures: Current: Transportation Department of public service Materials and supplies 167,000 167,000 150,676 16,324 Contractual services 140,000 140,000 118,698 21,302 Total expenditures 307,000 307,000 269,374 37,626 Net change in fund balance (95,000) (95,000) (48,230) 46,770 Fund balance, beginning of year 95,208 95,208 95,208 - Fund balance, end of year $ 208 $ 208 $ 46,978 $ 46,770

City of North Olmsted, Ohio Schedule of Revenues, Expenditures and Changes in Fund Balance Budget (Non-GAAP Basis) and Actual - Recreation Fund For the Year Ended December 31, 2010
100
Variance with Final Budget Budget Positive Original Final Actual (Negative) Revenues: Property and other local taxes $ 854,962 $ 854,962 $ 877,883 $ 22,921 Charges for services 1,149,460 1,148,710 1,158,089 9,379 Intergovernmental 184,422 184,422 192,312 7,890 Miscellaneous income 40,323 40,323 39,701 (622) Total revenues 2,229,167 2,228,417 2,267,985 39,568 Expenditures: Current: Leisure time activities Recreation department Salaries 838,130 830,030 818,841 11,189 Benefits 277,427 291,527 280,445 11,082 Materials and supplies 114,563 103,263 99,336 3,927 Contractual services 946,989 971,351 943,606 27,745 Capital outlay 50,441 118,594 114,453 4,141 Total expenditures 2,227,550 2,314,765 2,256,681 58,084 Excess (deficiency) of revenues over expenditures 1,617 (86,348) 11,304 97,652 Other financing sources (uses): Sale of capital assets - - 1,444 1,444 Transfers - in - 11,000 10,526 (474) Transfers - out (77,333) (77,333) (77,333) - Other financing sources (uses) (77,333) (66,333) (65,363) 970 Net change in fund balance (75,716) (152,681) (54,059) 98,622 Prior year encumbrances 52,561 52,561 52,561 - Fund balance, beginning of year 131,321 131,321 131,321 - Fund balance, end of year $ 108,166 $ 31,201 $ 129,823 $ 98,622
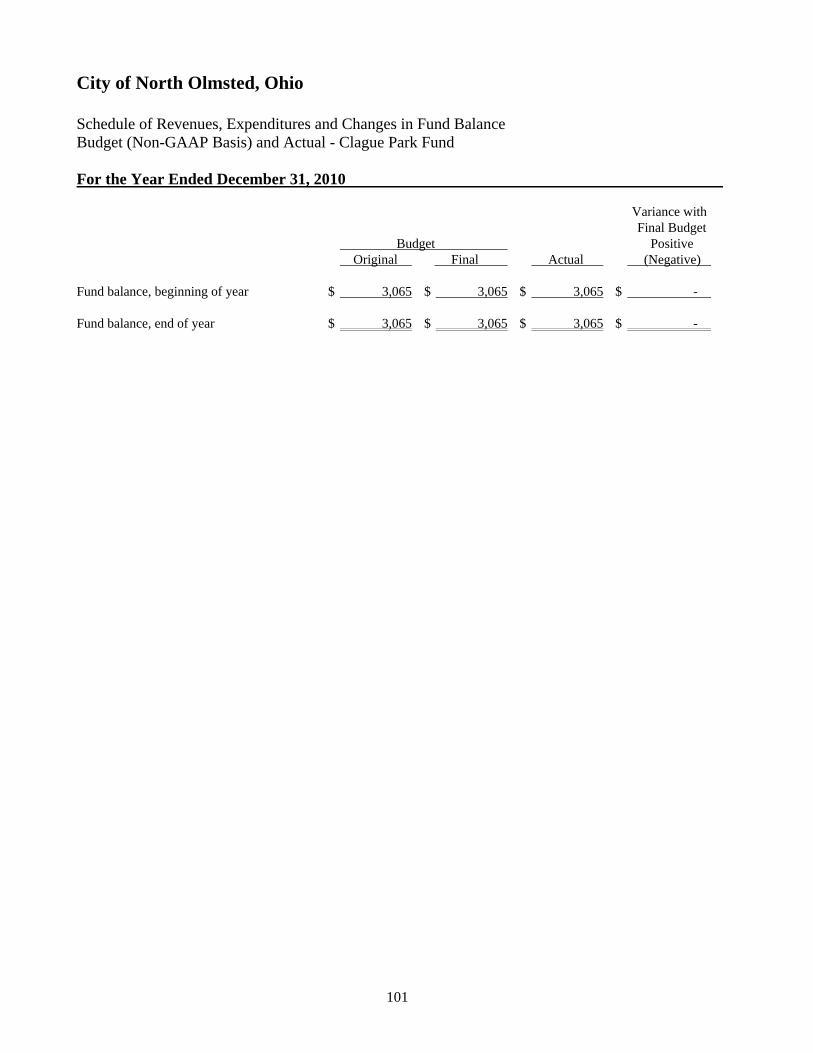
City of North Olmsted, Ohio Schedule of Revenues, Expenditures and Changes in Fund Balance Budget (Non-GAAP Basis) and Actual - Clague Park Fund For the Year Ended December 31, 2010
101
Variance with Final Budget Budget Positive Original Final Actual (Negative) Fund balance, beginning of year $ 3,065 $ 3,065 $ 3,065 $ - Fund balance, end of year $ 3,065 $ 3,065 $ 3,065 $ -

City of North Olmsted, Ohio Schedule of Revenues, Expenditures and Changes in Fund Balance Budget (Non-GAAP Basis) and Actual - Hotel/Motel Tax Fund For the Year Ended December 31, 2010
102
Variance with Final Budget Budget Positive Original Final Actual (Negative) Revenues: Property and other local taxes $ 250,000 $ 250,000 $ 251,803 $ 1,803 Expenditures: Current: Security of persons and property Fire department Contractual services 14,800 14,800 14,093 707 Capital outlay 24,078 24,078 18,864 5,214 Total fire department 38,878 38,878 32,957 5,921 Police department Materials and supplies 15,000 15,000 10,577 4,423 Contractual services 10,800 10,800 10,800 - Capital outlay 100,648 100,648 79,757 20,891 Total police department 126,448 126,448 101,134 25,314 Total expenditures 165,326 165,326 134,091 31,235 Excess (deficiency) of revenues over expenditures 84,674 84,674 117,712 33,038 Other financing sources (uses): Transfers - out (145,340) (145,340) (145,340) - Net change in fund balance (60,666) (60,666) (27,628) 33,038 Prior year encumbrances 3,526 3,526 3,526 - Fund balance, beginning of year 293,999 293,999 293,999 - Fund balance, end of year $ 236,859 $ 236,859 $ 269,897 $ 33,038

City of North Olmsted, Ohio Schedule of Revenues, Expenditures and Changes in Fund Balance Budget (Non-GAAP Basis) and Actual - Emergency Medical Services Fund For the Year Ended December 31, 2010
103
Variance with Final Budget Budget Positive Original Final Actual (Negative) Fund balance, beginning of year $ 2,773 $ 2,773 $ 2,773 $ - Fund balance, end of year $ 2,773 $ 2,773 $ 2,773 $ -

City of North Olmsted, Ohio Schedule of Revenues, Expenditures and Changes in Fund Balance Budget (Non-GAAP Basis) and Actual - State Highway Fund For the Year Ended December 31, 2010
104
Variance with Final Budget Budget Positive Original Final Actual (Negative) Revenues: Intergovernmental $ 94,000 $ 94,000 $ 96,586 $ 2,586 Investment earnings - - 693 693 Total revenues 94,000 94,000 97,279 3,279 Expenditures: Current: Transportation Service department Materials and supplies 98,000 98,000 10,173 87,827 Contractual services 10,000 10,000 - 10,000 Total expenditures 108,000 108,000 10,173 97,827 Net change in fund balance (14,000) (14,000) 87,106 101,106 Fund balance, beginning of year 328,606 328,606 328,606 - Fund balance, end of year $ 314,606 $ 314,606 $ 415,712 $ 101,106

City of North Olmsted, Ohio Schedule of Revenues, Expenditures and Changes in Fund Balance Budget (Non-GAAP Basis) and Actual - Street Maintenance Fund For the Year Ended December 31, 2010
105
Variance with Final Budget Budget Positive Original Final Actual (Negative) Revenues: Intergovernmental $ 1,146,500 $ 1,146,500 $ 1,191,222 $ 44,722 Investment earnings - - 1,987 1,987 Total revenues 1,146,500 1,146,500 1,193,209 46,709 Expenditures: Current: Transportation Service department Salaries 547,842 547,842 504,012 43,830 Benefits 207,786 238,356 224,385 13,971 Materials and supplies 504,078 504,078 369,247 134,831 Contractual services 239,102 239,102 157,964 81,138 Capital outlay 60,000 60,000 58,182 1,818 Total expenditures 1,558,808 1,589,378 1,313,790 275,588 Net change in fund balance (412,308) (442,878) (120,581) 322,297 Prior year encumbrances 94,825 94,825 94,825 - Fund balance, beginning of year 1,050,492 1,050,492 1,050,492 - Fund balance, end of year $ 733,009 $ 702,439 $ 1,024,736 $ 322,297

City of North Olmsted, Ohio Schedule of Revenues, Expenditures and Changes in Fund Balance Budget (Non-GAAP Basis) and Actual - Solid Waste Management Fund For the Year Ended December 31, 2010
106
Variance with Final Budget Budget Positive Original Final Actual (Negative) Revenues: Municipal income taxes $ 1,716,544 $ 1,716,544 $ 1,803,952 $ 87,408 Intergovernmental 12,750 12,750 14,058 1,308 Total revenues 1,729,294 1,729,294 1,818,010 88,716 Expenditures: Current: Basic utility services Service department Contractual services 2,140,419 2,146,767 2,028,820 117,947 Net change in fund balance (411,125) (417,473) (210,810) 206,663 Fund balance, beginning of year 420,565 420,565 420,565 - Fund balance, end of year $ 9,440 $ 3,092 $ 209,755 $ 206,663
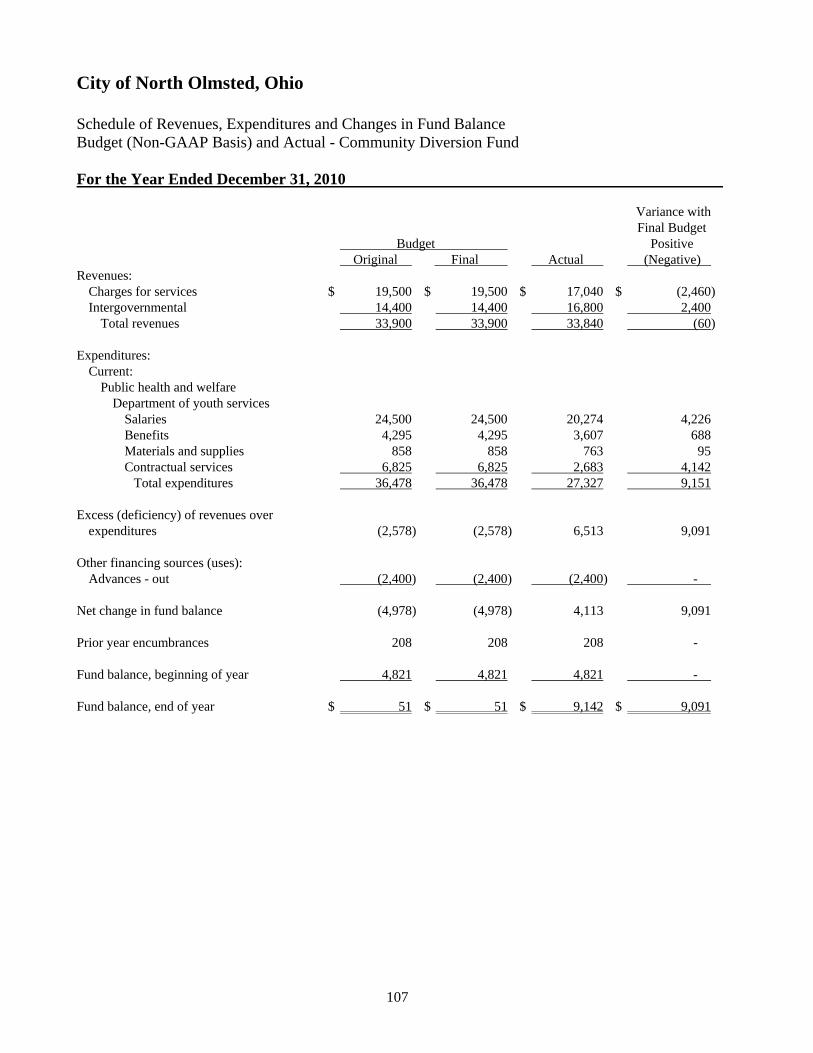
City of North Olmsted, Ohio Schedule of Revenues, Expenditures and Changes in Fund Balance Budget (Non-GAAP Basis) and Actual - Community Diversion Fund For the Year Ended December 31, 2010
107
Variance with Final Budget Budget Positive Original Final Actual (Negative) Revenues: Charges for services $ 19,500 $ 19,500 $ 17,040 $ (2,460) Intergovernmental 14,400 14,400 16,800 2,400 Total revenues 33,900 33,900 33,840 (60) Expenditures: Current: Public health and welfare Department of youth services Salaries 24,500 24,500 20,274 4,226 Benefits 4,295 4,295 3,607 688 Materials and supplies 858 858 763 95 Contractual services 6,825 6,825 2,683 4,142 Total expenditures 36,478 36,478 27,327 9,151 Excess (deficiency) of revenues over expenditures (2,578) (2,578) 6,513 9,091 Other financing sources (uses): Advances - out (2,400) (2,400) (2,400) - Net change in fund balance (4,978) (4,978) 4,113 9,091 Prior year encumbrances 208 208 208 - Fund balance, beginning of year 4,821 4,821 4,821 - Fund balance, end of year $ 51 $ 51 $ 9,142 $ 9,091

City of North Olmsted, Ohio Schedule of Revenues, Expenditures and Changes in Fund Balance Budget (Non-GAAP Basis) and Actual - Drug Enforcement Fund For the Year Ended December 31, 2010
108
Variance with Final Budget Budget Positive Original Final Actual (Negative) Revenues: Fines and forfeitures $ - $ - $ 33 $ 33 Expenditures: Current: Security of persons and property Police department Other 21,941 21,941 - 21,941 Net change in fund balance (21,941) (21,941) 33 21,974 Fund balance, beginning of year 22,297 22,297 22,297 - Fund balance, end of year $ 356 $ 356 $ 22,330 $ 21,974
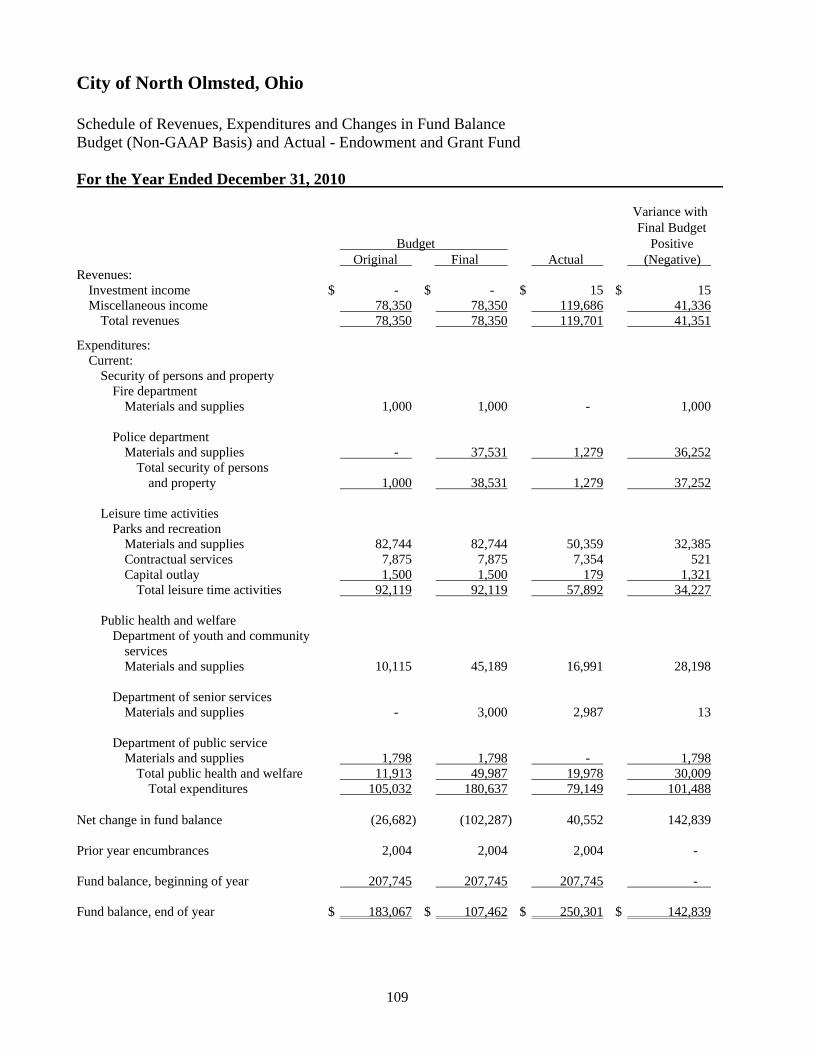
City of North Olmsted, Ohio Schedule of Revenues, Expenditures and Changes in Fund Balance Budget (Non-GAAP Basis) and Actual - Endowment and Grant Fund
For the Year Ended December 31, 2010
109
Variance with Final Budget Budget Positive Original Final Actual (Negative) Revenues: Investment income $ - $ - $ 15 $ 15 Miscellaneous income 78,350 78,350 119,686 41,336 Total revenues 78,350 78,350 119,701 41,351
Expenditures: Current: Security of persons and property Fire department Materials and supplies 1,000 1,000 - 1,000 Police department Materials and supplies - 37,531 1,279 36,252 Total security of persons and property 1,000 38,531 1,279 37,252 Leisure time activities Parks and recreation Materials and supplies 82,744 82,744 50,359 32,385 Contractual services 7,875 7,875 7,354 521 Capital outlay 1,500 1,500 179 1,321 Total leisure time activities 92,119 92,119 57,892 34,227 Public health and welfare Department of youth and community services Materials and supplies 10,115 45,189 16,991 28,198 Department of senior services Materials and supplies - 3,000 2,987 13 Department of public service Materials and supplies 1,798 1,798 - 1,798 Total public health and welfare 11,913 49,987 19,978 30,009 Total expenditures 105,032 180,637 79,149 101,488 Net change in fund balance (26,682) (102,287) 40,552 142,839 Prior year encumbrances 2,004 2,004 2,004 - Fund balance, beginning of year 207,745 207,745 207,745 - Fund balance, end of year $ 183,067 $ 107,462 $ 250,301 $ 142,839

City of North Olmsted, Ohio Schedule of Revenues, Expenditures and Changes in Fund Balance Budget (Non-GAAP Basis) and Actual - Fair Capacity Housing Fund
For the Year Ended December 31, 2010
110
Variance with Final Budget Budget Positive Original Final Actual (Negative) Revenues: Intergovernmental $ - $ - $ 38,310 $ 38,310 Expenditures: Current: General government - legislative and executive Law department Salaries 22,487 25,487 23,000 2,487 Benefits 3,754 4,218 4,218 - Materials and supplies 2,250 2,250 5 2,245 Contractual services 56,100 56,100 1,240 54,860 Total expenditures 84,591 88,055 28,463 59,592 Net change in fund balance (84,591) (88,055) 9,847 97,902 Fund balance, beginning of year 253,506 253,506 253,506 - Fund balance, end of year $ 168,915 $ 165,451 $ 263,353 $ 97,902

City of North Olmsted, Ohio Schedule of Revenues, Expenditures and Changes in Fund Balance Budget (Non-GAAP Basis) and Actual - Fire Pension Fund For the Year Ended December 31, 2010
111
Variance with Final Budget Budget Positive Original Final Actual (Negative) Revenues: Property and other local taxes $ 213,741 $ 213,741 $ 219,471 $ 5,730 Intergovernmental 41,441 41,441 42,789 1,348 Total revenues 255,182 255,182 262,260 7,078 Expenditures: Current: Security of persons and property Fire department Benefits 283,955 283,302 260,588 22,714 Contractual services - 653 653 - Total expenditures 283,955 283,955 261,241 22,714 Net change in fund balance (28,773) (28,773) 1,019 29,792 Fund balance, beginning of year 28,773 28,773 28,773 - Fund balance, end of year $ - $ - $ 29,792 $ 29,792

City of North Olmsted, Ohio Schedule of Revenues, Expenditures and Changes in Fund Balance Budget (Non-GAAP Basis) and Actual - Law Enforcement Fund For the Year Ended December 31, 2010
112
Variance with Final Budget Budget Positive Original Final Actual (Negative) Expenditures: Current: Security of persons and property Police department Materials and supplies $ 22,583 $ 22,583 $ 2,665 $ 19,918 Capital outlay 9,239 9,239 4,536 4,703 Other 11,804 11,804 - 11,804 Total expenditures 43,626 43,626 7,201 36,425 Net change in fund balance (43,626) (43,626) (7,201) 36,425 Fund balance, beginning of year 43,646 43,646 43,646 - Fund balance, end of year $ 20 $ 20 $ 36,445 $ 36,425

City of North Olmsted, Ohio Schedule of Revenues, Expenditures and Changes in Fund Balance Budget (Non-GAAP Basis) and Actual - Stop Program Fund For the Year Ended December 31, 2010
113
Variance with Final Budget Budget Positive Original Final Actual (Negative) Revenues: Fines and forfeitures $ 180,000 $ 180,000 $ 211,898 $ 31,898 Expenditures: Current: Security of persons and property Law department Salaries 13,004 13,004 13,004 - Benefits 6,667 6,667 6,667 - Total law department 19,671 19,671 19,671 - Police department Salaries 104,000 104,000 91,368 12,632 Benefits 36,684 36,812 36,812 - Materials and supplies 5,000 4,872 2,730 2,142 Contractual services 32,500 32,500 14,110 18,390 Total police department 178,184 178,184 145,020 33,164 Total expenditures 197,855 197,855 164,691 33,164 Net change in fund balance (17,855) (17,855) 47,207 65,062 Fund balance, beginning of year 54,786 54,786 54,786 - Fund balance, end of year $ 36,931 $ 36,931 $ 101,993 $ 65,062

City of North Olmsted, Ohio Schedule of Revenues, Expenditures and Changes in Fund Balance Budget (Non-GAAP Basis) and Actual - Police Pension Fund For the Year Ended December 31, 2010
114
Variance with Final Budget Budget Positive Original Final Actual (Negative) Revenues: Property and other local taxes $ 213,741 $ 213,741 $ 219,471 $ 5,730 Intergovernmental 41,441 41,441 42,789 1,348 Total revenues 255,182 255,182 262,260 7,078 Expenditures: Current: Security of persons and property Police department Benefits 298,955 298,302 256,796 41,506 Contractual services - 653 653 - Total expenditures 298,955 298,955 257,449 41,506 Net change in fund balance (43,773) (43,773) 4,811 48,584 Fund balance, beginning of year 43,773 43,773 43,773 - Fund balance, end of year $ - $ - $ 48,584 $ 48,584

City of North Olmsted, Ohio Schedule of Revenues, Expenditures and Changes in Fund Balance Budget (Non-GAAP Basis) and Actual - Senior Center Fund For the Year Ended December 31, 2010
115
Variance with Final Budget Budget Positive Original Final Actual (Negative) Revenues: Charges for services $ 18,000 $ 18,000 $ 20,657 $ 2,657 Fines and forfeitures 1,800 1,800 1,700 (100) Investment income 4,500 4,500 321 (4,179) Miscellaneous income 300 300 6,182 5,882 Total revenues 24,600 24,600 28,860 4,260 Expenditures: Current: Leisure time activities Department of community life services Materials and supplies 16,151 13,751 9,343 4,408 Contractual services 23,000 30,400 26,241 4,159 Total expenditures 39,151 44,151 35,584 8,567 Net change in fund balance (14,551) (19,551) (6,724) 12,827 Prior year encumbrances 3,230 3,230 3,230 - Fund balance, beginning of year 34,790 34,790 34,790 - Fund balance, end of year $ 23,469 $ 18,469 $ 31,296 $ 12,827

City of North Olmsted, Ohio Schedule of Revenues, Expenditures and Changes in Fund Balance Budget (Non-GAAP Basis) and Actual - Title III Fund For the Year Ended December 31, 2010
116
Variance with Final Budget Budget Positive Original Final Actual (Negative) Revenues: Charges for services $ 7,600 $ 7,600 $ 6,993 $ (607) Intergovernmental 12,500 12,500 11,844 (656) Total revenues 20,100 20,100 18,837 (1,263) Expenditures: Current: Public health and welfare Department of senior services Salaries 14,749 14,749 14,460 289 Benefits 2,643 2,643 2,601 42 Total expenditures 17,392 17,392 17,061 331 Net change in fund balances 2,708 2,708 1,776 (932) Fund balance, beginning of year 35,292 35,292 35,292 - Fund balance, end of year $ 38,000 $ 38,000 $ 37,068 $ (932)

City of North Olmsted, Ohio Schedule of Revenues, Expenditures and Changes in Fund Balance Budget (Non-GAAP Basis) and Actual - Public Way Management Fund For the Year Ended December 31, 2010
117
Variance with Final Budget Budget Positive Original Final Actual (Negative) Revenues: Charges for services $ 10,000 $ 10,000 $ 1,047 $ (8,953) Licenses and permits 10,000 10,000 2,000 (8,000) Total revenues 20,000 20,000 3,047 (16,953) Expenditures: Current: Transportation Public service and properties Contractual services 23,237 73,237 32,268 40,969 Net change in fund balance (3,237) (53,237) (29,221) 24,016 Prior year encumbrances 8,237 8,237 8,237 - Fund balance, beginning of year 53,221 53,221 53,221 - Fund balance, end of year $ 58,221 $ 8,221 $ 32,237 $ 24,016

City of North Olmsted, Ohio Schedule of Revenues, Expenditures and Changes in Fund Balance Budget (Non-GAAP Basis) and Actual - Library Bond Retirement Fund For the Year Ended December 31, 2010
118
Variance with Final Budget Budget Positive Original Final Actual (Negative) Revenues: Property and other local taxes $ 792,802 $ 792,802 $ 806,424 $ 13,622 Intergovernmental 90,877 90,877 99,032 8,155 Total revenues 883,679 883,679 905,456 21,777 Expenditures: Current: General government - legislative and executive Finance department Contractual services 10,000 12,175 2,175 10,000 Debt service: Principal 520,000 520,000 520,000 - Interest and fiscal charges 361,078 361,078 356,073 5,005 Total debt service 881,078 881,078 876,073 5,005 Total expenditures 891,078 893,253 878,248 15,005 Net change in fund balance (7,399) (9,574) 27,208 36,782 Fund balance, beginning of year 626,437 626,437 626,437 - Fund balance, end of year $ 619,038 $ 616,863 $ 653,645 $ 36,782

City of North Olmsted, Ohio Schedule of Revenues, Expenditures and Changes in Fund Balance Budget (Non-GAAP Basis) and Actual - Special Assessment Bond Retirement Fund For the Year Ended December 31, 2010
119
Variance with Final Budget Budget Positive Original Final Actual (Negative) Revenues: Special assessments $ 96,750 $ 96,750 $ 102,735 $ 5,985 Expenditures: Current: General government - legislative and executive Finance department Contractual services 1,200 1,200 1,017 183 Debt service: Principal 90,000 90,000 90,000 - Interest and fiscal charges 7,950 7,950 6,750 1,200 Total debt service 97,950 97,950 96,750 1,200 Total expenditures 99,150 99,150 97,767 1,383 Net change in fund balance (2,400) (2,400) 4,968 7,368 Fund balance, beginning of year 85,984 85,984 85,984 - Fund balance, end of year $ 83,584 $ 83,584 $ 90,952 $ 7,368

City of North Olmsted, Ohio Schedule of Revenues, Expenditures and Changes in Fund Balance Budget (Non-GAAP Basis) and Actual - Fire Station Bond Retirement Fund For the Year Ended December 31, 2010
120
Variance with Final Budget Budget Positive Original Final Actual (Negative) Revenues: Property and other local taxes $ 284,987 $ 284,987 $ 292,628 $ 7,641 Intergovernmental 36,350 36,350 37,728 1,378 Total revenues 321,337 321,337 330,356 9,019 Expenditures: Current: General government - legislative and executive Finance department Contractual services - 870 870 - Debt service: Principal 150,000 150,000 150,000 - Interest and fiscal charges 168,013 168,013 163,013 5,000 Total debt service 318,013 318,013 313,013 5,000 Total expenditures 318,013 318,883 313,883 5,000 Net change in fund balance 3,324 2,454 16,473 14,019 Fund balance, beginning of year 511,868 511,868 511,868 - Fund balance, end of year $ 515,192 $ 514,322 $ 528,341 $ 14,019

City of North Olmsted, Ohio Schedule of Revenues, Expenditures and Changes in Fund Balance Budget (Non-GAAP Basis) and Actual - Capital Improvements Fund For the Year Ended December 31, 2010
121
Variance with Final Budget Budget Positive Original Final Actual (Negative) Revenues: Licenses and permits $ - $ - $ 1,610 $ 1,610 Expenditures: Current: General government - legislative and executive Finance department Capital outlay 113,586 113,586 19,656 93,930 Information systems Capital outlay 145,139 145,139 130,478 14,661 Total expenditures 258,725 258,725 150,134 108,591 Net change in fund balance (258,725) (258,725) (148,524) 110,201 Prior year encumbrances 19,656 19,656 19,656 - Fund balance, beginning of year 256,172 256,172 256,172 - Fund balance, end of year $ 17,103 $ 17,103 $ 127,304 $ 110,201

City of North Olmsted, Ohio Schedule of Revenues, Expenditures and Changes in Fund Balance Budget (Non-GAAP Basis) and Actual - Library Construction Fund For the Year Ended December 31, 2010
122
Variance with Final Budget Budget Positive Original Final Actual (Negative) Fund balance, beginning of year $ 113,169 $ 113,169 $ 113,169 $ - Fund balance, end of year $ 113,169 $ 113,169 $ 113,169 $ -

City of North Olmsted, Ohio Schedule of Revenues, Expenditures and Changes in Fund Balance Budget (Non-GAAP Basis) and Actual - Building and Land Acquisition and Improvement Fund For the Year Ended December 31, 2010
123
Variance with Final Budget Budget Positive Original Final Actual (Negative) Other financing sources (uses): Transfers - out $ (36,000) $ (26,000) $ (46,000) $ (20,000) Net change in fund balance (36,000) (26,000) (46,000) (20,000) Fund balance, beginning of year 221,196 221,196 221,196 - Fund Balance, end of year $ 185,196 $ 195,196 $ 175,196 $ (20,000)

City of North Olmsted, Ohio Schedule of Revenues, Expenditures and Changes in Fund Balance Budget (Non-GAAP Basis) and Actual - Issue I Fund For the Year Ended December 31, 2010
124
Variance with Final Budget Budget Positive Original Final Actual (Negative) Revenues: Intergovernmental $ 72,400 $ 72,400 $ 72,399 $ (1) Expenditures: Current: Transportation Engineering department Contractual services 6,038 6,038 6,038 - Capital outlay 72,400 72,400 72,399 1 Total expenditures 78,438 78,438 78,437 1 Net change in fund balance (6,038) (6,038) (6,038) - Prior year encumbrances 6,038 6,038 6,038 - Fund balance, beginning of year - - - - Fund balance, end of year $ - $ - $ - $ -

City of North Olmsted, Ohio Schedule of Revenues, Expenditures and Changes in Fund Balance Budget (Non-GAAP Basis) and Actual - Fire Construction Fund For the Year Ended December 31, 2010
125
Variance with Final Budget Budget Positive Original Final Actual (Negative) Fund balance, beginning of year $ 154,161 $ 154,161 $ 154,161 $ - Fund balance, end of year $ 154,161 $ 154,161 $ 154,161 $ -

City of North Olmsted, Ohio Schedule of Revenues, Expenditures and Changes in Fund Equity Budget (Non-GAAP Basis) and Actual - NOMBL Fund For the Year Ended December 31, 2010
126
Variance with Final Budget Budget Positive Original Final Actual (Negative) Fund equity, beginning of year $ 21,708 $ 21,708 $ 21,708 $ - Fund equity, end of year $ 21,708 $ 21,708 $ 21,708 $ -

City of North Olmsted, Ohio Schedule of Revenues, Expenditures and Changes in Fund Equity Budget (Non-GAAP Basis) and Actual - Springvale Golf Course and Ballroom Fund For the Year Ended December 31, 2010
127
Variance with Final Budget Budget Positive Original Final Actual (Negative) Revenues: Charges for services $ 1,295,000 $ 1,295,000 $ 1,304,384 $ 9,384 Expenses: Golf course and ballroom Salaries 364,440 392,440 387,765 4,675 Benefits 78,677 90,477 87,496 2,981 Contractual services 296,473 280,273 267,415 12,858 Materials and supplies 226,465 232,465 217,289 15,176 Capital outlay 17,019 96,219 19,812 76,407 Total expenses 983,074 1,091,874 979,777 112,097 Excess (deficiency) of revenues over expenses 311,926 203,126 324,607 121,481 Other financing sources (uses): Transfers - in - 75,800 75,800 - Transfers - out (353,269) (353,269) (353,269) - Total other financing sources (uses) (353,269) (277,469) (277,469) - Net change in fund equity (41,343) (74,343) 47,138 121,481 Prior year encumbrances 10,288 10,288 10,288 - Fund equity, beginning of year 64,955 64,955 64,955 - Fund equity, end of year $ 33,900 $ 900 $ 122,381 $ 121,481

City of North Olmsted, Ohio Schedule of Revenues, Expenditures and Changes in Fund Equity Budget (Non-GAAP Basis) and Actual - Sewer Revenue Fund For the Year Ended December 31, 2010
128
Variance with Final Budget Budget Positive Original Final Actual (Negative) Revenues: Charges for services $ 6,449,810 $ 6,449,810 $ 6,299,729 $ (150,081) Tap - in fees - - 71,428 71,428 Total revenues 6,449,810 6,449,810 6,371,157 (78,653) Expenses: Sewer Salaries 1,784,075 1,784,075 1,511,918 272,157 Benefits 662,668 662,668 621,336 41,332 Materials and supplies 535,982 540,982 447,160 93,822 Contractual services 2,590,549 2,585,549 2,478,213 107,336 Capital outlay 611,447 609,347 406,287 203,060 Total sewer 6,184,721 6,182,621 5,464,914 717,707 Debt service: Principal 9,537 329,537 329,536 1 Interest and fiscal charges 1,378 9,955 9,954 1 Total debt service 10,915 339,492 339,490 2 Total expenses 6,195,636 6,522,113 5,804,404 717,709 Excess (deficiency) of revenues over expenses 254,174 (72,303) 566,753 639,056 Other financing sources (uses): Sale of capital assets - - 1,542 1,542 Note proceeds 320,000 320,000 320,000 - Loan proceeds 763,990 763,990 462,577 (301,413) Premium on general obligation bonds - 9,538 9,538 - General obligation bond proceeds - 290,000 290,000 - Transfers - out (2,005,168) (1,980,331) (1,980,331) - Total other financing sources (uses) (921,178) (596,803) (896,674) (299,871) Net change in fund equity (667,004) (669,106) (329,921) 339,185 Prior year encumbrances 901,991 901,991 901,991 - Fund equity, beginning of year - - - - Fund equity, end of year $ 234,987 $ 232,885 $ 572,070 $ 339,185

City of North Olmsted, Ohio Schedule of Revenues, Expenditures and Changes in Fund Equity Budget (Non-GAAP Basis) and Actual - Hospitalization Fund For the Year Ended December 31, 2010
129
Variance with Final Budget Budget Positive Original Final Actual (Negative) Revenues: Charges for services $ 2,537,572 $ 2,537,572 $ 2,511,040 $ (26,532) Expenses: Claims 2,628,378 2,628,378 1,959,427 668,951 Net change in fund equity (90,806) (90,806) 551,613 642,419 Fund equity, beginning of year 1,635,196 1,635,196 1,635,196 - Fund equity, end of year $ 1,544,390 $ 1,544,390 $ 2,186,809 $ 642,419
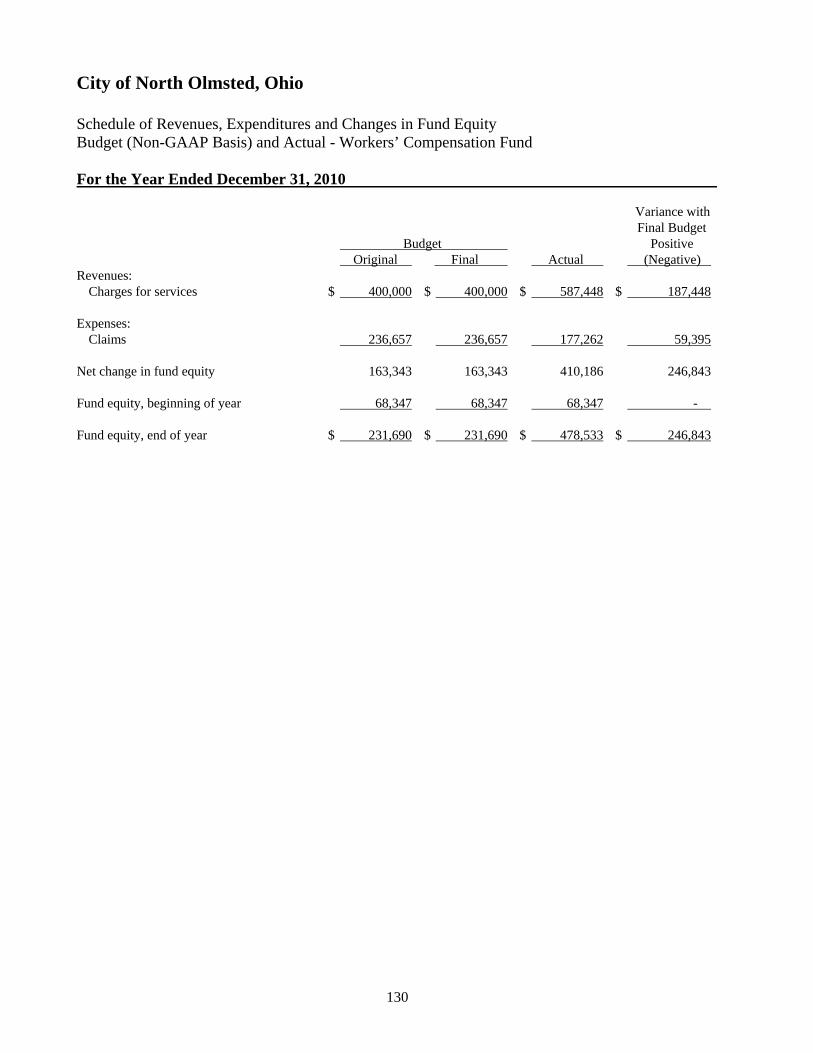
City of North Olmsted, Ohio Schedule of Revenues, Expenditures and Changes in Fund Equity Budget (Non-GAAP Basis) and Actual - Workers’ Compensation Fund For the Year Ended December 31, 2010
130
Variance with Final Budget Budget Positive Original Final Actual (Negative) Revenues: Charges for services $ 400,000 $ 400,000 $ 587,448 $ 187,448 Expenses: Claims 236,657 236,657 177,262 59,395 Net change in fund equity 163,343 163,343 410,186 246,843 Fund equity, beginning of year 68,347 68,347 68,347 - Fund equity, end of year $ 231,690 $ 231,690 $ 478,533 $ 246,843

City of North Olmsted, Ohio Fund Description For the Year Ended December 31, 2010
131
Fiduciary Funds Fiduciary fund reporting focuses on net assets and changes in net assets. The fiduciary fund category is split into four classifications: pension trust funds, investment trust funds, private-purpose trust funds and agency funds. Trust funds are used to account for assets held by the City under a trust agreement for individuals, private organizations, or other governments and are therefore not available to support the City’s own programs. The City has no trust funds. Agency funds are purely custodial (assets equal liabilities) and thus do not involve measurement of results of operations. Agency Fund Deposits Fund - Accounts for deposits held by the City from contractors, developers and individuals to ensure compliance with City ordinances. These monies net of inspection charges are returned when the work is properly completed.

City of North Olmsted, Ohio Statement of Changes in Assets and Liabilities Deposits Fund For the Year Ended December 31, 2010
132
Beginning Ending Balance Balance 12/31/09 Additions Reductions 12/31/10 Assets: Equity in pooled cash and cash equivalents $ 255,314 $ 160,906 $ 40,916 $ 375,304 Liabilities: Accounts and contracts payable $ 26,714 $ - $ 26,714 $ - Deposits held and due to others 228,600 160,906 14,202 375,304 Total liabilities $ 255,314 $ 160,906 $ 40,916 $ 375,304

STATISTICALSECTION

City of North Olmsted, Ohio Statistical Section
133
This part of the City’s comprehensive annual financial report presents detailed information as a context for understanding what the information in the financial statements, note disclosures, and required supplementary information says about the City's overall financial health. Contents Page(s) Financial Trends These schedules contain trend information to help the reader understand how the City's financial performance and well-being have changed over time. 134-141 Revenue Capacity These schedules contain information to help the reader assess the City's most significant local revenue sources, the property tax and municipal income tax. 142-146 Debt Capacity These schedules present information to help the reader assess the affordability of the City's current levels of outstanding debt and the City's ability to issue additional debt in the future. 147-151 Economic and Demographic Information These schedules offer economic and demographic indicators to help the reader understand the environment within which the City's financial activities take place. 152-153 Operating Information These schedules contain service data to help the reader understand how the information in the City's financial report relates to the services the City provides and the activities it performs. 154-160 Sources: Unless otherwise noted, the information in these schedules is derived form the comprehensive annual financial reports for the relevant year. The City implemented GASB Statement 34 in 2003; schedules presenting government-wide information include information beginning in that year.
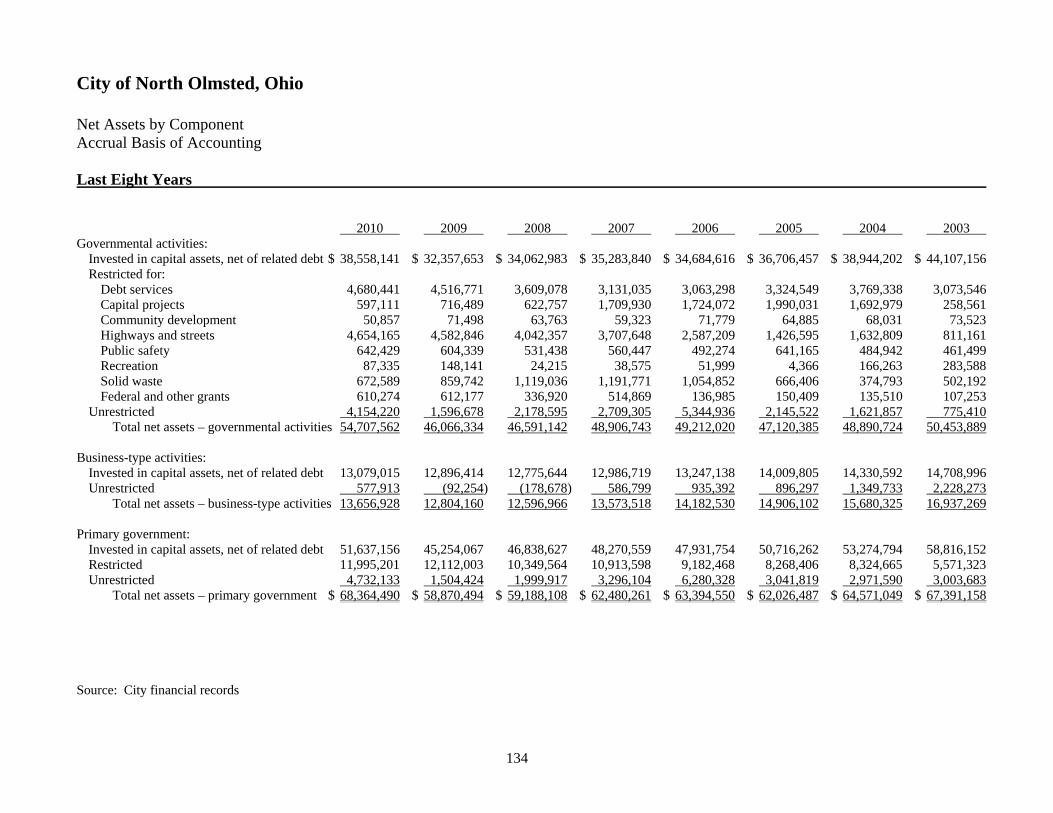
City of North Olmsted, Ohio Net Assets by Component Accrual Basis of Accounting Last Eight Years
134
2010 2009 2008 2007 2006 2005 2004 2003 Governmental activities: Invested in capital assets, net of related debt $ 38,558,141 $ 32,357,653 $ 34,062,983 $ 35,283,840 $ 34,684,616 $ 36,706,457 $ 38,944,202 $ 44,107,156 Restricted for: Debt services 4,680,441 4,516,771 3,609,078 3,131,035 3,063,298 3,324,549 3,769,338 3,073,546 Capital projects 597,111 716,489 622,757 1,709,930 1,724,072 1,990,031 1,692,979 258,561 Community development 50,857 71,498 63,763 59,323 71,779 64,885 68,031 73,523 Highways and streets 4,654,165 4,582,846 4,042,357 3,707,648 2,587,209 1,426,595 1,632,809 811,161 Public safety 642,429 604,339 531,438 560,447 492,274 641,165 484,942 461,499 Recreation 87,335 148,141 24,215 38,575 51,999 4,366 166,263 283,588 Solid waste 672,589 859,742 1,119,036 1,191,771 1,054,852 666,406 374,793 502,192 Federal and other grants 610,274 612,177 336,920 514,869 136,985 150,409 135,510 107,253 Unrestricted 4,154,220 1,596,678 2,178,595 2,709,305 5,344,936 2,145,522 1,621,857 775,410 Total net assets – governmental activities 54,707,562 46,066,334 46,591,142 48,906,743 49,212,020 47,120,385 48,890,724 50,453,889 Business-type activities: Invested in capital assets, net of related debt 13,079,015 12,896,414 12,775,644 12,986,719 13,247,138 14,009,805 14,330,592 14,708,996 Unrestricted 577,913 (92,254) (178,678) 586,799 935,392 896,297 1,349,733 2,228,273 Total net assets – business-type activities 13,656,928 12,804,160 12,596,966 13,573,518 14,182,530 14,906,102 15,680,325 16,937,269 Primary government: Invested in capital assets, net of related debt 51,637,156 45,254,067 46,838,627 48,270,559 47,931,754 50,716,262 53,274,794 58,816,152 Restricted 11,995,201 12,112,003 10,349,564 10,913,598 9,182,468 8,268,406 8,324,665 5,571,323 Unrestricted 4,732,133 1,504,424 1,999,917 3,296,104 6,280,328 3,041,819 2,971,590 3,003,683 Total net assets – primary government $ 68,364,490 $ 58,870,494 $ 59,188,108 $ 62,480,261 $ 63,394,550 $ 62,026,487 $ 64,571,049 $ 67,391,158 Source: City financial records

City of North Olmsted, Ohio Changes in Net Assets Accrual Basis of Accounting Last Eight Years
135
2010 2009 2008 2007 2006 2005 2004 2003 Governmental activities: Charges for services: General government $ 1,247,442 $ 1,245,426 $ 1,294,947 $ 1,380,444 $ 1,377,673 $ 2,112,111 $ 2,028,781 $ 1,913,520 Security of persons and property 1,191,835 1,132,436 983,509 913,899 919,841 960,897 658,766 675,496 Public health and welfare 40,077 32,742 35,723 34,924 17,076 8,140 6,470 8,910 Transportation 173,141 230,351 370,720 257,444 234,374 261,165 132,714 123,303 Basic utility services - - - - 10,379 88,498 - 16,931 Leisure time activities 1,226,424 1,158,712 1,188,305 1,115,611 1,132,666 991,352 1,080,826 1,092,362 Economic development 19,875 21,447 20,826 20,771 18,969 14,752 - - Total charges for services 3,898,794 3,821,114 3,894,030 3,723,093 3,710,978 4,436,915 3,907,557 3,830,522
Operating grants and contributions: General government 48,547 29,998 53,548 259,898 18,911 134,699 54,304 39,683 Security of persons and property 54,646 55,111 73,554 52,724 69,342 39,828 122,702 102,673 Public health and welfare 63,017 46,530 53,436 42,152 63,097 36,582 - - Transportation 1,603,510 1,442,017 1,506,885 1,532,237 1,576,013 1,393,585 1,281,106 1,166,058 Basic utility services 3,634 4,350 - 8,018 - - - - Leisure time activities 69,136 64,267 75,757 71,678 75,495 63,915 69,406 73,190 Community environment - - - - - 21,601 - - Economic development 15,400 54,600 19,975 - - 27,503 - - Total operating grants and contributions 1,857,890 1,696,873 1,783,155 1,966,707 1,802,858 1,717,713 1,527,518 1,381,604
Capital grants and contributions: General government - - - - - - - 1,037,239 Security of persons and property - 100,000 - - 47,834 313,443 - - Transportation 8,162,080 681,725 161,267 1,086,471 2,966,101 609,370 - - Basic utility services - - - - - - - 942,051 Leisure time activities - 18,654 - 112,200 - - - - Total capital grants and contributions 8,162,080 800,379 161,267 1,198,671 3,013,935 922,813 - 1,979,290 Total governmental activities program revenues 13,918,764 6,318,366 5,838,452 6,888,471 8,527,771 7,077,441 5,435,075 7,191,416
(Continued)

City of North Olmsted, Ohio Changes in Net Assets Accrual Basis of Accounting (Continued) Last Eight Years
136
2010 2009 2008 2007 2006 2005 2004 2003 Business-type activities: Charges for services: NOMBL - - - 1,608 31,277 1,191,441 4,525,424 4,497,011 Springvale golf course and ballroom 1,304,849 1,286,334 1,309,635 1,236,571 1,311,244 1,316,095 1,234,847 1,356,442 Sewer 6,769,950 6,371,014 6,291,597 5,902,415 5,705,603 5,897,826 5,704,261 5,996,694 Total charges for services 8,074,799 7,657,348 7,601,232 7,140,594 7,048,124 8,405,362 11,464,532 11,850,147 Capital grants and contributions: Sewer 71,428 124,197 40,886 141,130 471,157 185,705 362,240 135,336 Total business-type activities program revenues 8,146,227 7,781,545 7,642,118 7,281,724 7,519,281 8,591,067 11,826,772 11,985,483 Total primary government program revenues 22,064,991 14,099,911 13,480,570 14,170,195 16,047,052 15,668,508 17,261,847 19,176,899 Expenses: Governmental activities: General government 3,276,027 3,900,267 4,556,304 4,272,866 4,272,186 4,165,796 4,483,169 4,537,200 Security of persons and property 11,627,831 12,806,773 14,754,497 14,450,742 14,334,131 13,245,013 12,377,981 12,210,303 Public health services 467,464 536,943 565,271 567,033 549,892 546,222 471,085 437,691 Transportation 9,184,733 9,493,814 10,144,063 9,877,064 9,899,888 10,358,230 9,405,883 9,155,956 Basic utility services 2,246,112 2,111,966 2,162,069 1,806,726 1,678,150 1,645,096 1,579,622 1,681,386 Leisure time activities 2,519,617 2,493,927 2,618,770 2,451,564 2,479,209 2,594,345 2,827,622 2,447,232 Community environment - - - - - 24,843 - - Economic development 377,094 548,066 562,343 343,280 156,942 202,149 - - Interest and fiscal charges 1,580,084 1,754,255 1,947,244 2,125,469 2,320,133 2,344,396 2,213,332 2,354,210 Total governmental activities expenses 31,278,962 33,646,011 37,310,561 35,894,744 35,690,531 35,126,090 33,358,694 32,823,978
(Continued)

City of North Olmsted, Ohio Changes in Net Assets Accrual Basis of Accounting (Continued) Last Eight Years
137
2010 2009 2008 2007 2006 2005 2004 2003 Business-type activities: NOMBL - 13,158 13,158 13,158 42,057 984,208 4,714,687 4,467,129 Springvale golf course and ballroom 1,403,969 1,337,078 1,417,950 1,470,220 1,451,094 1,480,190 1,412,396 1,509,294 Sewer revenue 5,965,290 6,251,896 6,659,020 6,735,440 6,752,055 6,900,892 7,024,422 6,702,118 Total business-type activities expenses 7,369,259 7,602,132 8,090,128 8,218,818 8,245,206 9,365,290 13,151,505 12,678,541 Total primary government expenses 38,648,221 41,248,143 45,400,689 44,113,562 43,935,737 44,491,380 46,510,199 45,502,519 Net (expense) revenue: Governmental activities (17,360,198) (27,327,645) (31,472,109) (29,006,273) (27,162,760) (28,048,649) (27,923,619) (25,632,562) Business-type activities 776,968 179,413 (448,010) (937,094) (725,925) (774,223) (1,324,733) (693,058) Total primary government net expense (16,583,230) (27,148,232) (31,920,119) (29,943,367) (27,888,685) (28,822,872) (29,248,352) (26,325,620) General revenues and other changes in net assets: Governmental activities: Property taxes and other local taxes 9,895,600 11,020,701 10,868,791 11,396,531 10,701,905 10,354,341 10,507,940 10,238,732 Municipal income taxes 12,142,212 12,239,390 13,021,313 13,014,677 14,164,807 12,159,878 12,491,922 10,927,745 Grants and entitlements 3,954,223 3,462,553 4,145,745 3,492,684 3,429,556 3,102,792 3,088,546 2,906,433 Investment earnings 62,463 84,227 531,565 1,029,342 917,948 596,488 240,155 295,832 Other 22,728 23,747 60,552 95,844 42,532 64,811 31,891 43,411 Transfers (75,800) (27,781) 528,542 (328,082) (2,353) - - (46,256) Total governmental activities general revenues and other changes in net assets 26,001,426 26,802,837 29,156,508 28,700,996 29,254,395 26,278,310 26,360,454 24,365,897
(Continued)

City of North Olmsted, Ohio Changes in Net Assets Accrual Basis of Accounting (Continued) Last Eight Years
138
2010 2009 2008 2007 2006 2005 2004 2003 Business-type activities: Other - - - - - - 67,789 22,295 Transfers 75,800 27,781 (528,542) 328,082 2,353 - - 46,256 Total business-type activities general revenues and other changes in net assets 75,800 27,781 (528,542) 328,082 2,353 - 67,789 68,551 Total primary government general revenues and other changes in net assets 26,077,226 26,830,618 28,627,966 29,029,078 29,256,748 26,278,310 26,428,243 24,434,448 Change in net assets: Governmental activities 8,641,228 (524,808) (2,315,601) (305,277) 2,091,635 (1,770,339) (1,563,165) (1,266,665) Business-type activities 852,768 207,194 (976,552) (609,012) (723,572) (774,223) (1,256,944) (624,507) Total primary government change in net assets $ 9,493,996 $ (317,614) $ (3,292,153) $ (914,289) $ 1,368,063 $ (2,544,562) $ (2,820,109) $ (1,891,172) Source: City financial records

City of North Olmsted, Ohio Fund Balances, Governmental Funds Modified Accrual Basis of Accounting Last Ten Years
139
2010 2009 2008 2007 2006 2005 2004 2003 2002 2001
General fund Reserved $ 870,953 $ 399,153 $ 142,013 $ 180,744 $ 64,773 $ 42,139 $ 165,032 $ 124,397 $ 303,831 $ 517,702 Unreserved 3,620,708 3,189,607 3,038,397 3,862,969 3,553,794 3,403,317 3,265,274 3,396,867 2,550,238 1,879,264 Total general fund 4,491,661 3,588,760 3,180,410 4,043,713 3,618,567 3,445,456 3,430,306 3,521,264 2,854,069 2,396,966 All other governmental funds Reserved 423,390 252,063 256,447 221,861 2,117,205 426,875 608,054 2,704,397 3,556,983 2,867,537 Unreserved (deficit), reported in: Special revenue funds 5,290,424 5,826,527 5,833,486 6,024,628 4,433,601 2,721,488 2,151,294 1,633,313 2,047,338 1,819,163 Debt service funds 4,074,995 3,881,582 3,609,078 3,131,035 3,063,298 3,324,549 3,069,420 2,366,735 2,247,661 1,728,375 Capital projects funds 569,830 744,698 597,238 1,599,829 1,873,259 5,496,444 4,985,705 1,606,038 5,927,805 6,760,256 Total all other governmental funds 10,358,639 10,704,870 10,296,249 10,977,353 11,487,363 11,969,356 10,814,473 8,310,483 13,779,787 13,175,331 Total governmental funds $ 14,850,300 $ 14,293,630 $ 13,476,659 $ 15,021,066 $ 15,105,930 $ 15,414,812 $ 14,244,779 $ 11,831,747 $ 16,633,856 $ 15,572,297
Source: City financial records

City of North Olmsted, Ohio Changes in Fund Balances, Governmental Funds Modified Accrual Basis of Accounting Last Ten Years
140
2010 2009 2008 2007 2006 2005 2004 2003 2002 2001 Revenues: Property taxes $ 9,985,313 $ 10,687,345 $ 10,928,075 $ 11,300,024 $ 10,743,737 $ 10,519,830 $ 10,476,303 $ 10,000,703 $ 10,154,593 $ 10,114,983 Income taxes 11,770,310 12,241,747 12,823,445 13,347,091 13,716,789 12,310,815 12,416,225 11,658,413 11,328,050 11,121,341 Charges for services 2,414,501 2,318,947 2,306,911 2,429,928 2,400,889 2,485,102 1,930,702 2,002,103 2,073,941 2,075,553 Fines, licenses and permits 1,212,137 1,211,117 1,233,366 1,336,750 1,326,848 1,456,374 1,754,093 1,786,733 1,413,825 1,295,674 Intergovernmental 5,802,595 6,146,811 6,151,099 7,020,463 7,731,605 5,568,035 4,787,581 6,310,281 6,218,117 5,003,181 Special assessments 90,000 85,000 75,000 70,000 70,000 65,000 60,000 55,000 116,813 102,808 Interest 62,463 84,227 531,565 1,029,342 917,948 596,488 240,155 295,832 363,807 937,639 Miscellaneous 208,977 195,904 214,157 273,269 206,726 242,574 247,967 180,826 378,776 318,536 Total revenues 31,546,296 32,971,098 34,263,618 36,806,867 37,114,542 33,244,218 31,913,026 32,289,891 32,047,922 30,969,715 Expenditures: Current: General government 3,457,202 3,548,371 4,303,141 4,010,702 4,180,324 3,192,461 4,674,713 4,263,938 4,367,055 4,100,839 Security of persons and property 11,947,782 12,492,370 14,436,087 14,045,123 14,547,145 13,168,505 12,865,169 11,604,760 11,685,896 11,046,278 Public health and welfare 477,740 549,409 563,943 560,468 543,475 615,365 471,376 442,111 453,113 471,538 Transportation 4,422,054 4,949,069 5,702,600 5,522,720 4,981,748 4,817,442 3,863,076 5,311,916 5,213,922 6,473,806 Basic utility services 2,246,112 2,107,623 2,165,012 1,884,985 1,690,898 1,648,006 1,579,709 1,681,386 1,607,984 1,603,503 Leisure time activities 2,343,545 2,208,061 2,409,455 2,405,799 2,264,816 2,420,164 2,271,632 2,212,675 2,161,359 2,087,516 Community environment - - - - 22,372 37,593 - - - Economic development 556,467 554,298 544,560 341,877 155,170 175,375 - - 218,058 180,354 Other - - - - - - - - - Capital outlay 122,399 416,772 834,099 3,152,670 4,514,283 3,023,674 3,858,779 6,348,743 1,453,736 3,421,177 Debt Service: Principal 7,588,715 6,763,814 5,803,153 4,120,931 14,009,002 10,733,612 5,933,612 5,007,897 3,342,539 2,982,456 Interest and fiscal charge 1,606,408 1,738,992 1,951,582 2,077,473 2,322,655 2,147,630 2,229,548 2,378,765 2,552,217 2,757,715 Note issuance costs 25,522 22,017 12,000 13,250 - - - - - - Bond issuance costs 83,872 - - - 329,670 - - - - - Total expenditures 34,877,818 35,350,796 38,725,632 38,135,998 49,539,186 41,964,606 37,785,207 39,252,191 33,055,879 35,125,182 Excess of revenues over (under) expenditures (3,331,522) (2,379,698) (4,462,014) (1,329,131) (12,424,644) (8,720,388) (5,872,181) (6,962,300) (1,007,957) (4,155,467) (Continued)

City of North Olmsted, Ohio Changes in Fund Balances, Governmental Funds Modified Accrual Basis of Accounting (Continued) Last Ten Years
141
2010 2009 2008 2007 2006 2005 2004 2003 2002 2001 Other financing sources (uses): Issuance of notes - 3,215,000 2,370,000 1,560,000 500,000 9,860,000 7,725,000 2,195,000 1,865,000 - Inception of capital leases 59,763 - - - 63,782 19,316 - - - - Bond proceeds 3,715,000 - - - 27,230,000 - - - - 20,838,026
Premium on bonds 168,945 - - - 658,627 - - - - - Payment to bond escrow agent - - - - (16,354,414) - - - - (7,518,674) Sale of capital assets 20,284 9,450 27,527 12,349 20,120 11,105 560,213 11,447 13,206 13,519 Transfers - in 1,860,769 1,790,131 2,616,630 2,492,750 1,858,626 2,067,962 2,147,358 2,025,546 2,199,625 1,893,621 Transfers - out (1,936,569) (1,817,912) (2,096,550) (2,820,832) (1,860,979) (2,067,962) (2,147,358) (2,071,802) (2,008,315) (1,893,621) Total other financing sources (uses) 3,888,192 3,196,669 2,917,607 1,244,267 12,115,762 9,890,421 8,285,213 2,160,191 2,069,516 13,332,871 Net change in fund balances $ 556,670 $ 816,971 $ (1,544,407) $ (84,864) $ (308,882) $ 1,170,033 $ 2,413,032 $ (4,802,109) $ 1,061,559 $ 9,177,404 Debt service as a percentage of noncapital expenditures 37.11% 25.49% 21.38% 18.89% 38.30% 34.02% 24.52% 23.36% 18.44% 18.38%
Source: City financial records

City of North Olmsted, Ohio Assessed Valuations and Estimated Actual Values of Taxable Property Last Ten Years
142
Public Tangible Estimated Real Utility Personal True Values of Total Direct Year Property Property Property Total Taxable Property Tax Rate Ratio 2010 $ 825,718,930 $ 11,747,350 $ - $ 837,466,280 $ 2,372,546,204 $ 13.30 35.3% 2009 827,569,610 11,432,430 - 839,002,040 2,377,475,998 13.30 35.3 2008 882,868,100 11,624,510 15,831,601 910,324,211 2,799,034,922 13.20 32.5 2007 881,650,600 10,087,260 30,291,306 922,029,166 2,781,506,682 13.20 33.1 2006 881,661,360 14,502,800 39,487,817 935,651,977 2,758,639,748 13.20 33.9 2005 806,908,240 14,685,560 49,409,433 871,003,233 2,549,646,856 13.30 34.2 2004 802,181,840 15,808,350 47,369,486 865,359,676 2,529,519,101 13.30 34.2 2003 751,348,000 16,129,090 46,312,966 813,790,056 2,380,327,473 13.60 34.2 2002 748,692,910 17,173,070 50,671,362 816,537,342 2,376,154,188 13.60 34.4 2001 745,461,810 20,789,070 48,393,017 814,643,897 2,365,041,094 13.70 34.4 Source: Cuyahoga County Auditor, based upon tax year valuations

City of North Olmsted, Ohio Income Tax Revenue Collections (Cash Basis) Last Ten Years
143
Percentage Percentage Percentage of Taxes of Taxes of Taxes Tax Tax Total Tax Taxes from from Taxes from from Taxes from from Net Year Rate Collected Withholding Withholding Individuals Individuals Net Profits Profits 2010 2.00% $ 12,026,344 $ 9,090,112 75.6% $ 1,722,631 14.3% $ 1,213,601 10.1% 2009 2.00 12,285,520 8,970,962 73.0 1,727,948 14.1 1,586,610 12.9 2008 2.00 13,069,739 9,217,837 70.5 1,797,199 13.8 2,054,703 15.7 2007 2.00 13,330,936 9,275,262 69.6 1,880,178 14.1 2,175,496 16.3 2006 2.00 13,328,675 9,134,372 68.5 1,967,779 14.8 2,226,524 16.7 2005 2.00 12,613,174 9,137,415 72.4 2,065,620 16.4 1,410,139 11.2 2004 2.00 12,098,602 8,694,555 71.9 2,001,020 16.5 1,403,027 11.6 2003 2.00 11,548,120 8,516,041 73.7 2,110,004 18.3 922,075 8.0 2002 2.00 11,391,003 8,198,490 72.0 2,094,315 18.4 1,098,198 9.6 2001 2.00 10,971,259 8,020,823 73.1 2,148,819 19.6 801,617 7.3 Source: City Finance Department

City of North Olmsted, Ohio Property Tax Rates - Direct and Overlapping Governments (Per $1,000 of Assessed Valuation) Last Ten Years
144
City of North Olmsted Police Polaris General Debt Retirement and Fire School Cuyahoga Vocational Year Operating General Sewer Recreation Pension Total District County (a) School Total
2010 $ 6.70 $ 4.80 $ - $ 1.20 $ 0.60 $ 13.30 $ 91.40 $ 20.90 $ 2.40 $ 128.00 2009 6.40 5.10 - 1.20 0.60 13.30 83.50 20.60 2.40 119.80 2008 6.50 4.90 - 1.20 0.60 13.20 83.50 20.60 2.40 119.70 2007 6.50 4.90 - 1.20 0.60 13.20 83.50 20.20 2.40 119.30 2006 6.60 4.80 - 1.20 0.60 13.20 77.00 20.20 2.40 112.80 2005 6.70 4.80 - 1.20 0.60 13.30 77.00 20.30 2.40 113.00 2004 6.70 4.80 - 1.20 0.60 13.30 77.00 18.30 2.40 111.00 2003 7.00 4.10 0.70 1.20 0.60 13.60 77.00 17.60 2.40 110.60 2002 7.00 4.10 0.70 1.20 0.60 13.60 77.00 17.60 2.40 110.60 2001 7.00 4.10 0.80 1.20 0.60 13.70 69.10 17.60 2.40 102.80 (a) Includes Metroparks and Library Millage Source: Cuyahoga County Auditor

City of North Olmsted, Ohio Real Property Tax Levies, and Collections Last Ten Years
145
Percentage Percentage of Current of Total Accumulated Delinquent Collections Collections Outstanding Taxes to Total Current to Tax Delinquent Total to Tax Delinquent Total Tax Year Tax Levy Collections Levy Collections Collections(1) Levy Taxes Levy 2010 $ 11,800,535 $ 10,623,422 90.03% $ 391,697 $ 11,015,119 93.34% $ 574,690 4.9% 2009 11,802,571 11,300,029 95.74 235,982 11,536,011 97.74 659,686 5.6 2008 11,804,175 11,399,614 96.57 293,573 11,693,187 99.06 400,697 3.4 2007 11,807,403 11,403,200 96.58 250,483 11,653,683 98.70 459,981 3.9 2006 10,906,598 10,577,903 96.99 239,718 10,817,621 99.18 363,471 3.3 2005 10,876,753 10,520,394 96.72 330,560 10,850,954 99.76 405,306 3.7 2004 10,952,774 10,489,902 95.77 346,897 10,836,799 98.94 570,796 5.2 2003 10,460,345 10,098,354 96.54 235,467 10,333,821 98.79 537,927 5.1 2002 10,454,645 10,057,703 96.20 331,751 10,389,454 99.38 463,462 4.4 2001 10,477,350 10,135,765 96.74 256,101 10,391,866 99.18 534,176 5.1 Source: Cuyahoga County Auditor (1) State reimbursement of rollback and homestead exemptions is included Note: The County does not identify delinquent collections by the year for which the tax was levied.

City of North Olmsted, Ohio Principal Taxpayers - Real Estate Tax 2010 and 2001
146
December 31, 2010 Percent of Assessed Total Assessed Name of Taxpayer Value (1) Value Great Northern Partnership $ 29,579,140 3.53% DDR MDT Great Northern 22,867,310 2.73 Cleveland Electric Illuminating Company 10,069,260 1.20 Duke Realty Ohio 8,465,210 1.01 B&G Properties LTD Partnership 6,107,700 0.73 JVM Butternut Apartments, LLC 5,985,000 0.70 Moen, Inc. 5,654,680 0.68 Water Tower Square LTD Partnership 4,638,730 0.55 Wal Mart 4,200,010 0.50 Higbee Company 3,850,010 0.46
Total $ 101,417,050 12.09% December 31, 2001 Percent of Assessed Total Assessed Name of Taxpayer Value (1) Value Great Northern Partnership $ 20,420,720 2.77% DDR MDT Great Northern 17,725,860 2.41 Great Northern Properties 8,279,460 1.13 B&G Properties LTD Partnership 5,700,920 0.77 Butternut Ridge Appt. LLC 5,462,630 0.74 May Stores 74 Corp 4,869,900 0.66 Water Tower Square LTD 4,714,120 0.64 Wal Mart 4,221,390 0.57 Sears Roebuck Co 4,090,450 0.56 Country Club Hotel Assoc LLC 3,694,360 0.50 Total $ 79,179,810 10.75% Source: Cuyahoga County Auditor (1) The amounts presented represent the assessed values upon which 2010 and 2001 collections were based.

City of North Olmsted, Ohio Ratio of Outstanding Debt to Total Personal Income and Debt per Capita Last Ten Years
147
Governmental Activities Business-Type Activities General Special Long Intergovern- General Long Percentage Obligation Assessment OPWC OWDA Term Capital mental Police Obligation Term Capital OWDA OPWC Total of Personal Per Year Bonds Bonds Loans Loans Notes Leases Payable Pension Bonds Notes Leases Loans Loans Debt Income Capita
2010 $ 30,783,808 $ - $ 40,837 $ - $ - $ 51,989 $ - $ 93,801 $ 12,222,846 $ - $ 3,427 $1,436,697 $ 651,668 $ 45,285,073 5.54% $ 1,384 2009 31,165,433 90,000 54,450 - 3,215,000 - - 96,629 13,313,153 - - 1,018,076 782,001 49,734,742 5.83 1,458 2008 35,442,003 175,000 68,061 - 2,370,000 21,991 - 99,341 14,631,498 - 1,621 607,269 912,335 54,329,119 6.37 1,593 2007 39,579,073 250,000 81,675 - 1,560,000 42,930 - 101,941 15,878,343 - 3,206 611,019 1,042,667 59,150,854 7.34 1,734 2006 43,600,143 320,000 95,288 - - 62,755 - 104,434 16,945,688 - 4,711 662,621 1,173,000 62,968,640 7.82 1,846 2005 35,635,000 390,000 108,899 - 9,860,000 15,754 - 106,825 17,440,000 315,000 6,139 712,161 1,303,334 65,893,112 8.30 1,932 2004 39,115,000 455,000 122,511 - 7,175,000 - - 109,117 18,435,000 - 26,176 759,721 1,433,667 67,631,192 8.23 1,983 2003 42,230,000 515,000 136,123 - 2,195,000 - - 111,314 19,385,000 - 51,402 805,381 1,564,001 66,993,221 8.15 1,964 2002 45,130,000 570,000 149,736 172,176 1,865,000 - 45,103 113,422 20,290,000 - 75,713 849,216 1,694,334 70,954,700 8.55 2,080 2001 48,075,000 620,000 163,349 333,686 - - - - 21,155,000 - - 891,299 1,824,667 73,063,001 8.80 2,142
Note: Population and Personal Income are presented on page 153.

City of North Olmsted, Ohio Ratio of Net General Bonded Debt to Assessed Value and Net Bonded Debt Per Capita Last Ten Years
148
Gross(3) Assessed(2) Bonded Debt Service Year Population(1) Value Debt Monies Available 2010 32,718 a $ 837,466,280 $ 43,006,654 $ 2,802,057 2009 34,113 b 839,002,040 44,478,586 2,657,293 2008 34,113 b 910,324,211 50,073,501 2,455,310 2007 34,113 b 922,029,166 55,457,416 2,050,397 2006 34,113 b 935,651,977 60,545,831 1,441,806 2005 34,113 b 871,003,233 53,075,000 2,168,871 2004 34,113 b 865,359,676 57,550,000 1,802,585 2003 34,113 b 813,790,056 61,615,000 1,369,838 2002 34,113 b 816,537,342 65,420,000 1,625,402 2001 34,113 b 814,643,897 69,230,000 1,876,456 (1) Source: U.S. Bureau of Census, Census of Population (a) 2010 Federal Census (b) 2000 Federal Census (2) Source: Cuyahoga County Auditor, valuations based upon the tax year (3) Includes all general obligation bonded debt

149
Ratio of Net Bonded Net Bonded Net Bonded Debt to Assessed Debt Per Debt Valuation Capita $ 40,204,597 4.80% $ 1,229 41,821,293 4.98 1,226 47,618,191 5.23 1,396 53,407,019 5.89 1,566 59,104,025 6.32 1,733 50,906,129 5.84 1,492 55,747,415 6.44 1,634 60,245,162 7.40 1,766 63,794,598 7.81 1,870 67,353,544 8.27 1,974

City of North Olmsted, Ohio Computation of Direct and Overlapping General Obligation Debt December 31, 2010
150
Amount General Percentage Applicable Obligation Debt Applicable to City of Outstanding to City (1) North Olmsted Jurisdiction: Direct: City of North Olmsted (1) General obligation bonds $ 30,783,808 100.00% $ 30,783,808 OPWC loans 40,837 100.00 40,837 Total direct debt 30,824,645 30,824,645 Overlapping: North Olmsted School District 340,000 100.00 340,000 North Olmsted/Olmsted Falls School District 20,305,607 1.70 345,195 Cuyahoga County 319,446,948 2.81 8,976,459 Greater Cleveland Regional Transit Authority 152,760,000 2.81 4,292,556 Total overlapping debt 492,852,555 13,954,210 Total $ 523,677,200 $ 44,778,855 Source: Cuyahoga County Auditor (1) Percentages were determined by dividing each overlapping subdivision's assessed valuation within the City by its total assessed valuation.
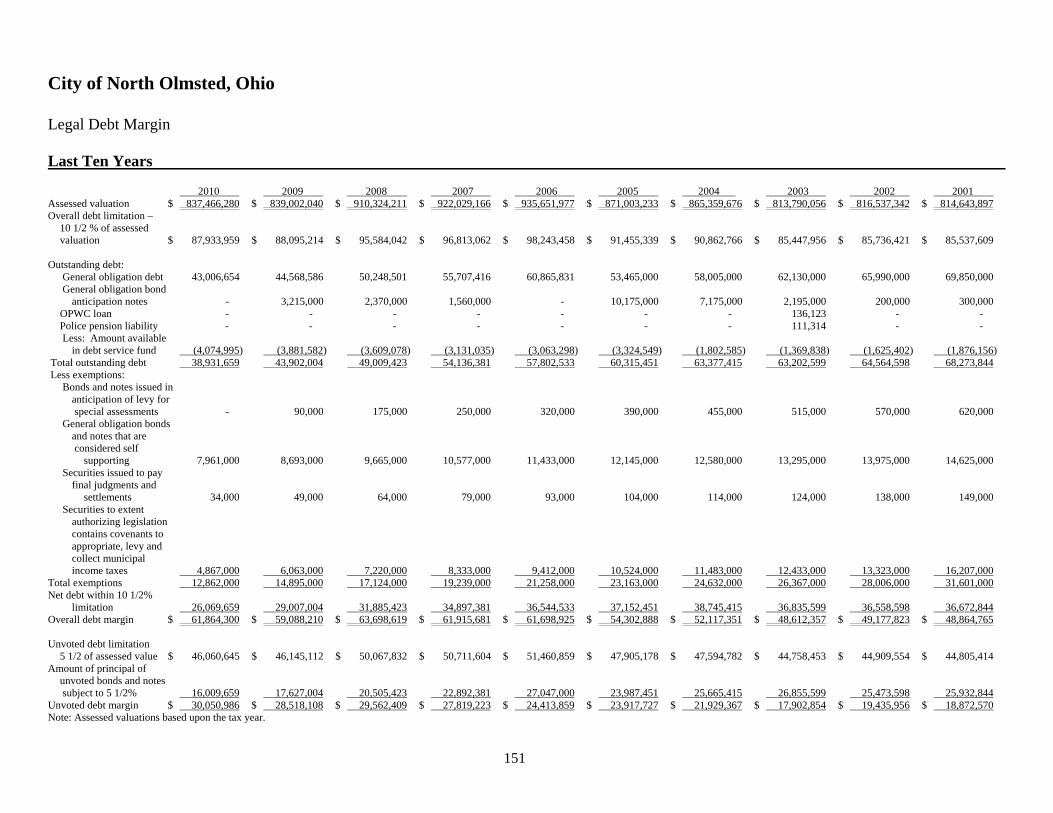
City of North Olmsted, Ohio Legal Debt Margin Last Ten Years
151
2010 2009 2008 2007 2006 2005 2004 2003 2002 2001 Assessed valuation $ 837,466,280 $ 839,002,040 $ 910,324,211 $ 922,029,166 $ 935,651,977 $ 871,003,233 $ 865,359,676 $ 813,790,056 $ 816,537,342 $ 814,643,897 Overall debt limitation – 10 1/2 % of assessed valuation $ 87,933,959 $ 88,095,214 $ 95,584,042 $ 96,813,062 $ 98,243,458 $ 91,455,339 $ 90,862,766 $ 85,447,956 $ 85,736,421 $ 85,537,609 Outstanding debt: General obligation debt 43,006,654 44,568,586 50,248,501 55,707,416 60,865,831 53,465,000 58,005,000 62,130,000 65,990,000 69,850,000 General obligation bond anticipation notes - 3,215,000 2,370,000 1,560,000 - 10,175,000 7,175,000 2,195,000 200,000 300,000 OPWC loan - - - - - - - 136,123 - - Police pension liability - - - - - - - 111,314 - - Less: Amount available in debt service fund (4,074,995) (3,881,582) (3,609,078) (3,131,035) (3,063,298) (3,324,549) (1,802,585) (1,369,838) (1,625,402) (1,876,156) Total outstanding debt 38,931,659 43,902,004 49,009,423 54,136,381 57,802,533 60,315,451 63,377,415 63,202,599 64,564,598 68,273,844 Less exemptions: Bonds and notes issued in anticipation of levy for special assessments - 90,000 175,000 250,000 320,000 390,000 455,000 515,000 570,000 620,000 General obligation bonds and notes that are considered self supporting 7,961,000 8,693,000 9,665,000 10,577,000 11,433,000 12,145,000 12,580,000 13,295,000 13,975,000 14,625,000 Securities issued to pay final judgments and settlements 34,000 49,000 64,000 79,000 93,000 104,000 114,000 124,000 138,000 149,000 Securities to extent authorizing legislation contains covenants to appropriate, levy and collect municipal income taxes 4,867,000 6,063,000 7,220,000 8,333,000 9,412,000 10,524,000 11,483,000 12,433,000 13,323,000 16,207,000 Total exemptions 12,862,000 14,895,000 17,124,000 19,239,000 21,258,000 23,163,000 24,632,000 26,367,000 28,006,000 31,601,000 Net debt within 10 1/2% limitation 26,069,659 29,007,004 31,885,423 34,897,381 36,544,533 37,152,451 38,745,415 36,835,599 36,558,598 36,672,844 Overall debt margin $ 61,864,300 $ 59,088,210 $ 63,698,619 $ 61,915,681 $ 61,698,925 $ 54,302,888 $ 52,117,351 $ 48,612,357 $ 49,177,823 $ 48,864,765 Unvoted debt limitation 5 1/2 of assessed value $ 46,060,645 $ 46,145,112 $ 50,067,832 $ 50,711,604 $ 51,460,859 $ 47,905,178 $ 47,594,782 $ 44,758,453 $ 44,909,554 $ 44,805,414 Amount of principal of unvoted bonds and notes subject to 5 1/2% 16,009,659 17,627,004 20,505,423 22,892,381 27,047,000 23,987,451 25,665,415 26,855,599 25,473,598 25,932,844 Unvoted debt margin $ 30,050,986 $ 28,518,108 $ 29,562,409 $ 27,819,223 $ 24,413,859 $ 23,917,727 $ 21,929,367 $ 17,902,854 $ 19,435,956 $ 18,872,570 Note: Assessed valuations based upon the tax year.

City of North Olmsted, Ohio Principal Employers Last Ten Years
152
2010 2009 2008 Percent of Percent of Percent of Total Income Total Income Total Income Employer Taxes Employer Taxes Employer Taxes Moen Incorporated 8.03% Moen Incorporated 6.93% Moen Incorporated 6.76% North Olmsted School District 5.63 North Olmsted School District 5.45 North Olmsted School District 4.92 The City of North Olmsted 2.23 The City of North Olmsted 2.45 The City of North Olmsted 2.55 Factory Mutual Insurance Company 1.28 Advanstar Communications, Inc. 1.68 Advanstar Communications, Inc. 1.57 Advanstar Communications, Inc. 1.25 Factory Mutual Insurance Company 1.34 Cingular Wireless Employee Services 1.22 AT&T Mobility 1.13 AT&T Mobility 1.20 Factory Mutual Insurance Company 1.22 Heartland Employment Services, Inc. 0.99 Heartland Employment Services, Inc. 0.99 Sunnyside Automotive, Inc. 0.92 Wal Mart Associates, Inc. 0.93 Wal Mart Associates, Inc. 0.96 Heartland Employment Services, Inc. 0.89 Heartland Payment Systems, Inc. 0.92 Sunnyside Automotive, Inc. 0.87 Wal Mart Associates, Inc. 0.87 Sunnyside Automotive, Inc. 0.90 Riser Foods Company 0.87 Riser Foods Company 0.84 23.29% 22.74% 21.76%
2007 2006 2005 Moen Incorporated North Olmsted School District Dillards Department Stores North Olmsted School District Moen Incorporated Factory Mutual Insurance The City of North Olmsted The City of North Olmsted GMAC-GM Payroll Services Factory Mutual Insurance Company Riser Foods Company Heartland Employment Services, Inc. Wal Mart Associates, Inc. Kaufmann's Department Stores Moen Incorporated Sunnyside Cars, Inc. Wal Mart Associates, Inc. The City of North Olmsted Heartland Employment Services, Inc. Dillard Department Stores North Olmsted School District Cingular Wireless Employee Services Sears, Roebuck & Company Riser Foods Company Merrill Lynch Pierce Kenner & P. Craig Olmsted Manor Nursing Center Sunnyside Cars, Inc. GMAC-GM Payroll Services Sunnyside Cars, Inc. Wal Mart Associates, Inc.
2004 2003 2002 2001 Factory Mutual Insurance Co. Factory Mutual Insurance Co. Factory Mutual Insurance Co. Factory Mutual Insurance Co. GMAC-GM Payroll Services GMAC-GM Payroll Services GMAC-GM Payroll Services GMAC-GM Payroll Services Heartland Employment Services, Inc Heartland Employment Services, Inc. Heartland Employment Services, Inc. Kaufmans May Department Stores May Department Stores May Department Stores Merrill Lynch P F & Smith Moen Incorporated Moen Incorporated Moen Incorporated Moen Incorporated The City of North Olmsted The City of North Olmsted The City of North Olmsted The City of North Olmsted North Olmsted School District North Olmsted School District North Olmsted School District North Olmsted School District Riser Foods Company Riser Foods Company Riser Foods Company Riser Foods Company Sunnyside Cars, Inc. Sunnyside Cars, Inc. Sunnyside Cars, Inc. Sunnyside Cars, Inc. Wal Mart Associates, Inc. Wal Mart Associates, Inc. Wal Mart Associates, Inc. Wal Mart Associates, Inc.
Source: Regional Income Tax Agency based on payroll withholding.

City of North Olmsted, Ohio Demographic and Economic Statistics Last Ten Years
153
Unemployment Rate (2) Employed Total Personal in School (3) Personal Income Year Population (1) County(2) County State US Enrollment Income(2) Per Capita 2010 32,718 a 574,600 9.5% 10.1% 9.6% 4,193 $ 817,917,282 $ 24,999 2009 34,113 b 581,200 9.2 10.8 9.3 4,314 852,795,765 24,999 2008 34,113 b 601,800 6.8 6.5 5.8 4,366 852,795,765 24,999 2007 34,113 b 617,900 6.1 5.6 4.6 4,587 805,411,545 23,610 2006 34,113 b 622,876 5.6 5.4 4.8 4,613 805,411,545 23,610 2005 34,113 b 629,000 5.9 5.8 5.1 4,577 794,414,837 23,288 2004 34,113 b 637,400 6.2 6.1 5.5 4,556 821,979,594 24,096 2003 34,113 b 629,600 6.8 6.1 6.0 4,468 821,979,594 24,096 2002 34,113 b 624,900 6.7 5.7 5.8 4,663 829,935,177 24,329 2001 34,113 b 648,300 4.6 4.3 4.8 4,714 829,935,177 24,329 (1) Source: U.S. Census, Census of population (a) 2010 Federal Census (b) 2000 Federal Census (2) Ohio Department of Jobs and Family Services, U.S. Department of Labor and Bureau of Labor Statistics Note: 2009 and 2010 personal income estimate not available (3) Source: North Olmsted Board of Education

City of North Olmsted, Ohio Full Time City Employees By Function or Program Last Ten Years
154
2010 2009 2008 2007 2006 2005 2004 2003 2002 2001 Function/program: General government: Council 1 1 1 1 1 1 1 1 1 1 Mayor 2 2 2 3 3 2 2 2 2 1 General clerical 1 1 1 1 1 1 1 1 1 1 Boards and commissions 1 1 1 1 1 1 1 2 2 2 Finance 6 6 6 6 6 6 6 6 6 7 Law 1 2 2 2 2 2 2 2 2 0 Information systems 1 1 1 1 0 1 1 2 2 2 Human resources 3 3 3 3 3 3 3 3 3 3 Building 9 9 12 9 11 12 10 10 11 10 Engineering 0 0 0 4 4 5 6 6 7 8 Total 25 26 29 31 32 34 33 35 37 35 Security of persons and property: Safety director 2 2 2 2 2 2 2 2 2 2 Fire 43 41 46 47 46 48 45 46 47 48 Dispatch 8 8 8 8 9 9 8 9 9 10 Corrections 1 1 1 2 2 2 2 2 3 3 Police 46 50 55 57 55 57 57 57 57 56 Youth Services (see Public health and welfare) 1 1 1 1 1 0 0 0 0 0 Fire clerk 1 1 1 1 1 1 1 1 1 2 Police clerk 5 5 6 6 6 6 6 6 7 8 Total 107 109 120 124 122 125 121 123 126 129 Leisure time activities: Senior center 3 2 2 2 2 2 2 2 2 2 Recreation 7 9 10 12 12 10 11 12 12 12 Springvale 4 3 4 4 4 4 4 4 4 4 Total 14 14 16 18 18 16 17 18 18 18 Public health and welfare: Community life services (a) 0 2 2 2 2 2 2 2 2 2 Youth services 0 0 0 0 0 1 1 1 1 1 Total 0 2 2 2 2 3 3 3 3 3 Transportation: Service director 1 2 2 2 2 2 2 2 2 2 Public service and properties Public works administrative 0 0 0 0 0 0 0 0 0 2 Animal warden 1 1 1 1 1 1 1 1 1 1 Building maintenance 3 3 4 5 5 5 5 5 6 6 Road 9 9 5 7 7 7 7 7 7 9 Forestry 4 3.5 7 7 7 9 9 9 10 12 Storm 3 3.5 4 5 6 6 6 6 8 13 Subtotal 20 20 21 25 26 28 28 28 32 43 Fleet 7 7 8 8 8 8 8 8 8 9 Bus 0 0 0 0 0 0 59 61 61 66 Total 28 29 31 35 36 38 97 99 103 120 Economic development Planning 2 2 2 2 2 2 2 0 0 0 Basic utility services: Wastewater treatment plant 28 27 29 32 35 37 37 37 36 33 Total 204 209 229 244 247 255 310 315 323 338 Source: City payroll records (a) See security of persons and property

City of North Olmsted, Ohio Operating Indicators by Function/Program Last Nine Years
155
2010 2009 2008 2007 2006 2005 2004 2003 2002 Function/Program: General government: Council and clerk Number of ordinances and resolutions submitted 162 152 165 158 203 191 206 182 209 Number of ordinances and resolutions passed 159 147 135 146 182 177 169 173 184
Finance Agency ratings Fitch IBCA AA- A+ A+ A+ A+ A+ A+ A+ A+ Moody's Financial Services - General Limited Tax Aa2 A1 A1 A1 A1 A2 A2 A2 A2 Moody's Financial Services - General Unlimited Tax Aa2 Aa3 Aa3 Aa3 Aa3 A1 A1 A1 A1
Law Real property complaints filed 38 22 18 7 17 12 11 N/A N/A Real property fines collected $ 7,405 $ 13,675 $ 9,858 $ 3,350 $ 2,173 $ 1,130 $ 1,450 N/A N/A Criminal cases prosecuted 922 927 1,304 730 933 674 N/A N/A N/A Traffic cases prosecuted 1,062 1,228 1,509 1,415 1,916 1,994 N/A N/A N/A
Building Estimated valuation of permits issued $ 15,650,821 $ 13,933,125 $ 15,151,105 $ 30,631,703 $ 39,828,613 $ 29,279,863 $ 30,239,136 $ 31,540,971 $ 51,295,838 Number of permits issued 1,103 1,142 1,203 1,284 1,312 1,444 1,465 1,482 1,455
Security of persons and property: Police Number of traffic citations issued 7,635 8,809 7,594 7,643 9,460 15,616 12,759 17,682 16,506 Number of parking citations issued 2,013 2,136 2,092 2,242 1,775 2,476 2,353 2,702 2,770 Number of criminal arrests 2,028 2,062 2,100 1,882 2,058 2,249 1,877 2,063 2,166
Fire Number of fire responses 703 700 810 811 733 711 679 723 N/A Number of squad responses 2,971 2,871 2,833 2,685 2,646 2,579 2,455 2,631 N/A Total number of emergency responses 3,674 3,571 3,643 3,496 3,379 3,290 3,134 3,354 3,228 Number of runs per day 10.1 10.3 10.0 9.6 9.2 9.0 8.6 9.1 8.8 (Continued)
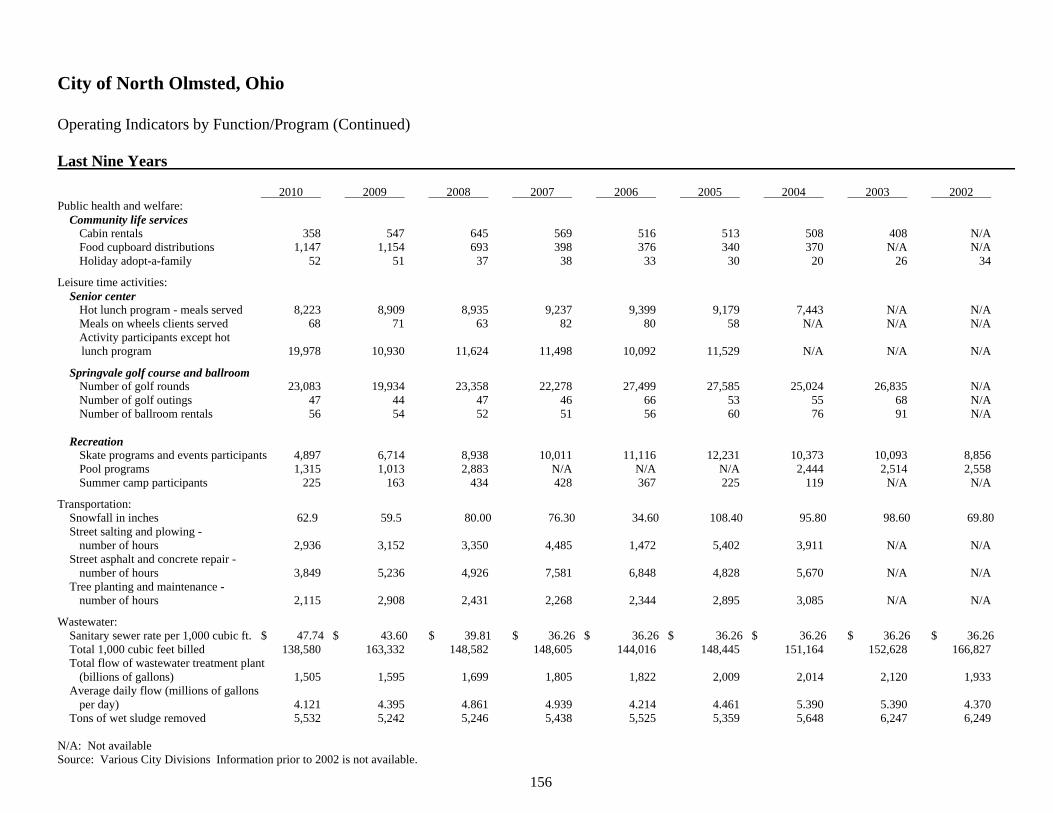
City of North Olmsted, Ohio Operating Indicators by Function/Program (Continued) Last Nine Years
156
2010 2009 2008 2007 2006 2005 2004 2003 2002 Public health and welfare: Community life services Cabin rentals 358 547 645 569 516 513 508 408 N/A Food cupboard distributions 1,147 1,154 693 398 376 340 370 N/A N/A Holiday adopt-a-family 52 51 37 38 33 30 20 26 34
Leisure time activities: Senior center Hot lunch program - meals served 8,223 8,909 8,935 9,237 9,399 9,179 7,443 N/A N/A Meals on wheels clients served 68 71 63 82 80 58 N/A N/A N/A Activity participants except hot lunch program 19,978 10,930 11,624 11,498 10,092 11,529 N/A N/A N/A
Springvale golf course and ballroom Number of golf rounds 23,083 19,934 23,358 22,278 27,499 27,585 25,024 26,835 N/A Number of golf outings 47 44 47 46 66 53 55 68 N/A Number of ballroom rentals 56 54 52 51 56 60 76 91 N/A Recreation Skate programs and events participants 4,897 6,714 8,938 10,011 11,116 12,231 10,373 10,093 8,856 Pool programs 1,315 1,013 2,883 N/A N/A N/A 2,444 2,514 2,558 Summer camp participants 225 163 434 428 367 225 119 N/A N/A
Transportation: Snowfall in inches 62.9 59.5 80.00 76.30 34.60 108.40 95.80 98.60 69.80 Street salting and plowing - number of hours 2,936 3,152 3,350 4,485 1,472 5,402 3,911 N/A N/A Street asphalt and concrete repair - number of hours 3,849 5,236 4,926 7,581 6,848 4,828 5,670 N/A N/A Tree planting and maintenance - number of hours 2,115 2,908 2,431 2,268 2,344 2,895 3,085 N/A N/A
Wastewater: Sanitary sewer rate per 1,000 cubic ft. $ 47.74 $ 43.60 $ 39.81 $ 36.26 $ 36.26 $ 36.26 $ 36.26 $ 36.26 $ 36.26 Total 1,000 cubic feet billed 138,580 163,332 148,582 148,605 144,016 148,445 151,164 152,628 166,827 Total flow of wastewater treatment plant (billions of gallons) 1,505 1,595 1,699 1,805 1,822 2,009 2,014 2,120 1,933 Average daily flow (millions of gallons per day) 4.121 4.395 4.861 4.939 4.214 4.461 5.390 5.390 4.370 Tons of wet sludge removed 5,532 5,242 5,246 5,438 5,525 5,359 5,648 6,247 6,249 N/A: Not available Source: Various City Divisions Information prior to 2002 is not available.

City of North Olmsted, Ohio Capital Assets Statistics by Function/Program Last Nine Years
157
2010 2009 2008 2007 2006 2005 2004 2003 2002 General government: Number of administrative vehicles 8 8 10 11 10 10 10 10 10
Security of persons and property: Fire: Number of stations 2 2 2 2 2 2 2 2 2 Number of vehicles 12 12 14 14 14 14 14 13 15
Police: Number of stations 1 1 1 1 1 1 1 1 1 Number of vehicles 24 26 29 27 28 28 28 28 28
Leisure time activities: Recreation: Number of parks 4 4 4 4 4 4 4 4 4 Number of pools 2 2 2 2 2 2 2 2 2 Recreation center facility 1 1 1 1 1 1 1 1 1 Number of vehicles 10 6 6 6 6 8 5 4 4
Springvale golf course and ballroom: Number of acres (18 hole golf course) 132 132 132 132 132 132 132 132 132 Square footage of ballroom 20,000 20,000 20,000 20,000 20,000 20,000 20,000 20,000 20,000 Number of vehicles 3 2 2 2 2 2 2 1 2
Senior center: Senior center facility 1 1 1 1 1 1 1 1 1 Number of vehicles 1 1 1 1 0 0 0 0 0
Transportation: Streets: Miles of streets 146 146 146 146 145 145 145 145 145 Number of street lights 2,633 2,633 2,633 2,633 2,362 2,362 2,362 2,362 2,362 Number of service vehicles 45 43 46 44 46 46 42 44 44
Wastewater: Miles of sanitary sewers 176 176 176 176 175 175 175 175 175 Miles of storm sewers 152 152 152 152 151 151 151 151 151 Number of vehicles 17 18 17 17 17 17 17 17 17 Note: The information presented above is for the last nine years. Information prior to 2002 is not available.

City of North Olmsted, Ohio Capital Assets by Function Last Nine Years
158
2010 2009 2008 2007 2006 2005 2004 2003 2002 Governmental activities: General government: Non-depreciable Land and art $ 3,728,055 $ 3,728,055 $ 3,728,055 $ 3,728,055 $ 3,728,055 $ 3,728,055 $ 3,705,055 $ 3,712,536 $ 3,712,536 CIP 18,986 - - - 254,987 288,158 134,465 5,451,463 423,692 Other capital assets Cost 13,863,148 13,821,102 13,729,777 12,854,218 12,326,485 12,043,287 12,023,709 5,193,388 5,272,427 Net book value 8,828,478 9,146,041 9,543,887 9,075,066 8,843,845 8,865,854 9,136,769 1,997,027 2,111,241 Security of persons and property: Fire: Non-depreciable Land 349,400 349,400 349,400 349,400 - - - - - CIP - - - - 2,166,808 433,895 - - - Other capital assets Cost 9,521,134 9,543,303 9,543,303 9,543,303 5,669,892 5,310,749 5,302,466 5,054,346 5,036,437 Net book value 5,863,147 6,103,581 6,394,553 6,735,628 3,157,763 3,032,411 3,247,466 2,947,042 3,100,706 Police: Other capital assets Cost 2,883,521 2,888,984 3,269,628 3,147,006 3,274,082 3,152,905 2,893,512 2,633,713 2,563,021 Net book value 833,697 934,353 1,032,175 1,082,266 1,147,013 1,081,959 983,193 977,251 1,032,607 Leisure time activities: Recreation: Non-depreciable CIP - - - - 12,284 - - 98,005 78,024 Other capital assets Cost 9,436,242 9,331,565 9,268,061 9,198,799 9,029,953 9,032,171 8,941,133 8,815,998 8,803,470 Net book value 1,333,826 1,533,088 1,797,927 2,026,002 2,091,819 2,319,717 2,526,462 2,659,549 2,892,112 Senior center: Non-depreciable CIP - 16,833 - - - 18,541 - - - Other capital assets Cost 687,186 539,328 537,262 537,262 519,066 480,903 340,491 322,846 322,846 Net book value 415,593 267,723 285,590 303,456 321,322 300,072 162,348 153,983 162,579 (Continued)

City of North Olmsted, Ohio Capital Assets by Function (Continued) Last Nine Years
159
2010 2009 2008 2007 2006 2005 2004 2003 2002 Transportation: Non-depreciable CIP - 137,773 171,537 - - 102,546 - - - Other capital assets Cost 3,707,236 3,670,474 3,635,325 3,632,741 3,682,027 3,360,309 3,228,825 2,925,187 2,891,034 Net book value 791,339 861,383 900,458 1,018,743 1,061,013 801,278 704,307 547,836 655,772 Infrastructure Cost 139,422,954 130,440,393 129,467,866 128,983,810 128,076,170 126,253,887 124,938,751 124,765,980 123,532,616 Net book value 47,272,254 43,804,306 47,936,456 52,478,902 55,977,893 58,243,624 61,511,648 66,012,005 69,290,696 Totals: Non-depreciable Land and art 4,077,455 4,077,455 4,077,455 4,077,455 3,728,055 3,728,055 3,705,055 3,712,536 3,712,536 CIP 18,986 154,606 171,537 - 2,434,079 843,140 134,465 5,549,468 501,716 Other capital assets Cost 40,098,467 39,794,756 39,983,356 38,913,329 34,501,505 33,380,324 32,730,136 24,945,478 24,889,235 Net book value 18,066,080 18,846,169 19,954,590 20,241,161 16,622,775 16,401,291 16,760,545 9,282,688 9,955,017 Infrastructure Cost 139,422,954 130,440,393 129,467,866 128,983,810 128,076,170 126,253,887 124,938,751 124,765,980 123,532,616 Net book value 47,272,254 43,804,306 47,936,456 52,478,902 55,977,893 58,243,624 61,511,648 66,012,005 69,290,696 Total governmental activities-cost $ 183,617,862 $ 174,467,210 $ 173,700,214 $ 171,974,594 $ 168,739,809 $ 164,205,406 $ 161,508,407 $ 158,973,462 $ 152,636,103 Total governmental activities-net book value $ 69,434,775 $ 66,882,536 $ 72,140,038 $ 76,797,518 $ 78,762,802 $ 79,216,110 $ 82,111,713 $ 84,556,697 $ 83,459,965 Business-type activities: Springvale golf course and ballroom: Cost $ 6,906,494 $ 6,896,158 $ 6,894,216 $ 6,902,678 $ 6,931,673 $ 6,928,445 $ 6,915,563 $ 6,915,069 $ 6,915,069 Net book value 4,993,308 5,157,215 5,328,579 5,509,561 5,637,324 5,813,900 6,009,015 6,204,470 6,387,523 Sewer revenue: Cost 69,798,659 69,008,076 68,353,901 68,347,944 68,372,826 68,227,491 68,114,361 67,935,873 67,808,647 Net book value 22,008,808 22,460,892 23,208,251 24,630,309 26,023,751 27,285,455 28,604,057 29,936,248 31,340,389 (Continued)

City of North Olmsted, Ohio Capital Assets by Function (Continued) Last Nine Years
160
2010 2009 2008 2007 2006 2005 2004 2003 2002 NOMBL: Cost 564,130 564,130 564,130 544,677 564,462 571,462 571,462 571,462 571,462 Net book value 391,537 391,537 391,537 372,084 372,084 372,084 372,084 374,062 378,019 Total business-type activities cost $ 77,269,283 $ 76,468,364 $ 75,812,247 $ 75,795,299 $ 75,868,961 $ 75,727,398 $ 75,601,386 $ 75,422,404 $ 75,295,178 Total business-type activities net book value $ 27,393,653 $ 28,009,644 $ 28,928,367 $ 30,511,954 $ 32,033,159 $ 33,471,439 $ 34,985,156 $ 36,514,780 $ 38,105,931 Source: City Finance Department - capital asset inventory. Information prior to 2002 is not available.