climate change mitigation in the buildings sector - · pdf fileclimate change mitigation in...
TRANSCRIPT
Climate change mitigation in the buildings sector:
the findings of the 4th Assessment Report of the IPCC
Diana Ürge-VorsatzCoordinating Lead Author, 4th Assessment Report, IPCCand
Professor and DirectorCenter for Climate Change and Sustainable Energy
Central European University

3CSEP
Outline
Mitigation in the buildings sector: global and regional importance
Potential and costs of GHG mitigation in buildings
Co-benefits of GHG mitigation in bldgsPolicies to foster carbon-efficiency buildingsConclusions

Mitigation in the buildings sector: global and regional importance

3CSEP
GHG emissions from buildings in 2004 (in Gt CO2 equivalent)
Energy-related direct CO2,3 Gt, 28%
Electricity-related indirect CO2,5.6 Gt, 53%
total energy-related CO2, 8.6 Gt, 81%
CH4, 0.4 Gt, 4%
N2O,0.1 Gt, 1%
Halocarbons,1.5 Gt, 14%
Building sector: global importanceIn 2004, in buildings were responsible for app. 1/3rd of global energy-
related CO2 (incl. indirect) and 3/5th of halocarbon emissions
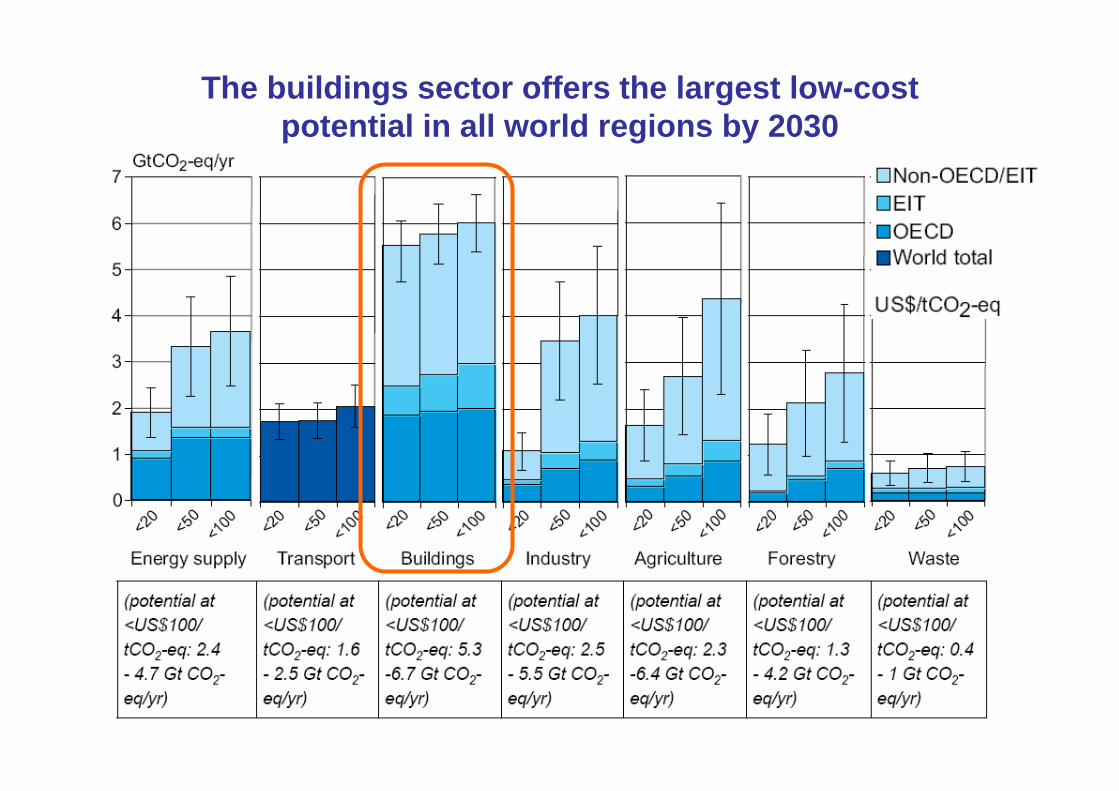
The buildings sector offers the largest low-cost potential in all world regions by 2030
3CSEP
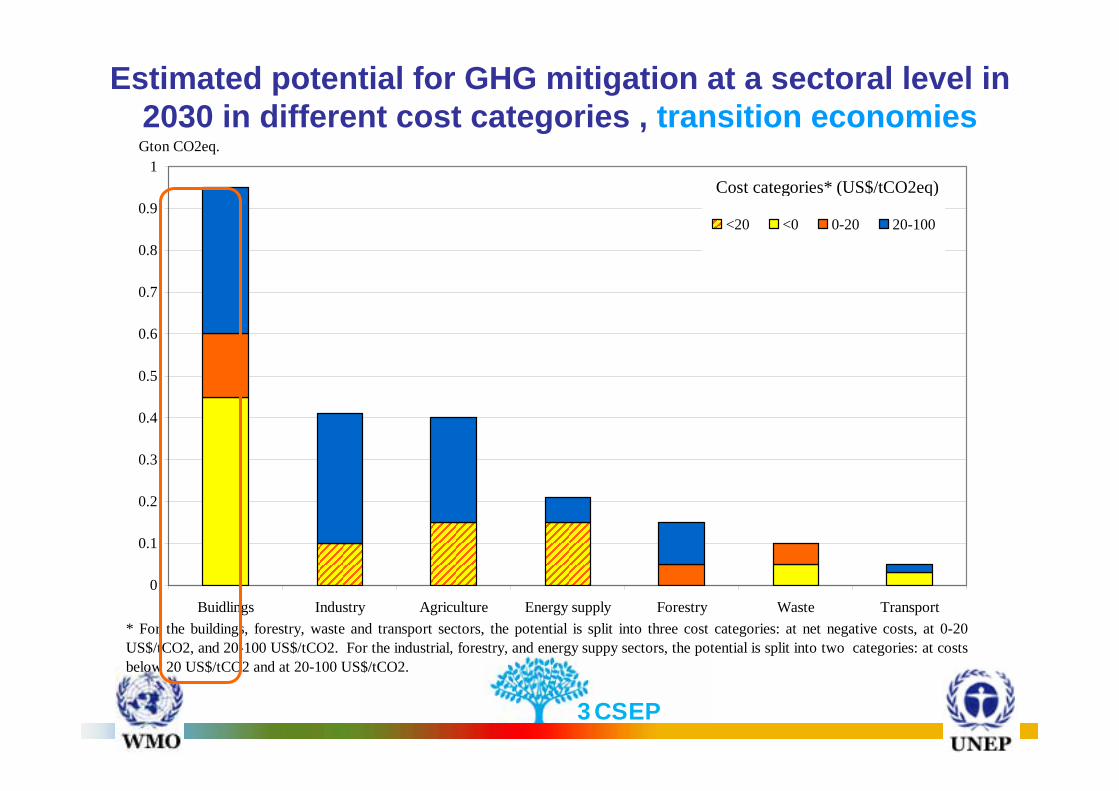
Estimated potential for GHG mitigation at a sectoral level in 2030 in different cost categories , transition economies
0
0.1
0.2
0.3
0.4
0.5
0.6
0.7
0.8
0.9
1
Buidlings Industry Agriculture Energy supply Forestry Waste Transport
Gton CO2eq.
<20 <0 0-20 20-100
Cost categories* (US$/tCO2eq)
* For the buildings, forestry, waste and transport sectors, the potential is split into three cost categories: at net negative costs, at 0-20US$/tCO2, and 20-100 US$/tCO2. For the industrial, forestry, and energy suppy sectors, the potential is split into two categories: at costsbelow 20 US$/tCO2 and at 20-100 US$/tCO2.
3CSEP
0
0.5
1
1.5
2
2.5
3
3.5
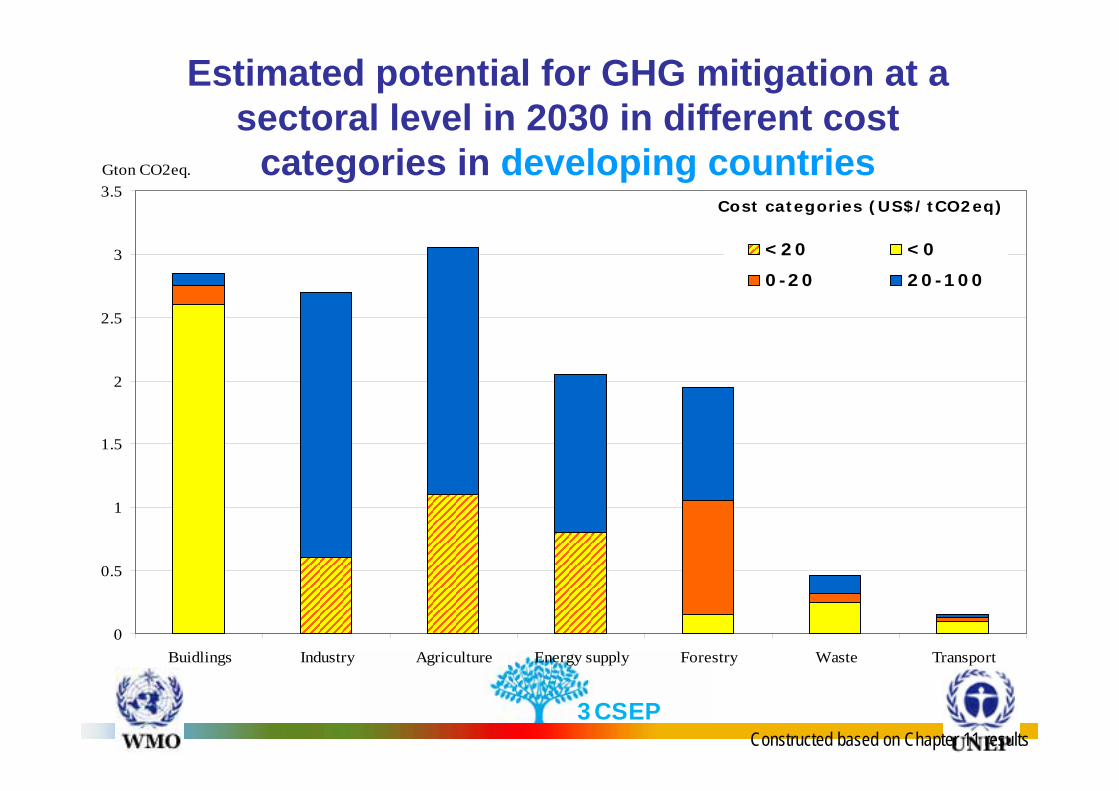
Buidlings Industry Agriculture Energy supply Forestry Waste Transport
Gton CO2eq.
<20 <0
0-20 20-100
Cost categories (US$/tCO2eq)
Estimated potential for GHG mitigation at a sectoral level in 2030 in different cost
categories in developing countries
Constructed based on Chapter 11 results
3CSEP
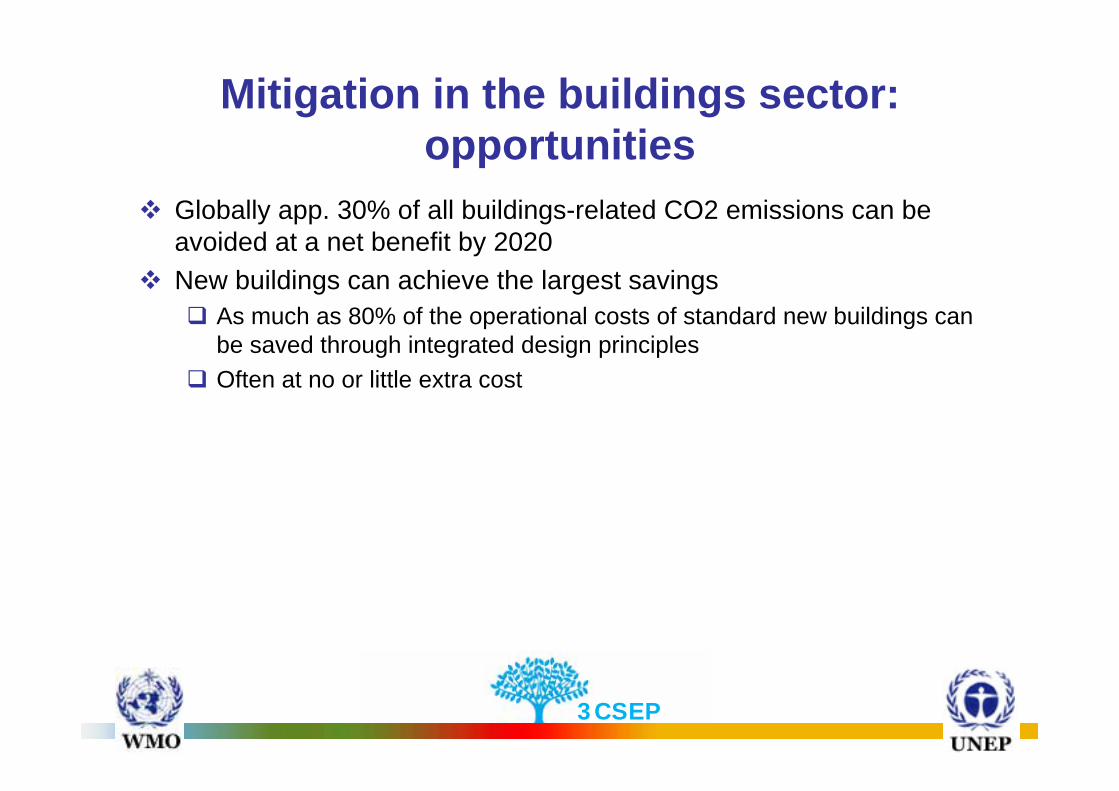
Mitigation in the buildings sector:opportunities
Globally app. 30% of all buildings-related CO2 emissions can be avoided at a net benefit by 2020New buildings can achieve the largest savings
As much as 80% of the operational costs of standard new buildings can be saved through integrated design principlesOften at no or little extra cost

Buildings utilising passive solar constructionexamples

3CSEP
Globally app. 30% of all buildings-related CO2 emissions can be avoided at a net benefit by 2020New buildings can achieve the largest savings
As much as 80% of the operational costs of standard new buildings can be saved through integrated design principlesOften at no or little extra cost
Hi-efficiency renovation is more costly, but possible
Mitigation in the buildings sector:opportunities

Case study: Solanova in Hungary
www.solanova.eu, not in IPCC report
0
50
100
150
200
250
300
Before SOLANOVA
kWh/
m2a
Renewable EnergyFossile Energy
-84%


Case study: savings by reconstruction, Germany
Reconstruction according to the passive house
principle
-90%15 kWh/(m²a)over 150 kWh/(m²a)
Before reconstruction
3CSEP
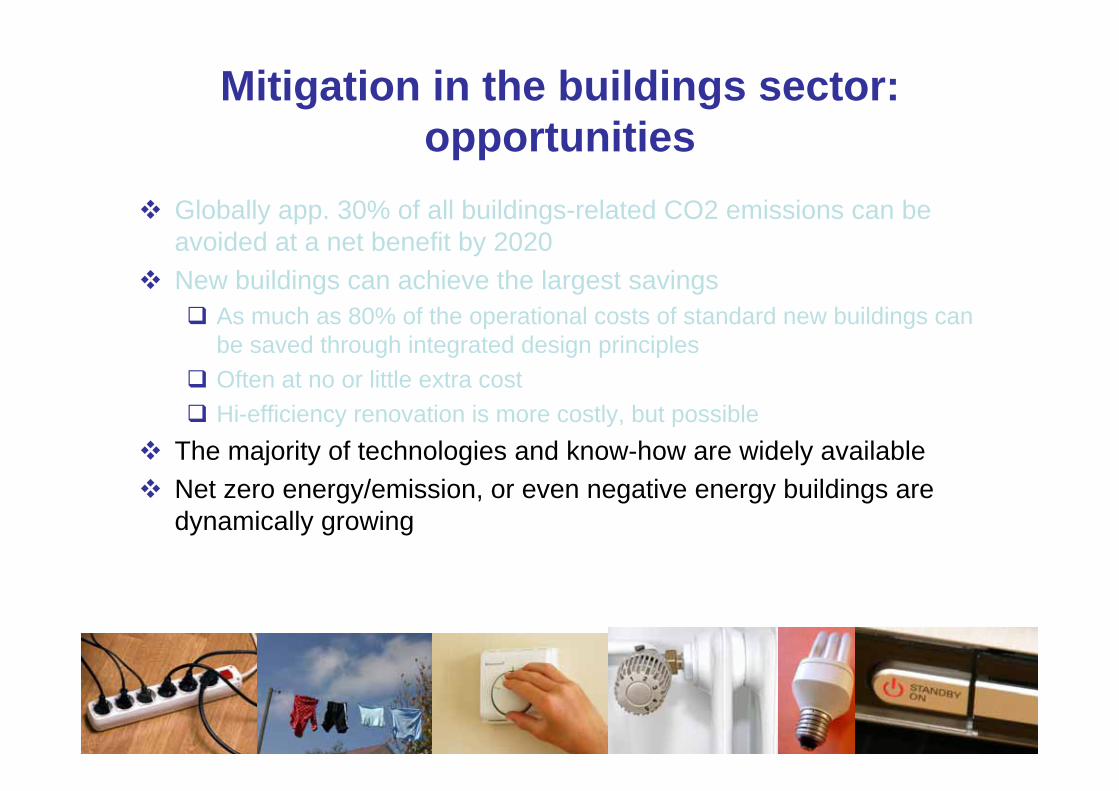
Globally app. 30% of all buildings-related CO2 emissions can be avoided at a net benefit by 2020New buildings can achieve the largest savings
As much as 80% of the operational costs of standard new buildings can be saved through integrated design principlesOften at no or little extra costHi-efficiency renovation is more costly, but possible
The majority of technologies and know-how are widely availableNet zero energy/emission, or even negative energy buildings are dynamically growing
Mitigation in the buildings sector:opportunities

3CSEP
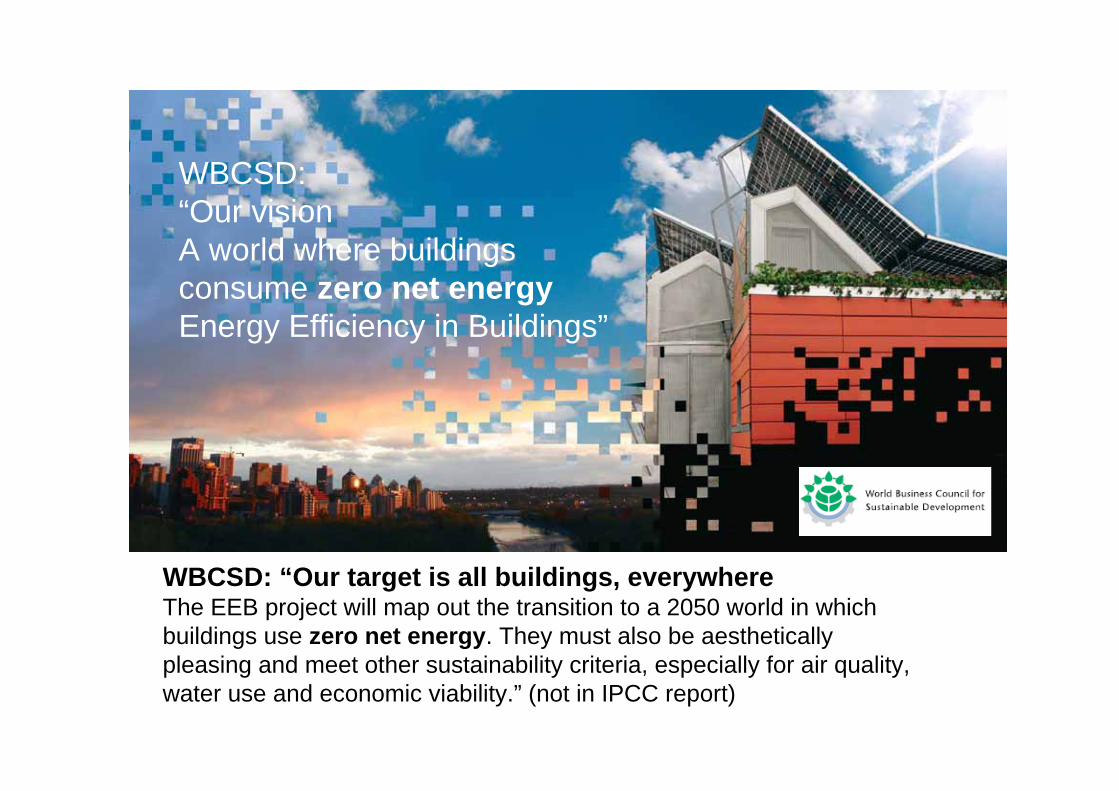
WBCSD:“Our visionA world where buildingsconsume zero net energyEnergy Efficiency in Buildings”
WBCSD: “Our target is all buildings, everywhereThe EEB project will map out the transition to a 2050 world in whichbuildings use zero net energy. They must also be aestheticallypleasing and meet other sustainability criteria, especially for air quality,water use and economic viability.” (not in IPCC report)

Co-benefits of GHG mitigation in buildings
3CSEP
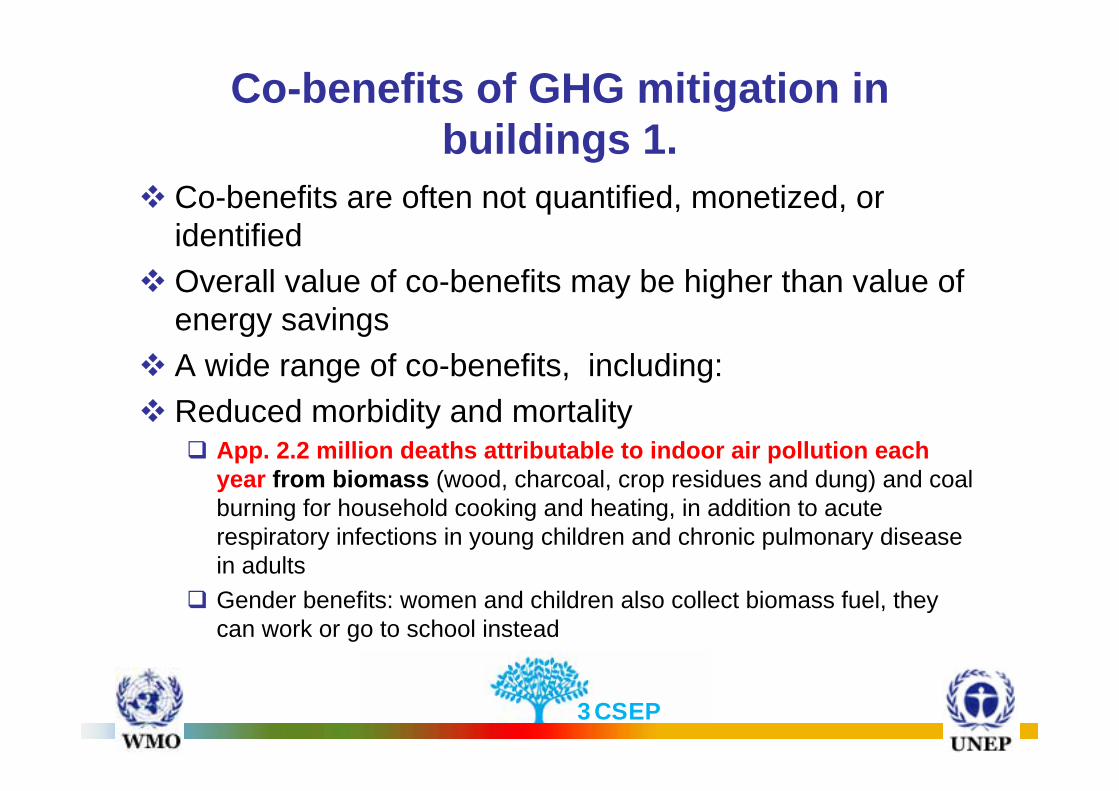
Co-benefits are often not quantified, monetized, or identified Overall value of co-benefits may be higher than value of energy savingsA wide range of co-benefits, including: Reduced morbidity and mortality
App. 2.2 million deaths attributable to indoor air pollution each year from biomass (wood, charcoal, crop residues and dung) and coal burning for household cooking and heating, in addition to acute respiratory infections in young children and chronic pulmonary disease in adultsGender benefits: women and children also collect biomass fuel, they can work or go to school instead
Co-benefits of GHG mitigation in buildings 1.
3CSEP
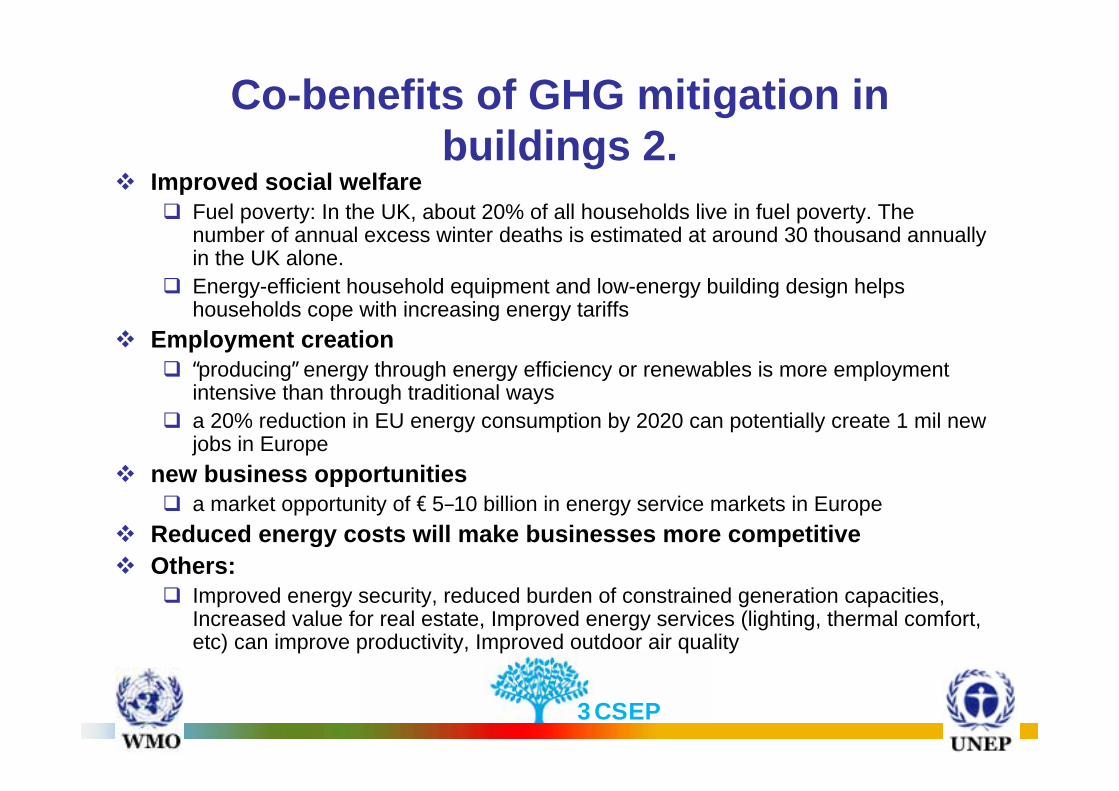
Improved social welfareFuel poverty: In the UK, about 20% of all households live in fuel poverty. The number of annual excess winter deaths is estimated at around 30 thousand annually in the UK alone.Energy-efficient household equipment and low-energy building design helps households cope with increasing energy tariffs
Employment creation“producing” energy through energy efficiency or renewables is more employment intensive than through traditional waysa 20% reduction in EU energy consumption by 2020 can potentially create 1 mil new jobs in Europe
new business opportunitiesa market opportunity of € 5–10 billion in energy service markets in Europe
Reduced energy costs will make businesses more competitive Others:
Improved energy security, reduced burden of constrained generation capacities, Increased value for real estate, Improved energy services (lighting, thermal comfort, etc) can improve productivity, Improved outdoor air quality
Co-benefits of GHG mitigation in buildings 2.

3CSEP
Although improving building efficiency is often profitable, investments are hindered by
barriersAlthough there are large cost-effective investments to be made, market barriers often hinder that they are captured by market forces
Including misplaced incentives, distorted energy price/tax regimes, fragmented industry and building design process, limited access to financing, lack of information and awareness (of the benefits), regulatory failures, etc.
These barriers are perhaps the most numerous and strongest in the buildings sectorTherefore, only strong and diverse policies can overcome them to kick-start and catalise markets in capturing the potentially cost-effective investments
Policies to foster carbon-efficiency buildings

3CSEP
Method: global review of ex-post policy evaluationsOver 80 ex-post policy evaluation studies were reviewed from over 52 countries20 policy instruments analysed

3CSEP
Flanders: -216$/tCO2 for households, -60 $/tCO2 for other sector in 2003.UK: -139 $ /tCO2
HighUK: 2.6 M tCO2/yrHighUK, Be, Fr, I, Dk, Ir
Energy efficiency obligations and quotas
Mex: $1Million in purchases saves $726,000/year; EU: <21$/tCO2
High/ Medium
Mex: 4 cities saved 3.3 ktCO2eq. in 1yearCh: 3.6Mt CO2 expectedEU: 20-44MtCO2 potential US:9-31Mt CO2 in 2010
HighUS, EU, Cn, Mex, Kor, Jp
Procurement regulations
NL: from -189 $/tCO2 to -5 $/tCO2 for end-users,46-109 $/tCO2 for Society
Medium
HkG: 1% of total el.saved;US: 79.6 M tCO2 in 2000;EU: 35-45 MtCO2, up to 60% savings for new bdgsUK: 2.88 MtCO2 by 2010, 7% less en use in houses 14% with grants& labellingCn: 15-20% of energy saved in urban regions
High
SG, Phil, Alg, Egy, US, UK, Cn, EU
Building codes
AUS: -52 $/tCO2 in 2020,US: -65 $/tCO2 in 2020;EU: -194 $/tCO2 in 2020Mar: 0.008 $/kWh
High
Jp: 31 M tCO2 in 2010; Cn: 250 Mt CO2 in 10 yrsUS: 1990-1997: 108 Mt CO2eq, in 2000: 65MtCO2 = 2.5% of el.use,Can: 8 MtCO2 in total by 2010, Br: 0.38 MtCO2/yearAUS: 7.9 MtCO2 by 2010
HighEU, US, JP, AUS, Br, Cn
Appliance standards
Cost of GHG emission reduction for selected best practices
Cost-effectiveness
Energy or emission reductions for selected best practices
Effec-tiveness
Country examples
Policyinstrument
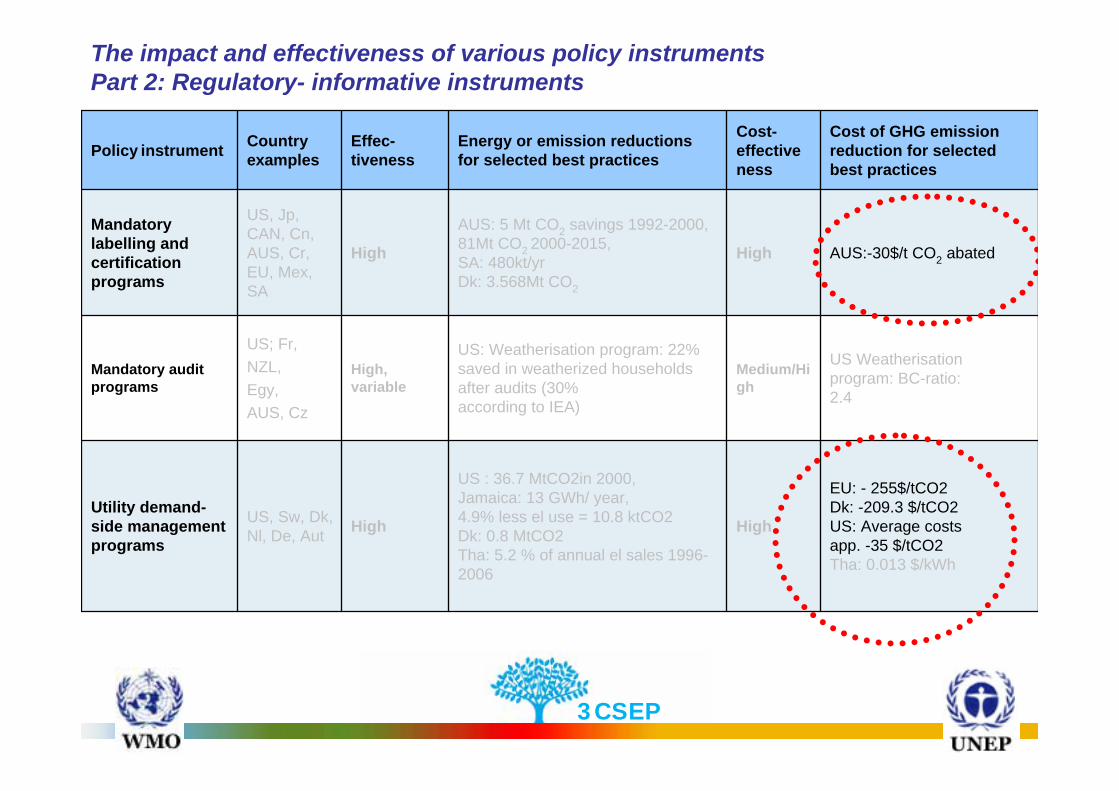
The impact and effectiveness of various policy instruments Part 1: Control and regulatory mechanisms- normative instruments
3CSEP
EU: - 255$/tCO2Dk: -209.3 $/tCO2US: Average costsapp. -35 $/tCO2Tha: 0.013 $/kWh
High
US : 36.7 MtCO2in 2000,Jamaica: 13 GWh/ year,4.9% less el use = 10.8 ktCO2Dk: 0.8 MtCO2Tha: 5.2 % of annual el sales 1996-2006
HighUS, Sw, Dk, Nl, De, Aut
Utility demand-side management programs
US Weatherisationprogram: BC-ratio:2.4
Medium/High
US: Weatherisation program: 22% saved in weatherized households after audits (30%according to IEA)
High,variable
US; Fr,NZL,Egy,AUS, Cz
Mandatory audit programs
AUS:-30$/t CO2 abatedHigh
AUS: 5 Mt CO2 savings 1992-2000, 81Mt CO2 2000-2015, SA: 480kt/yrDk: 3.568Mt CO2
High
US, Jp, CAN, Cn, AUS, Cr, EU, Mex, SA
Mandatory labelling and certification programs
Cost of GHG emission reduction for selected best practices
Cost-effectiveness
Energy or emission reductions for selected best practices
Effec-tiveness
Country examplesPolicy instrument
The impact and effectiveness of various policy instruments Part 2: Regulatory- informative instruments
3CSEP
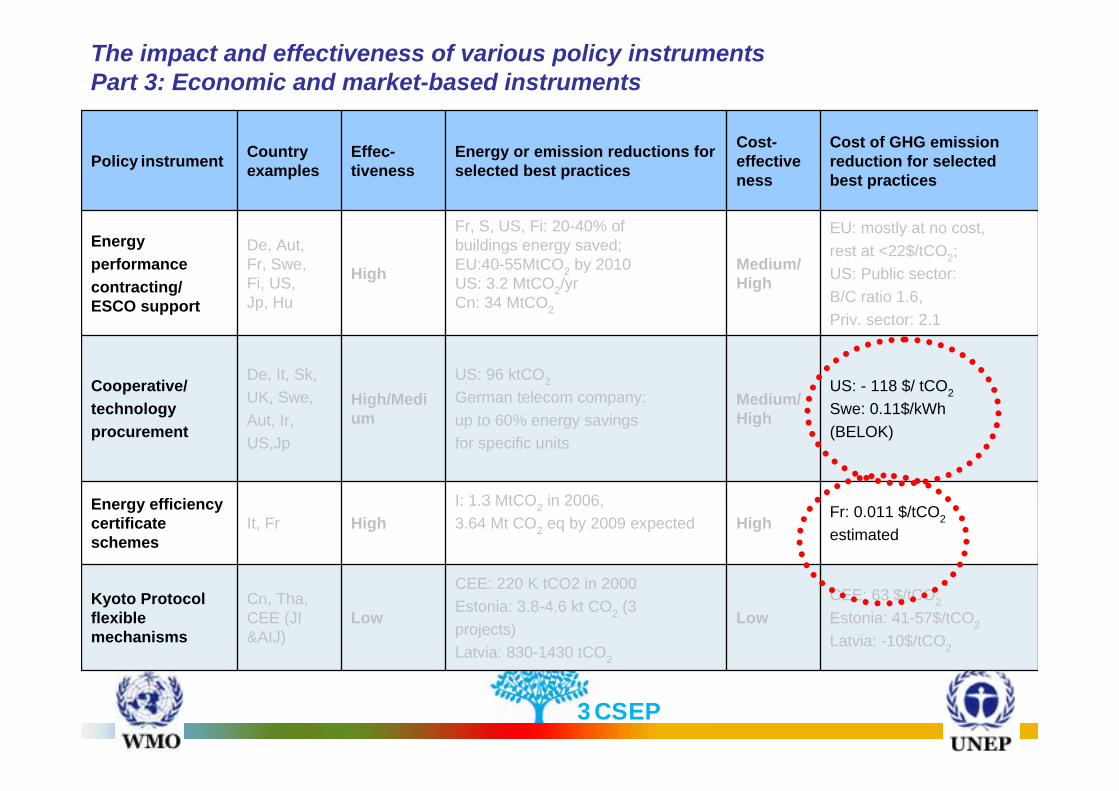
Fr: 0.011 $/tCO2estimated
HighI: 1.3 MtCO2 in 2006,3.64 Mt CO2 eq by 2009 expectedHigh It, Fr
Energy efficiency certificate schemes
CEE: 63 $/tCO2Estonia: 41-57$/tCO2Latvia: -10$/tCO2
Low
CEE: 220 K tCO2 in 2000Estonia: 3.8-4.6 kt CO2 (3projects)Latvia: 830-1430 tCO2
LowCn, Tha, CEE (JI &AIJ)
Kyoto Protocol flexible mechanisms
US: - 118 $/ tCO2Swe: 0.11$/kWh(BELOK)
Medium/High
US: 96 ktCO2German telecom company:up to 60% energy savingsfor specific units
High/Medium
De, It, Sk,UK, Swe,Aut, Ir,US,Jp
Cooperative/technologyprocurement
EU: mostly at no cost,rest at <22$/tCO2;US: Public sector:B/C ratio 1.6,Priv. sector: 2.1
Medium/ High
Fr, S, US, Fi: 20-40% ofbuildings energy saved;EU:40-55MtCO2 by 2010US: 3.2 MtCO2/yrCn: 34 MtCO2
High
De, Aut,Fr, Swe,Fi, US,Jp, Hu
Energyperformancecontracting/ ESCO support
Cost of GHG emission reduction for selected best practices
Cost-effectiveness
Energy or emission reductions for selected best practices
Effec-tiveness
Country examplesPolicy instrument
The impact and effectiveness of various policy instruments Part 3: Economic and market-based instruments

ConclusionBuildings are responsible for app. 1/3 of energy-related CO2 emissions and 2/3 of halocarbon emissionsApp. 30% of building emissions can be avoided at net benefit by 2020Cost-effective mitigation opportunities in all world regions are abundant; technologies and know-how widely availableIn addition to climate change benefits, improved energy-efficiency can advance several development goals as well as strategic economic targets
E.g. reducing mortality and morbidity, poverty alleviation, improving social welfare, employment, energy security
However, due to the numerous barriers public policies are needed to unlock the potentials and to kick-start or catalise marketsSeveral instruments have already been achieving large emission reductions at large net societal benefits, often at double or triple negative digit cost figures all over the worldHowever, each new building constructed in an energy-wasting manner potentially locks us into high climate-footprint buildings for decades (centuries) – action now is important

3CSEP
RoadsUrban infrastructureSome buildings
Glass manufacturingCement manufacturingSteel manufacturingMetals-based durables
AgricultureMiningConstructionFoodPaperBulk chemicalsPrimary aluminiumOther manufacturing
Domestic appliancesWater heating and HVAC systemsLightingVehicles
60-100 years30-60 yearsless than 30 years
Structures with influence > 100 years
Typical lifetime of capital stock
Early investment is important
Table 11.17: Observed and estimated lifetimes of major GHG-related capital stock
Thank you for your attentionDiana Ürge-Vorsatz
Center for Climate Change and Sustainable Energy Policy (3CSEP)Central European University
Web: 3csep.ceu.huEmail: [email protected]
For more information on AR4: www.ipcc.ch

3CSEP
Acknowledgements: authors of Chapter 6
Coordinating Lead Authors:Mark Levine (USA), Diana Ürge-Vorsatz (Hungary)
Lead Authors:Kornelis Blok (The Netherlands), Luis Geng (Peru), Danny Harvey (Canada), Siwei Lang (China), Geoffrey Levermore (UK), Anthony Mongameli Mehlwana(South Africa), Sevastian Mirasgedis (Greece), Aleksandra Novikova (Russia), Jacques Rilling (France), Hiroshi Yoshino (Japan)
Contributing Authors:Paolo Bertoldi (Italy), Brenda Boardman (UK), Marilyn Brown (USA), Suzanne Joosen (The Netherlands), Phillipe Haves (USA), Jeff Harris (USA), MithraMoezzi (USA)
Review Editors:Eberhard Jochem (Germany), Huaqing Xu (PR China)

Supplementary slides

3CSEP
Buildings sector: regional importanceIn 2030: the share of building-related emissions in global will stay at
approximately 1/3 of energy-related CO2
CO2 emissions including through the use of electricity, A1B scenario

3CSEP
Supply curves of conserved CO2 for buildings in 2020 for different world regions
Source: Figure 6/4. Notes: a) Except for the UK, Thailand and Greece, for which the supply curves are for the residential sector only. b) Except for EU-15 and Greece, for which the target year is 2010 and Hungary, for which the target year is 2030. Each step on the curve represents a type of measure, such as improved lighting or added insulation. The length of a step on the ‘X’ axis shows the abatement potential represented by the measure, while the cost of themeasure is indicated by the value of the step on the ‘Y’ axis.
3CSEP
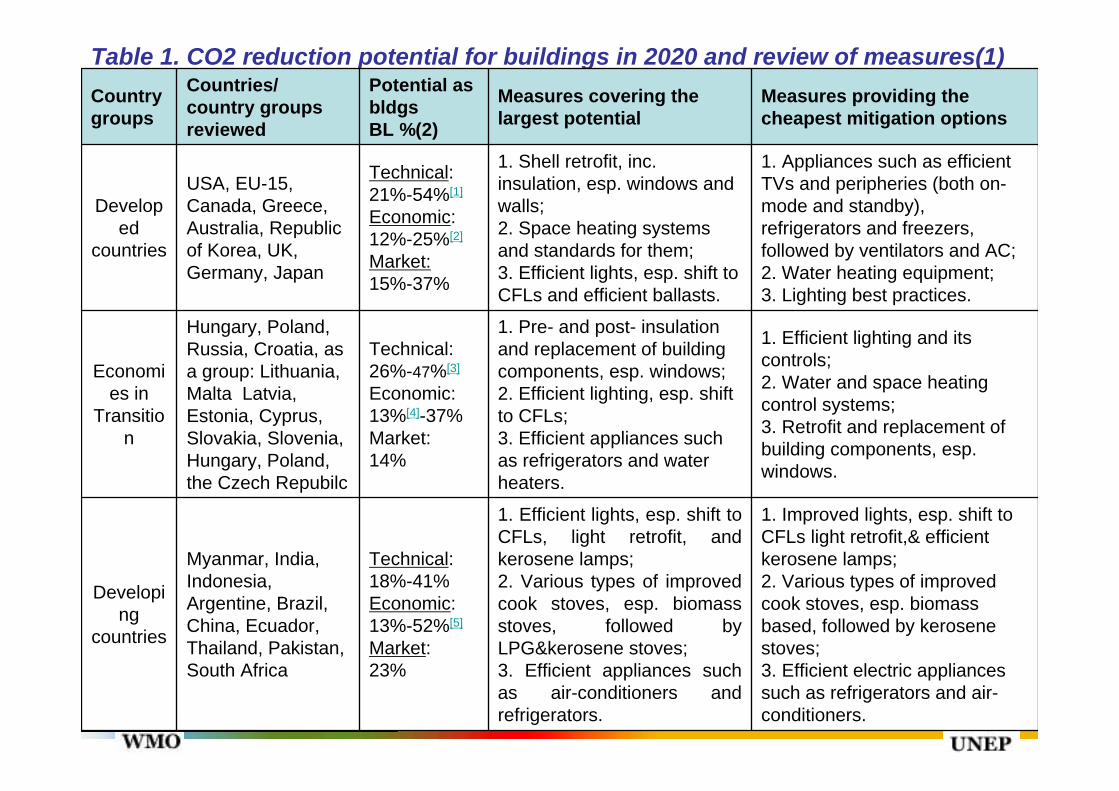
Table 1. CO2 reduction potential for buildings in 2020 and review of measures(1)
1. Improved lights, esp. shift to CFLs light retrofit,& efficient kerosene lamps;2. Various types of improved cook stoves, esp. biomass based, followed by kerosene stoves;3. Efficient electric appliances such as refrigerators and air-conditioners.
1. Efficient lights, esp. shift to CFLs, light retrofit, and kerosene lamps;2. Various types of improved cook stoves, esp. biomass stoves, followed by LPG&kerosene stoves;3. Efficient appliances such as air-conditioners and refrigerators.
Technical:18%-41%Economic:13%-52%[5]
Market:23%
Myanmar, India, Indonesia, Argentine, Brazil, China, Ecuador, Thailand, Pakistan, South Africa
Developing
countries
1. Efficient lighting and its controls; 2. Water and space heating control systems; 3. Retrofit and replacement of building components, esp. windows.
1. Pre- and post- insulation and replacement of building components, esp. windows; 2. Efficient lighting, esp. shift to CFLs;3. Efficient appliances such as refrigerators and water heaters.
Technical:26%-47%[3]
Economic:13%[4]-37%Market:14%
Hungary, Poland,Russia, Croatia, as a group: Lithuania, Malta Latvia, Estonia, Cyprus, Slovakia, Slovenia, Hungary, Poland, the Czech Repubilc
Economies in
Transition
1. Appliances such as efficient TVs and peripheries (both on-mode and standby), refrigerators and freezers, followed by ventilators and AC;2. Water heating equipment;3. Lighting best practices.
1. Shell retrofit, inc. insulation, esp. windows and walls;2. Space heating systems and standards for them;3. Efficient lights, esp. shift to CFLs and efficient ballasts.
Technical:21%-54%[1]
Economic:12%-25%[2]
Market:15%-37%
USA, EU-15, Canada, Greece, Australia, Republic of Korea, UK, Germany, Japan
Developed
countries
Measures providing the cheapest mitigation options
Measures covering the largest potential
Potential as bldgsBL %(2)
Countries/ country groups reviewed
Country groups

Problem statement 1: climate change
Climate change – one of the most formidable challenges of the 21st centuryIPCC’s Fourth Assessment Report showed that:
The challenge is HerculeanHowever, many of the solutions existA large share of these are affordableBut significant barriers exist to their adoption
3CSEP
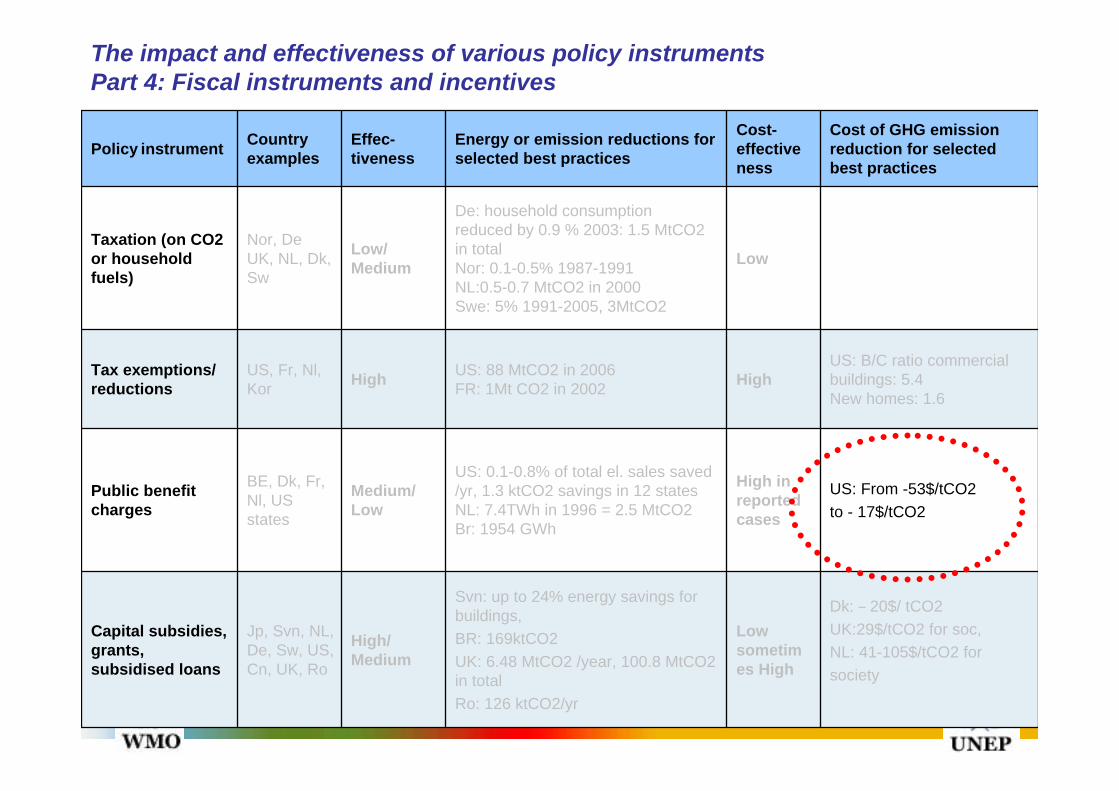
US: From -53$/tCO2to - 17$/tCO2
High in reported cases
US: 0.1-0.8% of total el. sales saved /yr, 1.3 ktCO2 savings in 12 statesNL: 7.4TWh in 1996 = 2.5 MtCO2Br: 1954 GWh
Medium/ Low
BE, Dk, Fr, Nl, US states
Public benefit charges
Dk: – 20$/ tCO2UK:29$/tCO2 for soc,NL: 41-105$/tCO2 forsociety
Low sometimes High
Svn: up to 24% energy savings for buildings,BR: 169ktCO2UK: 6.48 MtCO2 /year, 100.8 MtCO2 in totalRo: 126 ktCO2/yr
High/Medium
Jp, Svn, NL, De, Sw, US, Cn, UK, Ro
Capital subsidies, grants, subsidised loans
US: B/C ratio commercialbuildings: 5.4New homes: 1.6
HighUS: 88 MtCO2 in 2006FR: 1Mt CO2 in 2002HighUS, Fr, Nl,
KorTax exemptions/ reductions
Low
De: household consumptionreduced by 0.9 % 2003: 1.5 MtCO2 in totalNor: 0.1-0.5% 1987-1991NL:0.5-0.7 MtCO2 in 2000Swe: 5% 1991-2005, 3MtCO2
Low/Medium
Nor, De UK, NL, Dk, Sw
Taxation (on CO2 or household fuels)
Cost of GHG emission reduction for selected best practices
Cost-effectiveness
Energy or emission reductions for selected best practices
Effec-tiveness
Country examplesPolicy instrument
The impact and effectiveness of various policy instruments Part 4: Fiscal instruments and incentives

3CSEP
Br: -66$/tCO2;UK: 8$/tCO2(for allprograms of EnergyTrust)/Swe: 0.018$/kWh
Medium/ High
UK: 10.4ktCO2 annuallyArg: 25% in 04/05, 355 ktepFr: 40tCO2/ yearBr: 2.23kt/yr, 6.5-12.2MtCO2/ year with voluntarylabeling 1986-2005Swe: 3ktCO2/ year
Low/ Medium
Dk, US,UK, Fr,CAN, Br,Jp, Swe
Awareness, education, information
Medium
Max.20% energy savingsin households concerned,usually app. 5-10% savingsUK: 3%Nor: 8-10 %
Medium
Ontario,It, Swe,Fin, Jp,Nor, Aus,Cal, Can
Detailed billing & disclosure programs
Cost of GHG emission reduction for selected best practices
Cost-effectiveness
Energy or emission reductions for selected best practices
Effec-tiveness
Country examplesPolicy instrument
The impact and effectiveness of various policy instruments Part 5: Support, information and voluntary action (cont.)
Country name abbreviations: Alg - Algeria, Arg- Argentina, AUS - Australia, Aut - Austria, Be - Belgium, Br - Brazil, Cal - California, Can - Canada, CEE - Central and Eastern Europe, Cn - China, Cr - Costa Rica, Cz - Czech Republic, De - Germany, Ecu - Ecuador, Egy - Egypt, EU - European Union, Fin - Finland, GB-Great Britain, Hkg -Hong Kong, Hu - Hungary, Ind - India, Irl - Ireland, It - Italy, JP - Japan, Kor - Korea (South), Mar- Morocco, Mex - Mexiko, NL - Netherlands, Nor - Norway, Nzl – New Zealand, Phil - Philippines, Pol - Poland, Ro- Romania, SA- South Africa, SG - Singapore, Sk - Slovakia, Svn -Slovenia, Sw - Switzerland, Swe - Sweden, Tha - Thailand, US - United States.
3CSEP
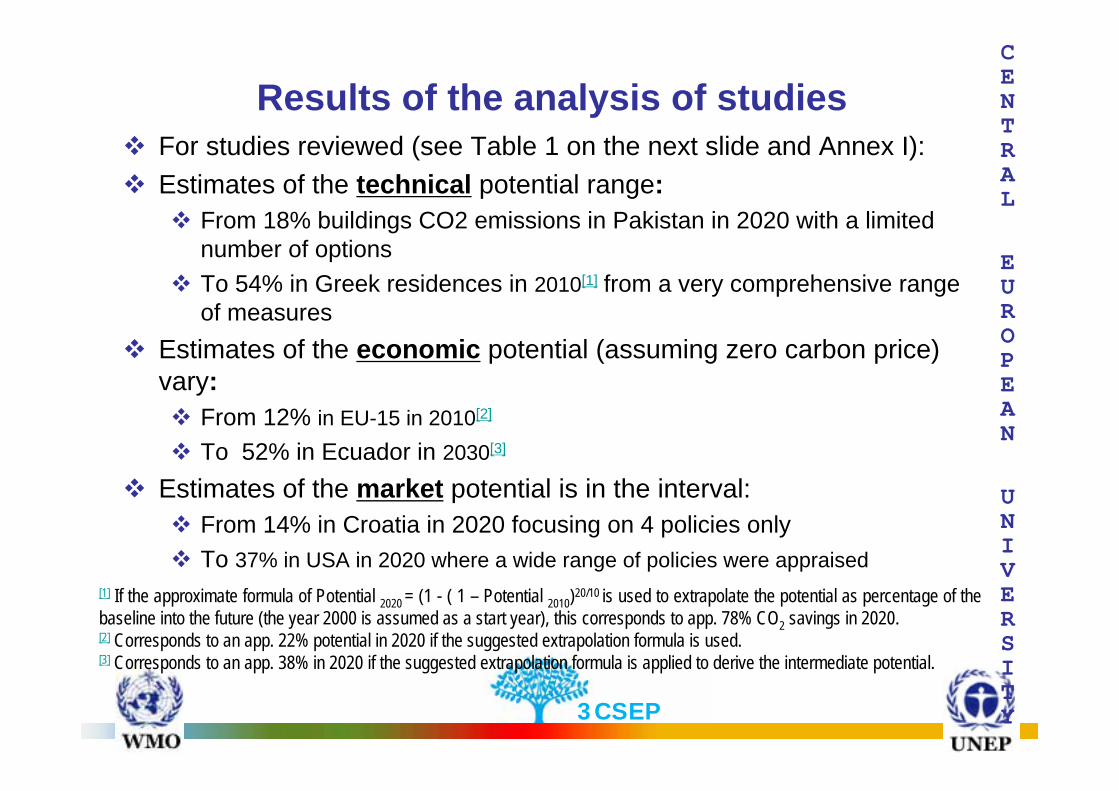
Results of the analysis of studiesFor studies reviewed (see Table 1 on the next slide and Annex I):Estimates of the technical potential range:
From 18% buildings CO2 emissions in Pakistan in 2020 with a limited number of options To 54% in Greek residences in 2010[1] from a very comprehensive range of measures
Estimates of the economic potential (assuming zero carbon price)vary:
From 12% in EU-15 in 2010[2]
To 52% in Ecuador in 2030[3]
Estimates of the market potential is in the interval:From 14% in Croatia in 2020 focusing on 4 policies onlyTo 37% in USA in 2020 where a wide range of policies were appraised
CENTRAL
EUROPEAN
UNIVERSITY
[1] If the approximate formula of Potential 2020 = (1 - ( 1 – Potential 2010)20/10 is used to extrapolate the potential as percentage of the baseline into the future (the year 2000 is assumed as a start year), this corresponds to app. 78% CO2 savings in 2020.[2] Corresponds to an app. 22% potential in 2020 if the suggested extrapolation formula is used. [3] Corresponds to an app. 38% in 2020 if the suggested extrapolation formula is applied to derive the intermediate potential.

3CSEP
Recent developments in AustriaCO
2reductions due to completed/built passive houses
11917
4140
20901363933831
10793
7972
651510
0
2000
4000
6000
8000
10000
1200019
95
1996
1997
1998
1999
2000
2001
2002
2003
2004
2005
2006
[tonnes CO2]
Others/Non-documented (incl. reconstructions)School, kindergartenOffice buildingTerrace house/Block of flatsFamily house/Double-house
Source: passive-house building database, www.HAUSderZukunft.at, not in IPCC report